Physik Invest’s Daily Brief is read by thousands of subscribers. You, too, can join this community to learn about the fundamental and technical drivers of markets.
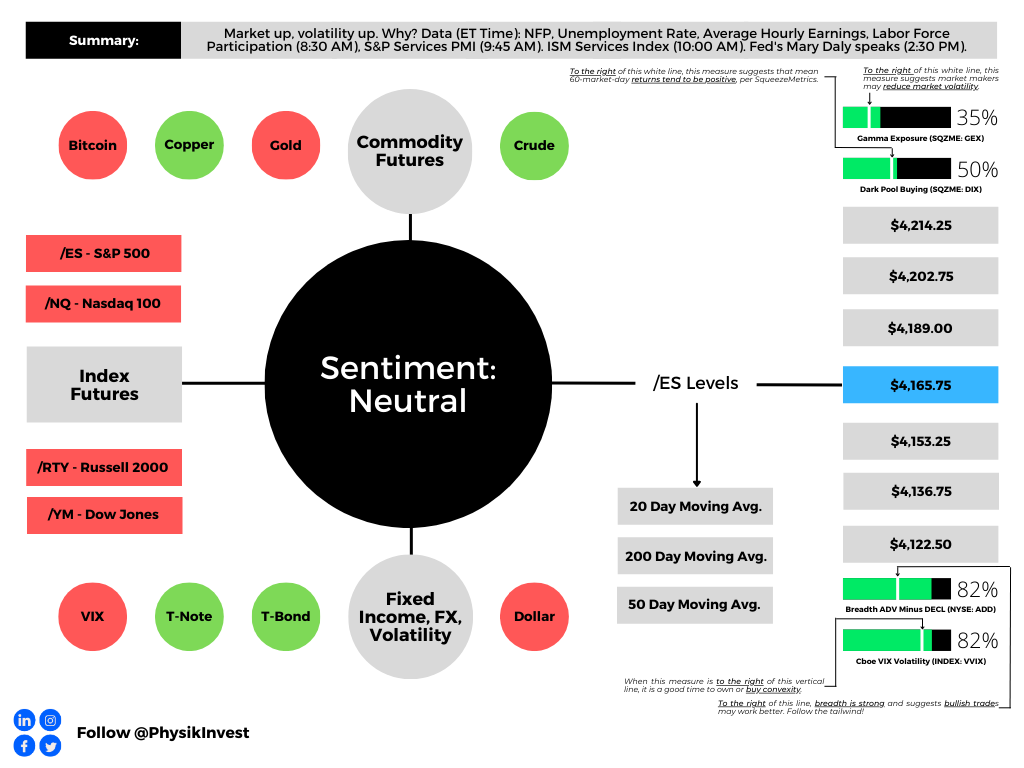
Graphic updated 8:30 AM ET. Sentiment Neutral if expected /ES open is inside of the prior day’s range. /ES levels are derived from the profile graphic at the bottom of this letter. Click here for the latest levels. SqueezeMetrics Dark Pool Index (DIX) and Gamma (GEX) with the latter calculated based on where the prior day’s reading falls with respect to the MAX and MIN of all occurrences available. A higher DIX is bullish. At the same time, the lower the GEX, the more (expected) volatility. Click to learn the implications of volatility, direction, and moneyness. Breadth reflects a reading of the prior day’s NYSE Advance/Decline indicator. The CBOE VIX Volatility Index (INDEX: VVIX) reflects the attractiveness of owning volatility. UMBS price via MND. Click here for the calendar.
Fundamental
Consumer price updates (CPI) have traders pricing (even) higher rates for longer.
Yesterday’s data showed goods deflation is underway while services inflation persists. Per Unlimited’s Bob Elliott, “the picture of inflation for the Fed today is considerably less sanguine than at the last meeting.”
Graphic: Retrieved from @VincentDeluard. “The most important indices are the prices of wage-intensive services: haircuts, childcare, dentists, lawyers. With the exception of garages (crazy inflation), they all converge towards 6.5 – 7% YoY and 0.4%-0.5% MoM. That is the true long-term inflation.”
This new data confirms the hawkishness expressed by the Federal Reserve’s (Fed) Jerome Powell last week. US Treasury interest rates shifted higher, accordingly.
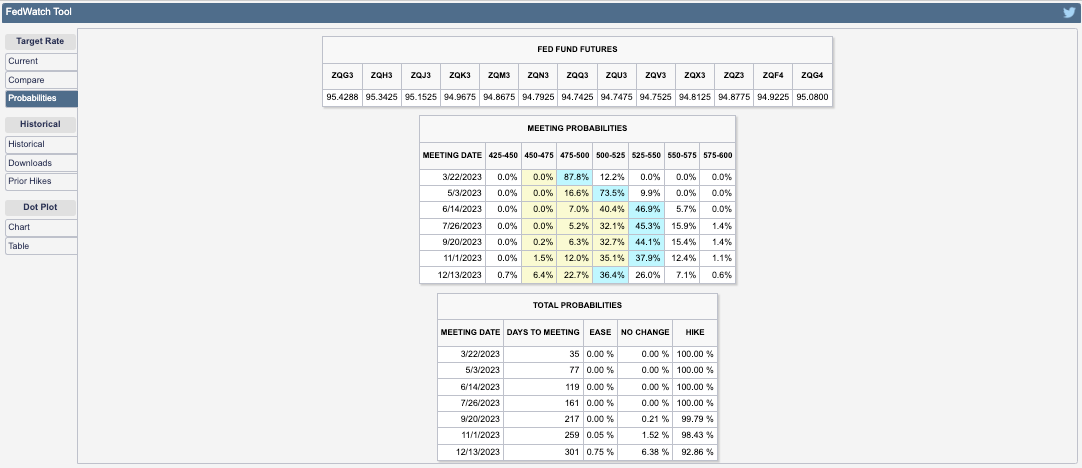
CME Group Inc’s (NASDAQ: CME) FedWatch Tool places the terminal rate at 5.25-5.50%, up from 5.00-5.25% on Tuesday before the CPI release. Easing is set to happen this year still in the November-December timeframe.
Graphic: Retrieved from CME Group Inc’s (NASDAQ: CME) website.
Recall “a higher interest rate environment implies a more potent” monetary tightening and heavier flow of capital out of capital markets (i.e., quantitative tightening or QT), to quote former Fed trader Joseph Wang.
The pressure from the sale of assets (e.g., USTs, MBSs) will increase interest rates and move yield-seeking market participants out of risk, hence the expectation that pressure persists on equities in 2023.
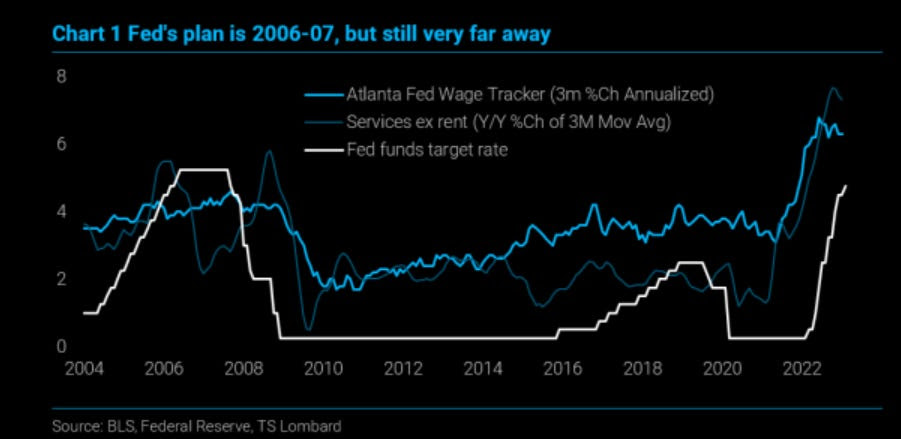
Graphic: Retrieved from TS Lombard. “Without a recession, the disinflation from the 2021 slowdown ends sometime soon, setting up for a re-acceleration later this year. Not to 8%, but high enough for the Fed to rue its choice of slowing rate hikes when it did.”
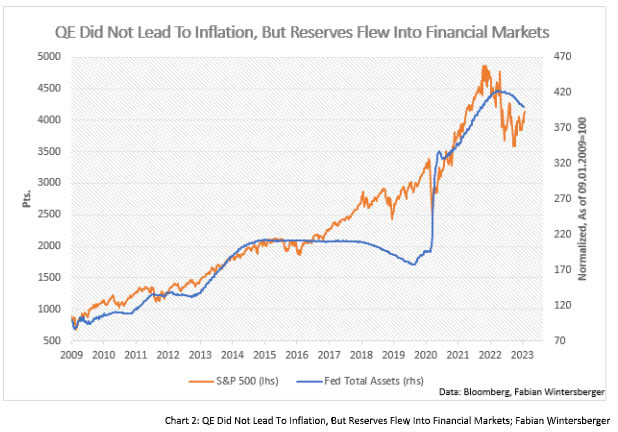
In other words, processes like QT manifest themselves as less demand for assets. Per Fabian Wintersberger, central bankers must “recycle bonds into the markets on an unprecedented scale, which could easily lead tolower bond prices/higher yields” causing a “reflux of capital to safe-haven assets, like treasuries.”
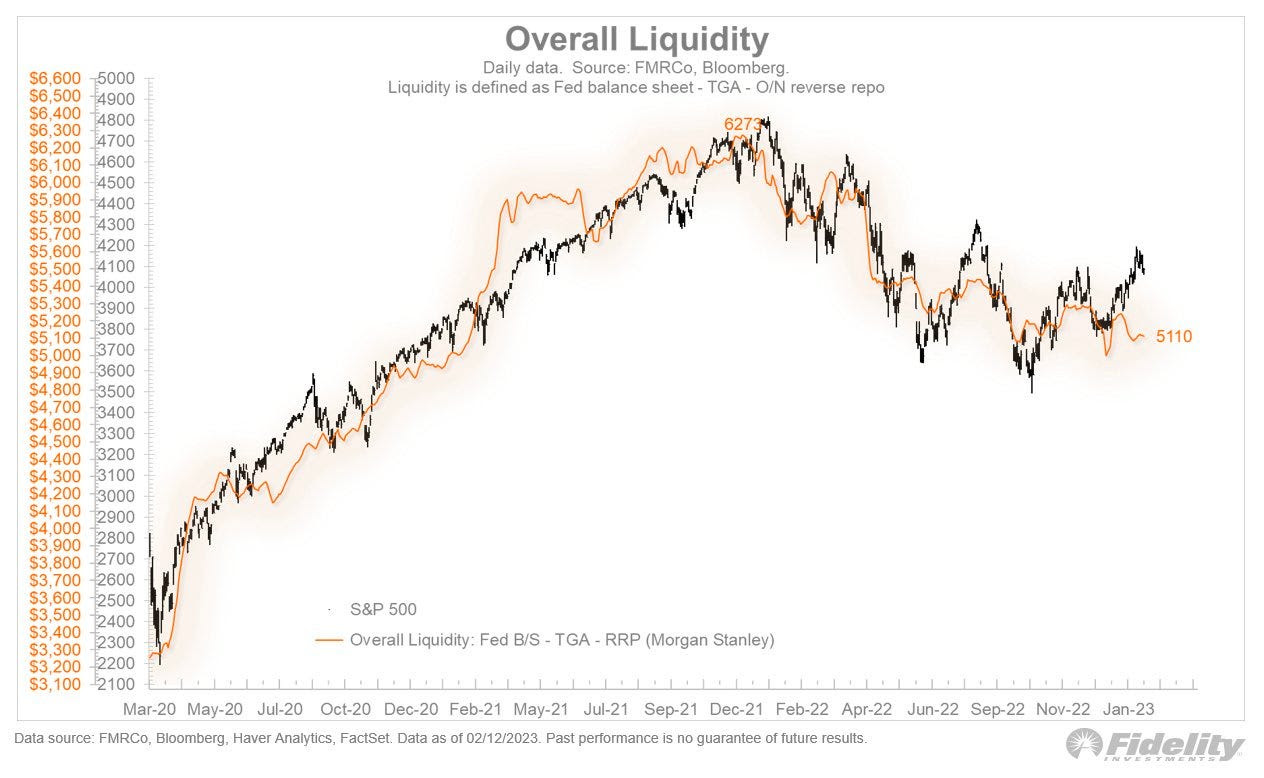
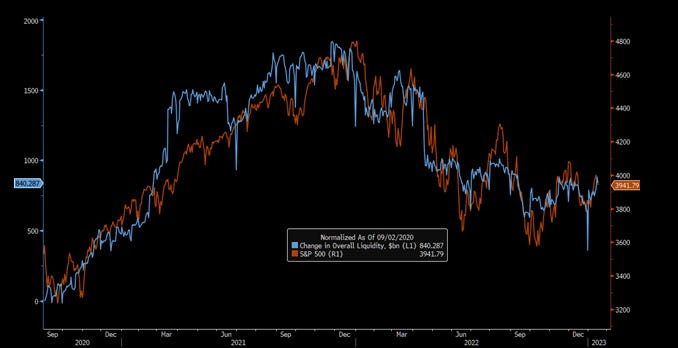
Graphic: Retrieved from Fidelity Investments. “The recent rally in stocks deviated from liquidity conditions, which have held steady but have not improved. This is just one reason to question whether there is an adequate foundation to support a new bull market.”
You can produce the above chart yourself. Fed Balance Sheet data, here. Treasury General Account Data, here. Reverse Repo data, here. NL = BS – TGA – RRP.
Moreover, the above chart which this letter has produced for you in the past and some would say is naive, shows so-called net liquidity.
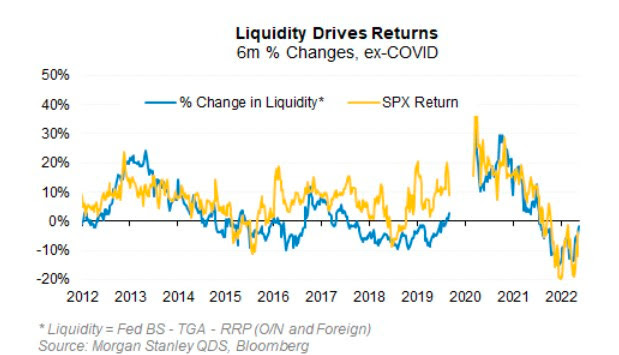
But, according to Morgan Stanley (NYSE: MS), the correlation between net liquidity and the S&P 500 (INDEX: SPX), over the past ten years is about ~0.70 and explains more than half of the movement in price-earings multiples over the past decade.
After CPI, there was short-lived relief, as this letter expected. Following CPI, weakness surfaced and measures of traders’ activity in options markets showed a bearish tilt.
Big trades that fired off include the purchase of put options expiring in March on the S&P 500 and call options expiring in May on the Cboe Volatility Index (INDEX: VIX).
The net effect is pressure on the indexes that remain well-supported and compressed heading into big options expirations (OpEx) this week, after which the door may open to enable them to move freely and in sync with their constituents, some of which, like Alphabet Inc (NASDAQ: GOOGL) (NASDAQ: GOOG), are trading rather weak.
Graphic: Retrieved from Tier1Alpha. “With implied correlation having fallen back to levels not seen since 2021, it’s notable that realized comovement shows no such improvement and instead sits near record highs. Whether this presages a violent snapback is unknowable, but certainly the conditions are in place.”
To explain, after OpEx, counterparty exposure to positive gamma (i.e., positive exposure to movement hedged in a way that reduces movement) will decline and “leave markets more at the whim of macro-type repositioning”; counterparties will do less to disrupt and more to bolster (i.e., add to movement). For how to trade (or how these events impact trades), see this case study by Physik Invest.
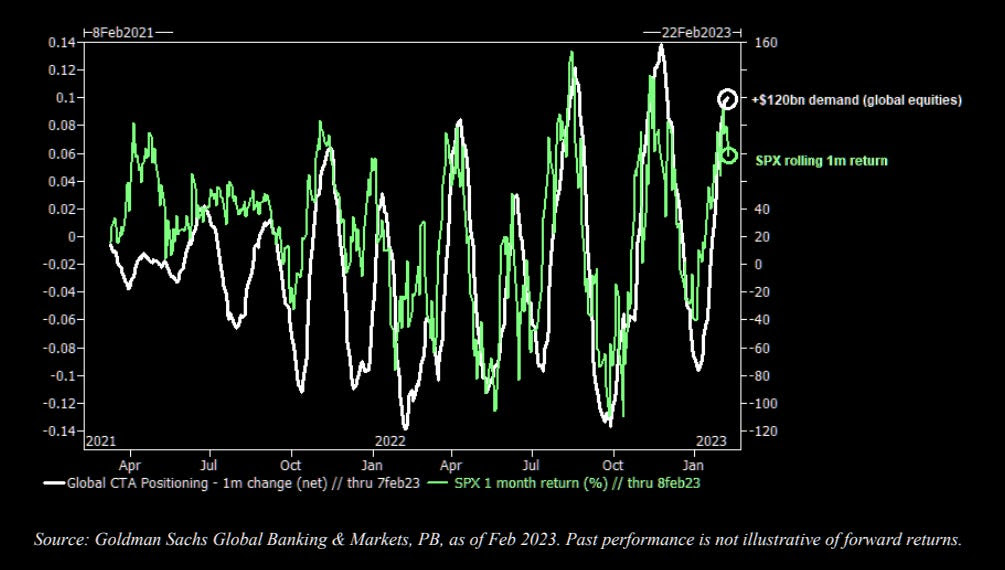
Should there be a large break lower, then “convexity could become an issue,” The Market Ear explained in a statement quoting Goldman Sachs Group Inc (NYSE: GS). “Inflecting CTA flow could translate to an approximately 20% sell-off in US equities over a month in a down-tape scenario.”
Graphic: Retrieved from Goldman Sachs Group Inc (NYSE: GS).
Technical
As of 7:30 AM ET, Wednesday’s regular session (9:30 AM – 4:00 PM ET), in the S&P 500, is likely to open in the lower part of a negatively skewed overnight inventory, inside of the prior day’s range, suggesting a limited potential for immediate directional opportunity.
The S&P 500 pivot for today is $4,136.25.
Key levels to the upside include $4,147.00, $4,159.00, and $4,168.75.
Key levels to the downside include $4,122.75, $4,104.25, and $4,083.75.
Disclaimer: Click here to load the updated key levels via the web-based TradingView platform. New links are produced daily. Quoted levels likely hold barring an exogenous development.
Graphic: 65-minute profile chart of the Micro E-mini S&P 500 Futures.
Definitions
Volume Areas: Markets will build on areas of high-volume (HVNodes). Should the market trend for a period of time, this will be identified by a low-volume area (LVNodes). The LVNodes denote directional conviction and ought to offer support on any test.
If participants auction and find acceptance in an area of a prior LVNode, then future discovery ought to be volatile and quick as participants look to the nearest HVNodes for more favorable entry or exit.
POCs: Areas where two-sided trade was most prevalent in a prior day session. Participants will respond to future tests of value as they offer favorable entry and exit.
About
The author, Renato Leonard Capelj, works in finance and journalism.
Capelj spends the bulk of his time at Physik Invest, an entity through which he invests and publishes free daily analyses to thousands of subscribers. The analyses offer him and his subscribers a way to stay on the right side of the market. Separately, Capelj is an options analyst at SpotGamma and an accredited journalist.
Physik Invest’s Daily Brief is read by thousands of subscribers. You, too, can join this community to learn about the fundamental and technical drivers of markets.
Graphic updated 8:20 AM ET. Sentiment Neutral if expected /ES open is inside of the prior day’s range. /ES levels are derived from the profile graphic at the bottom of this letter. Click here for the latest levels. SqueezeMetrics Dark Pool Index (DIX) and Gamma (GEX) with the latter calculated based on where the prior day’s reading falls with respect to the MAX and MIN of all occurrences available. A higher DIX is bullish. At the same time, the lower the GEX, the more (expected) volatility. Click to learn the implications of volatility, direction, and moneyness. Breadth reflects a reading of the prior day’s NYSE Advance/Decline indicator. The CBOE VIX Volatility Index (INDEX: VVIX) reflects the attractiveness of owning volatility.
Positioning
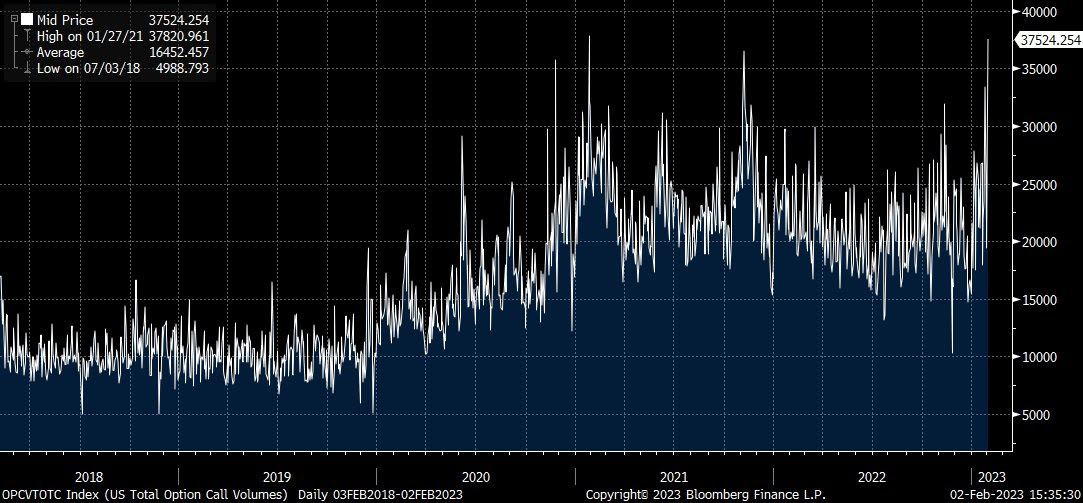
The Federal Reserve’s (Fed) decision to increase its benchmark interest rate by 25 basis points kicked off a bout of strength, boosted by the compression of wound implied volatility (IVOL). This volatility compression we observed with a shift lower in the IV term structure in the S&P 500 (INDEX: SPX). Follow-on strength surfaced on Thursday and, based on an analysis of top-line IVOL measures such as the Cboe Volatility Index (INDEX: VIX) trending higher with the SPX, it was, in part, from traders’ demands for call options, hence high call option volumes.
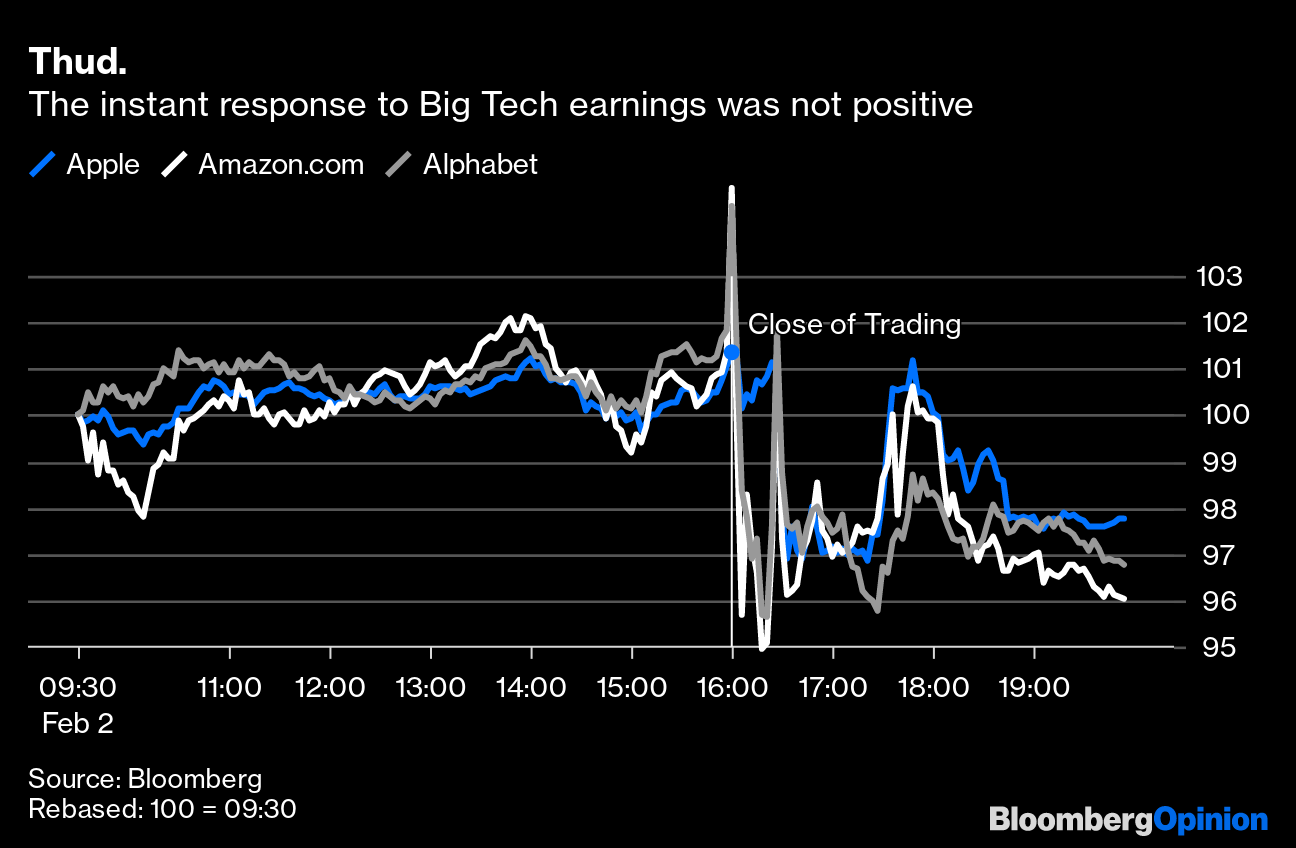
Graphic: Retrieved from Bloomberg via Danny Kirsch on 2/2/2023.
Recall our detailed letter published prior to February 2, 2023 (e.g., February 1, 2023, January 26, 2023, and beyond). The context was set for the SPX and VIX to trend higher; traders bidding up call options due to their fear of missing out, in the context of less liquidity to absorb those demands, would be beneficial to owners of structures like call option butterflies and ratio spreads. Additionally, owning such structures would help dampen the impact of potential SPX downside on portfolios.
For instance, on January 25, 2023, this letter said trades structured in the indexes such as the Nasdaq 100 (INDEX: NDX), where there was a steeper skew that would enable us to collect more credit in the options we are short, thereby lowering the cost of the spread we own, looked attractive, given the likelihood that the index would stay strong after the earnings reports of some big movers like Tesla Inc (NASDAQ: TSLA).
In yesterday’s letter update, we said that such trades were working spectacularly. In fact, your letter writer’s trading partner, who “initiated some +1 x -2 (17 FEB 23 13500/14000) [NDX] call ratio spreads for free (i.e., $0.00 debit or better to enter),” saw his spreads price in excess of a $40.00 credit to close, yesterday. That structure went from a $0 debit to open to a $4,000.00 credit to close. Again, nice job Justin. I’m expecting that case study, soon!
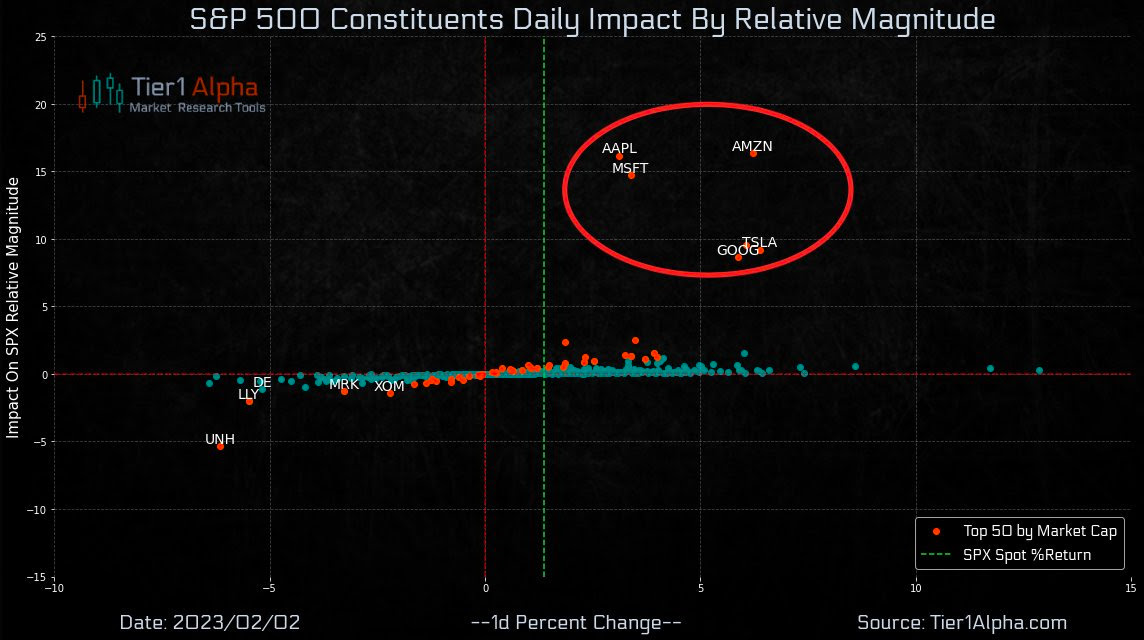
The NDX was probably the best place to be, yesterday, looking at the magnitude of movement in some of the heavyweights in the SPX, yesterday.
Noteworthy is that many of the strongest performers (e.g., Google, Amazon, Apple) weakened considerably in the after-market when their earnings, and the speeches associated, pointed to some challenges ahead.
Breadth was, generally, not that strong, to add. This validates your letter writer’s belief the market is in a precarious position. Notwithstanding the market’s potential to stay strong into the mid-February timeframe as some strategists believe, the data seems to suggest that “whenever there are two million or more call contracts that exchange hands on the Cboe, future 5- and 10-day returns tend toward being negative (about -1.37% and -2.12% respectively),” SpotGamma said.
SpotGamma added: “This is, in part, because the bullish hedging impact of short-dated call options activity is not long-lasting. Also, IV compressing from a relatively low starting point also does little to bolster long-lasting rallies.”
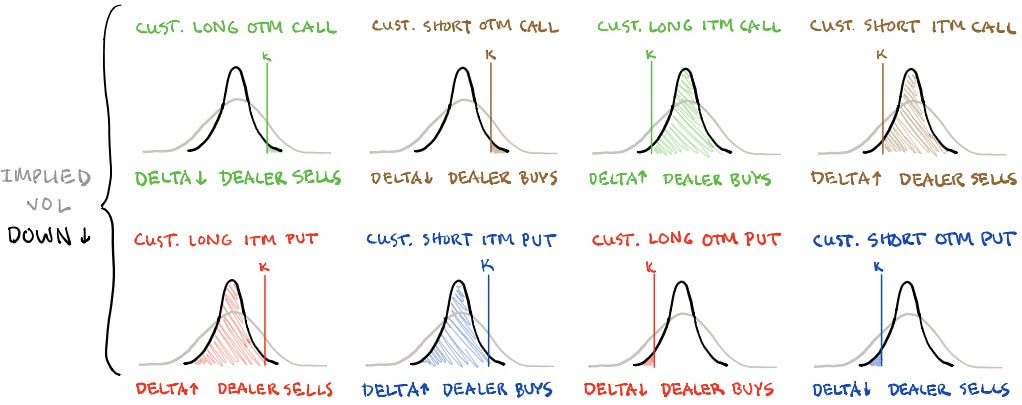
As further validation for the precariousness the market is in, “[t]he most prominent feature of the 0DTE landscape is actually customer-bought calls way out at $4,200.00 (which would ramp up buying from dealer long-gamma if SPX were to rise to ~$4,170.00.” Per SpotGamma, should “traders’ interest build at or slightly above current SPX prices, then dealers’ hedging may actually result in range suppression or pressure” as time passes and volatility falls. That’s because if a long call option’s probability of finishing in the money at expiration falls, the dealer’s risk falls as well and, so, the dealer can sell some of their hedges. This is market pressure.
As this letter stated, yesterday, knowing that longer-dated SPX IVOL “is cheap, now attractive trades include selling rich call verticals to finance put verticals.”
Per Joseph Wang, the “increasing probability of a second bout of inflation, an issue in the 1970s that the Fed is keen to avoid … [by] retighten[ing] financial conditions … through its balance sheet,” the flow of capital out of capital markets presents more pressure on the financial economy (not necessarily the real economy). Cheap put protection may help hedge the realization of further macro-type market pressure.
As of 8:15 AM ET, Friday’s regular session (9:30 AM – 4:00 PM ET), in the S&P 500, is likely to open in the upper part of a negatively skewed overnight inventory, inside of the prior range, suggesting a limited potential for immediate directional opportunity.
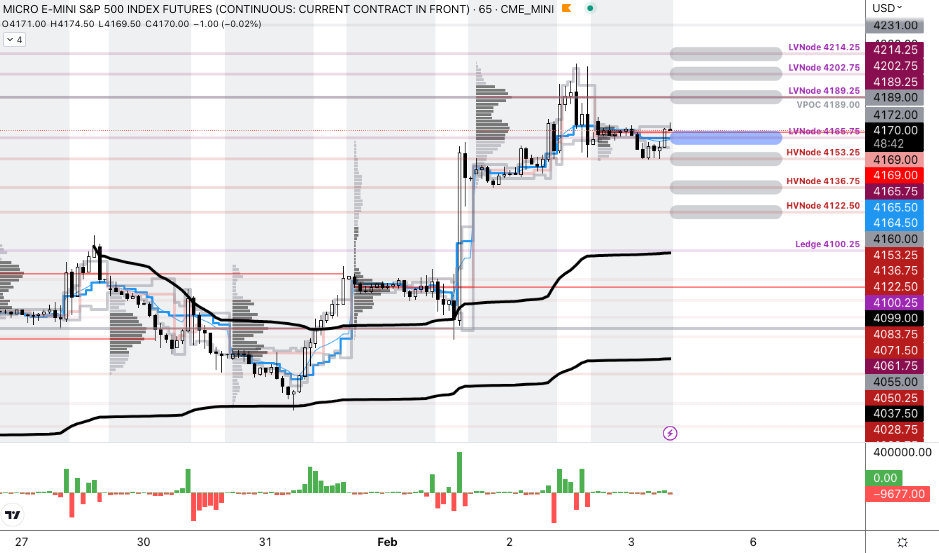
The S&P 500 pivot for today is $4,165.75.
Key levels to the upside include $4,189.00, $4,202.75, and $4,214.25.
Key levels to the downside include $4,153.25, $4,136.75, and $4,122.50.
Disclaimer: Click here to load the updated key levels via the web-based TradingView platform. New links are produced daily. Quoted levels hold weight barring an exogenous development.
Graphic: 65-minute profile chart of the Micro E-mini S&P 500 Futures.
Definitions
Volume Areas: Markets will build on areas of high-volume (HVNodes). Should the market trend for a period of time, this will be identified by a low-volume area (LVNodes). The LVNodes denote directional conviction and ought to offer support on any test.
If participants auction and find acceptance in an area of a prior LVNode, then future discovery ought to be volatile and quick as participants look to the nearest HVNodes for more favorable entry or exit.
POCs: Areas where two-sided trade was most prevalent in a prior day session. Participants will respond to future tests of value as they offer favorable entry and exit.
About
In short, Renato Leonard Capelj is an economics graduate working in finance and journalism.
Capelj spends most of his time as the founder of Physik Invest through which he invests and publishes daily analyses to subscribers, some of whom represent well-known institutions.
Separately, Capelj is an equity options analyst at SpotGamma and an accredited journalist interviewing global leaders in business, government, and finance.
Physik Invest’s Daily Brief is read by thousands of subscribers. You, too, can join this community to learn about the fundamental and technical drivers of markets.
Graphic updated 7:15 AM ET. Sentiment Neutral if expected /ES open is inside of the prior day’s range. /ES levels are derived from the profile graphic at the bottom of this letter. Levels may have changed since initially quoted; click here for the latest levels. SqueezeMetrics Dark Pool Index (DIX) and Gamma (GEX) with the latter calculated based on where the prior day’s reading falls with respect to the MAX and MIN of all occurrences available. A higher DIX is bullish. At the same time, the lower the GEX, the more (expected) volatility. Click to learn the implications of volatility, direction, and moneyness. Breadth reflects a reading of the prior day’s NYSE Advance/Decline indicator. The CBOE VIX Volatility Index (INDEX: VVIX) measure reflects the total attractiveness of owning volatility.
Administrative
Your letter writer has returned after a period of travel. Now, there is a lot of content to cover, so we’ll give it a good shot today and fill in some of the missing points over the coming days. Thanks!
Fundamental
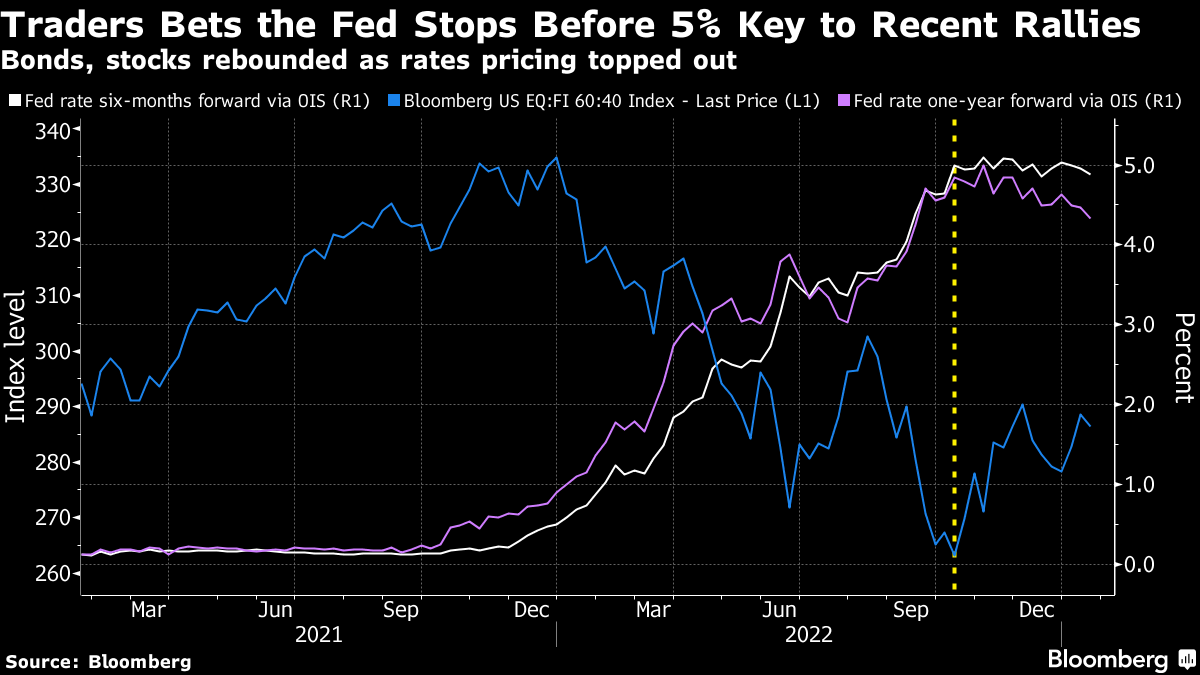
At its core, the expectation is that the US economy will fall into recession in the first half of 2023, and traders are betting policymakers will reverse in the second half of the year. This, in part, has boosted the S&P 500 (INDEX: SPX) over the past weeks.
However, many strategists think there is little reason for the policymakers to reverse course, and that will not be good for the markets.
Graphic: Retrieved from Bloomberg. Traders bet big on a peak in interest rates; some have amassed positions “in June 2023 SOFR options targeting a policy peak between 4.75% to 4.875%, and paying a premium of approximately $5.25 million for the hedge.”
As a recap, recall our past letters featuring the likes of Kai Volatility’s Cem Karsan and Credit Suisse Group AG’s (NYSE: CS) Zoltan Pozsar. The inflation conversation began when authorities cut rates and bought bonds, while money was sent to people.
Risk assets were the first to respond; it was easier to borrow and make bets on ideas with a lot of promise in the future. As the economy reopened and demand picked up, supply chains tightened, and prices in the real economy inflated.
Graphic: Retrieved from Moody’s Corporation (NYSE: MCO).
As argued by Pozsar, Andy Constan, and Joseph Wang, inflation likely trends higher for longer. Trends in de-globalization, supply chain chokepoints and restructuring, and a large credit boom in the banking sector are among the factors to blame.
Policymakers will continue generating negative wealth effects. Collateral damages to the economy (e.g., Alphabet Inc [NASDAQ: GOOGL] [NASDAQ: GOOG] and Spotify Technology SA [NYSE: SPOT] layoffs) are expected, consequently.
Graphic: Retrieved from The Market Ear. Per Morgan Stanley (NYSE: MS), “the single most important driver of equities over the last year has been excess liquidity, and it’s about to turn more restrictive. The amount of liquidity in the system is about to change again – the Treasury is increasing bill issuance sizes, which will drain liquidity from the system. The Treasury could build cash by more than $200 billion over the span of a month – which on top of QT will effectively drain nearly $300 billion from bank reserves – which implies the S&P 500 should be 6% lower over the net month.”
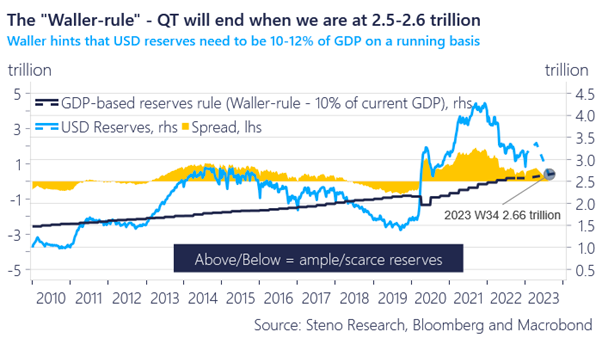
Moreover, per Andreas Steno Larsen, markets likely bottoms in the middle of 2023.
“[Christopher] Waller said that the QT process will either have to slow or come to a complete halt if the amount of USD reserves is equal to 10-11% of USD GDP, which is around 2.5 trillion USDs relative to current GDP (but rising over time obviously).”
Because we have more than $3 trillion USD in the system, and “more to be added due to the debt ceiling, we need a withdrawal of another $5-600 billion before QT will end [or] slow in between weeks 34-40 on our calculations,” Steno Larsen added, noting that if GDP flatlines, that would help keep QT running for longer.
“If the Fed is willing to bring reserves down to 10% of GDP, we should expect S&P 500 to bottom around $3,250.00 in the second half of the year,” Steno Larsen said. “The Waller Rule is not good news ultimately, but for now let’s enjoy the liquidity added in February and March due to the debt ceiling. When a debt ceiling deal is signed, run for the hills.”
As of 7:15 AM ET, Monday’s regular session (9:30 AM – 4:00 PM ET), in the S&P 500, is likely to open in the middle part of a balanced overnight inventory, inside of prior-range and -value, suggesting a limited potential for immediate directional opportunity.
Our S&P 500 pivot for today is $3,988.25.
Key levels to the upside include $3,998.25, $4,011.75, and $4,019.00.
Key levels to the downside include $3,979.75, $3,965.25, and $3,949.00.
Click here to load today’s key levels into the web-based TradingView platform. All levels are derived using the 65-minute timeframe. New links are produced, daily.
As a disclaimer, the S&P 500 could trade beyond the levels quoted in the letter. Therefore, you should load the above link on your browser for more relevant levels.
Graphic: 65-minute profile chart of the Micro E-mini S&P 500 Futures.
Definitions
Volume Areas: Markets will build on areas of high-volume (HVNodes). Should the market trend for long periods of time, it will be identified by low-volume areas (LVNodes). LVNodes denote directional conviction and ought to offer support on any test.
If participants auction and find acceptance in an area of a prior LVNode, then future discovery ought to be volatile and quick as participants look to HVNodes for favorable entry or exit.
POCs: Denote areas where two-sided trade was most prevalent in a prior day session. Participants will respond to future tests of value as they offer favorable entry and exit.
MCPOCs: Denote areas where two-sided trade was most prevalent over numerous sessions. Participants will respond to future tests of value as they offer favorable entry and exit.
About
In short, an economics graduate working in finance and journalism.
Capelj spends most of his time as the founder of Physik Invest through which he invests and publishes daily analyses to subscribers, some of whom represent well-known institutions.
Separately, Capelj is an equity options analyst at SpotGamma and an accredited journalist interviewing global leaders in business, government, and finance.
The daily brief is a free glimpse into the prevailing fundamental and technical drivers of U.S. equity market products. Join the 300+ that read this report daily, below!
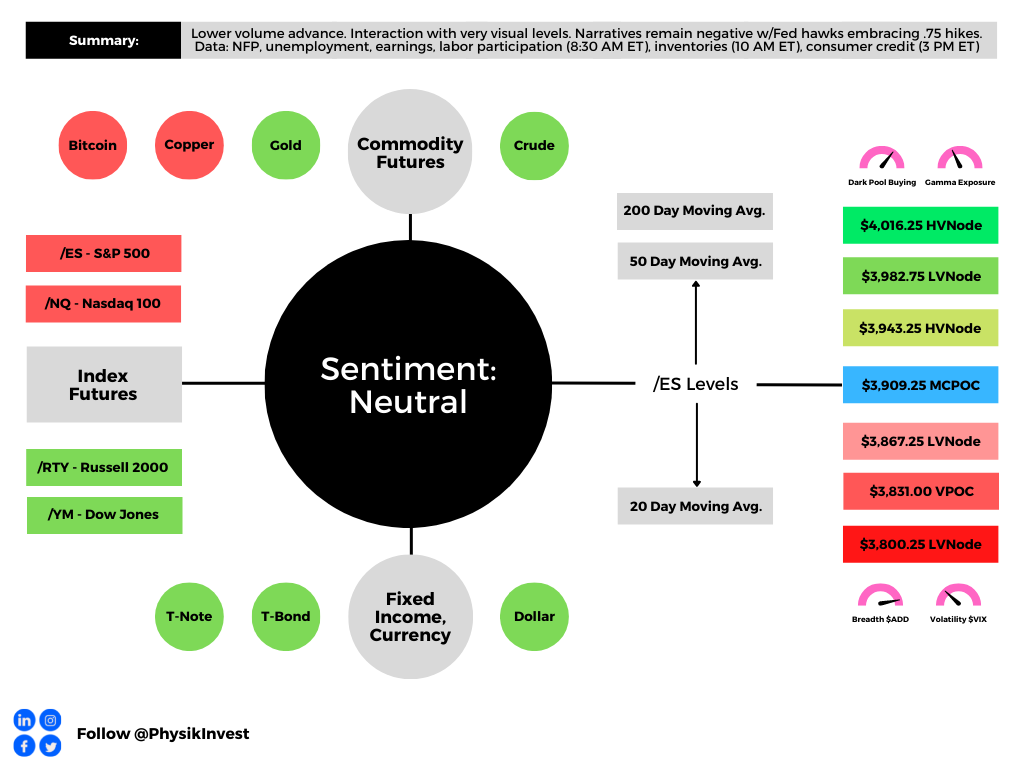
Graphic updated 7:00 AM ET. Sentiment Neutral if expected /ES open is inside of the prior day’s range. /ES levels are derived from the profile graphic at the bottom of the following section. Levels may have changed since initially quoted; click here for the latest levels. SqueezeMetrics Dark Pool Index (DIX) and Gamma (GEX) calculations are based on where the prior day’s reading falls with respect to the MAX and MIN of all occurrences available. A higher DIX is bullish. At the same time, the lower the GEX, the more (expected) volatility. Learn the implications of volatility, direction, and moneyness. Breadth reflects a reading of the prior day’s NYSE Advance/Decline indicator. VIX reflects a current reading of the CBOE Volatility Index (INDEX: VIX) from 0-100.
Fundamental
To start, thank you to the many new subscribers who joined in the past weeks. I’m honored.

Further, today we start broad (fundamental) and hone into specifics on how to act in the current trade environment (positioning), as well as potential inflection (technical) points.

I encourage you to read through to the technicals part, if possible. Have a great week!
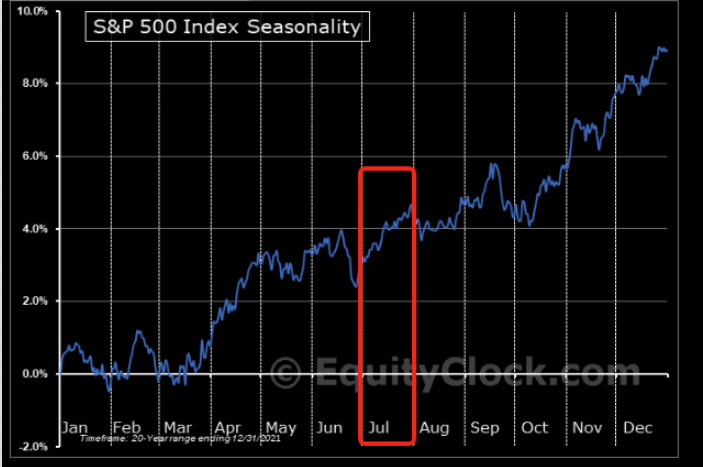
Seasonally speaking, the markets are in the midst of one of the most bullish periods of the year.
With bonds and equity products now off their swing lows and commodities off their highs (as inflation has, potentially, peaked), we have to question how much more?
Graphic: Retrieved from Goldman Sachs Group Inc (NYSE: GS).
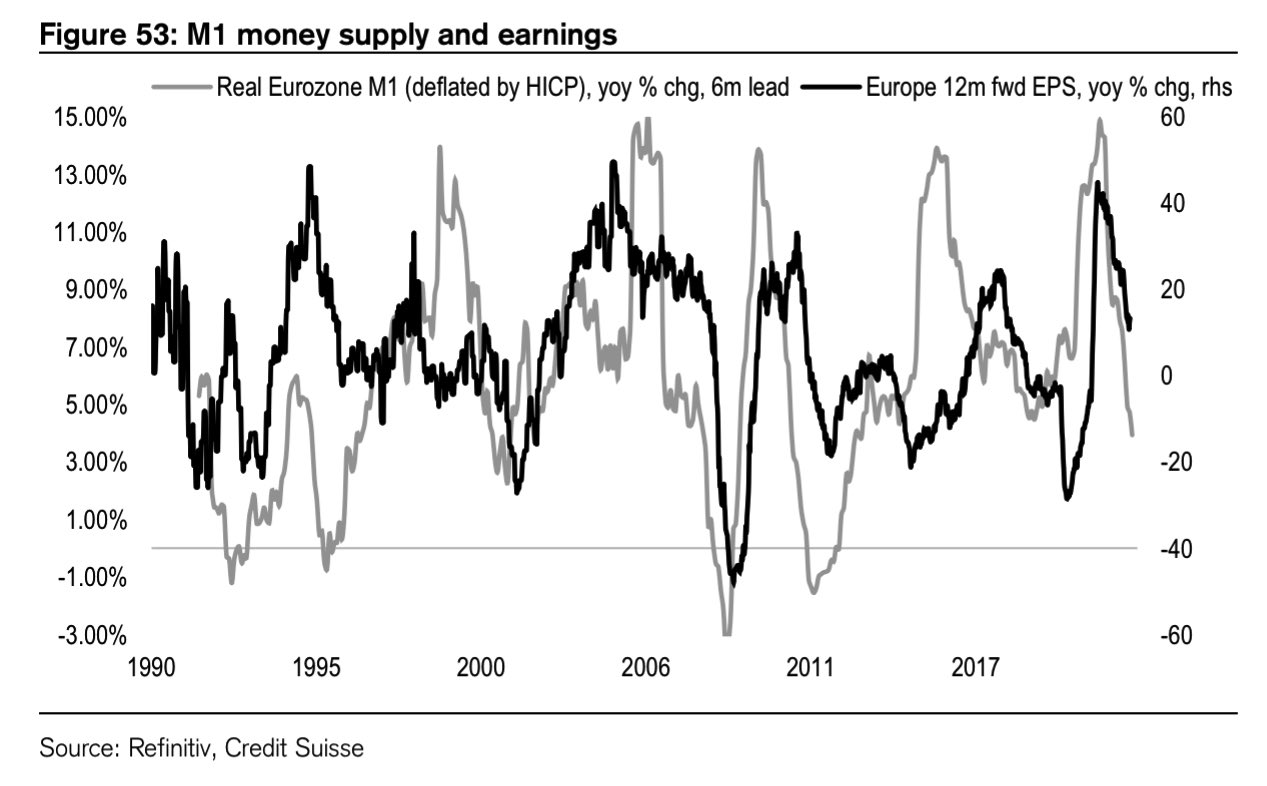
Well, thus far, and this is something we’ve talked about in the past, markets have suffered through compression in multiples. Does it stop or is there a looming earnings compression?
Graphic: Retrieved from Credit Suisse Group AG (NYSE: CS).
The earnings season shall shed clarity on the answer all the while – what is known – a strong dollar is sure to translate into a headwind for S&P 500 earnings growth.
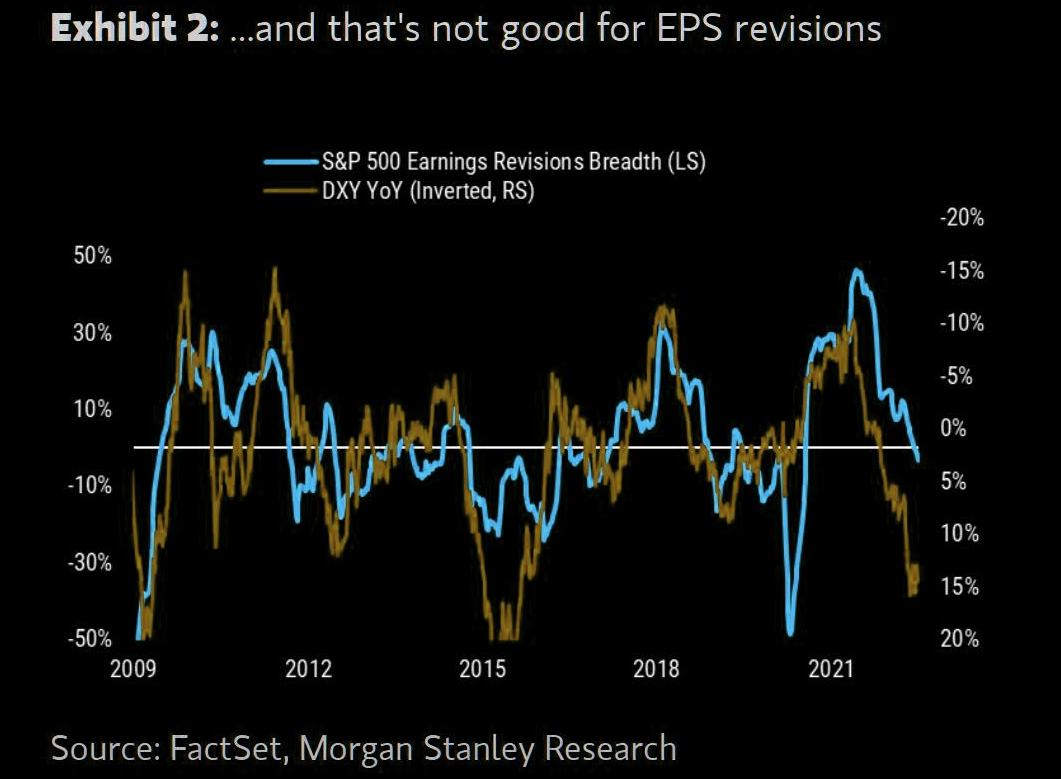
Graphic: Retrieved from The Market Ear. Via Morgan Stanley (NYSE: MS) research. “The simple math on S&P 500 earnings from currency is that for every percentage point increase on a year-on-year basis it’s approximately a 0.5xhit to EPS growth. At today’s 16% year-on-year level, that translates into an 8% headwind for S&P 500 EPS growth, all else equal”
“The main point for equity investors is that this dollar strength is just another reason to think earnings revisions are coming down,” Morgan Stanley’s Mike Wilson explains.
“[T]he recent rally in stocks is likely to fizzle out before too long.”
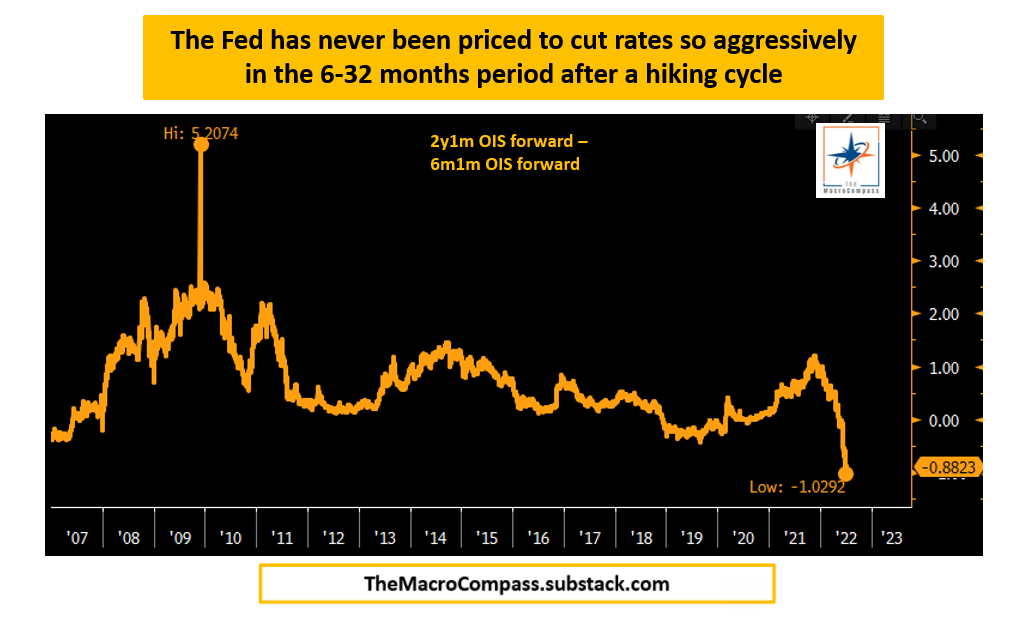
Moreover, with the impulse in credit falling, labor market showing preliminary signs of weakness, a drawdown in commodities (which is consistent with sharply lower economic growth), and bond market pricing rate cuts in early 2023, immediately following the hiking cycle, portfolios can “stay away from highly speculative assets, own USD cash and start allocating towards 5-10y+ government bonds,” as Alfonso Peccatiello explains well in his letter, The Macro Compass.
Graphic: Retrieved from The Macro Compass published by Alfonso Peccatiello.
Positioning
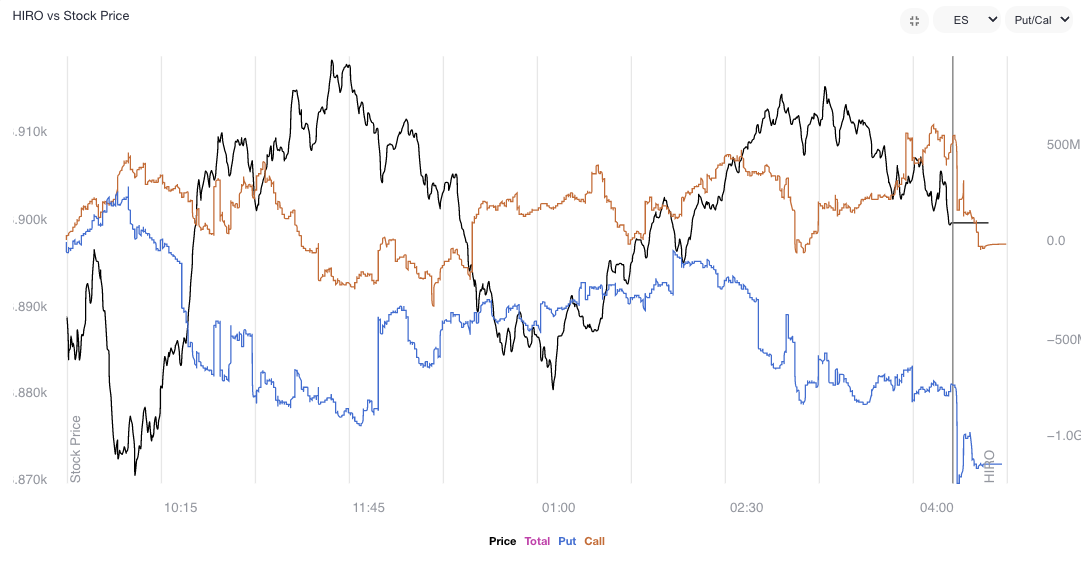
Calmer trade alongside easing volatility and generally rising gamma exposures. Trade, at times, was responsive. Participants would add positive (negative) delta bets into weakness (strength).
Graphic: Updated 7/8/2022. SpotGamma’s Hedging Impact of Real-Time Options (HIRO) indicator registers the sale of put (blue line) and call (orange) options.
Noteworthy is the continued sale of volatility, particularly across shorter time horizons, as well as increased demand for call options, especially in some of the larger index weights. Volatility sale, on the part of customers, leaves liquidity providers warehousing long volatility (which is kind of a naive thing to say as we’re discounting customer trades being paired off with each other).
Nonetheless, these liquidity providers’ positions, all else equal, will maintain or increase in value if underlying(s) realize volatility (especially that far in excess of implied). To hedge, rips (dips) will be sold (bought) to offset the increasing positive (negative) delta.
Graphic: Updated 7/7/2022. SpotGamma’s HIRO indicator for Alphabet Inc (NASDAQ: GOOG) (NASDAQ: GOOGL). Rising orange and blue lines point to call buying and put selling, both of which have bullish implications.
Moreover, this trend in volatility supply is in part on the loss of interest in “leveraged long S&P” trades, as well as “marginal demand for puts,” as SqueezeMetrics has stated, before.
Graphic: Retrieved from The Market Ear. Originally sourced via VIX Central. “Chart shows the VIX term structure ‘crash’ since June 13, which was the most recent VIX peak. The curve is now back to normal with the short end of the curve ‘much’ lower than longer-term maturities. Let’s see how far down they ‘press’ this.”
“Creeping into net selling territory is ‘smart’ bear market positioning. Short delta, short skew.”
Graphic: Retrieved from The Market Ear. “VIX has decoupled from cross-asset volatilities.”
Accordingly, the volatility markets have realized (RVOL) has crept (and exceeded, at times) the volatility implied (IVOL).
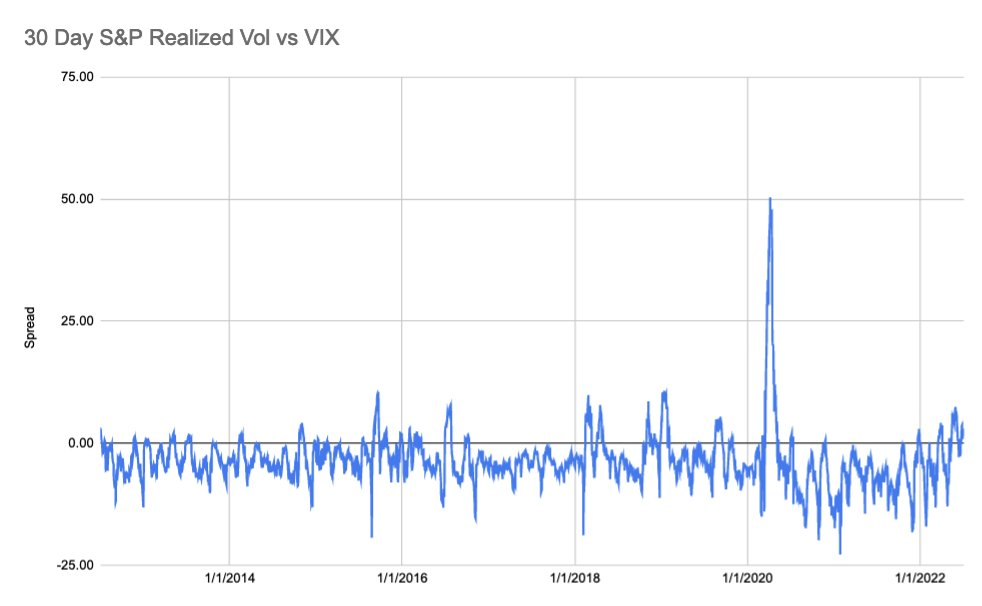
Graphic: Via S&P Global. As explained by SpotGamma, “30-day realized SPX volatility is now trading above the VIX, something that generally shows after major selloffs wherein IV “premium” needs to reset to calmer/higher equity markets.”
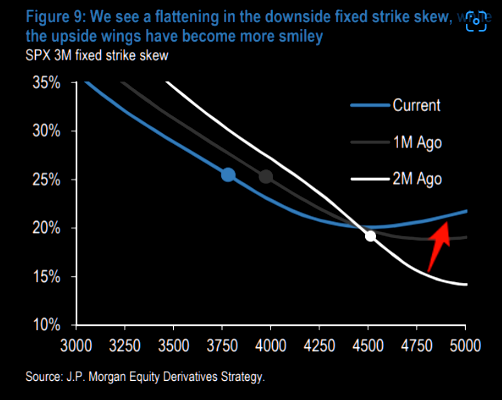
This, coupled with “a flattening in the downside fixed strike skew, while the upside wings [are] more smiley,” as described by JPMorgan Chase & Co (NYSE: JPM), has made for attractive low-cost spread opportunities, as talked about in the July 8, 2022 letter.
Graphic: Via JPMorgan Chase & Co (NYSE: JPM). Taken from The Market Ear.
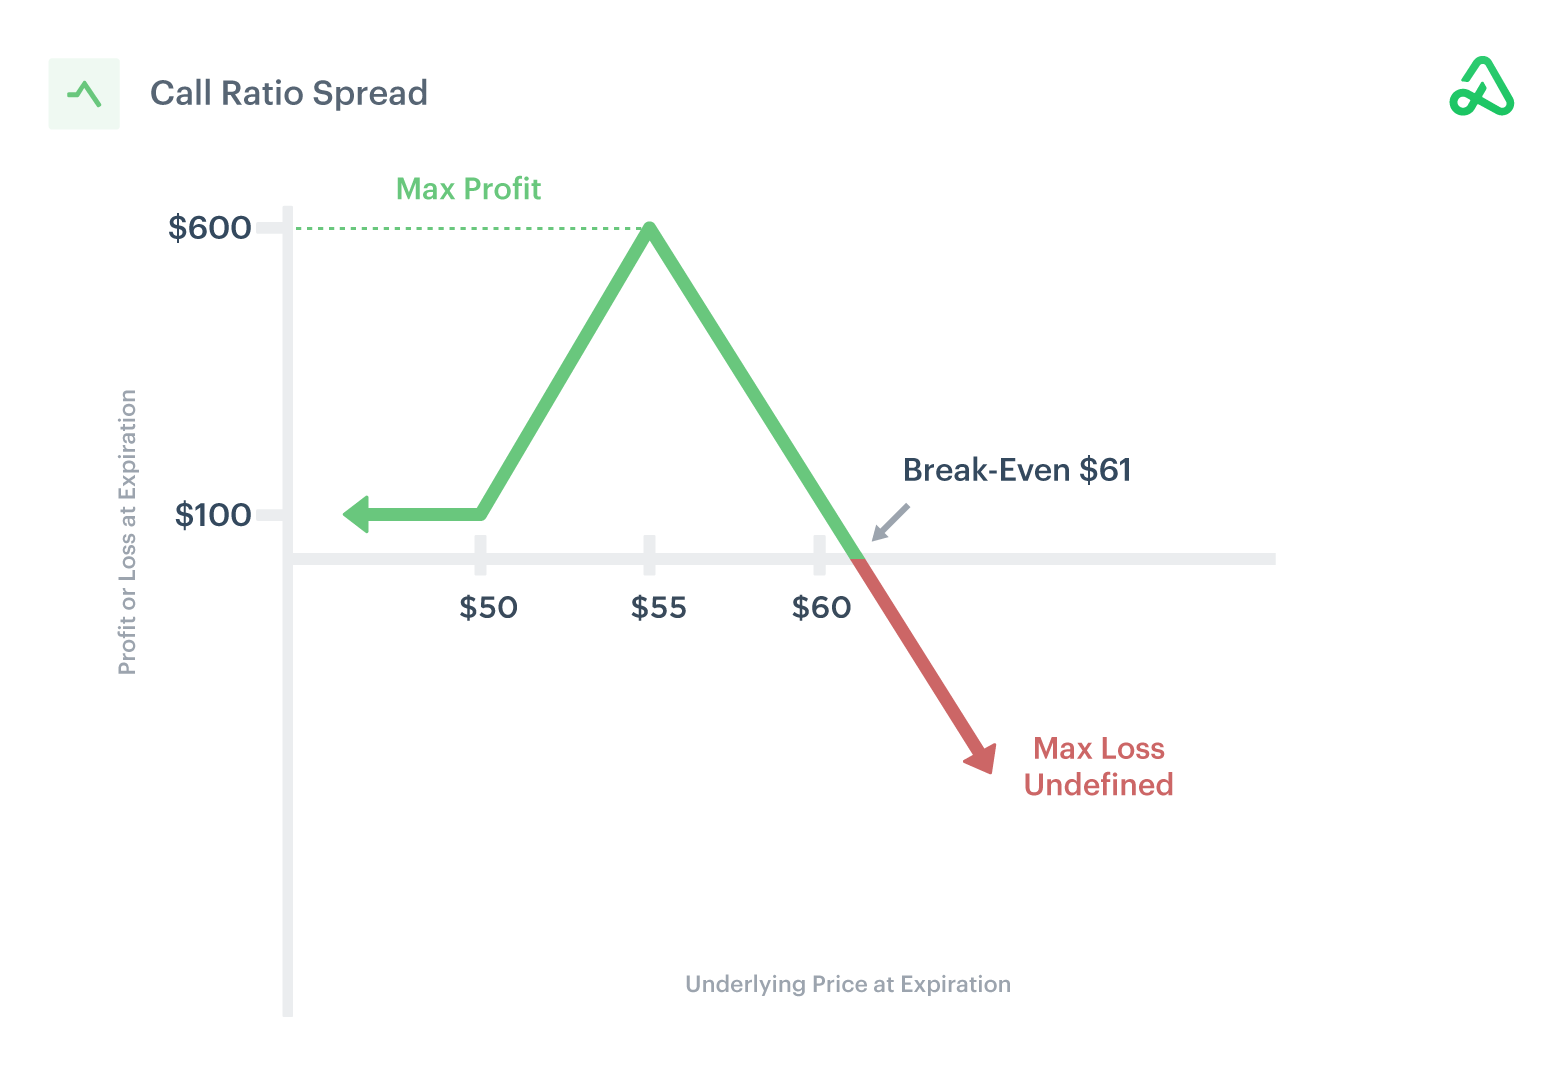
For instance, as discussed Friday, ratio spreads continue to work well for low- or no-cost exposure to the upside.
Pursuant to those remarks, no-cost spreads this letter’s writer has structured in Alphabet Inc (NASDAQ: GOOG) (NASDAQ: GOOGL) are pricing hundreds of dollars in credit to close.
Graphic: Via Charles Schwab Corporation-owned (NYSE: SCHW) TD Ameritrade’s Thinkorswim.
Obviously, there’s no mention, here, of the risk management (e.g., sizing and width) involved. Again, this is as I’m trying to give actionable info without providing explicit recommendations.
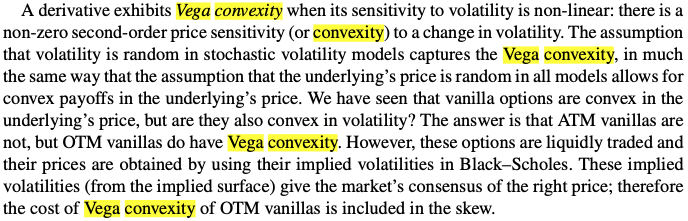
Similarly, if one thought volatility, though at a high starting point particularly at the money (ATM), was due for a repricing, they would look for exposure to the downside via something such as an inverse ratio (or back spread), as said last week.
This is as the ATMs, unlike those further out of the money (OTM), are less convex in vega.
Graphic: Via Mohamed Bouzoubaa et al’s Exotic Options and Hybrids.
Technical
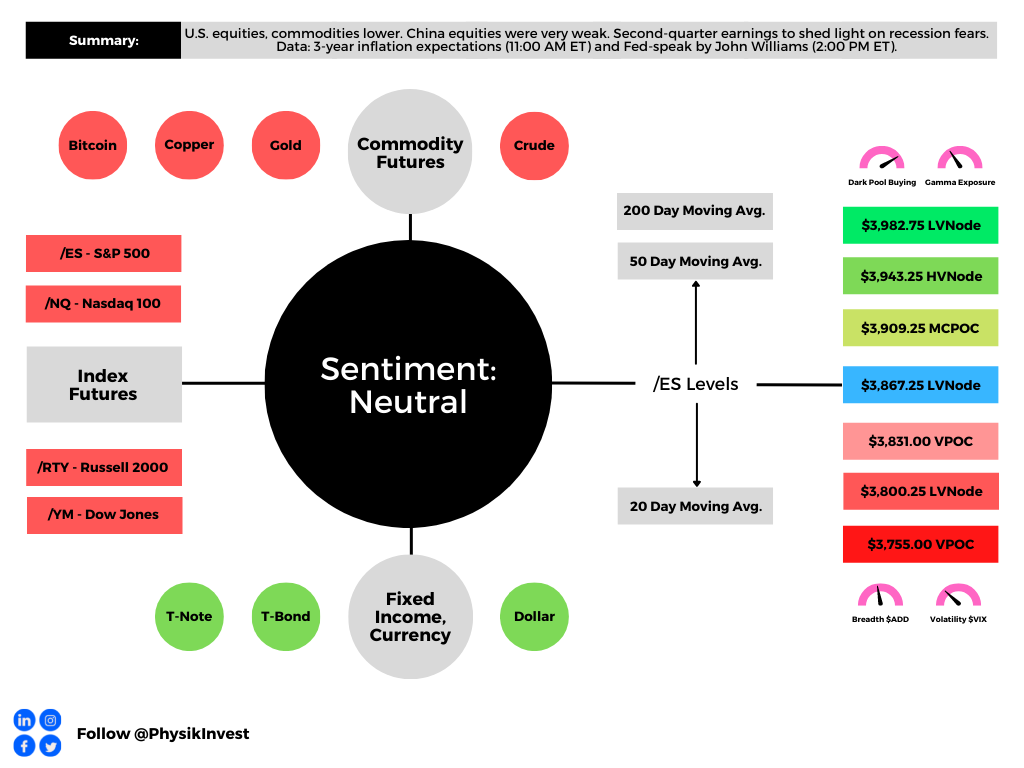
As of 7:00 AM ET, Monday’s regular session (9:30 AM – 4:00 PM ET), in the S&P 500, is likely to open in the middle-to-lower part of a negatively skewed overnight inventory, inside of prior-range and -value, suggesting a limited potential for immediate directional opportunity.
In the best case, the S&P 500 trades higher.
Any activity above the $3,867.25 LVNode puts into play the $3,909.25 MCPOC. Initiative trade beyond the MCPOC could reach as high as the $3,943.25 HVNode and $3,982.75 LVNode, or higher.
In the worst case, the S&P 500 trades lower.
Any activity below the $3,867.25 LVNode puts into play the $3,831.00 VPOC. Initiative trade beyond the VPOC could reach as low as the $3,800.25 LVNode and $3,755.00 VPOC, or lower.
Click here to load today’s key levels into the web-based TradingView charting platform. Note that all levels are derived using the 65-minute timeframe. New links are produced, daily.
Graphic: 65-minute profile chart of the Micro E-mini S&P 500 Futures.
Considerations: Responsiveness near key-technical areas (that are discernable visually on a chart), suggests technically-driven traders with short time horizons are very active.
Such traders often lack the wherewithal to defend retests and, additionally, the type of trade may be indicative of the other time frame participants waiting for more information to initiate trades.
Example: The below 65-minute S&P 500 chart with volume profiles was included in the July 8, 2022 edition of the newsletter. Prices were near an inflection (micro-composite point of control and two key volume-weighted average price levels). From thereon, selling surfaced.This is what is meant by responsiveness near key-technical areas.
Graphic: Updated 7/2/22. 65-minute profile chart of the Micro E-mini S&P 500 Futures.
Definitions
Volume Areas: A structurally sound market will build on areas of high volume (HVNodes). Should the market trend for long periods of time, it will lack sound structure, identified as low volume areas (LVNodes). LVNodes denote directional conviction and ought to offer support on any test.
If participants were to auction and find acceptance into areas of prior low volume (LVNodes), then future discovery ought to be volatile and quick as participants look to HVNodes for favorable entry or exit.
POCs: POCs are valuable as they denote areas where two-sided trade was most prevalent in a prior day session. Participants will respond to future tests of value as they offer favorable entry and exit.
MCPOCs: POCs are valuable as they denote areas where two-sided trade was most prevalent over numerous day sessions. Participants will respond to future tests of value as they offer favorable entry and exit.
Volume-Weighted Average Prices (VWAPs): A metric highly regarded by chief investment officers, among other participants, for quality of trade. Additionally, liquidity algorithms are benchmarked and programmed to buy and sell around VWAPs.
About
After years of self-education, strategy development, mentorship, and trial-and-error, Renato Leonard Capelj began trading full-time and founded Physik Invest to detail his methods, research, and performance in the markets.
Capelj also develops insights around impactful options market dynamics at SpotGamma and is a Benzinga reporter.
In no way should the materials herein be construed as advice. Derivatives carry a substantial risk of loss. All content is for informational purposes only.
The daily brief is a free glimpse into the prevailing fundamental and technical drivers of U.S. equity market products. Join the 300+ that read this report daily, below!
Graphic updated 6:30 AM ET. Sentiment Neutral if expected /ES open is inside of the prior day’s range. /ES levels are derived from the profile graphic at the bottom of the following section. Levels may have changed since initially quoted; click here for the latest levels. SqueezeMetrics Dark Pool Index (DIX) and Gamma (GEX) calculations are based on where the prior day’s reading falls with respect to the MAX and MIN of all occurrences available. A higher DIX is bullish. At the same time, the lower the GEX, the more (expected) volatility. Learn the implications of volatility, direction, and moneyness. Breadth reflects a reading of the prior day’s NYSE Advance/Decline indicator. VIX reflects a current reading of the CBOE Volatility Index (INDEX: VIX) from 0-100.
Fundamental
A light few letters after what it seems were like weeks of heavy content to discuss.
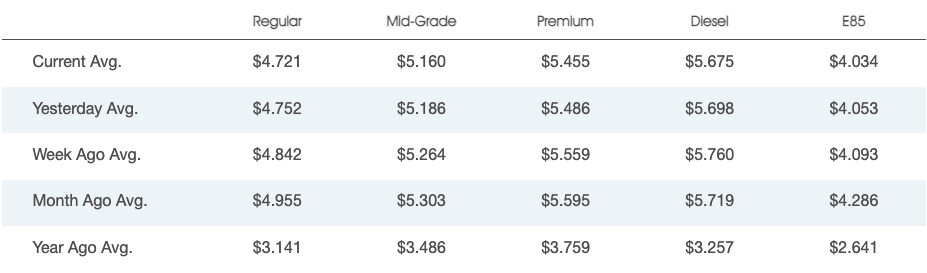
Further, prices at the pump are falling on an “unseasonal” drop in consumption, all the while the biggest bulls have tempered their outlooks on the market citing inflation and the implications of geopolitical tensions.
Graphic: National average gas prices posted by AAA.
An overseas slowdown affecting China likely solicits stimulus. Reported was China’s Ministry of Finance considering the sale of special bonds with proceeds used to pay for infrastructure and boost a slowed economy increasingly in the clear from Covid.
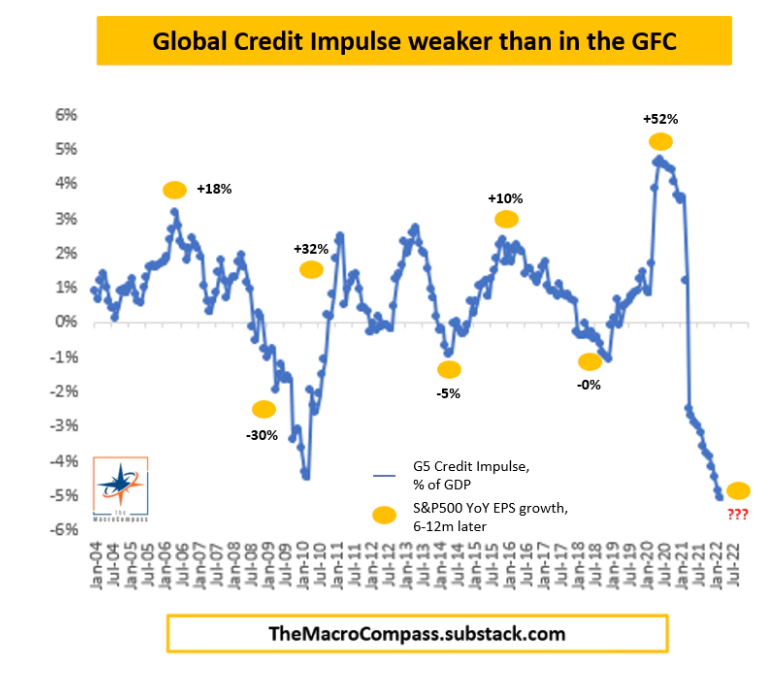
Graphic: Shared by Alfonso Peccatiello. “the pace of real-economy money printing (not bank reserves…) going on in the 5 largest economies in the world. It’s a good leading indicator for economic growth & the performance of several asset classes. It just printed below the GFC lows.”
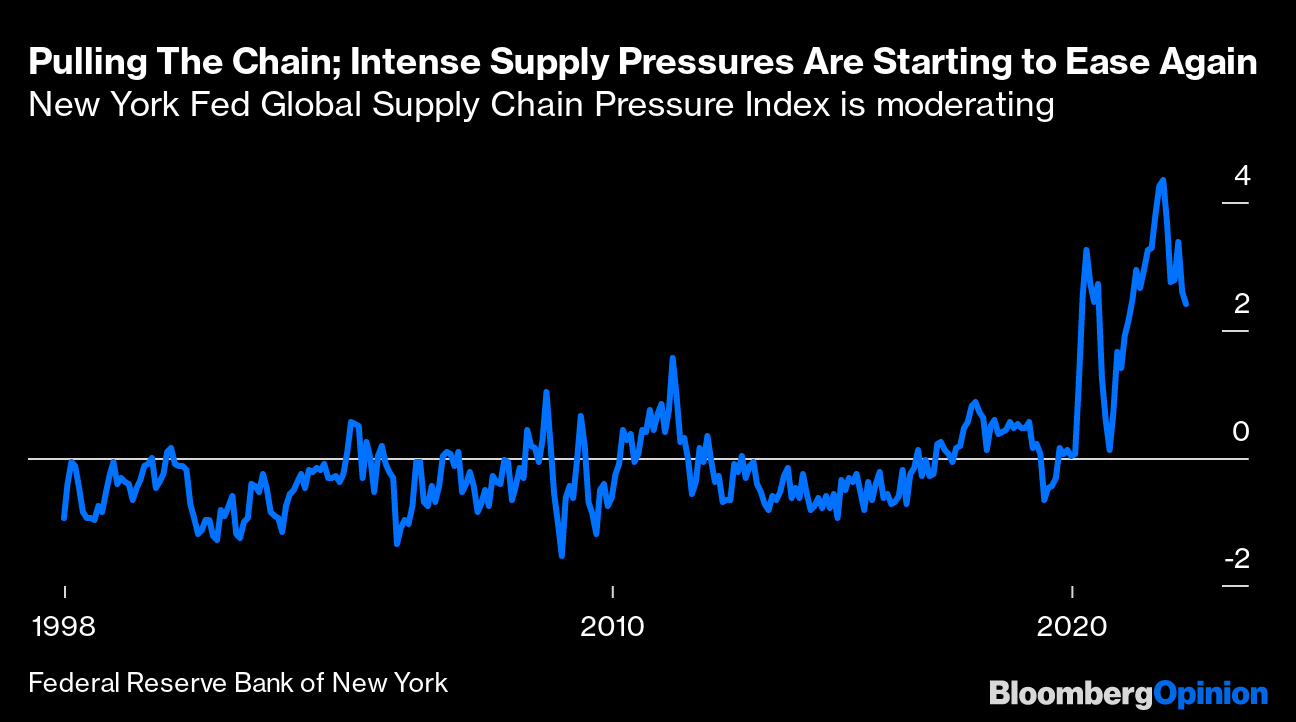
Moreover, as talked about yesterday, inflation may have peaked. Inventories are pointing to a looming supply gut.
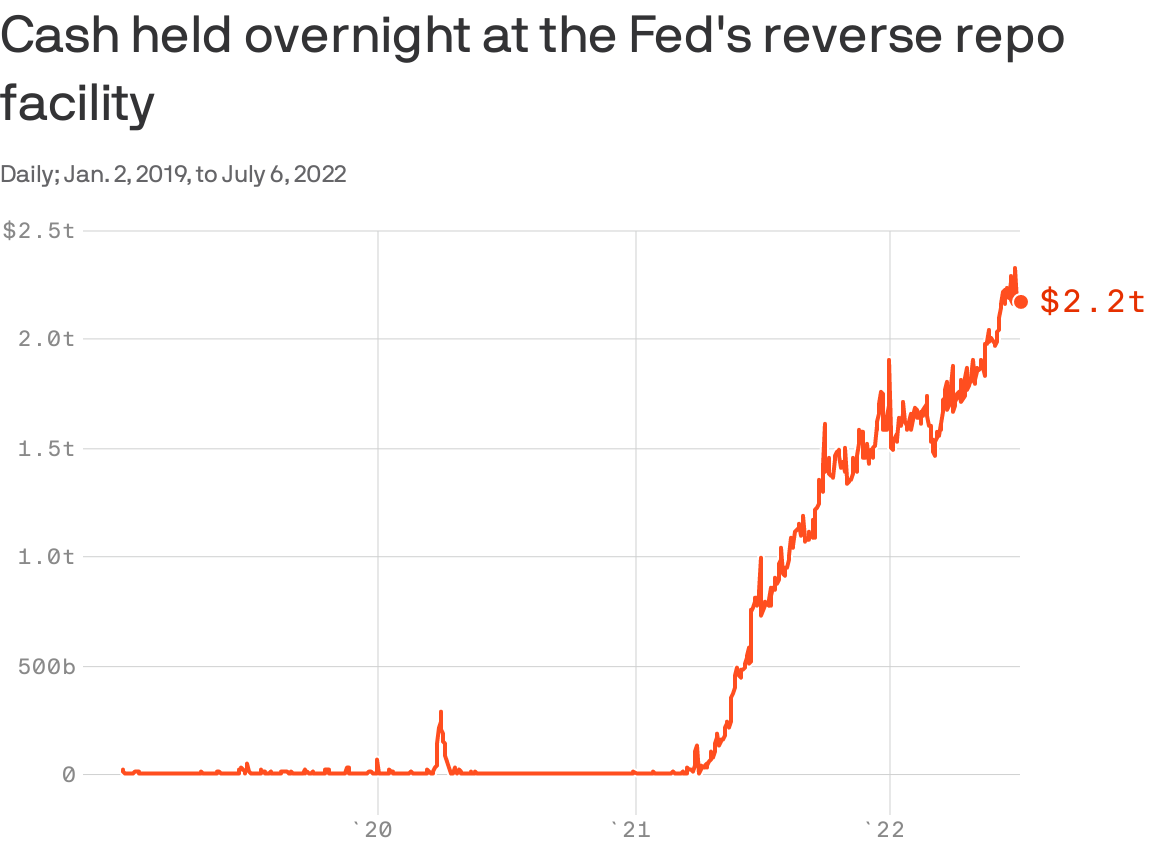
Accordingly, the Federal Reserve (Fed), just as it was slow to end stimulus late last year and early this year, maybe slow in moderating its efforts to de-stimulate.
Graphic: Retrieved from Axios. “The glut of cash being parked at the Fed is reflective of policies that have already run their course, especially with quantitative tightening underway.” But, “it’s a representation of how much too far the Fed went in easing,” says Thomas Simon, an economist at Jefferies Financial Group (NYSE: JEF).
Minutes from the last Federal Open Market Committee (FOMC) meeting revealed a rate hike up to 75 basis points in July would be appropriate, per Moody’s Corporation (NYSE: MCO).
A strong jobs report would likely prompt the Fed “to raise rates even more aggressively as they pursue their goal to raise the unemployment rate,” explains Bryce Doty of Sit Fixed Income.
“As [the Fed] seek[s] to destroy demand, they are also destroying supply. As a result, inflation will persist longer and the economy will be even worse.”
This is pursuant to calls by the Credit Suisse Group AG’s (NYSE: CS) Zoltan Pozsar who put forth, earlier this year, that the “Fed is pursuing demand destruction through negative wealth effects,” as the “central banks can only deal with nominal [and] not real chokepoints.”
Graphic: Via JPMorgan Chase & Co (NYSE: JPM). Taken from The Market Ear. “A stronger dollar, lower equity prices, and higher mortgage rates will weigh on demand growth [and] Over time weaker output demand should lead to weaker labor demand Don’t fight the Fed as this is what Fed wants (slower growth).”
Ultimately, the “risk of recession, whether it is real or merely implied by an inversion of the yield curve, won’t deter the Fed from hiking rates higher faster or from injecting more volatility to build up negative wealth effects.”
“Rallies could beget more forceful pushback from the Fed – the new game.”
Data shows net gamma exposure increasing which may increasingly feed into smaller ranges and a positive drift amid shorter-dated volatility sales and a pick up in call demand, particularly in some of the larger index weights.
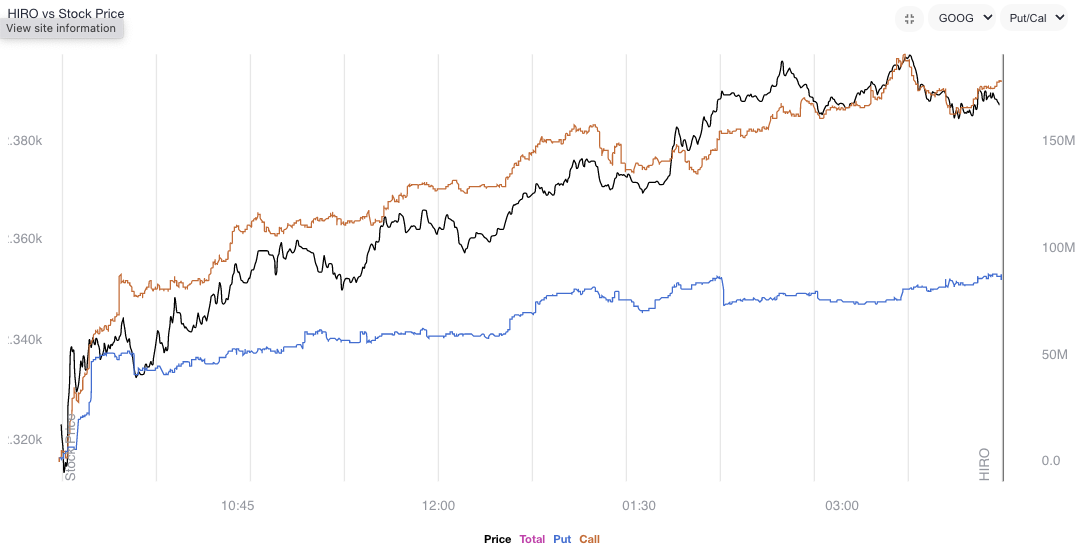
Graphic: Via SpotGamma’s Hedging Impact of Real-Time Options (HIRO) indicator for Alphabet Inc (NASDAQ: GOOG) (NASDAQ: GOOGL). Rising orange and blue lines point to call buying and put selling, both of which have bullish implications.
The creep in volatility realized (RVOL), versus that which is implied (IVOL), coupled with “a flattening in the downside fixed strike skew, while the upside wings [are] more smiley,” per JPMorgan Chase & Co (NYSE: JPM), makes it so we can put on more complex structures.
Graphic: Via S&P Global Inc (NYSE: SPGI). As explained by SpotGamma, “30-day realized SPX volatility is now trading above the VIX, something that generally shows after major selloffs wherein IV “premium” needs to reset to calmer/higher equity markets.”
For instance, ratio spreads continue to work well for low- or no-cost exposure to the upside.
Likewise, if one thought volatility, though at a high starting point particularly at the money (ATM), was due for a repricing, they would look for exposure to the downside via something such as an inverse ratio (or backspread).
This is as the ATMs, unlike those further out of the money (OTM), are less convex in vega.
As of 6:30 AM ET, Friday’s regular session (9:30 AM – 4:00 PM ET), in the S&P 500, is likely to open in the upper part of a negatively skewed overnight inventory, inside of prior-range and -value, suggesting a limited potential for immediate directional opportunity.
In the best case, the S&P 500 trades higher.
Any activity above the $3,909.25 MCPOC puts into play the $3,943.25 HVNode. Initiative trade beyond the HVNode could reach as high as the $3,982.75 LVNode and $4,016.25 HVNode, or higher.
In the worst case, the S&P 500 trades lower.
Any activity below the $3,909.25 MCPOC puts into play the $3,867.25 LVNode. Initiative trade beyond the LVNode could reach as low as the $3,831.00 VPOC and $3,800.25 LVNode, or lower.
Click here to load today’s key levels into the web-based TradingView charting platform. Note that all levels are derived using the 65-minute timeframe. New links are produced, daily.
Graphic: 65-minute profile chart of the Micro E-mini S&P 500 Futures.
Considerations: Responsiveness near key-technical areas (that are discernable visually on a chart), suggests technically-driven traders with short time horizons are very active.
Such traders often lack the wherewithal to defend retests and, additionally, the type of trade may be indicative of the other time frame participants waiting for more information to initiate trades.
Definitions
Volume Areas: A structurally sound market will build on areas of high volume (HVNodes). Should the market trend for long periods of time, it will lack sound structure, identified as low volume areas (LVNodes). LVNodes denote directional conviction and ought to offer support on any test.
If participants were to auction and find acceptance into areas of prior low volume (LVNodes), then future discovery ought to be volatile and quick as participants look to HVNodes for favorable entry or exit.
POCs: POCs are valuable as they denote areas where two-sided trade was most prevalent in a prior day session. Participants will respond to future tests of value as they offer favorable entry and exit.
MCPOCs: POCs are valuable as they denote areas where two-sided trade was most prevalent over numerous day sessions. Participants will respond to future tests of value as they offer favorable entry and exit.
Volume-Weighted Average Prices (VWAPs): A metric highly regarded by chief investment officers, among other participants, for quality of trade. Additionally, liquidity algorithms are benchmarked and programmed to buy and sell around VWAPs.
About
After years of self-education, strategy development, mentorship, and trial-and-error, Renato Leonard Capelj began trading full-time and founded Physik Invest to detail his methods, research, and performance in the markets.
Capelj also develops insights around impactful options market dynamics at SpotGamma and is a Benzinga reporter.
In no way should the materials herein be construed as advice. Derivatives carry a substantial risk of loss. All content is for informational purposes only.
The daily brief is a free glimpse into the prevailing fundamental and technical drivers of U.S. equity market products. Join the 300+ that read this report daily, below!
Overnight, equity index futures were steady alongside commodities and bonds. This is ahead of the release of minutes from a Federal Reserve (Fed) policy meeting.
In the news were advertising and social media firms. Snap Inc (NYSE: SNAP) warned of slower growth and deterioration in the macro-environment. Its peers Meta Platforms Inc (NASDAQ: FB), Alphabet Inc (NASDAQ: GOOGL), and Twitter Inc (NYSE: TWTR) also saw weakness.
China’s COVID Zero commitment likely nudges it off a path to achieve economic targets “by a large margin for the first time ever,” as Bloomberg explains.
This is as China and Russia have conducted one of their largest joint air drills “to send their own political, economic and military message to the international community,” much of which is at Davos, Switzerland doing thought exercises.
In a recent podcast, Pippa Malmgren, who is a former White House adviser and economist, well said, particularly in reference to some of the tension abroad, that “autocracy is not working well,” and “[y]ou go to war because … you have a domestic objective.”
Thought it was interesting. Give it a listen, here.
And, finally, Michael Burry of the “Big Short” sent a cryptic tweet alluding to what is likely the risk of another financial collapse.
Moreover, ahead is data on durable goods and core capital equipment orders (8:30 AM ET). Later, the Fed publishes the minutes of its last policy meeting (2:00 PM ET).
Graphic updated 6:10 AM ET. Sentiment Neutral if expected /ES open is inside of the prior day’s range. /ES levels are derived from the profile graphic at the bottom of the following section. Levels may have changed since initially quoted; click here for the latest levels. SqueezeMetrics Dark Pool Index (DIX) and Gamma (GEX) calculations are based on where the prior day’s reading falls with respect to the MAX and MIN of all occurrences available. A higher DIX is bullish. At the same time, the lower the GEX, the more (expected) volatility. Learn the implications of volatility, direction, and moneyness. SHIFT data used for S&P 500 (INDEX: SPX) options activity. Note that options flow is sorted by the call premium spent; if more positive, then more was spent on call options. Breadth reflects a reading of the prior day’s NYSE Advance/Decline indicator. VIX reflects a current reading of the CBOE Volatility Index (INDEX: VIX) from 0-100.
What To Expect
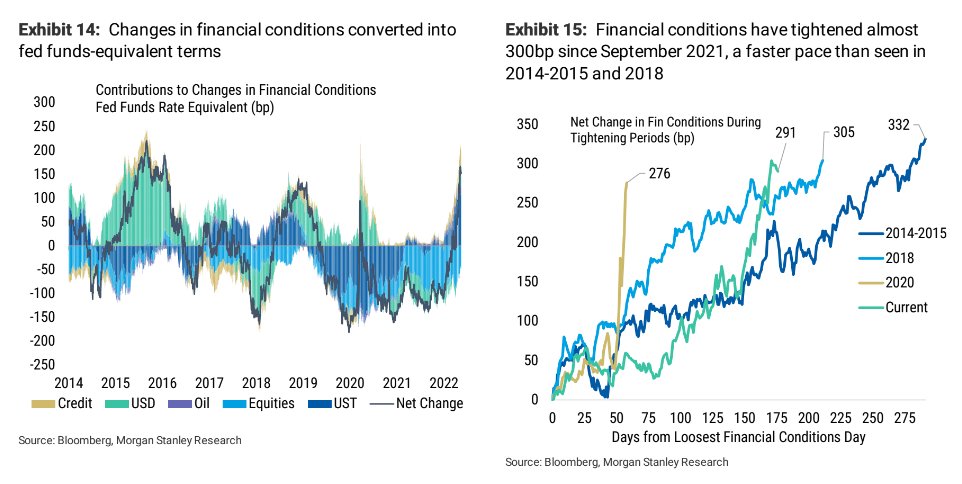
Fundamental: The Fed will issue policy meeting minutes that may provide clarity with respect to its intent to hike and reduce the size of its balance sheet.
In focus, per ex-Fed insider Ellen Meade, is “the rate path, the expected economic conditions, and what policymakers want to see from the data before they slow the pace of tightening.”
“The minutes may tell us they see the tightening in conditions this time around as greater than in earlier cycles. If that’s the case, then they may judge that they don’t need to raise the funds rate by as much this time around.”
Graphic: Via Morgan Stanley (NYSE: MS) research.
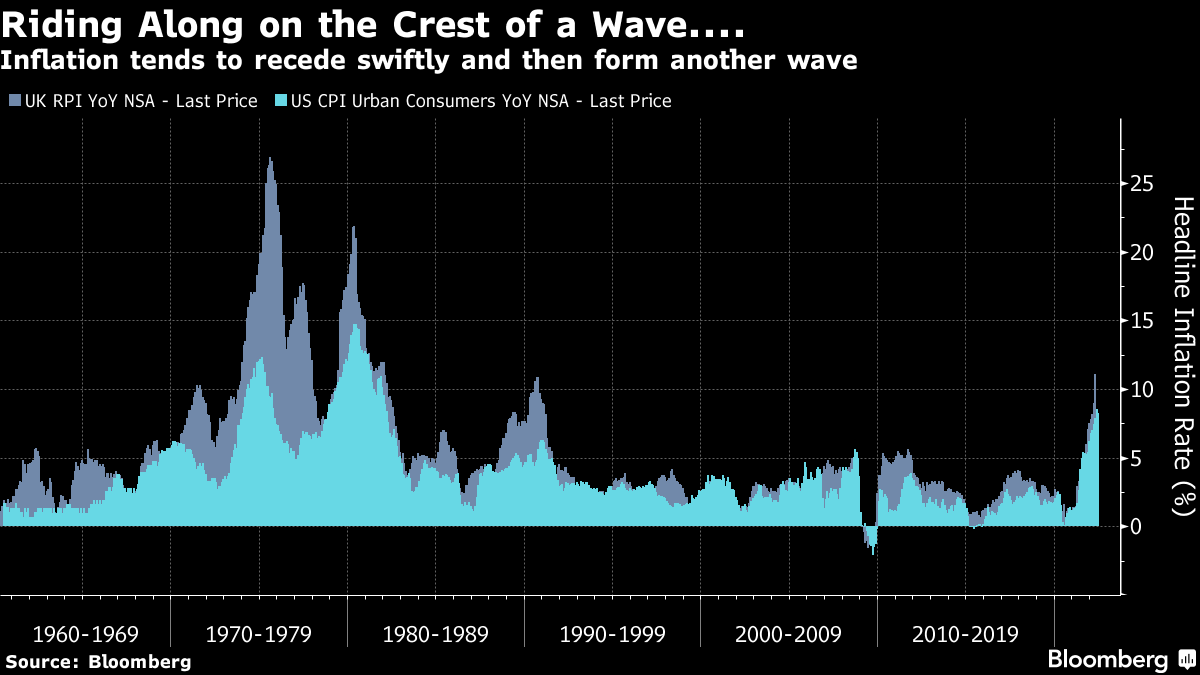
John Authers notes, however, that “inflation tends to move in waves” and it doesn’t, usually, “plateau and stay there.”
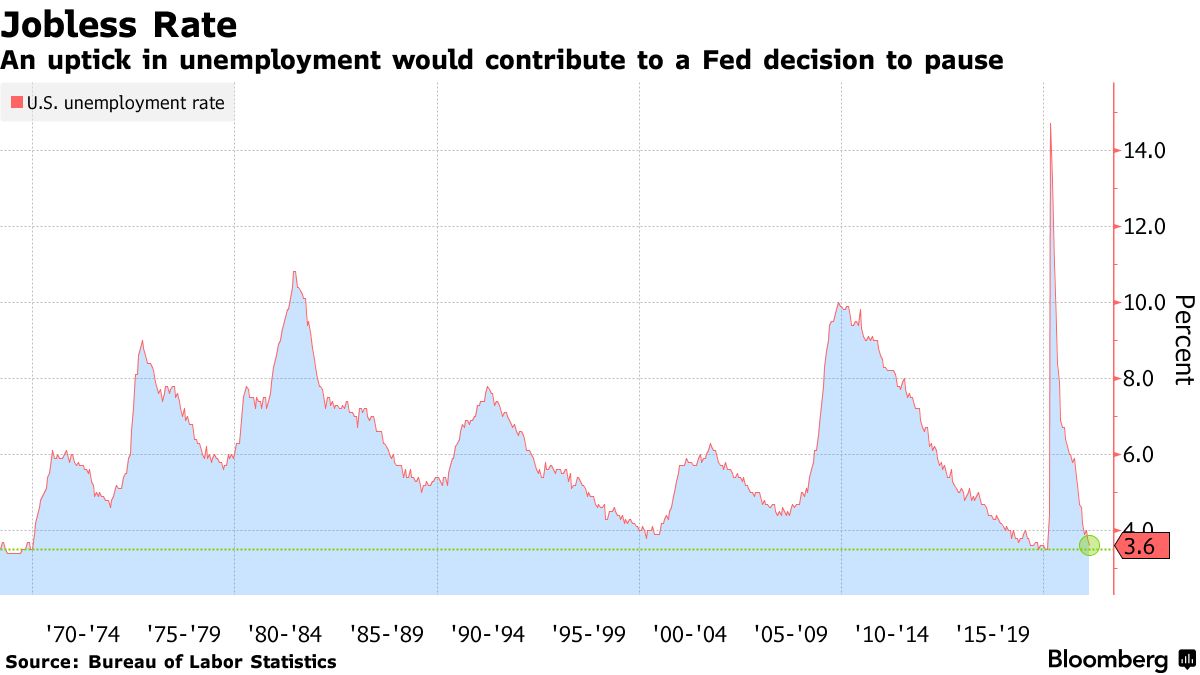
“That suggests that even though the focus is already shifting to whether there is evidence of a growth slowdown,” he added, in a statement echoed by Meade who is betting on slower “GDP growth, below its longer-run rate, and a rise in the unemployment rate, perhaps to its longer-run median rate or slightly above.”
Pursuant to those last remarks, the Fed’s Raphael Bostic is already floating a pause to rate hikes near September if inflation falls more than expected over the summer.
As Diane Swonk of Grant Thorton explains, “Policy works with a lag. The Fed wants to catch up but not outrun the market in its effort to tighten credit market conditions.”
Graphic: Via Bloomberg.
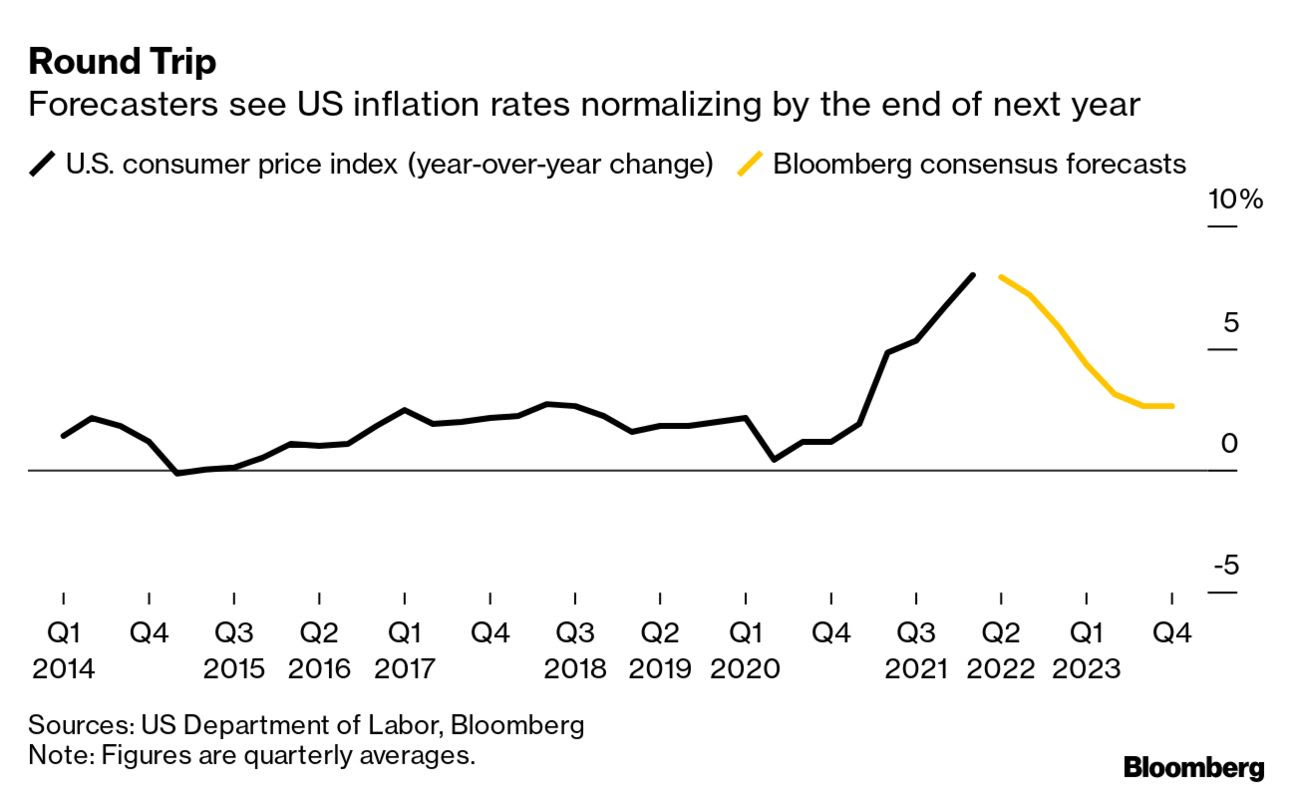
Futures First analyst Rishi Mishra, who is also the author of the “On Another Note” newsletter, suggests the Federal Open Market Committee may, rather, hone in on monthly changes with annual inflation still elevated.
“This brings down inflation expectations into a range where the Fed feels comfortable about de-anchoring risks,” Mishra said.
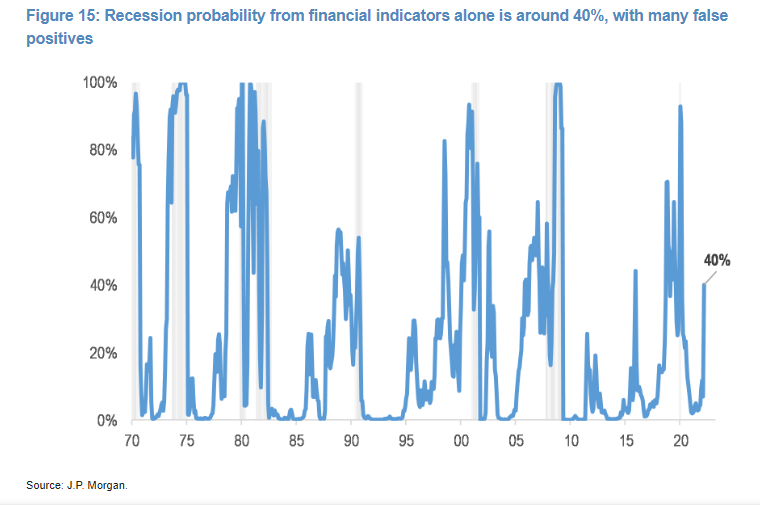
Graphic: Via JPMorgan Chase & Co (NYSE: JPM). Taken from Bloomberg. Though, potentially, “premature,” JPM’s model tracking the S&P 500, credit spreads and yield curve implies a 40% chance of a recession.
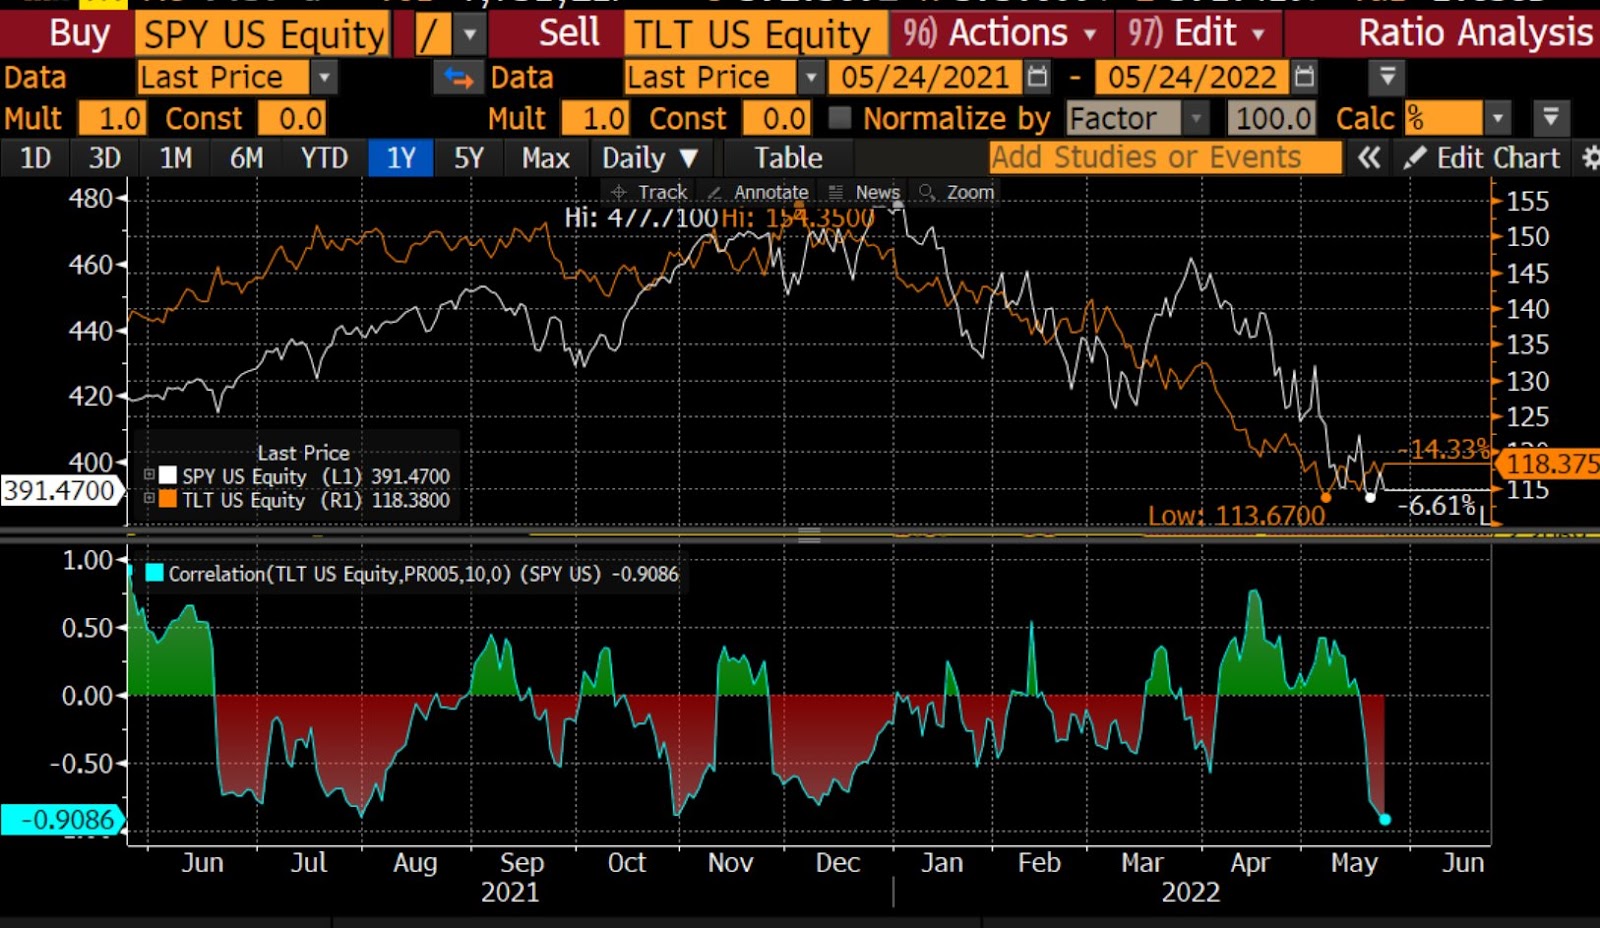
JPM’s Marko Kolanovic adds: “We have gone from a situation where both stocks and bonds were sold on the back of de-leveraging, to a situation where bonds rallied as stocks fell, nudging stock/bond correlations toward a more normal (negative) level.”
“We do indeed think this is where things could be gradually heading, but we acknowledge this is not likely to play out in a linear way.”
Graphic: Via @MrBlonde_macro. “Stock/bond correlation negative over the last 10 days. Some ‘normalization’ in cross-market relationships can be a source of relief.” The flip happened with 10-year yields at or above 3%.
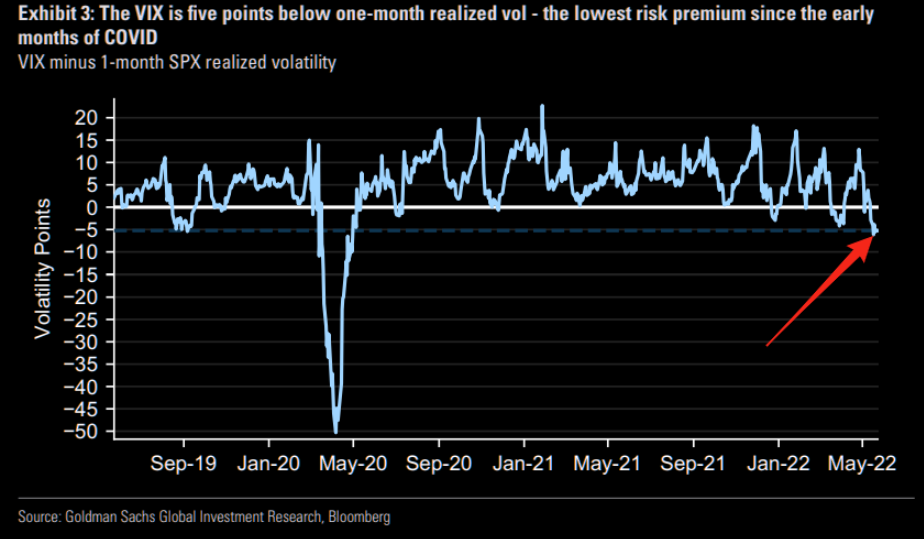
Positioning: In yesterday’s in-depth write-up, we talked about the underperformance of implied volatility (IVOL), relative to that which is realized (RVOL).
Dennis Davitt of Millbank Dartmoor Portsmouth had explained that the “RVOL of the underlying S&P 500 is above 27% … with IVOL of options trading between 24%-27%,” which translates to a VIX at 30%.
Graphic: Via Goldman Sachs Group Inc (NYSE: GS). Taken from The Market Ear.
So, essentially, it makes more sense to have exposure to underlying markets, synthetically (i.e., own options).
This, though, merits a bit more clarification (as I do not want it to be construed as if I was buying, systemically, bets on the downside). The opposite, actually.
Moreover, this was stated in the context of a market that is “(1) stretched and (2) near a critical inflection which we see at $3,700.00 SPX,” per SpotGamma. Separately, investors are bidding “skew on the call side” amid their “fear of missing on the upside.”
That’s when it makes sense to buy closer to at-the-money (ATM) and sell farther from ATM, or out-of-the-money (OTM). For instance, a margin intensive but low cost call +1 [ATM] x -2 [OTM] ratio spread.
Note, however, that width and timing are everything. Too much time or too narrow may result in asymmetric losses when the demand for upside bets further out in price and time bids the skew that you’re short, relative to the at-the-money volatility you own.

I’m willing to talk through this via email, if interested. Ping me at renato@physikinvest.com. I’m mindful that if I do post actual trade ideas, people may take them without knowing how to size and manage them, accordingly. Big yikes!
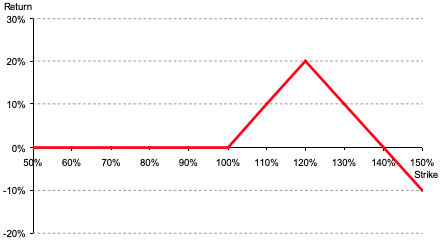
Goldman validates this thesis: “Even though the VIX’s reaction to recent spot downside has been mild, its high starting point leaves vol high overall, and we like strategies with a short volatility bias, including put selling and 1×2 call spread overlays.”
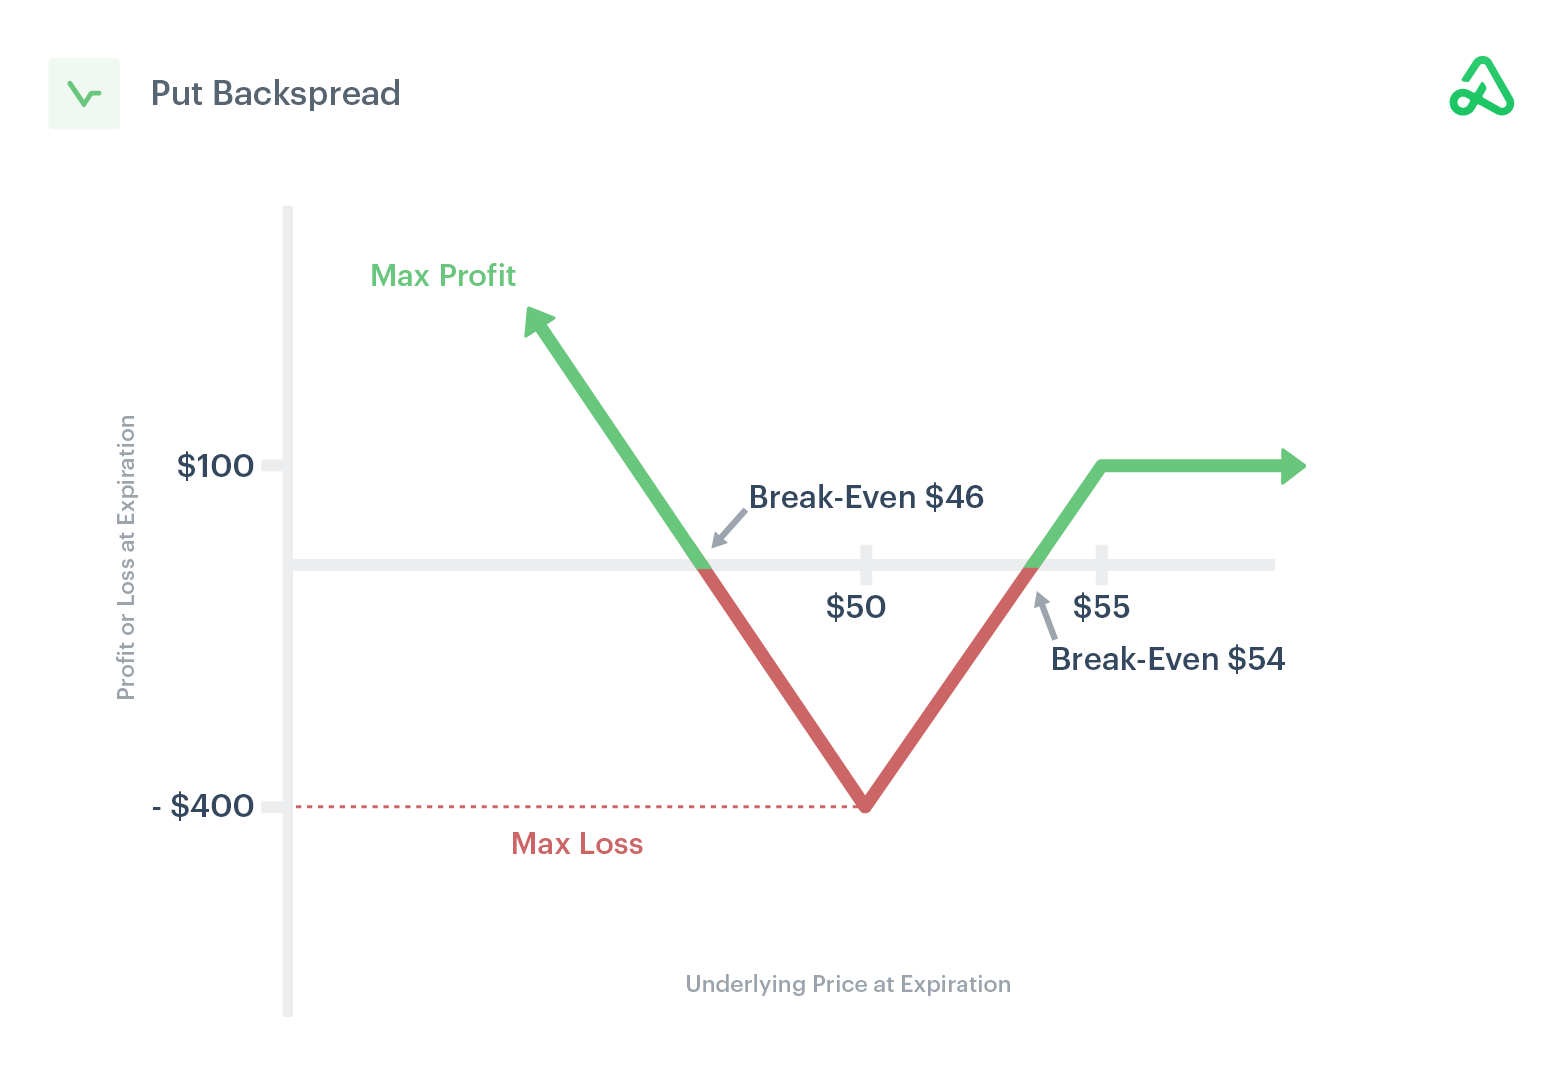
Graphic: Via Banco Santander SA (NYSE: SAN) research, the return profile, at expiry, of a classic 1×2 (long 1, short 2 further away) ratio spread.
Further, though SpotGamma assigns an edge to lower prices until the June FOMC and OPEX, “markets (which are already ‘fully loaded’ with puts) [are likely] pressured by liquidity providers’ hedging [at most] down to $3,700.00,” the area where that added pressure from hedging cools.
Graphic: Via SpotGamma.
Technical: As of 6:15 AM ET, Wednesday’s regular session (9:30 AM – 4:00 PM ET), in the S&P 500, will likely open in the lower part of a balanced overnight inventory, just inside of prior-range and -value, suggesting a limited potential for immediate directional opportunity.
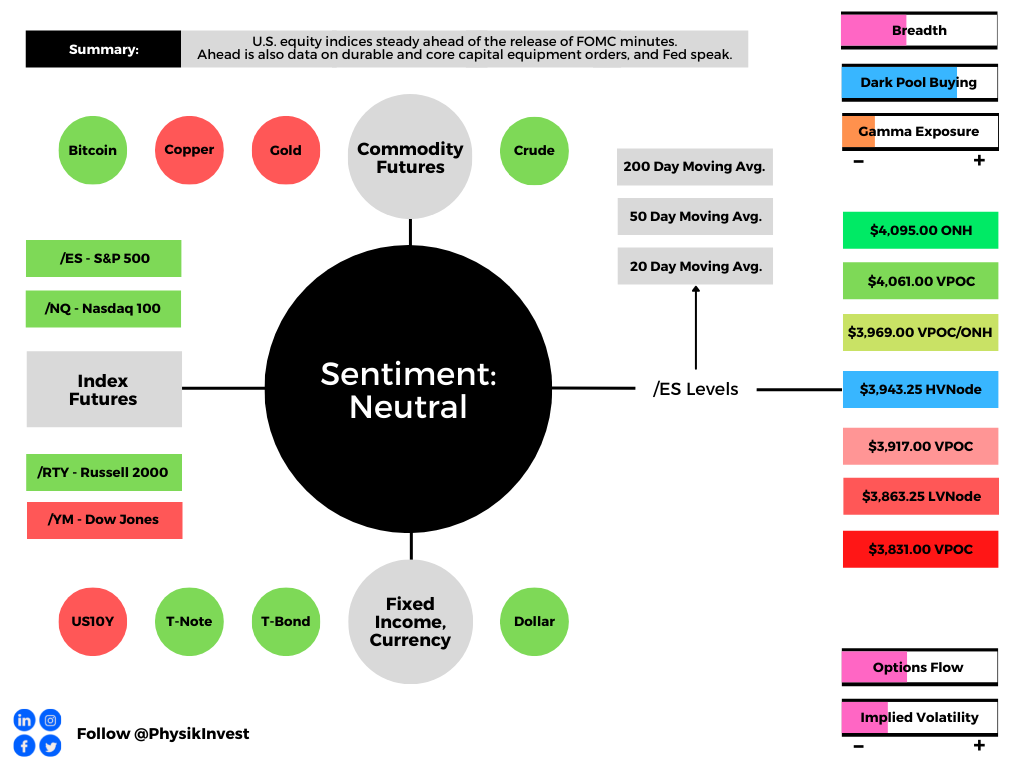
In the best case, the S&P 500 trades higher; activity above the $3,943.25 HVNode puts in play the $3,969.00 ONH. Initiative trade beyond the ONH could reach as high as the $4,061.00 VPOC and $4,095.00 ONH, or higher.
In the worst case, the S&P 500 trades lower; activity below the $3,943.25 HVNode puts in play the $3,917.00 VPOC. Initiative trade beyond the VPOC could reach as low as the $3,863.25 LVNode and $3,831.00 VPOC, or lower.
Click here to load today’s key levels into the web-based TradingView charting platform. Note that all levels are derived using the 65-minute timeframe. New links are produced, daily.
Graphic: 65-minute profile chart of the Micro E-mini S&P 500 Futures.
Considerations: Push-and-pull, as well as responsiveness near key-technical areas (discernable visually on a chart), suggests technically-driven traders with shorter time horizons are very active.
Such traders often lack the wherewithal to defend retests.
Large participants (who often move by committee) seldom respond to key technical inflections. It is their activity that often results in poor reliability of our technical levels.
Sometimes, the better trade is to wait for the larger participants’ entry and use the expansion of the range as a confirmation of a new trend.
Catalysts to consider include the release of Federal Open Market Committee (FOMC) minutes, Wednesday.
Definitions
Overnight Highs And Lows (ONH and ONL): Typically, there is a low historical probability associated with overnight rally-highs (lows) ending the upside (downside) discovery process.
Volume Areas: A structurally sound market will build on areas of high volume (HVNodes). Should the market trend for long periods of time, it will lack sound structure, identified as low volume areas (LVNodes). LVNodes denote directional conviction and ought to offer support on any test.
If participants were to auction and find acceptance into areas of prior low volume (LVNodes), then future discovery ought to be volatile and quick as participants look to HVNodes for favorable entry or exit.
POCs: POCs are valuable as they denote areas where two-sided trade was most prevalent in a prior day session. Participants will respond to future value tests as they offer favorable entry and exit.
About
After years of self-education, strategy development, mentorship, and trial-and-error, Renato Leonard Capelj began trading full-time and founded Physik Invest to detail his methods, research, and performance in the markets.
Capelj also develops insights around impactful options market dynamics at SpotGamma and is a Benzinga reporter.
In no way should the materials herein be construed as advice. Derivatives carry a substantial risk of loss. All content is for informational purposes only.
The Daily Brief is a free glimpse into the prevailing fundamental and technical drivers of U.S. equity market products. Join the 200+ that read this report daily, below!
Tuesday’s selling came alongside Russia cutting gas to Poland and Bulgaria, Vice President Kamala Harris testing positive for COVID-19, and heavy selling in growth and tech stocks, amid doubts corporate profits can withstand the Federal Reserve’s bid to tame inflation.
As Jerome Schneider of Pacific Investment Management Co says, QT will “have a profound effect on the cost of liquidity and more importantly the cost of transacting business and reallocating assets from one avenue to another avenue.”
“There might not necessarily be a rapid deceleration or decline in the stock market or other risk assets, but there’s going to be a changing cost of capital that this balance sheet is going to be part of.”
After the close, weakness continued. Alphabet Inc (NASDAQ: GOOGL) (NASDAQ: GOOG) missed on slowing sales growth and digital-ad spending. One of the biggest losers was Tesla Inc (NASDAQ: TSLA) which shed 12% or so on news that Elon Musk would use his fortune, much of which is tied up in Tesla, to buy Twitter Inc (NYSE: TWTR).
Germany’s passage of a bigger borrowing budget, coupled with China’s pledge to boost infrastructure bolstered an overnight advance that fed into price action at home. The S&P 500, in particular, for a brief moment, took back a key level, negating much of yesterday’s liquidation.
Ahead is data on international trade in goods (8:30 AM ET), as well as pending home sales and the rental vacancy rate (10:00 AM ET).
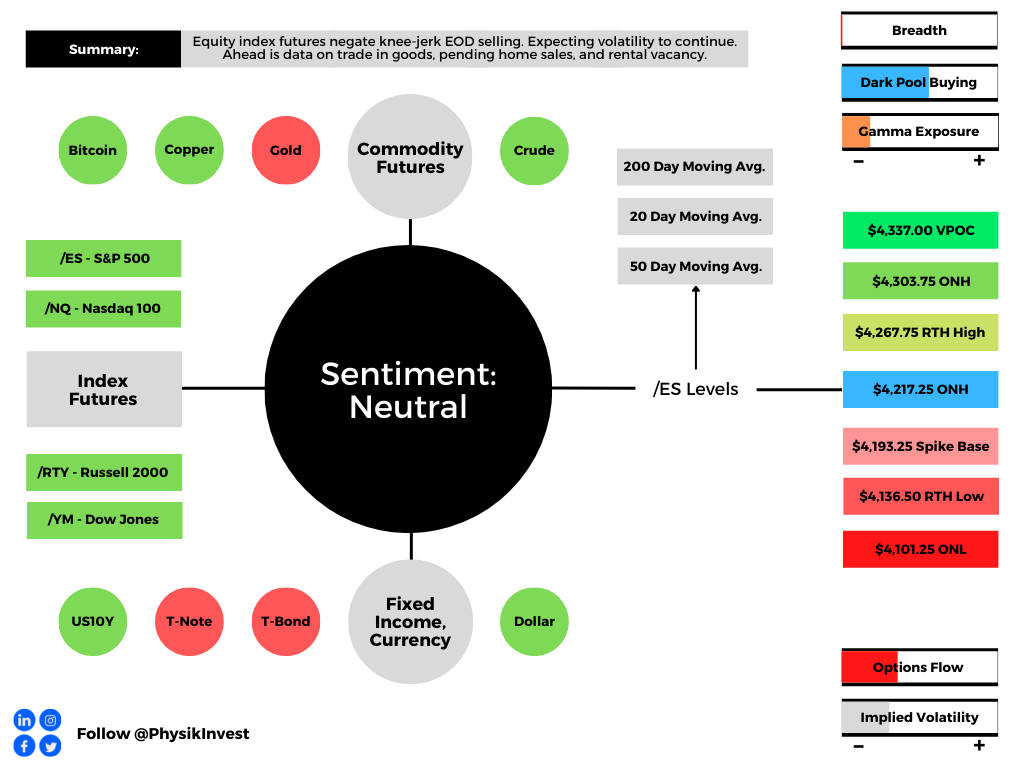
Graphic updated 7:00 AM ET. Sentiment Neutral if expected /ES open is inside of the prior day’s range. /ES levels are derived from the profile graphic at the bottom of the following section. Levels may have changed since initially quoted; click here for the latest levels. SqueezeMetrics Dark Pool Index (DIX) and Gamma (GEX) calculations are based on where the prior day’s reading falls with respect to the MAX and MIN of all occurrences available. A higher DIX is bullish. At the same time, the lower the GEX, the more (expected) volatility. Learn the implications of volatility, direction, and moneyness. SHIFT data used for S&P 500 (INDEX: SPX) options activity. Note that options flow is sorted by the call premium spent; if more positive, then more was spent on call options. Breadth reflects a reading of the prior day’s NYSE Advance/Decline indicator. VIX reflects a current reading of the CBOE Volatility Index (INDEX: VIX) from 0-100.
What To Expect
Positioning: Markets are positioned for continued volatility.
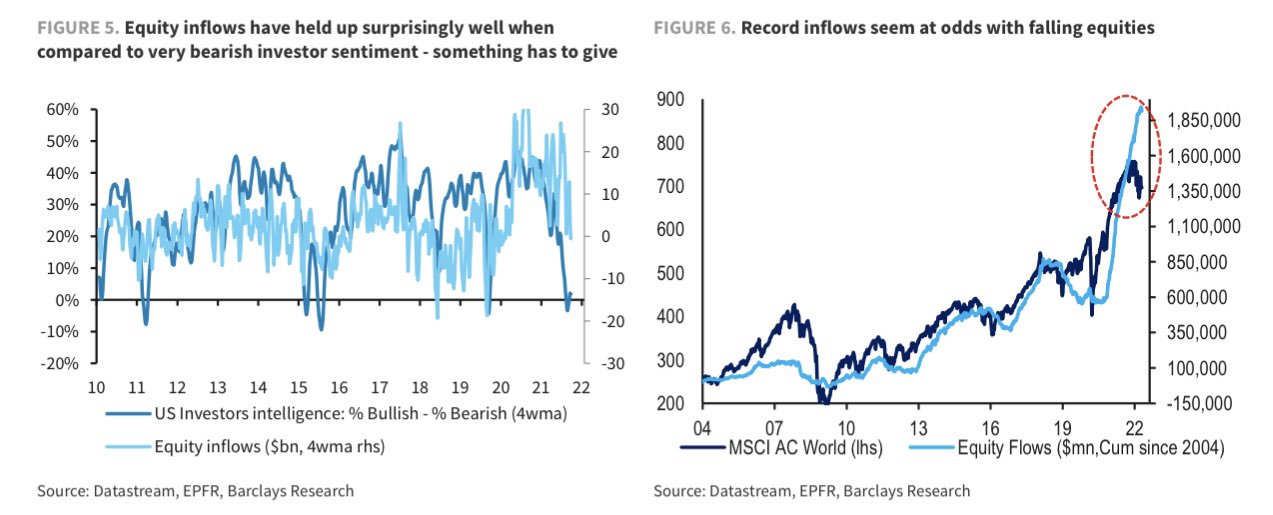
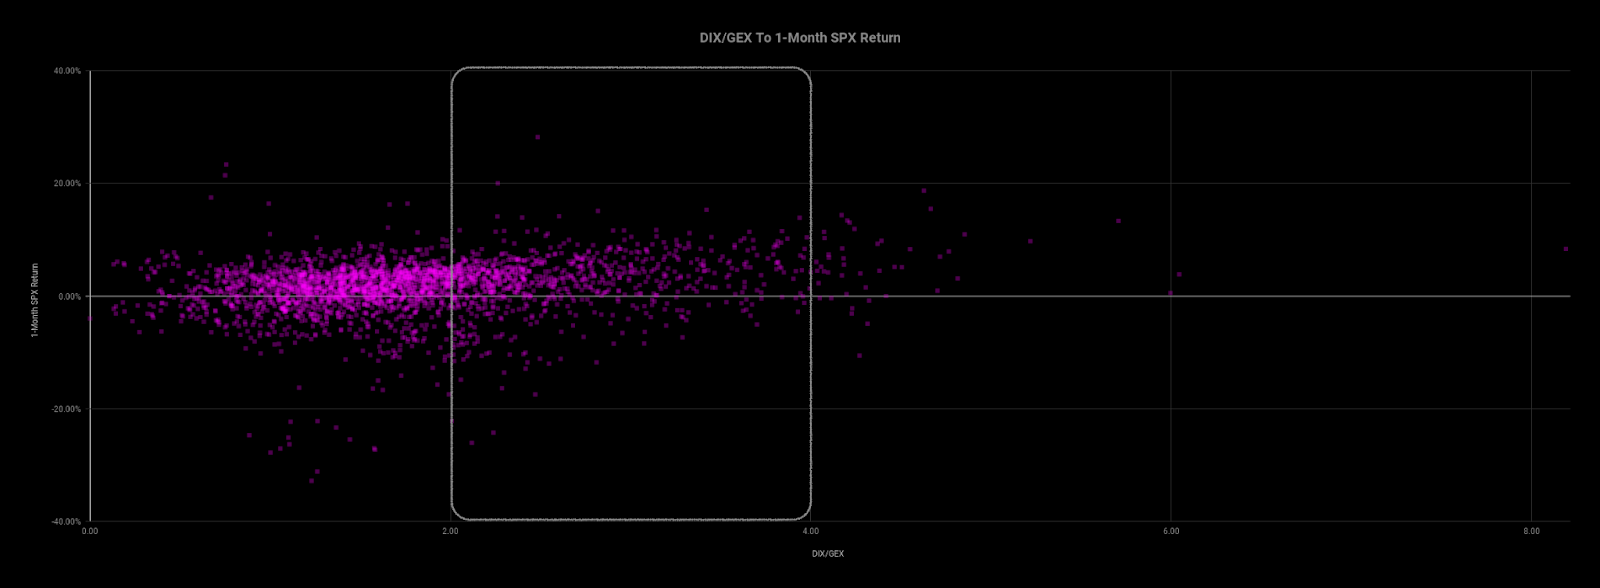
Based on a reading of market gamma exposure (GEX) and buying support (DIX), the returns distribution is skewed positive. There’s buying in the context of an environment in which the hedging of options positioning implies selling into weakness and buying of strength.
Graphic: Via Barclays PLC (NYSE: BCS) research.
In the most simple way that I can explain: when positioning is stretched one way, that often tends to mark a turning point – the returns distribution is either skewed positive or negative.
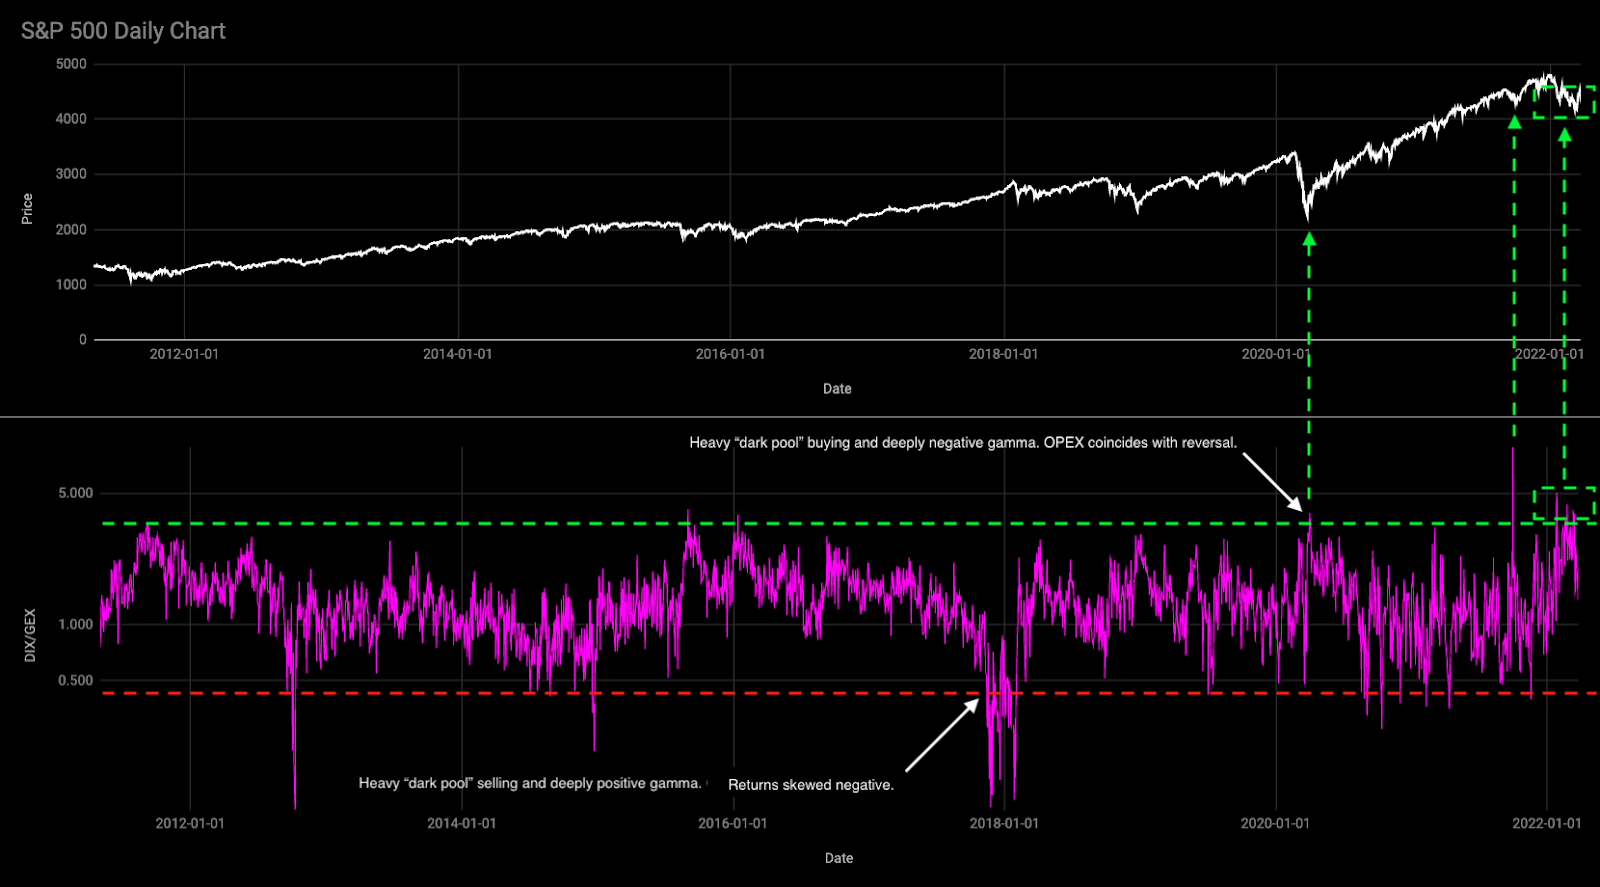
Graphic: Via Physik Invest. Data via SqueezeMetrics. Updated March of 2022. A high DIX/GEX ratio often portends positive 1-month returns.
An updated read, after Tuesday’s weak close, tells us that we can (1) definitely expect larger ranges to continue and (2) potential for short-term bounces.
Based on overnight activity, one of those is happening, now.
Graphic: Via Physik Invest. Data via SqueezeMetrics.
This is as participants are both well-hedged and using weakness as an opportunity to buy into a less highly valued market.
Well-hedged means that customers (i.e., you and I) own protection against long equity exposure. So, that could mean customers own puts and/or are short calls. One of the most dominant flows is the long put, short call.
Such trade offers customers positive, yet asymmetric (gamma), exposure to direction (delta). In other words, negative delta and positive gamma.
The counterparty has exposure to positive delta and negative gamma. If the underlyings trade lower and volatility rises, all else equal, the position will lose. To hedge against these losses, the counterparties will sell underlying into weakness.
If prices reverse and move higher, these counterparties will re-hedge and buy underlying.
Normally, as seen over the bull run of 2020 and 2021, markets are in an uptrend and there’s a strong supply of volatility. Often, customers sell more calls than puts and, in an uptrend, those calls solicit more active hedging than the put options.
Recall that the customer is short the call. That means the counterparty is long the call (a positive delta and gamma trade) and will make money if prices rise, all else equal.
The hedging of this particular exposure (i.e., sell strength, buy weakness), in an uptrend, occurs slower (i.e., counterparts will allow their profits to run), and that’s what can help the market sustain lower volatility trends for longer periods.
When prices reverse and underlyings trade lower, put options solicit increased hedging activity. Given the nature of counterparty exposure to those puts, that hedging happens quickly and can take from market liquidity as to volatility (i.e., buy strength, sell weakness).
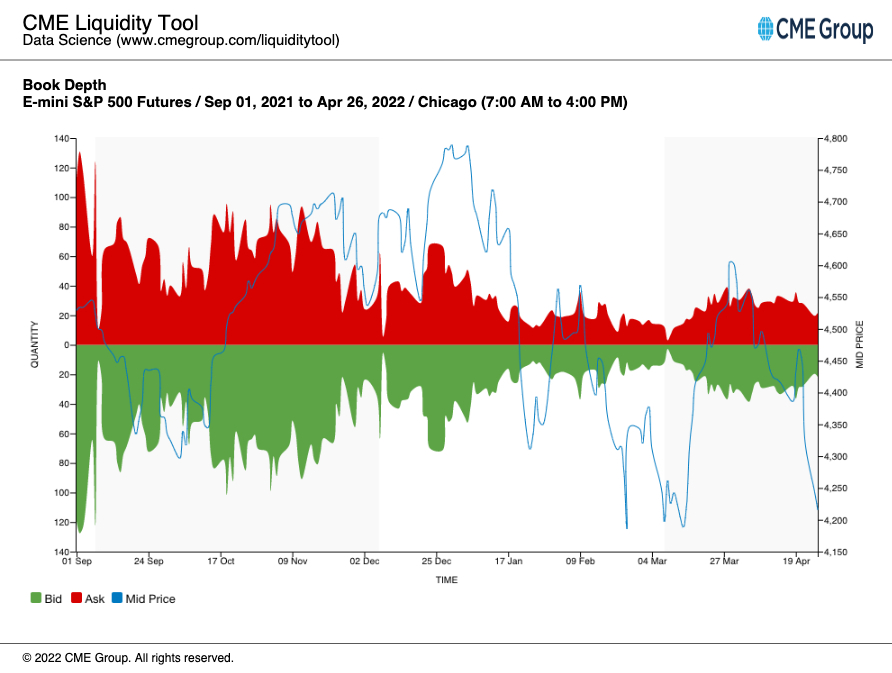
See, below, E-mini S&P 500 book depth, a proxy for market liquidity, and how much it has declined since the end of last year when markets became more volatile and noise around the Federal Reserve’s intent to taper bond-buying and raise rates grew louder.
Graphic: Via CME Group Inc (NASDAQ: CME) Liquidity Tool. Note how in late March, book depth rose as markets rose and customer call activity solicited increased hedging of counterparty long-gamma exposure (i.e., buy weakness, sell strength), adding to market liquidity.
In the above environment, counterparty hedging matters; the market is more sensitive to the flow, so to speak. That sensitivity is expected to continue.
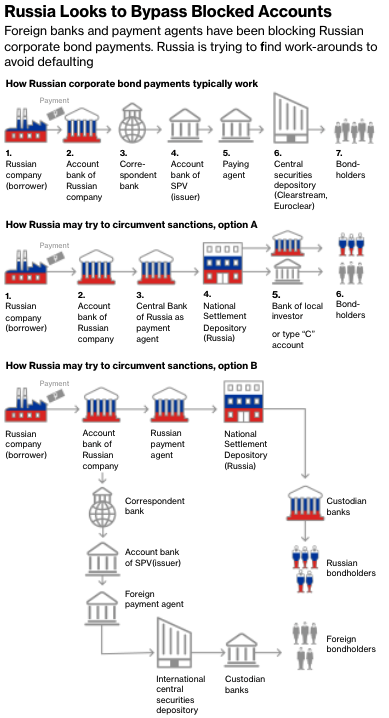
SpotGamma, an options data and analysis service, sees the early May period as pivotal. Then is the Federal Open Market Committee (FOMC) meeting and the potential Russian default, per Moody’s Corporation (NYSE: MCO).
As quoted: “Russia ‘may be considered in default’ if it does not pay two bonds in US dollars by end of a grace period on May 4.”
Until those events are resolved, participants will likely continue to (remain) hedge(d). Upon resolve, customers likely monetize their protection to offset losses on underlying equity exposure.
That means selling volatility which reduces counterparty exposure to short puts (negative gamma and positive delta). To re-hedge, underlying is bought back and that may support a price rise.
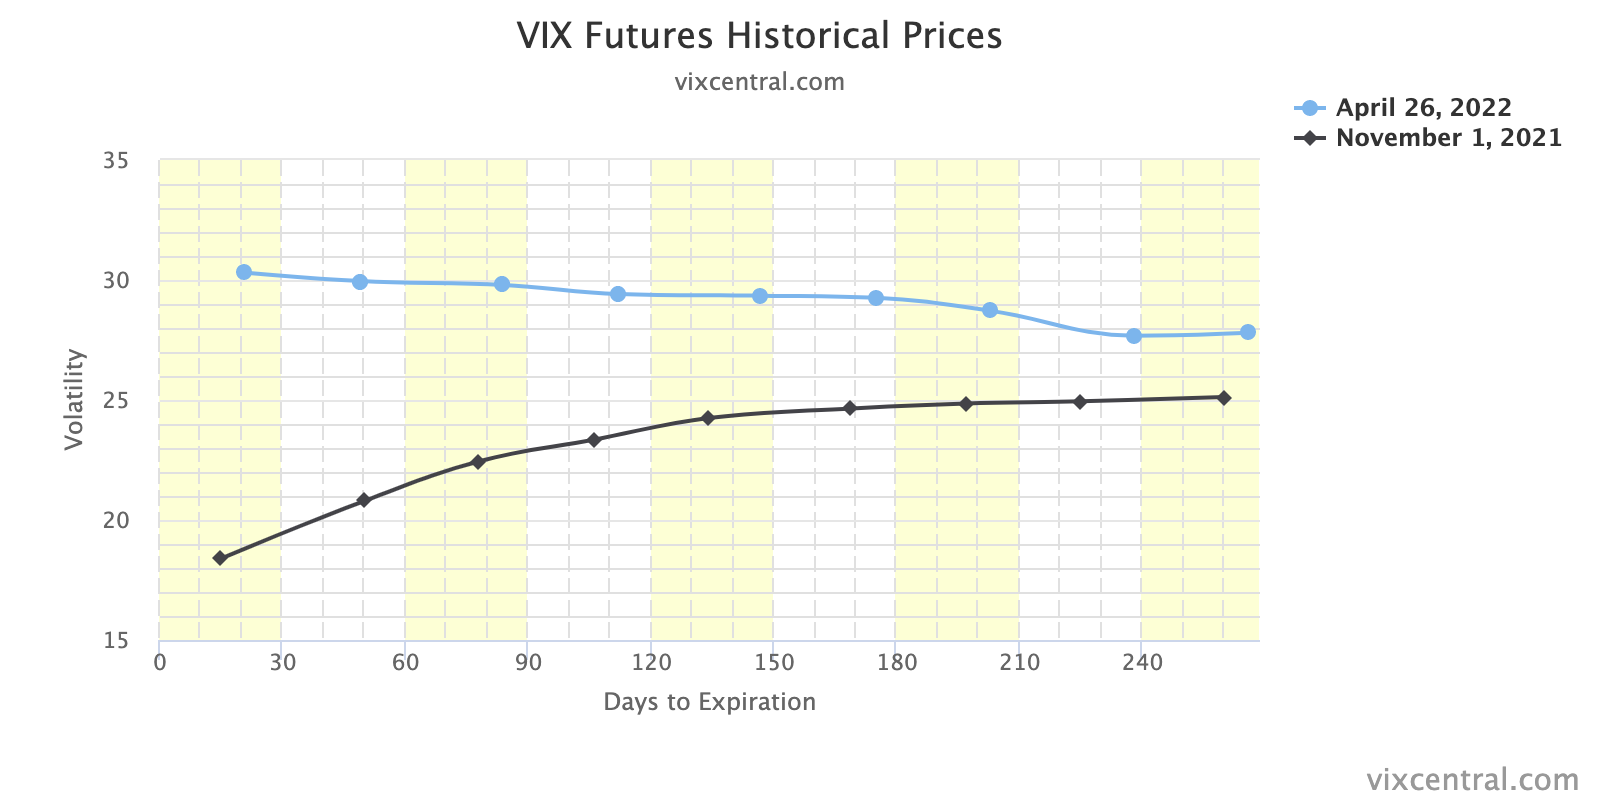
Graphic: VIX term structure via VIX Central. Expansion (higher) solicits counterparty selling which pressures the market lower. Compression (lower) solicits counterparty buying which bolsters attempts higher.
Whether that price rise has legs depends on what the fundamental situation is, then. See the below section titled Considerations for a full technical picture and the most likely turning points.
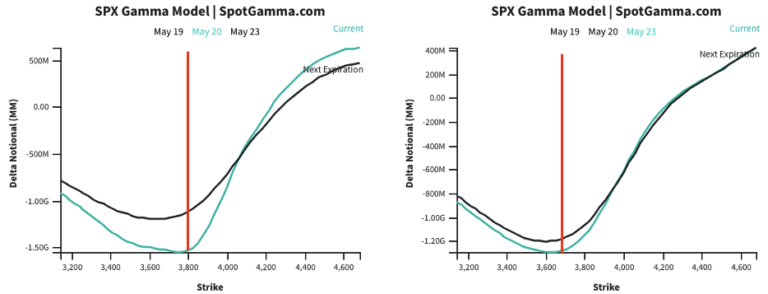
Technical: As of 7:00 AM ET, Wednesday’s regular session (9:30 AM – 4:00 PM ET), in the S&P 500, will likely open in the middle part of a balanced overnight inventory, inside of prior-range and -value, suggesting a limited potential for immediate directional opportunity.
In the best case, the S&P 500 trades higher; activity above the $4,217.25 overnight high (ONH) puts in play the $4,267.75 regular trade high (RTH High). Initiative trade beyond the RTH High could reach as high as the $4,303.75 ONH and $4,337.00 VPOC, or higher.
In the worst case, the S&P 500 trades lower; activity below the $4,217.25 ONH puts in play the $4,193.25 spike base. Initiative trade beyond the spike base could reach as low as the $4,136.50 regular trade low (RTH Low) and $4,101.25 overnight low (ONL), or lower.
Considerations: Spikes mark the beginning of a break from value. Spikes higher (lower) are validated by trade at or above (below) the spike base (i.e., the origin of the spike).
Additionally, the indexes continue to trade below their 20-, 50-, and 200-day simple moving averages, confirming the trend change and bearish tone (further validated by poor breadth).
Graphic: Market Internals as pioneered by (a mentor of mine) Peter Reznicek. Notice the indicator in the top right, weighted S&P sectors (histogram) versus unweighted (blue line). During late last week, participants sold the entire market, heavily (as supported by the difference between the volume flowing into stocks that are up versus those that are down).
All indexes remain, as stated, yesterday, below their volume-weighted average prices (VWAPs) anchored from the start of this year (or their respective peaks).
VWAPs are a metric highly regarded by chief investment officers (CIOs), among other participants, for quality of trade. Liquidity algorithms, too, are benchmarked and programmed to buy and sell around VWAPs.
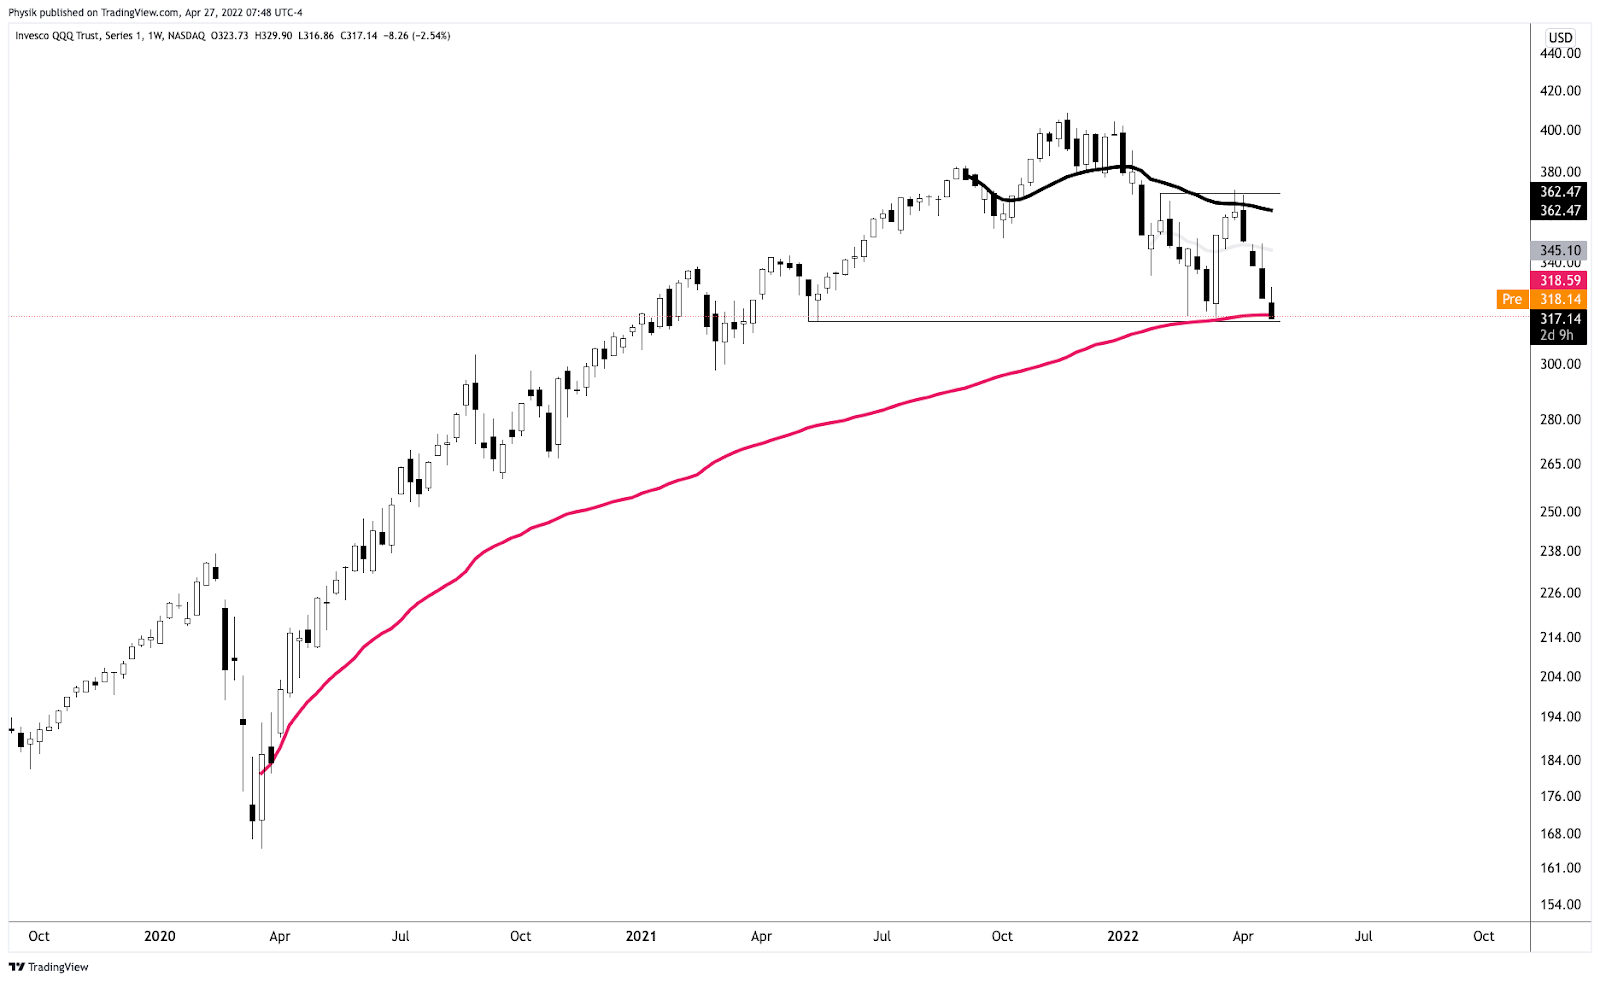
The Invesco QQQ Trust Series 1 (NASDAQ: QQQ) just tested a major VWAP, yesterday, anchored from the lows of March 2020. That’s a fair price to pay for Nasdaq 100 exposure.
Graphic: Invesco QQQ Trust Series 1 (NASDAQ: QQQ) with anchored VWAPs.
Notwithstanding, notice the flat-to-declining AVWAP that’s black in color. So long as prices remain below this level, the index is likely a sell.
Should that level flatten (and begin to rise), and if the QQQ was able to trade above it for a sustained period, there is potential for sustained upside.
Click here to load today’s key levels into the web-based TradingView charting platform. Note that all levels are derived using the 65-minute timeframe. New links are produced, daily.
Graphic: 65-minute profile chart of the Micro E-mini S&P 500 Futures.
Definitions
Overnight Rally Highs (Lows): Typically, there is a low historical probability associated with overnight rally-highs (lows) ending the upside (downside) discovery process.
Volume Areas: A structurally sound market will build on areas of high volume (HVNodes). Should the market trend for long periods of time, it will lack sound structure, identified as low volume areas (LVNodes). LVNodes denote directional conviction and ought to offer support on any test.
If participants were to auction and find acceptance into areas of prior low volume (LVNodes), then future discovery ought to be volatile and quick as participants look to HVNodes for favorable entry or exit.
POCs: POCs are valuable as they denote areas where two-sided trade was most prevalent in a prior day session. Participants will respond to future tests of value as they offer favorable entry and exit.
About
After years of self-education, strategy development, mentorship, and trial-and-error, Renato Leonard Capelj began trading full-time and founded Physik Invest to detail his methods, research, and performance in the markets.
Capelj also develops insights around impactful options market dynamics at SpotGamma and is a Benzinga reporter.
In no way should the materials herein be construed as advice. Derivatives carry a substantial risk of loss. All content is for informational purposes only.
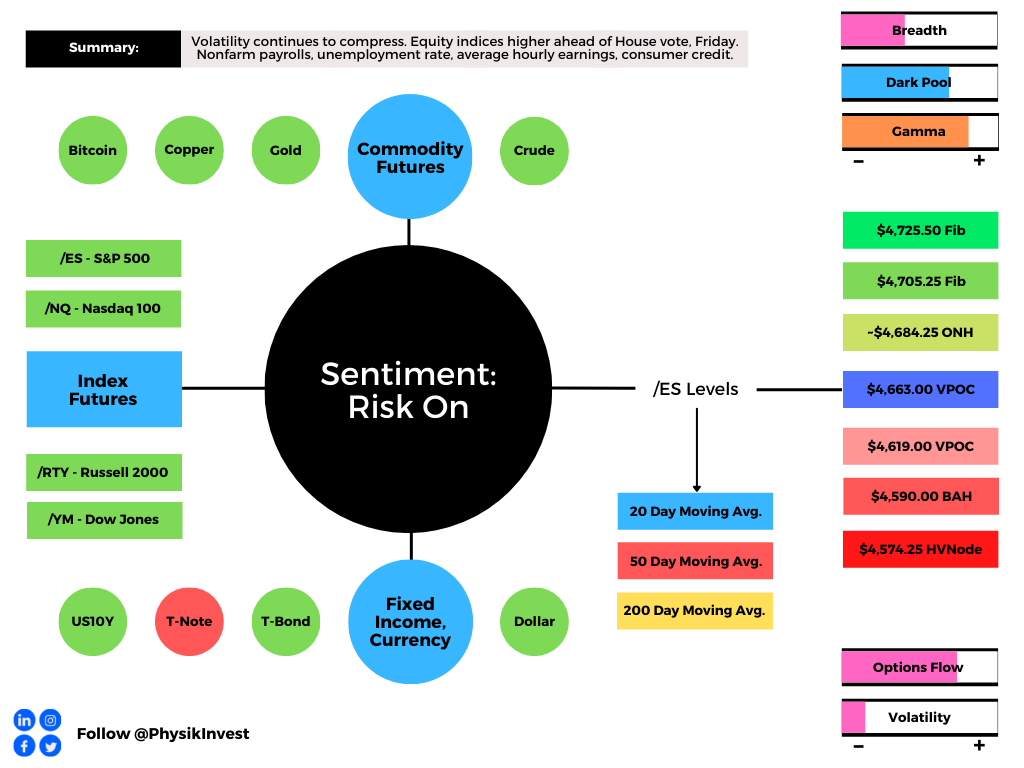
Equity index futures higher. Commodities were higher. Bonds mixed. Volatility compressed.
Ahead is a heavier day of economic releases, in the face of fundamental narratives and positioning metrics that may support intraday price stability.
What Happened
Overnight, equity index futures were marked up ahead of the House’s plan to vote on President Joe Biden’s economic package and infrastructure, as well as October jobs data.
Also, in the news, there were narratives surrounding China’s dollar surplus, a pandemic resurgence in Europe, Pfizer Inc’s (NYSE: PFE) development of a pill for COVID-19.
Ahead is data on payrolls, unemployment, and average hourly earnings (8:30 AM ET), as well as consumer credit (3:00 PM ET). I apologize as this is what I listed yesterday, mistakenly.
Graphic updated 6:30 AM ET. Sentiment Risk-On if expected /ES open is above the prior day’s range. /ES levels are derived from the profile graphic at the bottom of the following section. Levels may have changed since initially quoted; click here for the latest levels. SqueezeMetrics Dark Pool Index (DIX) and Gamma (GEX) calculations are based on where the prior day’s reading falls with respect to the MAX and MIN of all occurrences available. A higher DIX is bullish. At the same time, the lower the GEX, the more (expected) volatility. Learn the implications of volatility, direction, and moneyness. SHIFT data used for S&P 500 (INDEX: SPX) options activity. Note that options flow is sorted by the call premium spent; if more positive then more was spent on call options. Breadth reflects a reading of the prior day’s NYSE Advance/Decline indicator. VIX reflects a current reading of the CBOE Volatility Index (INDEX: VIX) from 0-100.
What To Expect
On weak intraday breadth and lacklustermarket liquidity metrics, the best case outcome occurred, evidenced by balanced trade at newly discovered S&P 500 prices.
As also evidenced by the separation of value, overnight, the gap out of yesterday’s range marks a potential willingness to continue the uptrend.
To note, poor structure left behind prior initiative trade adds to technical instability, a dynamic mentioned in prior commentaries. Participants will likely look to check old value (i.e., revisit, repair, and strengthen) pockets of low-volume, feverishly, on any breakdown of trend.
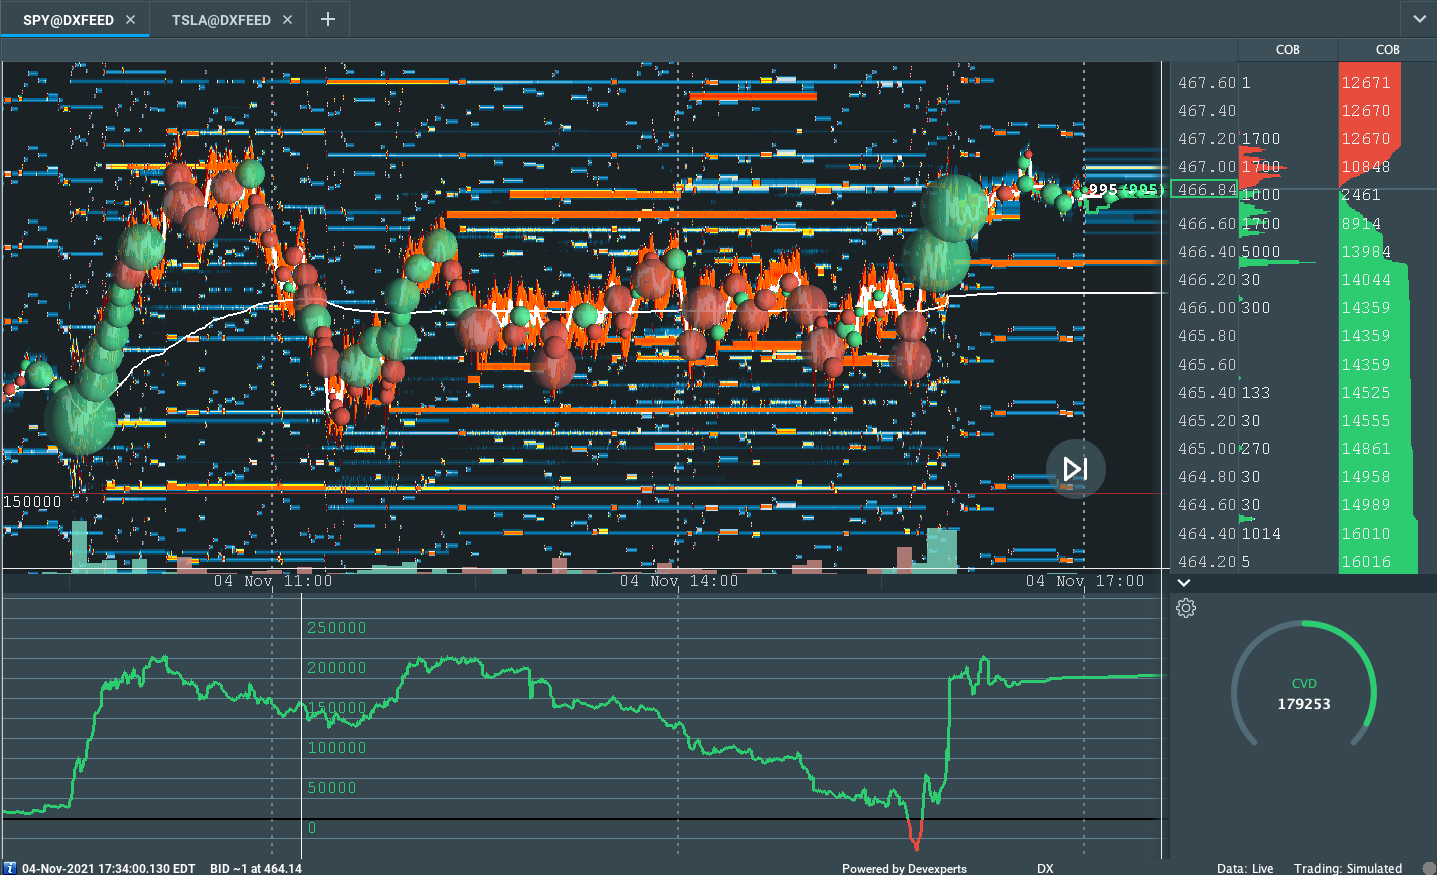
Graphic: Flat delta (i.e., non-committed buying/selling as measured by volume delta or buying and selling power as calculated by the difference in volume traded at the bid and offer) in SPDR S&P 500 ETF Trust (NYSE: SPY), via Bookmap. The readings are supportive of responsive trade (i.e., rotational trade that suggests current prices offered favorable entry and exit).
Context: The aforementioned trade is happening in the context of a slowdown in economic growth, increased clarity on the Federal Reserve’s (Fed) intent to moderate stimulus, as well as the prospects of renewed fiscal support.
The implications of these narratives on price are contradictory.
To elaborate, supply chain disruptions slowed the pace of economic growth, while participants saw both the Fed’s decision to taper and keep rates unchanged, as well as the potential passage of President Biden’s economic plan, today, as near-term positives.
In terms of positioning, the CBOE Volatility Index (INDEX: VIX) was lower, while supply came in across the VIX futures term structure. That, alongside the long-gamma environment and increased demand for options above current prices (i.e., bets on the upside), points to increased odds of near-term equity market stability.
To quote options analysis and data provider SpotGamma, “the term structure of IV (this is how high the IV is for longer-dated options) remains elevated. That suggests near term options could have more ‘bleed’ which could keep the SPX market price tailwind intact.”
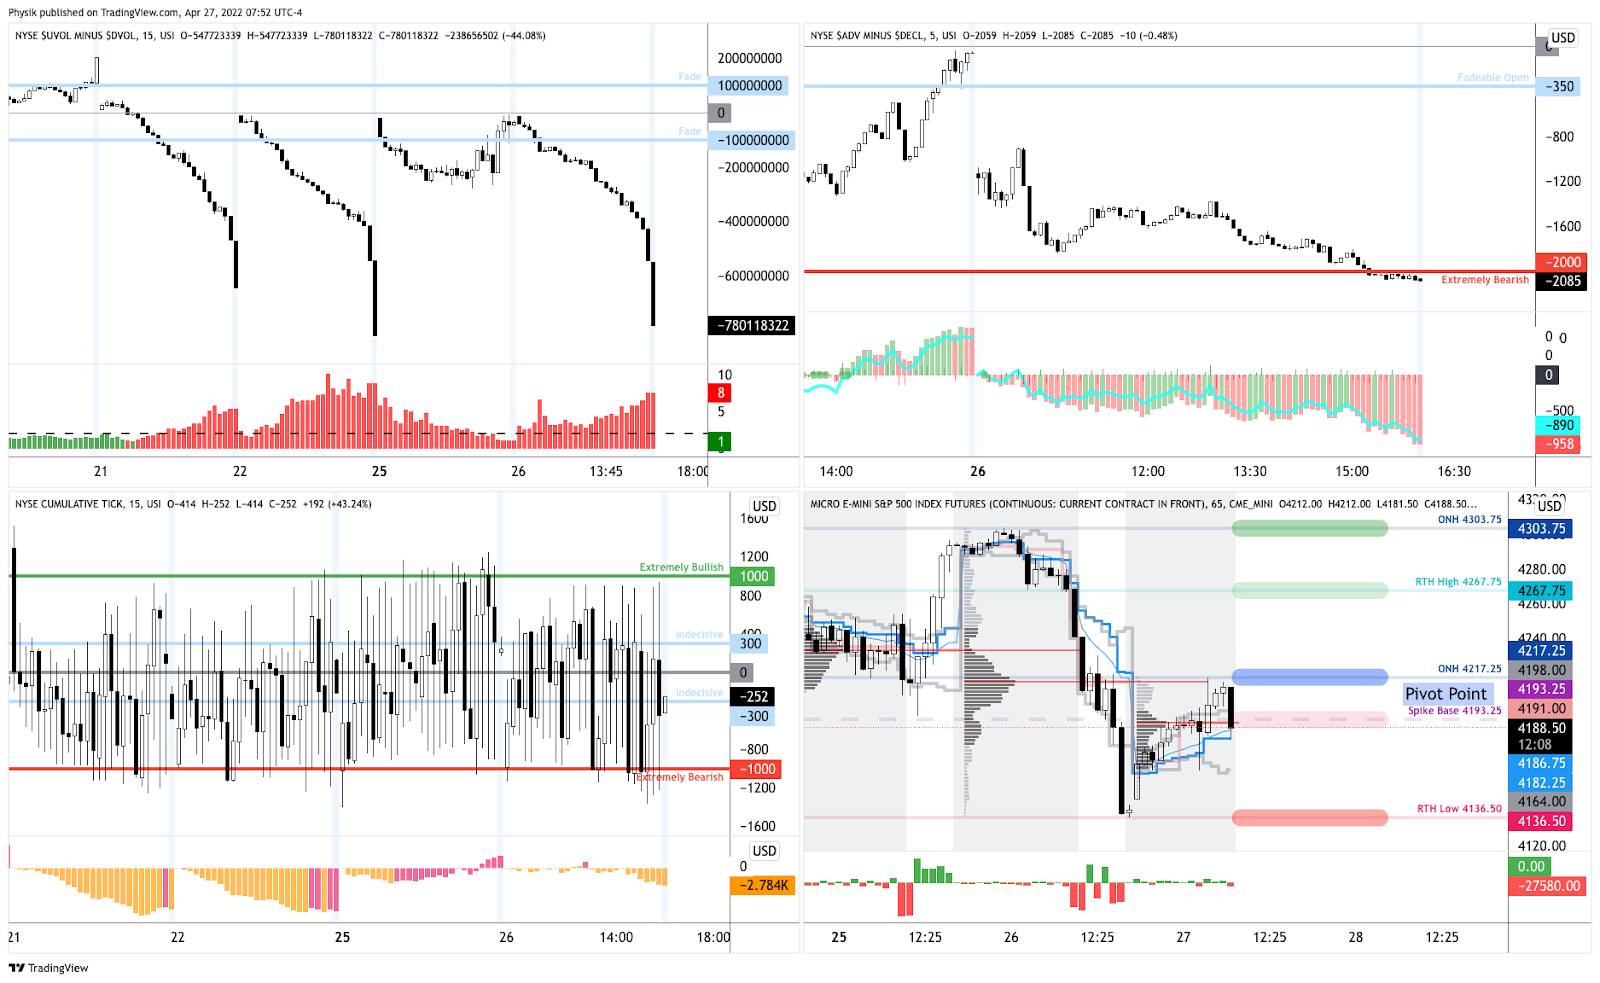
Expectations: As of 6:30 AM ET, Friday’s regular session (9:30 AM – 4:00 PM ET), in the S&P 500, will likely open in the upper part of a positively skewed overnight inventory, outside of prior-range and -value, suggesting a potential for immediate directional opportunity.
Gap Scenarios: Gaps ought to fill quickly. Should they not, that’s a signal of strength; do not fade. Leaving value behind on a gap-fill or failing to fill a gap (i.e., remaining outside of the prior session’s range) is a go-with indicator.

Auctioning and spending at least 1-hour of trade back in the prior range suggests a lack of conviction; in such a case, do not follow the direction of the most recent initiative activity.
In the best case, the S&P 500 trades sideways or higher; activity above the $4,663.00 untested point of control (VPOC) puts in play the $4,684.25 overnight high (ONH). Initiative trade beyond the ONH could reach as high as the $4,705.25 and $4,725.50 Fibonacci, or higher.
In the worst case, the S&P 500 trades lower; activity below the $4,663.00 VPOC puts in play the $4,619.00 VPOC. Initiative trade beyond the VPOC could reach as low as the $4,590.00 balance boundary and $4,574.25 high volume area (HVNode), or lower.
Click here to load today’s updated key levels into the web-based TradingView charting platform. Note that all levels are derived using the 65-minute timeframe. New links are produced, daily.
Graphic: 65-minute profile chart of the Micro E-mini S&P 500 Futures. Learn about the profile.
Charts To Watch
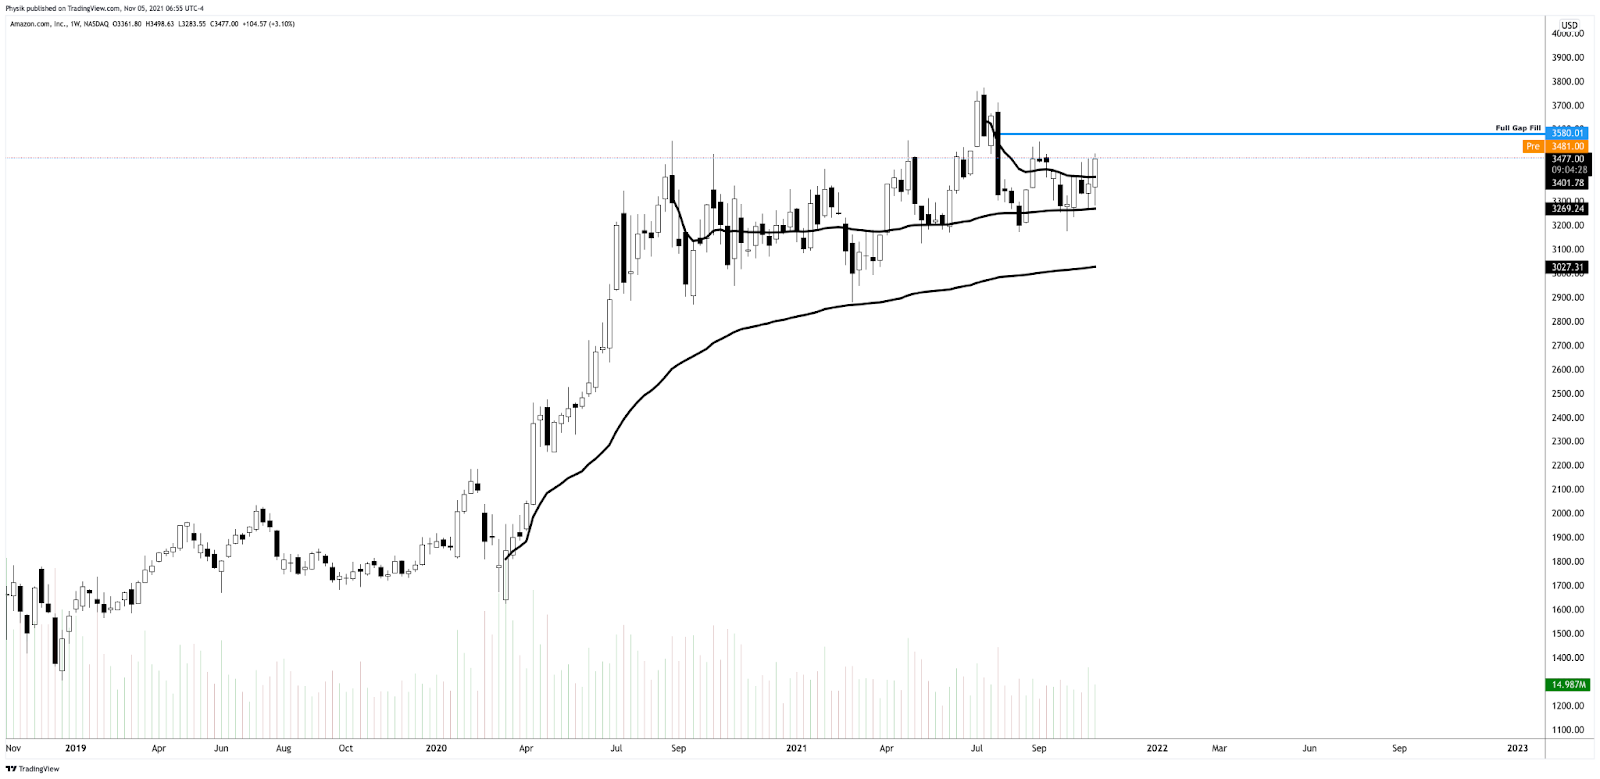
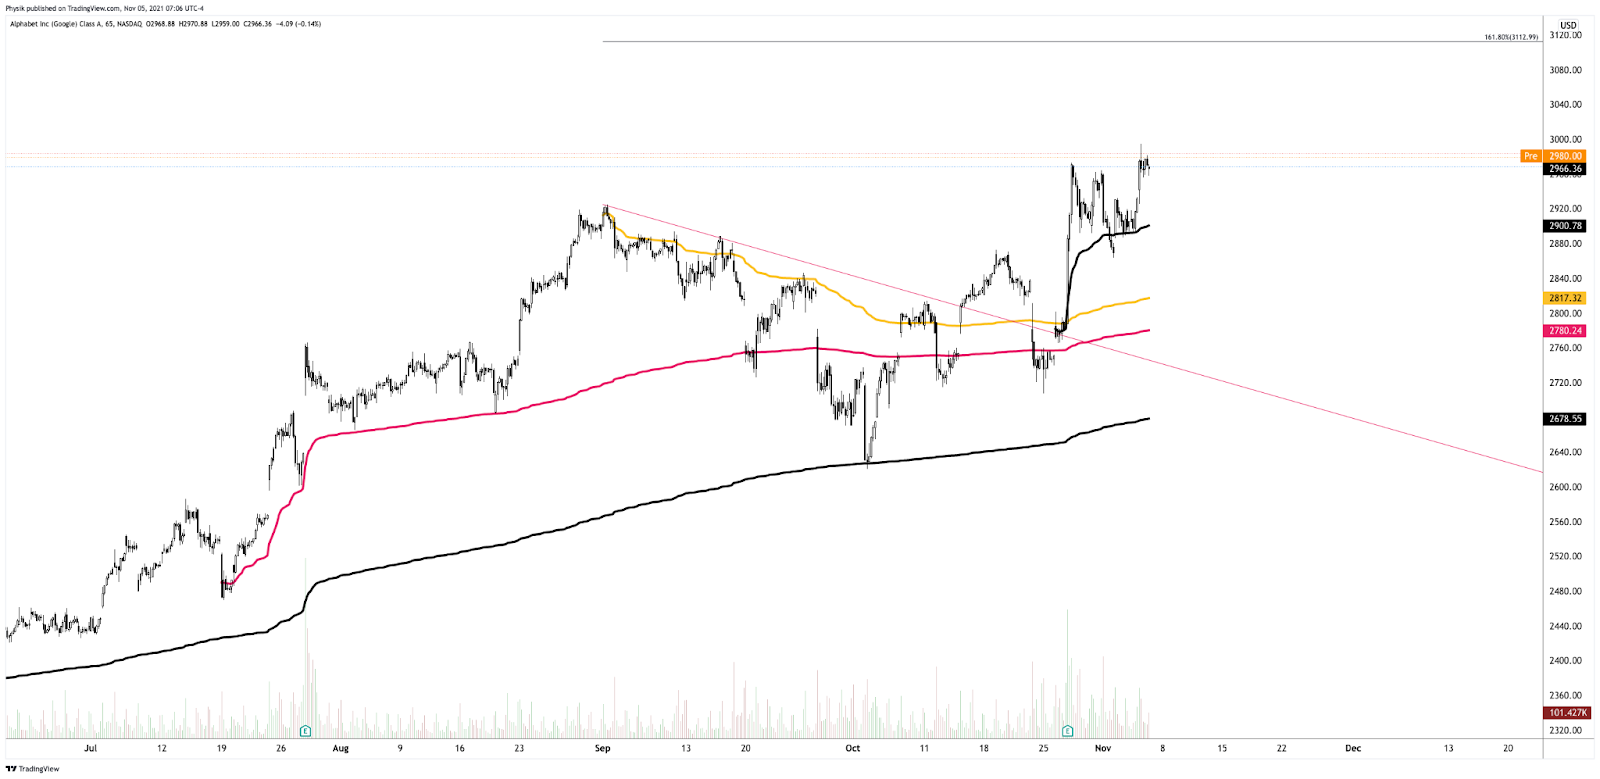
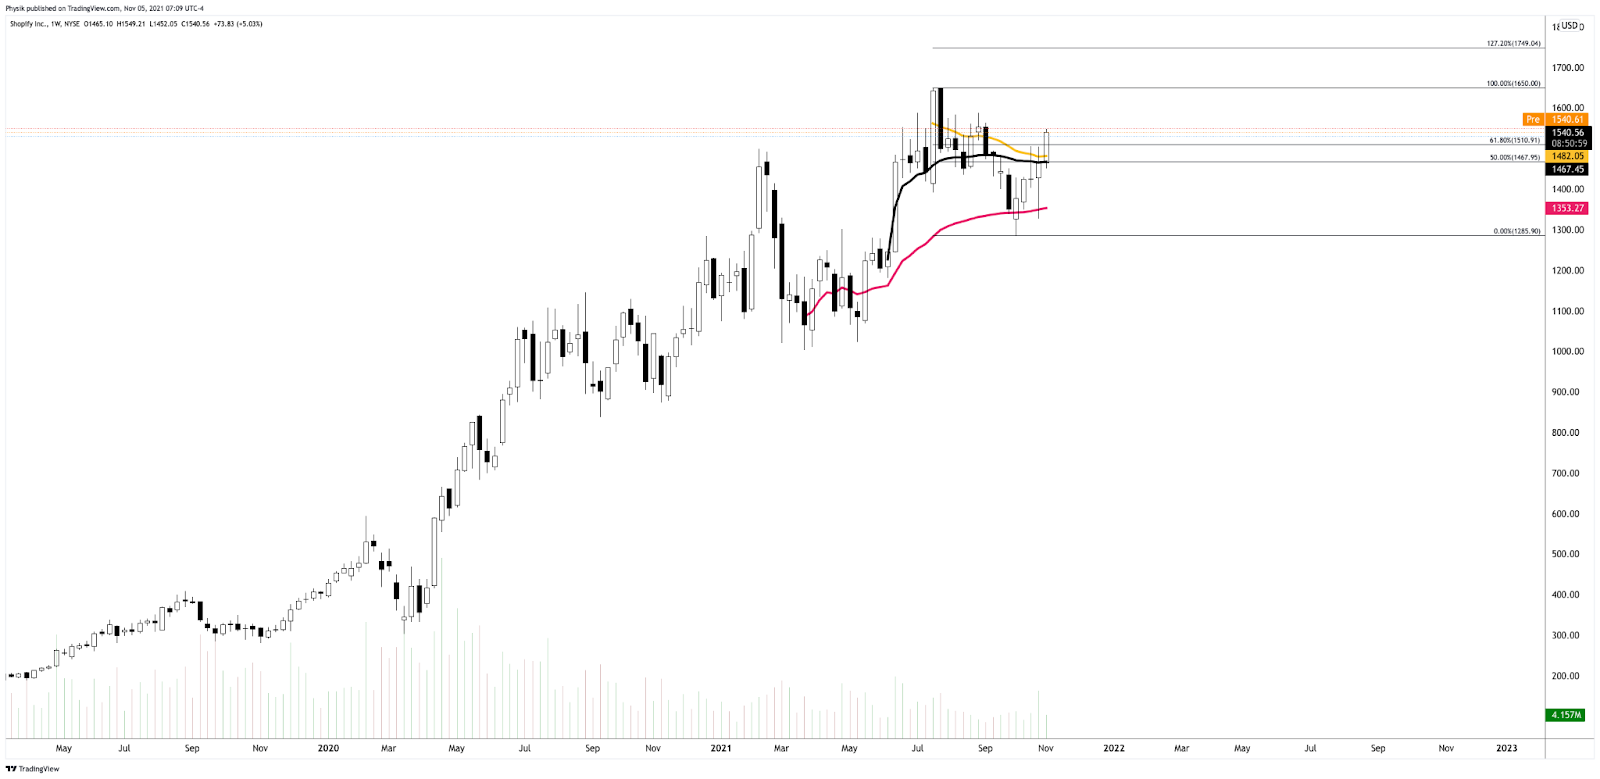
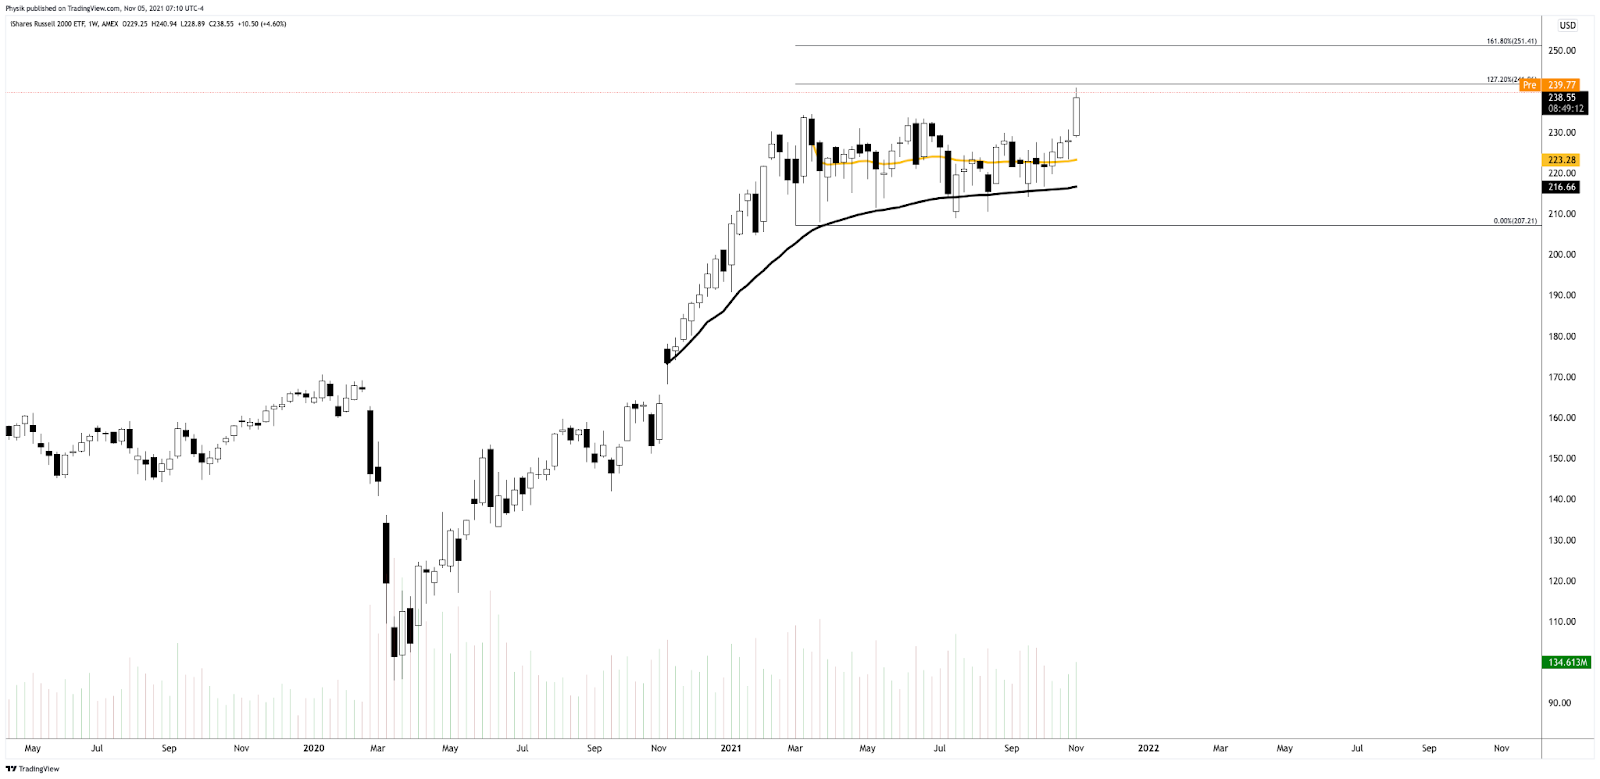
Graphic: (NASDAQ: AMZN). (S~3403, R~3580). S is for support. R is for resistance. I am seeking to initiate short-duration call structures against the 3580 gap fill and prior all-time high. Will initiate for credit or finance with put structures.Graphic: (NASDAQ: FB). (S~326.45, R~336.90). S is for support. R is for resistance. If the stock was to maintain prices above 336.90, there is a potential change in tone. In such a case, I’m targeting Fibonacci retracements with call structures financed with credits on the put side.Graphic: (NASDAQ: GOOGL). (S~2900, R~3113). S is for support. R is for resistance. I’m targeting prices between 3000 and 3100 with call structures for low cost or credit.Graphic: (NYSE: SHOP). (S~1482, R~1650). S is for support. R is for resistance. Potential break of trend, move to an all-time high.Graphic: (NYSE: IWM). (S~234.53, R~241.96, 251.41). S is for support. R is for resistance. Russell 2000 breaks out of balance. In my opinion, upon acceptance, there are potential opportunities for long trades.
Other charts I’m watching include BABA (S~155.29), ZM (S~245.92), ARKK (S~120.15), PINS (S~42.06), Z (S~58.15), BBY (S~123.65), GOOS (S~40.91), CTSH (R~82.00), LYFT (S~44.41), TMUS (S~118.00), WDC (51.47). S is for support. R is for resistance.
What People Are Saying
🔥 Goldman's Prime desk saw clients unwind risk on single names for a 3rd straight day, resulting in the largest $ de-grossing activity in 14 months – since Sept 2020.
Cave-Fill Process: Widened the area deemed favorable to transact at by an increased share of participants. This is a good development.
Overnight Rally Highs (Lows): Typically, there is a low historical probability associated with overnight rally-highs (lows) ending the upside (downside) discovery process.
Volume Areas: A structurally sound market will build on areas of high volume (HVNodes). Should the market trend for long periods of time, it will lack sound structure, identified as low volume areas (LVNodes). LVNodes denote directional conviction and ought to offer support on any test.
If participants were to auction and find acceptance into areas of prior low volume (LVNodes), then future discovery ought to be volatile and quick as participants look to HVNodes for favorable entry or exit.
Gamma: Gamma is the sensitivity of an option to changes in the underlying price. Dealers that take the other side of options trades hedge their exposure to risk by buying and selling the underlying. When dealers are short-gamma, they hedge by buying into strength and selling into weakness. When dealers are long-gamma, they hedge by selling into strength and buying into weakness. The former exacerbates volatility. The latter calms volatility.
POCs: POCs are valuable as they denote areas where two-sided trade was most prevalent in a prior day session. Participants will respond to future tests of value as they offer favorable entry and exit.
Balance (Two-Timeframe Or Bracket): Rotational trade that denotes current prices offer favorable entry and exit. Balance-areas make it easy to spot a change in the market (i.e., the transition from two-time frame trade, or balance, to one-time frame trade, or trend).
Modus operandi is responsive trade (i.e., fade the edges), rather than initiative trade (i.e., play the break).
Value-Area Placement: Perception of value unchanged if value overlapping (i.e., inside day). Perception of value has changed if value not overlapping (i.e., outside day). Delay trade in the former case.
About
After years of self-education, strategy development, and trial-and-error, Renato Leonard Capelj began trading full-time and founded Physik Invest to detail his methods, research, and performance in the markets.
Additionally, Capelj is a Benzinga finance and technology reporter interviewing the likes of Shark Tank’s Kevin O’Leary, JC2 Ventures’ John Chambers, and ARK Invest’s Catherine Wood, as well as a SpotGamma contributor, developing insights around impactful options market dynamics.
Disclaimer
At this time, Physik Invest does not manage outside capital and is not licensed. In no way should the materials herein be construed as advice. Derivatives carry a substantial risk of loss. All content is for informational purposes only.
Editor’s Note: Keeping it light today; the main takeaway is that we’re in a window of volatility and participants should maintain a cautiously bullish stance, for the time being. Skew makes it so we can hedge for little-to-no cost using complex spreads (more on this below).
Please note that levels in the below graphics should only be relied upon as rough areas of resistance and support due to the December contract roll. Updated levels to come later this week, after daily commentaries resume Thursday, September 16.
Equity index futures trade lower, last week, resolving a multi-week consolidation area.
Narratives around slower recovery rising.
Equity indices falling; SPX above 50-day.
Positioning risks mount case for volatility.
A couple trade ideas for the week ahead.
What Happened: U.S. stock index futures resolved lower, last week, alongside the evolution of some important dynamics with respect to the pace of the pandemic recovery and trend growth, non-seasonally aligned flows and positioning risks, as well as divergent sentiment.
Of interest this week is data on the consumer price index, industrial production, retail sales, and some Fed manufacturing surveys.
Graphic updated 12:00 PM ET Saturday. Sentiment Neutral if expected /ES open is inside of the prior day’s range. SqueezeMetrics Dark Pool Index (DIX) and Gamma (GEX) calculations are based on where the prior day’s reading falls with respect to the MAX and MIN of all occurrences available. A higher DIX is bullish. At the same time, the lower the GEX, the more (expected) volatility. SHIFT data used for S&P 500 (INDEX: SPX) options activity approximation. Note that options flow is sorted by the call premium spent; if more positive then more was spent on call options. Breadth reflects a reading of the prior day’s NYSE Advance/Decline indicator. VIX reflects a current reading of the CBOE Volatility Index (INDEX: VIX) from 0-100.
What To Expect: During the prior week’s regular trade, on weak intraday breadth and mostly divergent market liquidity metrics, the worst-case outcome occurred, evidenced by trade below a key micro-composite high volume area (HVNode).
This activity resolved a multi-week consolidation area (ie., balance).
Volume Areas: A structurally sound market will build on past areas of high volume. Should the market trend for long periods of time, it will lack sound structure (identified as a low volume area which denotes directional conviction and ought to offer support on any test).

If participants were to auction and find acceptance into areas of prior low volume, then future discovery ought to be volatile and quick as participants look to areas of high volume for favorable entry or exit.

Balance (Two-Timeframe Or Bracket): Rotational trade that denotes current prices offer favorable entry and exit. Balance-areas make it easy to spot a change in the market (i.e., the transition from two-time frame trade, or balance, to one-time frame trade, or trend).

Modus operandi is responsive trade (i.e., fade the edges), rather than initiative trade (i.e., play the break).
To note, initially, participants had a tough time separating value and expanding range lower.
This was evidenced by the minimal excess at Wednesday’s regular trade low (RTH Low), coupled with Thursday’s overnight response at the 20-day simple moving average (i.e., a visual level likely paid attention to by short-term, technically-driven market participants who generally are unable to defend retests).
Graphic: S&P 500 loses the 20-day simple moving average. A loss of that level officially changes the tone; “We maintain a cautiously bullish stance.”
Given that action – the difficulty participants had in moving prices out and away from balance – the path of least resistance was not down; stronger sellers were not yet on board, I explained.
Excess: A proper end to price discovery; the market travels too far while advertising prices. Responsive, other-timeframe (OTF) participants aggressively enter the market, leaving tails or gaps which denote unfair prices.

Value-Area Placement: Perception of value unchanged if value overlapping (i.e., inside day). Perception of value has changed if value not overlapping (i.e., outside day). Delay trade in the former case.
Graphic: 30-minute profile chart of the Micro E-mini S&P 500 Futures and market liquidity, via Bookmap, for the SPDR S&P 500 ETF Trust (NYSE: SPY) coming into Thursday’s regular trade. Notice the cumulative volume delta (CVD) or buying and selling power as calculated by the difference in volume traded at the bid and offer. So, coming into Friday’s trade, stronger sellers were likely not yet on board.
The tone changed Friday when selling intensified; the 20-day simple moving average was lost and the S&P 500 closed the session on a spike lower, away from value.
Spike Rules In Play: Spike’s mark the beginning of a break from value. Spikes higher (lower) are validated by trade at or above (below) the spike base (i.e., the origin of the spike).
Further, the aforementioned trade is happening in the context of peak growth and a moderation in the economic recovery, heightened valuations, the prospects of stimulus reduction, as well as non-seasonally aligned inflows, impactful options market dynamics, divergent sentiment, and fears of a mid-cycle transition.
The implications of these themes on price are contradictory.
To elaborate, Morgan Stanley (NYSE: MS), Citigroup Inc (NYSE: C), and Goldman Sachs Group Inc (NYSE: GS) cautioned investors about equity outlooks. Of concern, in particular, is a rise in cases of the delta variant, tensions between inflation expectations and yields, as well as seasonality.
Among other risks, as SpotGamma notes, “markets are fast approaching a window of volatility which could produce some pretty sharp volatility: 9/15 VIX expiration, 9/17 Quarterly OPEX and the 9/22 FOMC. This lineup is particularly interesting as we believe that expiration leads to a pickup in volatility.” Read more on SpotGamma’s perspectives, here.
Graphic: @pat_hennessy breaks down returns for the S&P 500, categorized by the week relative to OPEX. Based on his analysis, Pat sees that the “2 weeks prior to OPEX (e.g., 7/30/21 to 8/6/21 in this late-cycle) [have] been extremely bullish,” while “OPEX week returns peaked in 2016 and have trended lower since.”
SqueezeMetrics – which saw “the current combination of weak put flows and large customer vanna exposure” as fragile – echoes the risks of volatility adding “people are overexposed to changes in VIX, and will be hurt more than usual if VIX starts moving up. Historically, this means SPX down, VIX up.”
Moreover, for early trade next week, given an increased potential for heightened volatility and Friday’s end-of-day spike from value, participants may make use of the following framework.
If participants manage to find acceptance (i.e., spend multiple hours of trade) above the $4,467.00 spike base, then the odds of downside follow-through are lower. We’d look to maintain a cautiously bullish stance.
On the other hand, should participants have trouble maintaining prices above the $4,467.00 spike base, then the focus ought to be on big-picture risk management levels like the August 19, 2021 swing low and 50-day simple moving average.
Graphic: 65-minute profile chart of the Micro E-mini S&P 500 Futures updated 12:00 PM ET Saturday. Note that the roll to the December contract occurred on September 9, 2021. Therefore, levels in the above graphic should only be relied upon as rough areas of resistance and support. Updated levels to come Thursday, September 16, 2021.
Weekly Trade Idea
Please Note: In no way is the below a trade recommendation. Derivatives carry a substantial risk of loss. All content is for informational purposes only.
Options offer an efficient way to gain directional exposure.
If an option buyer was short (long) stock, he or she could buy a call (put) to hedge upside (downside) exposure. Additionally, one can spread, or buy (+) and sell (-) options together, strategically.
Commonly discussed spreads include credit, debit, ratio, back, and calendar.
Credit: Sell -1 option closer to the money. Buy +1 option farther out of the money.
Debit: Buy +1 option closer to the money. Sell -1 option farther out of the money.
Ratio: Buy +1 option closer to the money. Sell -2 options farther out of the money.
Back: Sell -1 option closer to the money. Buy +2 options farther out of the money.
Calendar: Sell -1 option. Buy +1 option farther out in time, at the same strike.
Typically, if bullish (bearish), sell at-the-money put (call) credit spread and/or buy a call (put) debit/ratio spread structured around target price. Alternatively, if the expected directional move is great (small), opt for a back spread (calendar spread). Also, if credit spread, capture 50-75% of the premium collected. If debit spread, capture 2-300% of the premium paid.
Be cognizant of risk exposure to direction (delta), time (theta), and volatility (vega).
Negative (positive) delta = synthetic short (long).
Negative (positive) theta = time decay hurts (helps).
Trade Idea 1: SELL -1 1/2 BACKRATIO SPX 100 (Weeklys) 17 SEP 21 4350/4250 PUT @3.80 LMT
I’m neutral-to-bearish on the S&P 500 and I think the index may travel sideways to lower over the next week, past its key moving averages. I will structure a spread below the current index price, expiring in 1 week. I will buy the 4350 put option once (+1) and sell the 4250 put option twice (-2) for a $3.80 credit. Should the index not move to my target, I keep the $380 credit. Should it move to $4,250.00, past the 50-day simple moving average, I could make $10,380.00 at expiry. Should the index move past $4,150.00 or so, I may incur unlimited losses. My goal, with this spread, is to capture the initial credit and close for additional credit if the index moves lower.
If necessary, I will hedge the position by either (A) selling futures, (B) widening strikes, (C) buying a far out-of-the-money put option to cap downside in case of an unpredictable move lower, or (D) roll strikes down in price and out in time.
Trade Idea 2: SELL -1 1/2 BACKRATIO GOOGL 100 17 SEP 21 2775/2700 PUT @.90 LMT
I’m neutral-to-bearish on Alphabet Inc and I think the stock may travel sideways to lower over the next week, past its key moving averages. I will structure a spread below the current stock price, expiring in 1 week. I will buy the 2775 put option once (+1) and sell the 2700 put option twice (-2) for a $0.90 credit. Should the stock not move to my target, I keep the $90 credit. Should it move to $2,700.00, toward the 50-day simple moving average, I could make $7,500.00 at expiry. Should the stock move past $2,625.00 or so, I may incur unlimited losses. My goal, with this spread, is to capture the initial credit and close for additional credit if the stock moves lower.
If necessary, I will hedge the position by either (A) selling stock, (B) widening strikes, (C) buying a far out-of-the-money put option to cap downside in case of an unpredictable move lower, or (D) roll strikes down in price and out in time.
News And Analysis
Lenders continue to expect falling profits, refinancing demand.
Manchin seeing delay in Congress for vote on Biden’s agenda.
Massive decline in forbearances, down nearly 67% from peak.
Oil prices continuing to fall as pandemic worries slow demand.
Moody’s: Democrats are at a fork in the road, may not take it.
COVID-19 and China risks won’t pass for years, some project.
Nasdaq talks market infrastructure, the real trends in volumes.
Bonds turning hot; European Central Bank redefines tapering.
What People Are Saying
Producer Price Inflation is above 10% for the first time since 1981 on a finished goods basis (the main measure used until 2011). On a final demand basis, it's 8.3%, highest since inception in 2011. Either way, it's worryingly high. pic.twitter.com/vIYCRAjd79
In this the SPX chart, OPEX is marked. It does give the appearance that volatility has shifted from end of month aka "mid OPEX cycle" to OPEX itself. pic.twitter.com/huedOFaMGL
With every up swing shorter than the previous one and loss of momentum, this market tells me it wants to correct. No top reversal chart pattern. No breakdown signal as of Friday's close. 4,100-4,200 area is support. #SPXpic.twitter.com/sPkQEPghQ8
After years of self-education, strategy development, and trial-and-error, Renato Leonard Capelj began trading full-time and founded Physik Invest to detail his methods, research, and performance in the markets.
Additionally, Capelj is a finance and technology reporter. Some of his biggest works include interviews with leaders such as John Chambers, founder and CEO, JC2 Ventures, Kevin O’Leary, businessman and Shark Tank host, Catherine Wood, CEO and CIO, ARK Invest, among others.
Disclaimer
At this time, Physik Invest does not manage outside capital and is not licensed. In no way should the materials herein be construed as advice. Derivatives carry a substantial risk of loss. All content is for informational purposes only.
Editor’s Note: Before getting into today’s commentary, we take a moment to reflect on the following quote taken from page 123 of The Disciplined Traderby Mark Douglas.
“For years, many people in the academic community believed that the markets were random; this is a perfect example of their general lack of understanding of human nature. People act as a force on prices in perfectly logical ways, when you understand the logic of their fears.”
Also, given Labor Day, markets are closed Monday, September 6. As a result, Daily Briefs will resume Tuesday, September 7. Thank you and have a great extended weekend!
Equity index futures traded sideways to higher last week.
Reality throwing a wrench in seasonality.
Ahead: Light calendar to base decisions.
Equity indices rising; SPX above 50-day.
Positioning risks mount case for volatility.
A couple trade ideas for the week ahead.
What Happened: U.S. stock index futures auctioned mostly sideways to higher, into Friday’s nonfarm payrolls miss.
Next week participants have a light calendar to base decisions around.
Graphic updated 10:30 AM ET 9/4/2021. Sentiment Neutral if expected /ES open is inside of the prior day’s range. SqueezeMetrics Dark Pool Index (DIX) and Gamma (GEX) calculations are based on where the prior day’s reading falls with respect to the MAX and MIN of all occurrences available. A higher DIX is bullish. At the same time, the lower the GEX, the more (expected) volatility. SHIFT data used for S&P 500 (INDEX: SPX) options activity approximation. Note that options flow is sorted by the call premium spent; if more positive then more was spent on call options. Breadth reflects a reading of the prior day’s NYSE Advance/Decline indicator. VIX reflects a current reading of the CBOE Volatility Index (INDEX: VIX) from 0-100.
What To Expect: During the prior week’s trade, on mostly lackluster intraday breadth and market liquidity metrics, the best case outcome occurred, evidenced by new all-time highs in the S&P 500 and Nasdaq 100.
This is significant because the sideways to higher trade marks acceptance, or a willingness to transact at higher prices after a v-pattern recovery, above the key 50-day simple moving average.
V-Pattern: A pattern that forms after a market establishes a high, retests some support, and then breaks above said high. In most cases, this pattern portends continuation.
Graphic: S&P 500 maintaining prices above the 50-day simple moving average. This moving average can be looked at as a key dynamic level on any move lower. Losing that particular level likely changes the tone.
Further, the aforementioned trade is happening in the context of peak growth and a moderation in the economic recovery, as well as non-seasonally aligned inflows, impactful options market dynamics, divergent sentiment, and fears of a mid-cycle transition.
The implications of these themes on price are contradictory.
To elaborate, August, over the past 25 years, has historically been the largest month for equity outflows. According to Goldman Sachs Group Inc’s (NYSE: GS) Scott Rubner, “We have seen none of these outflows and it has been buying the dip (TINA).”
Given this divergence from the norm, advances are not “welcomed and may lead to a quick right tail hedging … [as] option volume notional is 120% of stock volume notional.”
To put it simply, an increased share of options being traded expires within two weeks. The hedging of these directionally sensitive options can represent an increased share of volume in underlying stocks.
As a result, option flows impact the underlying’s price, markedly.
We couple this so-called right-tail hedging with the structural positioning – the so-called wall of worry – that can drive the market through three factors – change in the underlying price (gamma), implied volatility (vanna), and time (charm) – that are well known to impact an options exposure to directional risk or delta.
“Charm is a major driver for support in the markets,” said Cem Karsan of Kai Volatility Advisors. “All of that support is leading up to and accelerating into that Monday-Wednesday window” ahead of options expiration (OPEX). “And then the window really opens for lack of support. It’s not like there’s a bunch of selling all of a sudden. It’s a window of non-strength; a lack of these supportive flows that have been there prior.”
Graphic: @pat_hennessy breaks down returns for the S&P 500, categorized by the week relative to OPEX. Based on his analysis, Pat sees that the “2 weeks prior to OPEX (e.g., 7/30/21 to 8/6/21 in this late-cycle) [have] been extremely bullish.”
With the August monthly OPEX behind us, the focus shifts now to September. At and around the same time, Morgan Stanley’s (NYSE: MS) Michael Wilson expects a formal signal (which would align with Karsan’s window of non-strength) on the taper of asset purchases, that could lead to a mid-cycle transition and possibly an S&P 500 correction.
“Assuming a stable equity risk premium at 345bp, P/Es would fall to 19x, or 10% lower.”
Graphic: @pat_hennessy breaks down S&P 500 OPEX returns. Pat sees that “OPEX week returns peaked in 2016 and have trended lower since.”
Adding, the eventual reduction in the Federal Reserve’s balance sheet – a removal of liquidity – may exacerbate any sort of risk-off scenario in which participants try to get ahead of whatever cascading reaction may come with a taper.
As Karsan explains: “It’s not a coincidence that the mid-February to mid-March 2020 downturn literally started the day after February expiration and ended the day of March quarterly expiration. These derivatives are incredibly embedded in how the tail reacts and there’s not enough liquidity, given the leverage, if the Fed were to taper.”
SpotGamma – in a September 2, 2021 note – echoed the possibility of volatility; “markets are fast approaching a window of volatility which could produce some pretty sharp volatility: 9/15 VIX expiration, 9/17 Quarterly OPEX and the 9/22 FOMC. This lineup is particularly interesting as we believe that expiration leads to a pickup in volatility – however, traders may hold the pause button on selling that volatility due to the FOMC. This could catch less sophisticated vol sellers off guard and lead to some exacerbated volatility.”
Others, like SqueezeMetrics – which sees “the current combination of weak put flows and large customer vanna exposure” as fragile – suggest that volatility risks have risen, too.
Given the big picture context (i.e., status quo – higher prices – in the face of volatility risks) participants may make use of the following frameworks.
In the best case, the S&P 500 trades sideways or higher; activity above the $4,527.75 high volume area (HVNode) pivot puts in play the $4,550.00 overnight high (ONH). Initiative trade beyond the ONH could reach as high as the Fibonacci extensions at $4,556.25 and $4,592.25.
In the worst case, the S&P 500 trades lower; activity below the $4,527.75 HVNode puts in play the $4,510.00 regular trade high (RTH High). Initiative trade beyond the RTH High could reach as low as the $4,495.00 and $4,481.75 HVNodes.
Overnight Rally Highs (Lows): Typically, there is a low historical probability associated with overnight rally-highs (lows) ending the upside (downside) discovery process.

Volume Areas: A structurally sound market will build on past areas of high volume. Should the market trend for long periods of time, it will lack sound structure (identified as a low volume area which denotes directional conviction and ought to offer support on any test).

If participants were to auction and find acceptance into areas of prior low volume, then future discovery ought to be volatile and quick as participants look to areas of high volume for favorable entry or exit.
Graphic: 65-minute profile chart of the Micro E-mini S&P 500 Futures updated 10:30 AM ET 9/4/2021.
Weekly Trade Ideas
Please Note: In no way is the below a trade recommendation. Derivatives carry a substantial risk of loss. All content is for informational purposes only.
Options offer an efficient way to gain directional exposure.
If an option buyer was short (long) stock, he or she could buy a call (put) to hedge upside (downside) exposure. Additionally, one can spread, or buy (+) and sell (-) options together, strategically.
Commonly discussed spreads include credit, debit, ratio, back, and calendar.
Credit: Sell -1 option closer to the money. Buy +1 option farther out of the money.
Debit: Buy +1 option closer to the money. Sell -1 option farther out of the money.
Ratio: Buy +1 option closer to the money. Sell -2 options farther out of the money.
Back: Sell -1 option closer to the money. Buy +2 options farther out of the money.
Calendar: Sell -1 option. Buy +1 option farther out in time, at the same strike.
Typically, if bullish (bearish), sell at-the-money put (call) credit spread and/or buy a call (put) debit/ratio spread structured around target price. Alternatively, if the expected directional move is great (small), opt for a back spread (calendar spread). Also, if credit spread, capture 50-75% of the premium collected. If debit spread, capture 2-300% of the premium paid.
Be cognizant of risk exposure to direction (delta), time (theta), and volatility (vega).
Negative (positive) delta = synthetic short (long).
Negative (positive) theta = time decay hurts (helps).
Trade Idea 1: SELL -1 1/2 BACKRATIO GOOGL 100 17 SEP 21 2770/2670 PUT @.15 LMT
I’m neutral on Alphabet Inc and I think the stock may travel sideways to lower over the next couple of weeks, toward $2,770.00, or the volume-weighted average price anchored from the July 28 gap. I will structure a spread below the current stock price, expiring in 2 weeks. I will buy the 2770 put option once (+1) and sell the 2670 put option twice (-2) for a $0.15 credit. Should the stock not move to my target, I keep the $15 credit. Should it move to $2,670.00 I could make $10,015.00 at expiry. Should the stock move past $2,570.00 or so, I may incur unlimited losses. My goal, with this spread, is to capture the initial credit and close for additional credit if the stock moves lower.
If necessary, I will hedge the position by either (A) selling stock, (B) widening strikes, (C) buying a far out-of-the-money put option to cap downside in case of an unpredictable move lower, or (D) roll strikes down in price and out in time.
Trade Idea 2: SELL -1 1/2 BACKRATIO SPX 100 (Weeklys) 10 SEP 21 4480/4430 PUT @.25 LMT
I’m neutral on the S&P 500 and I think the index may travel sideways to lower over the next week, toward its key moving averages. I will structure a spread below the current index price, expiring in 2 weeks. I will buy the 4480 put option once (+1) and sell the 4430 put option twice (-2) for a $0.25 credit. Should the index not move to my target, I keep the $25 credit. Should it move to $4,430.00, past the 20-day simple moving average, I could make $5,025.00 at expiry. Should the index move past $4,380.00 or so, beyond the 50-day simple moving average, I may incur unlimited losses. My goal, with this spread, is to capture the initial credit and close for additional credit if the index moves lower.
If necessary, I will hedge the position by either (A) selling futures, (B) widening strikes, (C) buying a far out-of-the-money put option to cap downside in case of an unpredictable move lower, or (D) roll strikes down in price and out in time.
News And Analysis
Moody’s Weekly Market Outlook on Ida, gas, and inflation.
Reinventing tail risk: a fresh look at market crash protection.
Kansas City Southern mulls $27B CP Rail bid after ruling.
ARK Invest on commodities, innovation, economic signals.
Taliban relies on financing from China following withdrawal.
Hedge Funds cut exposure to stocks that count on China.
Three hours a week: China has put limits on video gaming.
Global gas prices threatening to dent economic recovery.
Are Treasuries in a cautious stance as debt story unfolds?
Could the macro theme/picture be an edge for day traders?
George Soros: Investors in China face a rude awakening.
400,000 homeowners enter the final month in forbearance.
Let’s Hang Out
Los Angeles, CA September 10-12
Salt Lake City, UT September 28-30
About
After years of self-education, strategy development, and trial-and-error, Renato Leonard Capelj began trading full-time and founded Physik Invest to detail his methods, research, and performance in the markets.
Additionally, Capelj is a finance and technology reporter. Some of his biggest works include interviews with leaders such as John Chambers, founder and CEO, JC2 Ventures, Kevin O’Leary, businessman and Shark Tank host, Catherine Wood, CEO and CIO, ARK Invest, among others.
Disclaimer
At this time, Physik Invest does not manage outside capital and is not licensed. In no way should the materials herein be construed as advice. Derivatives carry a substantial risk of loss. All content is for informational purposes only.