Categories
Commentary

Daily Brief For April 27, 2022

The Daily Brief is a free glimpse into the prevailing fundamental and technical drivers of U.S. equity market products. Join the 200+ that read this report daily, below!

What Happened

Overnight, equity index futures probed higher, essentially negating Tuesday’s end-of-day, knee-jerk liquidation.

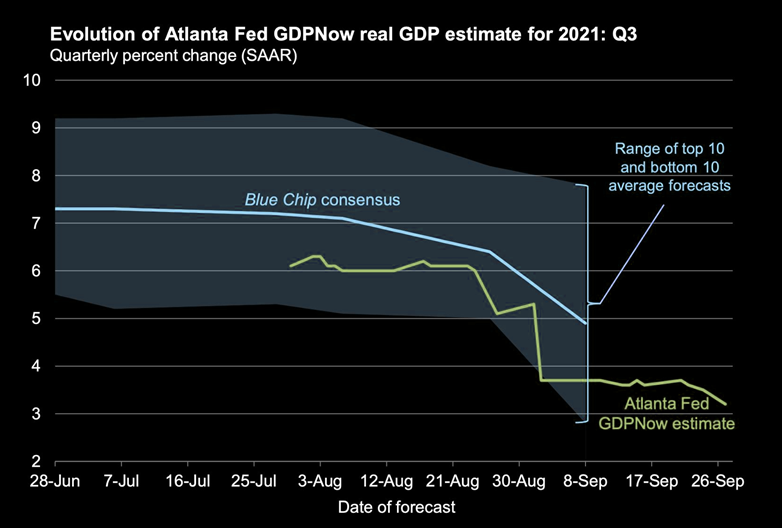
Tuesday’s selling came alongside Russia cutting gas to Poland and Bulgaria, Vice President Kamala Harris testing positive for COVID-19, and heavy selling in growth and tech stocks, amid doubts corporate profits can withstand the Federal Reserve’s bid to tame inflation.

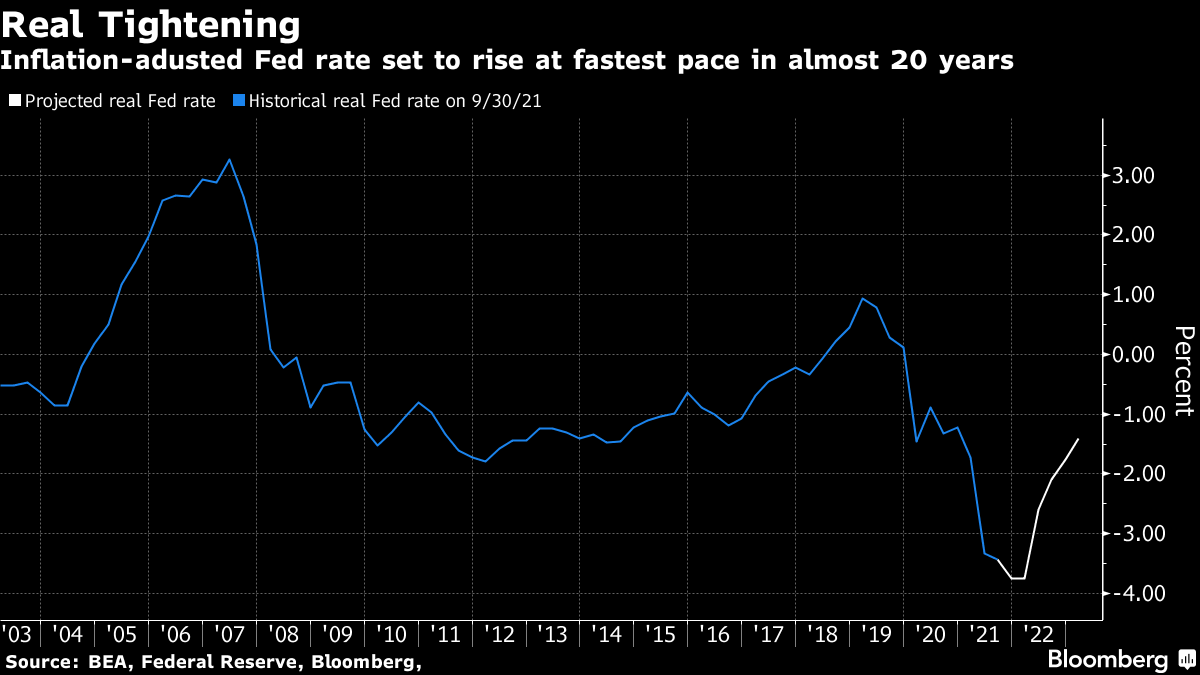
As Jerome Schneider of Pacific Investment Management Co says, QT will “have a profound effect on the cost of liquidity and more importantly the cost of transacting business and reallocating assets from one avenue to another avenue.” 

“There might not necessarily be a rapid deceleration or decline in the stock market or other risk assets, but there’s going to be a changing cost of capital that this balance sheet is going to be part of.”

After the close, weakness continued. Alphabet Inc (NASDAQ: GOOGL) (NASDAQ: GOOG) missed on slowing sales growth and digital-ad spending. One of the biggest losers was Tesla Inc (NASDAQ: TSLA) which shed 12% or so on news that Elon Musk would use his fortune, much of which is tied up in Tesla, to buy Twitter Inc (NYSE: TWTR).

Germany’s passage of a bigger borrowing budget, coupled with China’s pledge to boost infrastructure bolstered an overnight advance that fed into price action at home. The S&P 500, in particular, for a brief moment, took back a key level, negating much of yesterday’s liquidation.

Ahead is data on international trade in goods (8:30 AM ET), as well as pending home sales and the rental vacancy rate (10:00 AM ET).

Graphic updated 7:00 AM ET. Sentiment Neutral if expected /ES open is inside of the prior day’s range. /ES levels are derived from the profile graphic at the bottom of the following section. Levels may have changed since initially quoted; click here for the latest levels. SqueezeMetrics Dark Pool Index (DIX) and Gamma (GEX) calculations are based on where the prior day’s reading falls with respect to the MAX and MIN of all occurrences available. A higher DIX is bullish. At the same time, the lower the GEX, the more (expected) volatility. Learn the implications of volatility, direction, and moneyness. SHIFT data used for S&P 500 (INDEX: SPX) options activity. Note that options flow is sorted by the call premium spent; if more positive, then more was spent on call options. Breadth reflects a reading of the prior day’s NYSE Advance/Decline indicator. VIX reflects a current reading of the CBOE Volatility Index (INDEX: VIX) from 0-100.

What To Expect

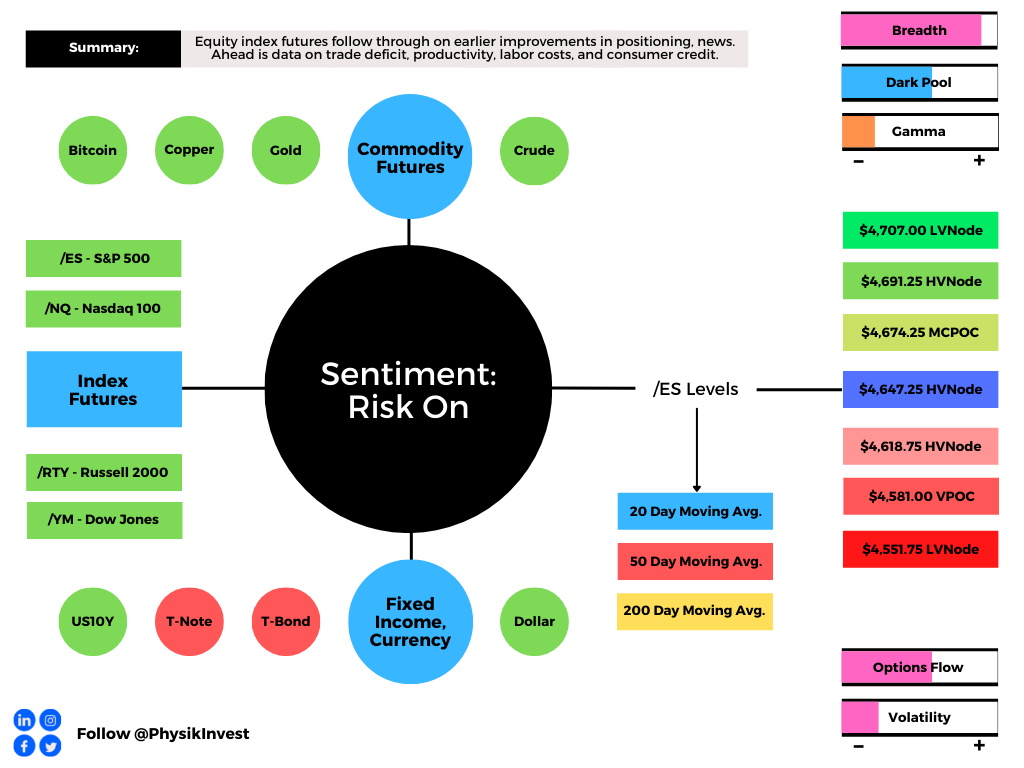
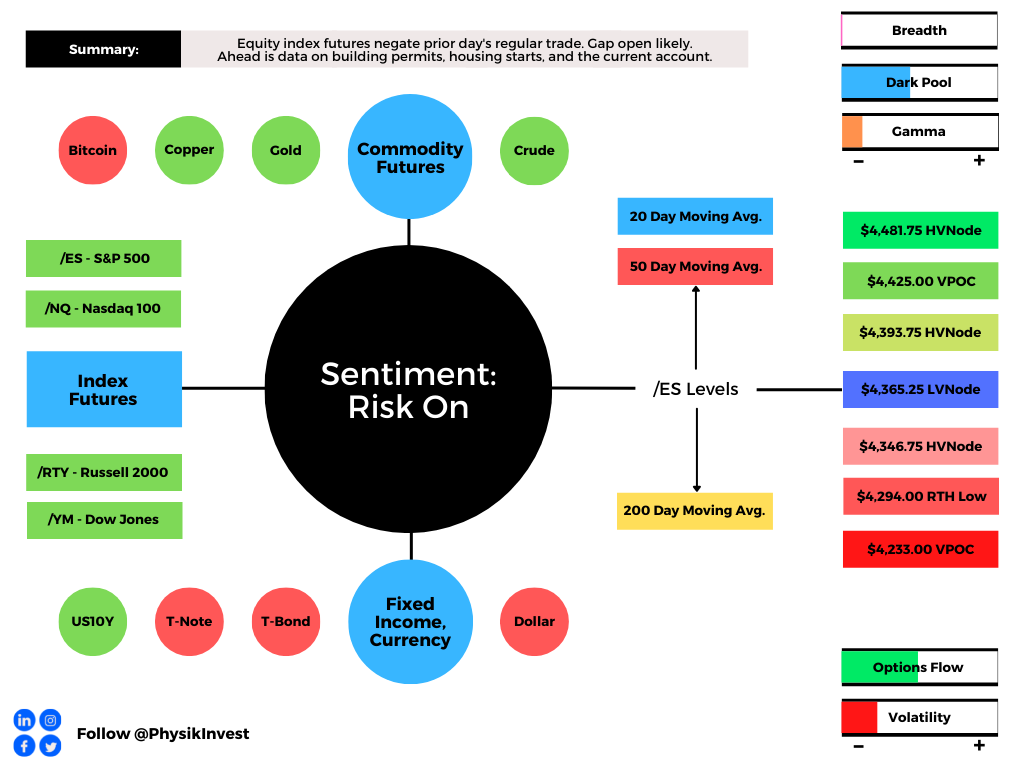
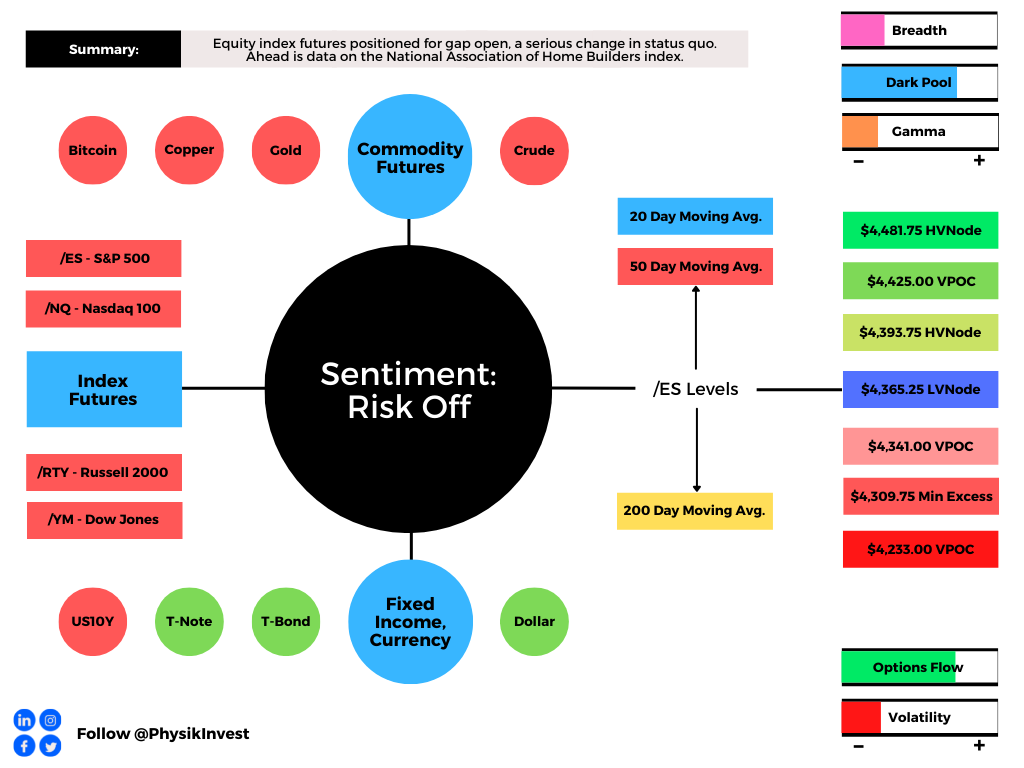
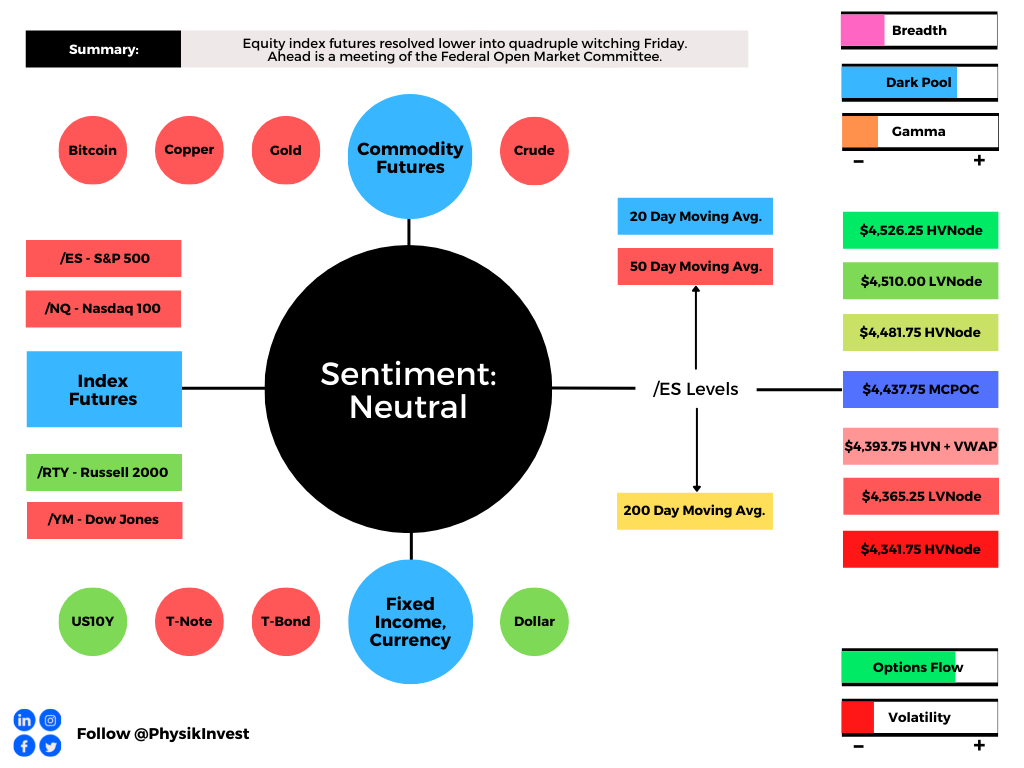
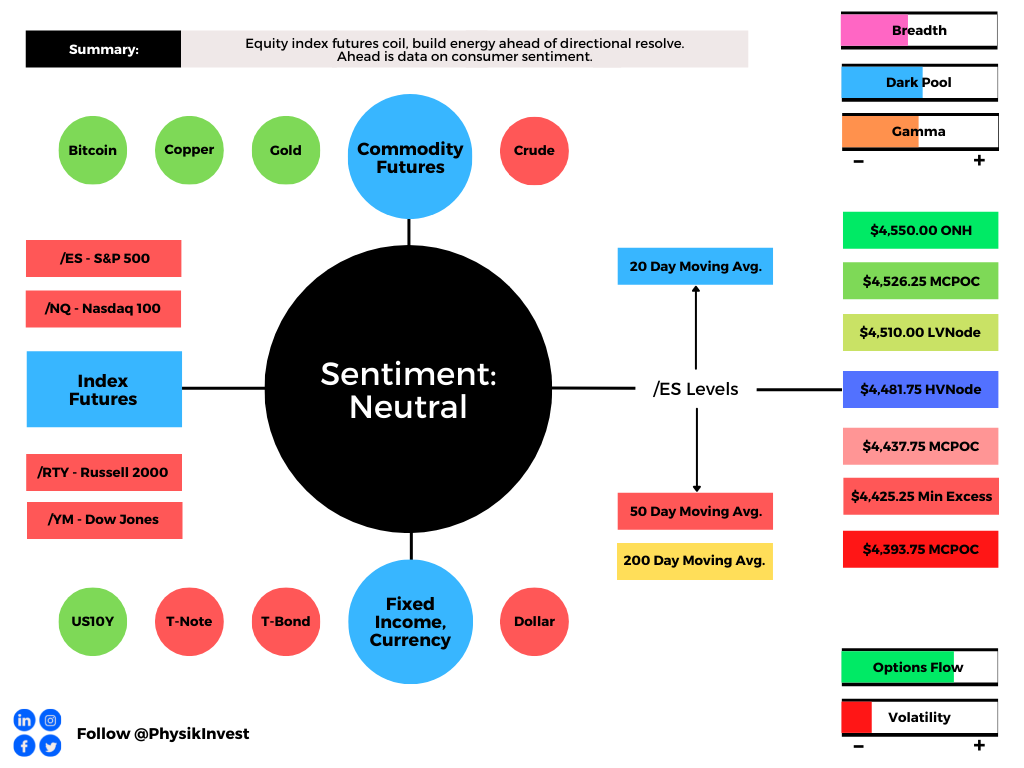
Positioning: Markets are positioned for continued volatility. 

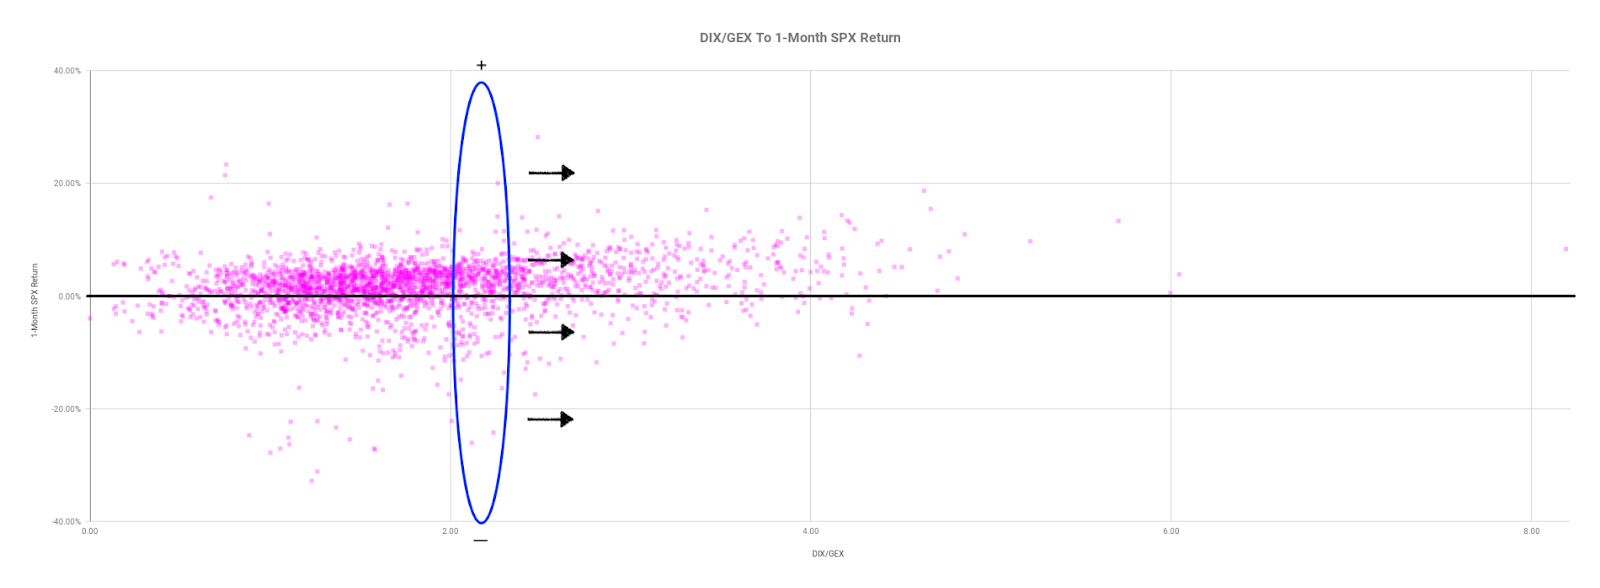
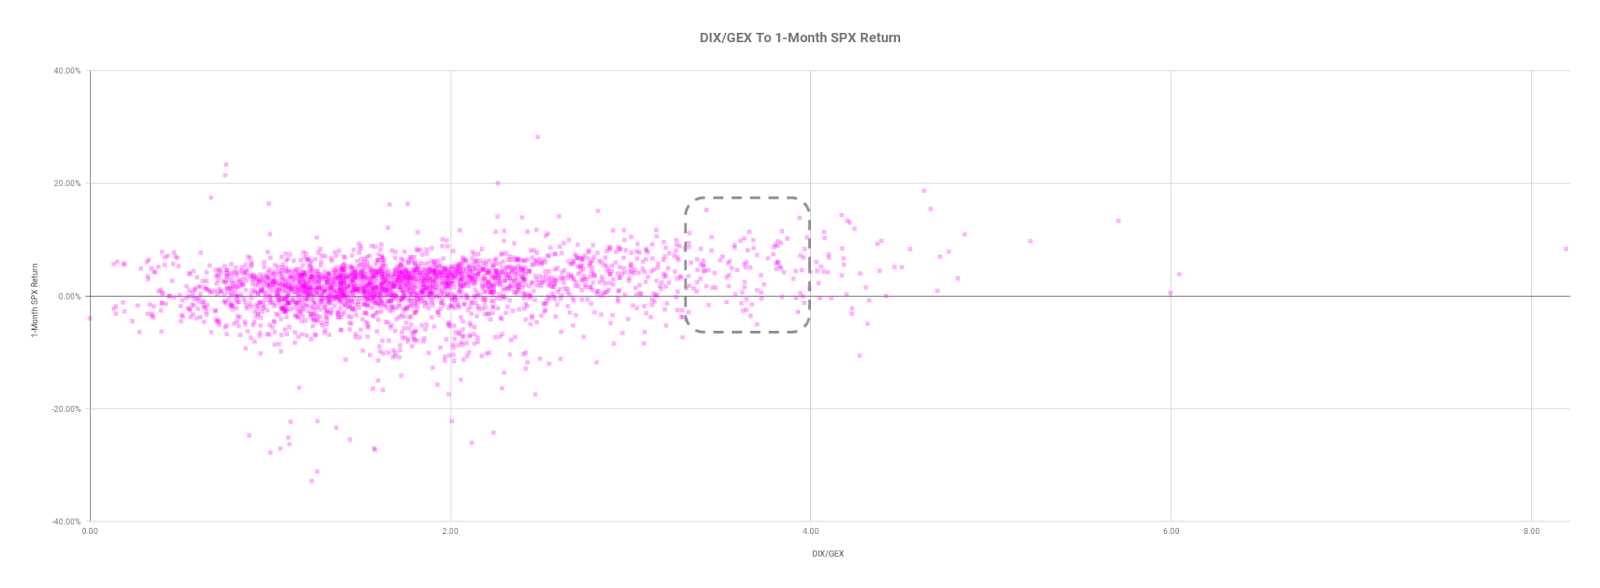
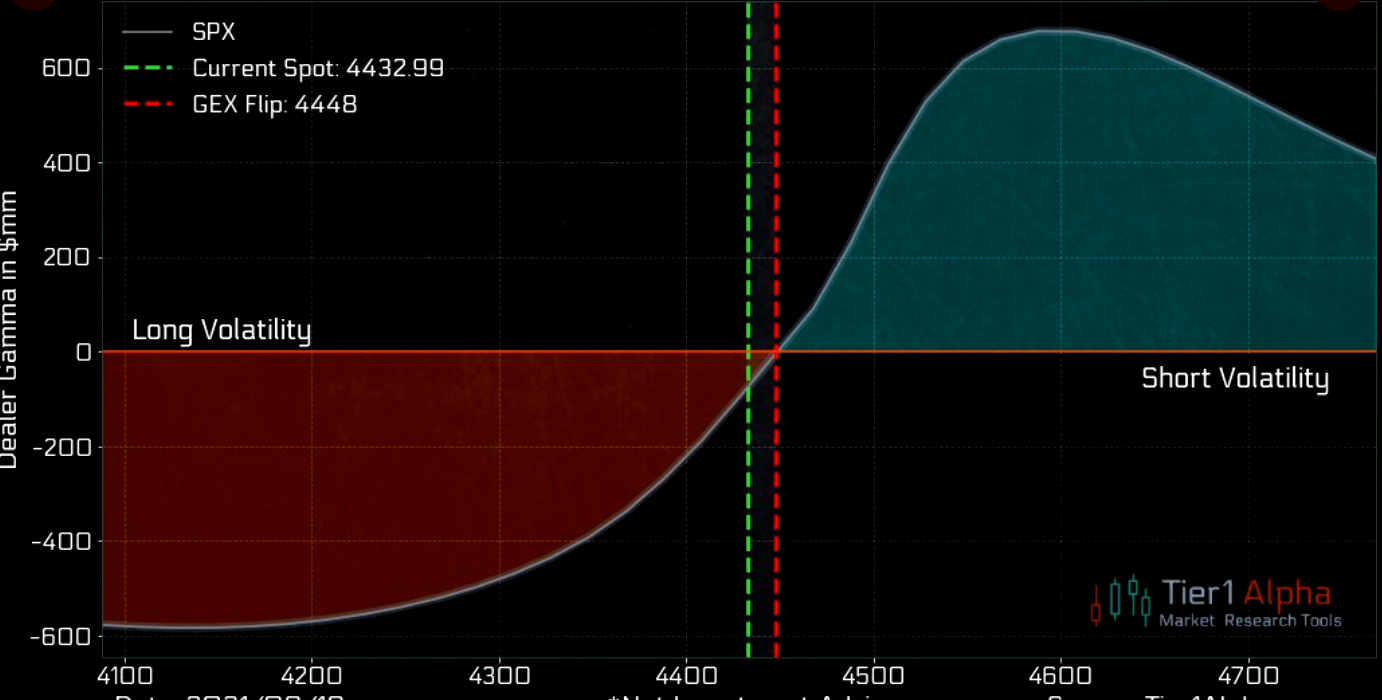
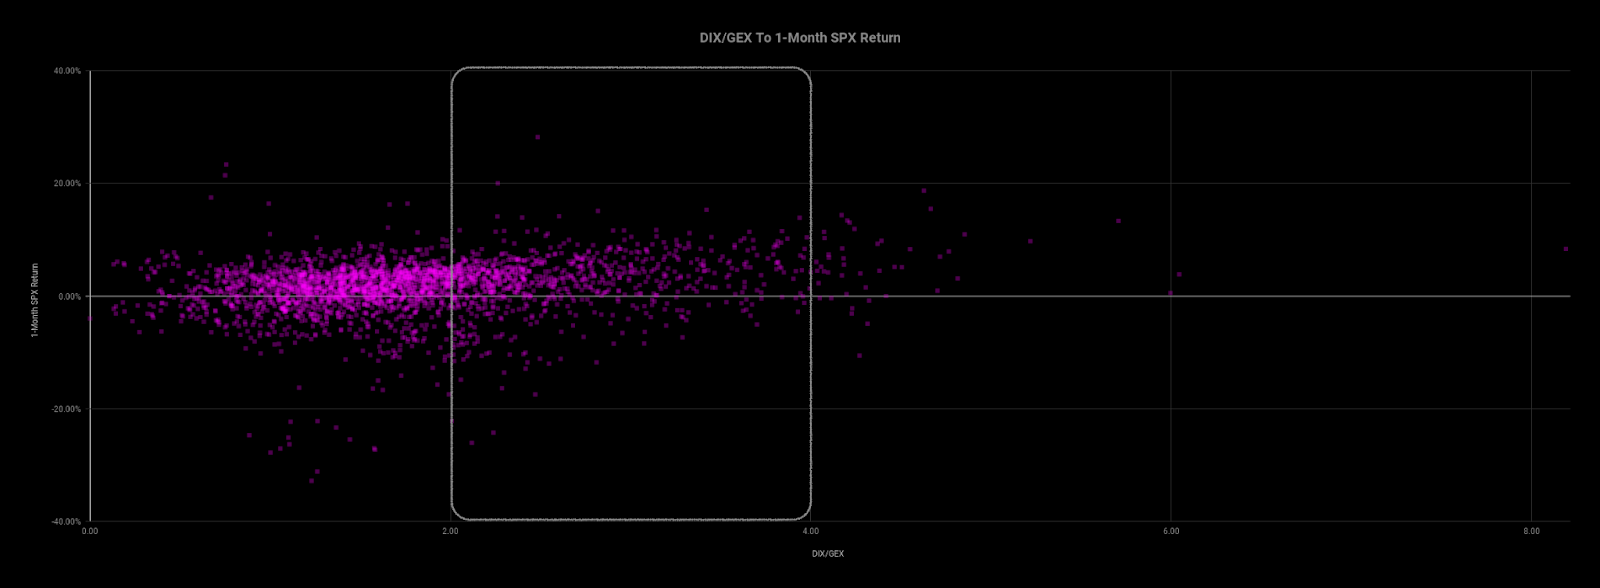
Based on a reading of market gamma exposure (GEX) and buying support (DIX), the returns distribution is skewed positive. There’s buying in the context of an environment in which the hedging of options positioning implies selling into weakness and buying of strength.

Graphic: Via Barclays PLC (NYSE: BCS) research.

In the most simple way that I can explain: when positioning is stretched one way, that often tends to mark a turning point – the returns distribution is either skewed positive or negative.

Graphic: Via Physik Invest. Data via SqueezeMetrics. Updated March of 2022. A high DIX/GEX ratio often portends positive 1-month returns.

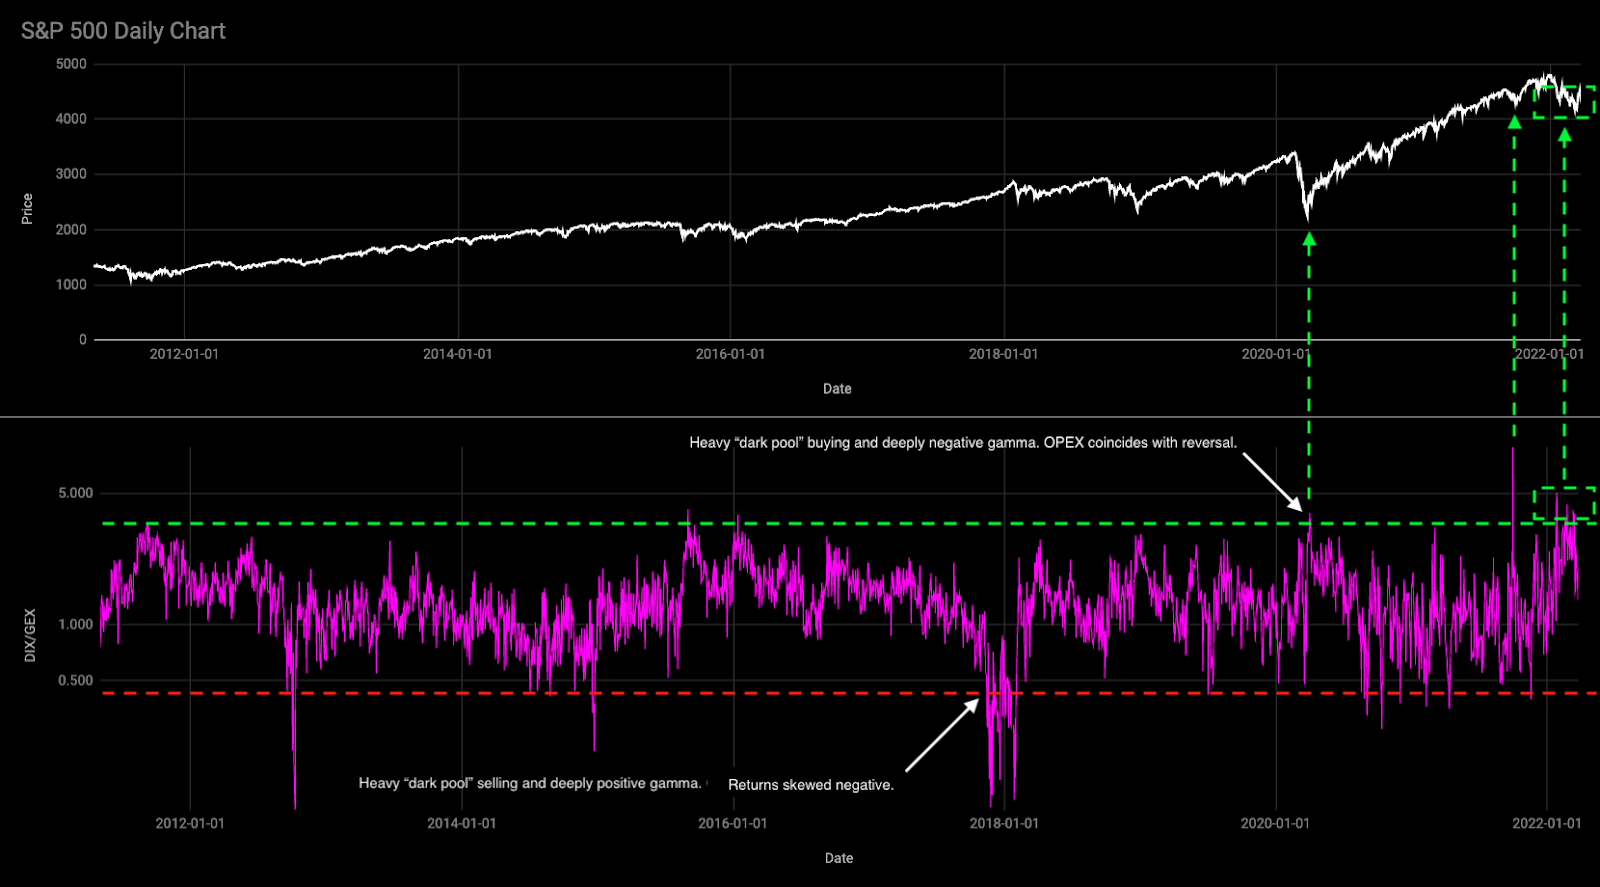
An updated read, after Tuesday’s weak close, tells us that we can (1) definitely expect larger ranges to continue and (2) potential for short-term bounces

Based on overnight activity, one of those is happening, now.

Graphic: Via Physik Invest. Data via SqueezeMetrics.

This is as participants are both well-hedged and using weakness as an opportunity to buy into a less highly valued market.

Well-hedged means that customers (i.e., you and I) own protection against long equity exposure. So, that could mean customers own puts and/or are short calls. One of the most dominant flows is the long put, short call.

Such trade offers customers positive, yet asymmetric (gamma), exposure to direction (delta). In other words, negative delta and positive gamma. 

The counterparty has exposure to positive delta and negative gamma. If the underlyings trade lower and volatility rises, all else equal, the position will lose. To hedge against these losses, the counterparties will sell underlying into weakness.

If prices reverse and move higher, these counterparties will re-hedge and buy underlying.

Normally, as seen over the bull run of 2020 and 2021, markets are in an uptrend and there’s a strong supply of volatility. Often, customers sell more calls than puts and, in an uptrend, those calls solicit more active hedging than the put options.

Recall that the customer is short the call. That means the counterparty is long the call (a positive delta and gamma trade) and will make money if prices rise, all else equal. 

The hedging of this particular exposure (i.e., sell strength, buy weakness), in an uptrend, occurs slower (i.e., counterparts will allow their profits to run), and that’s what can help the market sustain lower volatility trends for longer periods.

When prices reverse and underlyings trade lower, put options solicit increased hedging activity. Given the nature of counterparty exposure to those puts, that hedging happens quickly and can take from market liquidity as to volatility (i.e., buy strength, sell weakness).

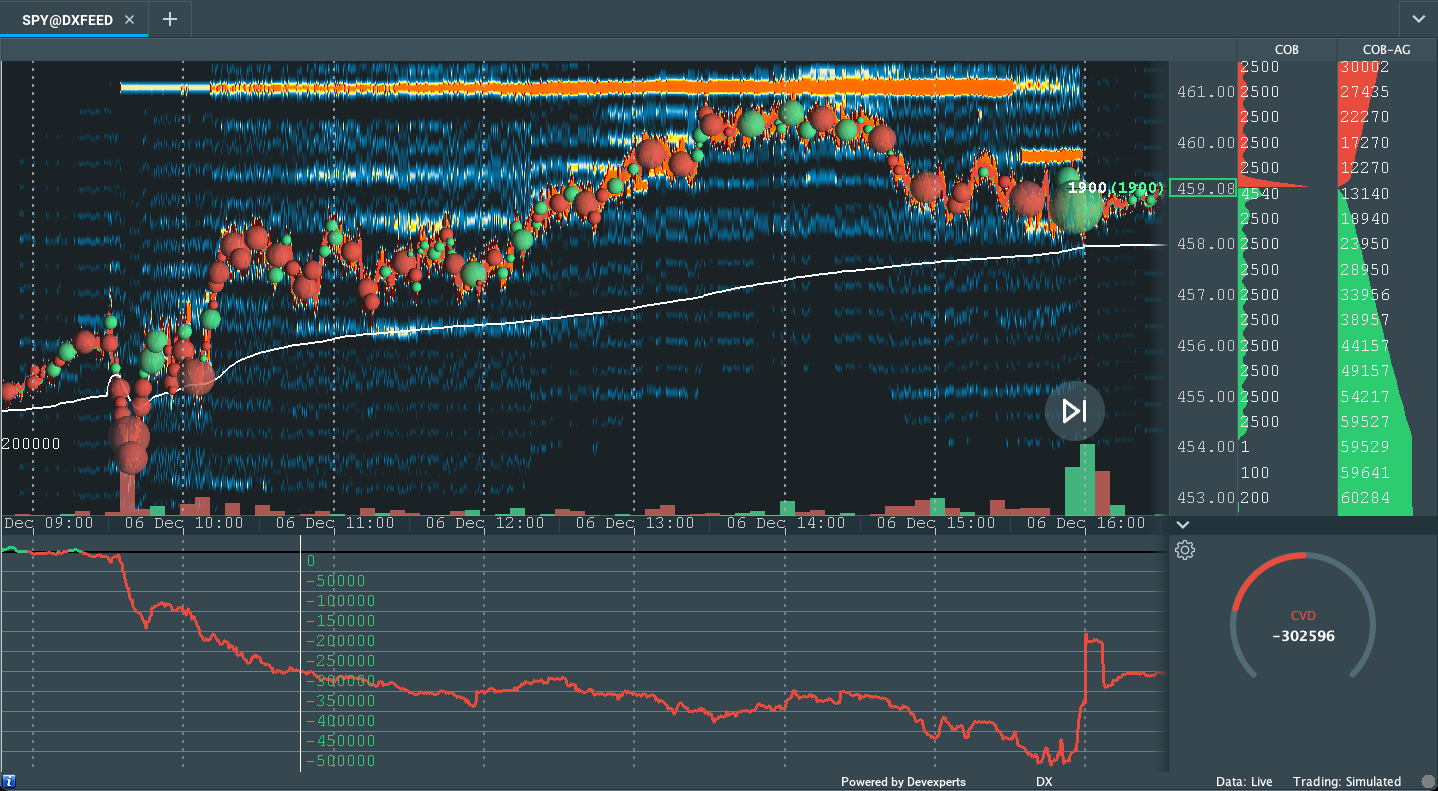
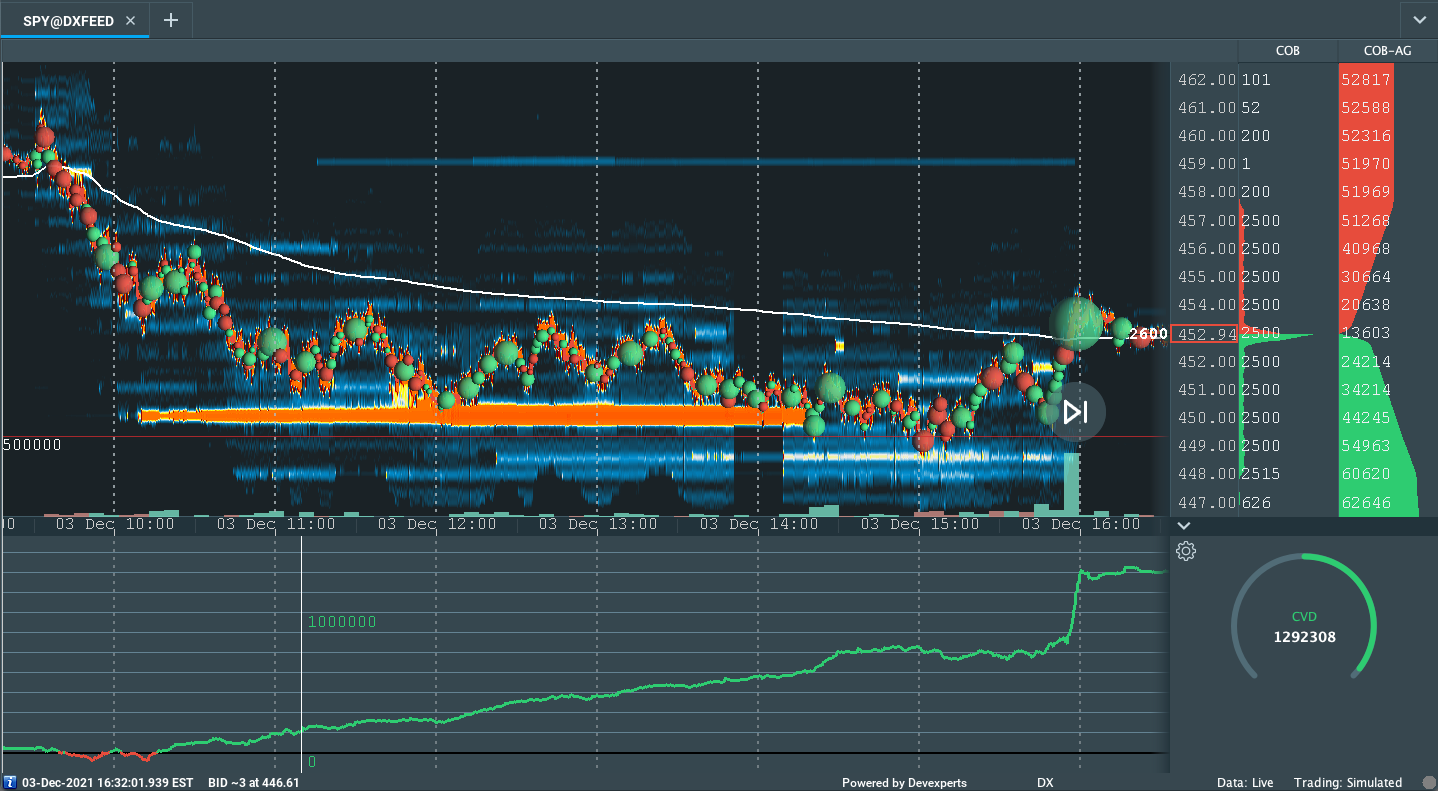
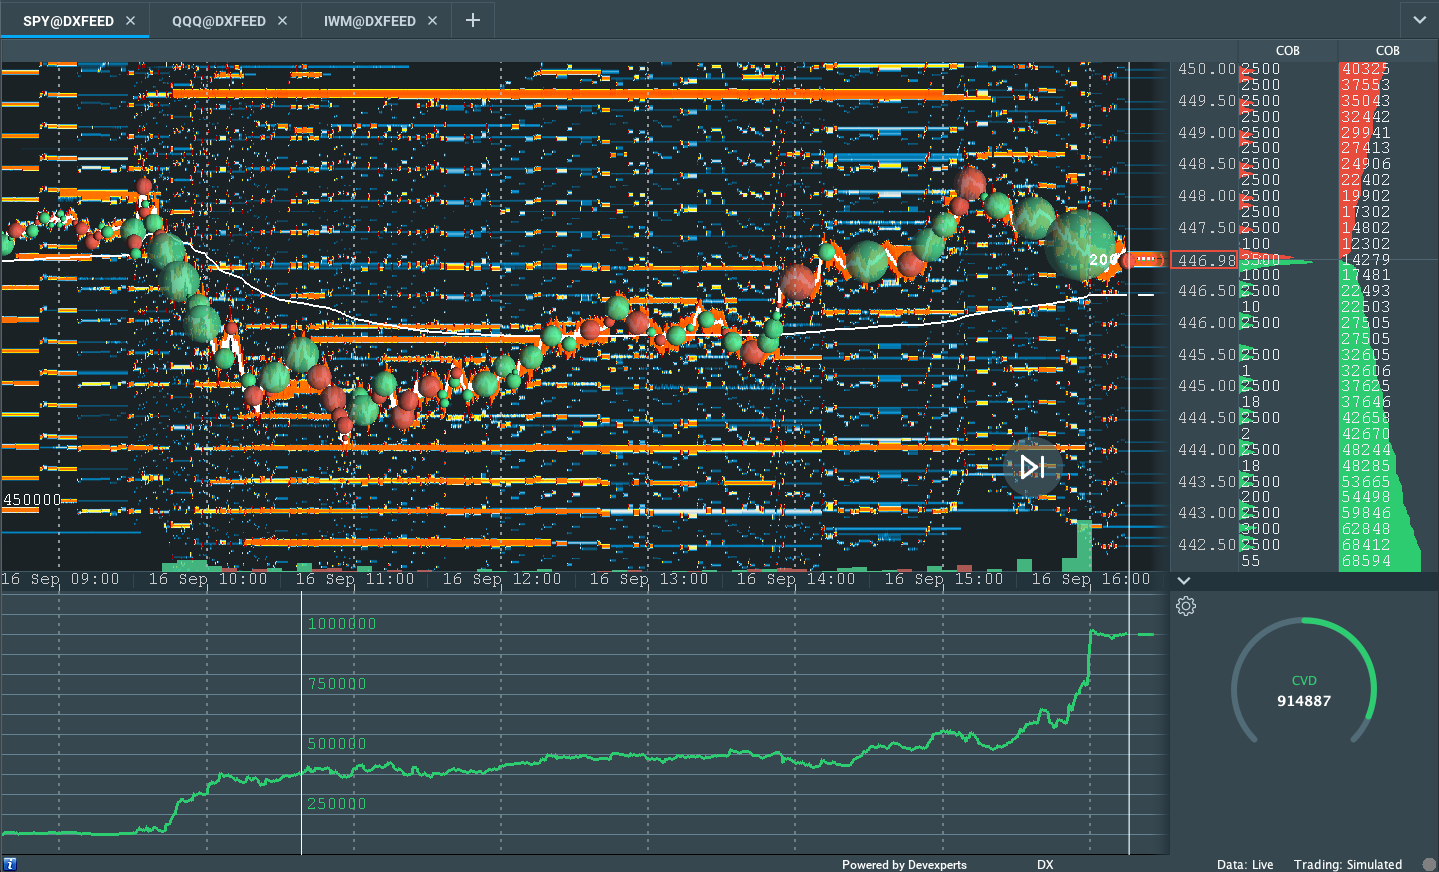
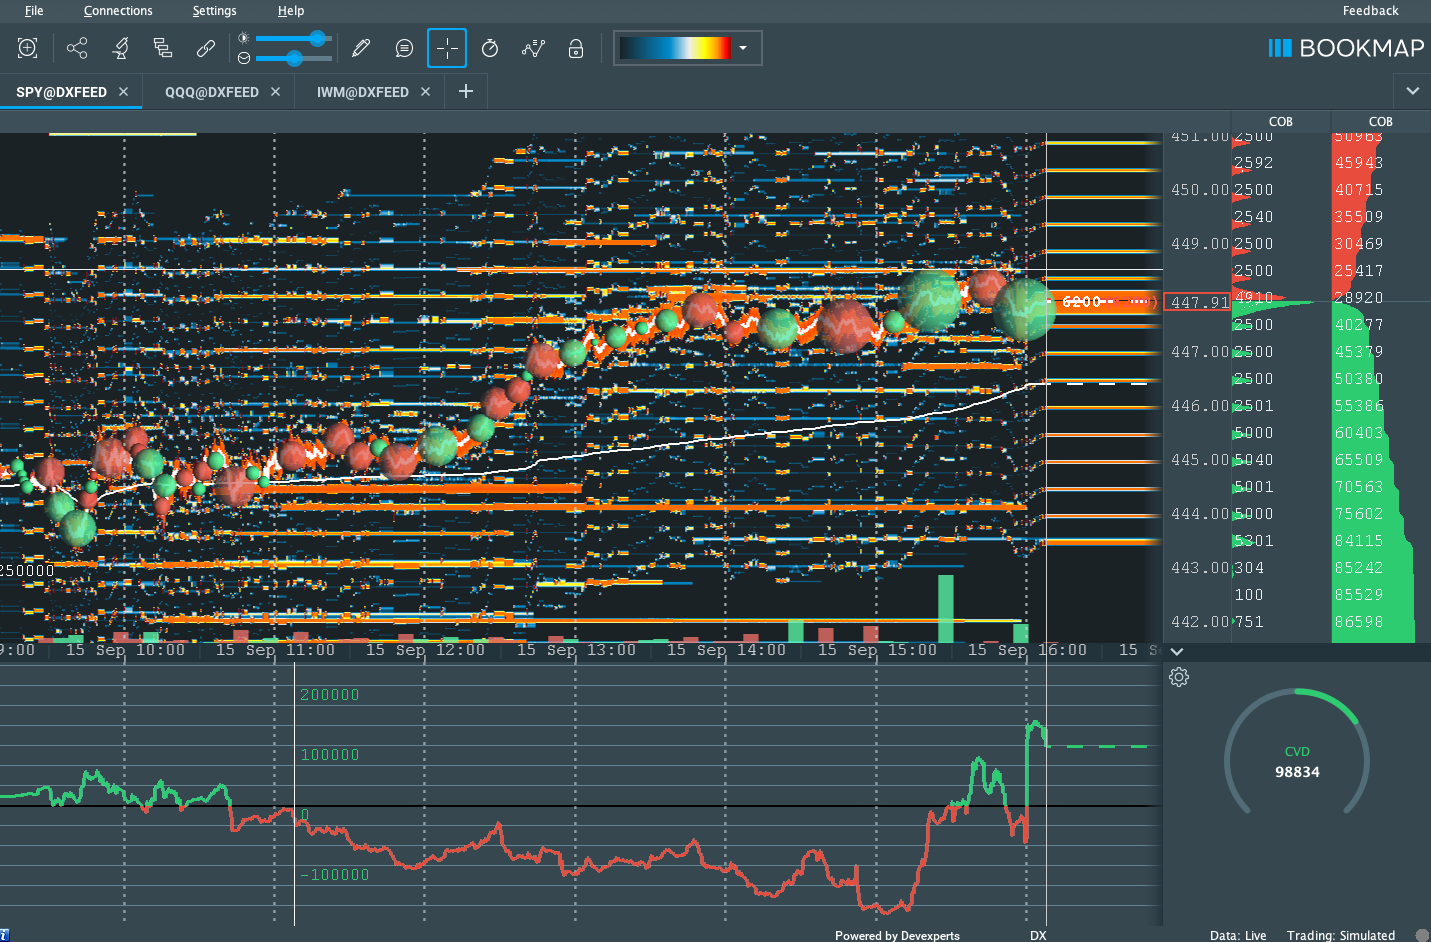
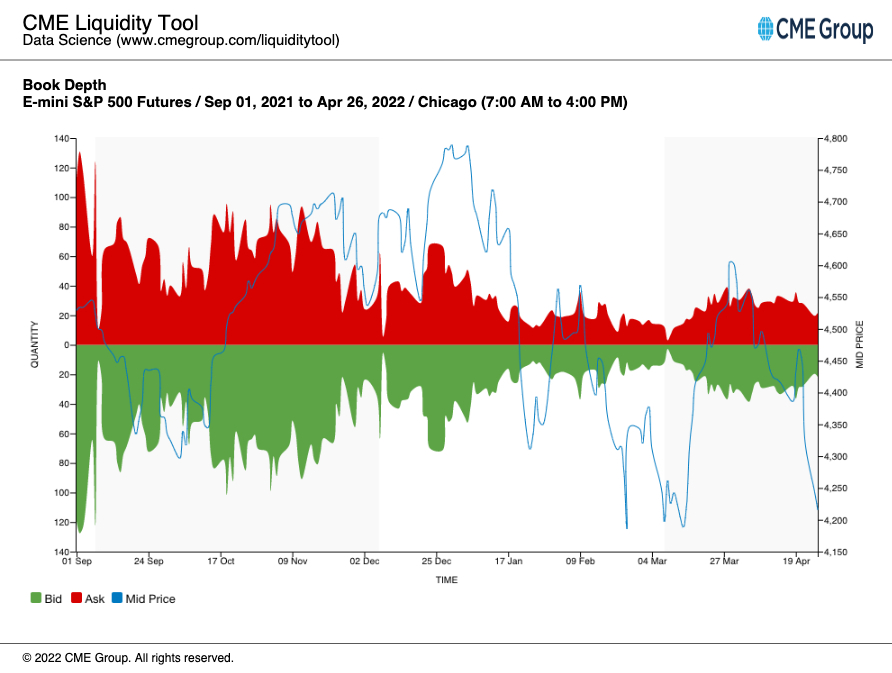
See, below, E-mini S&P 500 book depth, a proxy for market liquidity, and how much it has declined since the end of last year when markets became more volatile and noise around the Federal Reserve’s intent to taper bond-buying and raise rates grew louder.

Graphic: Via CME Group Inc (NASDAQ: CME) Liquidity Tool. Note how in late March, book depth rose as markets rose and customer call activity solicited increased hedging of counterparty long-gamma exposure (i.e., buy weakness, sell strength), adding to market liquidity.

In the above environment, counterparty hedging matters; the market is more sensitive to the flow, so to speak. That sensitivity is expected to continue.

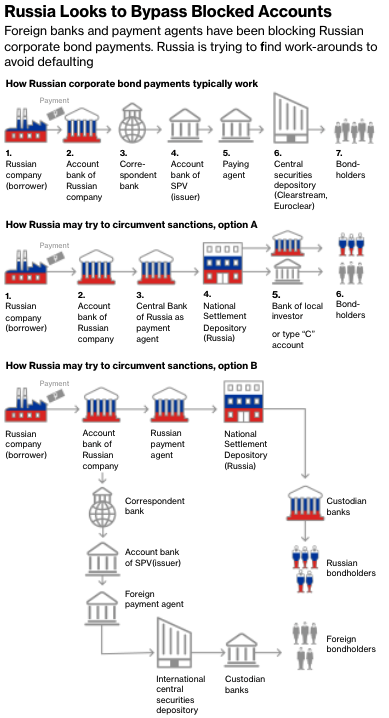
SpotGamma, an options data and analysis service, sees the early May period as pivotal. Then is the Federal Open Market Committee (FOMC) meeting and the potential Russian default, per Moody’s Corporation (NYSE: MCO).

As quoted: “Russia ‘may be considered in default’ if it does not pay two bonds in US dollars by end of a grace period on May 4.”

Graphic: Via Bloomberg.

Until those events are resolved, participants will likely continue to (remain) hedge(d). Upon resolve, customers likely monetize their protection to offset losses on underlying equity exposure. 

That means selling volatility which reduces counterparty exposure to short puts (negative gamma and positive delta). To re-hedge, underlying is bought back and that may support a price rise.

Graphic: VIX term structure via VIX Central. Expansion (higher) solicits counterparty selling which pressures the market lower. Compression (lower) solicits counterparty buying which bolsters attempts higher.

Whether that price rise has legs depends on what the fundamental situation is, then. See the below section titled Considerations for a full technical picture and the most likely turning points.

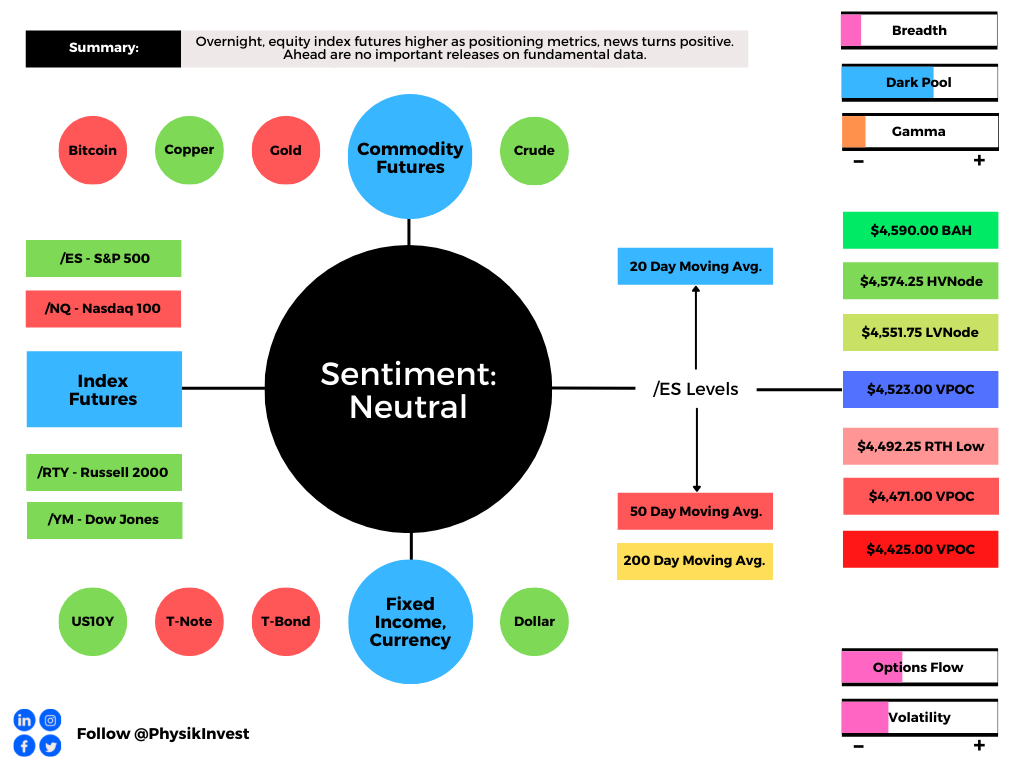
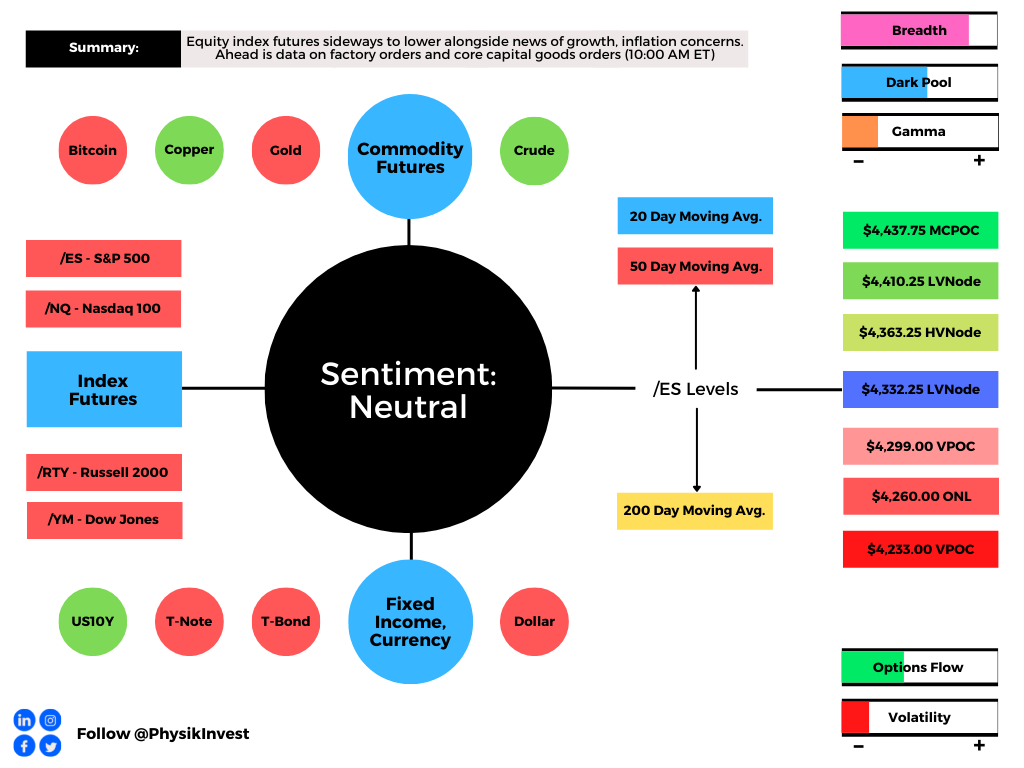
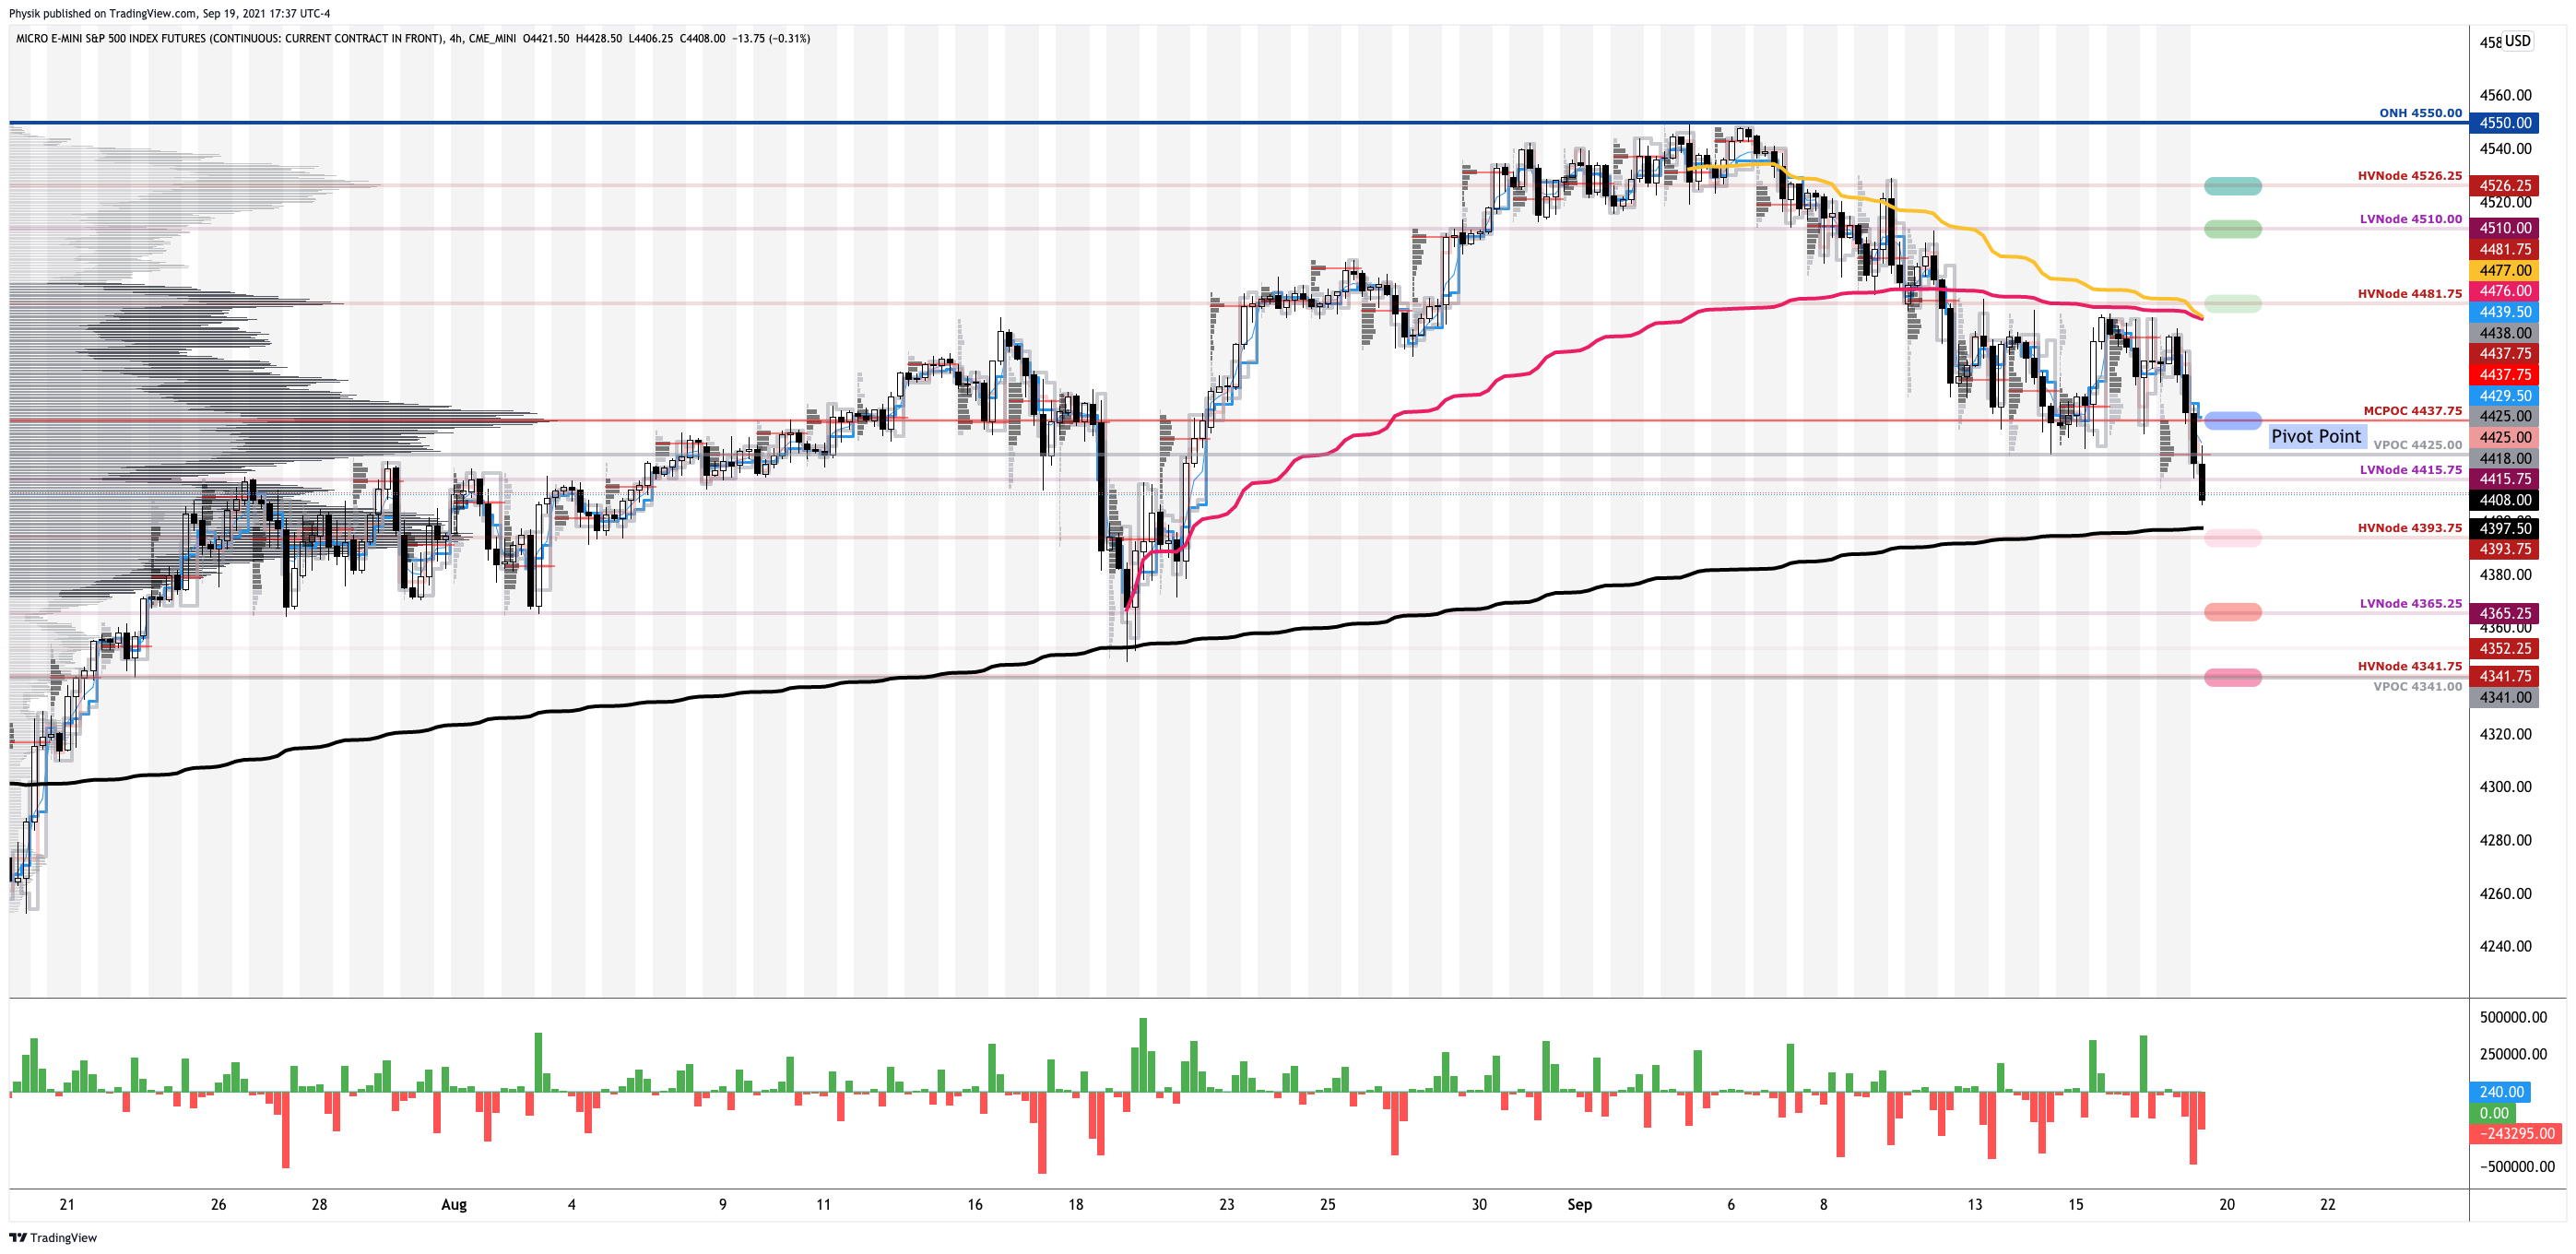
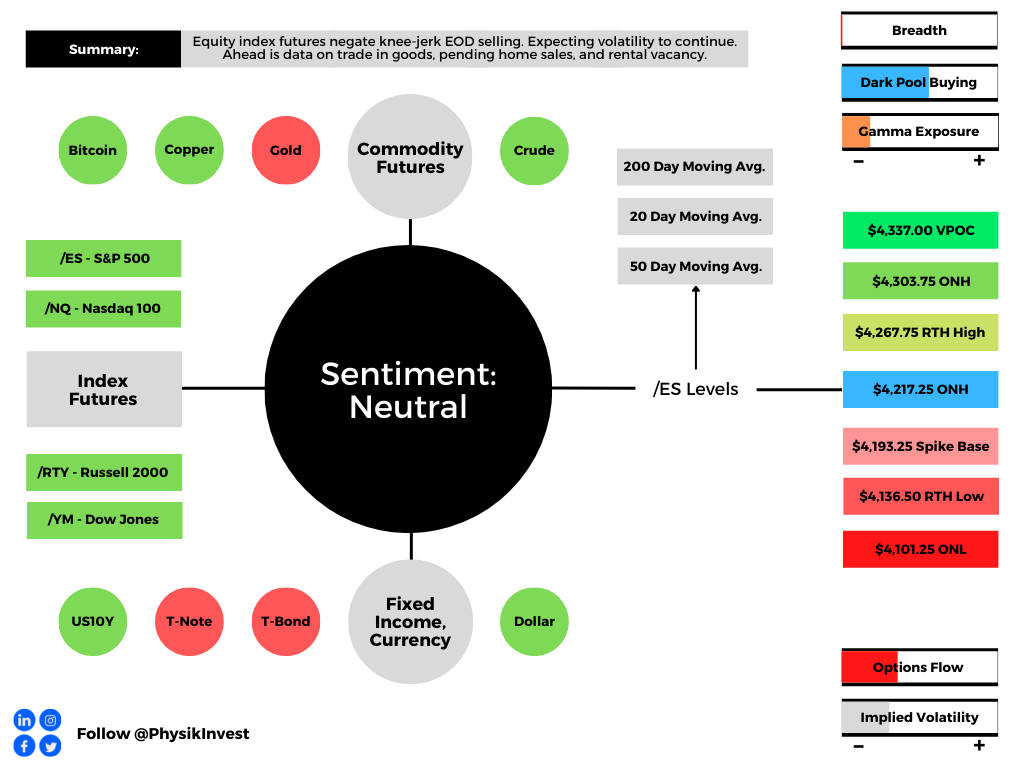
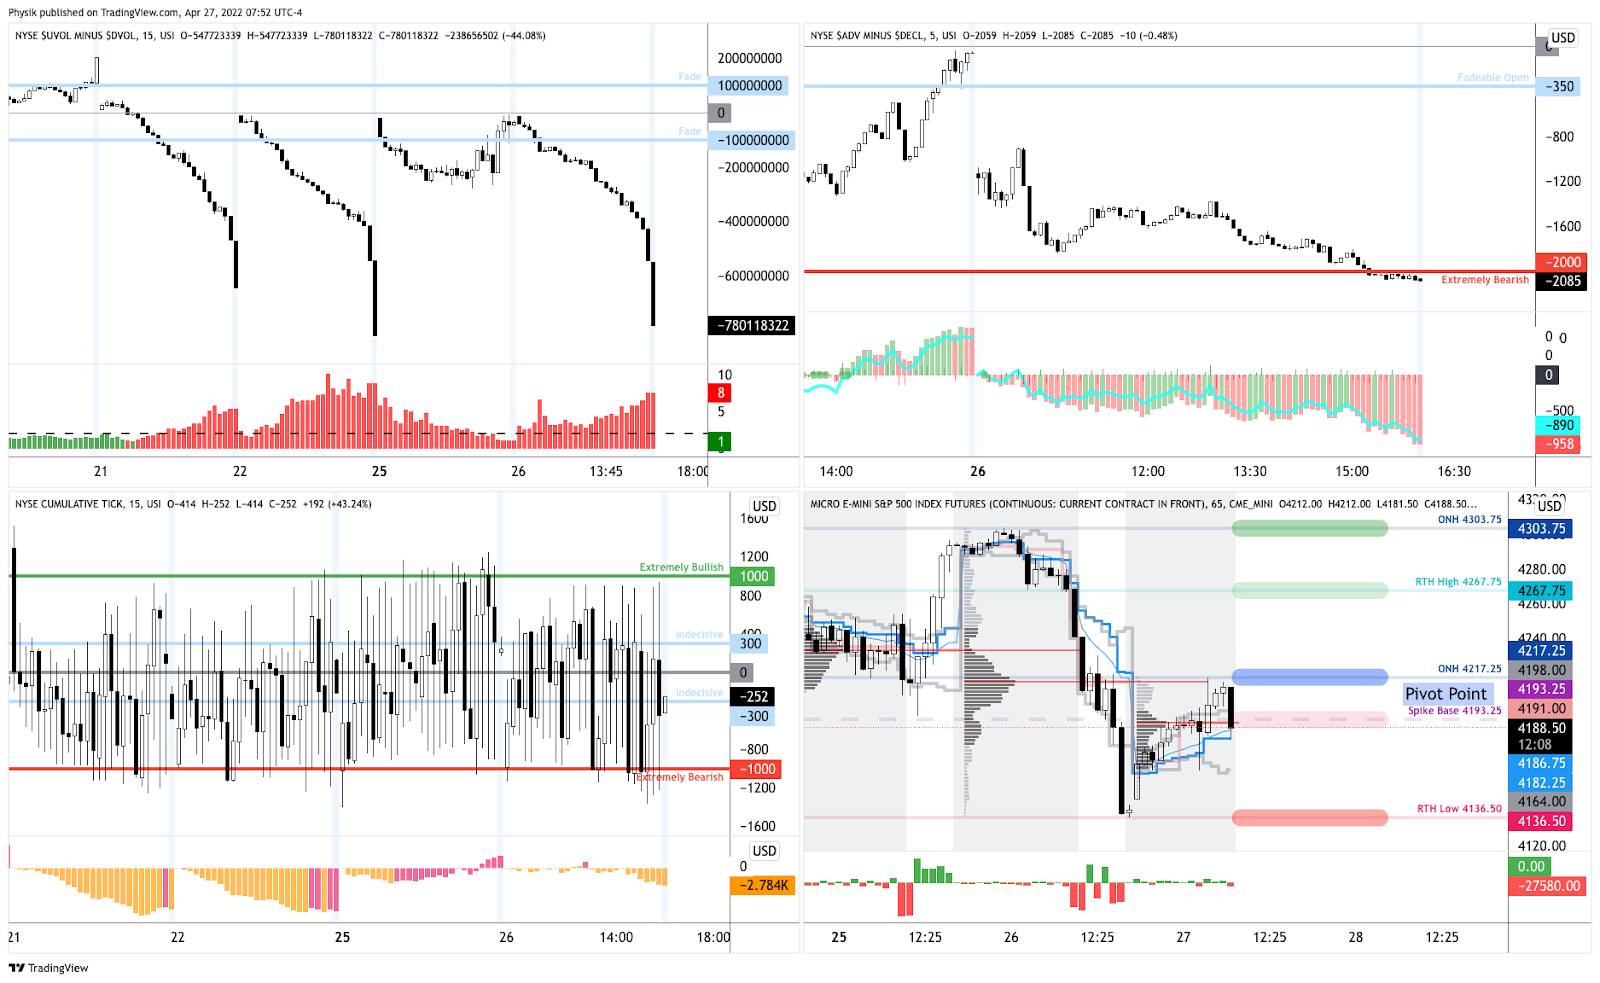
Technical: As of 7:00 AM ET, Wednesday’s regular session (9:30 AM – 4:00 PM ET), in the S&P 500, will likely open in the middle part of a balanced overnight inventory, inside of prior-range and -value, suggesting a limited potential for immediate directional opportunity.

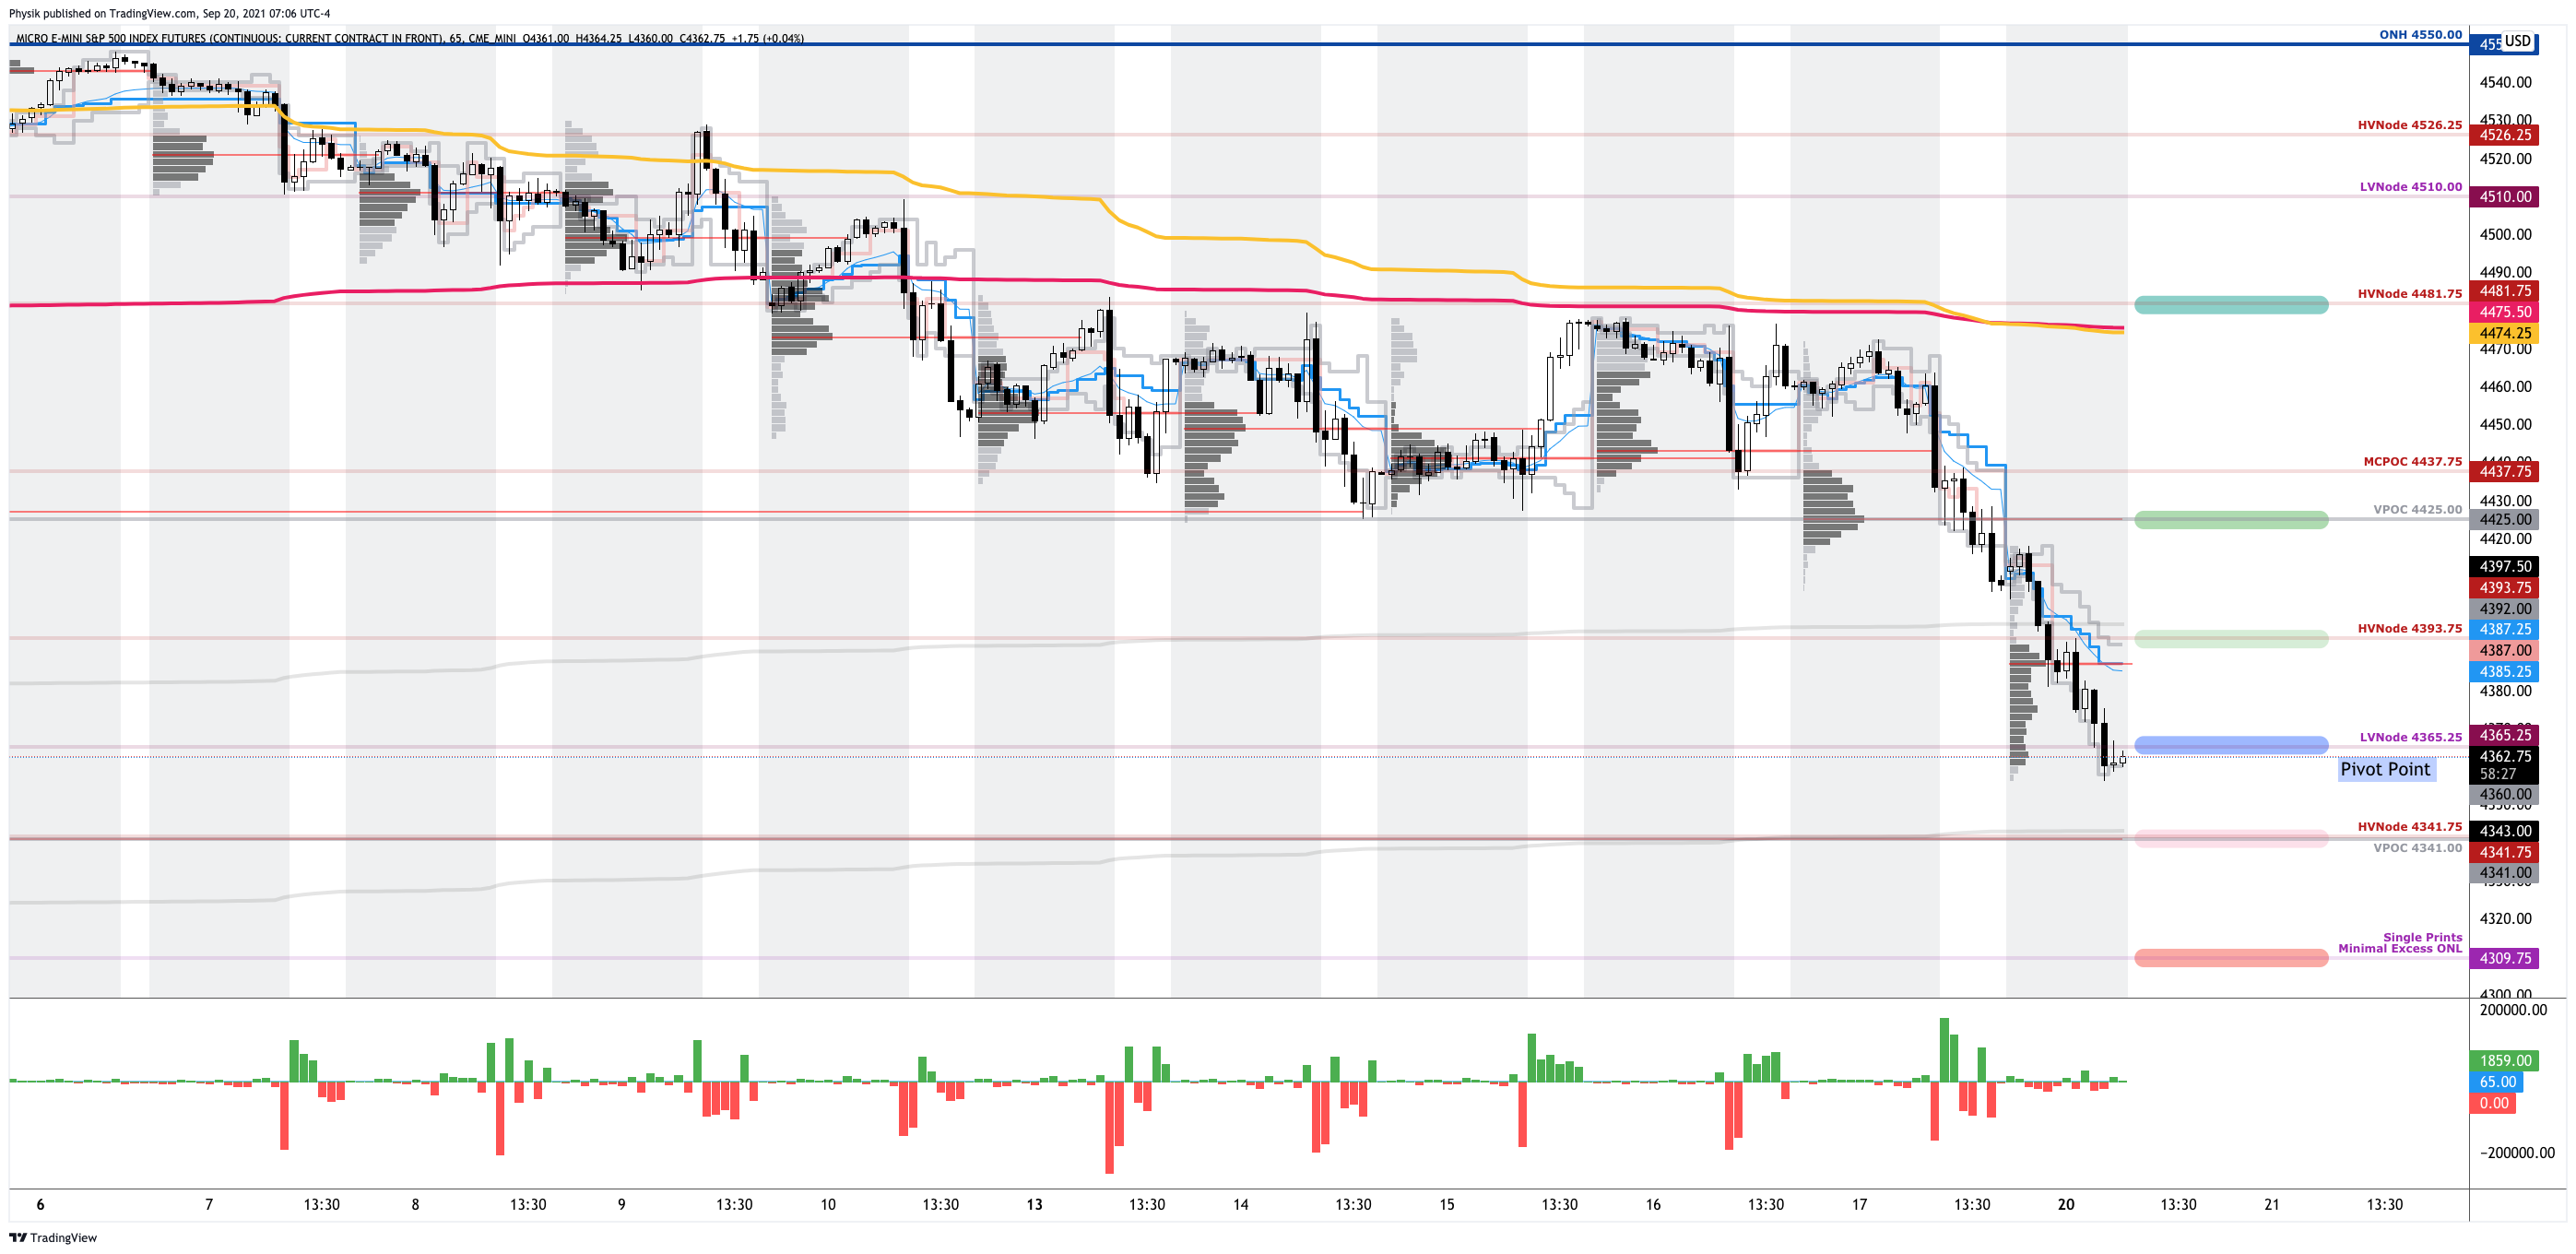
In the best case, the S&P 500 trades higher; activity above the $4,217.25 overnight high (ONH) puts in play the $4,267.75 regular trade high (RTH High). Initiative trade beyond the RTH High could reach as high as the $4,303.75 ONH and $4,337.00 VPOC, or higher.

In the worst case, the S&P 500 trades lower; activity below the $4,217.25 ONH puts in play the $4,193.25 spike base. Initiative trade beyond the spike base could reach as low as the $4,136.50 regular trade low (RTH Low) and $4,101.25 overnight low (ONL), or lower.

Considerations: Spikes mark the beginning of a break from value. Spikes higher (lower) are validated by trade at or above (below) the spike base (i.e., the origin of the spike).

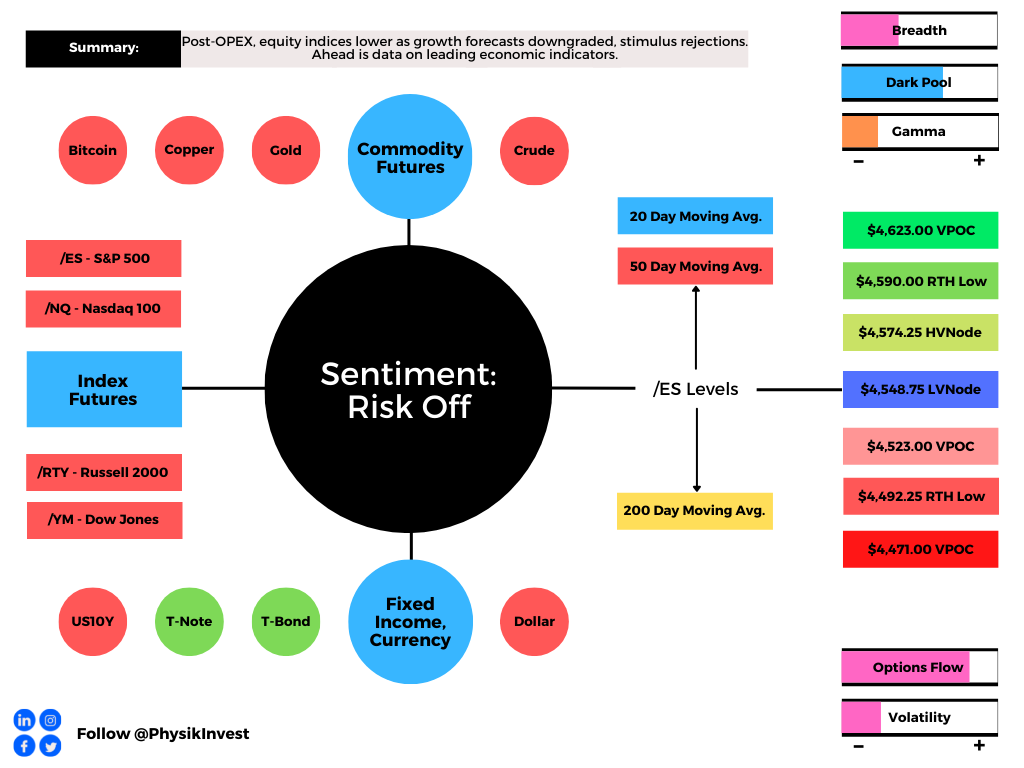
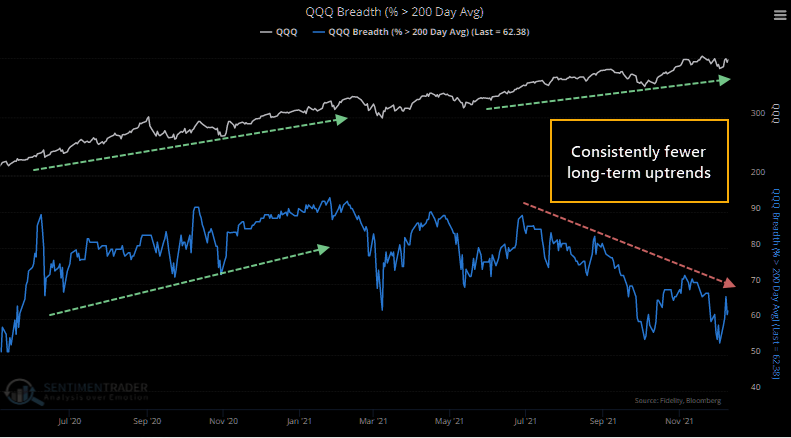
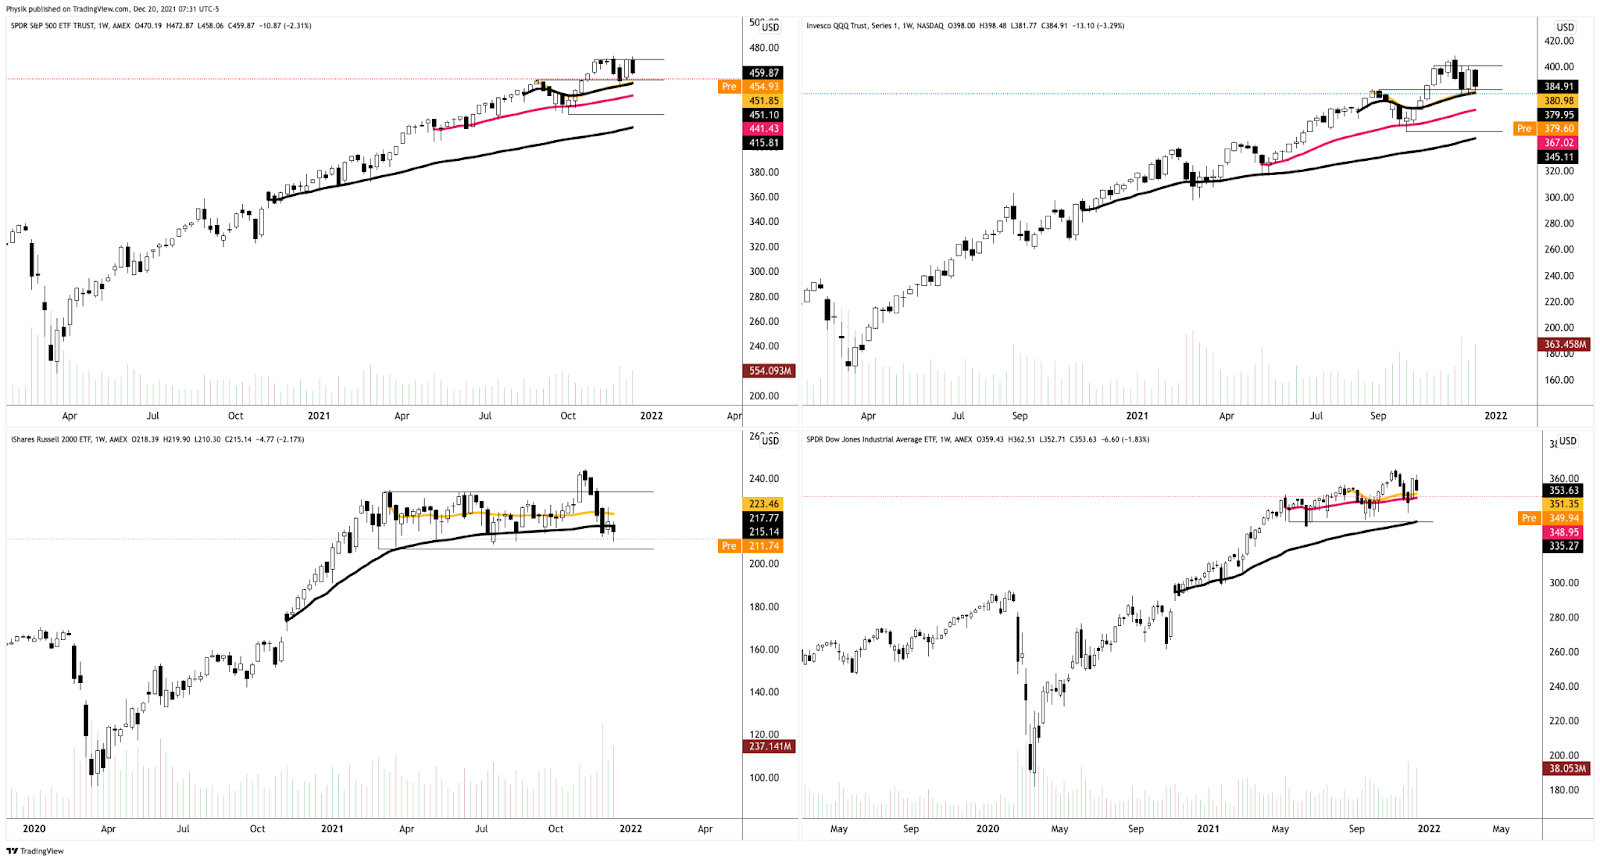
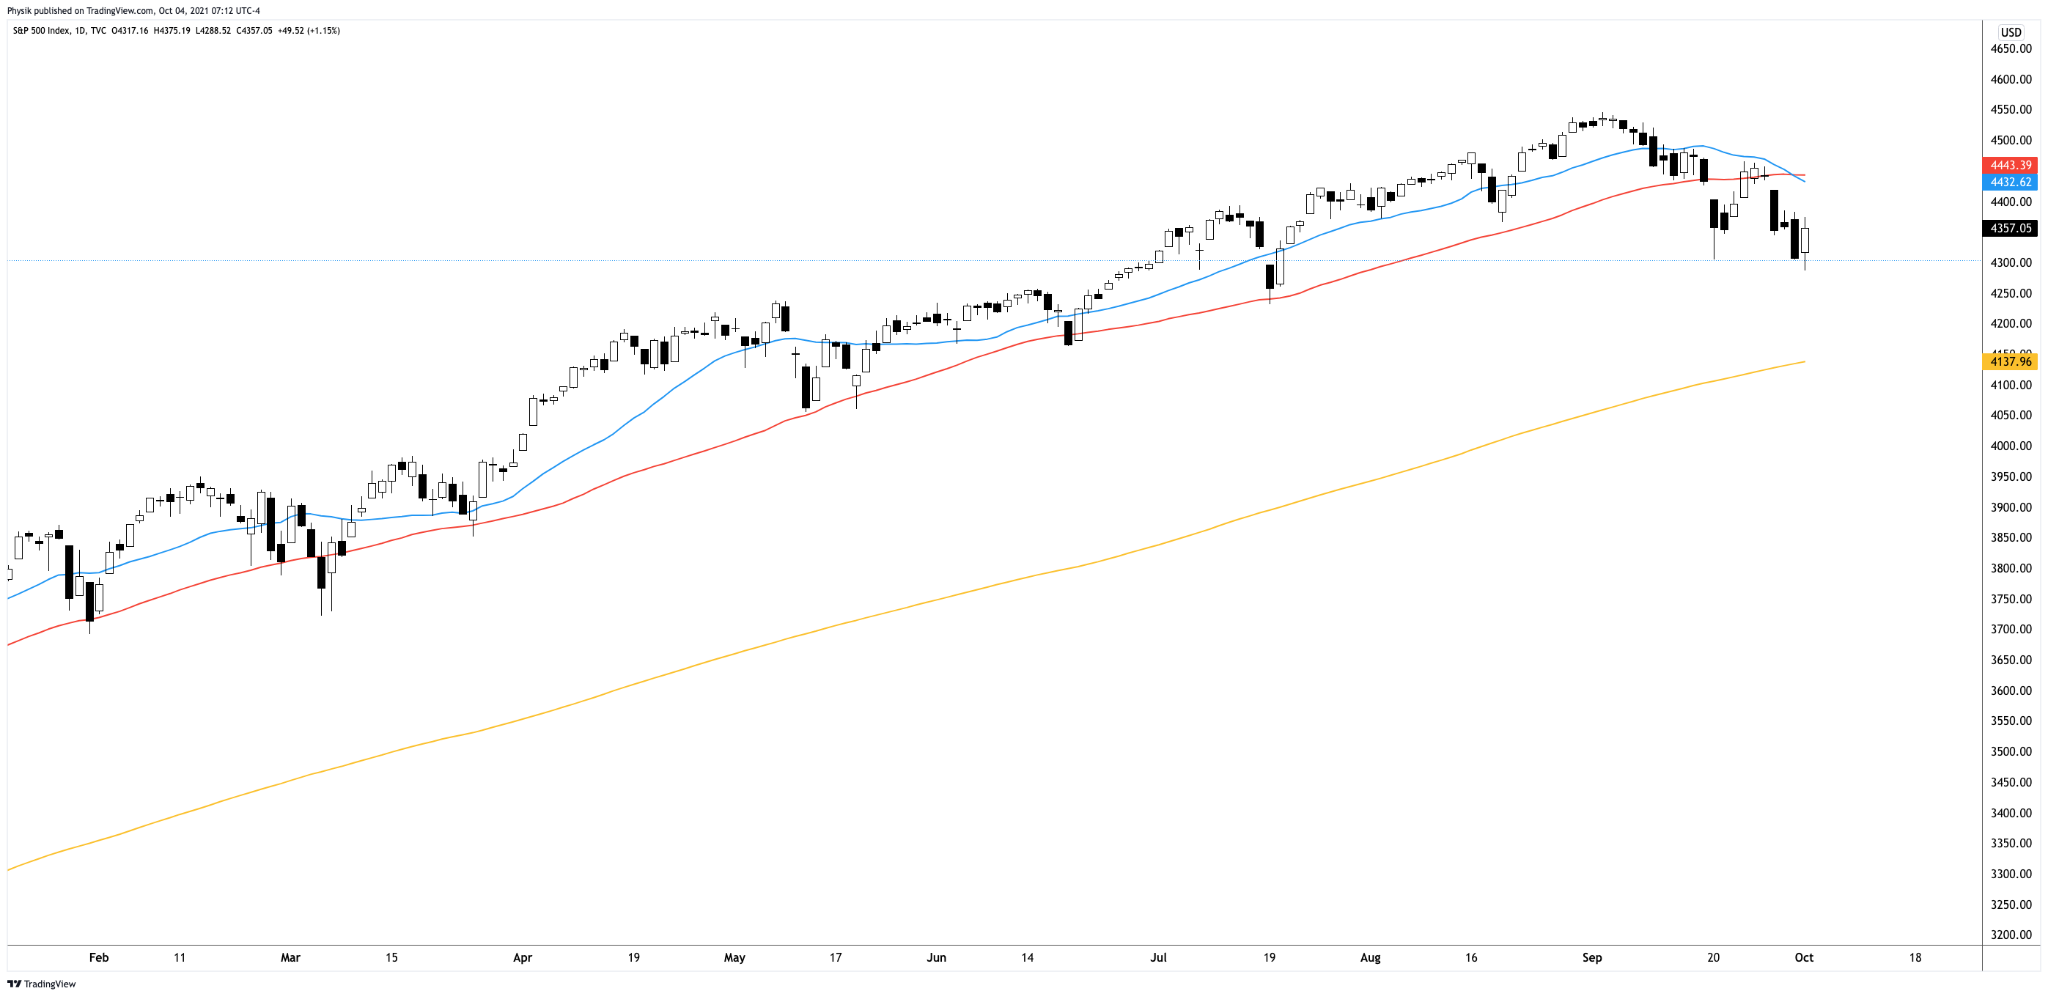
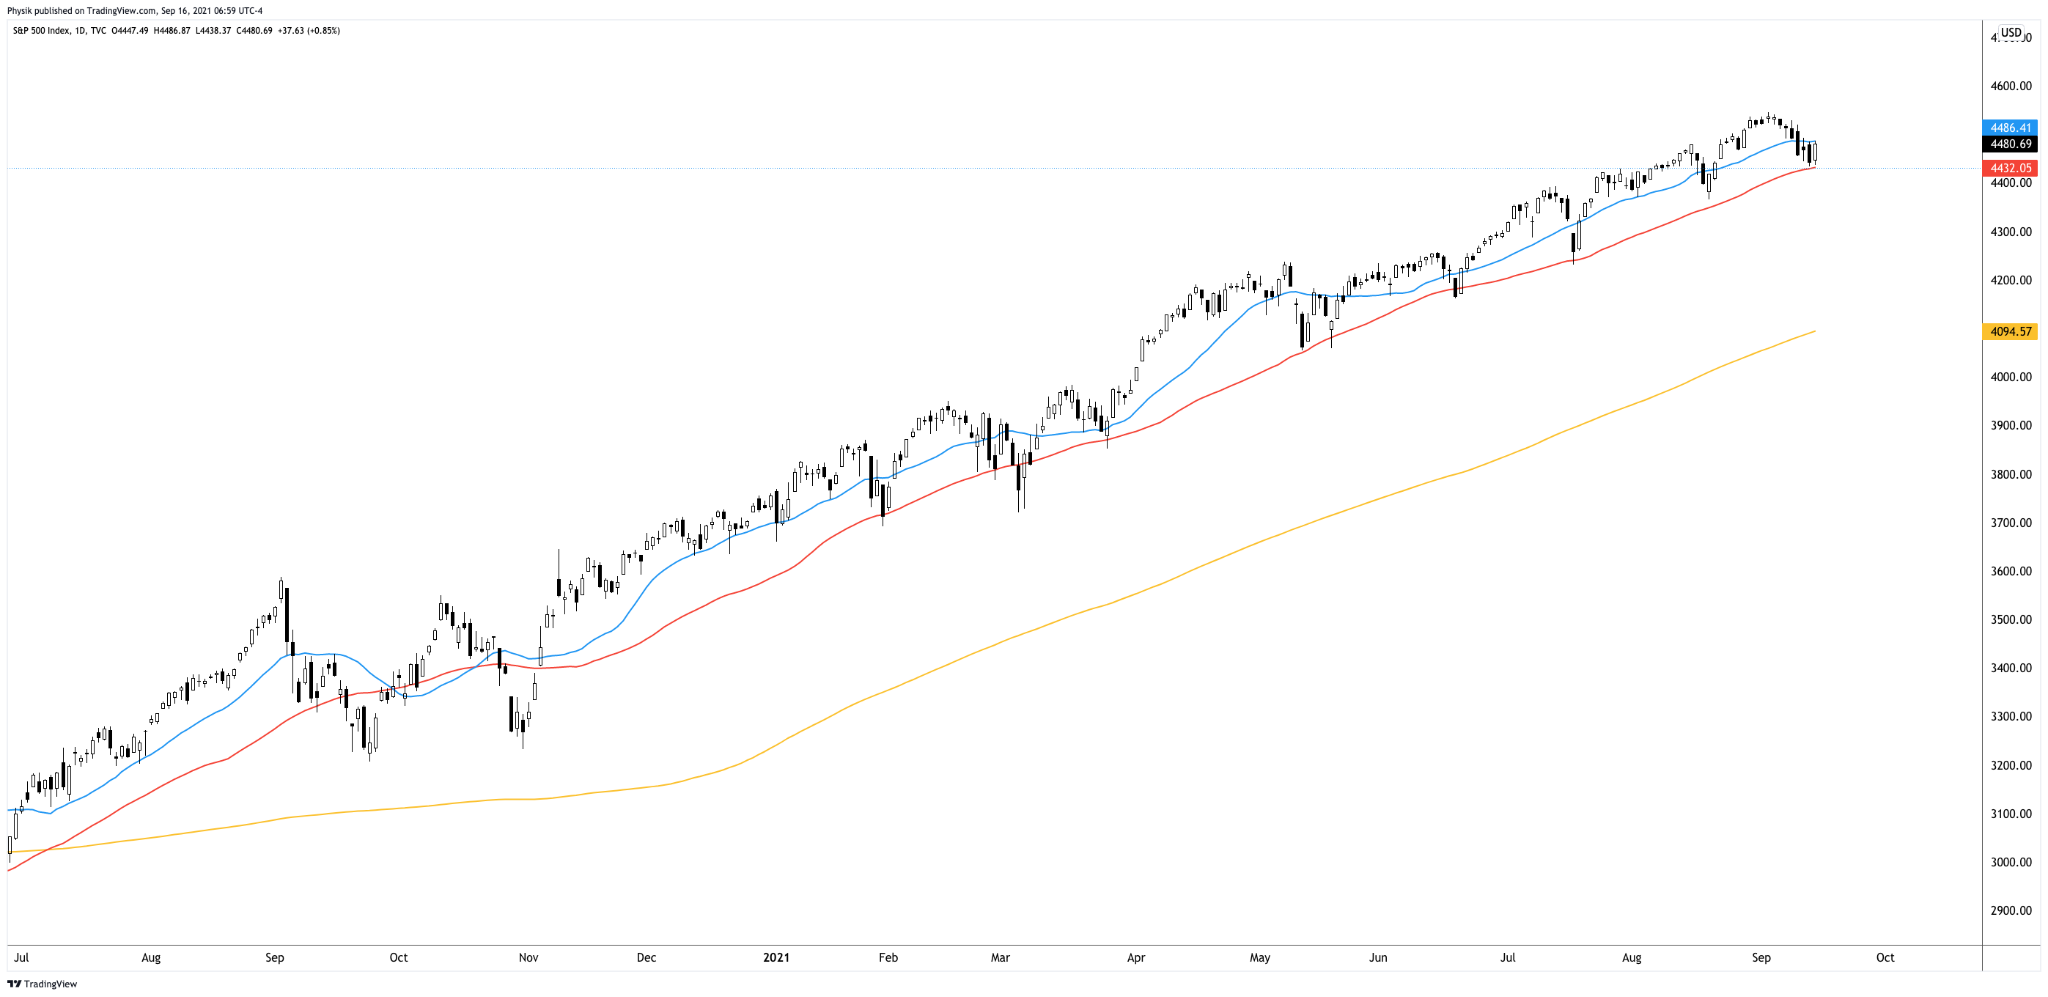
Additionally, the indexes continue to trade below their 20-, 50-, and 200-day simple moving averages, confirming the trend change and bearish tone (further validated by poor breadth).

Graphic: Market Internals as pioneered by (a mentor of mine) Peter Reznicek. Notice the indicator in the top right, weighted S&P sectors (histogram) versus unweighted (blue line). During late last week, participants sold the entire market, heavily (as supported by the difference between the volume flowing into stocks that are up versus those that are down).

All indexes remain, as stated, yesterday, below their volume-weighted average prices (VWAPs) anchored from the start of this year (or their respective peaks). 

VWAPs are a metric highly regarded by chief investment officers (CIOs), among other participants, for quality of trade. Liquidity algorithms, too, are benchmarked and programmed to buy and sell around VWAPs.

The Invesco QQQ Trust Series 1 (NASDAQ: QQQ) just tested a major VWAP, yesterday, anchored from the lows of March 2020. That’s a fair price to pay for Nasdaq 100 exposure.

Graphic: Invesco QQQ Trust Series 1 (NASDAQ: QQQ) with anchored VWAPs.

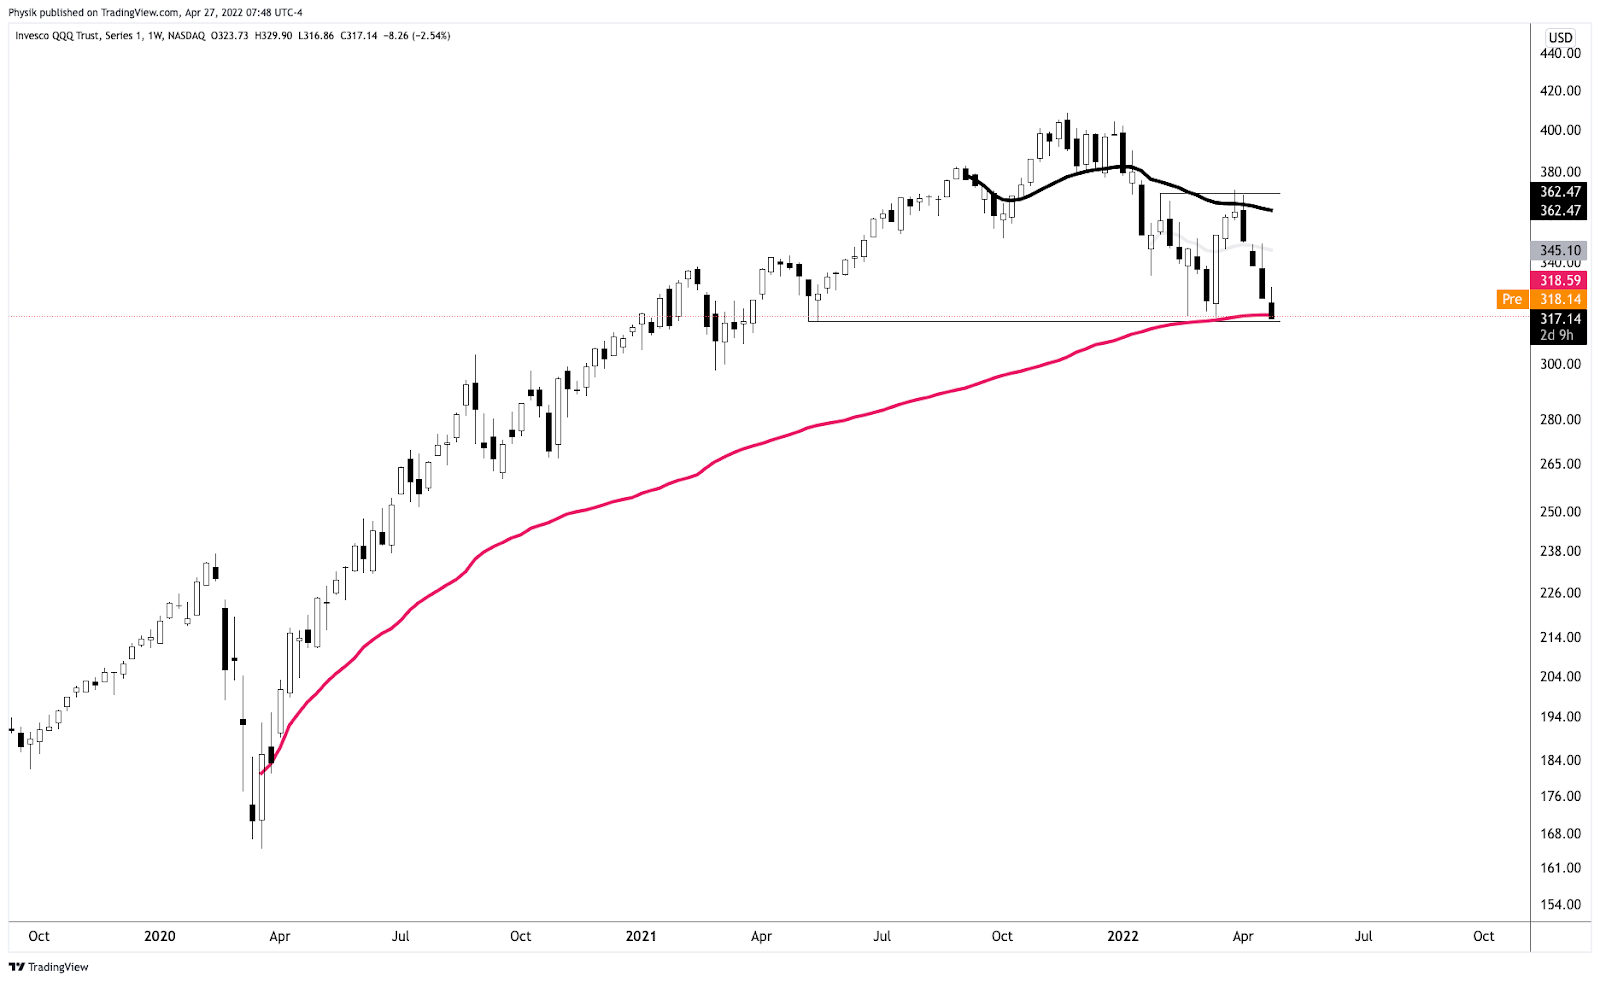
Notwithstanding, notice the flat-to-declining AVWAP that’s black in color. So long as prices remain below this level, the index is likely a sell. 

Should that level flatten (and begin to rise), and if the QQQ was able to trade above it for a sustained period, there is potential for sustained upside.

Click here to load today’s key levels into the web-based TradingView charting platform. Note that all levels are derived using the 65-minute timeframe. New links are produced, daily.
Graphic: 65-minute profile chart of the Micro E-mini S&P 500 Futures.

Definitions

Overnight Rally Highs (Lows): Typically, there is a low historical probability associated with overnight rally-highs (lows) ending the upside (downside) discovery process.

Volume Areas: A structurally sound market will build on areas of high volume (HVNodes). Should the market trend for long periods of time, it will lack sound structure, identified as low volume areas (LVNodes). LVNodes denote directional conviction and ought to offer support on any test. 

If participants were to auction and find acceptance into areas of prior low volume (LVNodes), then future discovery ought to be volatile and quick as participants look to HVNodes for favorable entry or exit.

POCs: POCs are valuable as they denote areas where two-sided trade was most prevalent in a prior day session. Participants will respond to future tests of value as they offer favorable entry and exit.

About

After years of self-education, strategy development, mentorship, and trial-and-error, Renato Leonard Capelj began trading full-time and founded Physik Invest to detail his methods, research, and performance in the markets.

Capelj also develops insights around impactful options market dynamics at SpotGamma and is a Benzinga reporter.

Some of his works include conversations with ARK Invest’s Catherine Wood, investors Kevin O’Leary and John Chambers, FTX’s Sam Bankman-Fried, Kai Volatility’s Cem Karsan, The Ambrus Group’s Kris Sidial, among many others.

Disclaimer

In no way should the materials herein be construed as advice. Derivatives carry a substantial risk of loss. All content is for informational purposes only.

Categories
Commentary

Daily Brief For December 20, 2021

What Happened

Overnight, equity index futures auctioned sideways to lower with growth-heavy and rate-sensitive names bearing the brunt of the move.

This is as Goldman Sachs Group (NYSE: GS) economists reduced their U.S. economic growth expectations, Senator Joe Manchin rejected a $2 trillion tax-and-spending package, hawkish central bank pivots, and rising COVID-19 lockdown risks. 

Ahead is data on leading economic indicators (10:00 AM ET).

Graphic updated 6:40 AM ET. Sentiment Risk-Off if expected /ES open is below the prior day’s range. /ES levels are derived from the profile graphic at the bottom of the following section. Levels may have changed since initially quoted; click here for the latest levels. SqueezeMetrics Dark Pool Index (DIX) and Gamma (GEX) calculations are based on where the prior day’s reading falls with respect to the MAX and MIN of all occurrences available. A higher DIX is bullish. At the same time, the lower the GEX, the more (expected) volatility. Learn the implications of volatility, direction, and moneyness. SHIFT data used for S&P 500 (INDEX: SPX) options activity. Note that options flow is sorted by the call premium spent; if more positive then more was spent on call options. Breadth reflects a reading of the prior day’s NYSE Advance/Decline indicator. VIX reflects a current reading of the CBOE Volatility Index (INDEX: VIX) from 0-100.

What To Expect

Divergent breadth in less heavily-weighted constituents, and what remains of “put-heavy” positioning, coupled with recent fundamental developments, is feeding into lower index prices.

Graphic: Sentimentrader writes: “Fewer than 65% of NDX stocks are currently trading above their 200-day moving averages. That is a stark change from a year ago when internal trends improved as the NDX marched steadily higher.”

Though the December 17 options expiration (OPEX) cleared positive delta and quite a bit of negative delta (e.g., the ARK Innovation ETF [NYSE: ARKK] had $1.5 billion in notional put delta expire) which, in theory, should open a window of strength and realized volatility, wherein positive fundamental forces and dealers’ covering of hedges would bolster any recovery, the January 21 expiry still carries $1.7 billion in notional put delta.

Continued weakness and higher volatility, among other things, likely solicits dealer hedging of exposure to increasing positive delta; weakness has dealers selling against short-dated, increasingly sensitive negative gamma positioning.

With breadth still to recover, a clear expansion of range places the S&P 500 below its 20- and 50-day simple moving averages, the levels which solicited responsive buying by short-term, visual traders who often lack the wherewithal (both emotional and financial) to defend retests.

Graphic: Monthly charts of the S&P 500 (top left), Nasdaq 100 (top right), Russell 2000 (bottom left), Dow Jones Industrial Average (bottom right). All indices come into major support areas.

Context: “The Fed is seen responding to the inflation fears stalking businesses by leaning toward an older playbook of prioritizing the fight against price pressures — even if that risks weaker growth over the longer term,” per Bloomberg.

Notwithstanding, per Nasdaq, “growth in earnings is so far stronger than the multiple compression caused by rising rates,” and that is what has helped support this year’s rally.

Couple that with the management of massive S&P positions, and relentless, seasonally-aligned “passive buying support,” in the face of expectations there will be “the strongest quarterly nominal [economic] growth in more than three decades,” weakness (especially in growth-heavy and rate-sensitive names) remains.

Graphic: Positively skewed return distribution amidst “natural, passive buying,” and supportive positioning metrics. Data SqueezeMetrics. Graph via Physik Invest.

That’s due in part to some of the dynamics discussed in an earlier section, coupled with some negative fundamental developments like the rejection of an economic stimulus package, cuts to Goldman Sachs Group’s GDP forecasts, among other things.

I end with a note from JPMorgan Chase & Co’s (NYSE: JPM) Marko Kolanovic who expects a year-end rally to be driven by stocks targeted by short-sellers. 

“For short-selling campaigns to succeed, there have to be positioning, liquidity and often systematic amplifiers of the selloff,” Kolanovic wrote. 

“We believe these conditions are not met, and hence this market episode may end up in a short squeeze and cyclical rally into year-end and January.” 

That aligns with light positioning, improving seasonality metrics, and data that suggests equity markets tend to rally into the first hike.

Graphic: S&P 500 performance before and after rate hikes.

Expectations: As of 6:40 AM ET, Monday’s regular session (9:30 AM – 4:00 PM ET), in the S&P 500, will likely open in the middle part of a negatively skewed overnight inventory, outside of prior-range and -value, suggesting a potential for immediate directional opportunity.

Gap Scenarios: Gaps ought to fill quickly. Should they not, that’s a signal of strength; do not fade. Leaving value behind on a gap-fill or failing to fill a gap (i.e., remaining outside of the prior session’s range) is a go-with indicator.

Auctioning and spending at least 1-hour of trade back in the prior range suggests a lack of conviction; in such a case, do not follow the direction of the most recent initiative activity.

In the best case, the S&P 500 trades sideways or higher; activity above the $4,548.75 low volume area (LVNode) puts in play the $4,574.25 high volume area (HVNode). Initiative trade beyond the HVNode could reach as high as the $4,590.00 regular trade low (RTH Low) and $4,623.00 untested point of control (VPOC), or higher.

In the worst case, the S&P 500 trades lower; activity below the $4,548.75 LVNode puts in play the $4,523.00 VPOC. Initiative trade beyond the VPOC could reach as low as the $4,492.25 RTH Low and $4,471.00 VPOC, or lower.

Click here to load today’s key levels into the web-based TradingView charting platform. Note that all levels are derived using the 65-minute timeframe. New links are produced, daily.
Graphic: 65-minute profile chart of the Micro E-mini S&P 500 Futures. Learn about the profile.

Definitions

Volume Areas: A structurally sound market will build on areas of high volume (HVNodes). Should the market trend for long periods of time, it will lack sound structure, identified as low volume areas (LVNodes). LVNodes denote directional conviction and ought to offer support on any test. 

If participants were to auction and find acceptance into areas of prior low volume (LVNodes), then future discovery ought to be volatile and quick as participants look to HVNodes for favorable entry or exit.

POCs: POCs are valuable as they denote areas where two-sided trade was most prevalent in a prior day session. Participants will respond to future tests of value as they offer favorable entry and exit.

MCPOCs: POCs are valuable as they denote areas where two-sided trade was most prevalent over numerous day sessions. Participants will respond to future tests of value as they offer favorable entry and exit.

Volume-Weighted Average Prices (VWAPs): A metric highly regarded by chief investment officers, among other participants, for quality of trade. Additionally, liquidity algorithms are benchmarked and programmed to buy and sell around VWAPs.

About

After years of self-education, strategy development, and trial-and-error, Renato Leonard Capelj began trading full-time and founded Physik Invest to detail his methods, research, and performance in the markets.

Additionally, Capelj is a Benzinga finance and technology reporter interviewing the likes of Shark Tank’s Kevin O’Leary, JC2 Ventures’ John Chambers, and ARK Invest’s Catherine Wood, as well as a SpotGamma contributor, helping develop insights around impactful options market dynamics.

Disclaimer

At this time, Physik Invest does not carry the right to provide advice. In no way should the materials herein be construed as advice. Derivatives carry a substantial risk of loss. All content is for informational purposes only.

Categories
Commentary

Daily Brief For December 7, 2021

What Happened

Overnight, screens went green as equity index and commodity futures auctioned sideways to higher as fears regarding the Chinese economy and omicron were assuaged.

Specifically, China moved to ease monetary policy and studies revealed GSK’s antibody treatment working on the COVID-19 omicron variant.

Ahead is data on the trade deficit, productivity, and unit labor costs (8:30 AM ET), as well as consumer credit (3:00 PM ET).

Graphic updated 6:30 AM ET. Sentiment Risk-On if expected /ES open is above the prior day’s range. /ES levels are derived from the profile graphic at the bottom of the following section. Levels may have changed since initially quoted; click here for the latest levels. SqueezeMetrics Dark Pool Index (DIX) and Gamma (GEX) calculations are based on where the prior day’s reading falls with respect to the MAX and MIN of all occurrences available. A higher DIX is bullish. At the same time, the lower the GEX, the more (expected) volatility. Learn the implications of volatility, direction, and moneyness. SHIFT data used for S&P 500 (INDEX: SPX) options activity. Note that options flow is sorted by the call premium spent; if more positive then more was spent on call options. Breadth reflects a reading of the prior day’s NYSE Advance/Decline indicator. VIX reflects a current reading of the CBOE Volatility Index (INDEX: VIX) from 0-100.

What To Expect

On supportive intraday breadth and divergent market liquidity metrics, the best case outcome occurred, evidenced by an upside gap, expansion of range, and separation of value.

This activity, which marks participants’ willingness to change the trend, is on top of poor structure, a dynamic that adds to technical instability.

Specifically, Monday’s session left a gap and p-shaped emotional, multiple-distribution profile structure (i.e., old-money shorts covering).

Going forward, participants will look to revisit, repair, and strengthen – build out areas of high volume (HVNodes) via the cave-fill process – these areas of low volume (LVNodes).

Graphic: Divergent delta (i.e., non-committed buying as measured by volume delta or buying and selling power as calculated by the difference in volume traded at the bid and offer) in SPDR S&P 500 ETF Trust (NYSE: SPY), one of the largest ETFs that track the S&P 500 index, via Bookmap. The readings are supportive of responsive trade (i.e., rotational trade that suggested current prices offered favorable entry and exit).

Context: COVID-19, China, and U.S. growth, as well as improvements in positioning metrics.

Overnight, there was news that GlaxoSmithKline Plc’s research showed its antibody treatment effective against mutations in the omicron variant.

This came after China’s decision to reduce the cash banks must hold in reserves; the development releases “funds in long-term liquidity to bolster slowing economic growth.”

As noted yesterday, though there is a potential that the U.S. realizes the swiftest tightening in financial conditions since 2005, now, more than during the tech-and-telecom bubble, do rates and earnings growth support current valuations.

At the same time, DIX, which is derived from short sales (i.e., liquidity provision on the market-making side), pointed to “natural, passive buying support,” while negative gamma exposures (i.e., an environment characterized by options dealers hedging their exposure by selling into lows and buying into highs), as a result of increased demand for very short-dated downside protection, left the market prone to destabilizing volatility. 

Graphic: Sensitivity in the VIX term structure, at the front end, suggests heightened activity in shorter-dated protection. As we’re starting to see, once that short-dated protection rolls off the table (and/or is monetized), counterparties/dealers will reverse and support the market, buying to close their existing stock/futures hedges.

Taken together, the distribution of forward S&P 500 returns was skewed positive, heading into Monday’s session.

Subsequent price action, after participants’ powerful responsive buying at the S&P 500’s 50-day simple moving average, which coincided with a large base of resting liquidity at $4,500.00, is follow-through on indices being positioned for a vicious rebound.

Graphic: “[N]atural, passive buying support,” coupled with strong put flows results in positive return distribution. Data via SqueezeMetrics. Graph via Physik Invest.

To tame our expectations, I end with a statement from Morgan Stanley (NYSE: MS) research: 

“We reiterate our view that tapering is tightening for the markets and it will lead to lower valuations like it always does at this stage of any recovery. How much lower? We forecast S&P 500 forward P/Es to fall to 18x, or approximately 12% below current levels. Obviously, for the more expensive parts of the market, that decline will be larger.”

Expectations: As of 6:30 AM ET, Monday’s regular session (9:30 AM – 4:00 PM ET), in the S&P 500, will likely open in the upper part of a positively skewed overnight inventory, outside of prior-range and -value, suggesting a potential for immediate directional opportunity.

Gap Scenarios: Gaps ought to fill quickly. Should they not, that’s a signal of strength; do not fade. Leaving value behind on a gap-fill or failing to fill a gap (i.e., remaining outside of the prior session’s range) is a go-with indicator.

Auctioning and spending at least 1-hour of trade back in the prior range suggests a lack of conviction; in such a case, do not follow the direction of the most recent initiative activity.

In the best case, the S&P 500 trades sideways or higher; activity above the $4,647.25 HVNode puts in play the $4,674.25 micro composite point of control (MCPOC)

Initiative trade beyond the MCPOC could reach as high as the $4,691.25 HVNode and $4,707.00 LVNode, or higher.

In the worst case, the S&P 500 trades lower; activity below the $4,647.25 HVNode puts in play the $4,618.75 HVNode

Initiative trade beyond the latter could reach as low as the $4,581.00 untested point of control (VPOC) and $4,551.75 LVNode, or lower.

Click here to load today’s updated key levels into the web-based TradingView charting platform. Note that all levels are derived using the 65-minute timeframe. New links are produced, daily.
Graphic: 65-minute profile chart of the Micro E-mini S&P 500 Futures. Learn about the profile.

What People Are Saying

Definitions

Cave-Fill Process: Widened the area deemed favorable to transact at by an increased share of participants. This is a good development.

Volume Areas: A structurally sound market will build on areas of high volume (HVNodes). Should the market trend for long periods of time, it will lack sound structure, identified as low volume areas (LVNodes). LVNodes denote directional conviction and ought to offer support on any test. 

If participants were to auction and find acceptance into areas of prior low volume (LVNodes), then future discovery ought to be volatile and quick as participants look to HVNodes for favorable entry or exit.

POCs: POCs are valuable as they denote areas where two-sided trade was most prevalent in a prior day session. Participants will respond to future tests of value as they offer favorable entry and exit.

MCPOCs: POCs are valuable as they denote areas where two-sided trade was most prevalent over numerous day sessions. Participants will respond to future tests of value as they offer favorable entry and exit.

Value-Area Placement: Perception of value unchanged if value overlapping (i.e., inside day). Perception of value has changed if value not overlapping (i.e., outside day). Delay trade in the former case.

About

After years of self-education, strategy development, and trial-and-error, Renato Leonard Capelj began trading full-time and founded Physik Invest to detail his methods, research, and performance in the markets.

Additionally, Capelj is a Benzinga finance and technology reporter interviewing the likes of Shark Tank’s Kevin O’Leary, JC2 Ventures’ John Chambers, and ARK Invest’s Catherine Wood, as well as a SpotGamma contributor, developing insights around impactful options market dynamics.

Disclaimer

At this time, Physik Invest does not manage outside capital and is not licensed. In no way should the materials herein be construed as advice. Derivatives carry a substantial risk of loss. All content is for informational purposes only.

Categories
Commentary

Daily Brief For December 6, 2021

What Happened

Overnight, equity index futures auctioned sideways to higher after Friday’s liquidation had the S&P 500 undercutting its 50-day simple moving average (SMA), a visual go/no-go level.

Strength shifted, again, to the Russell 2000 while the tech-heavy Nasdaq 100 was underwater. This comes as policymakers look to temper inflation with the tightening of monetary policy.

In regards to news, China’s central bank looked to boost liquidity for its slowing economy. It was also found that a new virus variant was not fueling a surge in hospitalizations; the U.S.’s adviser on the issue, Anthony Fauci, said there wasn’t “a great degree of severity to omicron.”

That didn’t stop the economists at Goldman Sachs Group Inc (NYSE: GS) from cutting their forecasts for U.S. GDP next year; the estimates were revised down on an expectation the omicron strain would drag growth.

Ahead are no important releases on fundamental data.

Graphic updated 6:30 AM ET. Sentiment Neutral if expected /ES open is inside of the prior day’s range. /ES levels are derived from the profile graphic at the bottom of the following section. Levels may have changed since initially quoted; click here for the latest levels. SqueezeMetrics Dark Pool Index (DIX) and Gamma (GEX) calculations are based on where the prior day’s reading falls with respect to the MAX and MIN of all occurrences available. A higher DIX is bullish. At the same time, the lower the GEX, the more (expected) volatility. Learn the implications of volatility, direction, and moneyness. SHIFT data used for S&P 500 (INDEX: SPX) options activity. Note that options flow is sorted by the call premium spent; if more positive then more was spent on call options. Breadth reflects a reading of the prior day’s NYSE Advance/Decline indicator. VIX reflects a current reading of the CBOE Volatility Index (INDEX: VIX) from 0-100.

What To Expect

On weak intraday breadth and divergent market liquidity metrics, the worst outcome occurred; there was an expansion of range, to the downside, and participants spent the majority of the session building value at lower prices (i.e., levels at which 70% of that day’s volume occurred).

The lower bound of Friday’s range was $4,500.00 or so, at which the 50-day SMA corresponded with a large base of resting liquidity. 

To note, the 50-day is visual level at which short-term, technically-driven participants were likely buying in response to probes below developing balance. 

Successfully auctioning beneath the 50-day is a concern. Those short-term participants lack the wherewithal (both emotional and financial) to defend retests.

Continuation lower, in such a case, is likely.

Graphic: Divergent delta (i.e., non-committed selling as measured by volume delta or buying and selling power as calculated by the difference in volume traded at the bid and offer) in SPDR S&P 500 ETF Trust (NYSE: SPY), one of the largest ETFs that track the S&P 500 index, via Bookmap. The readings are supportive of responsive trade (i.e., rotational trade that suggests current prices offer favorable entry and exit; the market is in balance).

Context: The Fed’s intent to moderate stimulus and uncertainty with regards to how a new COVID-19 variant will impact the global recovery.

According to Bloomberg, “the Fed is seen responding to the inflation fears stalking businesses by leaning toward an older playbook of prioritizing the fight against price pressures — even if that risks weaker growth over the longer term.”

In line with the aforementioned, traders already started pricing in potential rate overshoots with the “December 2024 eurodollar yields [rising] above December 2025 contracts, a curve inversion that signals expectations the central bank may consider cutting rates in 2025.”

The result is that the U.S. may realize the swiftest tightening in financial conditions since 2005 if the Fed was to hike rates three times next year.

Graphic: Via Bloomberg, trades price in a rapid increase in the real Fed rate.

This development carries weight; now, more than during the tech-and-telecom bubble, low rates support current valuations.

Graphic: Low rates support current valuations better than the ‘90s, according to Nasdaq.

The reason being? 

“Lower interest rates lead to future cashflow discounting less – leading to higher valuations. From another perspective, a company with a 5% profit margin is a much more attractive investment when long-term borrow costs are less than 2%, as they are now than when it costs 5%-7% to borrow money back in the ‘90s.”

The Fed’s intent to taper faster, and eventually hike rates, just as liquidity conditions have deteriorated, pushed “the orange dot [in the above graphic] toward the right during the year.”

Notwithstanding, “growth in earnings is so far stronger than the multiple compression caused by rising rates (blue line),” and that is helping support this year’s rally.

The intent to moderate stimulus is likely to serve as a headwind; there’s always a possibility of unanticipated policy adjustments, in the face of a resurgent COVID-19 digging further into the economy’s growth.

That’s partially why we saw Goldman Sachs cut their forecasts for GDP. 

Graphic: Via The Market Ear. Goldman Sachs cut its forecast for GDP.

But, for every negative view, there is a positive (either by the same institution or a competitor).

We see JPMorgan Chase & Co (NYSE: JPM), among others, doubling down on their bullishness.

“We are calling for another year of positive earnings surprises, relative to current consensus estimates.”

Similarly, the market may shrug off omicron just as it did beta and delta

Graphic: Via The Market Ear, the market shrugs off COVID-19 variants with ease.

And, despite the market’s trade in short-gamma (a “negative [gamma] implies the opposite [selling into lows, buying into highs], thus magnifying market volatility”) destabilizing demand for downside protection is concentrated in shorter-dated options

Graphic: A roll lower in the VIX term structure brings in supportive flows. Via The Market Ear.

Once that short-dated protection rolls off the table (and/or is monetized), counterparties will quickly reverse and support the market, buying to close their existing stock/futures hedges.

This flow is stabilizing and may play into a seasonally-aligned rally into Christmas as participants see defenses rolled out against the new COVID-19 variant, and the positive effects of pro-cyclical inflation, economic growth, and improvements in global trade.

Such development plays into a thesis held by Moody’s Corporation (NYSE: MCO). 

“The forecast is that the Dow Jones Industrial Average increases this quarter and peaks in early 2022. However, the rest of the contours of the forecast didn’t change. We expect the DJIA to steadily decline throughout 2022, but because it will now peak later than previously thought, the level of the DJIA will be higher at the end of next year and over the near-term forecast.”

Similarly, here are some views by Morgan Stanley (NYSE: MS), compiled by The Market Ear. 

“The Morgan Stanley’s Global Risk Demand Index (GRDI) [fell] to a 10Y low reading of -4.2SD, last Friday (currently -3.SD). Historically, such a level has proved to be a solid buy signal over the next 3m. Other signs that investor sentiment has overshot to the downside include the VIX > 30, a steep put-call skew, and the AAII survey where 42% of respondents are bearish (90th percentile reading). Over the last decade, MSCI ACWI has risen 98% of the time over the next 3m post this signal and by an average of 10%.”

Expectations: As of 6:30 AM ET, Monday’s regular session (9:30 AM – 4:00 PM ET), in the S&P 500, will likely open in the middle part of a positively skewed overnight inventory, inside of prior-range and -value, suggesting a limited potential for immediate directional opportunity.

Balance-Break Scenarios: A change in the market (i.e., the transition from two-time frame trade, or balance, to one-time frame trade, or trend) may occur.

Monitor for acceptance (i.e., more than 1-hour of trade) outside of the developing balance area. Rejection (i.e., return inside of balance) portends a move to the opposite end of the balance.

In the best case, the S&P 500 trades sideways or higher; activity above the $4,523.00 untested point of control (VPOC) puts in play the $4,551.75 low volume area (LVNode). Initiative trade beyond the LVNode could reach as high as the $4,574.25 high volume area (HVNode) and $4,590.00 balance area high (BAH), or higher.

In the worst case, the S&P 500 trades lower; activity below the $4,523.00 VPOC puts in play the $4,492.25 regular trade low (RTH Low). Initiative trade beyond the RTH Low could reach as low as the $4,471.00 and $4,425.00 VPOC, or lower.

Click here to load today’s updated key levels into the web-based TradingView charting platform. Note that all levels are derived using the 65-minute timeframe. New links are produced, daily.
Graphic: 65-minute profile chart of the Micro E-mini S&P 500 Futures. Learn about the profile.

What People Are Saying

Definitions

Volume Areas: A structurally sound market will build on areas of high volume (HVNodes). Should the market trend for long periods of time, it will lack sound structure, identified as low volume areas (LVNodes). LVNodes denote directional conviction and ought to offer support on any test. 

If participants were to auction and find acceptance into areas of prior low volume (LVNodes), then future discovery ought to be volatile and quick as participants look to HVNodes for favorable entry or exit.

Liquidation Breaks: The profile shape suggests participants were “too” long and had poor location.

POCs: POCs are valuable as they denote areas where two-sided trade was most prevalent in a prior day session. Participants will respond to future tests of value as they offer favorable entry and exit.

About

After years of self-education, strategy development, and trial-and-error, Renato Leonard Capelj began trading full-time and founded Physik Invest to detail his methods, research, and performance in the markets.

Additionally, Capelj is a Benzinga finance and technology reporter interviewing the likes of Shark Tank’s Kevin O’Leary, JC2 Ventures’ John Chambers, and ARK Invest’s Catherine Wood, as well as a SpotGamma contributor, developing insights around impactful options market dynamics.

Disclaimer

At this time, Physik Invest does not manage outside capital and is not licensed. In no way should the materials herein be construed as advice. Derivatives carry a substantial risk of loss. All content is for informational purposes only.

Categories
Commentary

Daily Brief For October 4, 2021

Market Commentary

Equity index futures were sideways to lower with bonds and the dollar.

  • Nordea: Macro backdrop worsens.
  • Ahead is a relatively light calendar.
  • October is volatile while Q4 bullish.

What Happened: U.S. stock index futures auctioned sideways to lower overnight alongside reports that China was showing little interest in a direct bailout of Evergrande and U.S. political leaders remain at odds on the debt limit.

Ahead is data on factory orders and core capital goods orders (10:00 AM ET).

Graphic updated 6:30 AM ET. Sentiment Neutral if expected /ES open is inside of the prior day’s range. /ES levels are derived from the profile graphic at the bottom of the following section. SqueezeMetrics Dark Pool Index (DIX) and Gamma (GEX) calculations are based on where the prior day’s reading falls with respect to the MAX and MIN of all occurrences available. A higher DIX is bullish. At the same time, the lower the GEX, the more (expected) volatility. SHIFT data used for S&P 500 (INDEX: SPX) options activity. Note that options flow is sorted by the call premium spent; if more positive then more was spent on call options. Breadth reflects a reading of the prior day’s NYSE Advance/Decline indicator. VIX reflects a current reading of the CBOE Volatility Index (INDEX: VIX) from 0-100.

What To Expect: As of 6:30 AM ET, Monday’s regular session (9:30 AM – 4:00 PM EST) in the S&P 500 will likely open inside of prior-range and -value, suggesting a limited potential for immediate directional opportunity.

Adding, during the prior day’s regular trade, on a strengthening of intraday breadth, among other metrics including positioning measures, the best case outcome occurred, evidenced by a recovery of Thursday’s $4,365.00 untested point of control (VPOC). 

Given the overnight response at the top of Friday’s value area – the bulk of where trade was conducted – it looks as though participants are interested in slowing the pace of downside discovery. 

Still, the S&P 500 is well below its 20- and 50-day simple moving averages and multiple distribution profile structures denote emotion, as well as a lack of commitment

Graphic: S&P 500 daily chart with 20-, 50-, and 200-day simple moving average.

Further, the aforementioned trade is happening in the context of a traditionally volatile October and a fraying in the buy-the-dip psychology.

According to Nordea, despite a calm, upward-sloping term structure, there has been “a slightly upward tilting trend” in futures tracking the S&P 500 volatility index, likely warranted by several macro reasons including a worsening in liquidity, a slowdown in growth, cost/margin problems, and risks to the Fed put.

Graphic: Fed’s GDPNow estimate lowers expectations for U.S. economic growth, via The Market Ear

LPL Research adds that aside from October, no other month has seen more 1% moves, and the fourth quarter is “historically the best for stocks, with the third quarter the worst.”

Graphic: LPL Research unpacks S&P 500 seasonality. 

Moreover, for today, given expectations of heightened volatility, participants may make use of the following frameworks.

In the best case, the S&P 500 trades sideways or higher; activity above the $4,332.25 low volume area (LVNode) puts in play the $4,363.25 high volume area (HVNode). Initiative trade beyond the HVNode could reach as high as the $4,410.25 LVNode and $4,437.75 micro composite point of control (MCPOC), or higher.

In the worst case, the S&P 500 trades lower; activity below the $4,332.25 LVNode puts in play the $4,299.00 VPOC. Initiative trade beyond the VPOC could reach as low as $4,260.00 overnight low (ONL) and $4,233.00 VPOC, or lower.

Graphic: 65-minute profile chart of the Micro E-mini S&P 500 Futures updated 6:30 AM ET.

Definitions

Overnight Rally Highs (Lows): Typically, there is a low historical probability associated with overnight rally-highs (lows) ending the upside (downside) discovery process.

Volume Areas: A structurally sound market will build on areas of high volume (HVNodes). Should the market trend for long periods of time, it will lack sound structure, identified as low volume areas (LVNodes). LVNodes denote directional conviction and ought to offer support on any test. 

If participants were to auction and find acceptance into areas of prior low volume (LVNodes), then future discovery ought to be volatile and quick as participants look to HVNodes for favorable entry or exit.

POCs: POCs are valuable as they denote areas where two-sided trade was most prevalent in a prior day session. Participants will respond to future tests of value as they offer favorable entry and exit.

MCPOCs: POCs are valuable as they denote areas where two-sided trade was most prevalent over numerous day sessions. Participants will respond to future tests of value as they offer favorable entry and exit.

Responsive Buying (Selling): Buying (selling) in response to prices below (above) an area of recent price acceptance.

Price Discovery (One-Timeframe Or Trend): Elongation and range expansion denotes a market seeking new prices to establish value, or acceptance (i.e., more than 30-minutes of trade at a particular price level).

News And Analysis

EM bond markets continue to grow, as do vulnerabilities.

There’s is no inflation without income; there’s no income.

Action on Evergrande to avoid financial, social instability.

Global growth steady as delta spurs big regional swings.

Doomsday clock for U.S. debt ticks on political clashings.

Global Credit Conditions Q4: supply strain, inflation pain.

What People Are Saying

About

After years of self-education, strategy development, and trial-and-error, Renato Leonard Capelj began trading full-time and founded Physik Invest to detail his methods, research, and performance in the markets. 

Additionally, Capelj is a finance and technology reporter. Some of his biggest works include interviews with leaders such as John Chambers, founder and CEO, JC2 Ventures, Kevin O’Leary, businessman and Shark Tank host, Catherine Wood, CEO and CIO, ARK Invest, among others.

Disclaimer

At this time, Physik Invest does not manage outside capital and is not licensed. In no way should the materials herein be construed as advice. Derivatives carry a substantial risk of loss. All content is for informational purposes only.

Categories
Commentary

Daily Brief For September 21, 2021

Market Commentary

Equity index futures trade higher with commodities and yields. Volatility ebbs. 

  • Ahead is a 2-day FOMC meeting.
  • SPX below balance, 50-day SMA.
  • Conditions slowly start improving.

What Happened: End of day rally continued overnight with U.S. stock index futures negating much of yesterday’s liquidation. This comes alongside news questioning Evergrande’s ability to make good on its liabilities, as well as the Federal Reserve’s two-day policy meeting.

Ahead is data on building permits, housing starts, and the current account (8:30 AM ET).

Graphic updated 6:40 AM ET. Sentiment Risk-On if expected /ES open is above the prior day’s range. /ES levels are derived from the profile graphic at the bottom of the following section. SqueezeMetrics Dark Pool Index (DIX) and Gamma (GEX) calculations are based on where the prior day’s reading falls with respect to the MAX and MIN of all occurrences available. A higher DIX is bullish. At the same time, the lower the GEX, the more (expected) volatility. SHIFT data used for S&P 500 (INDEX: SPX) options activity. Note that options flow is sorted by the call premium spent; if more positive then more was spent on call options. Breadth reflects a reading of the prior day’s NYSE Advance/Decline indicator. VIX reflects a current reading of the CBOE Volatility Index (INDEX: VIX) from 0-100.

What To Expect: As of 6:40 AM ET, Tuesday’s regular session (9:30 AM – 4:00 PM EST) in the S&P 500 will likely open outside of prior-range and -value, suggesting a higher potential for immediate directional opportunity.

Gap Scenarios In Play: Gaps ought to fill quickly. Should they not, that’s a signal of strength; do not fade. Leaving value behind on a gap-fill or failing to fill a gap (i.e., remaining outside of the prior session’s range) is a go-with indicator.

Auctioning and spending at least 1-hour of trade back in the prior range suggests a lack of conviction; in such a case, do not follow the direction of the most recent initiative activity.

During the prior day’s regular trade, on weak intraday breadth and divergent market liquidity metrics, the worst-case outcome occurred, evidenced by trade below yesterday’s pivot, the $4,365.25 low volume area (LVNode). 

This trade is significant because it was an acceptance of the overnight gap, a willingness to transact at lower prices. We’re carrying forward the presence of emotional, multiple distribution structures left behind the initiative trade. Also, though the selling covered a lot of ground, it was measured and the CBOE Volatility Index (INDEX: VIX) is now down 20% from Monday’s peak. 

To note, coming into Monday’s liquidation, according to SqueezeMetrics, “the current combination of weak put flows and large customer vanna exposure” was fragile; “Historically, this means SPX down, VIX up.”

Adding, according to SpotGamma, it’s likely Monday’s liquidation was a combination of equity de-risking, combined with short gamma from options positioning. See definition below.

Analysts at JPMorgan Chase & Co (NYSE: JPM) support that belief: “The market sell-off that escalated overnight we believe is primarily driven by technical selling flows in an environment of poor liquidity, and overreaction of discretionary traders to perceived risks.”

Graphic: Tier1Alpha market research graphic via The Market Ear.

Coming into Tuesday’s regular trade, conditions have improved; now, the focus is the September 21-22 Federal Open Market Committee (FOMC) meeting ending Wednesday.

Moreover, for today, participants may make use of the following frameworks.

In the best case, the S&P 500 trades sideways or higher; activity above the $4,365.25 LVNode pivot puts in play the $4,393.75 high volume area (HVNode). Initiative trade beyond the HVNode could reach as high as the $4,425.00 untested point of control (VPOC) and $4,481.75 HVNode, or higher.

In the worst case, the S&P 500 trades lower; activity below the $4,365.25 LVNode puts in play the $4,346.75 HVNode. Initiative trade beyond the HVNode could reach as low as the $4,294.00 regular trade low (RTH Low) and $4,233.00 VPOC, or lower.

Graphic: 65-minute profile chart of the Micro E-mini S&P 500 Futures updated 6:40 AM ET.

Definitions

Gamma: To note, gamma is the sensitivity of an option to changes in the underlying price. Those that take the other side and warehouse these risks hedge their exposure by buying and selling the underlying. When dealers are short-gamma, they hedge by buying into strength and selling into weakness. When dealers are long-gamma, they hedge by selling into strength and buying into weakness. The former exacerbates volatility. The latter calms volatility.

Volume Areas: A structurally sound market will build on areas of high volume (HVNodes). Should the market trend for long periods of time, it will lack sound structure, identified as low volume areas (LVNodes). LVNodes denote directional conviction and ought to offer support on any test. 

If participants were to auction and find acceptance into areas of prior low volume (LVNodes), then future discovery ought to be volatile and quick as participants look to HVNodes for favorable entry or exit.

POCs: POCs are valuable as they denote areas where two-sided trade was most prevalent in a prior day session. Participants will respond to future tests of value as they offer favorable entry and exit.

News And Analysis

Megacap tech selloff hits $500B since Nasdaq 100 peak. 

Fintech SPACs pick up as revenue clarity allays concern.

J&J said a second COVID shot boosts protection to 94%.

Wall Street’s message on Evergrande: China has control.

What People Are Saying

About

After years of self-education, strategy development, and trial-and-error, Renato Leonard Capelj began trading full-time and founded Physik Invest to detail his methods, research, and performance in the markets. 

Additionally, Capelj is a finance and technology reporter. Some of his biggest works include interviews with leaders such as John Chambers, founder and CEO, JC2 Ventures, Kevin O’Leary, businessman and Shark Tank host, Catherine Wood, CEO and CIO, ARK Invest, among others.

Disclaimer

At this time, Physik Invest does not manage outside capital and is not licensed. In no way should the materials herein be construed as advice. Derivatives carry a substantial risk of loss. All content is for informational purposes only.

Categories
Commentary

Daily Brief For September 20, 2021

Market Commentary

Equity index futures, commodities, and yields trade lower.

  • Concerns around the debt ceiling.
  • SPX below balance, 50-day SMA.
  • Ahead is a 2-day FOMC meeting.
  • Today we receive NAHB updates.

What Happened: U.S. stock index futures auctioned lower alongside commodities and yields as Treasury Secretary Janet Yellen seeks to raise or suspend the debt ceiling alongside Evergrande fears.

Ahead is data on the National Association of Home Builders Index (10:00 AM ET).

Graphic updated 7:15 AM ET. Sentiment Risk-Off if expected /ES open is below the prior day’s range. /ES levels are derived from the profile graphic at the bottom of the following section. SqueezeMetrics Dark Pool Index (DIX) and Gamma (GEX) calculations are based on where the prior day’s reading falls with respect to the MAX and MIN of all occurrences available. A higher DIX is bullish. At the same time, the lower the GEX, the more (expected) volatility. SHIFT data used for S&P 500 (INDEX: SPX) options activity. Note that options flow is sorted by the call premium spent; if more positive then more was spent on call options. Breadth reflects a reading of the prior day’s NYSE Advance/Decline indicator. VIX reflects a current reading of the CBOE Volatility Index (INDEX: VIX) from 0-100.

What To Expect: As of 7:15 AM ET, Monday’s regular session (9:30 AM – 4:00 PM EST) in the S&P 500 will likely open outside of prior-range and -value, suggesting a high potential for immediate directional opportunity.

Gap Scenarios In Play: Gaps ought to fill quickly. Should they not, that’s a signal of strength; do not fade. Leaving value behind on a gap-fill or failing to fill a gap (i.e., remaining outside of the prior session’s range) is a go-with indicator.

Auctioning and spending at least 1-hour of trade back in the prior range suggests a lack of conviction; in such a case, do not follow the direction of the most recent initiative activity.

During the prior week’s trade, on weak breadth, the worst-case outcome occurred, evidenced by a balance-area breakout and separation of value below the S&P 500’s 50-day simple moving average (i.e., a visual level likely paid attention to by short-term, technically-driven market participants who generally are unable to defend retests).

Further, the aforementioned trade is happening in the context of a waning economic recovery, heightened valuations in the face of strong EPS expectations, the prospects of stimulus reduction, non-seasonally aligned flows, impactful options and equity market dynamics, divergent sentiment, as well as fears of a mid-cycle transition.

A key risk, as highlighted by Treasury Secretary Janet Yellen, is the debt ceiling which, if not resolved, some economists argue “that an announcement on tapering is likely to be delayed to December, and that Treasury yields could fall further as a result.”

We note that – as Goldman Sachs writes – “The upcoming debt limit deadline is beginning to look as risky as the 2011 debt limit showdown that led to Standard & Poor’s downgrade of the US sovereign rating and eventually to budget sequestration, or the 2013 deadline that overlapped with a government shutdown.”

Adding, as SpotGamma said, “over 50% of stocks [had] their largest gamma position” roll-off Friday. This suggests an increased potential for volatility heading into the September 21-22 FOMC event. SqueezeMetrics confirms.

Moreover, for today, participants may make use of the following frameworks.

In the best case, the S&P 500 trades sideways or higher; activity above the $4,365.25 low volume area (LVNode) pivot puts in play the $4,393.75 high volume area (HVNode). Initiative trade beyond the HVNode could reach as high as the $4,425.00 untested point of control (VPOC) and $4,481.75 HVNode, or higher.

In the worst case, the S&P 500 trades lower; activity below the $4,365.25 LVNode puts in play the $4,341.00 VPOC. Initiative trade beyond the VPOC could reach as low as $4,309.75 (the intersection of a minimal excess overnight low and poor structure in a prior day session), or lower.

Graphic: 65-minute profile chart of the Micro E-mini S&P 500 Futures updated 7:15 AM ET.

Definitions

Volume Areas: A structurally sound market will build on areas of high volume (HVNodes). Should the market trend for long periods of time, it will lack sound structure, identified as low volume areas (LVNodes). LVNodes denote directional conviction and ought to offer support on any test. 

If participants were to auction and find acceptance into areas of prior low volume (LVNodes), then future discovery ought to be volatile and quick as participants look to HVNodes for favorable entry or exit.

POCs: POCs are valuable as they denote areas where two-sided trade was most prevalent in a prior day session. Participants will respond to future tests of value as they offer favorable entry and exit.

News And Analysis

Analyzing the nightmare scenario for China’s economy.

FOMC preview: How to make tapering data-dependent.

China’s property fear is spreading beyond Evergrande.

Goldman Sachs: Low-rate world favors quality growth.

Airbnb CEO Brian Chesky to herald a travel revolution.

Pfizer/BioNTech vaccine is safe and protective for kids.

Risks associated with rising government debt, inflation.

The global housing market is broken dividing countries.

Trudeau set for slimmer victory than hoped in election.

Yellen renews call to up debt limit to avoid catastrophe.

Solana blackout reveals the fragility of cryptocurrency.

FX Weekly: There’s a Lehman in China every 3 years.

What People Are Saying

About

After years of self-education, strategy development, and trial-and-error, Renato Leonard Capelj began trading full-time and founded Physik Invest to detail his methods, research, and performance in the markets. 

Additionally, Capelj is a finance and technology reporter. Some of his biggest works include interviews with leaders such as John Chambers, founder and CEO, JC2 Ventures, Kevin O’Leary, businessman and Shark Tank host, Catherine Wood, CEO and CIO, ARK Invest, among others.

Disclaimer

At this time, Physik Invest does not manage outside capital and is not licensed. In no way should the materials herein be construed as advice. Derivatives carry a substantial risk of loss. All content is for informational purposes only.

Categories
Commentary

Weekly Brief For September 19, 2021

Editor’s Note: Late today. So sorry! The main takeaway is that we’re in a window of volatility and participants should focus on leveraging rich skew and complex spreads to hedge or speculate on sideways to lower trade.

Market Commentary

  • SPX below balance, 50-day SMA.
  • Ahead is a 2-day FOMC meeting.
  • Concerns around the debt ceiling.
  • Rich skew makes hedging easier.
  • Post OPEX volatility likely in play.

What Happened: U.S. stock index futures auctioned lower, last week, into Friday’s quadruple witching derivatives expiry. 

Of interest this week is a meeting of the Federal Open Market Committee (FOMC).

Graphic updated 5:30 PM ET Sunday. Sentiment Neutral if expected /ES open is inside of the prior day’s range. /ES levels are derived from the profile graphic at the bottom of the following section. SqueezeMetrics Dark Pool Index (DIX) and Gamma (GEX) calculations are based on where the prior day’s reading falls with respect to the MAX and MIN of all occurrences available. A higher DIX is bullish. At the same time, the lower the GEX, the more (expected) volatility. SHIFT data used for S&P 500 (INDEX: SPX) options activity. Note that options flow is sorted by the call premium spent; if more positive then more was spent on call options. Breadth reflects a reading of the prior day’s NYSE Advance/Decline indicator. VIX reflects a current reading of the CBOE Volatility Index (INDEX: VIX) from 0-100.

What To Expect: During the prior week’s trade, on weak breadth, the worst-case outcome occurred, evidenced by a balance-area breakout and separation of value below the S&P 500’s 50-day simple moving average (i.e., a visual level likely paid attention to by short-term, technically-driven market participants who generally are unable to defend retests).

Balance-Break Scenarios: A change in the market (i.e., the transition from two-time frame trade, or balance, to one-time frame trade, or trend) has occurred.

We now monitor for rejection (i.e., return inside of balance) which portends a move to the opposite end of the balance.

Further, the aforementioned trade is happening in the context of a waning economic recovery, heightened valuations in the face of strong EPS expectations, the prospects of stimulus reduction, non-seasonally aligned flows, impactful options and equity market dynamics, divergent sentiment, as well as fears of a mid-cycle transition.

In a Goldman Sachs Group Inc (NYSE: GS) note posted by The Market Ear, analysts “believe it is a critical period for many investors and companies that manage performance to calendar year-end. Such pressures boost volumes and volatility as investors observe earnings reports, analyst days and managements’ guidance for the following year.”

At the same time, inflows into equities are exploding to the upside as JPMorgan Chase & Co (NYSE: JPM) technicians “do not see a pattern on the [S&P 500] chart or any cross-market dynamics that would suggest the market is set for a lasting bearish reversal. The late-Aug systematic sell signals lose statistical significance into next week and the seasonal trends improve into early-Oct.”

Graphic: Bank of America Corporation (NYSE: BAC) charts equity flows, via The Market Ear.

That said, we hone in on risks.

If concerns like the debt ceiling are not resolved, some economists argue, according to Bloomberg, “that an announcement on tapering is likely to be delayed to December, and that Treasury yields could fall further as a result.”

We note that – as Goldman Sachs writes – “The upcoming debt limit deadline is beginning to look as risky as the 2011 debt limit showdown that led to Standard & Poor’s downgrade of the US sovereign rating and eventually to budget sequestration, or the 2013 deadline that overlapped with a government shutdown.”

On the other hand, according to SqueezeMetrics, “the current combination of weak put flows and large customer vanna exposure” is fragile; “people are [still] overexposed to changes in VIX, and will be hurt more than usual if VIX starts moving up. Historically, this means SPX down, VIX up.”

Following SqueezeMetrics’ remarks, SpotGamma adds that “over 50% of stocks [had] their largest gamma position” roll-off Friday. This suggests an increased potential for volatility heading into the September 21-22 FOMC event.

In this post-quad-witching window of non-strength, we may, as a result, use the rich skew to hedge (see below Weekly Trade Idea section).

Moreover, for today, given an increased potential for heightened volatility and initiative trade, participants may make use of the following frameworks.

In the best case, the S&P 500 trades sideways or higher; activity above the $4,437.75 micro-composite point of control (MCPOC) puts in play the $4,481.75 high volume area (HVNode). Initiative trade beyond the $4,481.75 HVNode could reach as high as the $4,510.00 low volume area (LVNode) and $4,526.25 HVNode, or higher.

In the worst case, the S&P 500 trades lower; activity below the $4,437.75 MCPOC puts in play the $4,393.75 HVNode. Initiative trade beyond the $4,393.75 HVNode could reach as low as the $4,365.25 LVNode and $4,341.00 untested point of control (VPOC), or lower.

We note that the $4,481.75 and $4,393.75 HVNodes intersect key anchored volume-weighted average price levels. These are metrics highly regarded by chief investment officers, among other participants, for quality of trade. Additionally, liquidity algorithms are benchmarked and programmed to buy and sell around VWAPs.

Graphic: 4-hour profile chart of the Micro E-mini S&P 500 Futures updated 5:30 PM ET Sunday.

Key Definitions

Volume Areas: A structurally sound market will build on areas of high volume (HVNodes). Should the market trend for long periods of time, it will lack sound structure, identified as low volume areas (LVNodes). LVNodes denote directional conviction and ought to offer support on any test. 

If participants were to auction and find acceptance into areas of prior low volume (LVNodes), then future discovery ought to be volatile and quick as participants look to HVNodes for favorable entry or exit.

POCs: POCs are valuable as they denote areas where two-sided trade was most prevalent in a prior day session. Participants will respond to future tests of value as they offer favorable entry and exit.

MCPOCs: POCs are valuable as they denote areas where two-sided trade was most prevalent over numerous day sessions. Participants will respond to future tests of value as they offer favorable entry and exit.

Weekly Trade Idea

Please Note: In no way is the below a trade recommendation. Derivatives carry a substantial risk of loss. All content is for informational purposes only.

Options offer an efficient way to gain directional exposure. 

If an option buyer was short (long) stock, he or she could buy a call (put) to hedge upside (downside) exposure. Additionally, one can spread, or buy (+) and sell (-) options together, strategically.

Commonly discussed spreads include credit, debit, ratio, back, and calendar.

  • Credit: Sell -1 option closer to the money. Buy +1 option farther out of the money.
  • Debit: Buy +1 option closer to the money. Sell -1 option farther out of the money.
  • Ratio: Buy +1 option closer to the money. Sell -2 options farther out of the money. 
  • Back: Sell -1 option closer to the money. Buy +2 options farther out of the money.
  • Calendar: Sell -1 option. Buy +1 option farther out in time, at the same strike.

Typically, if bullish (bearish), sell at-the-money put (call) credit spread and/or buy a call (put) debit/ratio spread structured around target price. Alternatively, if the expected directional move is great (small), opt for a back spread (calendar spread). Also, if credit spread, capture 50-75% of the premium collected. If debit spread, capture 2-300% of the premium paid.

Be cognizant of risk exposure to direction (delta), time (theta), and volatility (vega). 

  • Negative (positive) delta = synthetic short (long). 
  • Negative (positive) theta = time decay hurts (helps).
  • Negative (positive) vega = volatility hurts (helps).

Trade Idea: SELL -1 1/2 BACKRATIO SPX 100 (Weeklys) 29 SEP 21 4400/4300 PUT @.65 CREDIT LMT

I’m neutral to bearish on the S&P 500 and I think the index may slide toward $4,300. I will structure a spread below the current index price, expiring in about 2 weeks. I will buy the 4400 put option once (+1) and sell the 4300 put option twice (-2) for a $0.65 credit. Should the index not move to my target, I keep the $65 credit. Should it move to $4,300, I could make $10,065.00 at expiry. Should the index move past $4,200.00 or so, I may incur unlimited losses. My goal, with this spread, is to capture the initial credit and close for additional credit if the index moves lower. 

If necessary, I will hedge the position by either (A) selling futures, (B) widening strikes, (C) buying a far out-of-the-money put option to cap downside in case of an unpredictable move lower, or (D) roll strikes down in price and out in time.

News And Analysis

An essay on why you keep losing money as a trader.

August retail sales reflect strong consumer demand.

UBS: Resist temptation to time market despite highs.

U.S. debt ceiling fight could cause markets to tumble.

Nasdaq on whether Rule 605 works better in dollars.

Rally driven less by reflation prospects; TINA to stock.

Higher U.S. CGT proposal spurs a PE and M&A rush.

If a CEO talks like Kant, think twice before investing.

New vehicle prices surge amid global chip shortages.

Active managers’ performance disappointing in 2021.

DeFi is disrupting but not derailing traditional finance.

OpenSea admitted recent incident as insider trading.

SEC looks to greater oversight of the crypto markets.

Central bank digital currency; cash for the digital age.

White House to put forward three CFTC nominations.

Some key lessons from NYC’s first SALT conference. 

Let’s Hang Out

Salt Lake City, UT September 28-30

About

After years of self-education, strategy development, and trial-and-error, Renato Leonard Capelj began trading full-time and founded Physik Invest to detail his methods, research, and performance in the markets. 

Additionally, Capelj is a finance and technology reporter. Some of his biggest works include interviews with leaders such as John Chambers, founder and CEO, JC2 Ventures, Kevin O’Leary, businessman and Shark Tank host, Catherine Wood, CEO and CIO, ARK Invest, among others.

Disclaimer

At this time, Physik Invest does not manage outside capital and is not licensed. In no way should the materials herein be construed as advice. Derivatives carry a substantial risk of loss. All content is for informational purposes only.

Categories
Commentary

Daily Brief For September 17, 2021

Market Commentary

Equity index futures trade sideways to lower.

  • Fed could hint at a stimulus taper.
  • Ahead: UoM consumer sentiment.
  • OPEX and a potential for volatility.

What Happened: U.S. stock index futures auctioned sideways to lower ahead of quadruple witching and news the Federal Reserve may hint at scaling back asset purchases next week. 

Ahead is data on University of Michigan consumer sentiment (10:00 AM ET).

Graphic updated 6:30 AM ET. Sentiment Neutral if expected /ES open is inside of the prior day’s range. SqueezeMetrics Dark Pool Index (DIX) and Gamma (GEX) calculations are based on where the prior day’s reading falls with respect to the MAX and MIN of all occurrences available. A higher DIX is bullish. At the same time, the lower the GEX, the more (expected) volatility. SHIFT data used for S&P 500 (INDEX: SPX) options activity approximation. Note that options flow is sorted by the call premium spent; if more positive then more was spent on call options. Breadth reflects a reading of the prior day’s NYSE Advance/Decline indicator. VIX reflects a current reading of the CBOE Volatility Index (INDEX: VIX) from 0-100.

What To Expect: As of 6:30 AM ET, Friday’s regular session (9:30 AM – 4:00 PM EST) in the S&P 500 will likely open inside of prior-range and -value, suggesting a limited potential for immediate directional opportunity.

Adding, during the prior day’s regular trade, on weak intraday breadth and strong market liquidity metrics, the worst-case outcome occurred, evidenced by trade back toward the market’s most recent perception of value, the convergence of the $4,437.75 micro-composite point of control (MCPOC) and an anchored volume-weighted average price (VWAP).

POCs: POCs are valuable as they denote areas where two-sided trade was most prevalent. Participants will respond to future tests of value as they offer favorable entry and exit.

VWAP: A metric highly regarded by chief investment officers, among other participants, for quality of trade. Additionally, liquidity algorithms are benchmarked and programmed to buy and sell around VWAPs.
Graphic: Divergent delta (i.e., committed buying as measured by volume delta or buying and selling power as calculated by the difference in volume traded at the bid and offer) in SPDR S&P 500 ETF Trust (NYSE: SPY), one of the largest ETFs that track the S&P 500 index, via Bookmap. The readings are supportive of responsive trade or balance (i.e., rotational trade that suggests current prices offer favorable entry and exit).

We’re carrying forward the presence of minimal excess at Wednesday’s regular trade low (RTH Low), after a test of a point of control (POC) and 50-day simple moving average (i.e., two visual levels likely paid attention to by short-term, technically-driven market participants who generally are unable to defend retests).

Balance-Break Scenarios Potentially In Play: A change in the market (i.e., the transition from two-time frame trade, or balance, to one-time frame trade, or trend) may occur.

Monitor for acceptance (i.e., more than 1-hour of trade) outside of the balance area. Rejection (i.e., return inside of balance) portends a move to the opposite end of the balance.

Further, the aforementioned trade is happening in the context of peak growth and a moderation in the economic recovery, heightened valuations, the prospects of stimulus reduction, as well as non-seasonally aligned flows, impactful options market dynamics, divergent sentiment, and fears of a mid-cycle transition.

Graphic: @pat_hennessy breaks down returns for the S&P 500, categorized by the week relative to OPEX. Based on his analysis, Pat sees that the “2 weeks prior to OPEX (e.g., 7/30/21 to 8/6/21 in this late-cycle) [have] been extremely bullish,” while “OPEX week returns peaked in 2016 and have trended lower since.”

According to SqueezeMetrics, coming into Thursday’s session, the steepness of the GammaVol (GXV) curve suggested there was no more risk to the upside than there was to the downside; “SPX upside needs a bunch of bought puts to throw on the bonfire. It would be bullish for SPX to have people buying SPX puts,” and that hasn’t happened yet.

Thereafter, the index crept back into range, past $4,450.00, before responding higher, into the close ahead of quadruple witching, during which SpotGamma believes participants are likely to “see a big chunk of SPX options expire on the open, and the balance of index/etf/stocks expire on the close. This should lead to a decent amount of volatility Friday and Monday ahead of the FOMC.”

Moreover, for today, given an increased potential for heightened volatility, participants may make use of the following frameworks.

In the best case, the S&P 500 trades sideways or higher; activity above the $4,481.75 high volume area (HVNode) puts in play the $4,510.00 low volume area (LVNode). Initiative trade beyond the LVNode could reach as high as the $4,526.25 HVNode and $4,550.00 overnight high (ONH).

In the worst case, the S&P 500 trades lower; activity below the $4,481.75 HVNode puts in play the $4,437.75 MCPOC. Initiative trade beyond the MCPOC could reach as low as the $4,425.25 minimal excess low and $4,393.75, another micro-composite point of control (MCPOC).

Overnight Rally Highs (Lows): Typically, there is a low historical probability associated with overnight rally-highs (lows) ending the upside (downside) discovery process.

Volume Areas: A structurally sound market will build on past areas of high volume. Should the market trend for long periods of time, it will lack sound structure (identified as a low volume area which denotes directional conviction and ought to offer support on any test). 

If participants were to auction and find acceptance into areas of prior low volume, then future discovery ought to be volatile and quick as participants look to areas of high volume for favorable entry or exit.

Excess: A proper end to price discovery; the market travels too far while advertising prices. Responsive, other-timeframe (OTF) participants aggressively enter the market, leaving tails or gaps which denote unfair prices.
Graphic: 65-minute profile chart of the Micro E-mini S&P 500 Futures updated 6:30 AM ET.

News And Analysis

Fed seen announcing bond taper in November, rate liftoff in 2023.

Invesco could merge with a State Street asset-management unit.

Food and Drug Administration weighing COVID-19 booster shots.

S&P analysis on Canada growth prospects in the coming decade.

Rising transportation expenses are companies’ big inflation hurdle

Wall Street influencers are making $500,000, above even bankers.

GM plans to idle factories longer amid problematic chip shortages.

What People Are Saying

About

After years of self-education, strategy development, and trial-and-error, Renato Leonard Capelj began trading full-time and founded Physik Invest to detail his methods, research, and performance in the markets. 

Additionally, Capelj is a finance and technology reporter. Some of his biggest works include interviews with leaders such as John Chambers, founder and CEO, JC2 Ventures, Kevin O’Leary, businessman and Shark Tank host, Catherine Wood, CEO and CIO, ARK Invest, among others.

Disclaimer

At this time, Physik Invest does not manage outside capital and is not licensed. In no way should the materials herein be construed as advice. Derivatives carry a substantial risk of loss. All content is for informational purposes only.

Categories
Commentary

Daily Brief For September 16, 2021

Market Commentary

Equity index futures trade sideways to lower with commodities and yields.

  • Equity indices falling; SPX above 50-day.
  • Ahead are claims, retail sales, and more.
  • Positioning risks mount case for volatility.

What Happened: After a break higher, yesterday, U.S. stock index futures auctioned sideways to lower overnight as participants positioned themselves for an options expiry and upcoming data dumps.

Ahead is data on jobless claims (8:30 AM ET), retail sales (8:30 AM ET), Philadelphia Fed manufacturing survey (8:30 AM ET), and business inventories (10:00 AM ET).

Graphic updated 6:40 AM ET. Sentiment Neutral if expected /ES open is inside of the prior day’s range. SqueezeMetrics Dark Pool Index (DIX) and Gamma (GEX) calculations are based on where the prior day’s reading falls with respect to the MAX and MIN of all occurrences available. A higher DIX is bullish. At the same time, the lower the GEX, the more (expected) volatility. SHIFT data used for S&P 500 (INDEX: SPX) options activity approximation. Note that options flow is sorted by the call premium spent; if more positive then more was spent on call options. Breadth reflects a reading of the prior day’s NYSE Advance/Decline indicator. VIX reflects a current reading of the CBOE Volatility Index (INDEX: VIX) from 0-100.

What To Expect: As of 6:40 AM ET, Thursday’s regular session (9:30 AM – 4:00 PM EST) in the S&P 500 will likely open inside of prior-range and -value, suggesting a limited potential for immediate directional opportunity.

Adding, during the prior day’s regular trade, on strong intraday breadth and middling market liquidity metrics, the best case outcome occurred, evidenced by the S&P 500 closing the session on a spike higher, away from value.

Spike Rules In Play: Spike’s mark the beginning of a break from value. Spikes higher (lower) are validated by trade at or above (below) the spike base (i.e., the origin of the spike). 
Graphic: Divergent delta (i.e., non-committed buying as measured by volume delta or buying and selling power as calculated by the difference in volume traded at the bid and offer) in SPDR S&P 500 ETF Trust (NYSE: SPY), one of the largest ETFs that track the S&P 500 index, via Bookmap. The readings are supportive of responsive trade or balance (i.e., rotational trade that suggests current prices offer favorable entry and exit).

This is significant because of rejection, or a willingness not to transact at lower prices. We’re carrying forward the presence of minimal excess at Wednesday’s regular trade low (RTH Low), after a test of a prior untested point of control (VPOC) and 50-day simple moving average (i.e., two visual levels likely paid attention to by short-term, technically-driven market participants who generally are unable to defend retests).

Graphic: S&P 500 rotates between the 20- and 50-day simple moving average. Thus far, stronger sellers have not stepped up.

Further, the aforementioned trade is happening in the context of peak growth and a moderation in the economic recovery, heightened valuations, the prospects of stimulus reduction, as well as non-seasonally aligned inflows, impactful options market dynamics, divergent sentiment, and fears of a mid-cycle transition.

Graphic: @pat_hennessy breaks down returns for the S&P 500, categorized by the week relative to OPEX. Based on his analysis, Pat sees that the “2 weeks prior to OPEX (e.g., 7/30/21 to 8/6/21 in this late-cycle) [have] been extremely bullish,” while “OPEX week returns peaked in 2016 and have trended lower since.”

According to SqueezeMetrics, the steepness of the GammaVol (GXV) curve suggests there is no more risk to the upside than there is to the downside; “SPX upside needs a bunch of bought puts to throw on the bonfire. It would be bullish for SPX to have people buying SPX puts,” and that hasn’t happened yet.

In other words, the graphic “means that movement from 4450 to 4500 is very easy, … [a]nd now that we’re at 4480, it’s slippery back down to 4450.”

Moreover, for today, given an increased potential for heightened volatility and responsive trade, participants may make use of the following frameworks.

In the best case, the S&P 500 trades sideways or higher; activity above the $4,481.75 high volume area (HVNode) puts in play the $4,510.00 low volume area (LVNode). Initiative trade beyond the LVNode could reach as high as the $4,526.25 HVNode and $4,550.00 overnight high (ONH).

In the worst case, the S&P 500 trades lower; activity below the $4,481.75 HVNode puts in play the $4,449.50 spike base. Initiative trade beyond the spike base could reach as low as the $4,425.25 minimal excess low and $4,393.75 micro-composite point of control (MCPOC).

To note, the $4,481.75 HVNode corresponds with two anchored Volume Weighted Average Price (VWAP) levels, a metric highly regarded by chief investment officers, among other participants, for quality of trade. Additionally, liquidity algorithms are benchmarked and programmed to buy and sell around VWAPs.

Overnight Rally Highs (Lows): Typically, there is a low historical probability associated with overnight rally-highs (lows) ending the upside (downside) discovery process.

Volume Areas: A structurally sound market will build on past areas of high volume. Should the market trend for long periods of time, it will lack sound structure (identified as a low volume area which denotes directional conviction and ought to offer support on any test). 

If participants were to auction and find acceptance into areas of prior low volume, then future discovery ought to be volatile and quick as participants look to areas of high volume for favorable entry or exit.

POCs: POCs are valuable as they denote areas where two-sided trade was most prevalent. Participants will respond to future tests of value as they offer favorable entry and exit.

Excess: A proper end to price discovery; the market travels too far while advertising prices. Responsive, other-timeframe (OTF) participants aggressively enter the market, leaving tails or gaps which denote unfair prices.
Graphic: 65-minute profile chart of the Micro E-mini S&P 500 Futures updated 7:25 AM ET.

News And Analysis

How ‘OpEx’ is shaking up the third week of the month.

U.S. political noise to intensify but have limited impact.

Though COVID cases are falling, the deaths are rising.

Biden’s economic plan at risk of delays amid squabble.

China Evergrande onshore bond trading is suspended.

The Coinbase spat with SEC ups ante in a crypto fight.

The foreclosure rate at its lowest in over two decades.

Talking Options Greeks: Everything you need to know.

What People Are Saying

About

After years of self-education, strategy development, and trial-and-error, Renato Leonard Capelj began trading full-time and founded Physik Invest to detail his methods, research, and performance in the markets. 

Additionally, Capelj is a finance and technology reporter. Some of his biggest works include interviews with leaders such as John Chambers, founder and CEO, JC2 Ventures, Kevin O’Leary, businessman and Shark Tank host, Catherine Wood, CEO and CIO, ARK Invest, among others.

Disclaimer

At this time, Physik Invest does not manage outside capital and is not licensed. In no way should the materials herein be construed as advice. Derivatives carry a substantial risk of loss. All content is for informational purposes only.