What Happened
Overnight, equity index futures were mixed after Monday’s failed balance-area breakout in the S&P 500 had that index rotate to and through the opposite end of a multi-day consolidation.
This is as market participants await clarity on monetary policy from the Federal Reserve and the weighty “quad-witching” derivatives expiry, late this week.
Ahead is data on the producer price index (8:30 AM ET).

What To Expect
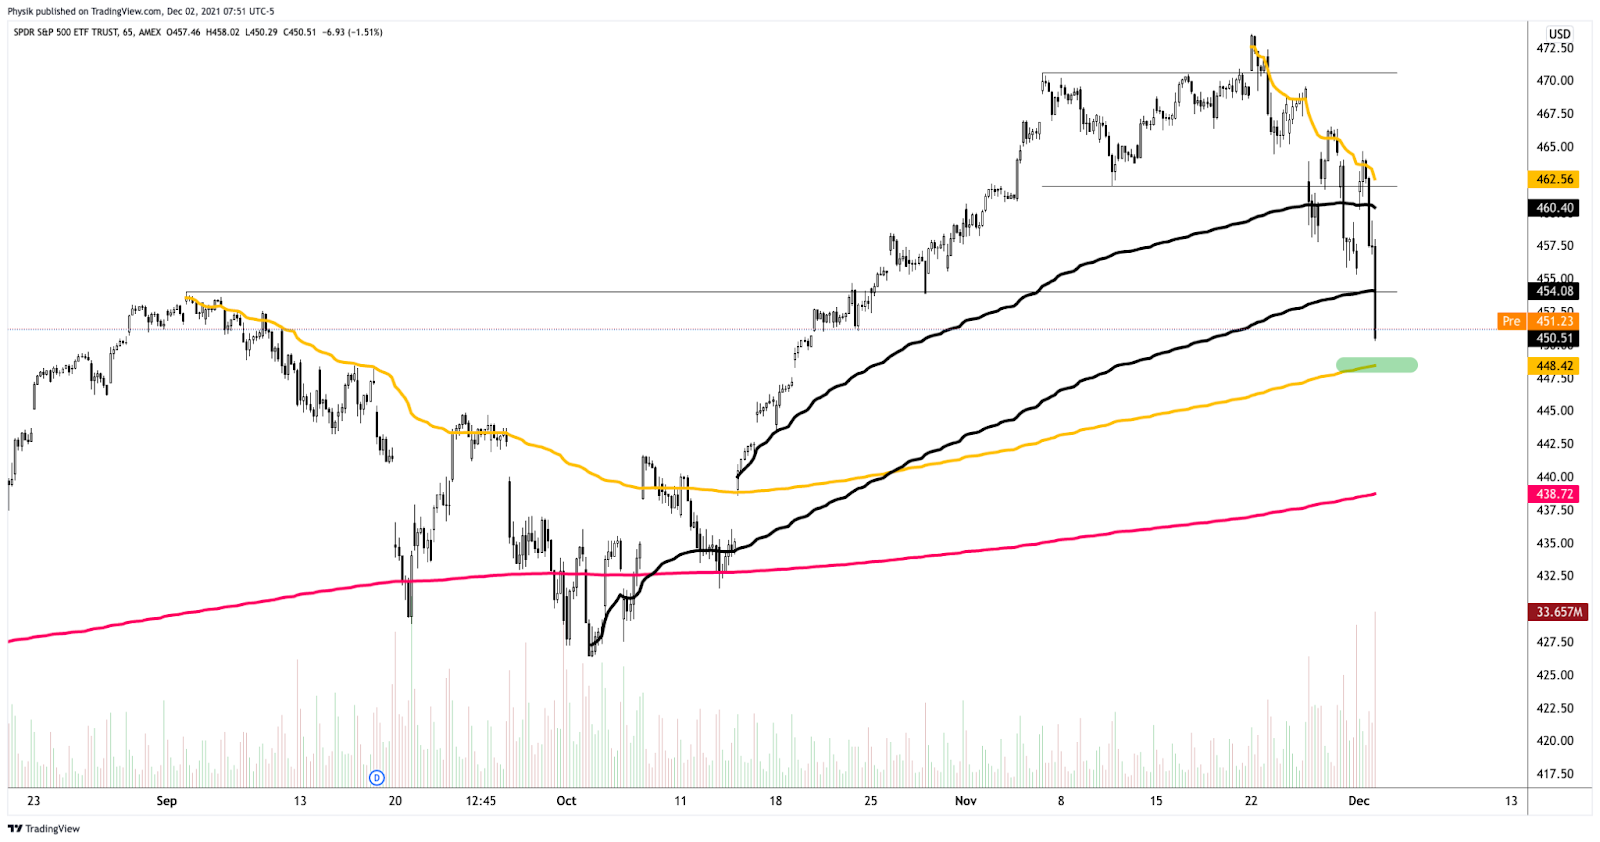
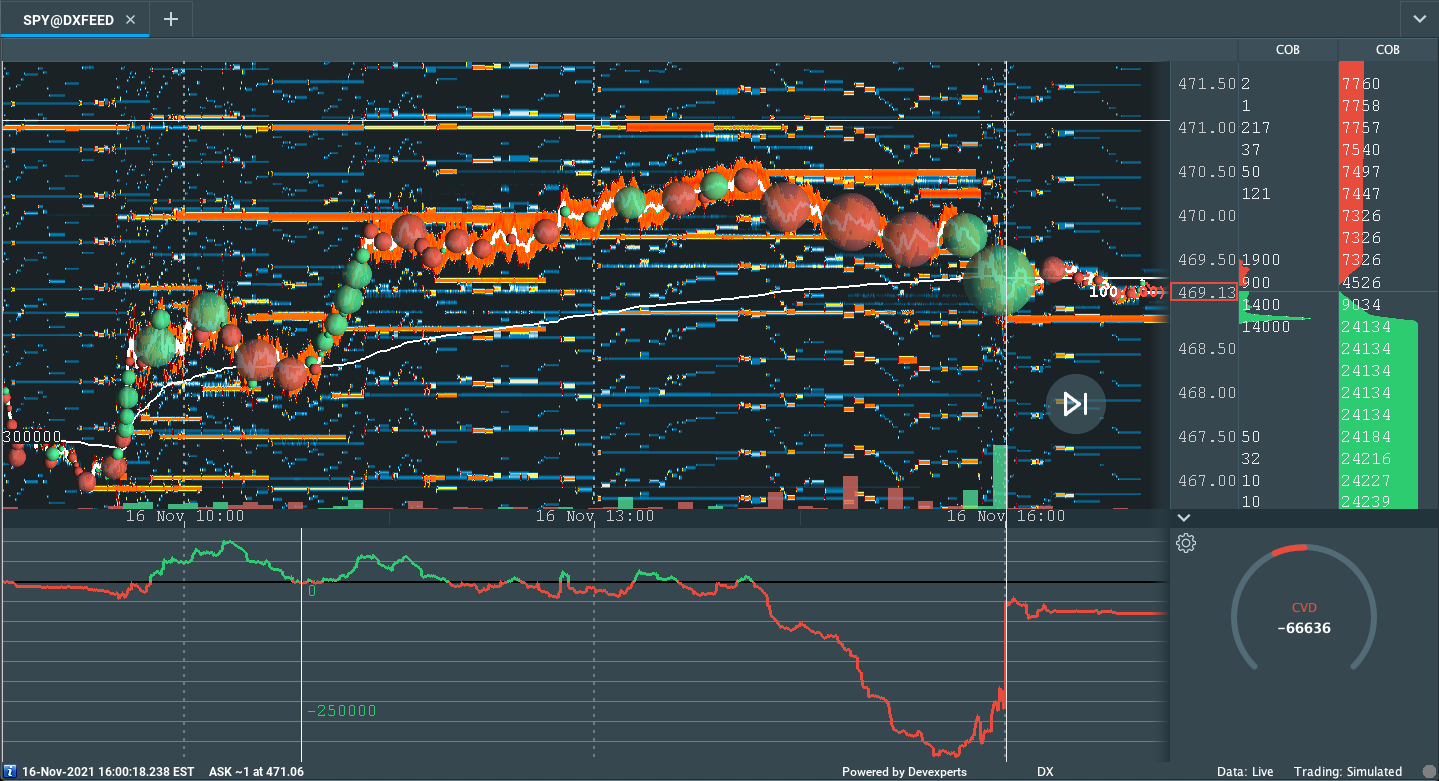
A change in the market was occurring, yesterday, as participants sought to break the S&P 500 out of a multi-day balance area and discover higher prices.
Shortly after the U.S. cash open, however, there was no follow-through; the index liquidated to the opposite end of the balance with sellers turning aggressive into the close.
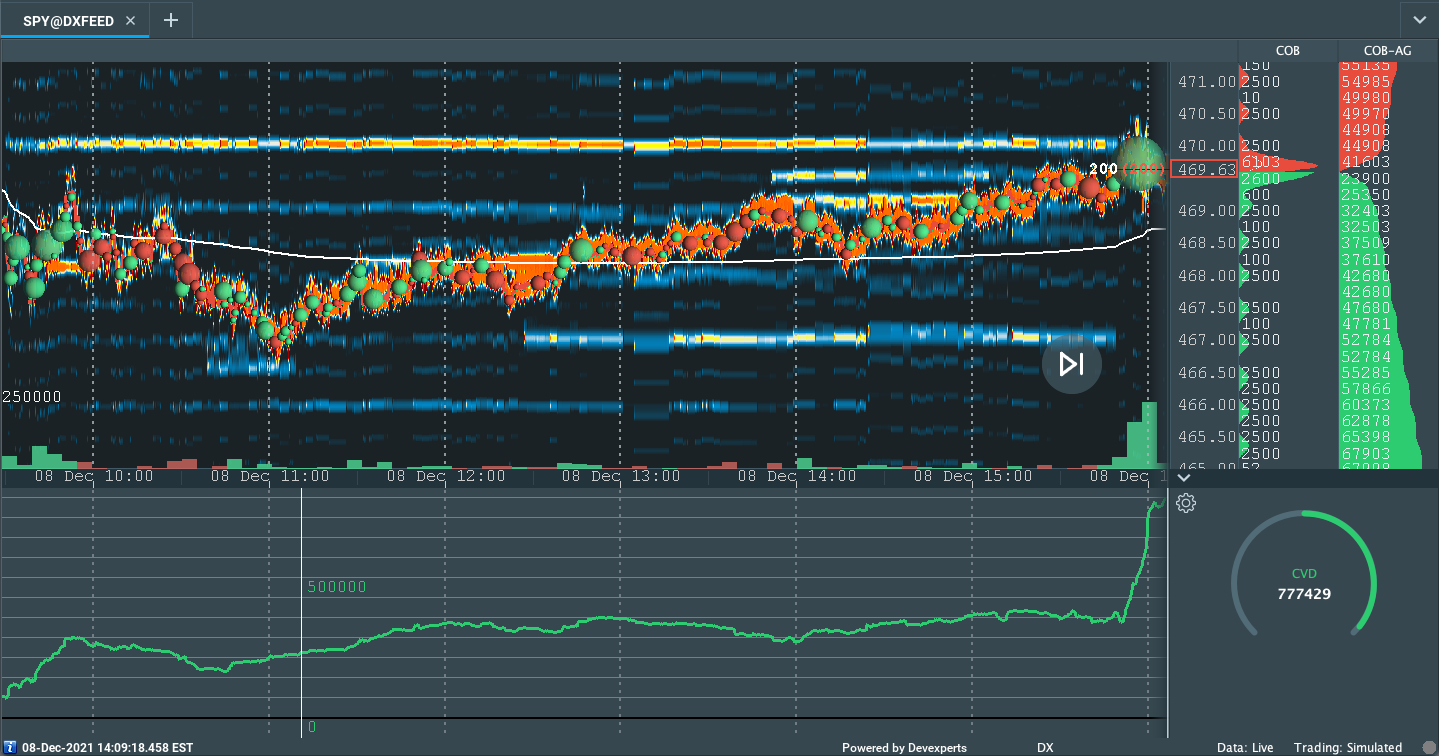
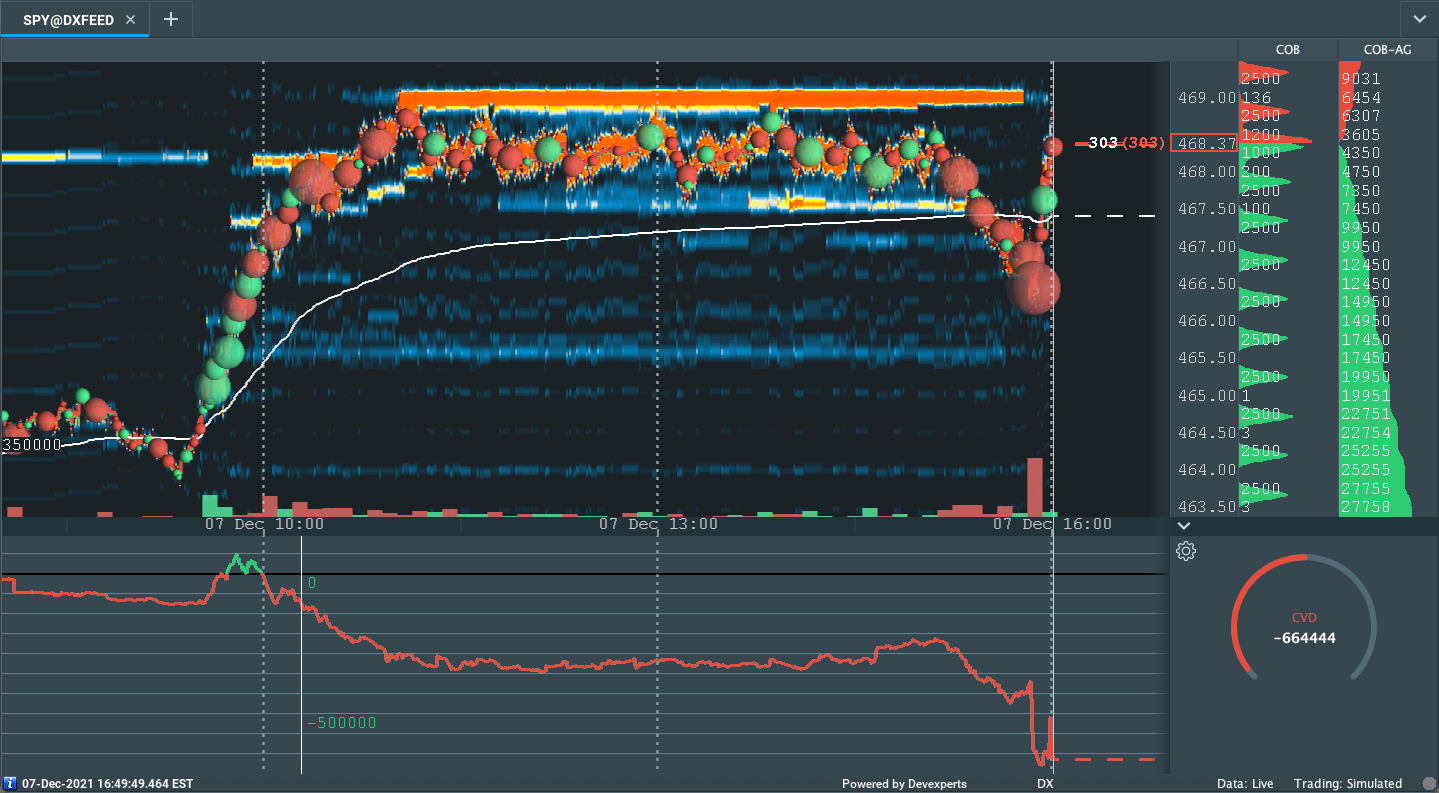
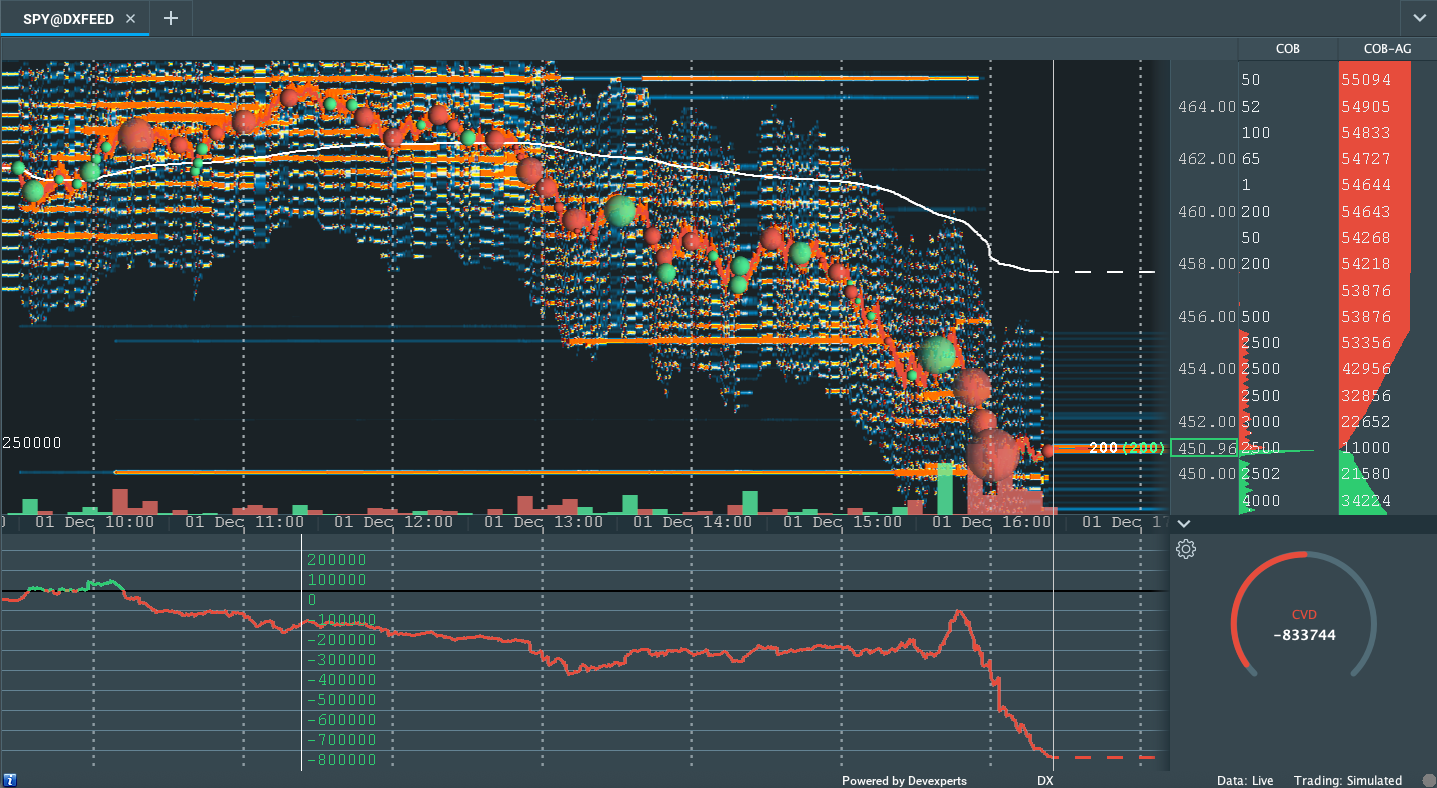
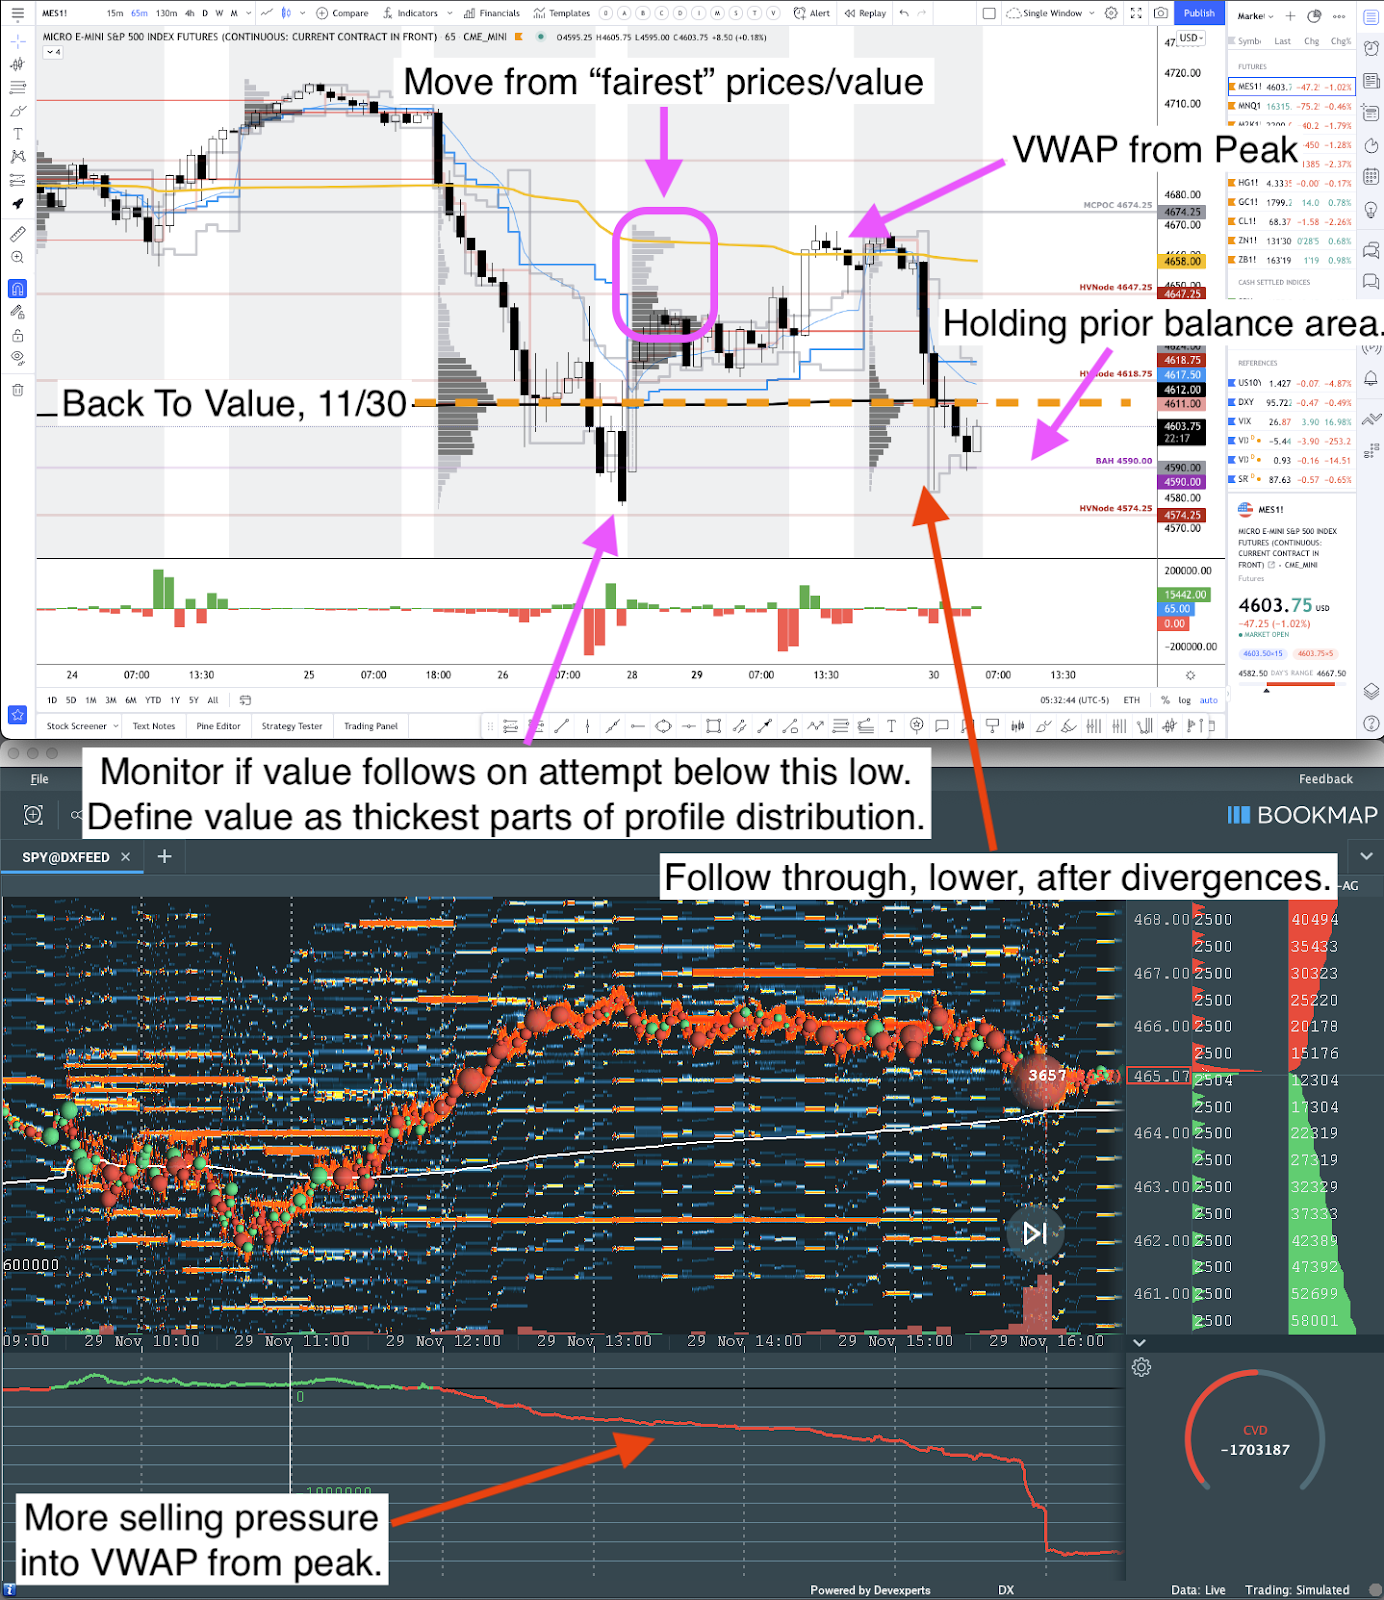
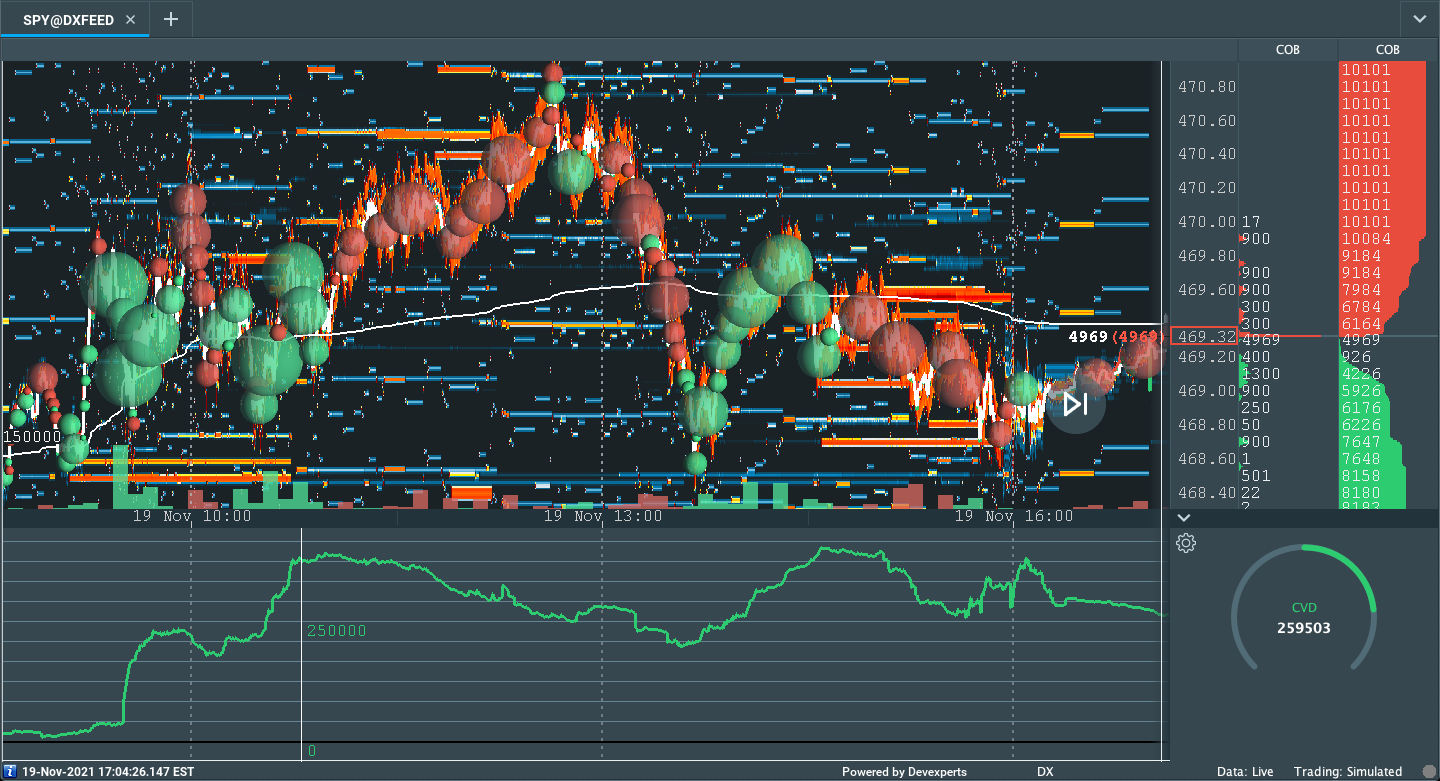
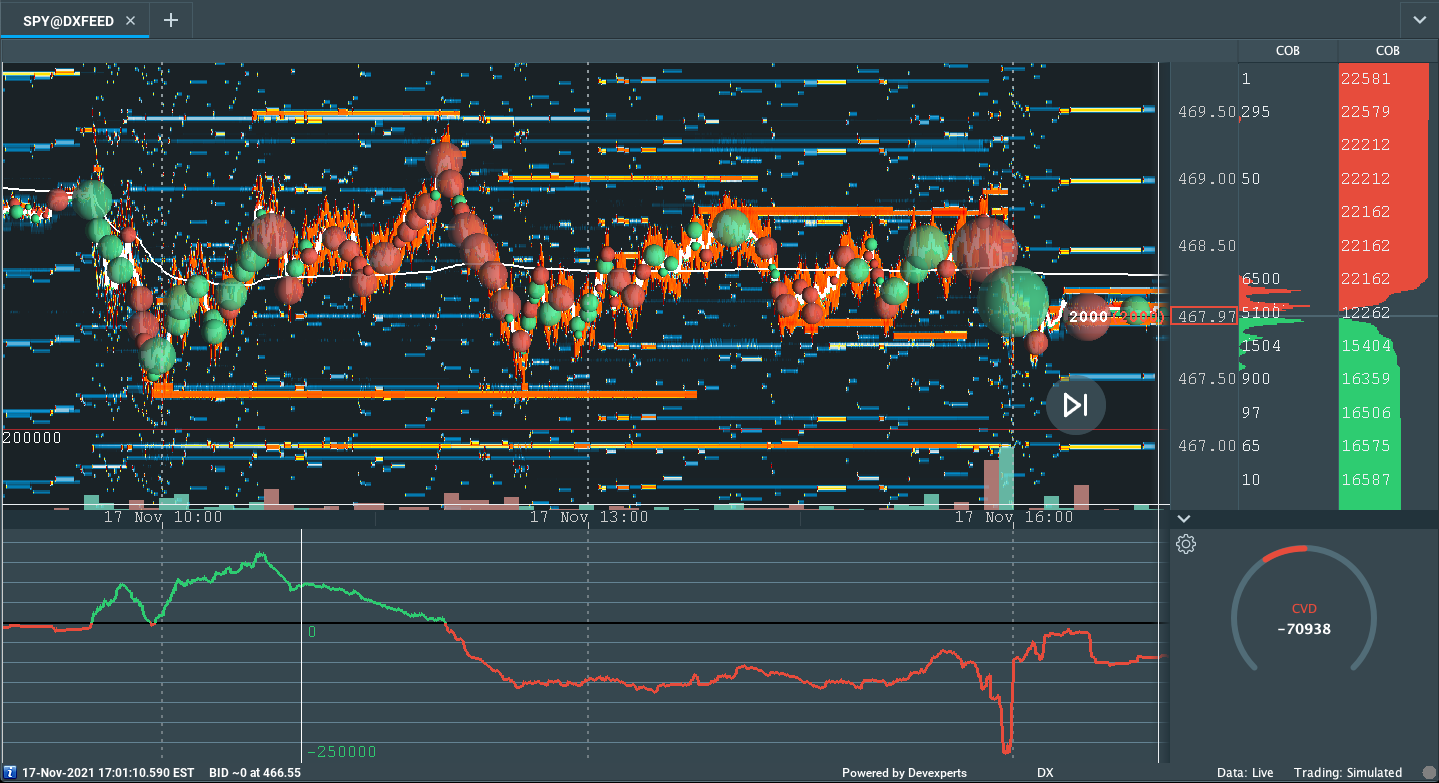
Selling carried-forward, overnight, as the S&P 500 made it through the low-end of balance before finding responsive buyers at an anchored volume-weighted average price (VWAP) level, at which liquidity algorithms are benchmarked and programmed to buy and sell.
As noted many sessions ago, prior discovery left gaps and p-shaped emotional, multiple-distribution profile structures (i.e., old-money covering shorts).
Participants are now revisiting, repairing, and strengthening – building out areas of high volume (HVNodes) via the cave-fill process – these areas of low volume (LVNodes).

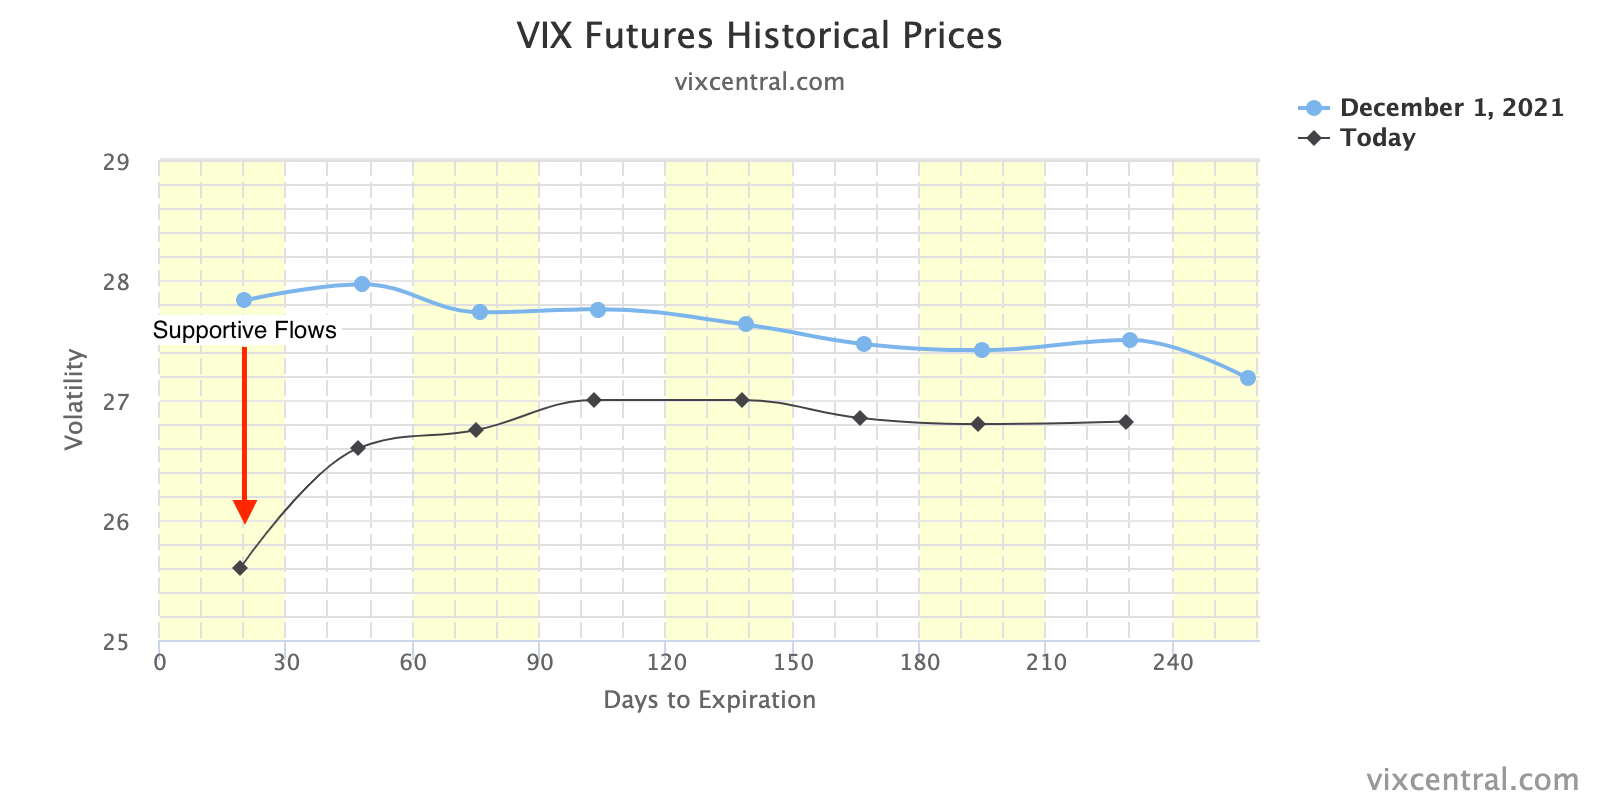
Context: The S&P 500 can’t seem to crack the pin beneath $4,700.00.
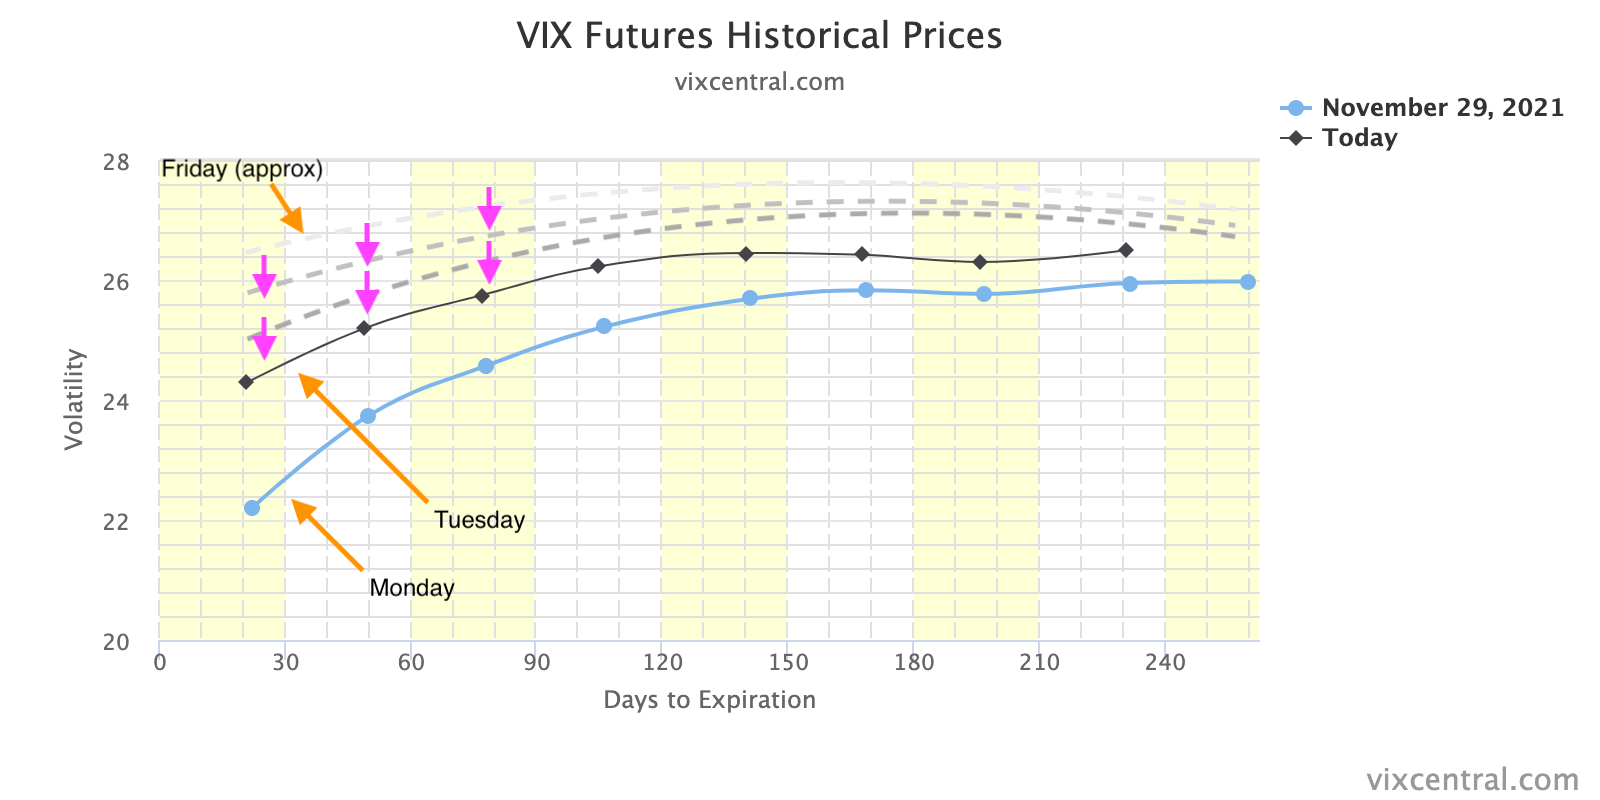
This pin is the result of customers committing capital to bets on low volatility into this week’s Federal Open Market Committee (FOMC) meeting and Friday’s large derivatives expiry.

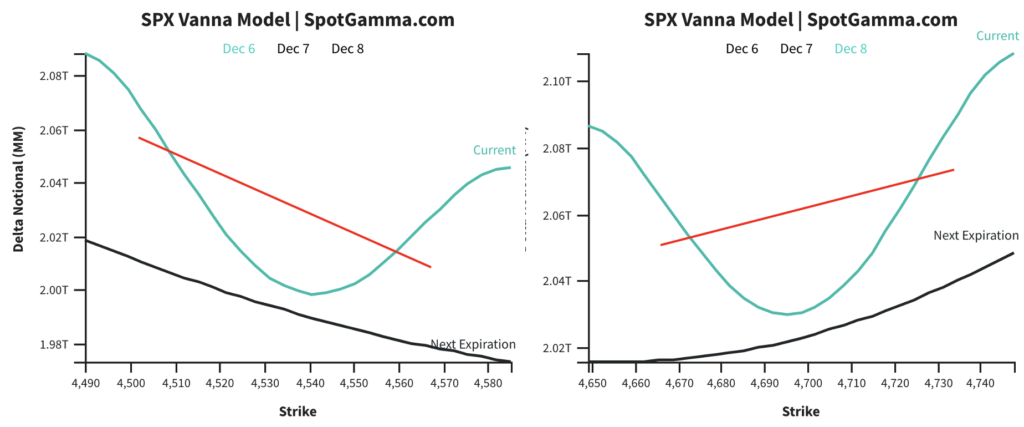
According to SpotGamma, participants are increasing their short-delta exposure (via a lot of call selling and a bit of put buying).
In hedging their rising (declining) long-delta exposure, the dealer or counterparty to this positioning will sell (buy) futures into strength (weakness).
This forces the market into a consolidation.
This trend ought to continue until (A) there’s a collapse in event-related implied volatility which would bring in positive flows as dealers cover static hedges, (B) the poor breadth and single-stock weakness feeds into feverishly destabilizing demand for downside protection, or (C) participants commit more capital to calls further out in time and higher in price.
We talk about the implications of options positioning mainly because it is a growing market that provides a clear indication of how participants (no matter how large) are positioned.

Also, with FOMC approaching, the “other” timeframe participant (e.g., the hedge funds and institutions behind impactful buy/sell programs) is likely awaiting policy clarity to reposition.

As Mind Over Markets author James Dalton best explained: “Market participants balance their positions in expectation of the market’s reaction to the external stimuli – there is simply no activity. Trade is not being facilitated in any direction, for there is little participation and no confidence.”
Notwithstanding, last night, we broke a multi-session balance area. Based on profile theory, a new trend may begin. Context, though, suggests otherwise.
Participants (large in size) are seeking clarity and, given the market’s responsiveness to technical levels, weaker, less well-capitalized short-term participants are in control.
Therefore, we ought to discount (give less weight to) what happens in the coming days.
If later this week, participants are assuaged of their fears surrounding monetary policy, a collapse in event-related implied volatility ought to bring in positive flows as the long delta (from dealers’ exposure to short puts) decreases.
The decrease in dealer supply (short delta), via covering of short stock/futures hedges, would bolster any attempt higher.
According to SpotGamma, if “interest in call options was to grow (evidenced by a shift higher in the Call Wall), a rally into (and beyond) end-of-year is further affirmed.”
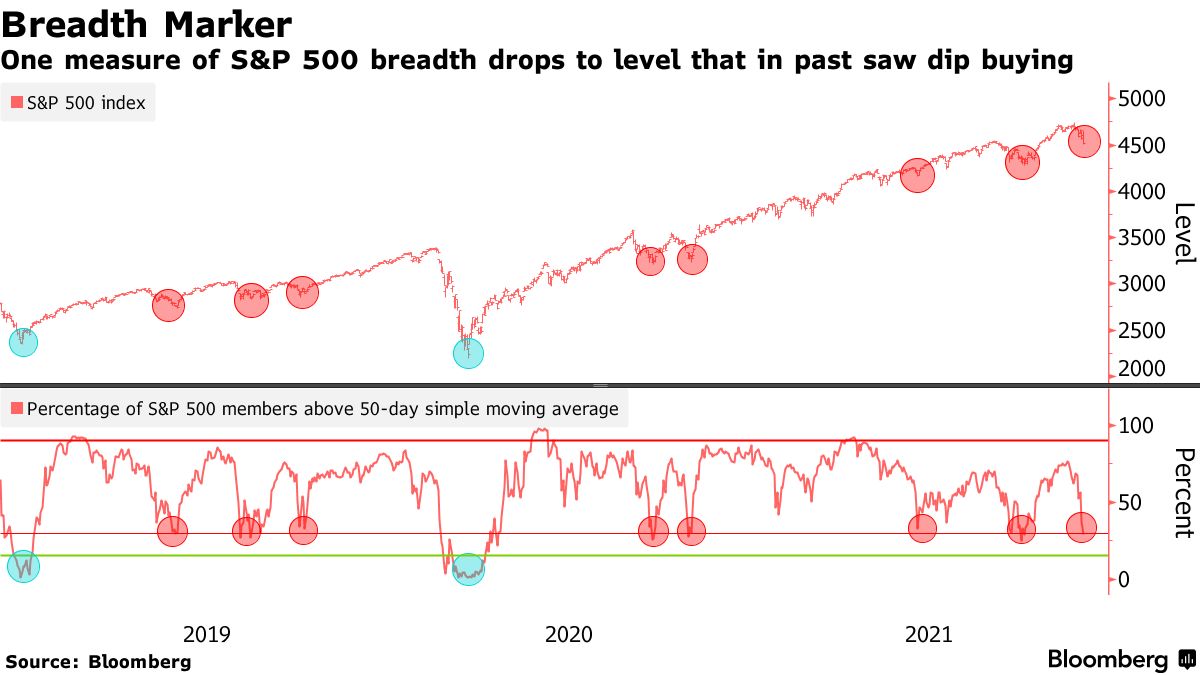
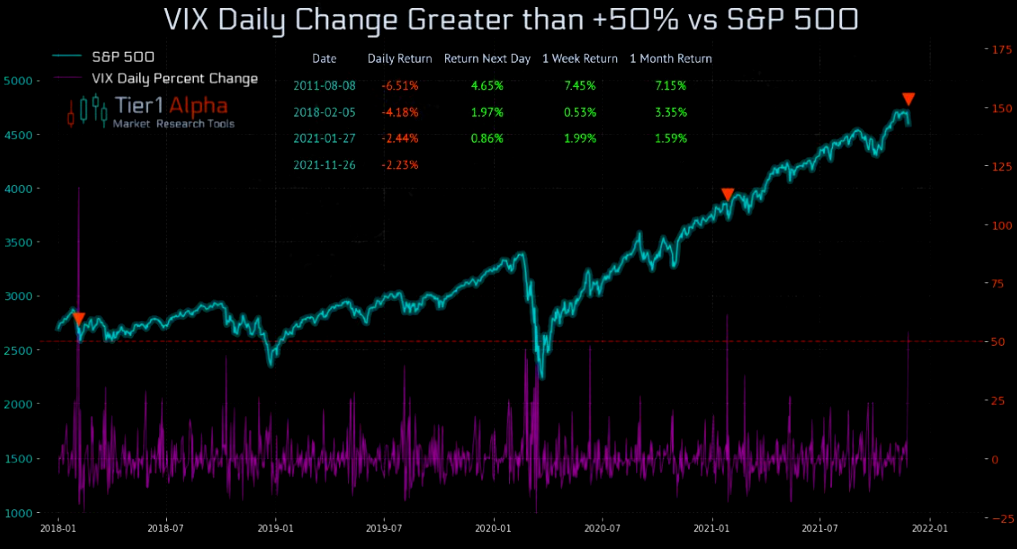
That’s not to say that some of the vulnerabilities like participants’ large exposure to leveraged products (which increases the speed with which volatility is realized) couldn’t prompt a round of destabilizing demand for downside protection.
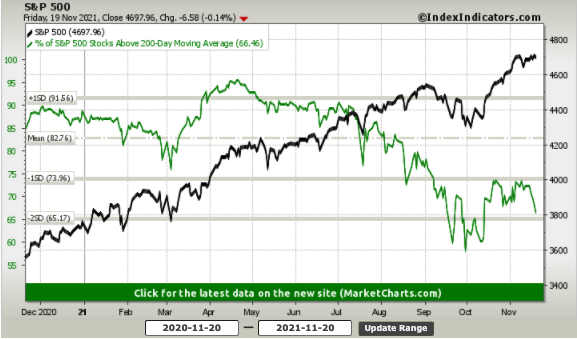
So, the question is whether the few companies leading this year’s rally can continue to lead?
Or, in light of recent exuberance in heavy-weights like Apple Inc (NASDAQ: AAPL), in which participants are underexposed to downside protection, post-FOMC demand for protection bids volatility and results in a destabilizing, reflexive reaction on the part of dealers.

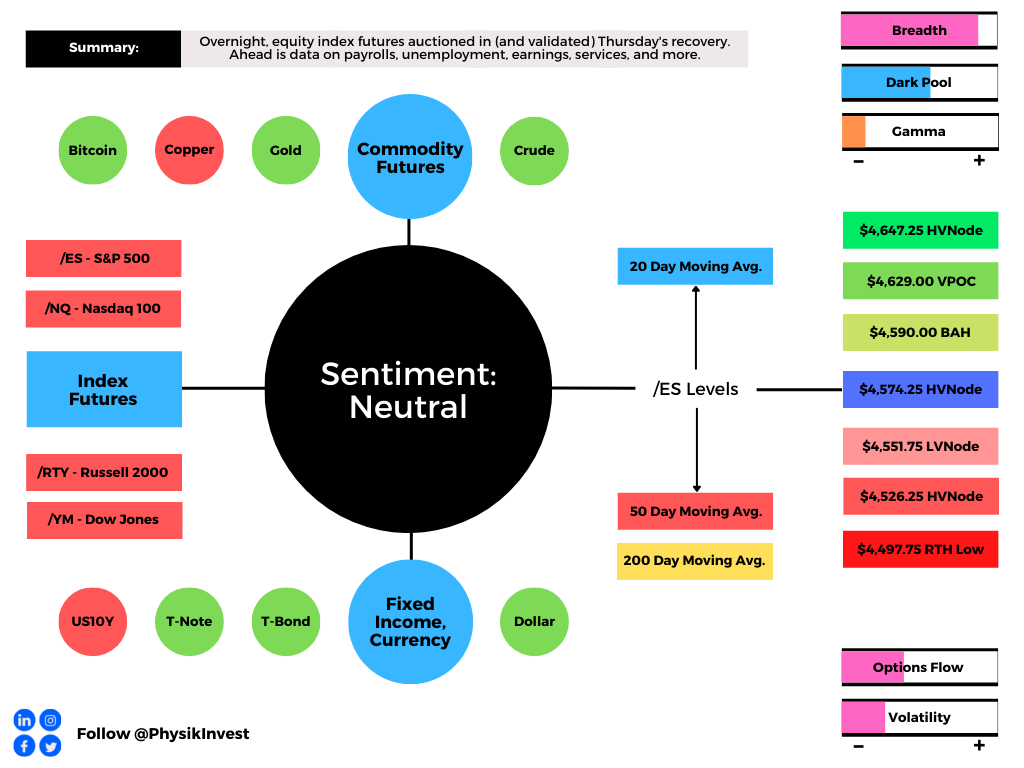
Expectations: As of 6:30 AM ET, Tuesday’s regular session (9:30 AM – 4:00 PM ET), in the S&P 500, will likely open in the lower part of a balanced overnight inventory, outside of prior-range and -value, suggesting a potential for immediate directional opportunity.
Balance-Break + Gap Scenarios: A change in the market (i.e., the transition from two-time frame trade, or balance, to one-time frame trade, or trend) is occurring.

Monitor for acceptance (i.e., more than 1-hour of trade) outside of the balance area.

Leaving value behind on a gap-fill or failing to fill a gap (i.e., remaining outside of the prior session’s range) is a go-with indicator.

Rejection (i.e., return inside of balance) portends a move to the opposite end of the balance.
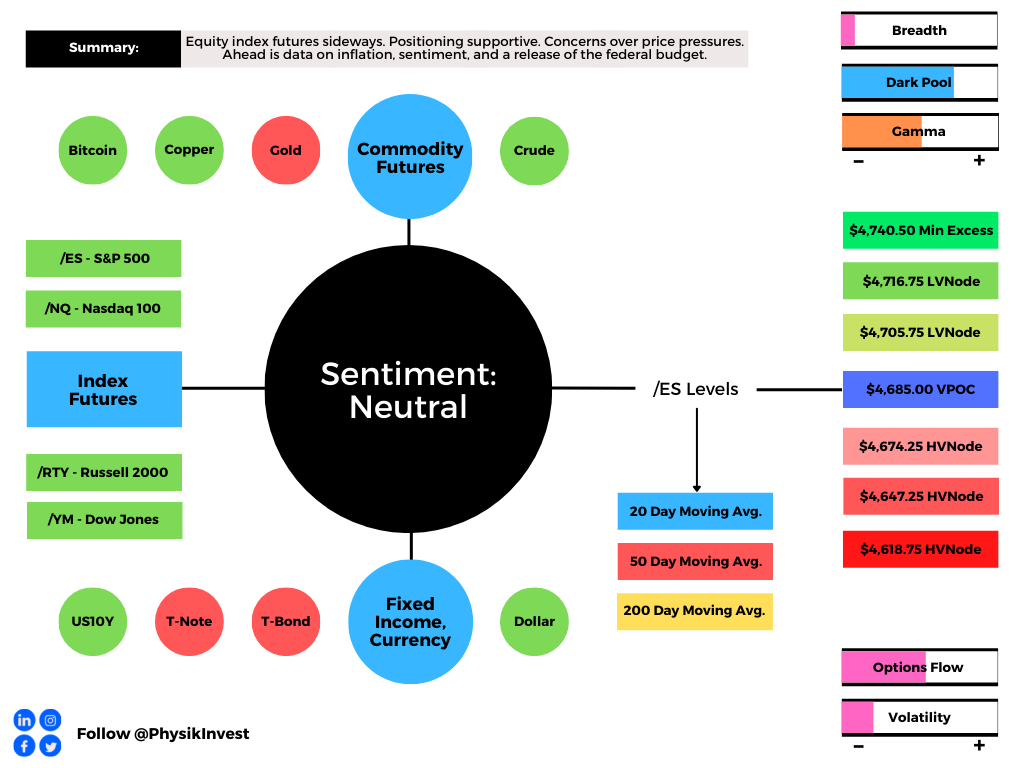
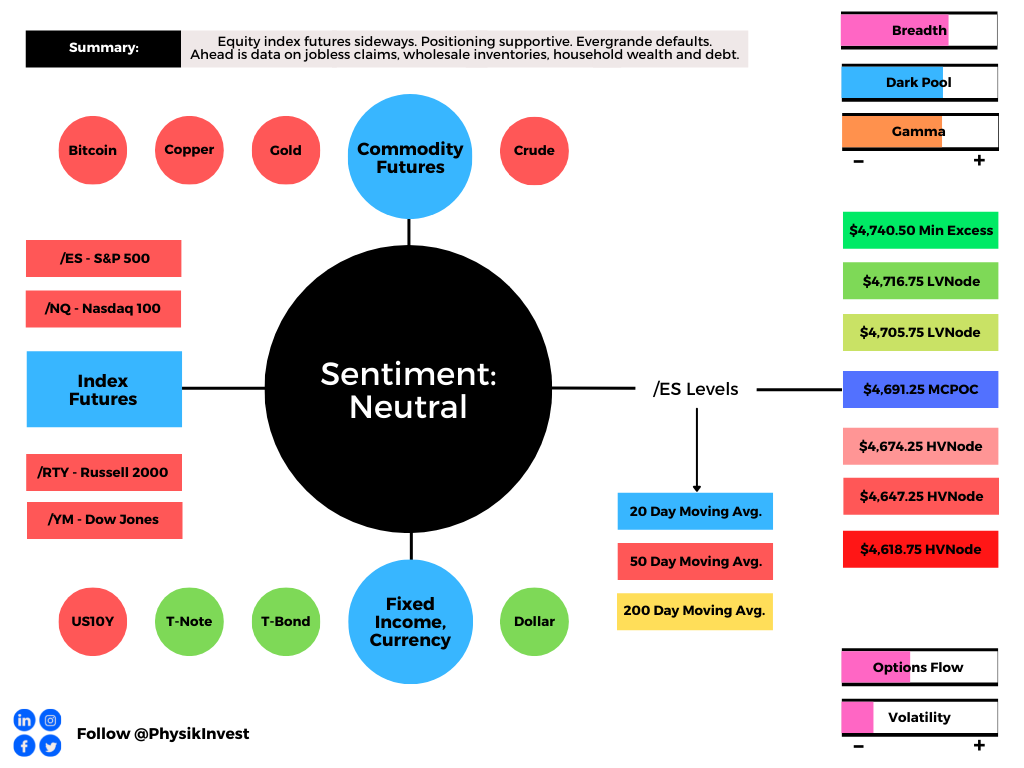
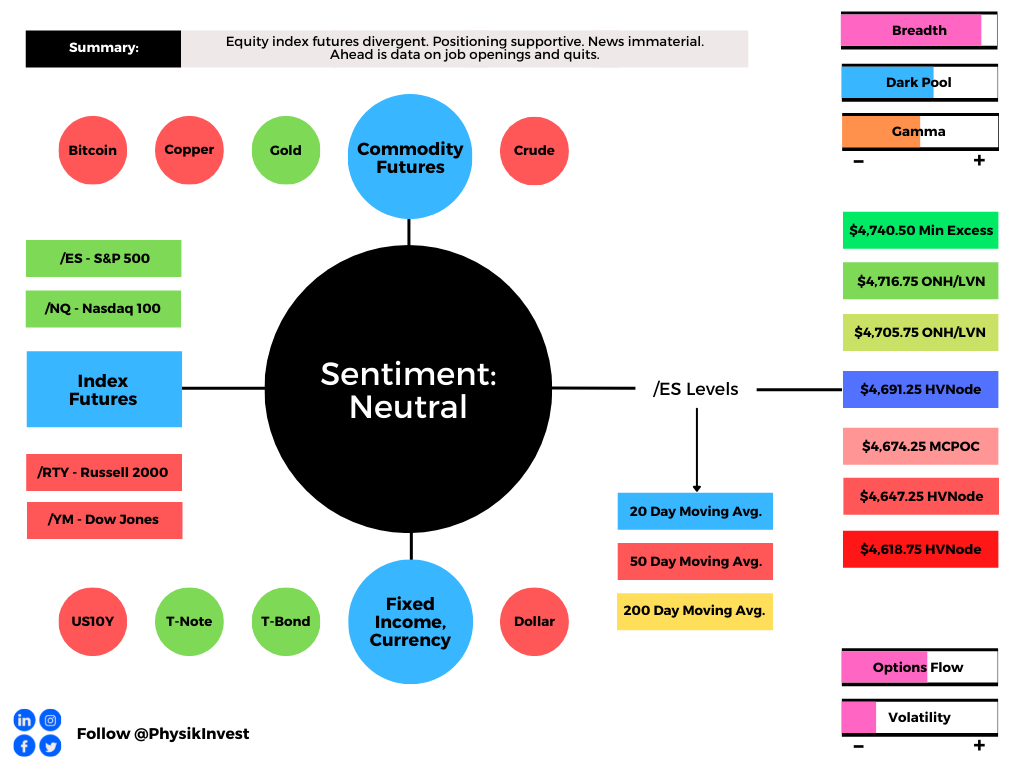
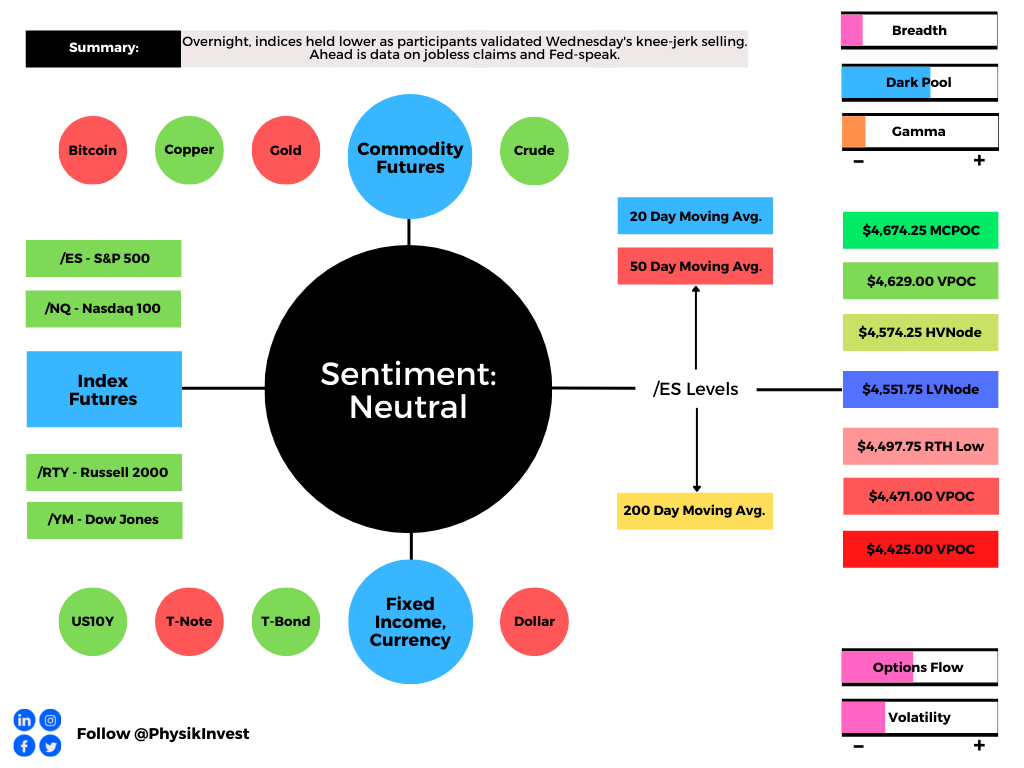
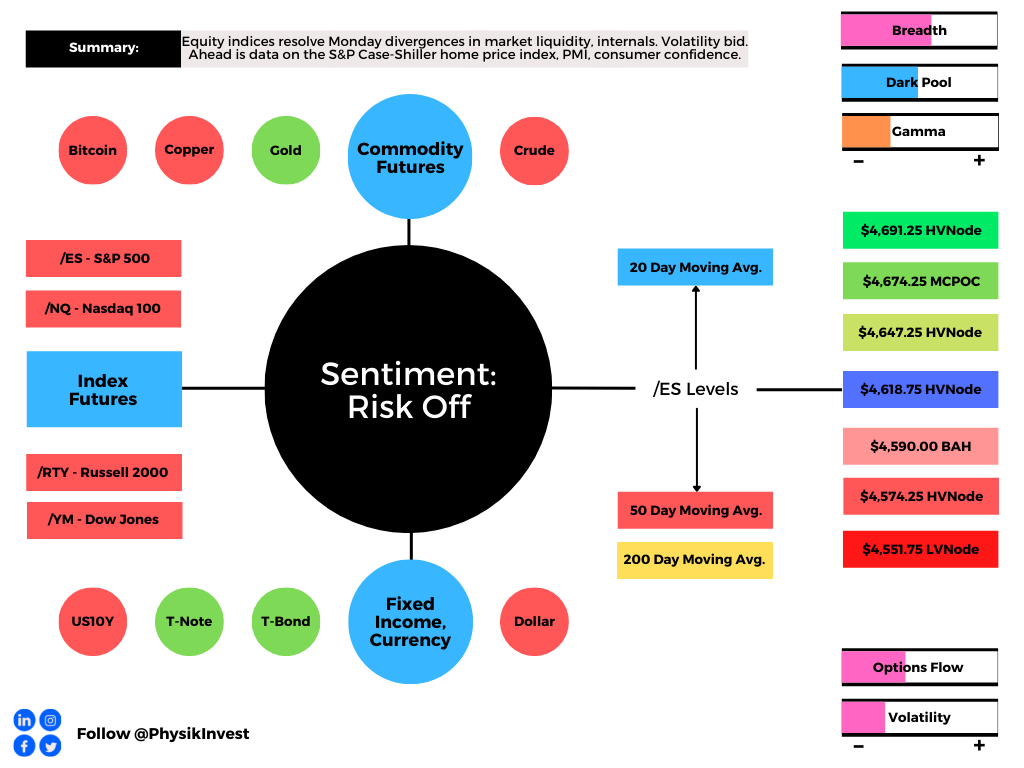
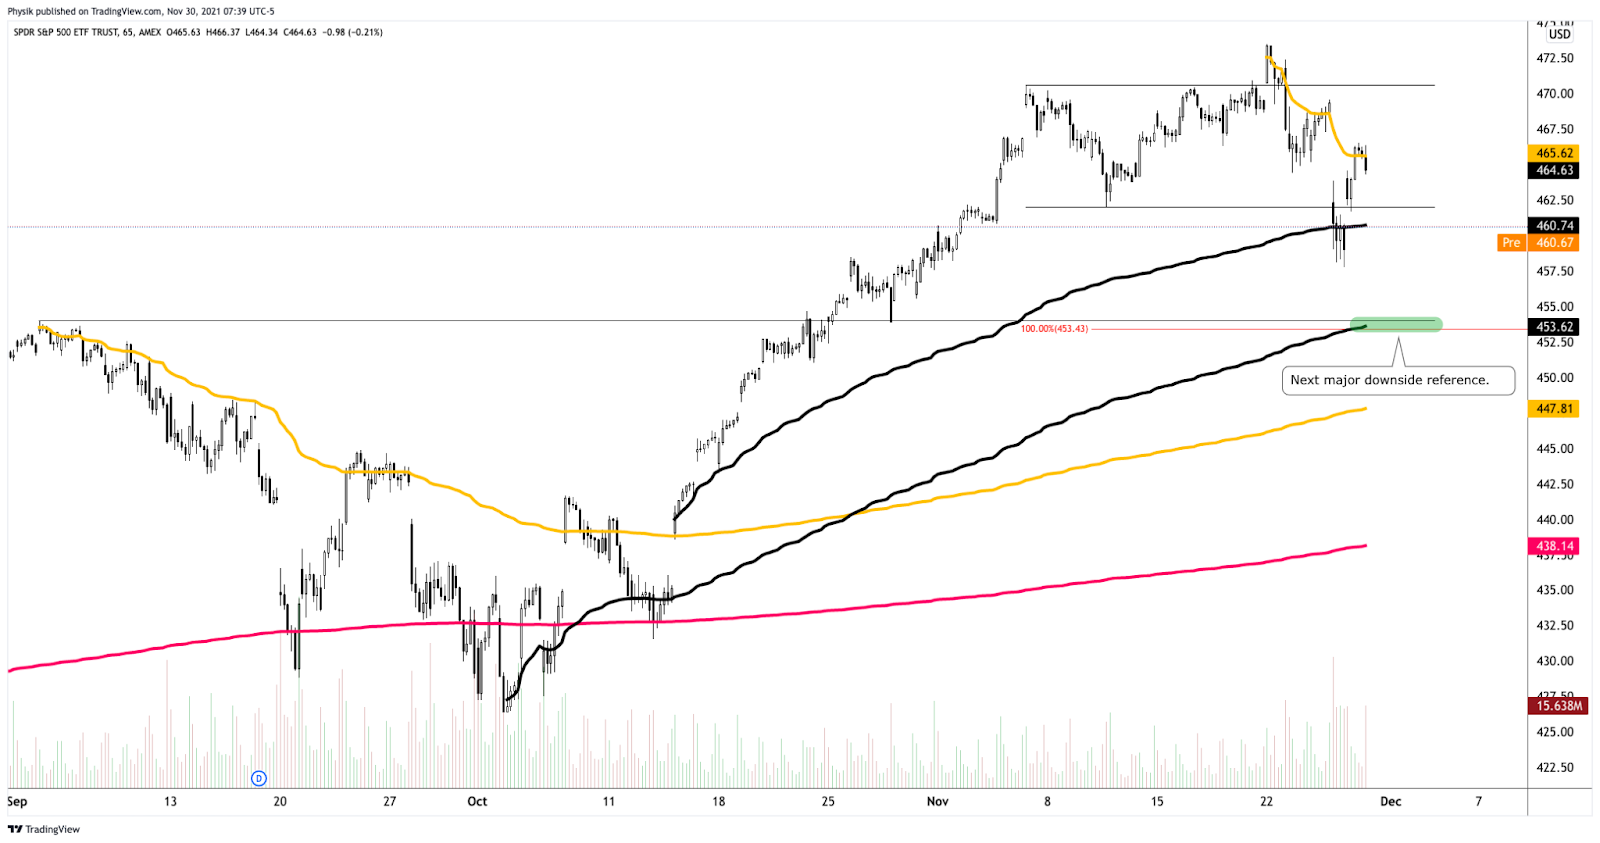
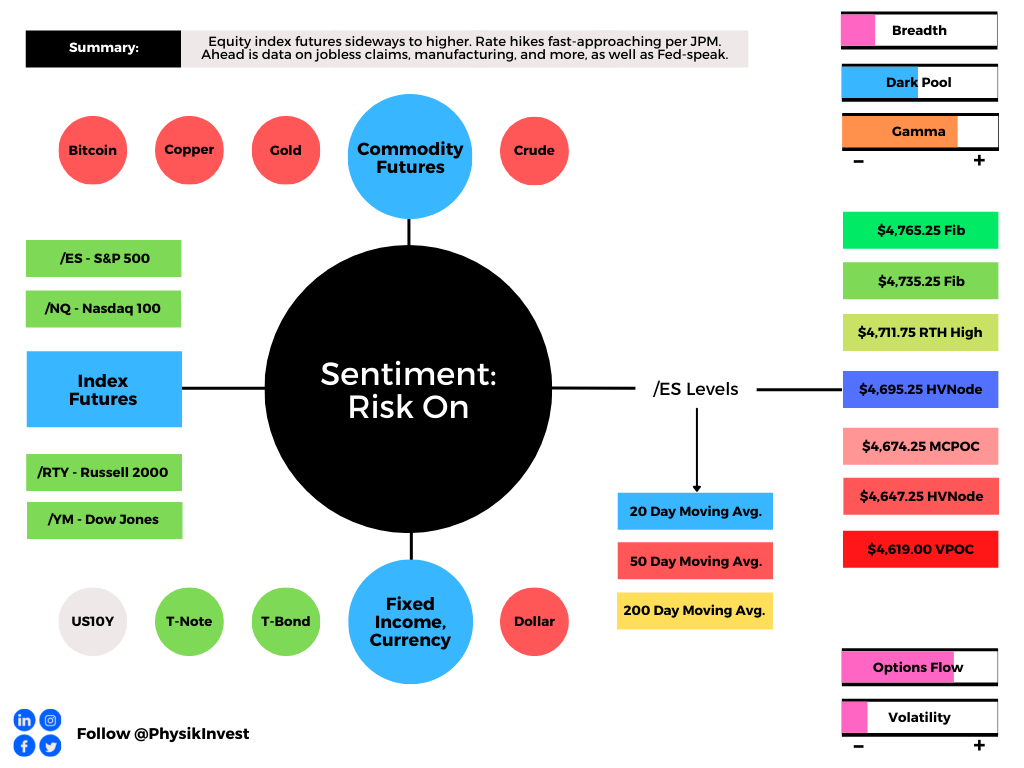
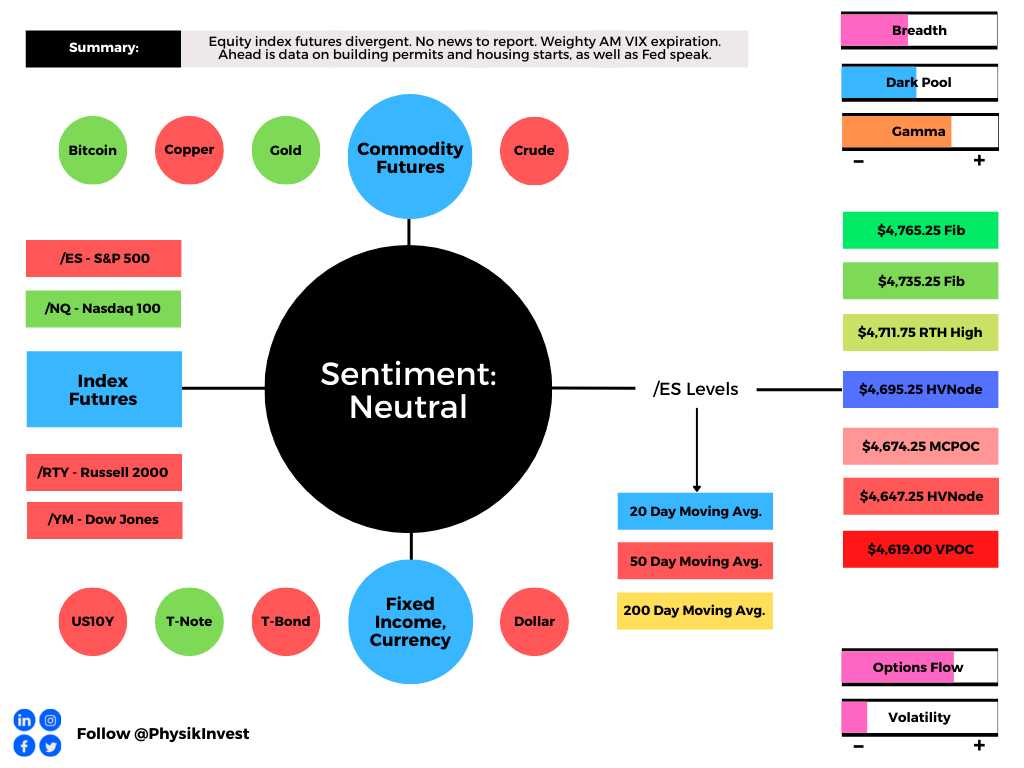
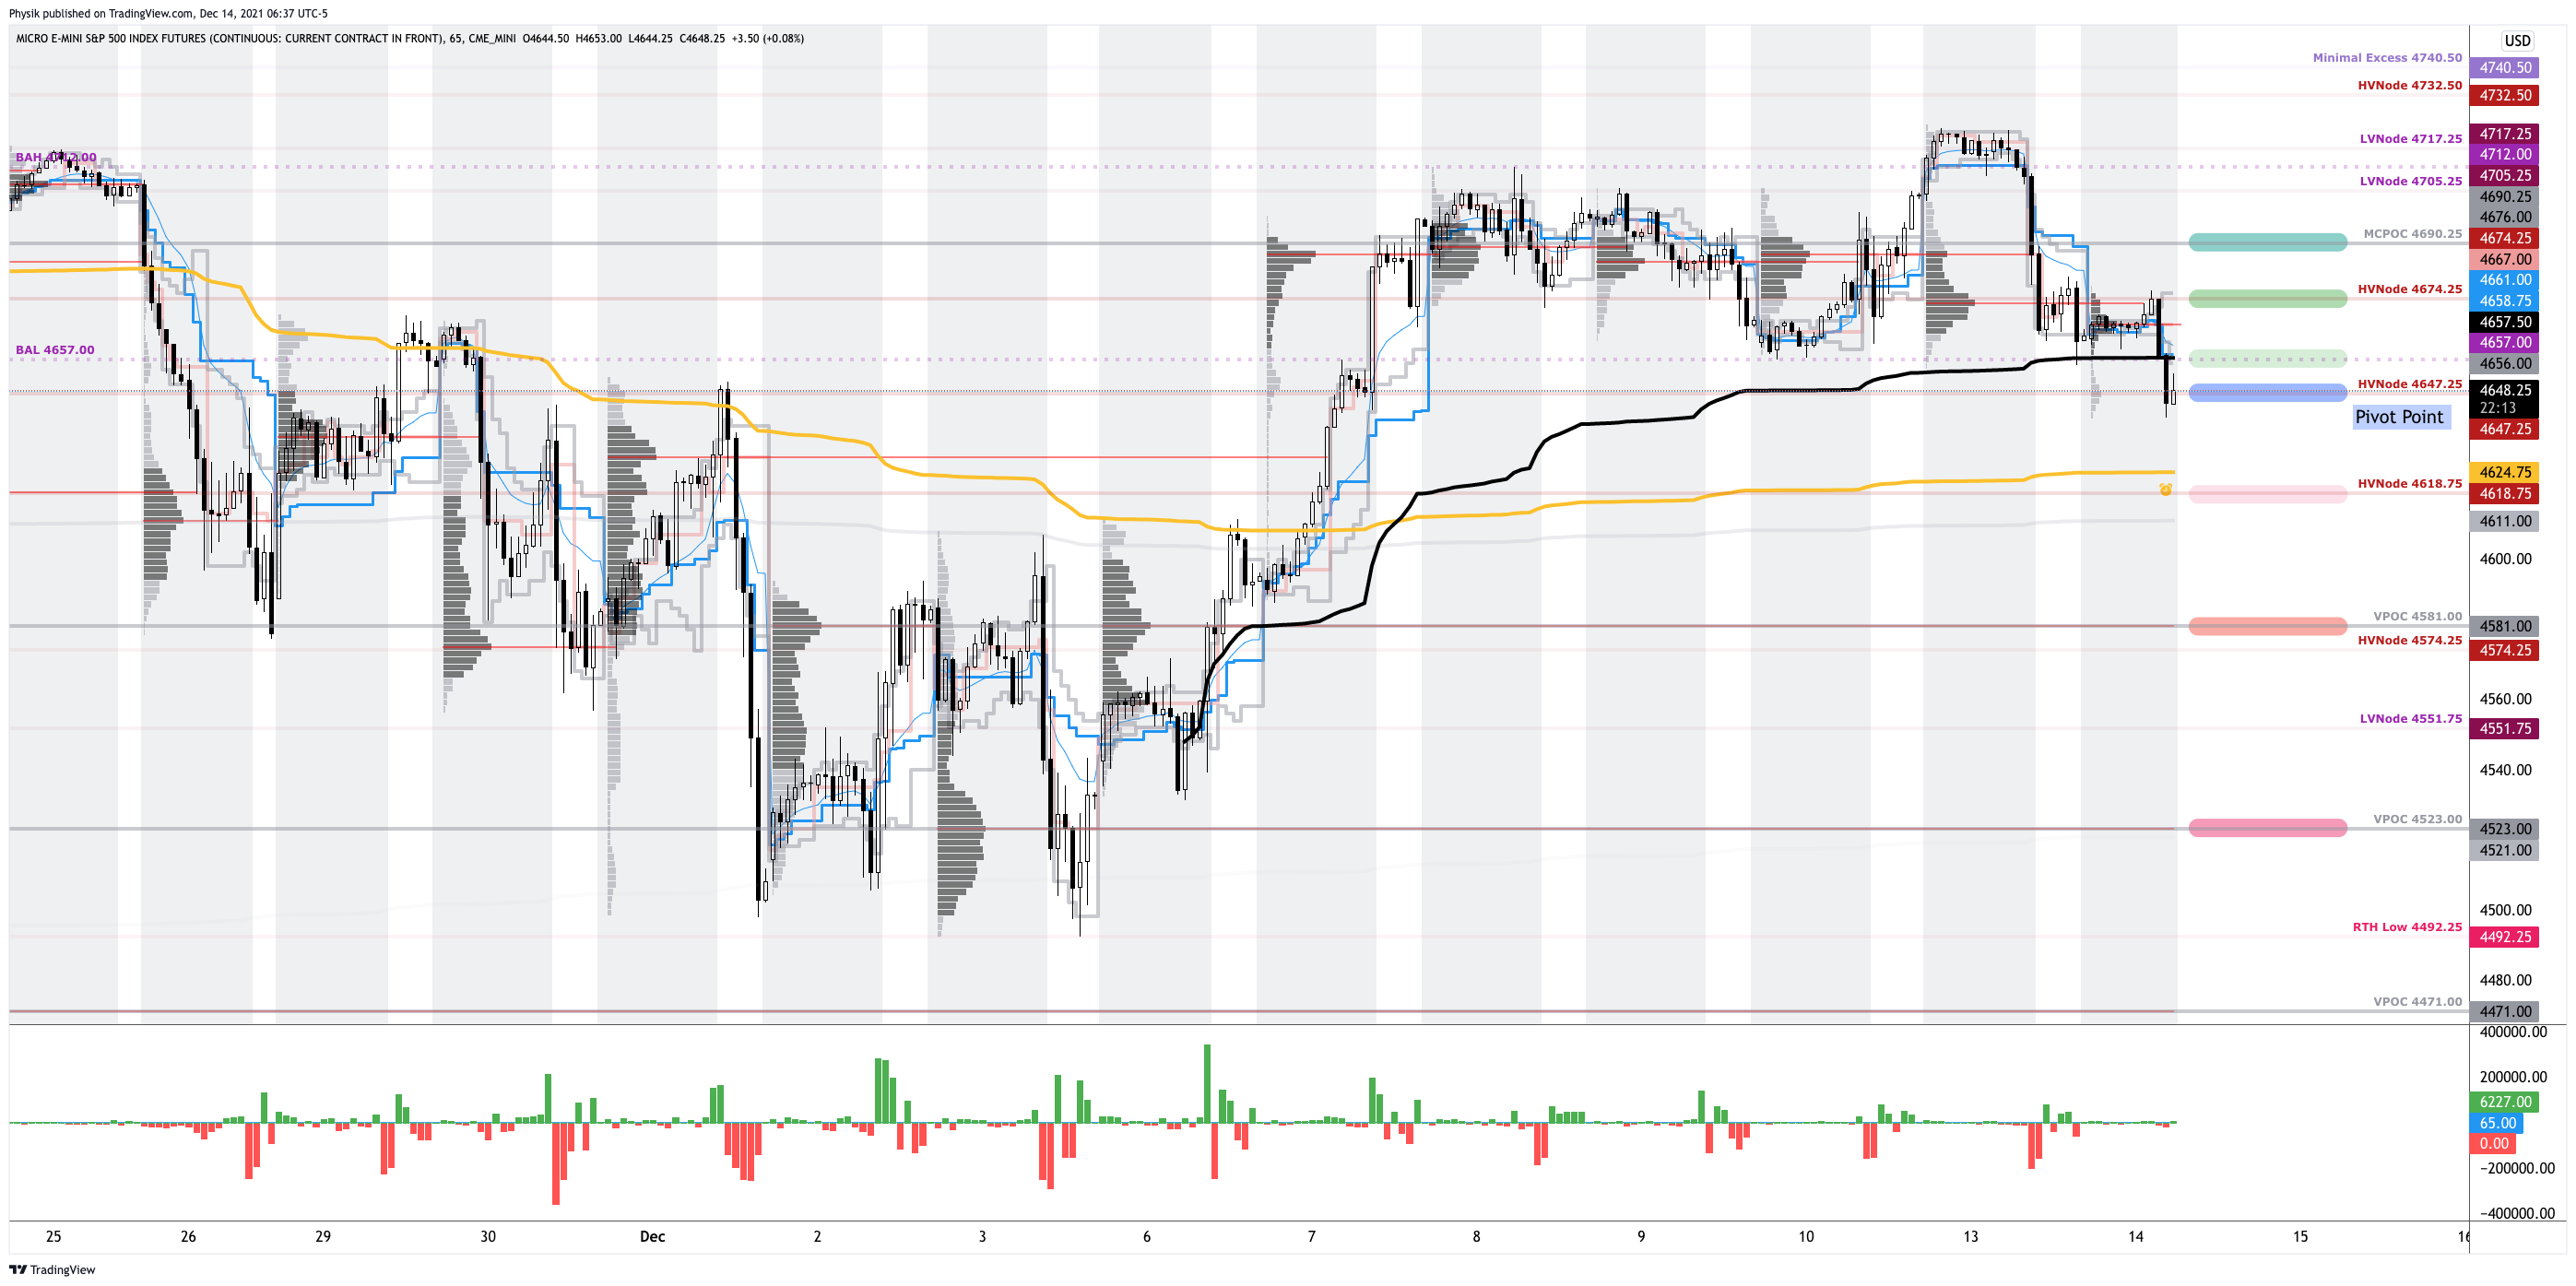
In the best case, the S&P 500 trades sideways or higher; activity above the $4,647.25 HVNode puts in play the $4,657.00 balance area low (BAL). Initiative trade beyond the BAL could reach as high as the $4,674.25 HVNode and $4,690.25 micro composite point of control (MCPOC), or higher.
In the worst case, the S&P 500 trades lower; activity below the $4,647.25 HVNode puts in play the $4,618.75 HVNode. Initiative trade beyond the latter could reach as low as the $4,581.00 and $4,523.00 untested point of control (VPOC), or lower.
Click here to load today’s key levels into the web-based TradingView charting platform. Note that all levels are derived using the 65-minute timeframe. New links are produced, daily.

What People Are Saying
Definitions
Cave-Fill Process: Widened the area deemed favorable to transact at by an increased share of participants. This is a good development.
Volume Areas: A structurally sound market will build on areas of high volume (HVNodes). Should the market trend for long periods of time, it will lack sound structure, identified as low volume areas (LVNodes). LVNodes denote directional conviction and ought to offer support on any test.
If participants were to auction and find acceptance into areas of prior low volume (LVNodes), then future discovery ought to be volatile and quick as participants look to HVNodes for favorable entry or exit.
Liquidation Breaks: The profile shape suggests participants were “too” long and had poor location.
POCs: POCs are valuable as they denote areas where two-sided trade was most prevalent in a prior day session. Participants will respond to future tests of value as they offer favorable entry and exit.
MCPOCs: POCs are valuable as they denote areas where two-sided trade was most prevalent over numerous day sessions. Participants will respond to future tests of value as they offer favorable entry and exit.
Options Expiration (OPEX): Traditionally, option expiries mark an end to pinning (i.e, the theory that market makers and institutions short options move stocks to the point where the greatest dollar value of contracts will expire) and the reduction dealer gamma exposure.
Initiative Buying (Selling): Buying (selling) within or above (below) the previous day’s value area.
Responsive Buying (Selling): Buying (selling) in response to prices below (above) an area of recent price acceptance.
Price Discovery (One-Timeframe Or Trend): Elongation and range expansion denotes a market seeking new prices to establish value, or acceptance (i.e., more than 30-minutes of trade at a particular price level).
Balance (Two-Timeframe Or Bracket): Rotational trade that denotes current prices offer favorable entry and exit. Balance-areas make it easy to spot a change in the market (i.e., the transition from two-time frame trade, or balance, to one-time frame trade, or trend).
Modus operandi is responsive trade (i.e., fade the edges), rather than initiative trade (i.e., play the break).
Excess: A proper end to price discovery; the market travels too far while advertising prices. Responsive, other-timeframe (OTF) participants aggressively enter the market, leaving tails or gaps which denote unfair prices.
Value-Area Placement: Perception of value unchanged if value overlapping (i.e., inside day). Perception of value has changed if value not overlapping (i.e., outside day). Delay trade in the former case.
About
After years of self-education, strategy development, and trial-and-error, Renato Leonard Capelj began trading full-time and founded Physik Invest to detail his methods, research, and performance in the markets.
Additionally, Capelj is a Benzinga finance and technology reporter interviewing the likes of Shark Tank’s Kevin O’Leary, JC2 Ventures’ John Chambers, and ARK Invest’s Catherine Wood, as well as a SpotGamma contributor, helping develop insights around impactful options market dynamics.
Disclaimer
At this time, Physik Invest does not carry the right to provide advice. In no way should the materials herein be construed as advice. Derivatives carry a substantial risk of loss. All content is for informational purposes only.