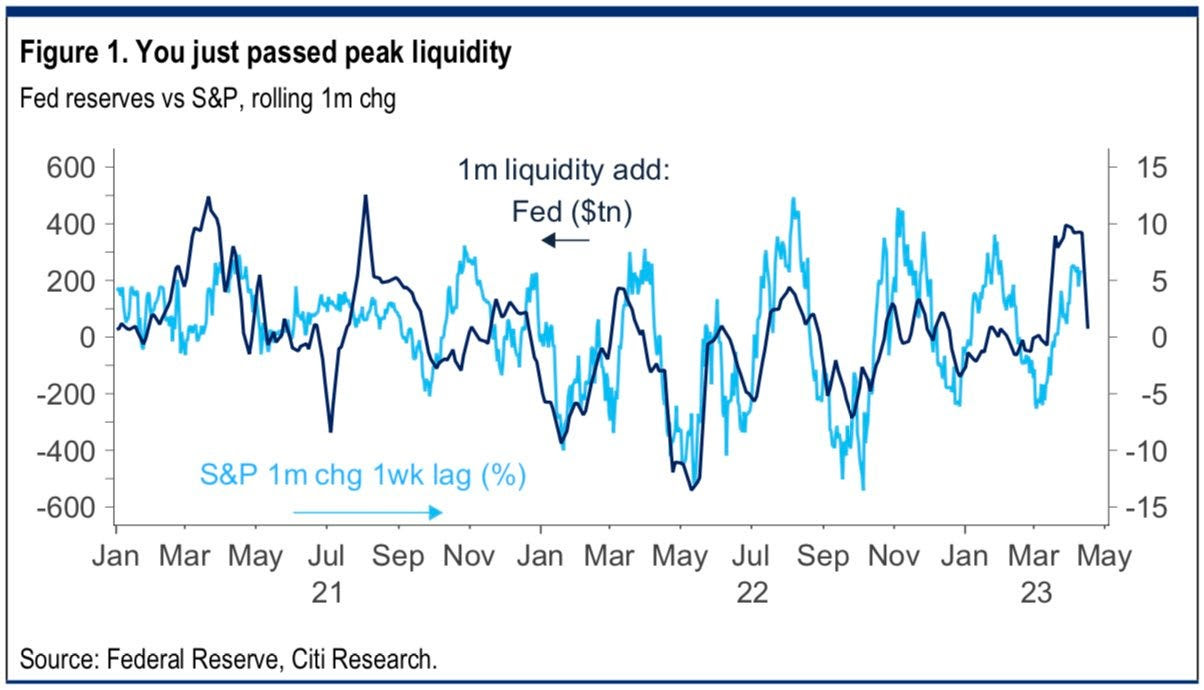
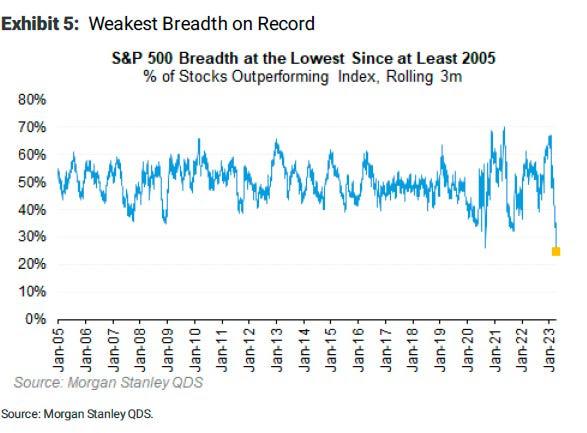
Leading up to the recent decline, market breadth (measuring how many stocks participate in a market move) had weakened. While a handful of dominant stocks masked the weakness, the underlying market was thinning out. Such dispersion [1] [2] [3], where some stocks surge while others lag, can create an illusion of stability in some market environments.
At the same time, liquidity—cash and credit availability—steadily drained from the system. Mechanisms like the reverse repo facility (where banks park excess cash with the Federal Reserve), the Treasury General Account (the government’s cash balance), and money market flows help offset [1] shortfalls. However, this time, they offered little cushion.
New policies—such as tariffs and trade restrictions—reinforce market trends and drive investors toward safer assets like bonds. There is a growing preference for lower bond yields over short-term stock market gains.
While the Federal Reserve controls short-term interest rates, long-term rates are more influenced by broader factors such as inflation expectations, economic growth, and investor sentiment.
Although lower long-term rates can support risk assets, their more immediate and significant impact is on the broader economy. Lowering them reduces borrowing costs for homeowners and businesses, encouraging investment and consumption. Additionally, lowering these yields helps with servicing government debt burdens and improving fiscal stability.
The shifts are intentional. Policymakers are transitioning the economy from dependence on government stimulus, but this adjustment comes with growing pains. Policy narratives and actions may weaken markets and slow economic activity in the short term. One reason receiving attention is the wealth effect—wealthier households, who drive a significant share of consumer spending, tend to spend more when stocks rise. Conversely, market drops can curb this effect and feed an economic slowdown.
Graphic: Retrieved from Bloomberg via @amitisinvesting.
Positioning Context: Setting Up For A Rip
History doesn’t repeat, but it often rhymes. Today’s setup echoes late summer 2024, albeit without the sharp volatility repricing. The difference? This time, investors were prepared, with hedges to act as insurance against market turmoil. The selling has been orderly, creating an illusion of stability and sustaining optimism.
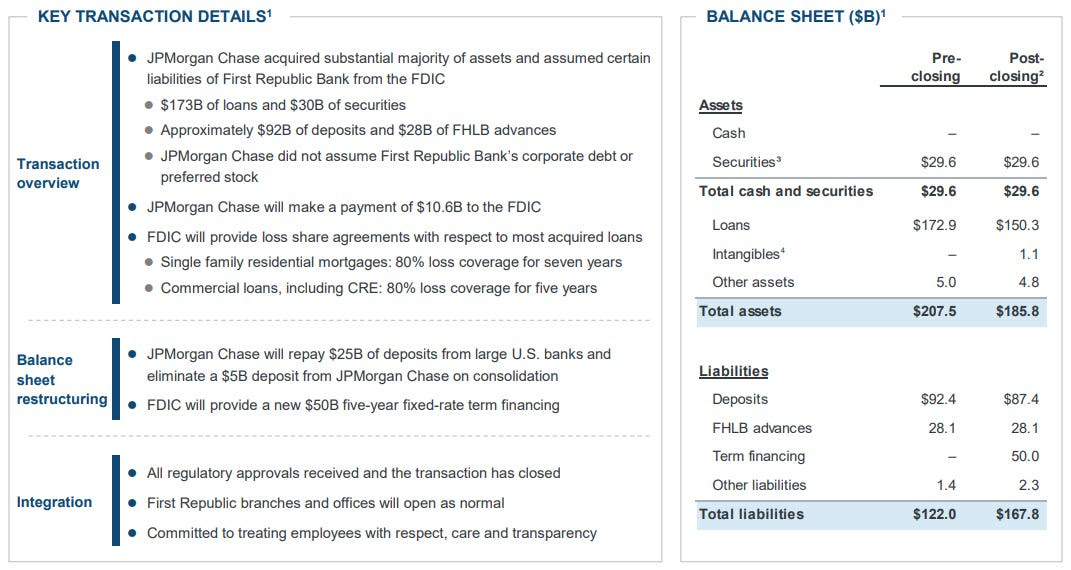
Graphic: Retrieved from JPMorgan Chase via @Marlin_Capital.
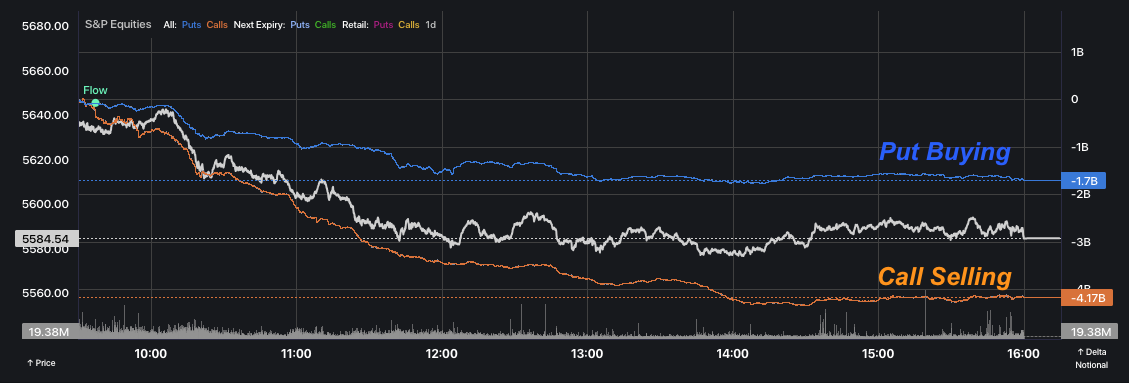
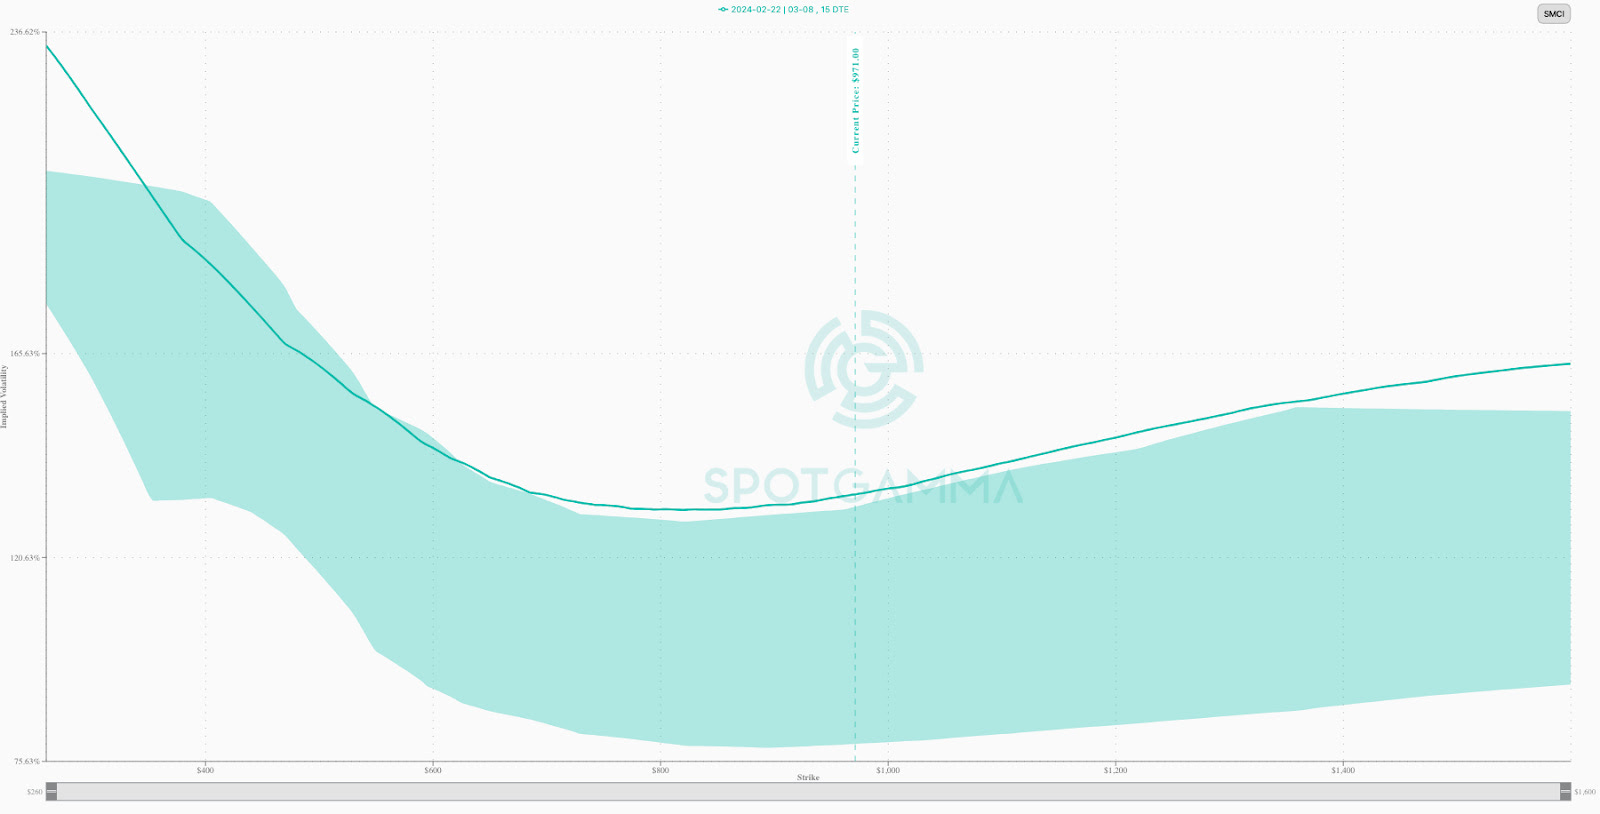
This ongoing decline began in mid-February, coinciding with the unwinding of significant amounts of call options—contracts to buy stocks at a set price. This added indirect pressure on the market through hedging-related flows.
SpotGamma expresses this view, highlighting that the February expiration was “call-weighted” due to strong stock performance leading up to it. This increased the likelihood of a pullback, as call sellers unwound their long stock hedges—a simplified explanation, as other offsetting positions may also be in play.
Graphic: Retrieved from SpotGamma.
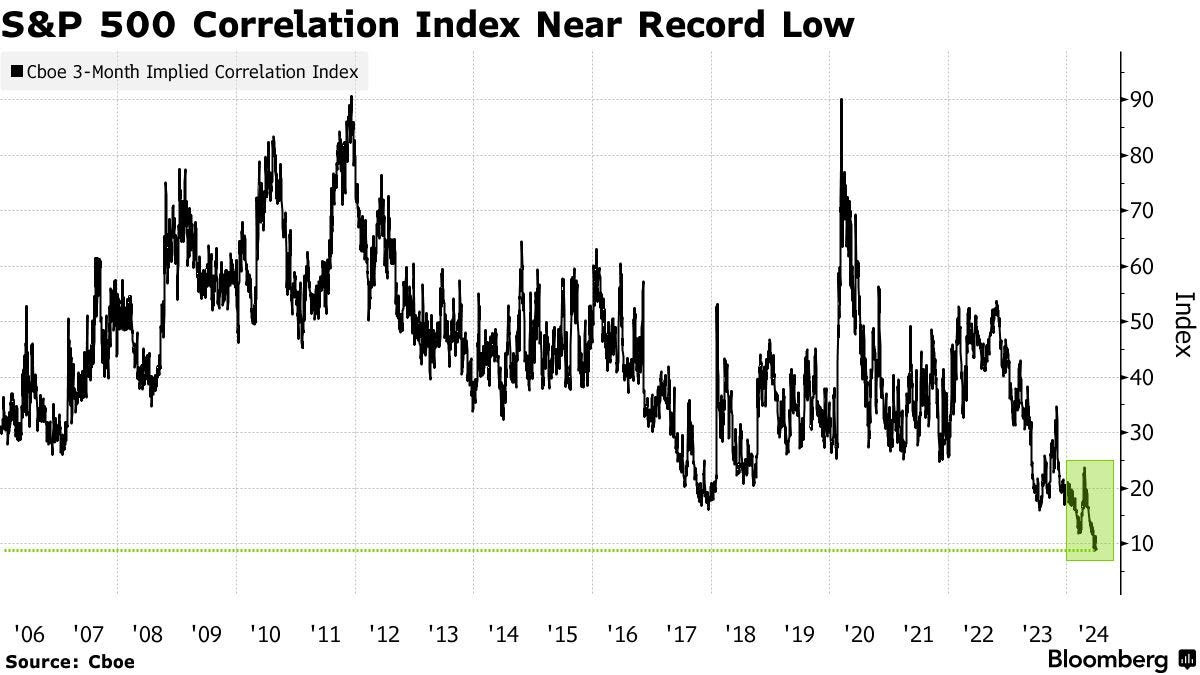
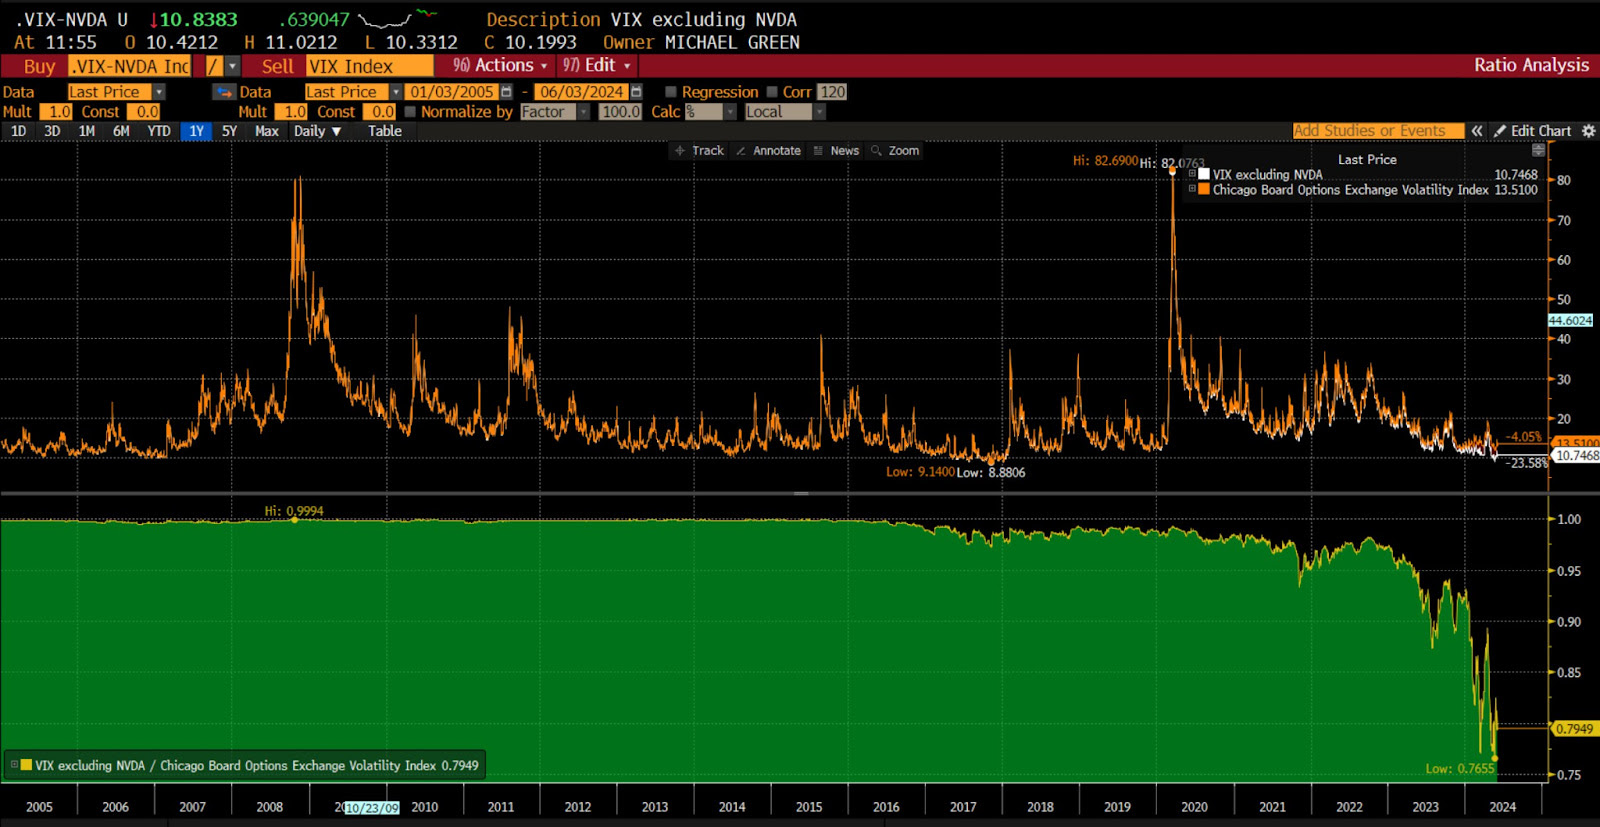
At the same time, after market shocks in August and December 2024, investors focused more on guarding against sudden volatility spikes rather than hedging against a broader market downturn. This pattern is familiar—the S&P 500 and the Cboe Volatility Index (VIX), which measures expected market volatility, sometimes rise together ahead of market peaks.
Meanwhile, within market supply dynamics, this activity has effectively set a floor under VIX pricing, as reflected in the VVIX trending higher since the volatility of late last summer.
Graphic: Retrieved from TradingView.
The result? Despite preparations for increased volatility, it hasn’t materialized, frustrating hedge holders and making it harder to identify a market bottom typically marked by extreme volatility spikes. Even with a backwardated implied volatility term structure (where short-term volatility is priced higher than longer-term volatility), anxiety and market movements remain out of sync.
Graphic: Retrieved from TradingView. 1-month VIX less 3-month VIX.
Over time, some traders might shift to longer-dated options, while others might drop their hedges altogether, which could amplify volatility-selling behavior. Ironically, this could create the conditions for shocks they were trying to hedge against.
Given this environment, 2022’s playbook becomes relevant. Back then, investors—rattled by the COVID crash—were prepared, monetizing hedges into declines and keeping a lid on volatility. We may see parallels now. After last week’s economic data, hedgers have been supplying volatility back to the market, offering brief relief as we potentially enter a seasonally stronger period.
Graphic: Retrieved from SpotGamma.
The main takeaway? Current positioning dynamics indicate that investors have effectively managed and responded to the downside. While markets will be volatile, significant shocks may be delayed or avoided.
Graphic: Retrieved from SpotGamma and for illustrative purposes only. SPX prices X-axis. Option delta Y-axis. When the factors of implied volatility (Vanna) and time change (Charm), hedging ratios change. If investors hedge by selling stock to offset long put options, falling implied volatility (as seen in the skew chart above) leads them to buy back the stock, which can support markets.
Context Applied: Trade Structuring
We adapted previously shared structuring guides. Given volatility’s failure to perform, we opted for downside ratios and flies. This worked, and we plan on developing some case studies.
A potential cyclical rebound within a broader period of weakness could be expressed via low-cost positive-delta (bullish) structures, including buying calls while proportionately hedging with stocks or futures, where potential gains from the calls can outweigh hedge-related losses. Additionally, as we prefer, one can deploy verticals and flies, buying options closer to the current market prices while selling more options further out (with an extra far-out option bought to reduce margin requirements if needed).
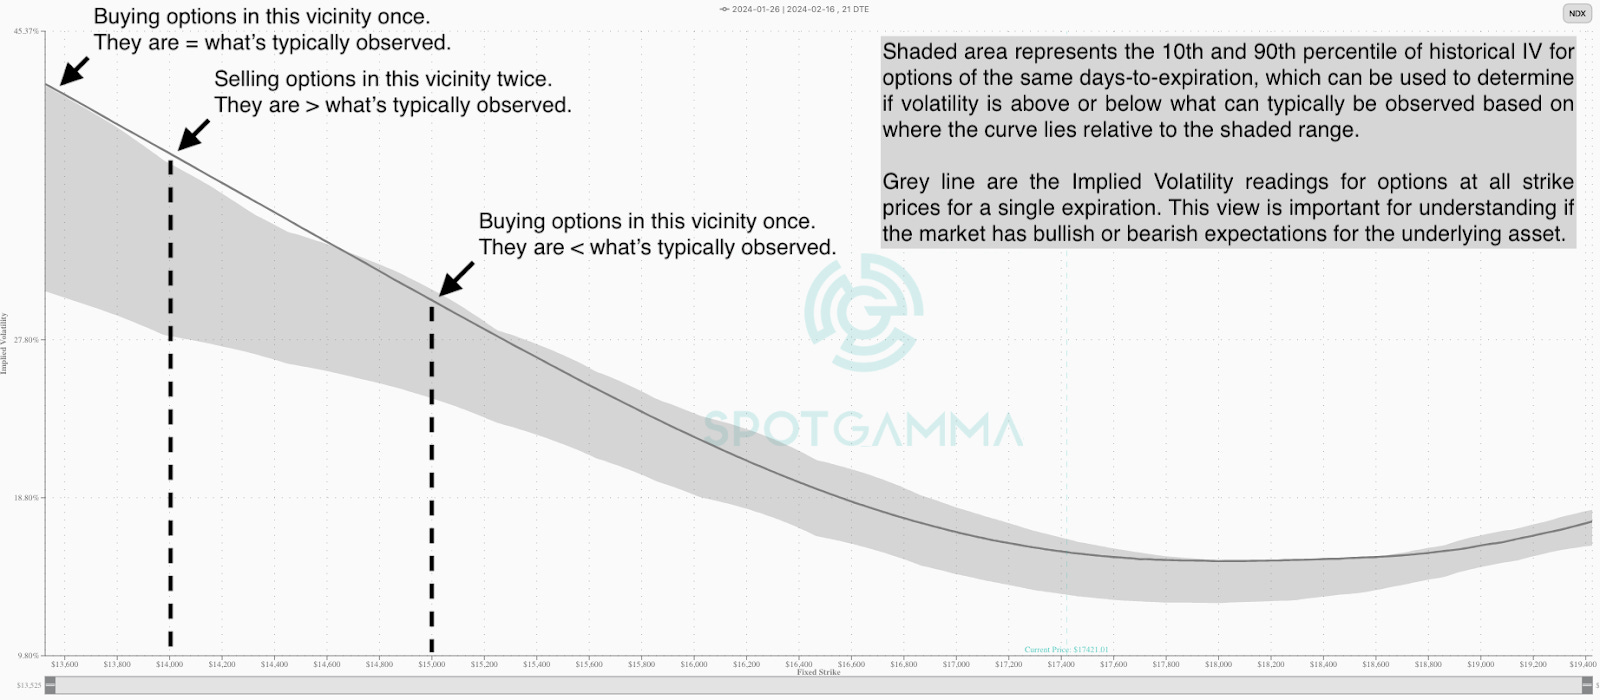
We and others agree that the Nasdaq 100 (NDX) and higher beta stocks are appealing. For one, relative strength pockets emerge in the NDX versus the SPX, potentially attributable to tariffs disproportionately impacting non-tech sectors. Checking options skews, and NDX options farther away in price may be underpriced for the eventually realized volatility.
Graphic: Retrieved from Bloomberg via Nicholas Smith.
For more on structuring across different products, be they gold or Bitcoin, see our Mar-a-LagoAccords letter published last month.
Disclaimer
By viewing our content, you agree to be bound by the terms and conditions outlined in this disclaimer. Consume our content only if you agree to the terms and conditions below.
Physik Invest is not registered with the US Securities and Exchange Commission or any other securities regulatory authority. Our content is for informational purposes only and should not be considered investment advice or a recommendation to buy or sell any security or other investment. The information provided is not tailored to your financial situation or investment objectives.
We do not guarantee the accuracy, completeness, or timeliness of any information. Please do not rely solely on our content to make investment decisions or undertake any investment strategy. Trading is risky, and investors can lose all or more than their initial investment. Hypothetical performance results have limitations and may not reflect actual trading results. Other factors related to the markets and specific trading programs can adversely affect actual trading results. We recommend seeking independent financial advice from a licensed professional before making investment decisions.
We don’t make any claims, representations, or warranties about the accuracy, completeness, timeliness, or reliability of any information we provide. We are not liable for any loss or damage caused by reliance on any information we provide. We are not liable for direct, indirect, incidental, consequential, or damages from the information provided. We do not have a professional relationship with you and are not your financial advisor. We do not provide personalized investment advice.
Our content is provided without warranties, is the property of our company, and is protected by copyright and other intellectual property laws. You may not be able to reproduce, distribute, or use any content provided through our services without our prior written consent. Please email renato@physikinvest for consent.
We reserve the right to modify these terms and conditions at any time. Following any such modification, your continued consumption of our content means you accept the modified terms. This disclaimer is governed by the laws of the jurisdiction in which our company is located.
This edition shouts out Public.com, a multi-asset investing platform built for those who take investing seriously. Public recently launched Alpha, an AI investment exploration tool, in the app store. We’re excited to host co-founder and co-CEO Jannick Malling on the next podcast to discuss the market and how AI levels the playing field. Stay tuned!
When market expectations drift too far from underlying fundamentals, they eventually become unsustainable. This sometimes leads to corrections that can trigger cascading effects across the broader market.
It is prevailing investment practices that partly fuel such a dynamic. While concepts like diversification and efficient markets appear sound, they often fail to account for the pressures investors face in practice. For instance, sophisticated retail investors have no mandate and typically have the space to make deliberate, calculated decisions. On the other hand, institutional-type investors, driven by the need to deliver consistent short-term profits, may feel compelled to chase returns. This pressure can lead to riskier behaviors, such as betting on low volatility by selling options. While this may produce steady returns in calm markets, it exposes investors to sudden shocks, volatility repricings, and forced unwinds when markets turn unexpectedly. Investors are often unprepared for such volatility, seldom owning options outright due to the rarity of shocks. This creates a market landscape skewed toward a “winner-takes-all” outcome, where only a few are positioned to benefit from such rare moments.
The following sections explore this realm of increasingly frequent, dramatic, and unpredictable outcomes. Let’s dive in.
In our excruciatingly detailed ‘Reality is Path-Dependent’ newsletter, we explored how markets are shaped by reflexivity (feedback loops) and path dependency (how past events influence the present), setting the stage for August 2024’s turbulence and recovery.
To recap, we noticed that while individual stocks experienced big price swings, the broader indexes, like the S&P 500—representing those stocks—showed restraint. Remarkably, the S&P 500 went over 350 sessions without a single 2% or more significant move lower, reflecting this calm. This happened because of a mix of factors, including many investors focusing on broader market calm, often expressed by selling options and, in some cases, using their profits to double down on directional bets in high-flying stocks. This helped create a gap between the calmer movements in the indexes and wilder swings in individual stock components, leading to falling correlations; beneath the surface, big tech, AI, and Mag-7 stocks gained ground, while smaller stocks in the index struggled, as shown by fewer stocks driving the market higher (weaker breadth).
By arbitrage constraints, declining correlation is the reconciliation. When investors sell options on an index, the firms on the other side of the trade—like dealers or market makers—dynamically hedge their risk. They may do this by buying the index as its price drops and selling it when it rises, which can help keep the index within a narrower range and reduce actual realized volatility. However, this doesn’t apply as much to individual stocks, where we observed more options buying. For these stocks, hedging works differently: dealers may buy when prices rise and sell when prices fall, reinforcing trends and extending price moves. This creates a situation where the index stays relatively calm, but its components can swing more wildly.
Anyway, we noticed that as the connection between the index and its stocks was weakening, traders who bet on these differences (called dispersion) profited. As more participated in this and other volatility-suppressing trades, it became more successful. This shows how feedback loops (reflexivity) and past events (path dependency) influence future market behavior. Overall, this trade helped sustain the market rally and added stability as lesser-weighted stocks stepped up to offset the slowdown in leaders in July.
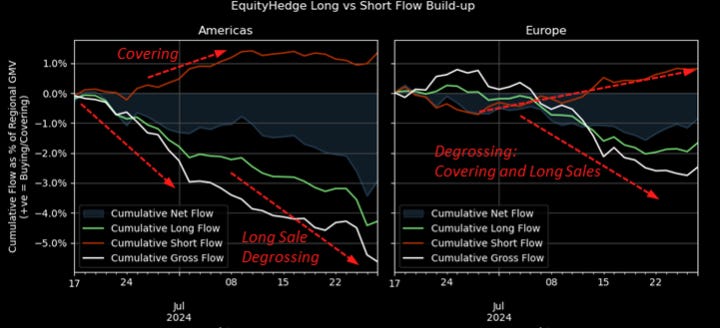
However, we speculated about the risks of a broader “sell-everything” market. Waning enthusiasm for big tech stocks and broader market selling on the news could manifest demand for protection (such as buying longer-dated put options). During the quieter, less liquid summer months, this could trigger increased volatility and lead to a sharp sell-off (as dealers or market makers hedge in the same direction the market’s moving, amplifying moves). Although low and stable volatility gave an optimistic market outlook, we considered advanced structures to hedge against potential pullbacks at low cost, including ultra-wide, broken-wing NDX put butterflies, ratio spreads, and low-cost VIX calls and call spreads (which, by way of the VIX being an indirect measure of volatility or volatility squared, offer amplified protection in a crash). In the event of market weakness, these structures would be closed/monetized, with the proceeds/profits used to lower the cost of upside participating trades through year-end. Again, further details can be found in the ‘Reality is Path-Dependent’ newsletter.
Graphic: Retrieved from UBS. Hedge funds were cutting risk in July 2024.
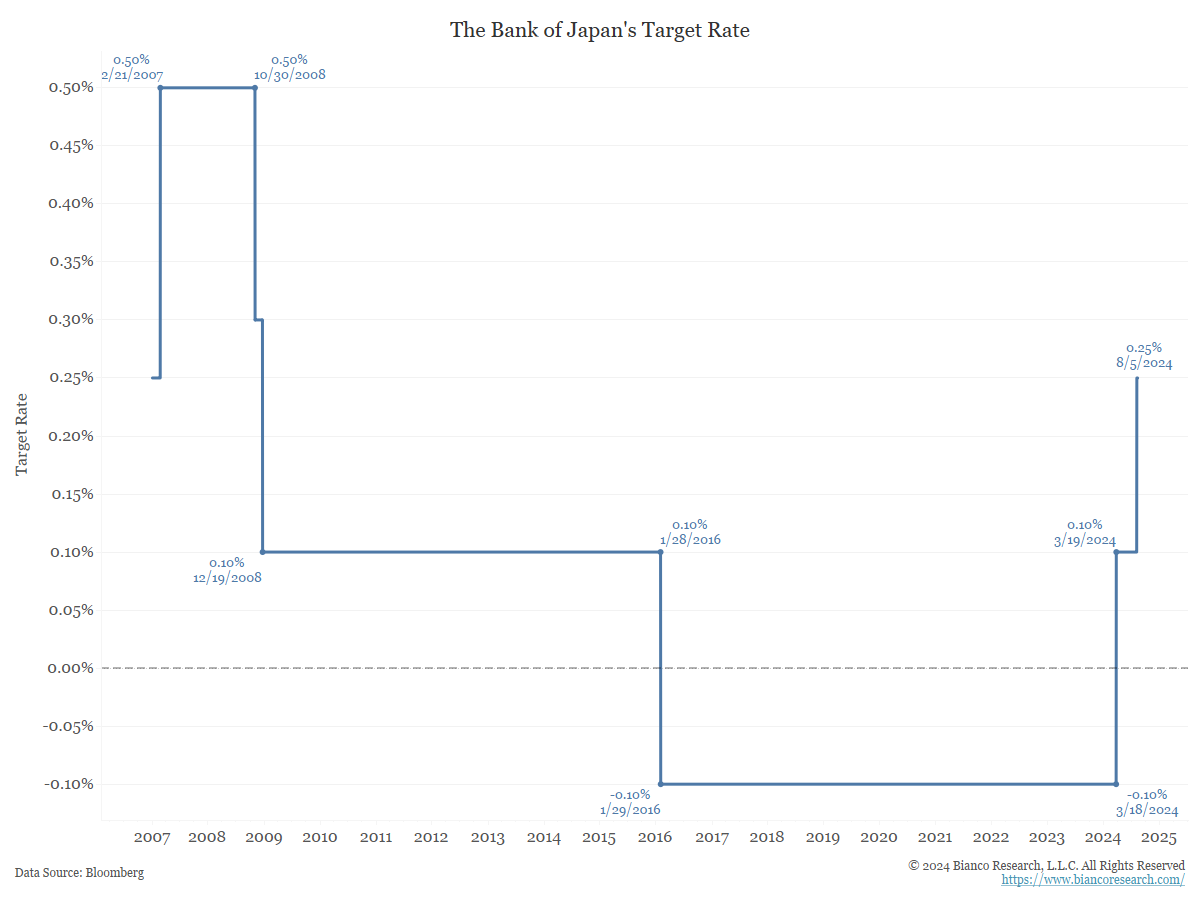
Our warnings about the risks of extreme momentum crowding and positioning leading to violent unwinds were borne out in August 2024. Markets reeled as recession probabilities were repriced, quarterly earnings disappointed, and central bank policies diverged. The Federal Reserve’s dovish stance starkly contrasted with an unanticipated rate hike by the Bank of Japan. This fueled considerable volatility across assets, particularly higher-beta equities and cryptocurrencies, which are more heavily influenced by traditional risk and monetary policy factors. The episode highlighted the vulnerabilities of a market reliant on leveraged trading and concentrated investments; the situation was about more than just a fundamental shock.
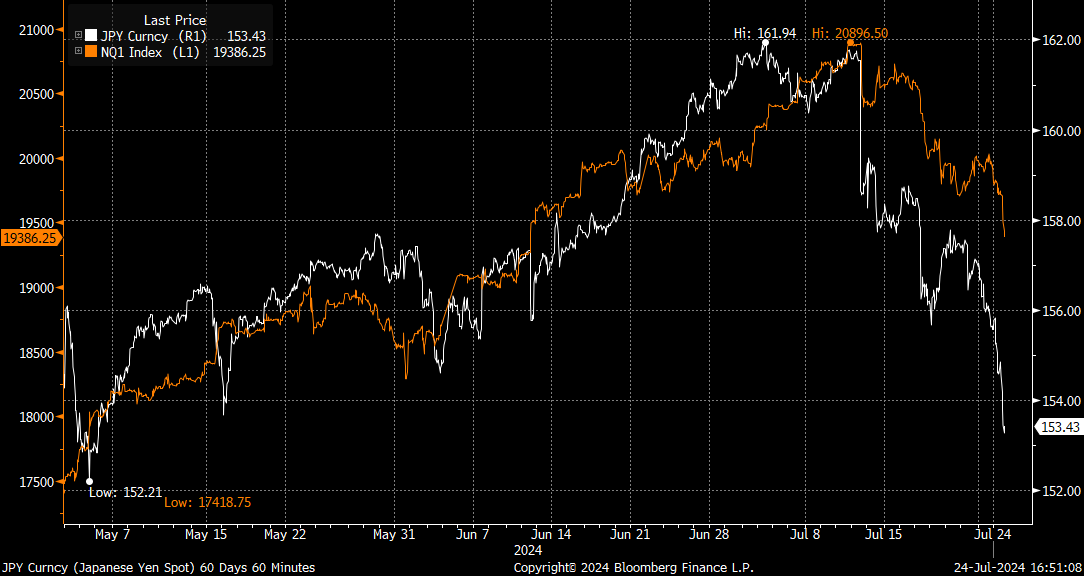
The unraveling was marked by spikes in stock market volatility measures like the VIX, a liquidity vacuum, and forced deleveraging by trend-following and volatility-sensitive strategies. Despite this clearing some froth, key equity and volatility positioning and valuation vulnerabilities remained, leaving markets fragile and uncertain whether growth will stabilize or deteriorate.
Graphic: Retrieved from Bloomberg via PPGMacro. Yen versus Nasdaq.
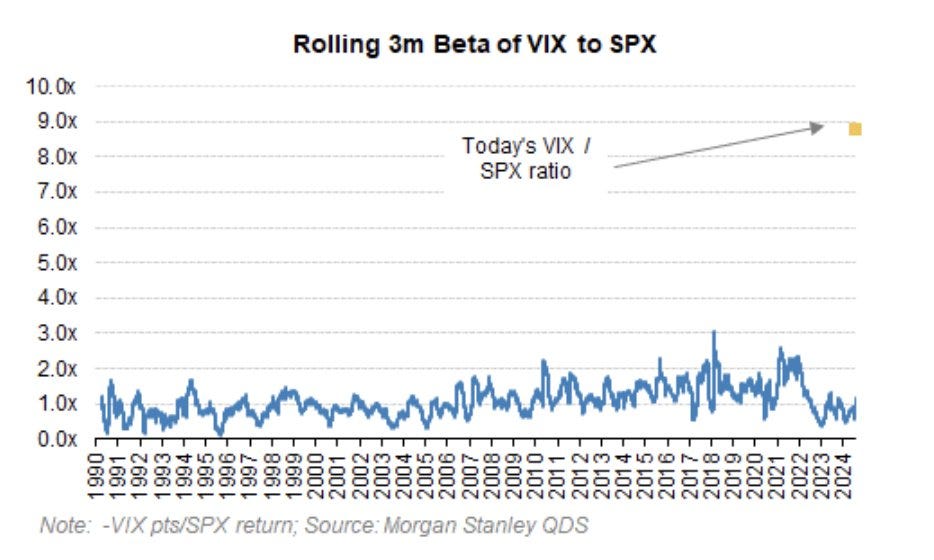
Some accounts compared the selling to the 1987 stock market crash. Volatility broke its calm streak, with spot-vol beta—the relationship between market movements and expected/implied volatility changes—rising and correlations increasing.
Graphic: Retrieved from Morgan Stanley via @NoelConvex.
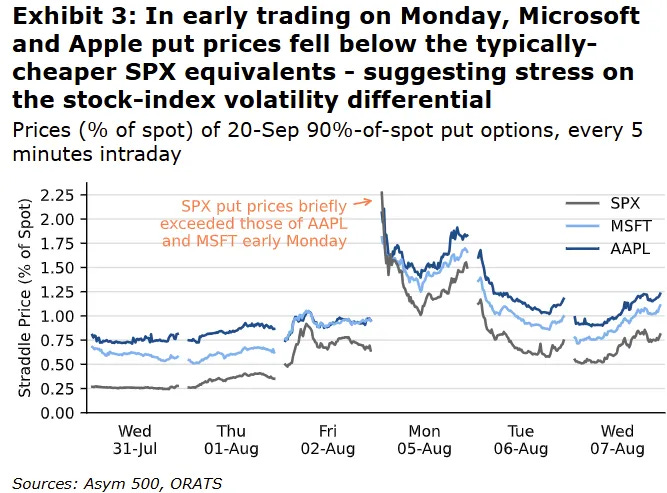
Early warning signs of precariousness emerged as prices for far out-of-the-money SPX and VIX options—key indicators and drivers of potential crashes when heavily traded—soared hundreds of percent the week before crash day, Monday, August 5. These tail-risk hedges, often viewed as insurance against steep market drops, carried well, becoming significantly more expensive as demand surged. Just as insurers raise premiums on homes in disaster-prone areas to account for higher risk, the soaring cost of these options reflected the market’s growing fear of extreme outcomes. This repricing fed into broader quantitative measures, triggering a wave of deleveraging and prompting investors to offload hundreds of billions in stock bets, amplifying the sell-off.
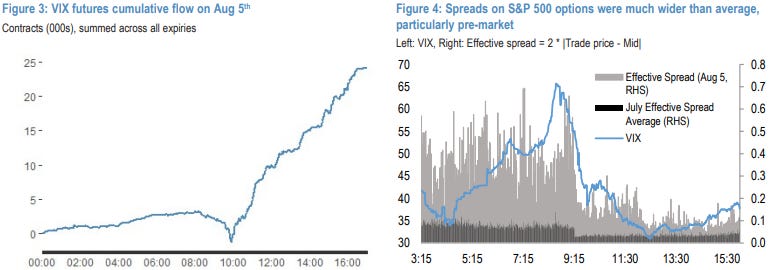
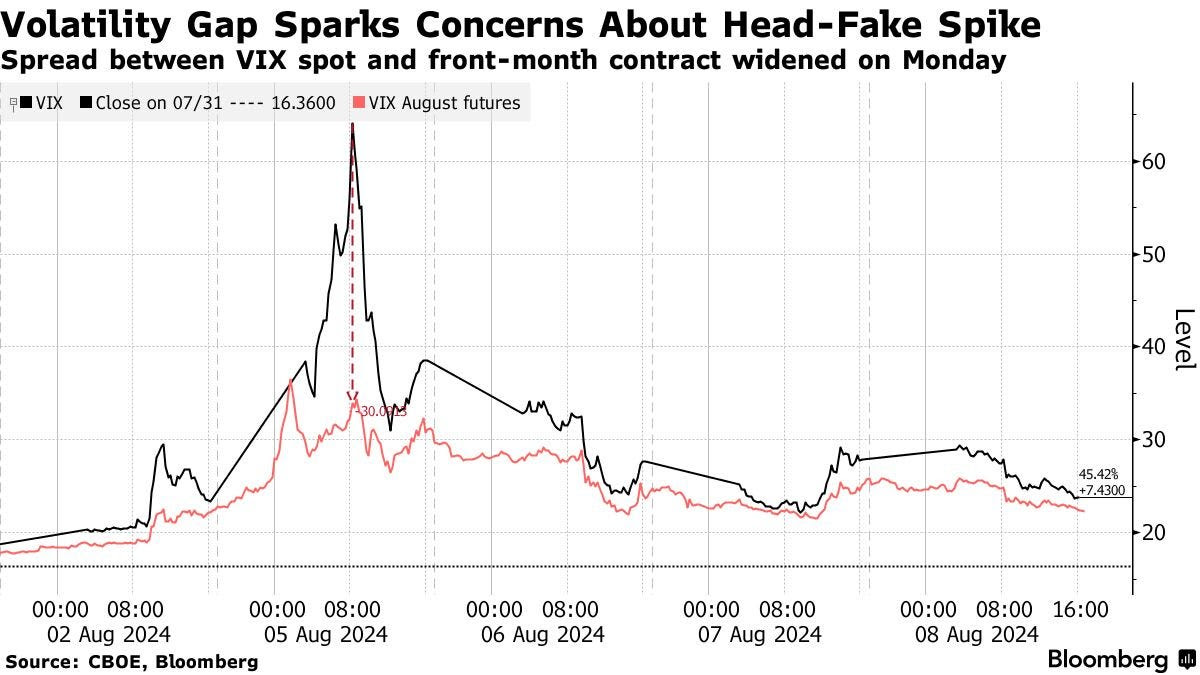
At one point, the VIX breached 65, its highest level since 2020. A lack of liquidity during pre-market hours and the shift from short-term to longer-term hedges contributed to this sharp rise. The VIX is calculated based on a selection of S&P 500 options about 30 days out, chosen by an algorithm that looks at the middle point between the prices people are willing to buy and sell those options. When there’s not a lot of trading activity and markets get volatile, the difference between the buying (bid) and selling (ask) prices widens, lending to the VIX being higher than it should be.
Graphic: Retrieved from JPMorgan via @jaredhstocks.
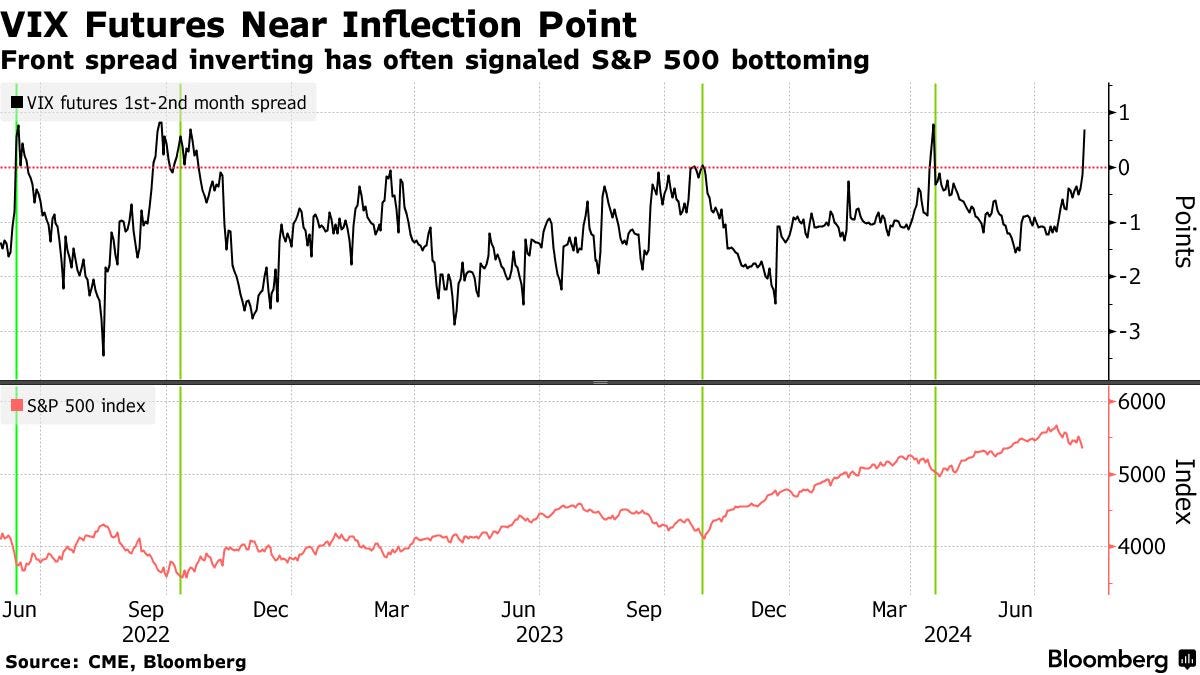
Comparatively, VIX futures—perhaps a better measure of hedging demands outside regular market hours—lagged. JPMorgan claims the fast narrowing in the VIX spot and futures indicates the VIX spot overstated fear and hedging demand.
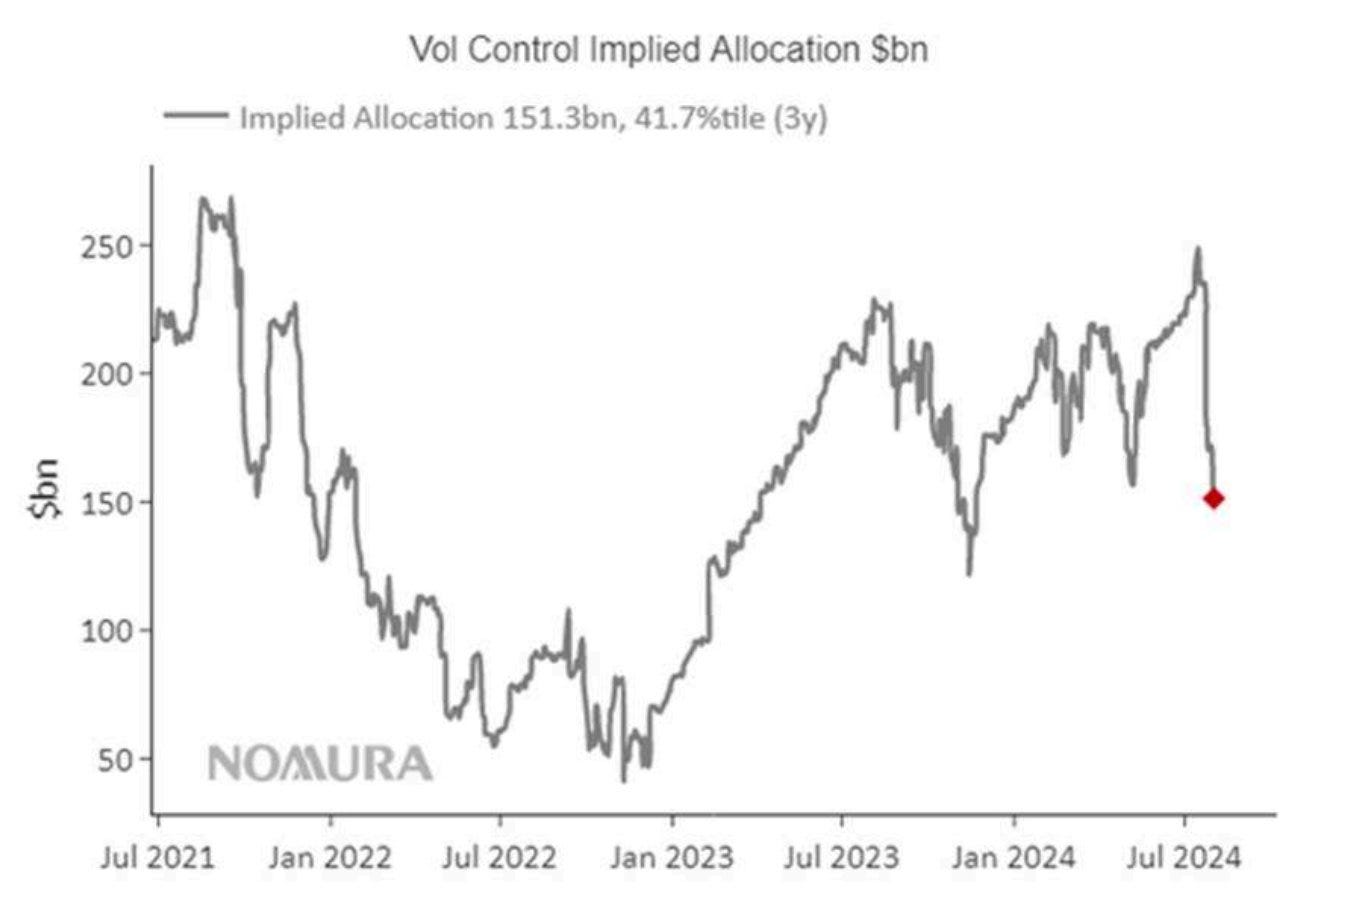
Moreover, a technical issue at the Cboe options exchange delayed trading, and by the time the problem was resolved, the VIX had already dropped sharply. This coincided with traders doubling down on short-volatility positions and buying stocks, confident in the S&P 500’s historical tendency to rebound in the months following similar volatility spikes.
Graphic: Retrieved from Nomura via The Market Ear.
Rocky Fishman, founder of Asym 500, explains that the dislocations above were compounded by dispersion traders who likely experienced mark-to-market losses on their short index positions while single-stock markets remained closed. This forced some to cover their short index volatility positions, resulting in a pre-market surge in index volatility. Once trading resumed, many began selling single-stock options, triggering a broader decline in volatility levels—particularly in single-stock options.
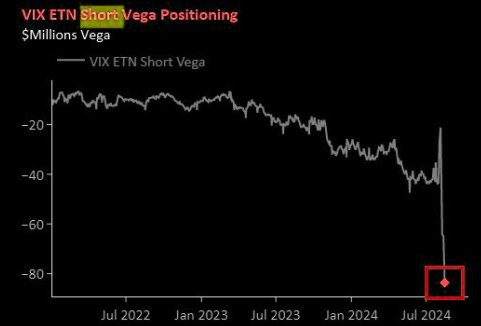
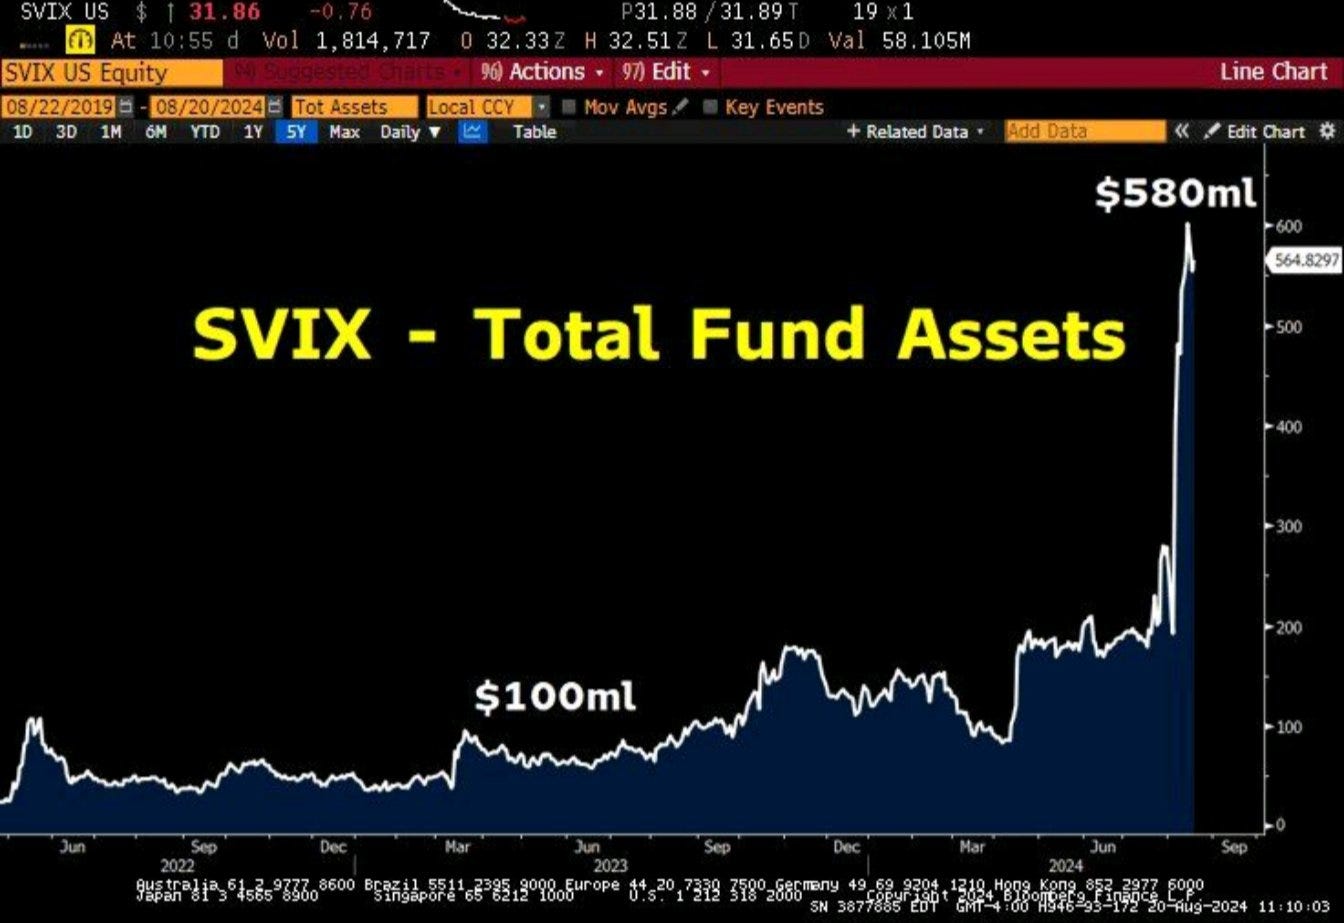
So, the rapid decrease in the VIX was driven more by positioning dynamics and the calculation mechanics of the VIX itself rather than a complete unwinding of risky trades. Additionally, the S&P 500’s movement into lower-volatility segments of the SPX options curve, which the VIX relies on, further intensified this decline. Kris Sidial of The Ambrus Group adds, “It’s quite evident that many have doubled down on [short volatility]. But you don’t need to trust our data. Barring any additional volatility shocks in the next few weeks, I expect some of these firms to deliver stellar numbers by the end of Q3 due to their inclination to take on more risk.”
Graphic: Retrieved from Bloomberg via @iv_technicals.
The market’s recovery in the fall was mainly driven by the Mag-7 giants, whose robust performance overshadowed the struggles of smaller stocks. The August decline created an opportunity to acquire beaten-down stocks at discounts, with investors indeed seeing the panic as a buy signal; outside of significant crises unable to topple the economy (like the bank failures in 2023), back-tests suggest that when the VIX exceeds 35, the S&P 500 has historically risen upwards of 15% over the next six months.
The recovery was not without risks, with the divide between market leaders and laggards highlighting continued fragility. In any case, supportive flows into mega-caps and dealer hedging activities helped stabilize broader indexes through November.
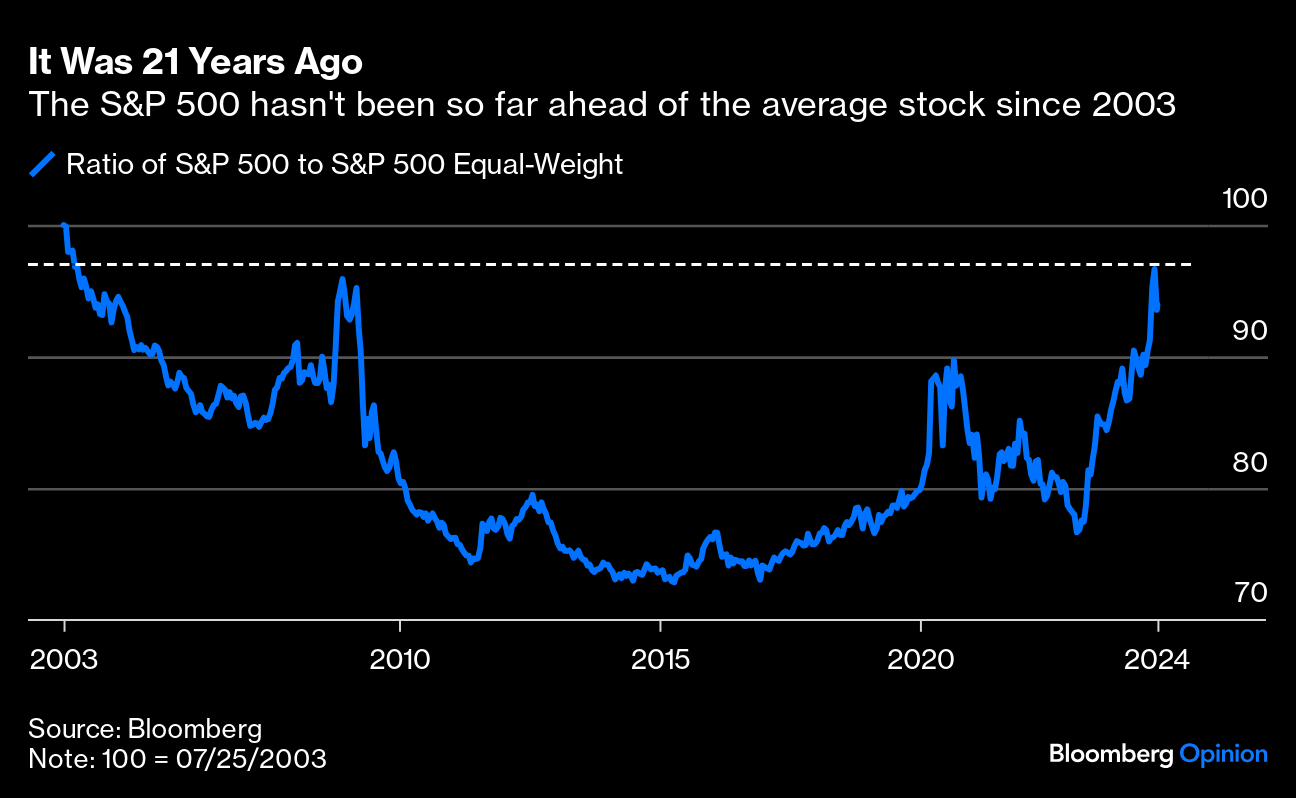
The growing gap between the stable performance of the S&P 500 and the larger fluctuations in its components created profits for those dispersion traders we discussed. However, as valuations for mega-cap stocks climb, the market becomes more vulnerable to shifts in sentiment or capital flows. Events like the yen carry trade—where borrowing in Japan funded investments in U.S. Treasuries and equities—unwind exposed concentration risks and positioning imbalances, which could amplify future shocks.
Graphic: Retrieved from Bloomberg via @Alpha_Ex_LLC.
As for potential triggers and shocks going forward, rising inequality and populism are creating deep divisions within and among major powers, while protectionist policies strain potential global cooperation. According to Cem Karsan of Kai Volatility, these dynamics drive economic battles and indirect conflicts, with Eastern nations working to reduce Western influence. This shift coincides with a new era of high inflation, widening wealth gaps, and changing power dynamics. Millennials, now a dominant force in the workforce and politics, are challenging decades of policies that primarily benefited corporations and the wealthy, reversing globalization and redistributing wealth—though this comes at the cost of heightened inflation.
These structural changes disrupt traditional investment strategies like the 60/40 portfolio. A major geopolitical event, such as China moving on Taiwan, could severely impact supply chains, critical industries, and the global economy, with significant repercussions for stocks like Nvidia and broader indices like the S&P 500. If market bets against panic (like short volatility) unravel, it could trigger more swings like August’s. The same reflexivity that has stabilized markets since then could amplify volatility during future shocks, turning successive disruptions into severe crises if market positioning is misaligned.
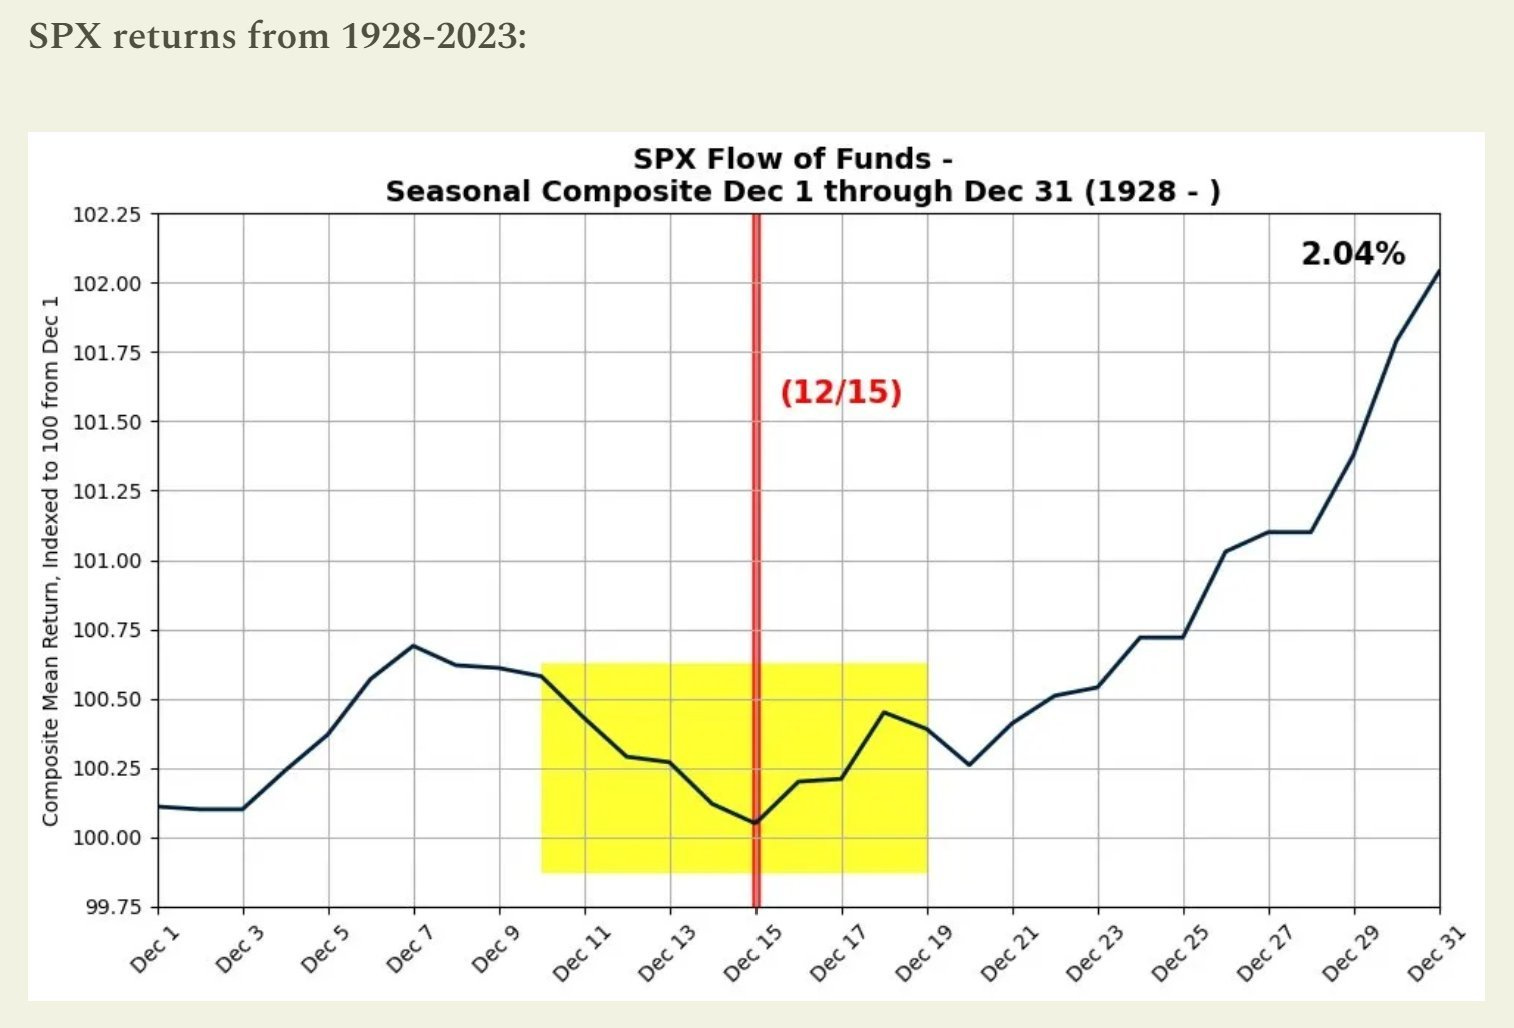
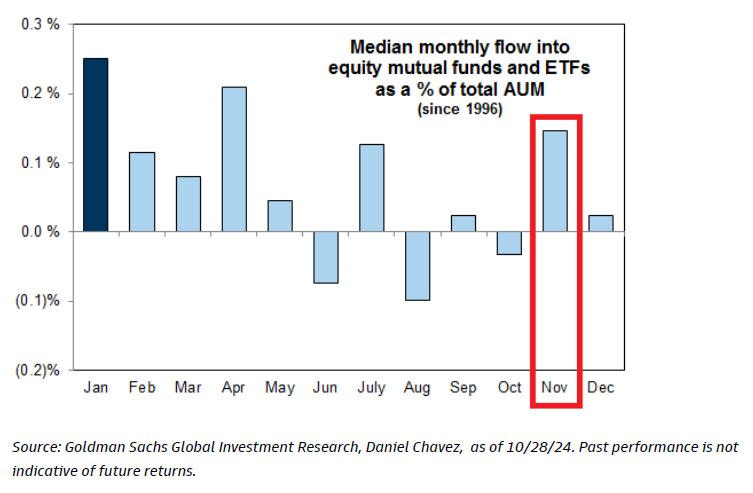
Despite this challenging backdrop, short-term market behavior operates independently, dictated by supply and demand dynamics. Seasonal flows, particularly during year-end, created a bullish bias; reduced holiday trading volumes, combined with reinvestment effects and significant options expirations, contributed to structural upward pressure on markets. These flows and a historical tendency for election years to drive positive performance suggested a right-skewed distribution for near-term outcomes.
The prospect and fulfillment of a “red sweep,” characterized by follow-on deregulation, a business-friendly environment, and more animal spirits, boosted markets. However, caution was spotted in certain areas, like bonds, where expectations for inflation rose.
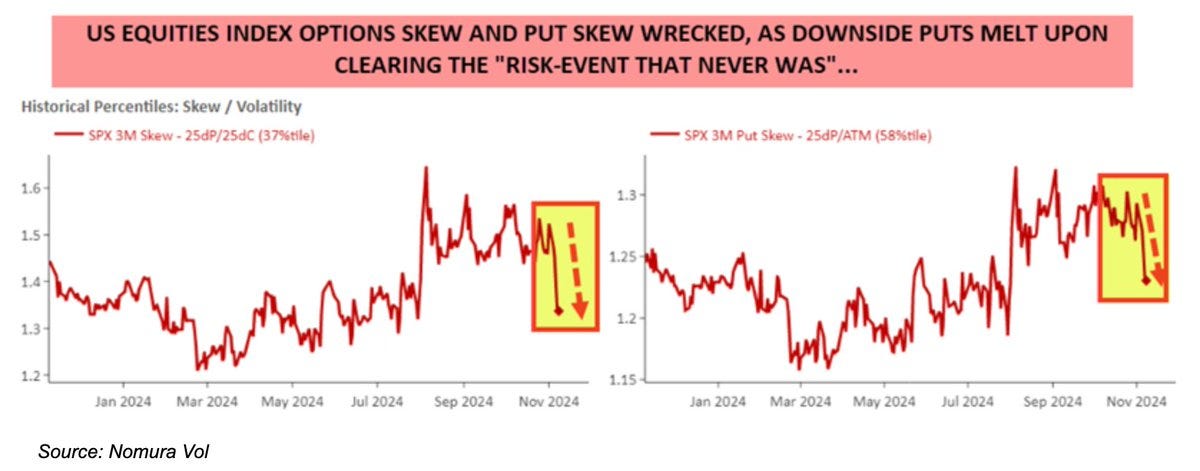
Ultimately, the market overextended, highlighting the risk of a peak as it caught down to weak breath on the Federal Reserve’s surprising hawkish shift in December. This change led to volatility in equities, interest rates, and currencies, reminiscent of the spike in August when the VIX jumped and surpassed the S&P 500’s decline. Such persistent divergences validate a clear shift into a new market regime characterized by volatility that consistently outpaces market sell-offs.
Graphic: Retrieved from Nomura.
In a report, Cboe said that equity spot/vol beta surged to -3.3, meaning for every 1% drop in the S&P 500, the VIX gained 3.3 points—exceeding even August’s extreme levels. SPX options priced greater downside risk, with skew steepening. Notwithstanding, correlations settled near historic lows, signaling investor focus on sector rotation and stock dispersion.
Graphic: Retrieved from Bloomberg via Alpha Exchange.
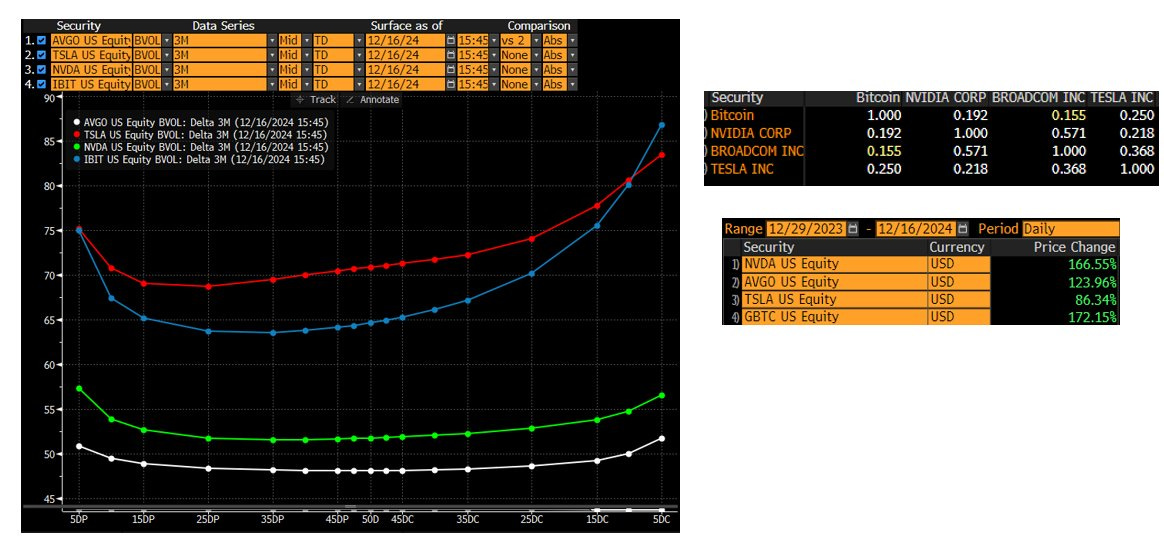
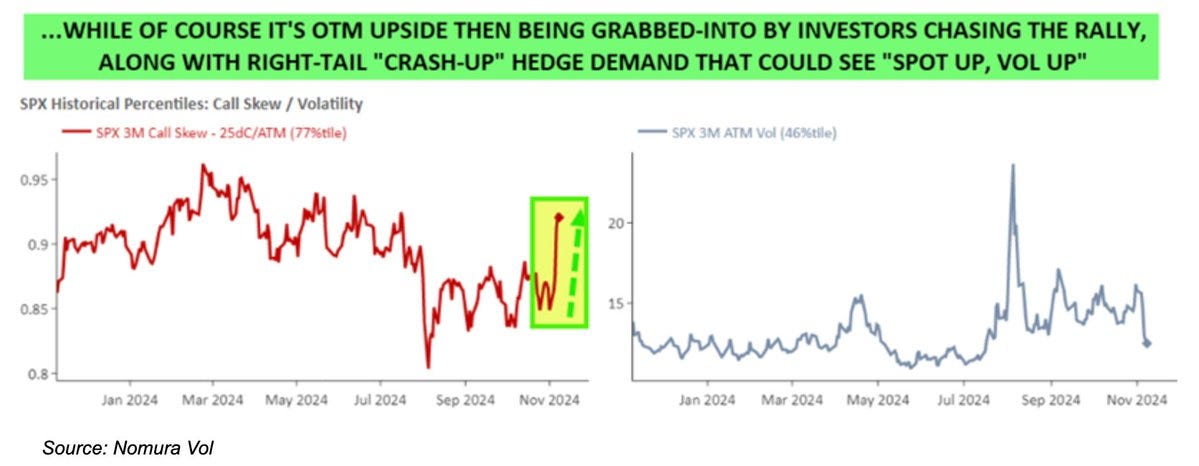
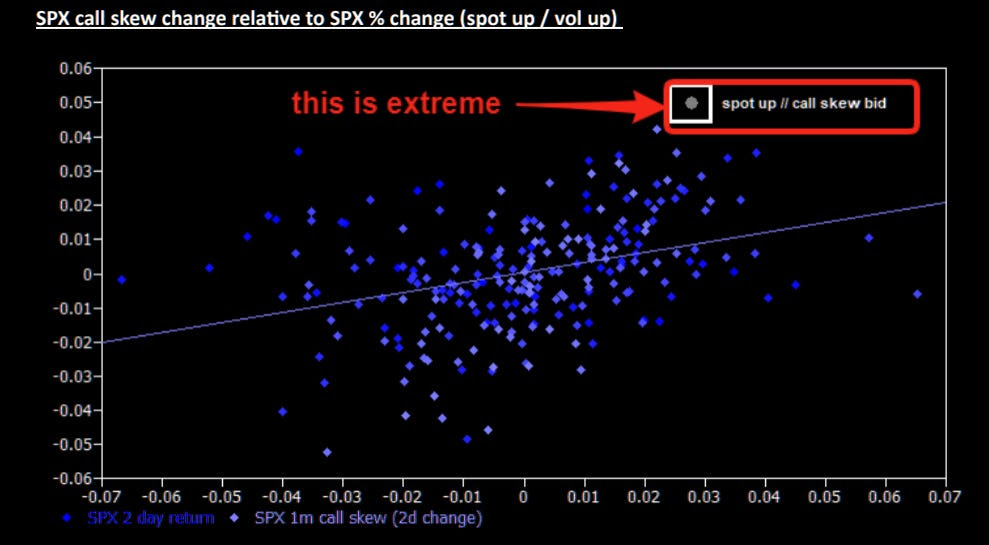
Early warning signals appeared when volatility and equities increased simultaneously, highlighting a “spot up, vol up” pattern that frequently foreshadows market peaks. For instance, at one moment, upside calls on major stocks like Nvidia and the S&P 500 were well-priced and poised to perform strongly in a rally. This occurs because, during rallies, implied volatility of call options generally decreases as investors tend to sell calls tied to their stock holdings rather than liquidating them entirely. When investors chase synthetic upside exposure through call options, indices like the VIX could stabilize or increase as the market rises. Since counterparties typically adjust their exposure by buying the underlying asset, it propels the rally and magnifies market fluctuations.
Beyond the chase, the post-election rally got an extra boost from unwinding protective puts. Significant events like elections typically boost demand for puts as hedges against adverse outcomes, with counterparties hedging these positions by selling underlying stocks or futures, among other things. As markets rise, time passes, or uncertainty fades, these puts lose value, leading counterparties to unwind hedges by buying stocks and futures. This is a structural support that pushes markets higher.
Corporate buybacks and stabilizing volatility levels encouraged funds to increase their exposure. Nomura estimated that assuming stable markets, up to $145 billion in additional volatility-sensitive buying could occur over three months. Although 30-day implied volatility traded a bit above realized volatility, this signaled uncertainty rather than distress. Seasonal factors mentioned in the previous section—like low holiday liquidity and limited selling pressure—added to the upward trend.
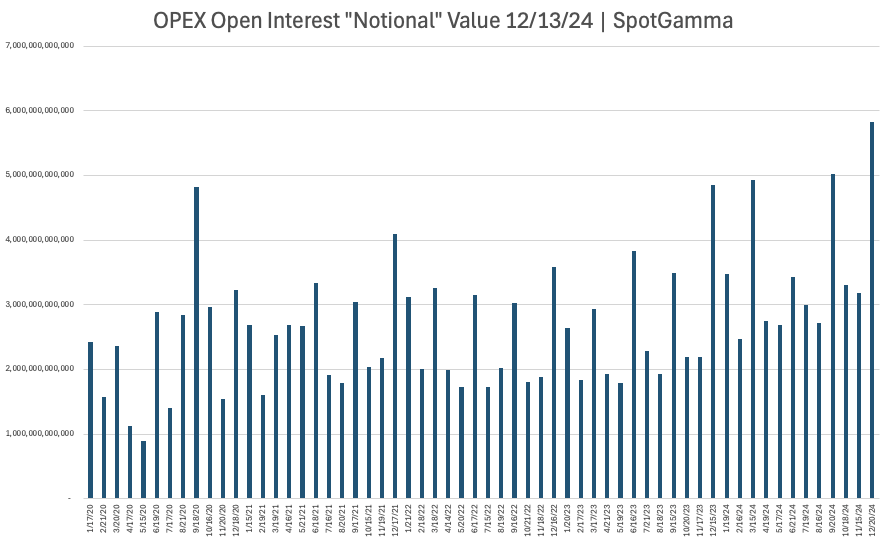
Then came the FOMC meeting, followed by December’s massive options expiration (OPEX), disrupting the supportive dynamics that had fueled the rally. While a rate cut was expected, uncertainty around forward guidance introduced volatility just as the market faced a substantial unwinding of stabilizing exposure. Those who hedged customer-owned call options by buying stock during rallies and hedged customer-owned puts by selling stock during declines were forced to re-hedge as markets turned lower following the FOMC meeting. This involved selling stocks and futures, adding downside pressure.
Macro factors triggered the initial downside, with positioning amplifying equity volatility.
Ultimately, volatility levels signaled oversold conditions ahead of a massive put-clearing OPEX, setting the stage for a year-end lift. The volatility spikes in August and December remained contained, as they were largely event-driven and mitigated by existing hedges and a market structure anchored by year-end flows. The subsequent unwinding of significant options positions in December eased the pressure, while reinvestment and re-leveraging effects into January supported against weak breadth; as the earlier-mentioned Cem Karsan explains best, the substantial gains over the year increased collateral for leveraged investors, enabling them to reinvest profits or take on more leverage, which has given markets a lease on life through today.
2025 might see increased volatility, not driven by typical inflation or recession fears but by the positioning dynamics herein that can magnify market swings during downturns. The so-called “red sweep” introduces optimism and the likelihood of greater risk-taking, which could result in one-sided positioning and heightened volatility. Factors like populism, protectionism, and rising interest rates are additional pressures on stocks and bonds. Gold and Bitcoin are identified as potential stores of value, but Bitcoin remains prone to speculation, liquidity challenges, and regulatory obstacles.
The following newsletters will identify structures to lean into fundamental catalysts and underlying volatility contexts. Notably, the structures discussed earlier (such as ultra-wide, broken-wing NDX put butterflies, ratio spreads, and low-cost VIX calls and call spreads) may continue to perform as effective hedges.
By viewing our content, you agree to be bound by the terms and conditions outlined in this disclaimer. Consume our content only if you agree to the terms and conditions below.
Physik Invest is not registered with the US Securities and Exchange Commission or any other securities regulatory authority. Our content is for informational purposes only and should not be considered investment advice or a recommendation to buy or sell any security or other investment. The information provided is not tailored to your financial situation or investment objectives.
We do not guarantee the accuracy, completeness, or timeliness of any information. Please do not rely solely on our content to make investment decisions or undertake any investment strategy. Trading is risky, and investors can lose all or more than their initial investment. Hypothetical performance results have limitations and may not reflect actual trading results. Other factors related to the markets and specific trading programs can adversely affect actual trading results. We recommend seeking independent financial advice from a licensed professional before making investment decisions.
We don’t make any claims, representations, or warranties about the accuracy, completeness, timeliness, or reliability of any information we provide. We are not liable for any loss or damage caused by reliance on any information we provide. We are not liable for direct, indirect, incidental, consequential, or damages from the information provided. We do not have a professional relationship with you and are not your financial advisor. We do not provide personalized investment advice.
Our content is provided without warranties, is the property of our company, and is protected by copyright and other intellectual property laws. You may not be able to reproduce, distribute, or use any content provided through our services without our prior written consent. Please email renato@physikinvest for consent.
We reserve the right to modify these terms and conditions at any time. Following any such modification, your continued consumption of our content means you accept the modified terms. This disclaimer is governed by the laws of the jurisdiction in which our company is located.
Last month, we had the privilege of attending the Milken Institute’s Asia Summit in Singapore, often seen as the West’s gateway to Asia. Prominent figures, including Bridgewater Associates Founder and CIO mentor Ray Dalio, shared insights on navigating a rapidly transforming, multipolar world. Dalio focused on the major forces shaping global conditions—such as debt cycles, political instability, great power conflicts, climate change, and technology—and highlighted where investment opportunities lie. While the U.S. market may be priced to perfection, Dalio pointed to regions like China and other parts of Asia as offering greater potential.
Fresh from Singapore, we sat down with Andy Constan, Founder, CEO, and CIO of Damped Spring Advisors, whom you may recognize from his appearances on CNBC or Twitter/X. Constan’s background is rooted in extracting value through “relative value” trades, but since the Global Financial Crisis and his time at Bridgewater Associates working alongside Ray Dalio, he’s shifted his focus to macroeconomic factors. In this discussion, we explore his experience building Bridgewater’s volatility pillar, the vulnerability of traditional alpha strategies during macro crises, the bull market for metals, stock market expectations, and more.
As you may have noticed, there’s a progression in our podcast episodes. In the first, Mat Cashman, a former market maker, broke down what options are and how they’re traded. In the second, Vuk Vukovic, founder of an upstart hedge fund, discussed idea generation and using options as tools to express those ideas. Now, in our third episode, Constan dives into how options fit into a balanced portfolio. The key takeaway? While options can enhance portfolios, most investors don’t need leveraged exposure to markets. A balanced portfolio in 2025 can remain straightforward, and here’s an expert telling you just that.
The video can be accessed at this link and below. An edited transcript follows.
I recently attended the Milken Institute event in Singapore, where Ray Dalio was a keynote speaker. Since you worked alongside Ray at Bridgewater, I thought it would be interesting to hear your perspective. Some key themes he discussed included multipolarity, deglobalization, internal disorder, elections, and the fact that a few companies drive much of the S&P 500 Index’s performance. Could you start by sharing a bit about your time at Bridgewater? What was your role, and how may those themes and what you learned there shape your portfolio today?
Before joining Bridgewater Associates as a senior research team member, I ran a hedge fund, focusing heavily on equity relative value, volatility, capital structure arbitrage, risk arbitrage, long-short strategies, and statistical arbitrage. Through my hedge fund experience, I looked at volatility across different asset classes—rates, equity, currency, and commodities. By the time I joined Bridgewater, I had accumulated 23 years of experience, including 18 years at Salomon Brothers, where I was involved in market-making and prop trading, and five years running my hedge fund.
When I joined in 2010, the idea was to see if I could contribute to Bridgewater’s investment process in areas they hadn’t previously explored. I created the volatility pillar within their idea generation team, working closely with Ray Dalio, Greg Jensen, Bob Prince, who were the three CIOs at the time, and several talented young individuals, including Karen Karniol-Tambour, now the Co-CIO, and Bob Elliott, now a well-known figure on Twitter/X who was always excellent at asking probing questions.
This role exposed me to macro factors I hadn’t previously focused on. I noticed that traditional alpha strategies often blew up during macroeconomic crises, convincing me that many of them—like long-short equity, leveraged derivatives, and convertible bond arbitrage—were vulnerable to the same risks. The Global Financial Crisis clearly illustrated how macro factors, along with central bank actions like quantitative easing and tightening or lowering and raising interest rates, influence monetary conditions and the availability of leverage; when financial conditions tighten, seemingly uncorrelated alpha strategies unravel.
Bridgewater’s focus is on directionally trading the most liquid assets globally. Before my time there, they primarily traded futures and cash securities, with little exposure to options or derivatives. So, my role was to explore whether the volatility market could offer insights to enhance their directional trading or even serve as a new asset class responding to their existing macro indicators.
Graphic: Retrieved from Renato Leonard Capelj, founder at Physik Invest.
Does Bridgewater still have this volatility pillar?
While my connections at Bridgewater remain strong, we don’t discuss business. Like most hedge funds, their work happens behind closed doors. In any case, I don’t believe they’re involved in those markets, as they’re typically too small for their size; instead, it is more likely they use some of the strategies I helped develop—focused on volatility, credit markets, and other convex assets—to refine their directional views on traditional, highly liquid macro assets.
Were there any trades—or even just ones you were eager to pursue—that Bridgewater decided not to go after?
Three days after I joined, the Flash Crash occurred. The market was already on edge, particularly with European turmoil. Earlier that spring, the Greek debt market had been rocked by significantly higher deficit expectations, sparking the European debt crisis just ahead of the Flash Crash. When the crash happened, it cemented for many investors that a more volatile post-GFC regime would persist for years.
A persistent demand for long-term equity volatility has run over many funds and investors throughout my career. This demand primarily comes from insurance companies, which can’t sell traditional investment management products but want to, as their clients are the same retail investors who may purchase money management services for their 401(k)s or pensions. Essentially, the clients have savings they want to invest, and the insurance companies have life insurance policies—like Term Life—that historically acted as fixed-income securities. You get a guaranteed death benefit, and your policy accrues value based on interest rates.
With interest rates incredibly low then, insurance companies in the mid-1990s began creating securities that offered guaranteed death benefits with upside exposure to equities. They bought equity portfolios, added interest rate swaps, and purchased puts on the S&P 500, creating a bond with a call option on equities. This enabled clients to receive a guaranteed death benefit with potential equity performance upside. Accordingly, the aggressive demand for these products pushed up long-term volatility, as these were 10- to 20-year death benefit products, and long-term call options became highly sought. This affected the dividend market—dealers who sold these calls became exposed to dividends.
Initially, Swiss banks like UBS O’Connor and First Boston and some French banks supplied the calls. However, by the mid-to-late ’90s, the demand overwhelmed them as markets grew more volatile, mainly due to the increasing tech concentration in the index. Long-Term Capital Management (LTCM) stepped in, selling global index volatility for five years. This did not end well, and after LTCM was unwound, long-term volatility remained well-bid as insurance companies continued buying these structures and selling them to clients. Warren Buffett eventually stepped in during the GFC, selling $9 billion notional in five- to ten-year S&P puts. He saw it as a good bet, figuring that buying stocks at $700 in ten years after collecting premiums was favorable. Uniquely, he wasn’t required to post any collateral—a situation unlikely ever to repeat. However, Buffett eventually unwound this position as the market rallied following the GFC lows around the Flash Crash.
With Buffett out of the game, no willing sellers of long-term volatility existed. The banks and LTCM had been burned, and even though Buffett avoided getting burned, his exposure to Vega (i.e., the impact of volatility on an option’s price) still cost him.
At one point, we saw 10-year implied volatility reach 38%. I spent weeks crafting a case for Bridgewater, supported by data, evaluating the size and forward demand of the insurance market and potential players who could self-insure. We analyzed whether selling 38 implied volatility was a good trade and gathered historical data from every stock market, from 1780s UK to post-Soviet Russia, to assess risk. As it turns out, selling a 38 implied volatility would have been profitable in most cases. The only exceptions were Germany, Italy, and Japan, where WWII drove realized volatility above 38. Never before in the US, UK, or elsewhere had there been sustained realized 38 volatility.
Confident in my findings, I presented this trade idea to Bridgewater, but we ultimately didn’t execute it. The following year, realized volatility dropped below 20, and implied volatility fell by 12-13 points. Had Bridgewater made the trade, it could have likely netted $1 billion in the first year and over $20 billion over the decade.
Did that, in terms of how they made decisions and portfolios guide how you think about making decisions today?
Yes. Bob Prince pulled me aside during the process and said, “We like what you’ve done, but we need you to think differently.”
At Bridgewater, the way they want you to think makes perfect sense. If you’re serious about having a long-term investment process, you need something you can use consistently, day in and day out. You’re not just looking to trade—you want an alpha stream that endures. That’s the real asset. Once a trade is done, if it can’t be repeated, all the effort is wasted. Bridgewater’s focus—and anyone involved in systematic trading should—was discovering long-term alpha streams.
The biggest constraint, both at Bridgewater and everywhere, is time. You have to be selective about where you invest it. For CIOs, learning to trade options proficiently would have been a massive time drain and likely hurt their performance in building a sustainable, long-term alpha-generating engine, which already demanded their full attention.
So that’s the key—what is your time worth? I believe they made the right decision. Investment researchers should focus on creating lasting alpha, not short-term trades.
What did your early work at Solomon Brothers—being on the Brady Commission following the 1987 stock market crash—teach you about the interplay between participants and how this affects liquidity and market outcomes?
At 23, I was fortunate to be assigned to the Brady Commission. What set me apart was a relatively ordinary skill for my generation: I was particularly good at working with spreadsheets. This put me at the table with five senior investment professionals from Morgan Stanley, Goldman Sachs, Lehman Brothers, JPMorgan, and the head of research at Tudor, who had made a fortune during the crash. I analyzed actual trades with the names of brokers and end clients—tracking who bought and sold during the crash across multiple markets, including S&P 500 futures, S&P 500 baskets, and rates.
This experience shaped my understanding of markets. Ever since, I’ve been focused on answering who owns what and why. Today, we call this flow and positioning, but knowing who held what and the pressures they faced was invaluable back then. Were they in a drawdown? Were they doing well? Did they see inflows or outflows? Were they levered or not? Understanding these dynamics—and who the players and their end investors were—has been the foundation of my life’s work.
Is that understanding of flow and positioning what guided your career following Solomon Brothers, even when you had the chance to work with firms like Long-Term Capital Management (LTCM)?
When many of my friends at Solomon’s prop desk went off to start LTCM, I had the worst year of my career in 1995. My convertible bond strategy and most hedge funds collapsed due to the Fed tightening. I asked those guys for a job multiple times. Thank God I didn’t get it, but they were the most brilliant people I knew back then. At the time, Solomon had just gotten past the treasury bond auction scandal, which John Meriwether, at least in part, oversaw, and that led to his departure to start LTCM. By then, Solomon was the worst-performing stock in the S&P 500 for the first ten years of my career—bar none. So, when LTCM launched, Solomon wasn’t a great place to be. I thought it through carefully—and even acted on it—but they didn’t want me.
Following LTCM, is that when things started clicking for you from a macro perspective regarding the relationship between macro crises and relative value trades failing? Moving into the future, what are some of the big macro themes you think may affect market outcomes significantly over the next few years?
Honestly, back in 1995, I had no idea what macroeconomics meant or how it worked, and I didn’t fully appreciate its significance. By 1998, it started becoming more apparent with the LTCM unwind. It wasn’t just LTCM; many firms, including Citibank, where I worked, were involved in government bond arbitrage. LTCM was simply the poster child, so attention gravitated there. By 2004, when I started my hedge fund, people were beginning to consider the possibility of hedge funds deleveraging as a cause of widespread contagion. Still, it wasn’t until 2007 and 2008 that I truly grasped the scale of that risk.
In any case, I prefer to operate on a one-year horizon. What’s clear now is that the Fed, more so than other central banks, has concluded that inflation is no longer a concern—it’s not going to re-accelerate. Because of that, they can lower interest rates relatively quickly, even if the job market doesn’t weaken enough to force their hand. You could call it a normalization. Since mid-December of last year, when the Fed started emphasizing the importance of real short-term interest rates, we’ve been on this path toward normalization. The idea is that real short-term rates dictate both inflation and economic strength, and the Fed is fully committed to returning to a normal interest rate—quickly.
The critical question is, are they right? That’s what markets are wrestling with now. Are they correct in saying that financial conditions are tight and that lowering short-term rates will ease those conditions, which flow through to stimulate the economy? Typically, the Fed doesn’t try to steer the economy directly; instead, it responds to and offsets economic pressures. When inflation rises, they hike—and do it aggressively, though often a bit late until they’re confident. They keep hiking until they’re optimistic inflation is rolling over. Conversely, when they cut rates, they should, in my view, be leaning against a trend and responding to a slowing economy that’s disinflationary and underperforming on growth and jobs.
We’re in a strange situation now. The Fed doesn’t need to combat inflation, and they certainly don’t believe they need to. Instead, they think that by acting too cautiously, they risk over-correcting. So they’re normalizing rates. But what does “normal” even mean now? Is the current path of normalization too aggressive? At the heart of it, this revolves around the pace and destination of rate cuts. That’s what we need to watch moving forward.
There’s also an election coming in early November, which could impact the economy. Politically, I believe it doesn’t matter much which party is in power—they both tend to increase the pie by accumulating more debt and engaging in deficit spending. The difference lies in who and how they distribute that pie. It matters for specific sectors and individual stocks. One might think that oil would do very well under Harris and very poorly under Trump, but one might think that oil companies are going to do very well under Trump and very poorly under Harris. It’s complicated but consequential.
Post-election, I’ll be watching to see if there’s any sign of austerity from either party, though I expect none. We’ll likely continue running budget deficits, though they won’t grow as fast. COVID drove a rapid spike in spending, but we’ve since returned to a more constant deficit. The change in expenditures, rather than the percentage of GDP, influences the economy. If spending remains steady, it acts as a drag. If it grows, it stimulates the economy. How that unfolds depends on the balance of power between the House, Senate, and the Oval Office.
Looking ahead, the Fed will cut rates to around 3%, leading to a soft landing—no significant increase in unemployment and inflation hitting their target. I find that scenario unlikely. It’s like a skipper on a battleship trying to dock perfectly by pulling an antiquated lever. The Fed doesn’t have that much control by tweaking the short-term interest rate; financial conditions matter most to me: the availability and cost of financing for consumers and companies, accumulated wealth, and the health of the dominant financial institutions. Right now, all indicators suggest consumption and investment conditions are favorable. At the corporate and individual levels, income is strong, and corporate profits are expected to remain robust. There’s no need to dissave or leverage up, but they can if they want to consume.
Given these conditions, I’ve remained bullish on the economy since April 2020 and still don’t foresee a recession. This leads me to question why the Fed is normalizing rates and why they believe this won’t stimulate consumption and investment. I think the 3% rate target is too low. If I’m right, inflation will stay sticky or rise slightly relative to their target—not dramatically, as there’s no supply shock, but the demand and monetary sides are still stimulative. Why would major corporations start cutting jobs when they’re reporting record earnings and the economy sees record GDP? I don’t expect a significant weakening in the job market, especially as the government continues deficit spending. In my view, the direction the central bank is taking—normalizing rates—is misaligned with the economy’s current strength.
Is this preemptive action by the Fed a mistake?
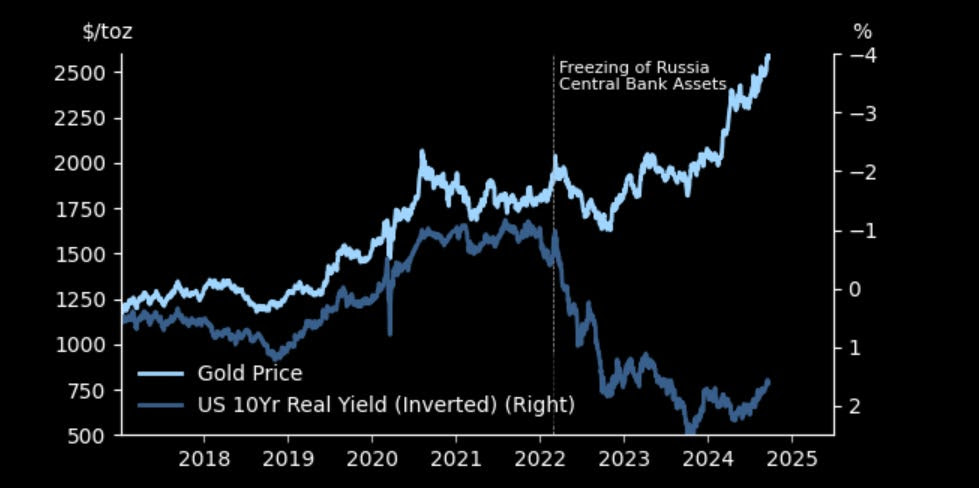
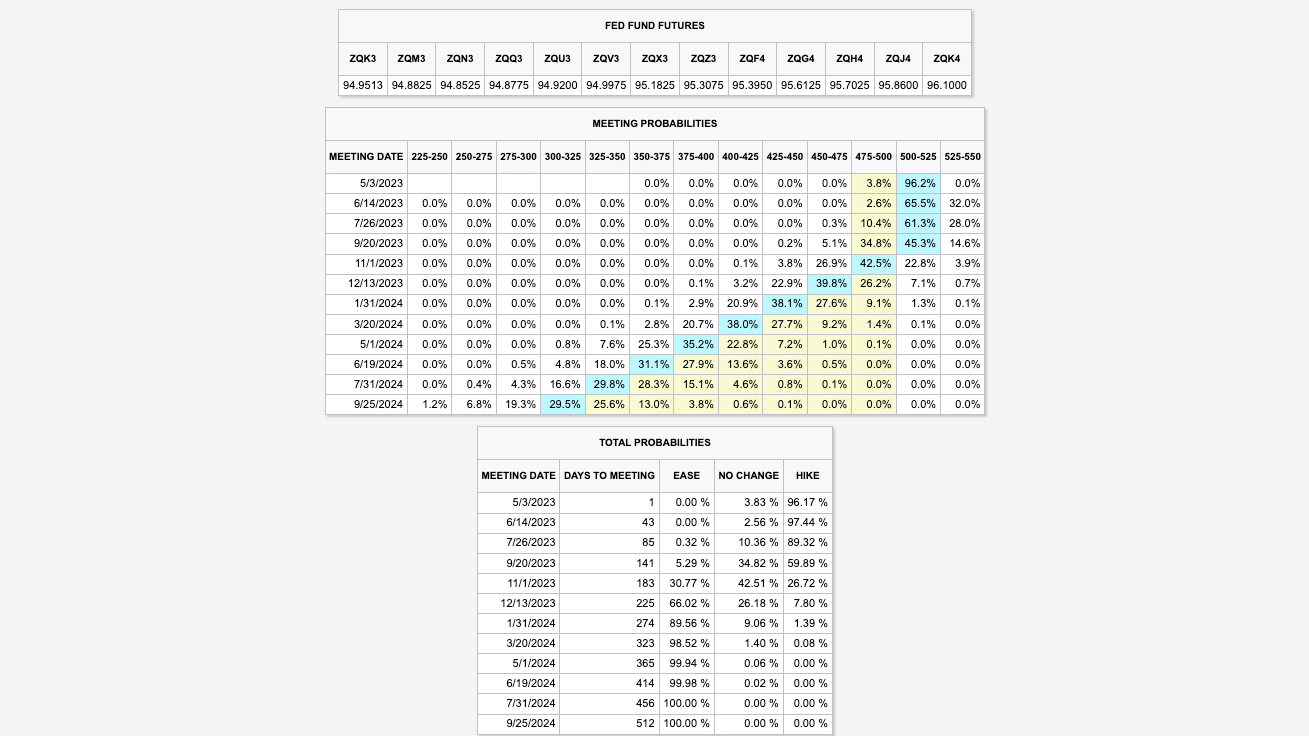
I don’t know. We’ll have to see what Jerome Powell does. He cut rates by 50 basis points, and now (September 25), the markets are pricing in about a 17% chance that the two 25 basis point cuts projected for the next two meetings will happen. There’s an 83% chance we’ll see two 50 basis point cuts or one 50 and one 25. The trough interest rate they’re targeting is now around 2.87%, the lowest we’ve seen, except for a brief moment on August 5 when people called for emergency cuts of 75 basis points. So, that’s a significant drop. Christopher Waller and other Fed officials have indicated that rates will likely come down over the next 6 to 12 months, and there’s plenty of room for further cuts. The Fed’s ‘dots’ representing the minimum projected path for interest rates validate this. Meanwhile, inflation expectations have risen daily since the Fed meeting, with gold at all-time highs, bitcoin rallying, stocks not so much, and long-term bonds selling off. Only very short-term bonds are rallying.
Gold is inversely correlated with rates, correct? So, you have other factors, like buying from central banks, that may help buoy it in recent years, correct?
Yes. Many central banks have been increasing their gold holdings — the obvious ones are China and Saudi Arabia. Switzerland is another, and some of the buying may involve private citizens in some cases. There’s been a broader trend among countries that don’t want to hold U.S. assets, particularly adversaries, turning to alternatives like gold. But this flow is unpredictable. Prices slow it down; people don’t buy gold at any price. It’s fairly inelastic — they’ll buy at most prices but not at every price.
In my framework, I’ve always been bullish on gold since leaving Bridgewater, where I was indoctrinated to understand the value of non-fiat currencies. I haven’t yet bought into Bitcoin because its price is still too correlated with the Nasdaq for me to consider it a true monetary equivalent, though it may become one someday.
Moreover, there are a few ways inflation arises. Demand-side inflation happens when people decide to spend more, which can vary with societal changes and human behavior. Supply-side inflation can come from labor shortages and rising costs in services and manufacturing. However, the latter can’t be hedged with gold because its value doesn’t depend on these forces. The key to gold is its relationship to currency. The more currency that gets printed, the less valuable it becomes relative to gold. Gold is a hedge against monetary inflation. That said, I’m cautious about gold prices in the short term because we’ve diverged from the following three core factors I look at.
First, I see gold as a real currency with a zero coupon. Real rates have fallen but recently stabilized. Despite this, the drop in real rates has driven up gold prices considerably, making gold seem overvalued relative to real rates.
Second, I consider the credibility of central banks. Are they becoming more or less credible? You could debate that all day. You hold gold if you believe there’s less confidence in central banks. I think they’ve done a decent job tackling inflation, at least in perception, which should be bearish for gold since the Fed’s “mission accomplished” suggests stronger credibility.
Lastly, I look at monetary inflation. The U.S. has pretty much wrapped up its money-printing experiment. Sure, we still run a deficit, but that’s different from the aggressive balance sheet expansion we saw before. The balance sheet is still too large, but the impulse has subsided. Meanwhile, China has signaled a willingness to ease credit conditions, lower rates, and encourage banks to buy equities, though they haven’t engaged in fiscal stimulus yet. If they do, China could be where the U.S. was in 2021, which would be bullish for gold. I suspect part of the reason for increased Chinese gold buying is the expectation of significant monetary stimulus. We’ll have to wait and see if that happens, but it would be very bullish for gold if it does.
All things considered, I think gold is overpriced, so I’m trimming my gold positions in my beta portfolio. I’ve even placed a small speculative short position in my alpha portfolio. It’s still a bull market for gold, but bull markets do correct, and I’ll probably be buying the dip when it happens.
Graphic: Retrieved from Goldman Sachs Group Inc (NYSE: GS) via The Market Ear.
In the context of inflation staying sticky, could you foresee a period when, even if markets rise in nominal terms, in real terms, they don’t go anywhere or go down?
The ideal scenario for a broad portfolio to meaningfully outperform cash is if the central bank eases more than expected and inflation doesn’t respond. If that happens, every asset will outperform cash. Is it possible? Of course—it’s happened. Assets have done very well relative to cash this year despite a brief drop in August. But the question remains: can this continue indefinitely? There’s a natural limit to asset growth. Still, for now, the central bank seems more dovish each day despite no supporting data. It raises the question of whether they have an agenda. I don’t believe they know more than anyone else, but their actions suggest a strong confidence that inflation won’t rise. If they’re right, assets should hold up. Will they perform exceptionally next year? Probably not. But with cash yielding less than 4% on a one-year bill, that’s becoming less attractive too.
Leading to the volatility during August, we saw some rotation beneath the surface of the index, with movement into small caps and some softening in names like Nvidia. One could say that foreshadowed further weakness. Still, did you ever anticipate the unsettling volatility we saw and the subsequent quick recovery?
I wrote a fairly extensive piece on the dispersion trade and was bearish on the idea, expecting it to unwind. I was mindful of the yen’s strengthening and role in deleveraging, especially after seeing the wild moves in July following the CPI report. There was some instability, which I anticipated. But, in hindsight, the only real opportunity was to go all-in long at the bottom in August. I covered some positions and bought a bit more, but I didn’t cover enough, and I’m surprised by how strong the reversal was. Looking back, it’s clear the markets were already convinced the Fed would ease aggressively, and that’s where we stand now.
I saw a lot of commentary about how some of that risky positioning could have been doubling down following the August drop. Do you get concerned that this foreshadows something bigger happening in the future?
Everyone currently in the market is where they want to be. Their risk managers are comfortable, they’re comfortable, and they’re not over-leveraged. There’s no one delaying a margin call right now. These speculative unwinds happen fast unless they’re systemic and start feeding on each other. But we didn’t see that. More importantly, there was no sign of any banking institution struggling. The bigger story is consistent (i.e., passive) investment driven by strong incomes, robust job markets, steady 401(k) contributions, insurance plans, and government spending. In addition, reinvesting income from existing investments continues to fuel this trend. From what I see, it’s fairly leveraged, but only a significant drawdown would cause that to reverse.
And when you say meaningful drawdown, what does that look like?
10% corrections would probably mean a dip is less likely to be bought. You know, a 5% correction is just getting bought.
Could you ever foresee, though we have things in place to prevent such a thing from occurring again, a 1987-type crash unwinding some of this risky positioning in a big way? How would that look?
The odds of a stock market crash are low. A slower correction is more likely than a crash.
We had this rapid move down, and we’ve come back up. With markets now near all-time highs, how do you think about portfolio structuring? You talked a bit about positioning in gold, equities, etc. How do you think about structuring a portfolio, and do you look at things like volatility or skew levels as an input or guide?
When constructing a portfolio, the first step is to clarify your goals. For most people, the aim should be building a balanced portfolio that’s diversified across growth and inflation risks. It’s important not to focus on timing markets or picking specific asset classes. Instead, set it and forget it, with a long-term horizon of 10-20 years. Of course, some money will be needed sooner, so you must manage that more conservatively. Depending on your age and job prospects, you might adjust your risk tolerance—the better your prospects, the more risk you can afford.
My advice? Don’t spend time betting on markets. Focus on building a “set it and forget it” beta portfolio of long assets and keep adding to it. Spend your energy earning money outside the market instead. Speculating on markets is tough. It’s a zero-sum game—your gain is someone else’s loss, and that person is likely smart and motivated. It’s “Fight Night,” not passive investing. Thinking you’ll get lucky? These are sharks out there who will devour you. Competing against them far exceeds the costs of gambling in a casino. It’s like playing poker, not blackjack or craps. If you enter the game, you better be confident in your strategy because the competition is fierce.
If I’m not sleeping, I’m working to maintain whatever edge I might have, and I’m still unsure if I even have one. So, how do I build portfolios? Cautiously, with low confidence, sticking to what I know. I balance risk management, never going all in and grinding through it, just like Joey Knish, John Turturro’s character in Rounders. That’s the guy I want to be.
In terms of Damped Spring’s story, what do you want to do there? You’ve been running that for a few years, starting with a very small followership, and then you scaled that up. You’ve gotten to this point? What’s next?
I have a life I enjoy. I maintain relationships with a few hundred institutional clients, and over 15 of the largest firms value my insights. I provide them with my research, and I’ve also built deep connections with professionals—many of whom prefer to remain anonymous—who want to be members of Damped Spring. These members ask me questions like yours, and I give them data-driven answers. My goal is to meet them wherever they are on their learning curve and help them progress in a very hands-on way. Every day, I work with clients, answering their questions thoughtfully or being upfront if I don’t have the answer. I find that incredibly rewarding.
The financial side is a small part; it’s not about the money for me. Institutions pay because they value the service, and I charge individuals mainly to ensure they’re serious and to avoid wasting time with internet trolls. But people care—they want to be part of this community and learn from each other, which is wonderful. I’ll keep doing it for as long as I can add value and people want to hear what I say.
I’ve also started “2 Gray Beards” with Nick Givanovic. It’s a different approach—we offer low-touch, 20-minute videos once a week explaining what’s happening worldwide and what it means for long-only portfolios. People interested in 2 Gray Beards often don’t have much time to consider their investments. Many rely on their financial advisor or money manager, who might charge 80 basis points a year—say $40,000 for someone with decent wealth—and often, they don’t fully understand what the advisor says.
We aim to reach these end clients directly and say, “Here’s what’s happening. Watch these videos for 20 minutes a week for a few months, maybe half a year, and I guarantee you’ll be able to have a more meaningful conversation with your financial advisor. If we’re successful, you might understand your portfolio better than your advisor.” Nick and I see this as valuable and love doing it.
What’s the biggest lesson you’ve learned in the last four years? It could be good or bad.
Underestimating how far momentum could take the market, whether up or down. I was bullish from April 2020 to February 2022, and I thought a 5 or 10% correction in 2022 would be the extent of it—but I stayed long for too long. Likewise, as markets bounced, I held onto my short positions for too long. What’s interesting to me is the role of momentum. It seems to be a more dominant factor than my models have suggested, and while I’m addressing it, it’s still somewhat unclear whether this is driven by momentum strategies or just passive money flows. I’m still learning, but that’s what I’m focused on most right now.
Well, that ties it up. I appreciate your time. It is an honor. Is there something else you’d like to add?
Recognize that beta is the way to go—it’s not difficult, and anyone can guide you through it. However, be cautious not to get too caught up in short-term trading.
Disclaimer
By viewing our content, you agree to be bound by the terms and conditions outlined in this disclaimer. Consume our content only if you agree to the terms and conditions below.
Physik Invest is not registered with the US Securities and Exchange Commission or any other securities regulatory authority. Our content is for informational purposes only and should not be considered investment advice or a recommendation to buy or sell any security or other investment. The information provided is not tailored to your financial situation or investment objectives.
We do not guarantee the accuracy, completeness, or timeliness of any information. Please do not rely solely on our content to make investment decisions or undertake any investment strategy. Trading is risky, and investors can lose all or more than their initial investment. Hypothetical performance results have limitations and may not reflect actual trading results. Other factors related to the markets and specific trading programs can adversely affect actual trading results. We recommend seeking independent financial advice from a licensed professional before making investment decisions.
We don’t make any claims, representations, or warranties about the accuracy, completeness, timeliness, or reliability of any information we provide. We are not liable for any loss or damage caused by reliance on any information we provide. We are not liable for direct, indirect, incidental, consequential, or damages from the information provided. We do not have a professional relationship with you and are not your financial advisor. We do not provide personalized investment advice.
Our content is provided without warranties, is the property of our company, and is protected by copyright and other intellectual property laws. You may not be able to reproduce, distribute, or use any content provided through our services without our prior written consent. Please email renato@physikinvest for consent.
We reserve the right to modify these terms and conditions at any time. Following any such modification, your continued consumption of our content means you accept the modified terms. This disclaimer is governed by the laws of the jurisdiction in which our company is located.
This week’s letter begins with an overview of reflexivity. Many works exist on this topic, with “The Alchemy of Finance” summarizing it well. Written by investor George Soros, it concludes that markets are often wrong, and biases validate themselves by influencing prices and the fundamentals they should reflect.
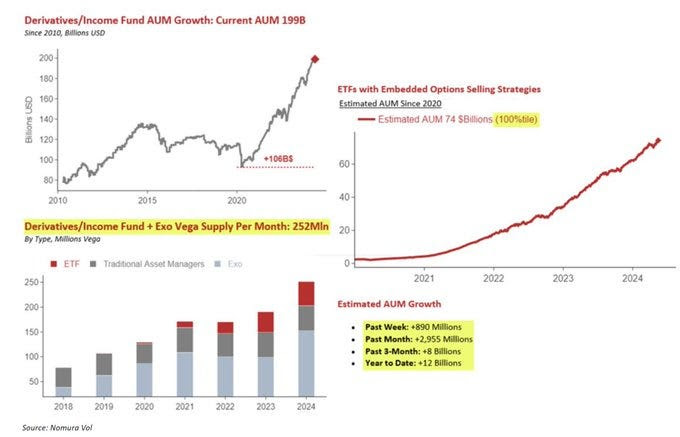
Namely, reflexivity is this feedback loop between participants’ understanding and the situations they’re participating in. Sometimes, these feedbacks manifest far-from-equilibrium prices. Think of the connection between lending and collateral value, selling stock to finance growth in the dot-com boom, leaning on cheap money to make longer-duration bets on promising ideas, or the success of volatility trades increasing the crowd in volatility investments, be this dispersion or options selling ETFs.
Graphic: Retrieved from Nomura Holdings Inc (NYSE: NMR)
Perception begets reality, with these far-from-equilibrium conditions reinforced until expectations are so far-fetched they become unsustainable. Sometimes, the corrections become something more, with self-reinforcing trends initiating the opposite way.
Enron creatively hid debt from its balance sheets, guaranteeing it with its stock. When the stock fell, it revealed financial misdeeds, contributing to a broader market downtrend, bankruptcies, and corporate scandals.
FTX brought itself and some peers down when withdrawals revealed a billions-large gap between liabilities and assets.
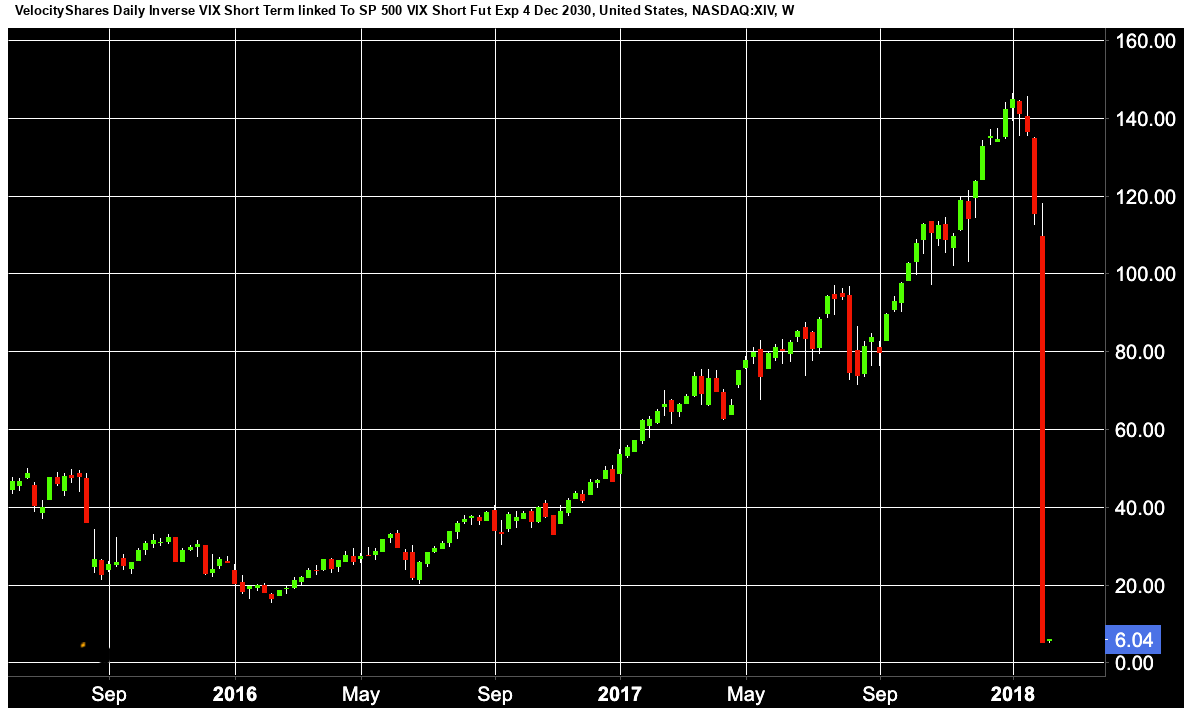
Volmageddon climaxed with the demise of products like the VelocityShares Daily Inverse VIX Short Term Exchange-Traded Note (ETN: XIV) after a sharp jump in volatility sparked a doom loop; to remain neutral, issuers rebalanced, buying large amounts of VIX futures, which propelled volatility even higher and sent products like XIV even lower.
Graphic: VelocityShares Daily Inverse VIX Short Term Note (ETN: XIV) retrieved from investing.com.
The expansion of such trades increases liquidity, sometimes making assets appear more liquid and money-like stores of wealth. This may also stimulate economic growth. Likewise, the contraction or closing of these trades can lead to a sudden reduction in liquidity, negatively impacting the economy and market stability.
“The Alchemy of Finance” identifies a recurring asymmetric market pattern of slow rises and abrupt falls. Additionally, if market prices accurately reflected fundamentals, there would be no opportunity to make additional money; just invest in index funds.
Further, we continue to see interventions to stabilize markets, and they encourage further distortion and misdirection of capital. Often, such interventions are blamed for benefitting wealthy investors most and increasing inequality. As explained in works like “The Rise of Carry: The Dangerous Consequences of Volatility Suppression and the New Financial Order of Decaying Growth and Recurring Crisis,” monetary authorities and regulators’ interventions reinforce scenarios of deteriorating economic growth, more frequent crises and less equality and social cohesion.
We’re getting off track, but the point is that the conclusions and approaches outlined in “The Alchemy of Finance” are captivating. Soros sought to understand markets from within without formal training, access to unique information, or his being math savvy; instead, he attempted to connect deeply with markets, assuming they felt like he did and he could sense their mood changes.
“We must recognize that thinking forms part of reality instead of being separate from it,” he explains. “I assumed that the market felt the same way as I did, and by keeping myself detached from other personal feelings, I could sense changes in its mood, … mak[ing] a conscious effort to find investment theses that were at odds with the prevailing opinion.”
We apply this understanding of the market’s mood in our best way here. Our long-winded analyses of everything from technicals to positioning and, increasingly, fundamentals and macroeconomic themes give us a holistic understanding of what’s at stake, whether self-reinforcing trends exist, and whether to adjust how we express ourselves.
Let’s get into it.
The Great Rotation
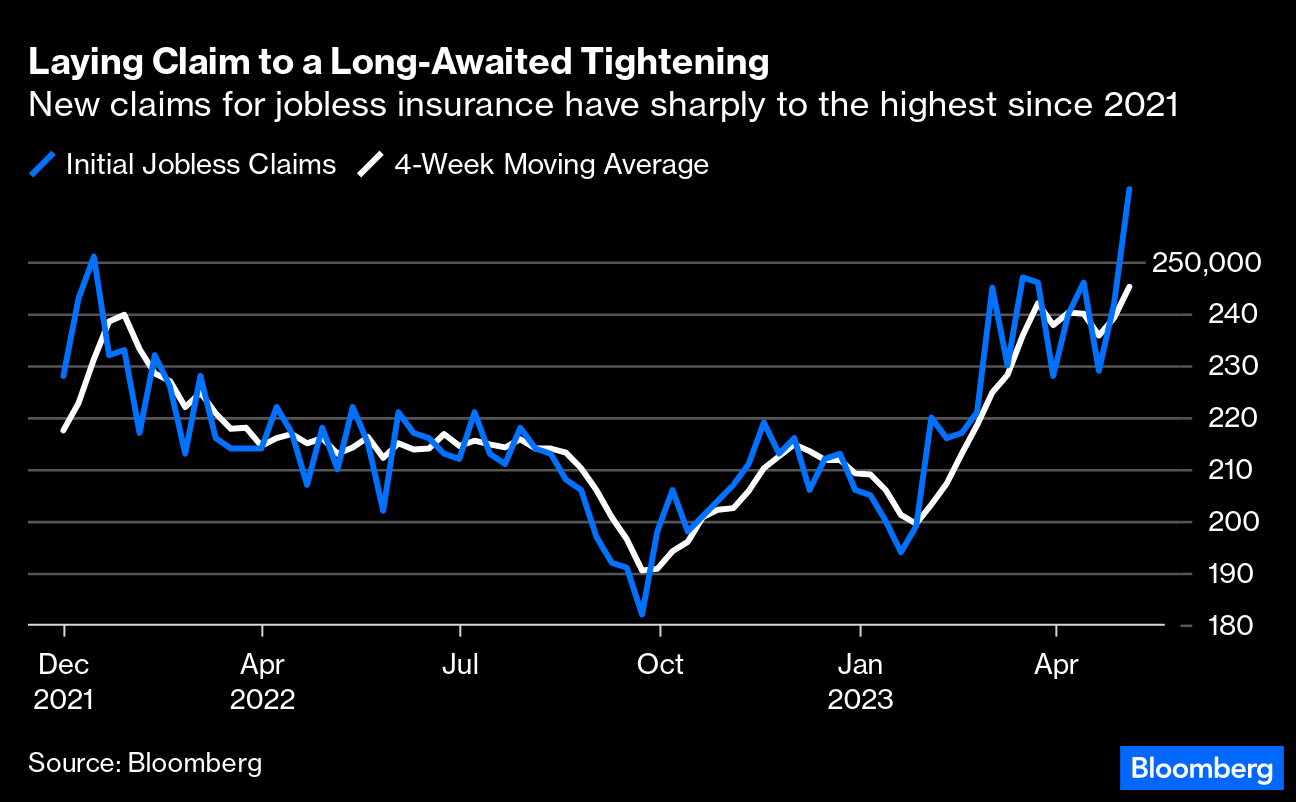
Last Thursday, an update on consumer prices showed US inflation cooling to its slowest pace since 2021. Accordingly, traders began pricing the news and buying bonds in anticipation the Federal Reserve may cut its benchmark rate by ~0.75% this year.
Graphic: Retrieved from CME Group Inc’s (NASDAQ: CME) FedWatch Tool. SOFR is a check on market conditions and expectations regarding short-term interest rates.
Optimism about lower interest rates prompted investors to shift from the previously favored large-cap tech, AI, and Mag-7 stocks into riskier market areas and safe-haven assets like gold, reflecting concerns about a potential dovish mistake. The Russell 2000 (INDEX: RUT), an index of smaller companies, outperformed the Nasdaq 100 (INDEX: NDX) by one of the most significant margins in the last decade. Despite the S&P 500 (INDEX: SPX) declining by nearly 1%, almost 400 components recorded gains.
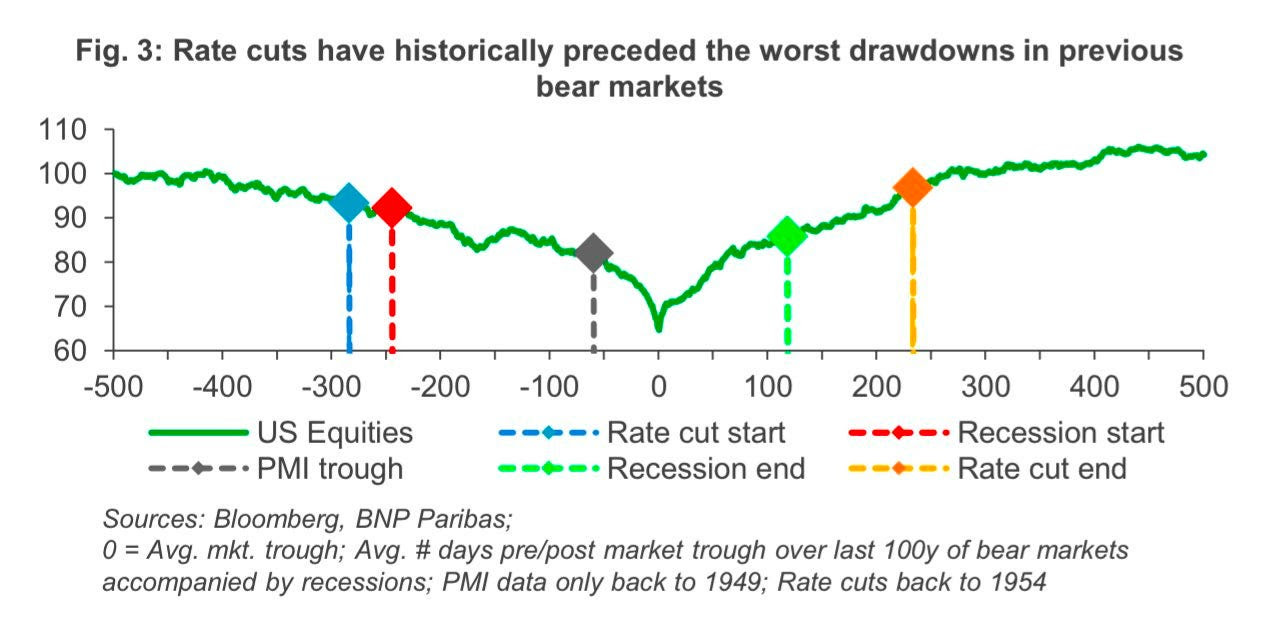
Graphic: Retrieved from BNP Paribas (OTC: BNPQY) Markets 360.
With these underlying divergences, committing capital to bearish positions is challenging. Breadth strengthened with more volume flowing into rising stocks than falling ones. This wouldn’t happen in a sell-everything scenario, explaining the hesitation to sell.
Graphic: Market internals as taught by Peter Reznicek.
The outsized movement observed isn’t surprising as it aligns with the narrative we shared earlier this year.
While individual stocks are experiencing significant volatility, indexes like the S&P 500, which represent these stocks, show more restrained movement. For example, after Thursday’s sell-off, despite its large constituents like Nvidia Corporation (NASDAQ: NVDA) weakening, the S&P 500 firmed.
Here’s a chart to illustrate.
Graphic: Retrieved from TradingView. Nvidia versus the S&P 500, with the latter in orange.
Among the culprits, investors have concentrated on selling options or volatility (the all-encompassing term) on indexes, and some of this is used to fund volatility in components, a trade (considered an investment by some) known as dispersion.
The trade is doing well in this environment, with Cboe’s S&P 500 Dispersion Index (INDEX: DSPX) jumping to a one-year high. Dropping realized volatility (i.e., volatility calculated using historical price data) and a widening spread between stock and index implied volatility (i.e., expectations of future volatility derived from options prices) validate this trade’s success, reports Mandy Xu, the Vice President and Head of Derivatives Market Intelligence at Cboe Global Markets (BATS: CBOE).
Graphic: Retrieved from Cboe Global Markets’ (BATS: CBOE) Mandy Xu.
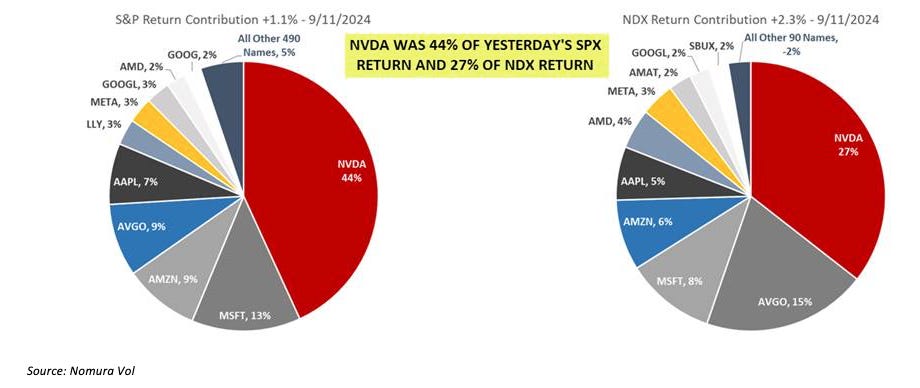
“The market has been broken up into two groups: 1. Nvidia and Magnificent 7; and 2. The other 493. The correlation between those two groups has been low, which has pressured S&P 500 correlation,” explained Chris Murphy, a derivatives strategy co-head at Susquehanna. “When looking at S&P stocks on an equal-weighted basis, the outsized impact of the MAG7 as a group and NVDA specifically is neutralized.”
Understanding correlation is critical to grasping the pricing dynamics between index options and their components and trading volatility dispersion. When counterparties (our all-encompassing term for the dealers, banks, or market makers who may be on the other side) fill their customers’ options sales in the index, they may hedge by buying the index as its price falls and selling when it rises, with all other conditions remaining the same. Consequently, trading ranges may narrow, with realized volatility also falling.
To explain visually, see immediately below. Movement benefits the counterparty’s position. Hedging may result in trading against the market, selling strength, and buying weakness.
This effect may be less pronounced or absent in single stocks, which do not experience the same level of this supposed volatility selling; instead, there is more buying, and the opposite occurs. Movement is a detriment to the counterparty’s position, with all else equal. Hedging may result in trading with the market, buying strength, and selling weakness. This can reinforce momentum and give trends a lease on their life; hedging can help sustain and extend market movements rather than neutralize them.
Together, as counterparties align the index with its underlying basket through arbitrage constraints, its volatility is suppressed, and the components can continue to exhibit their unique volatility—the only possible outcome is a decline in correlation. If the index is pinned and one of the larger constituents moves considerably, the dispersion trader may make good money in such a scenario.
Graphic: Retrieved from Bloomberg.
We now see large stocks starting to turn and lesser-weighted constituents in the S&P 500 firming up, picking up the slack. For instance, Nvidia traded markedly higher immediately after its last earnings report, and the S&P 500 was unfazed. Something is giving, and those constraints we talked about keep things intact.
The rotation, in and of itself, is healthy, giving legs to and broadening the equity market rally. It’s just that it’s happening with the most-loved stocks being severely overbought.
Graphic: Retrieved from BNP Paribas.
Should interruptions continue across large-cap equities, souring speculation on further upside, a broader turn and outflows may manifest. The market’s gradual shift into a higher implied volatility environment, notwithstanding direction, may aid in any such unsettling, feeding into a higher realized volatility.
Building on this point, we observe a shift in S&P 500 call options before last Thursday’s steep decline. Implied volatility rose with the S&P 500. SpotGamma indicates this is partly the result of demand for SPX call options as traders seek synthetic exposure to the upside in the place of stock. This “SPX up, SPX vol up” pattern is unusual and typically happens near the short-term tops.
Graphic: Retrieved from Bloomberg via Danny Kirsch, head of options at Piper Sandler Companies (NYSE: PIPR).
SpotGamma adds that the pressure on individual stocks that followed last Thursday stemmed from significant selling of longer-dated calls in the tech sector, a last-in, first-out (LIFO) phenomenon. In other words, those late to the party are the first out!
The counterparts on the other side of this trading potentially (re)hedge this by selling stock.
Graphic: Retrieved from SpotGamma.
However, with call selling, the chances of sustained follow-through are significantly lower. Put buying, which was less prevalent, changes this dynamic.
In the case of a prolonged downturn, equity put buying is the key indicator we would watch for, along with deteriorating market internals such as breadth, as analyzed earlier. We want to see traders committing more money to the downside at lower prices, and increasingly so, as prices drop and the range expands downward. That’s what market and volume profiles can help with!
The fundamentals don’t necessarily support the case for some disastrous downside, though.
A dovish Fed can be good for risk as it’s seen as preemptive, BNP Paribas (OTC: BNPQY) shares. Or, a dovish Fed could suggest a coming deceleration. In any case, long-term interest rates will be least sensitive to any change, a negative implication for capital formation, growth, and equity returns.
The Summer Of George
Kai Volatility founder Cem Karsan uses this Summer of George Seinfeld reference to describe the current market. During the summer months, there is insufficient liquidity to overwhelm the market’s current position.
Graphic: Retrieved from Bloomberg via Michael J. Kramer.
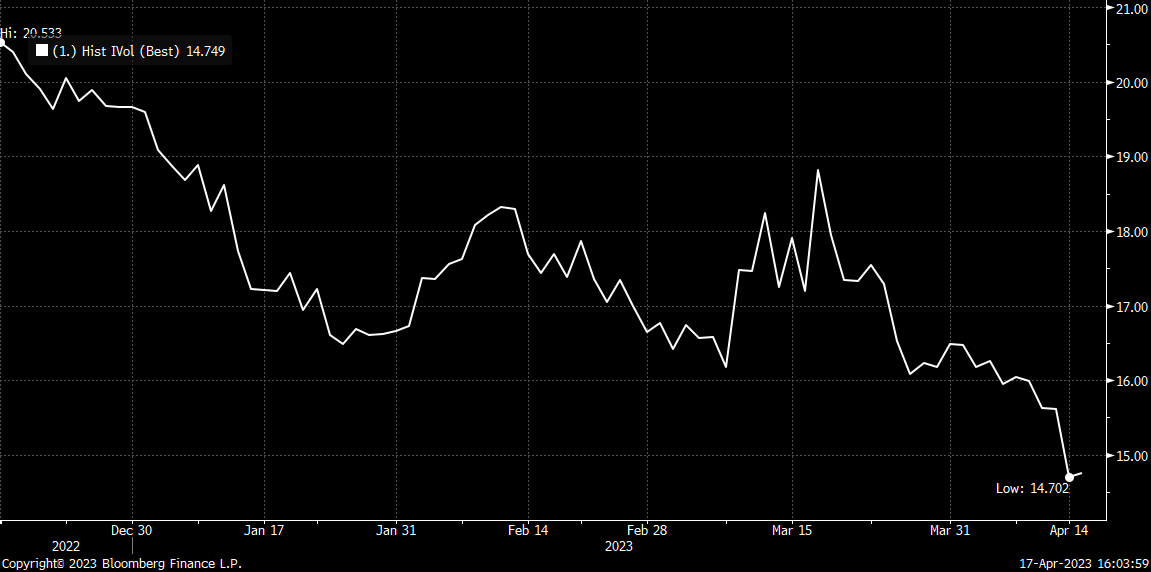
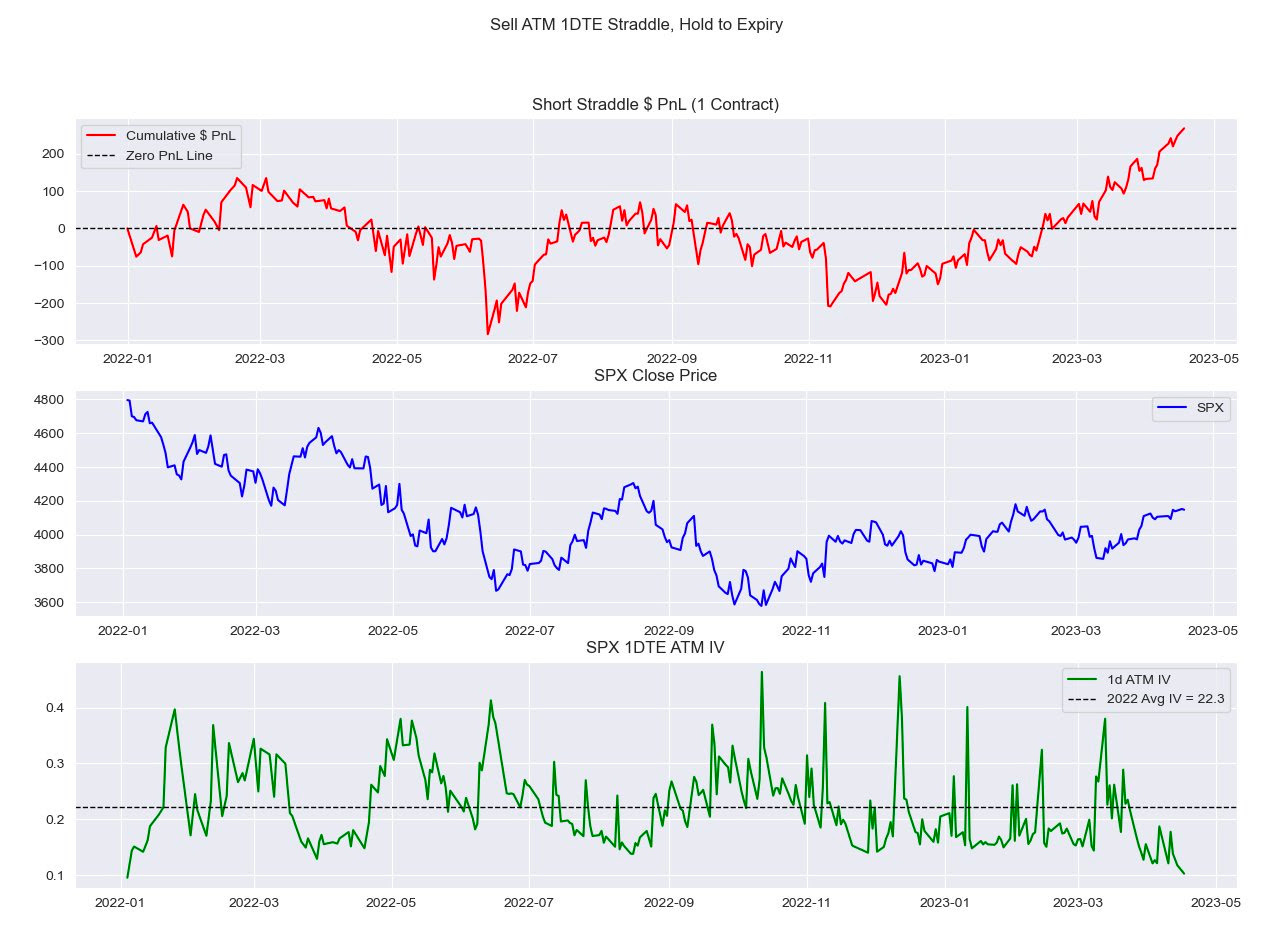
We know the SPX volatility risk premium is near its highs this year. The Cboe, itself, shows the implied-realized volatility spread widening to 4.5% (96th percentile high).
Implied volatility is low, but not cheap. Consequently, short-leaning volatility trades mentioned in this document remain attractive.
At the same time, however, there’s still a ton of volatility protecting investors against downsides owned below the market.
To quote QVR Advisors, there’s “too much supply of front month call selling and too much buying demand for longer-dated puts.”
“This trade flow is contributing to a large and growing structural dislocation which is not compensating ‘insurance sellers’ (i.e., near-dated call and put writers) and is overcharging in implied volatility terms, buyers of insurance (i.e., long-dated puts).”
Taken together, the implications are staggering. With calm and falling realized volatility, there may be some counterparty re-hedging. This may consist of buying stocks and futures and supporting markets where they are.
Let’s break down some of the trades to understand better.
Consider yourself a customer who owns 100 shares of the SPRD S&P 500 ETF Trust (NYSE: SPY). You’re traveling to Europe and want to hedge your position against the downside. So, you wake up one morning, go online, and tell your broker you want to buy one at-the-money 50 delta SPY put option.
The delta is terminology for how that option’s price will change based on a $1 change in the underlying. In this case, for every $1 move up/down, the option will change in value by $0.50. Delta is also used to estimate the likelihood of an option expiring in the money. For example, a delta of 0.5 suggests there is approximately a 50% chance the option will expire in the money. There’s also gamma, the second derivative of how the option’s price changes with underlying changes, but we won’t discuss that further.
With your 100 shares hedged, if the market goes down, you don’t mind. You’re hedged, after all!
Naively, we’ll say this trade wasn’t paired up against another investor’s; instead, some mysterious counterparty will warehouse this risk. These mysterious persons want nothing to do with the directional risk of your trade. They’ll hedge by selling 50 SPY shares (i.e., 100 × 0.50). Again, we’re naive here and don’t consider their potential to offset this risk with other positions they may have.
You check your phone after a while and find that SPY hasn’t moved much. Your 50 delta put is now 20 delta. Bummer! You shrug, turn off your phone, and hit the beach.
What happened to that mysterious counterparty on the other side of this trade, though? They bought back 30 SPY shares, supporting the market and reinforcing the trend!
Though this is a naive take, it may help.
Reality Is Path-Dependent
Your and the counterparty’s actions partly shaped the SPY’s price movement. You bought puts, setting off a chain of events. The counterparty hedged, the market didn’t move, and the hedge was unwound. This only serves to support the SPY further.
“There’s skew in the market, which ultimately forces a buyback of stock by dealers, market makers, banks, etc., every day, and it accelerates into expirations,” Karsan elaborates.
“When the market’s up, there’s a buyback and a momentum re-leveraging, … forcing more buying.”
As we approach the end of summer, things change. Among other things, elections are coming, and there will be some hedging of that. With months to go, broad market hedges against a sudden downturn have appeared generally inexpensive, with three-month puts protecting against a drop in the S&P 500 near their lows. See the dark blue line in the graphic below as an example!
“The high dispersion of stocks has contributed to weighing on VIX,” shares Tanvir Sandhu, chief global derivatives strategist at Bloomberg Intelligence. “If the equity market breath improves then that may weigh on volatility, while a pullback in mega-cap tech stocks could see both correlation and index volatility rise.”
In fact, excluding NVDA, the VIX hit traded into the 9s, on par with 2017 lows.
Graphic: Retrieved from Bloomberg via Michael Green.
SpotGamma adds that we are in the second longest stretch without an SPX 1-day 2% move up/down; traders aren’t committing capital to bets on big moves, either.
We see this in spot-vol beta, which refers to the relationship between the market (which we refer to as the “spot” here) and changes in its volatility over time or volatility’s sensitivity to market trading.
This spot-vol beta has been depressed.
In observance, Nomura Cross-Asset Macro Strategist Charlie McEligott states there’s limited potential for volatility to decrease further, particularly with the SPX 1-month implied correlation at historically low levels.
To that point, “the historically low spot-vol beta we are seeing now will eventually be followed by historically high spot-vol beta,” the Ambrus Group’s co-CIO anticipates.
Graphic: Retrieved from Nomura. A weak spot-vol beta historically leaves stocks going nowhere.
The case is less so valid with more actively traded shorter-dated options. According to Simplify Asset Management’s Michael Green, the sensitivity remains. You just have to look elsewhere.
Shorter-dated options are less exposed to changes in implied volatility; instead, they expose one more directly to movement or realized volatility. They can be more attractive to hedge with but can cause problems and amplify wild swings in rare cases.
Graphic: Retrieved from JPMorgan Chase & Co (NYSE: JPM).
If news shocks the market one way, movements may exaggerate when traders scramble to adjust their risk, as discussed below.
Though that’s usually not a worry, as Cboe puts, according to Karsan, a dwindling supply of margin puts, especially those with high convexity and far out-of-the-money, would be the indicator to watch for impending exaggerated movement. These options, particularly if shorter-dated, are crucial during market stress, serving as indicators and drivers of potential crashes when traded in large sizes (e.g., 5,000-10,000 0-DTE options bought on the offer to hedge).
As a counterparty, you may also use similarly dated options to hedge yourself, bolstering a reflexive loop!
Again, the reality is path-dependent! The path leading to this point—low correlations and reduced availability of those protective options—sets the stage for increased volatility.
Here, we wish to emphasize the convexity component—gamma or the rate at which the delta changes with the underlying asset’s price—rather than the likelihood of the underlying asset reaching the options’ strike prices. Just because an option turns expensive doesn’t mean it is likely to pay at expiry; instead, it may have value because that’s precisely what traders need to trim their margin requirements during volatile markets.
“Implied vol is about liquidity. It isn’t about fear or greed,” writes Capital Flows Research.
“Implied vol is about liquidity on specific parts of the distribution of returns on an asset. Remember, even the outright price of an asset is pricing a distribution of outcomes, not a single destination. Options make this even more explicit by having various strikes and expirations with differing premiums and discounts.”
History shows a minor catalyst can lead to a big unwind. Take what happened with index options a day before XIV crash day.
“Going into the close the last hour, we saw nickel, ten, and five-cent options trade up to about $0.50 and $0.70,” Karsan elaborates. “They really started to pop in the last hour.”
“And then, the next day, we opened up, and they were worth $10.00. You often don’t see them go from a nickel to $0.50. If you do, don’t sell them. Buy them, which is the next trade.”
New rules surrounding the collateral traders must post to trade can only amplify a bad situation, “potentially leading to premature and forced hedging as volatility increases,” The Ambrus Group writes.
“Because everyone has to put down more capital, you have to disallow people from trading down there in a way that you don’t have to now,” JJ Kinahan, president of Tastytrade, says.
The opposite can happen when markets move quickly higher. Take the options activity and price action in the Russell 2000 over the last week. Volatility skew, or the difference in implied volatility across different strike options, steepened accordingly.
Graphic: Retrieved from Bespoke Investment Group via Bloomberg.
Typically, options with farther-away strike prices have higher implied volatility than options with closer strike prices. When the skew steepens, the disparity in implied volatility between these various strike prices widens.
Depending on the steepening, we may have insight into the type of impending velocity and trade accordingly.
For instance, the implied volatility of out-of-the-money (OTM) calls, which offer protection against market upturns, rises significantly compared to at-the-money (ATM) calls and downside protection (puts). This steepening volatility skew indicates heightened enthusiasm among investors regarding potentially large upward market movements.
The steepening call volatility skew below results from distant call options pricing higher implied volatility than usual due to investor demand. Beyond helping understand the market’s thinking and mood, it can serve as a catalyst, with call options buying into a price rise further accelerating movement indirectly by how the other side hedges this risk (i.e., they buy stock to hedge).
Graphic: Retrieved from SpotGamma.
This action is apparent elsewhere, too, in the S&P 500 (as can be seen via the SPX cross-sectional skew graphic from Cboe above), where it’s proving quite sensitive, as well as single stocks like NVDA and Super Micro Computer Inc (NASDAQ: SMCI). We provided examples this year where steepening call skew helped reduce the cost of trades we used to capture the upside. In one case, we removed SMCI butterfly and ratio spreads for tens of thousands of percent in profit (e.g., $0.00 → $10.00)!
Graphic: SMCI volatility skew in February, relative to where it was (shaded) in recent history before that.
Market Tremors
This week’s market tremors are affecting some of the most loved areas of the market, and a flattening skew (e.g., green line versus grey line below) alludes to further potential for pressure.
Graphic: Retrieved from SpotGamma.
In the long term, a few things stick out, including high interest rates and a stronger dollar, which create macroeconomic problems.
A few explain it better than we do. Higher US interest rates relative to other economies can result in outflows and stress. Just look to places like Japan, where there’s been a lot of currency volatility. If the dollar’s strength continues, it could lead to crises elsewhere, creating a ripple effect and priming potential volatility at home.
“A US Dollar devaluation will then be a tailwind to S&P 500 earnings, which would be positive for stock prices,” Fallacy Alarm summarizes. “However, an unwinding carry trade also causes deleveraging, which is typically not good for asset prices.”
May this upset popular trading activities and catapult something minor into something more?
Sure, and the current low correlation and implied volatility mean that any considerable market disruption could have a substantial impact. Still, markets are intact and likely to stay so.
“If we continue to grind higher, options will get cheaper and cheaper on their own accord. Not to mention all the vol selling that’s getting them to a point which is even cheaper, at some point,” Karsan adds. “And the acceleration generally in those things becomes on the upside, the realized volatility on the upside gets to be just too big relative to the implied, which means it becomes profitable for entities to come in and start buying vol at these lower levels. Add to that, the vol supply is likely to dissipate a bit as we get into September, October, and November. Why? We have an election sitting there.”
So, as the market moves higher, it transitions into this lower implied volatility, reflected in broad measures like the VIX. If the VIX remains steady or higher, “that indicates that fixed-strike volatility is increasing, and if this persists, … it can unsettle volatility and create a situation where dealers themselves … begin to reduce their volatility exposure,” naturally buoying markets as previously outlined. If there is greater demand for calls, counterparties may hedge through purchases of the underlying asset, a positive.
If The Music’s Playing, Get Up And Dance
With volatility at its lower bound, at which it can stay given its bimodality, it makes sense to look at markets through a more optimistic lens. A lot is working in its favor, and if near-term declines are marginal and not upsetting to the status quo, it may set the stage for a rally through elections.
Accordingly, how do we make positive returns in rising markets and minimize losses or gains in flat-to-down markets as we have now? That’s the goal, right?
For the anxious and must-trade types, short-dated (e.g., 50- or 100-point-wide and 0-1 DTE) butterflies in the NDX worked well on sideways days. Here, we’ve tried to double and triple our initial risk but can easily hit more in benign markets. For the passive types, calendars may do just as well should the realized volatility keep where it is or fall relative to what is implied.
In anticipation of this week’s controlled retracement, we initiated wide (e.g., up to 2,000-point-wide) broken-wing butterflies and ratio spreads on the put side in the NDX, reducing their cost basis, if any, with the credits from the short-dated fly trades, among others. Into weakness, those spreads now price a few thousand percent higher, and we’re monetizing them, intending to use the credit to finance trades that capture upside potentially or to reduce our stock cost basis.
“And I think this is one of the arguments for going with VIX calls, not that we’ve seen anything explosive yet this year, but if we do see some of these things unwind, you’re going to get a kicker there where you might see the VIX cruise very quickly up to 45, and it probably won’t stay there unless there’s a real good fundamental reason for that to happen,” explains Michael Purves, the CEO and founder of Tallbacken Capital Advisors. Josh Silva, managing partner and CIO at Passaic Partners, adds, that “when there is a liquidation, it’ll be hard, it’ll be fast and it’ll be dramatic.”
“Typically, the market after that is pretty awesome.”
Disclaimer
By reading our content, you agree to be bound by the terms and conditions outlined in this disclaimer. Consume our content only if you agree to the terms and conditions below.
Physik Invest is not registered with the US Securities and Exchange Commission or any other securities regulatory authority. Our content is for informational purposes only and should not be considered investment advice or a recommendation to buy or sell any security or other investment. The information provided is not tailored to your financial situation or investment objectives.
We do not guarantee any information’s accuracy, completeness, or timeliness. Please do not rely solely on our content to make investment decisions or undertake any investment strategy. Trading is risky, and investors can lose all or more than their initial investment. Hypothetical performance results have limitations and may not reflect actual trading results. Other factors related to the markets and specific trading programs can adversely affect actual trading results. We recommend seeking independent financial advice from a licensed professional before making investment decisions.
We don’t make any claims, representations, or warranties about the accuracy, completeness, timeliness, or reliability of any information we provide. We are not liable for any loss or damage caused by reliance on any information we provide. We are not liable for direct, indirect, incidental, consequential, or damages from the information provided. We do not have a professional relationship with you and are not your financial advisor. We do not provide personalized investment advice.
Our content is provided without warranties, is the property of our company, and is protected by copyright and other intellectual property laws. You may not be able to reproduce, distribute, or use any content provided through our services without our prior written consent. Please email renato@physikinvest for consent.
We reserve the right to modify these terms and conditions at any time. Following any such modification, your continued consumption of our content means you accept the modified terms. This disclaimer is governed by the laws of the jurisdiction in which our company is located.
Risk appetite in the last months was fueled by the emergence of a “goldilocks disinflation thesis,” describes Marko Kolanovic of JPMorgan Chase & Co. This thesis envisions a no-recession scenario where central banks cut rates early, especially in the lead-up to elections.
The market is banking on such anticipatory movement by the Federal Reserve, pricing five rate cuts and the target interest rate moving from 525-550 to 400-425 basis points by year-end. With the backdrop of easing liquidity conditions through 2025 and continuing economic growth, equity investors are positioning for a broader rally. This has led to churn and a loss of momentum.
Graphic: Retrieved from Carson Investment Research via Ryan Detrick.
Though historical trends encourage optimism, Kolanovic is concerned markets are overlooking geopolitical events, such as the Houthi shipping attacks, exercises near the Suwałki Gap, and Russia’s testing of electronic warfare. Despite these potential disruptors, atypically low volatility skew and implied correlation indicate a lack of market responsiveness and positioning for less movement.
Recall skew reflects a scenario where increased market volatility disproportionately impacts farther away strike options due to losses from more frequent delta rebalancing in a moving market, leading option sellers to assign higher implied volatility to those strikes to compensate for increased risk. The relationship between index volatility and its components involves both individual volatilities and correlation, with implied correlation as a valuable indicator for pricing dynamics between index options and their components and trading volatility dispersion.
Appearing on The Market Huddle, Kai Volatility’s Cem Karsan emphasized the impact of more structured product issuance and investor volatility selling on index levels, describing how it pins the index and lowers correlation. When a dealer, bank, or market maker on the other side owns options, they need to buy the market when it goes down and sell when it goes up, keeping the index tight and realized volatility low. Much less of this, or even the opposite, is happening in single stocks, so they aren’t experiencing the same level of suppression.
Graphic: Retrieved from The Ambrus Group’s Kris Sidial. Higher short Vega exposure, growing derivative income fund and equity short vol hedge fund AUM, a larger auto-callable market, and record-high dispersion trading flow suppress index vol, posing significant risks.
“As dealers buy and sell index exposure, market makers will attempt to keep the index level and the underlying basket in line via arbitrage constraints,” Newfound Research well explained in their Liquidity Cascades paper. “If dealer hedging has suppressed index-level volatility, but underlying components are still exhibiting idiosyncratic volatility, then the only reconciliation is a decline in correlation.”
SpotGamma’s Brent Kochuba weighs in, noting low correlation typically aligns with interim stock market highs, presenting a potential cause for caution. Examining data since January 2018, Kochuba points out that the SPX’s average close-to-close change is 88 basis points, with the open-to-close average at 70 basis points. This analysis suggests the current SPX implied volatility (IV) is relatively low. While low IV levels can persist, the concern arises as current readings hint at overbought conditions.
“These low IVs can last for some time, but the general point here is that current readings are starting to suggest overbought conditions as index vols are priced for risk-less perfection, and single stock vols expand due to upside call chasing.”
Graphic: Retrieved from SpotGamma. Short-dated S&P 500 implied volatility is compressed. Updated Sunday, January 28, 2024.
Nomura Cross-Asset Macro Strategist Charlie McElligott explains selling volatility, which continues to attract money as it’s been profitable, is a stabilizing trade in most cases. Kris Sidial, Co-Chief Investment Officer at The Ambrus Group, warns it may end spectacularly in his most recent appearances. The situation in China is a cautionary example, where stock volatility triggered a destructive selling cycle as market participants grappled with structured product risk management.
Accordingly, for those who perceive a meaningful chance of movement, there is value in owning options, Goldman Sachs Group says, noting they expect more movement than is priced.
Graphic: Retrieved from Goldman Sachs Group via VolSignals.
Karsan, drawing parallels to the unwind of short volatility and dispersion trade from February to March of 2020, says the still-crowded trade can be compared to two sumo wrestlers or colossal plates on the Earth’s core exerting immense pressure against each other. While the trade may appear balanced and continue far longer, the accumulated pressures pose significant risks.
Graphic: Retrieved from JPMorgan Chase & Co via @jaredhstocks.
Major crashes happen when entities must trade volatility and options. Often, the trigger is the inability to cover the margin and meet regulatory requirements, causing a cascading effect.
Karsan, drawing on 25 years of experience, notes a precursor to a crash is a weakening supply of margin puts, particularly the highly convex and far out-of-the-money ones. These options play a significant role during stressful market periods, acting as indicators and drivers of impending crashes. The focus is on their convexity rather than whether they will be in the money, as the margin requirements become a determining factor in their impact on market dynamics. History shows a minor catalyst can lead to a dramatic unwind, turning one week to expiry $0.05 to $0.15 S&P 500 put options into $10.00 overnight.
“Prior to the XIV crash day, … going into the close the last hour, we saw nickel, ten, and five-cent options trade up to about $0.50 and $0.70. They really started to pop in the last hour. And then, the next day, we opened up and they were worth $10.00. You don’t see them go from a nickel to $0.50 very often. If you do, don’t sell them. Buy them, which is the next trade.”
Setting aside the pessimistic narrative, the current scenario favors continued ownership of risk assets. Cautious optimism surrounds this week’s Quarterly Refunding Announcement (QRA), “depending on how much bill issuance is scaled back and on the absolute funding needs,” CrossBorder Capital explained, coupled with Fed-speak and anticipation of cutting interest rates on falling inflation later this year. Still, according to Unlimited Funds ‘ Bob Elliott, predicting outcomes following this week’s releases lacks an advantage; instead, in this environment of churn, momentum loss, and indicators like low correlation and volatility, last week’s trades for managing potential downside stick out, particularly vis-à-vis volatility skew.
Graphic: Retrieved from SpotGamma. Updated Sunday, January 28, 2024.
Bloomberg reports that if the US defaults on its debt, which could happen as soon as June 1 if President Biden and House Speaker McCarthy fail to reach a deal on raising the ceiling, homebuyer borrowing costs may surge to 8.40%. As a consequence, the typical home’s monthly payment would increase by 22.00% and cool property sales; the monthly payment on a $500,000.00 mortgage may rise to $3,800.00, compared to about $3,095.00 at the current rate of 6.30%.
In prior letters, we concluded that past monetary action made stocks less sensitive to interest rates, quoting JPMorgan Chase & Co (NYSE: JPM) strategists that the market would likely continue to “artificially suppress perceptions of fundamental macro risks,” barring surprises like a debt limit breach.
With a debt limit breach a potential reality, Moody’s Corporation (NYSE: MCO) says a breach may compound recessionary pressures; expect a drop in equities, a volatility spike, and a disruption of funding markets.
Graphic: Retrieved from Nasdaq Inc (NASDAQ: NDAQ).
“Data show that short-term bonds have the most predictable reaction – with interest rates and default insurance costs rising significantly – before quickly returning to normal after the uncertainty has passed,” Nasdaq’s Phil Mackintosh writes. “In reality, a crisis was averted in all [prior] cases, with the government able to increase or suspend the debt limit before the X Date.”
Notwithstanding the short-term uncertainty regarding the debt limit, Bank of America Corporation (NYSE: BAC) is adamant there will be a recession that manifests cracks in “credit and tech,” similar to the situation in 2008. BAC sees the bubble in technology, media, and telecommunication stocks soon deflating as they face higher-for-longer interest rates and a tempered earnings outlook.
Graphic: Retrieved from Societe Generale SA (OTC: SCGLY) via The Market Ear.While investors poured $3.8 billion into technology stocks in the week through May 10, $2.1 billion was pulled from financial equities, the most significant redemption since May 2022.
Compounding the recessionary pressures BAC sees, EPB Research adds, are banks’ funding costs, which have increased too much relative to prevailing asset yields. If the spread drops too low, bank lending tightens, and a recession occurs. Also, other data suggests tightening is finally starting to have an impact. Bloomberg reports that initial claims for unemployment insurance are on the rise. There has been a drop in overall wage growth to 5.1% last month, too, the biggest fall in the rate of increase since the series began.
Separately, breadth divergences are becoming more frequent, with the Daily Advance-Decline (A-D) Line for the NYSE showing lower highs while DJIA and S&P 500 show slightly higher highs, McClellan Financial Publications writes. The bond CEF A-D Line is also showing a bearish divergence, indicating a shift in liquidity that could weigh on other stocks, including the big-cap stocks holding up the SP500 and the Nasdaq 100.
Graphic: Retrieved from McClellan Financial Publications.
McClellan adds that the A-D Line originated from data collected by Leonard Ayres and James Hughes in the 1920s. It was made famous in 1962.
Graphic: Retrieved from McClellan Financial Publications.
That’s when Joe Granville and Richard Russell commented on it in their newsletters, noting how it had shown a big bearish divergence ahead of the 1962 bear market.
Graphic: Retrieved from McClellan Financial Publications.
To end, the economic calendar next week is focused on manufacturing and housing. The housing market is showing some downside risk for existing-home sales for April due to a weak reading on pending sales, MCO says, adding that housing permits and starts are expected to move sideways as builders remain cautious amid high-interest rates and economic uncertainty. Regional Fed surveys in New York and Philadelphia will provide the first read on factory activity for May, with little hope for a significant rebound in manufacturing. Jobless claims will be critical, as continuing the recent trend would likely signal a rapid deceleration in monthly job gains. Other critical data to be released include retail sales, industrial production, and business inventories.
Should readers wish to hedge the debt ceiling debacle, June call options on the Cboe Volatility Index appear attractive, some suggest. But, with RVOL as low as it is, owning optionality is not generally warranted. The risk is lower lows in volatility.
Welcome to the Daily Brief by Physik Invest, a soon-to-launch research, consulting, trading, and asset management solutions provider. Learn about our origin story here, and consider subscribing for daily updates on the critical contexts that could lend to future market movement.
Separately, please don’t use this free letter as advice; all content is for informational purposes, and derivatives carry a substantial risk of loss. At this time, Capelj and Physik Invest, non-professional advisors, will never solicit others for capital or collect fees and disbursements. Separately, you may view this letter’s content calendar at this link.
Sentiment calmer on the heels of some weaker-than-expected data from China. Generally speaking, markets are holding well, led by technology and innovation.
Graphic: Retrieved from Goldman Sachs Group Inc (NYSE: GS) via The Market Ear.
Price doesn’t tell the whole story, however. Breadth is softening while market boosters are slowly being picked off. Tier1Alpha says that “1-month realized volatility rose nearly 13%, [and] … if volatility continues to rise, it will have an outsized effect on the 1-month vol, as the sample is now largely filled by the smaller returns we experienced in April.” Altogether, this “could result in larger [selling] flows being triggered from systematic strategies that use volatility scaling as a means for risk control.”
Graphic: Retrieved from Bespoke Investment Group via The Market Ear.
“With that vol premium getting squeezed out, there is little room for error,” SpotGamma adds; uncertainties that may manifest pressure and compound weaknesses under the hood include inflation reports and the debt ceiling issue.
“The next big moment comes Tuesday, when President Joe Biden is scheduled to meet House Speaker Kevin McCarthy and other congressional leaders,” Bloomberg explains. “The meeting is high stakes. Republican leaders want promises of future spending cuts before they approve a higher ceiling, while Biden is insisting on a ‘clean’ increase.”
Further, traders expect increased chances of rate cuts. This may not be outlandish; “Looking at the past 17 hiking episodes, the two-year, 10-year Treasury yield curve bottoms out 108 trading days before the first rate cut.”
“Using that guide, the 2s10s curve reached negative 111 basis points on March 8 and has since steepened to about negative 41 basis points. Assuming that marked the trough, 108 trading days lands in mid-August — sandwiched between the Fed’s July 26 and September 20 rate decisions.”
Graphic: Retrieved from Bloomberg. “Look at the gap between the three-month and the 10-year yields, generally regarded as a surefire recession indicator. It’s also a great indicator of imminent rate cuts. An inversion is also a timing signal because it makes little or no sense unless you’re confident that rate cuts will be starting soon. And over the last 30 years, the curve has never been as inverted as it is now.”
For better hedging participation in market upside, check out Physik Invest’s recently published trade structuring report.
Graphic: Retrieved from BNP Paribas (OTC: BNPQY) via Bloomberg. JPMorgan Chase & Co (NYSE: JPM) strategists say that “the first quarter will likely be the high point for stocks this year, … adding that equities won’t reach lows until the Fed has pivoted to rate cuts.”
About
Welcome to the Daily Brief by Physik Invest, a soon-to-launch research, consulting, trading, and asset management solutions provider. Learn about our origin story here, and consider subscribing for daily updates on the critical contexts that could lend to future market movement.
Separately, please don’t use this free letter as advice; all content is for informational purposes, and derivatives carry a substantial risk of loss. At this time, Capelj and Physik Invest, non-professional advisors, will never solicit others for capital or collect fees and disbursements. Separately, you may view this letter’s content calendar at this link.
The S&P 500 (INDEX: SPX) recovered after a violent sell-off led by products like the SPDR S&P Regional Banking ETF (NYSE: KRE). This is before updates on the Federal Reserve’s (Fed) monetary policy today.
Graphic: Retrieved from Danny Kirsch of Piper Sandler Companies (NYSE: PIPR).
The consensus is the Fed ratchets up the target rate to 5.00-5.25%. Following this, it is likely to keep rates at this higher level for longer than markets expect, letting the effects of the tightening work through the economy and tame the still-sticky inflation (e.g., lenders eating the cost of interest to sell more goods, job vacancies dropping, and payrolls surprising higher).
Graphic: Retrieved from Citigroup Inc (NYSE: C) via Bloomberg. “The Fed’s own projections from March suggest rates will be only just above 5% by year’s end — implying a protracted pause with no cuts, after the most aggressive hiking campaign in decades. It’s marked in red in the chart [above].”
Strategists at JPMorgan Chase & Co (NYSE: JPM) think a “hike and pause” scenario prompts a push higher in stocks.
“Here, the Fed would be relying on a tightening of lending standards stemming from the banking crisis to act as de facto rate hikes. Any language that the market interprets as the Fed being on pause should benefit stocks,” JPM wrote. “This outcome is not fully priced into equities.”
This idea was alluded to in yesterday’s letter; stocks likely do “ok” in a higher rates for longer environment. Beyond economic surprises and the debt ceiling issue, the Fed’s balance sheet (not likely to be addressed in this next announcement) strategists like Andy Constan of Damped Spring Advisors are most concerned about, since the size of quantitative easing or QE made stocks less sensitive to interest rates. Ratcheting quantitative tightening or QT, the flow of capital out of markets, would prompt some increased bearishness among those strategists.
Graphic: Retrieved from Bank of America Corporation (NYSE: BAC) via Macro Ops.
JPM strategists add the market may continue “artificially suppress[ing] perceptions of fundamental macro risks,” prompting upside momentum.
“We expect these inflows to persist over the next two weeks, with several more large returns expected to drop from the trailing sample window,” Tier1Alpha explains. “Even if market volatility increases during this time, it would take exceptionally significant moves to trigger substantial selling. While these inflows are advantageous during market upswings, it’s essential to remember that they can be particularly brutal on the way back down once volatility inevitably returns.”
Eventually, “as recessionary conditions proliferate,” EPB’s Eric Basmajian says, asset prices will turn. Downside accelerants include the debt limit breach, which Nasdaq Inc (NASDAQ: NDAQ) and Moody’s Corporation (NYCE: MCO) think portends recession and volatility spike.
Trade ideas and more in our recently published report.
Welcome to the Daily Brief by Physik Invest, a soon-to-launch research, consulting, trading, and asset management solutions provider. Learn about our origin story here, and consider subscribing for daily updates on the critical contexts that could lend to future market movement.
Separately, please don’t use this free letter as advice; all content is for informational purposes, and derivatives carry a substantial risk of loss. At this time, Capelj and Physik Invest, non-professional advisors, will never solicit others for capital or collect fees and disbursements. Separately, you may view this letter’s content calendar at this link.
First Republic Bank (NYSE: FRC) is in the news for its failure. FRC was known for handing out mortgages at rock-bottom rates. When interest rates rose, the bank’s book of mortgages was hurt and left it with not enough to suffice withdrawals.
“FRC believed its business model of extraordinary customer service and product pricing would result in superior customer loyalty through all cycles,” wrote Timothy Coffey of Janney Montgomery Scott. “Instead, too many FRC customers showed their true loyalties were to their own fears.”
This “marks the second-biggest bank failure in U.S. history, behind the 2008 collapse of Washington Mutual Inc.,” reports WSJ; after the instability in March, the bank finally succumbed to the Federal Reserve’s (Fed) rate increases and depositor worry.
JPMorgan Chase & Co (NYSE: JPM) acquired the bulk of FRC’s operations.
Graphic: Retrieved from JPM. See a nice summary by @brandonjcarl.
Further, research shows money is getting tighter, a headwind for the economy, while inflation is sticky and the Fed’s bond holdings are preventing tightening from being effective; WSJ reports the Fed’s balance sheet loaded with bonds may be insulating stocks from interest rate policies.
“Quantitative easing locked the Fed into a position that is difficult to unwind,” said Stephen Miran of Amberwave Partners. Quantitative easing, or QE, made stocks less sensitive to interest rates. “It’s made tightening both slower and less effective than it should have been.”
Graphic: Retrieved from Bloomberg. The Fed’s favorite measure of inflation, the core PCE index, has been consistently stuck around 4-5% since 2022. The employment cost index, which shows wage growth at around 4-5%, is inconsistent with a 2% inflation target.
Not “adjusting balance-sheet policy,” but raising rates to 5.00-5.25% as expected, ‘is akin to “hitting the same nail with a hammer over and over again.’” Therefore, stocks, which are higher alongside surprising economic and earnings data, though risky, can do “ok” for longer, comments Andy Constan of Damped Spring Advisors.
Graphic: Retrieved from CME Group Inc’s (NASDAQ: CME) FedWatch Tool.
The sale of volatility bolsters the stability and emboldens upside bettors, adds JPM’s Marko Kolanovic, who finds “selling of options forces intraday reversion, leaving the market price virtually unchanged many days.”
Graphic: Retrieved from Goldman Sachs Group Inc (NYSE: GS).
“This, in turn, drives buying of stocks by funds that mechanically increase exposure when volatility declines (e.g., volatility targeting and risk parity funds),” he elaborates. “This market dynamic artificially suppresses perceptions of fundamental macro risks. The low hurdle rate and robust fundamentals bode well for 1Q earnings results, but we advise using any market strength on reporting to reduce exposure.”
At this juncture, yes, stocks can move sideways or higher for a bit longer as a function of “momentum, not value,” Simplify Asset Management’s Michael Green concludes. Traders can position for this and various levels of potential upset later with structures included in a report we published last week.
About
Welcome to the Daily Brief by Physik Invest, a soon-to-launch research, consulting, trading, and asset management solutions provider. Learn about our origin story here, and consider subscribing for daily updates on the critical contexts that could lend to future market movement.
Separately, please don’t use this free letter as advice; all content is for informational purposes, and derivatives carry a substantial risk of loss. At this time, Capelj and Physik Invest, non-professional advisors, will never solicit others for capital or collect fees and disbursements. Separately, you may view this letter’s content calendar at this link.
Big news includes Netflix Inc (NASDAQ: NFLX) beating earnings estimates but having a weaker-than-expected forecast, Tesla Inc (NASDAQ: TSLA) cutting prices the sixth time this year, Meta Platforms Inc (NASDAQ: META) and Walt Disney Co (NYSE: DIS) commencing layoffs, and mortgage rates edging higher to ~6.4%.
Graphic: Retrieved from Bloomberg. “US mortgage rates increased last week by the most in two months to 6.43%, denting already sluggish demand.”
Equity markets are down, and equity implied volatility (IVOL) measures, including the Cboe Volatility Index or VIX, are climbing. Notwithstanding, the trend lower in IVOL is intact, and that’s good for traders biased short volatility.
Graphic: Retrieved from Bloomberg via Danny Kirsch of Piper Sandler Companies (NYSE: PIPR). Call option volatility for the $4,150.00 strike. May monthly expiration.
“With all the focus [on S&P 500 (INDEX: SPX)] 0 DTE lately, I look at how expensive these have been since 2022,” IPS Strategic Capital’s Pat Hennessy says, referencing a backtest he conducted selling a 1 DTE straddle and holding till maturity.
“Performance since the November CPI has been stellar, with a 63% win rate and an average gain of $20.00.”
Graphic: Retrieved from IPS Strategic Capital’s Pat Hennessy.
Volatility trader Darrin John agrees, noting volatility remains expensive, a detriment to those who may be biased long volatility.
“The VRP is so wide across all of the tenors I track,” John elaborates. “It’s going to be hard for gamma buyers to cover daily theta bills.”
Clouds are appearing on the horizon, however, and the trend higher (lower) in stocks (volatility) may not last. Bloomberg forecasts the largest fall in SPX earnings since the start of 2020. Notwithstanding, strength can continue for longer …
Graphic: Retrieved from Citigroup Inc Research (NYSE: C) via @tr8derz. “YTD rally stems from $1tn in CB liquidity. High-frequency indicators suggest this is already stalling, and coming weeks seem increasingly likely to bring a sharp reversal. Higher TGA and RRP, ECB QT and reduced China easing could easily see a net drain of some $6-800bn.”
… even with the SPX breadth reading poor. The SPX has rallied with multiples rising; strength came with positive earnings surprises, bond demand, and other things.
Graphic: Retrieved from Morgan Stanley (NYSE: MS) via Bloomberg.
Hence, at the risk of sounding like a broken record, the low-cost call structures we’ve talked about in the past remain attractive.
If markets move higher, you can monetize and roll profits into put spreads (i.e., buy put and sell another at a lower strike). This may work well if JPMorgan Chase & Co’s (NYSE: JPM) call that “even a mild recession would warrant retesting the previous lows” is realized.
Such structures work well as “a big pop in the market can result in a decent drop in the VIX…and vice versa, a market sell-off will result in a greater increase in the VIX now than it did in 2022,” says Alpha Exchange.
Alternatively, lean neutral and buy into cash or bonds yielding 4-5%. Some long box spreads yield 5.4% as of yesterday’s close.
In other news, Physik Invest’s first in-depth note is nearing completion and will be available for public viewing in short order. Take care and watch your risk!
About
Welcome to the Daily Brief by Physik Invest, a soon-to-launch research, consulting, trading, and asset management solutions provider. Learn about our origin story here, and consider subscribing for daily updates on the critical contexts that could lend to future market movement.
Separately, please don’t use this free letter as advice; all content is for informational purposes, and derivatives carry a substantial risk of loss. At this time, Capelj and Physik Invest, non-professional advisors, will never solicit others for capital or collect fees and disbursements. Separately, you may view this letter’s content calendar at this link.