Physik Invest’s Daily Brief is read free by thousands of subscribers. Join this community to learn about the fundamental and technical drivers of markets.
Fundamental
Note: The write-up on the conversation with Simplify’s Mike Green and your letter writer coming soon. Your letter writer is juggling Physik Invest, Benzinga, and two weeks of jury duty! Oh, my.
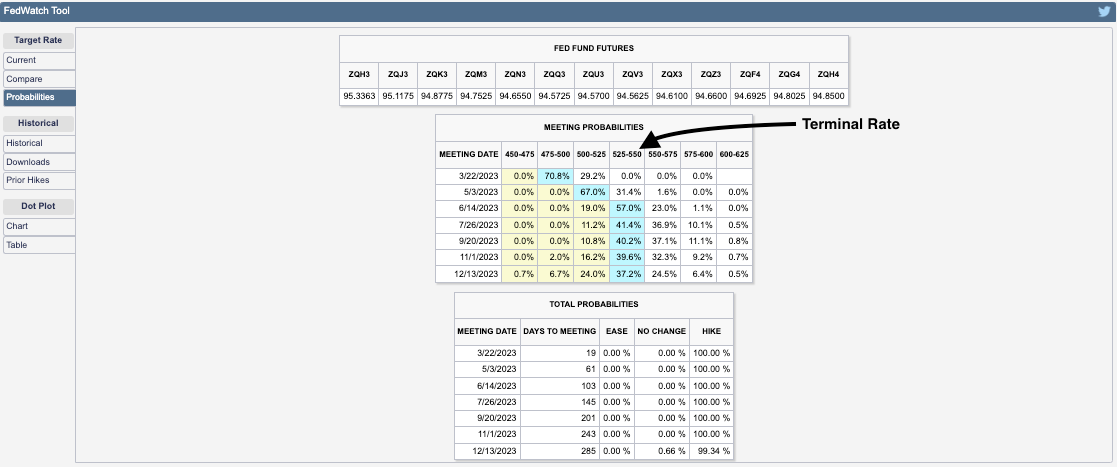
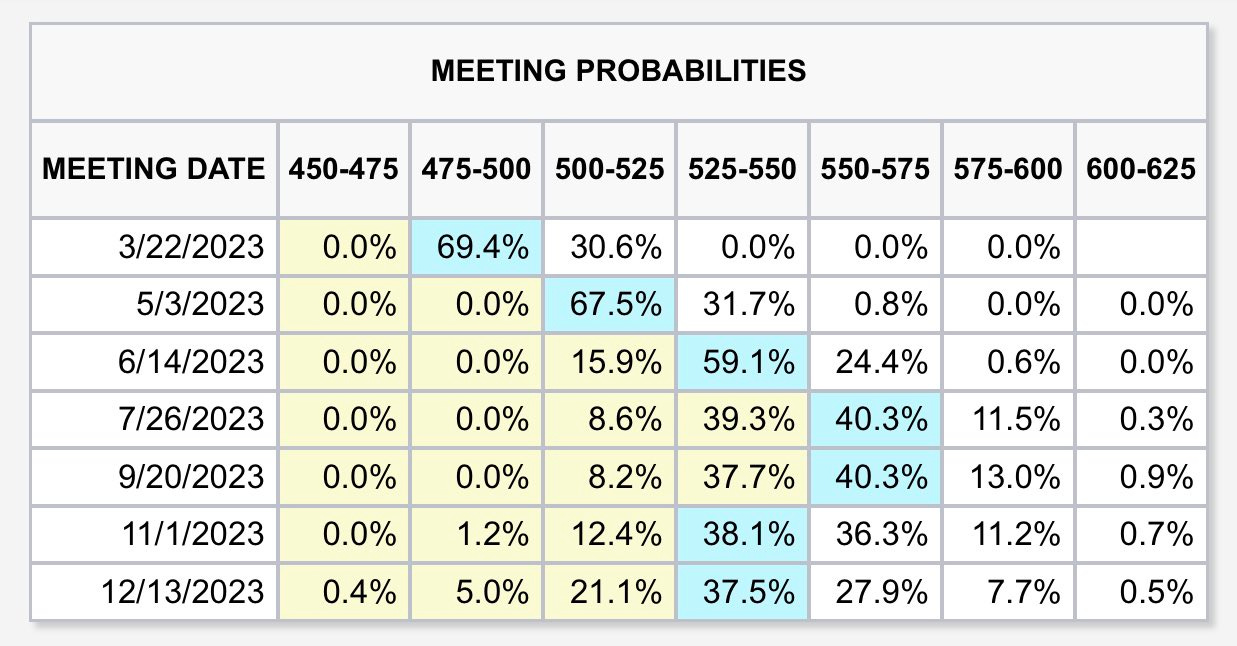
Following Federal Reserve (Fed) Chair Jerome Powell’s testimony yesterday, traders shifted their outlook on the path of interest rates. The terminal rate now sits between 5.50% and 5.75%, and there are no cuts priced in 2023. Traders are also anticipating a 0.50% hike at the March meeting, up from 0.25%.

The likes of Ken Griffin, who is the founder of Citadel and Citadel Securities, said the Fed’s updates have confused investors. He advised Powell to talk less about inflation.
“Every time they take the foot off the brake, or the market perceives they’re taking their foot off the brake, and the job’s not done, they make their work even harder,” he explained. TS Lombard’s Steven Blitz added the downshifts in hikes were a mistake and the testimony was a “tacit admission.”
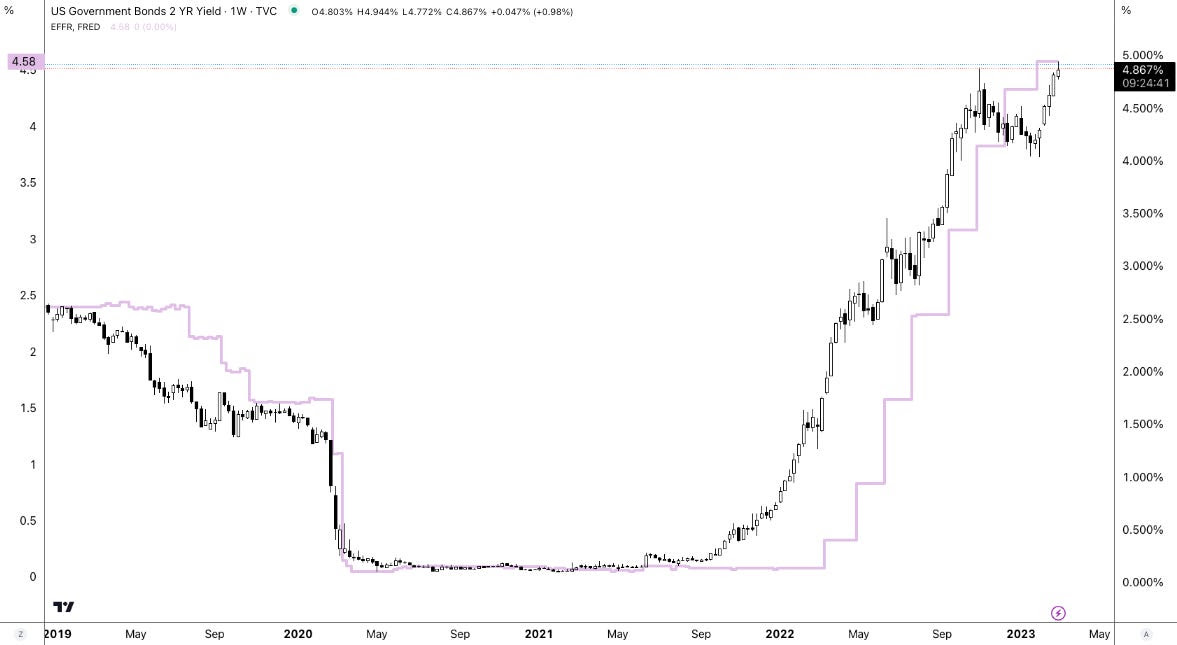
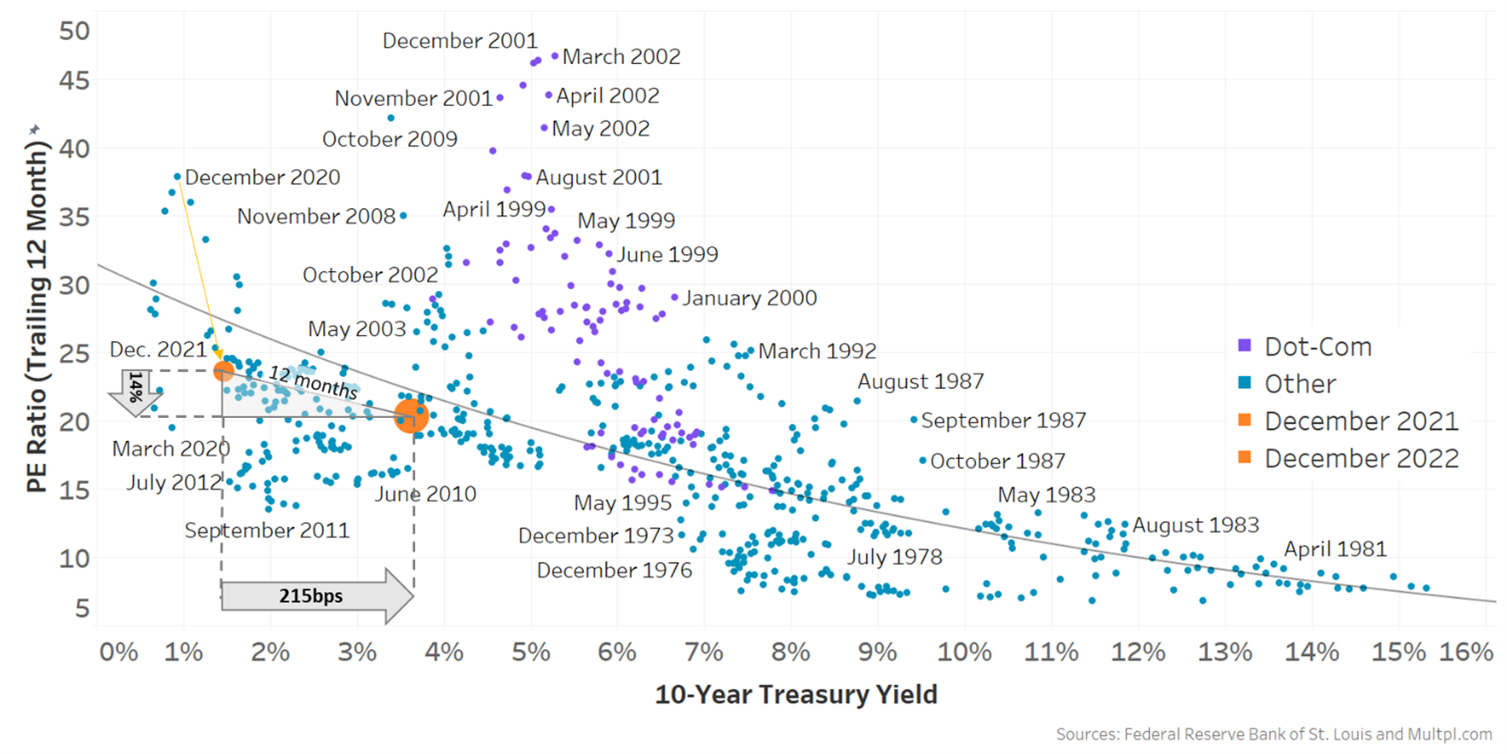
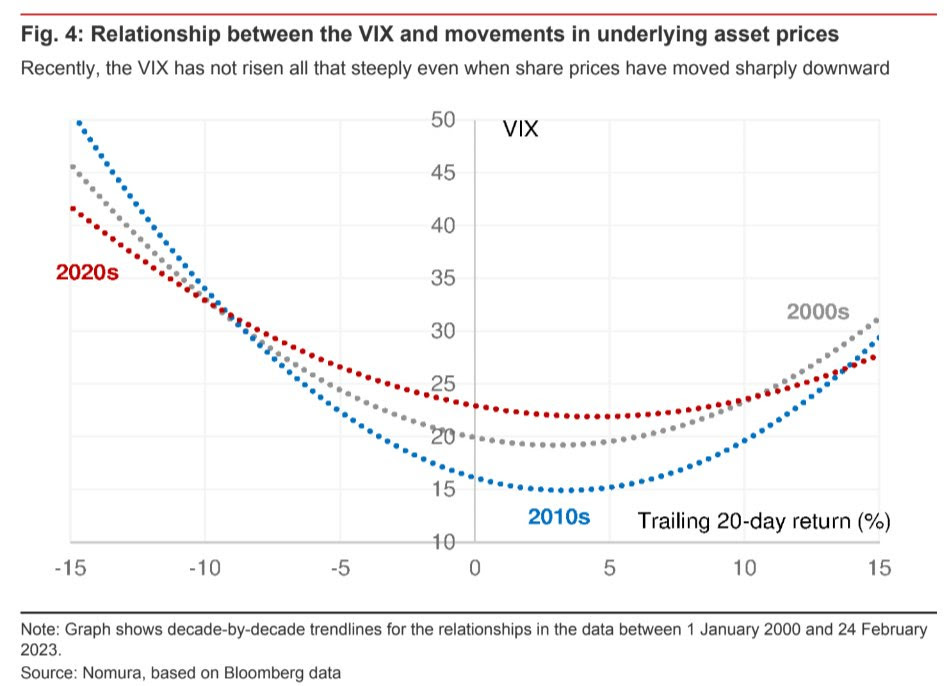
Anyways, the 2- and 10-year Treasury yield spread is at levels when the Fed’s Volcker tightened up the economy to tackle double-digit inflation. Bespoke Investment notes that after that particular spread inverted in October of 1979, the economy peaked at the end of January 1980 but the stock market remained strong.
“The next year, the S&P 500 rallied 22.9%, the Nasdaq was up 36.0%, and the Russell 2000 was up over 40.0%.”

However, Bespoke adds that “back then, the S&P 500 was trading for just 7.3 times trailing earnings. Today, the S&P 500 trades at a multiple that’s two-and-a-half times that level.” Per last week’s letters, investors’ salvation may be found in less traditional portfolio constructions. That’s what Simplify Asset Management portfolio manager and strategist Mike Green said to your letter writer last week in an interview as well.
Given the unreliability of data, Green explains, and the positioning, investors can get through a lot of the uncertainty by buying a one-year bond and stepping out.
“A real decrease in the purchasing power of the dollar means stock prices should go up because they are something you’re purchasing like everything else. The problem is that would, then, require significant multiple compression as you move forward. So, corporations would be making more money, but that money would be valued less richly because of the inflation.” Conversely, we see multiple expansions, Green said in casting doubt on recent market strength. “Earnings are actually going down.”
With the S&P 500 trading upwards of 20% above the last decade’s average forward price-to-earnings, traditional rules imply the P/E likely falls, and that is supportive of Green’s doubt and support of alternative portfolio constructions layering bond and volatility (i.e., options) exposure to target a full return of principal at the least.
“Using options allows you to introduce a degree of convexity in portfolios where [you] can take risks with a limited downside because [you’ve] either protected [your] downside or simply expended a degree of premium on it.”
With deterioration in some markets “offset by a lack of inventory” and/or hesitancy to sell, the marginal impact of “one person being in distress” may eventually “set a new clearing price … chang[ing] valuations for everybody.” That’s a good place to be as the owner of options protection.
Technical
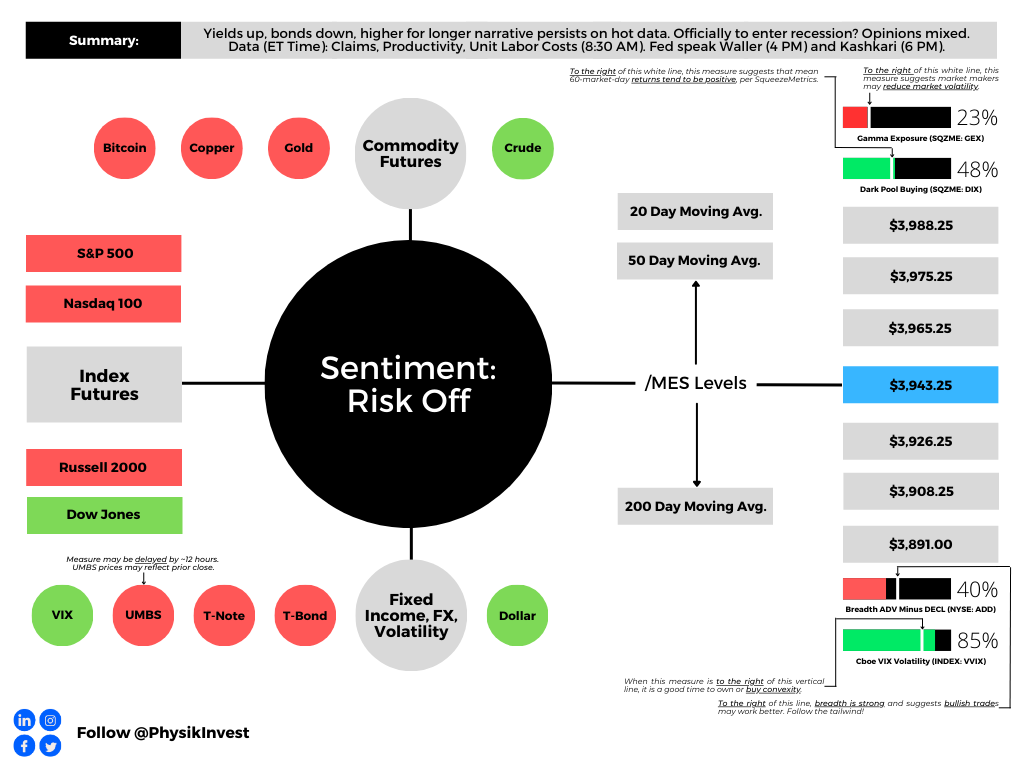
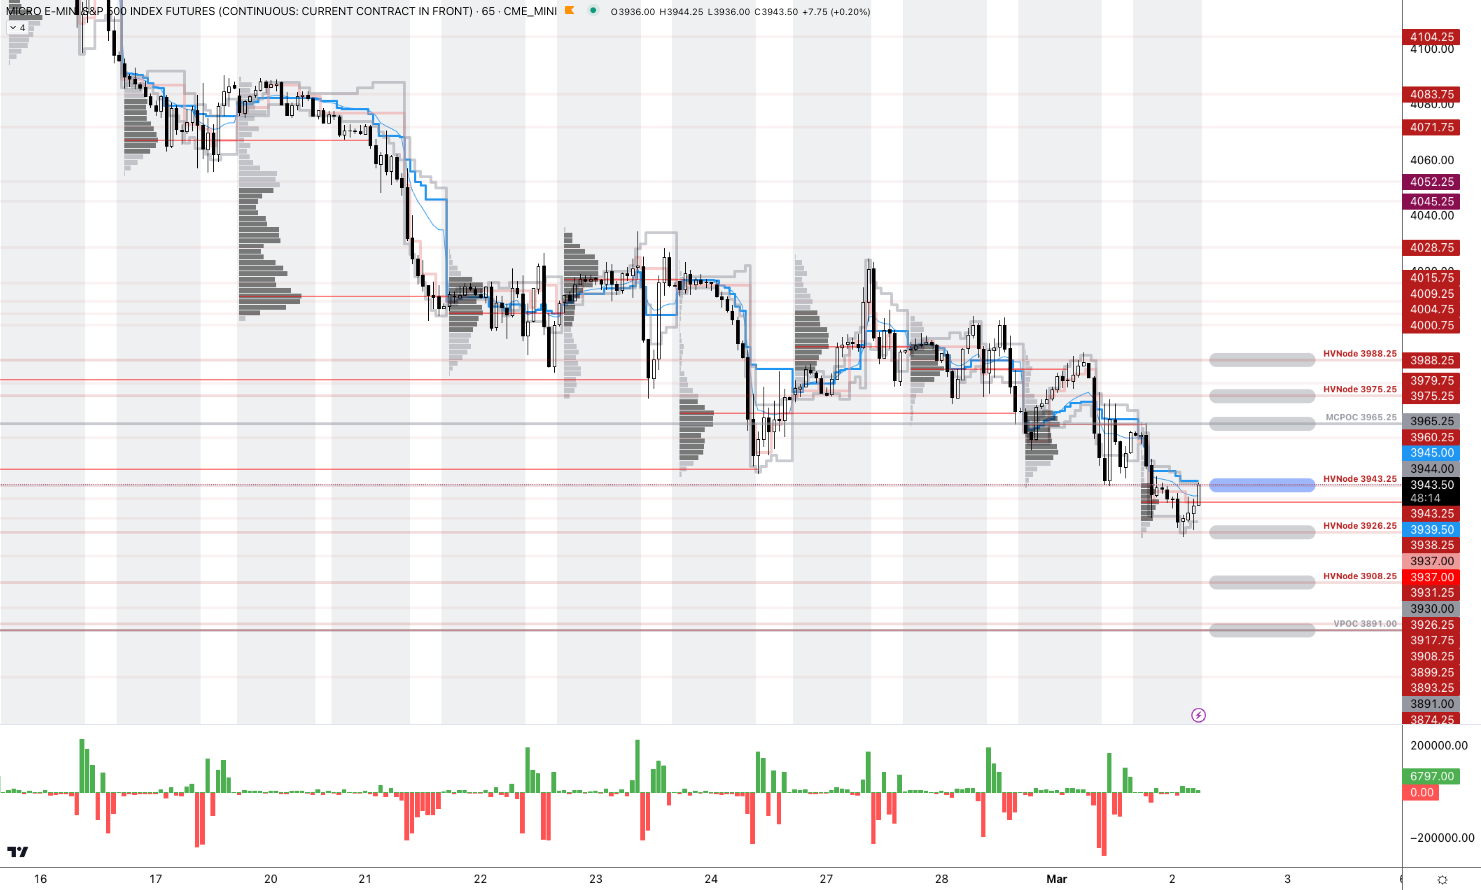
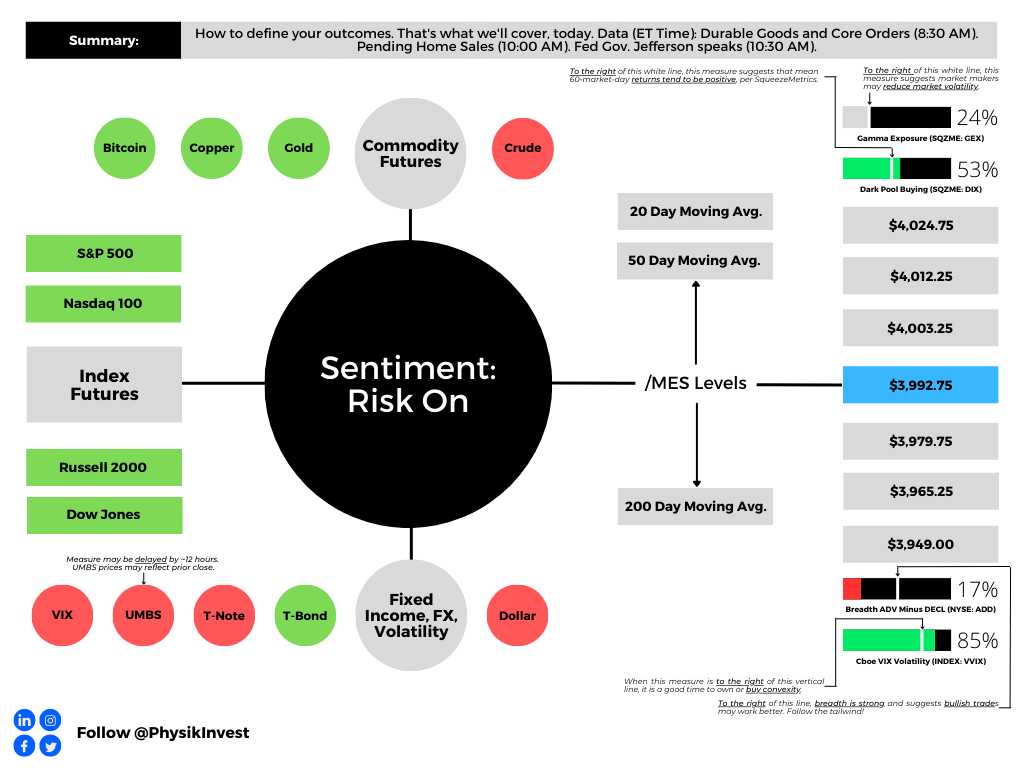
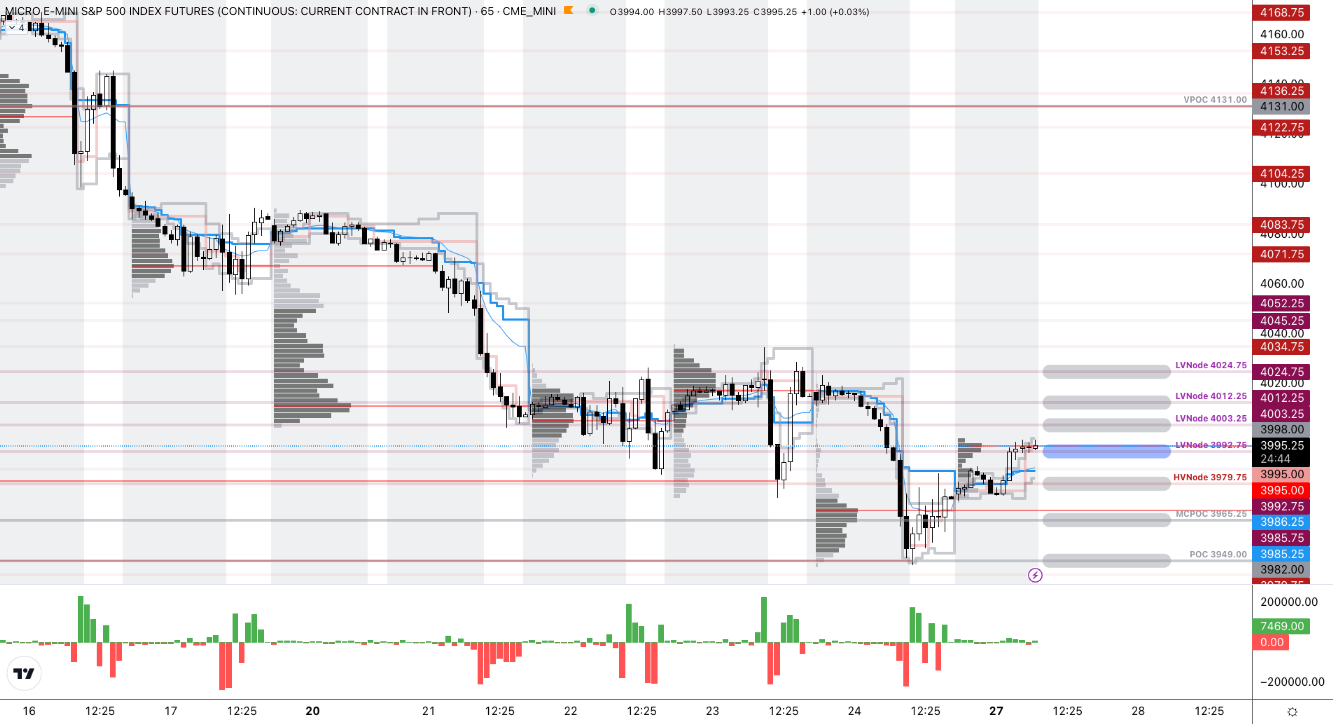
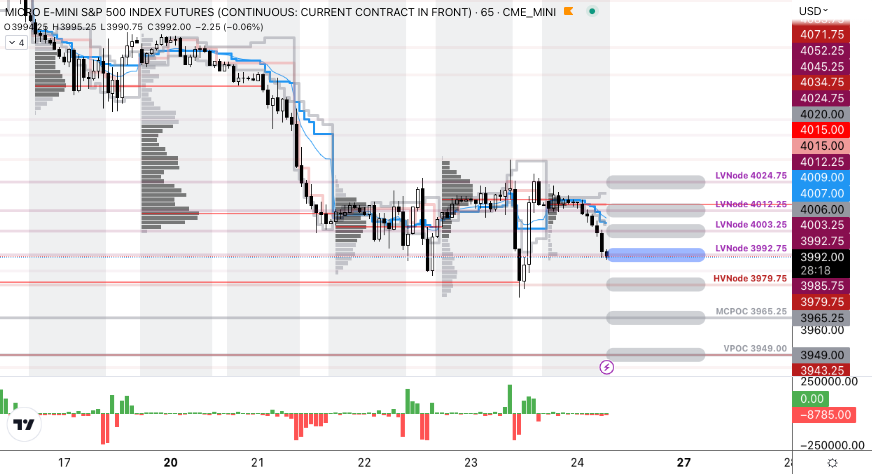
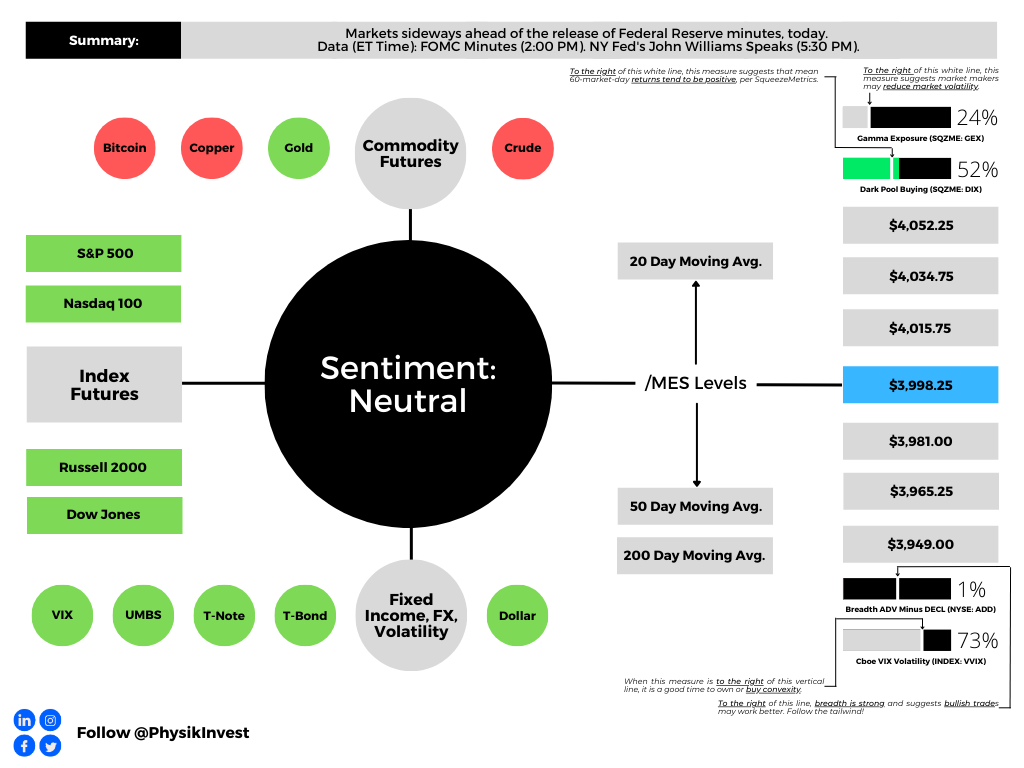
As of 7:50 AM ET, Wednesday’s regular session (9:30 AM – 4:00 PM ET), in the S&P 500, is likely to open in the lower part of a balanced overnight inventory, outside of the prior day’s range, suggesting a potential for immediate directional opportunity.
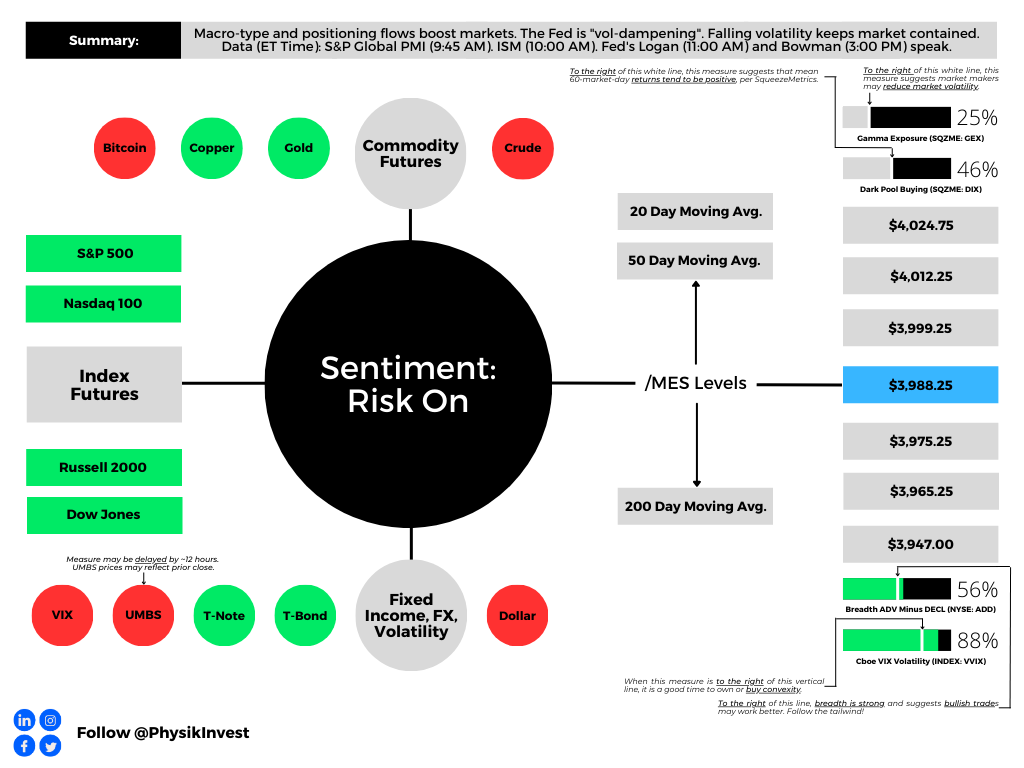
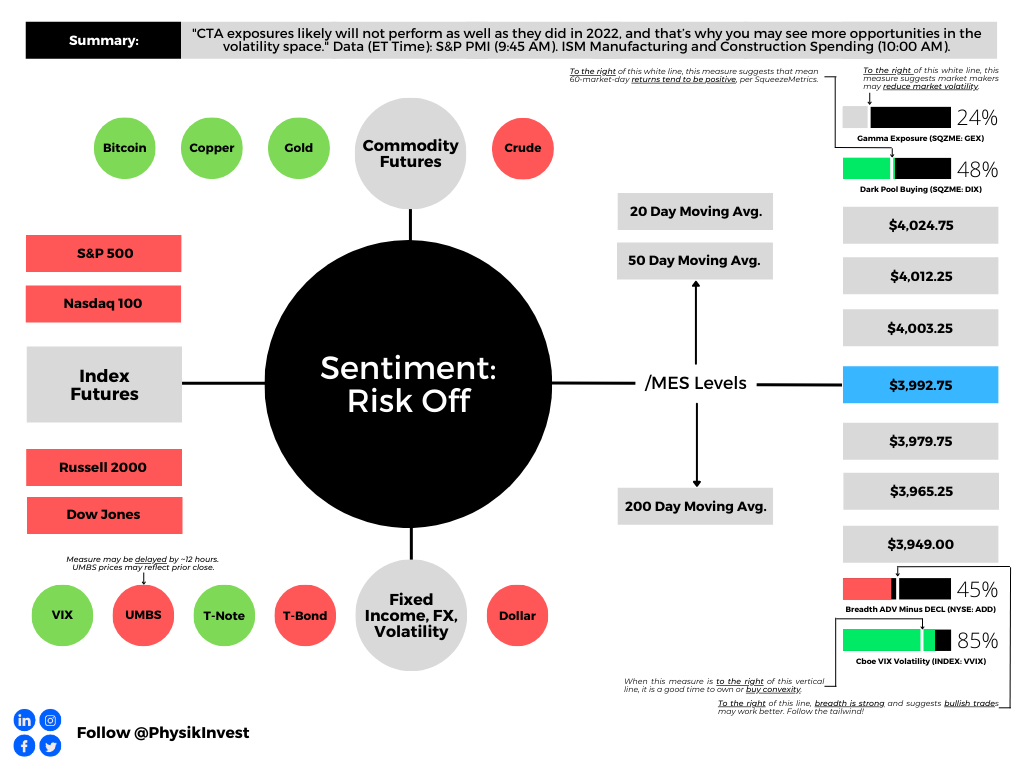
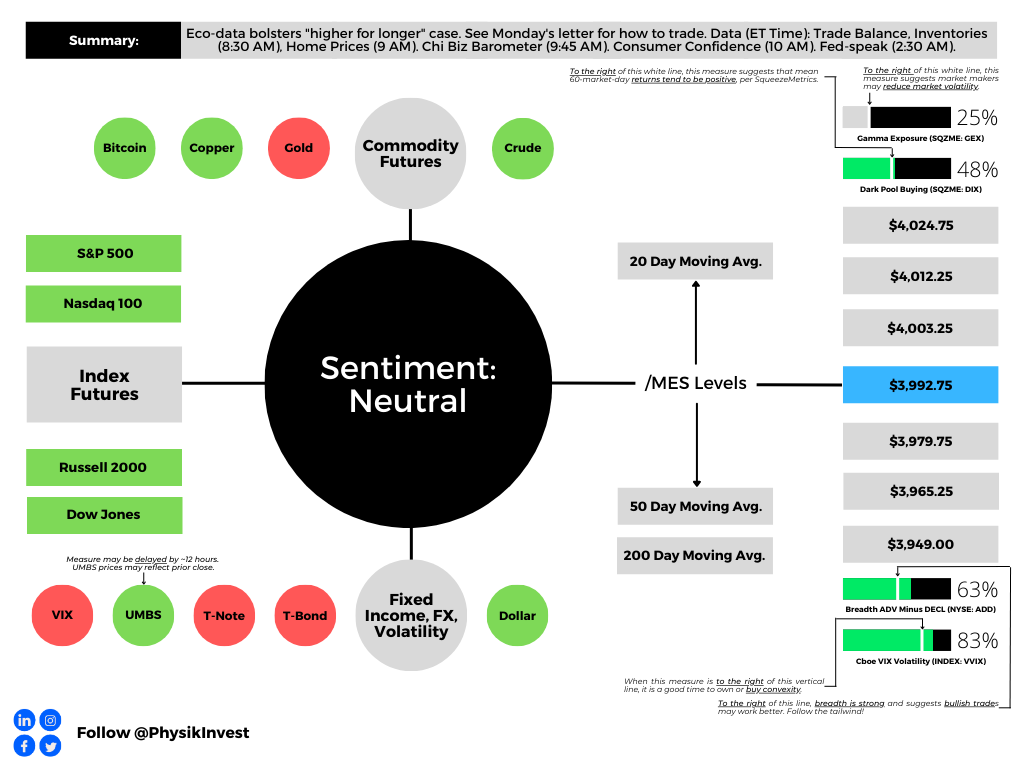
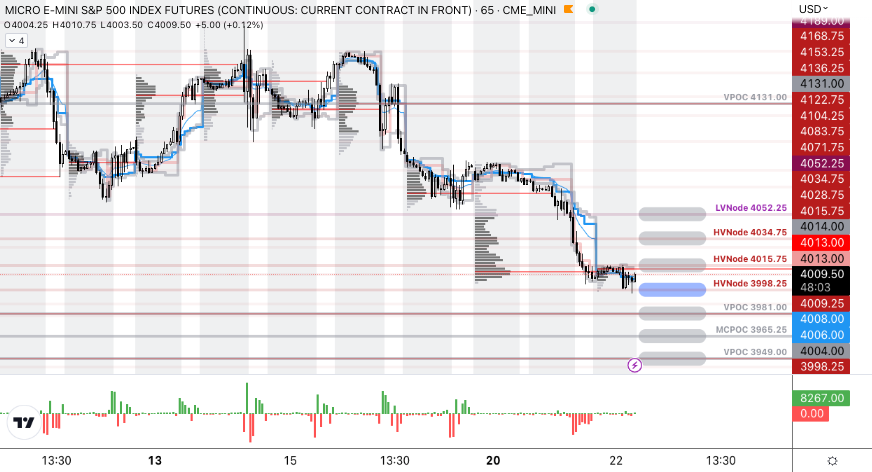
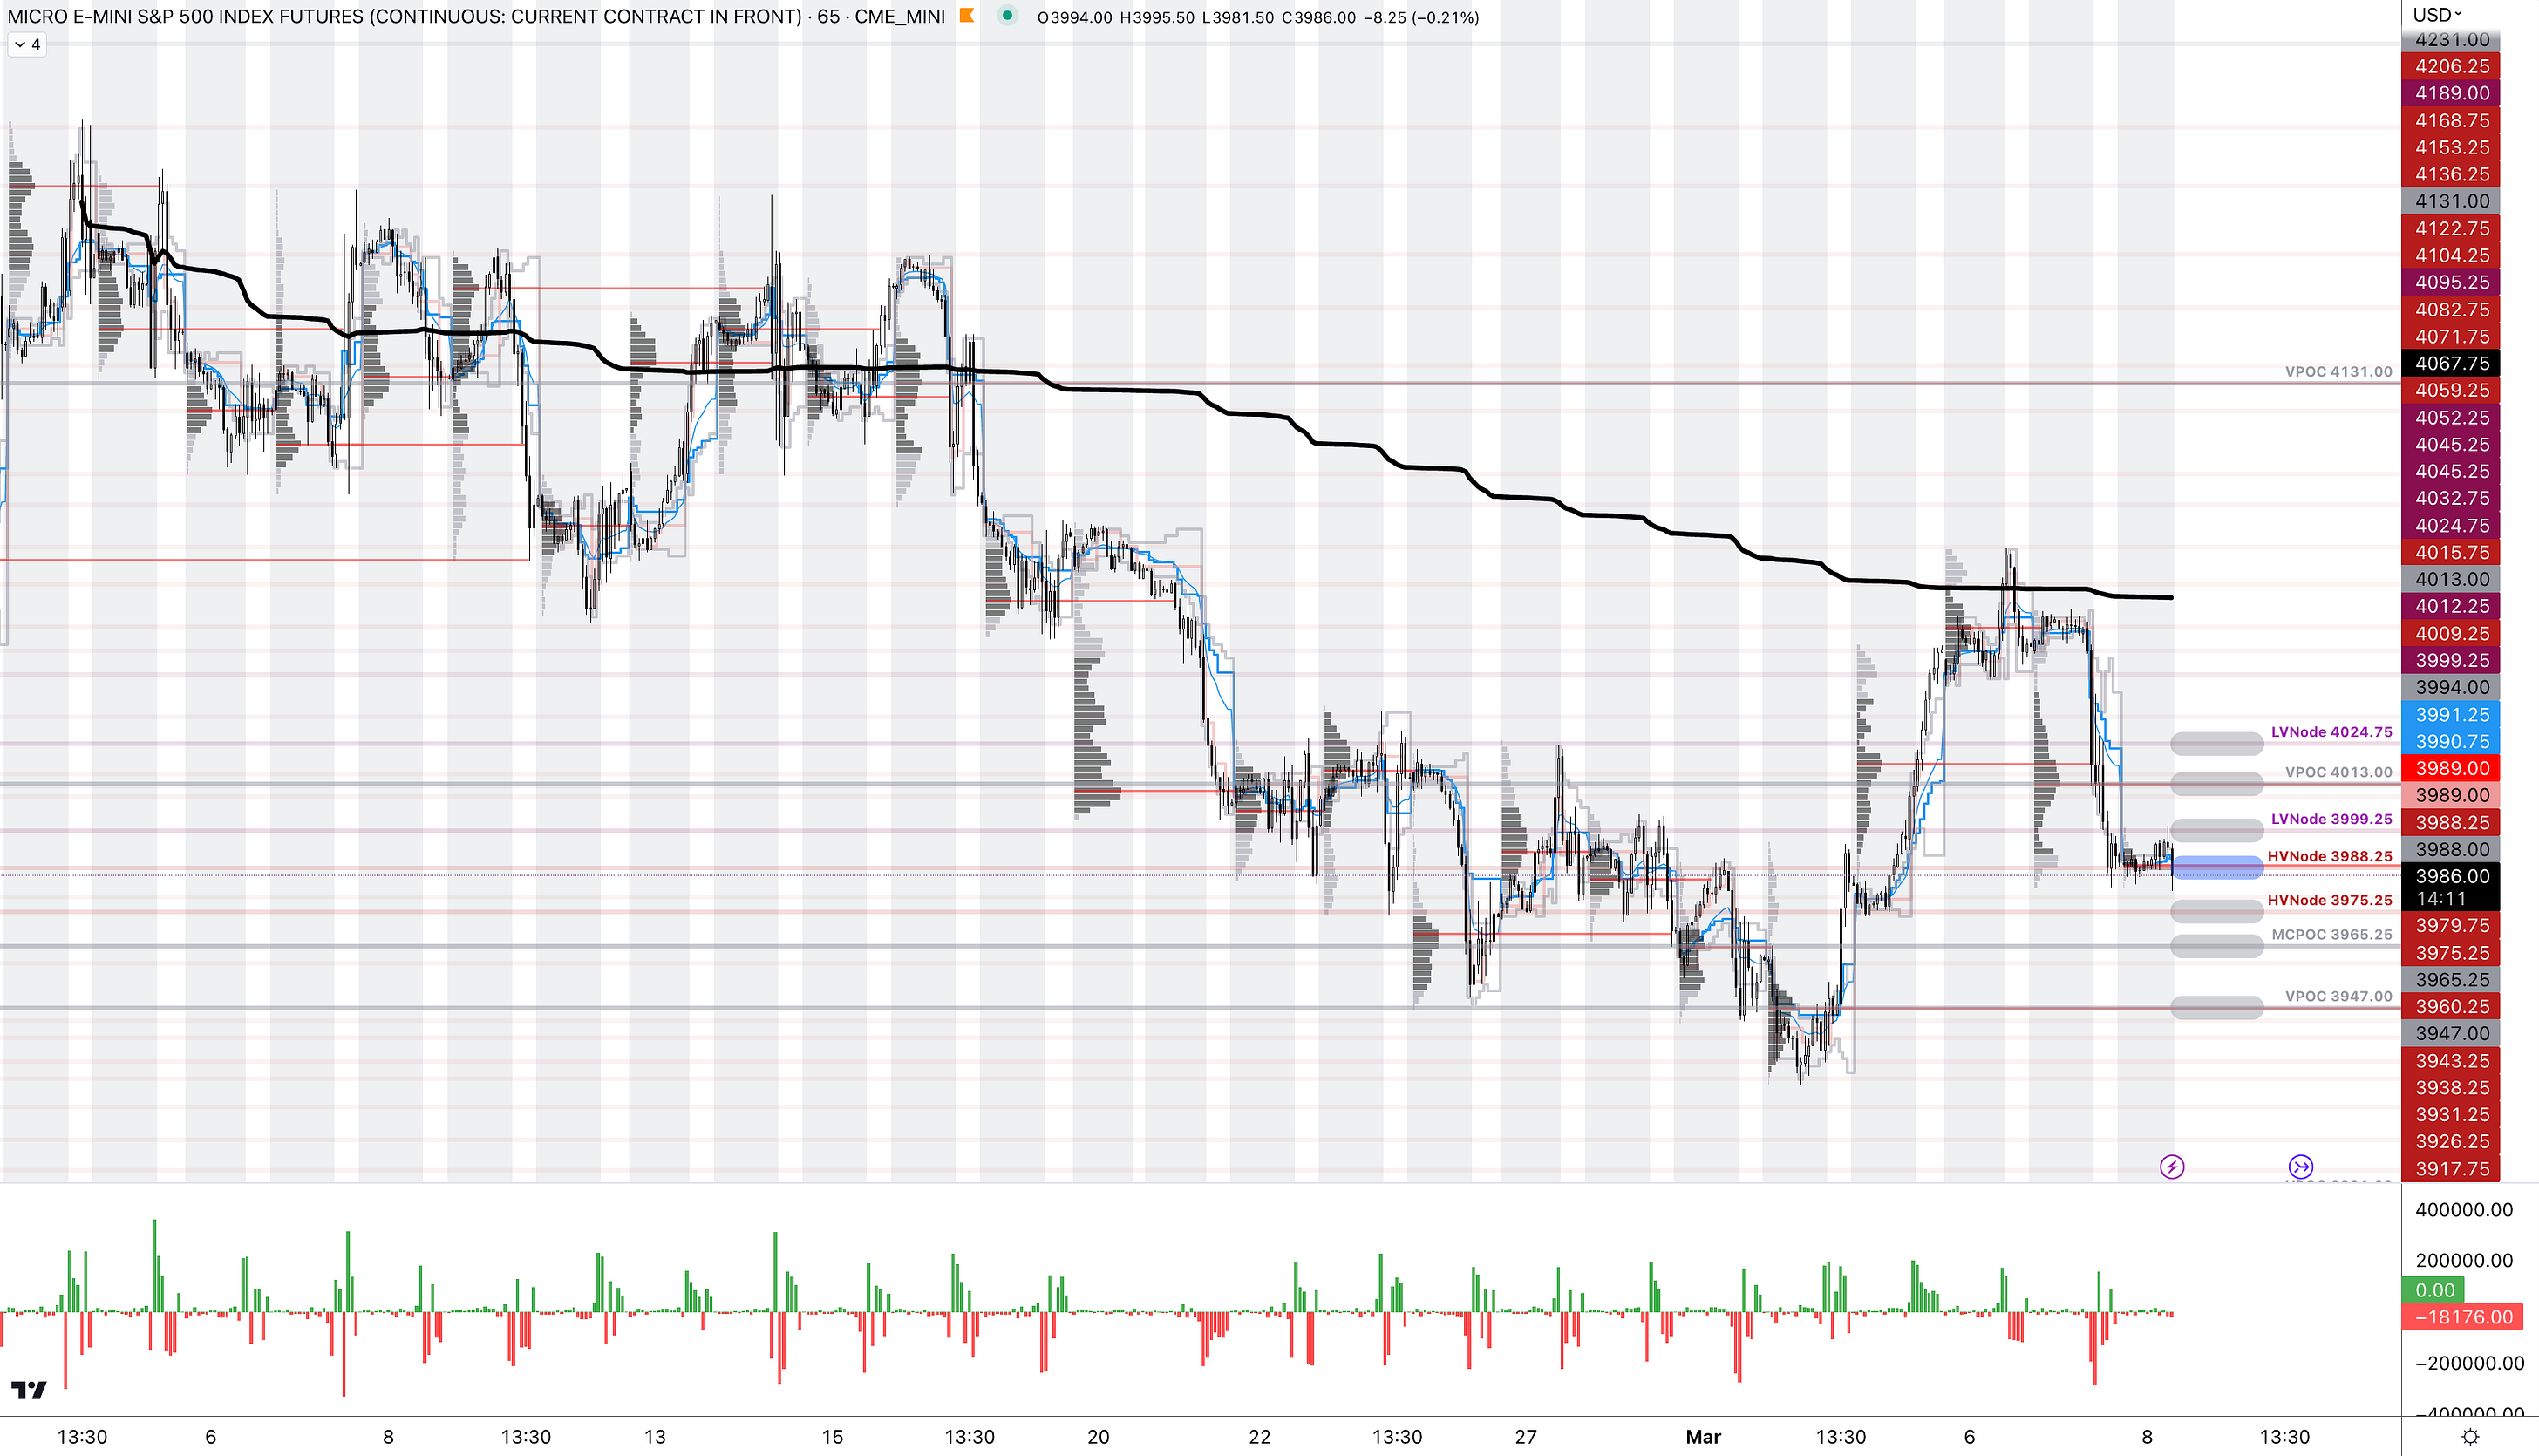
The S&P 500 pivot for today is $3,988.25.
Key levels to the upside include $3,999.25, $4,013.00, and $4,024.75.
Key levels to the downside include $3,975.25, $3,965.25, and $3,947.00.
Disclaimer: Click here to load the updated key levels via the web-based TradingView platform. New links are produced daily. Quoted levels likely hold barring an exogenous development.
Definitions
Volume Areas: Markets will build on areas of high-volume (HVNodes). Should the market trend for a period of time, this will be identified by a low-volume area (LVNodes). The LVNodes denote directional conviction and ought to offer support on any test.
If participants auction and find acceptance in an area of a prior LVNode, then future discovery ought to be volatile and quick as participants look to the nearest HVNodes for more favorable entry or exit.
POCs: Areas where two-sided trade was most prevalent in a prior day session. Participants will respond to future tests of value as they offer favorable entry and exit.
MCPOCs: Denote areas where two-sided trade was most prevalent over numerous sessions. Participants will respond to future tests of value as they offer favorable entry and exit.
About
The author, Renato Leonard Capelj, spends the bulk of his time at Physik Invest, an entity through which he invests and publishes free daily analyses to thousands of subscribers. The analyses offer him and his subscribers a way to stay on the right side of the market.
Separately, Capelj is an accredited journalist with past works including interviews with investor Kevin O’Leary, ARK Invest’s Catherine Wood, FTX’s Sam Bankman-Fried, North Dakota Governor Doug Burgum, Lithuania’s Minister of Economy and Innovation Aušrinė Armonaitė, former Cisco chairman and CEO John Chambers, and persons at the Clinton Global Initiative.
Connect
Direct queries to renato@physikinvest.com. Find Physik Invest on Twitter, LinkedIn, Facebook, and Instagram. Find Capelj on Twitter, LinkedIn, and Instagram. Only follow the verified profiles.
Calendar
You may view this letter’s content calendar at this link.
Disclaimer
Do not construe this newsletter as advice. All content is for informational purposes. Capelj and Physik Invest manage their own capital and will not solicit others for it.