Good Morning! I hope you are having a good week. I would be so honored if you could comment and/or share this post. Cheers!
As we step into Spring, we’re riding the wave of one of the strongest stock market rallies in over fifty years. It’s been a period of smooth sailing, with record highs beckoning transition from concern over potential downturns to the fear of being left out of further gains.
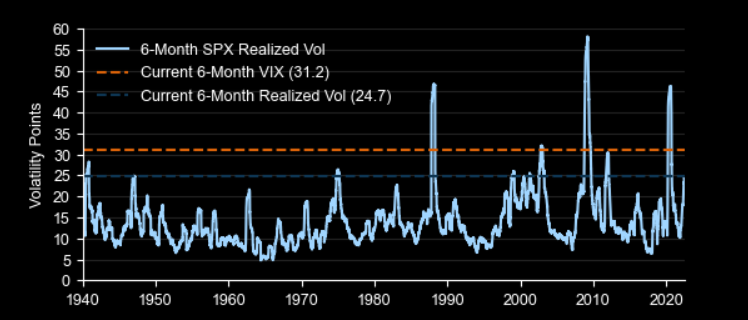
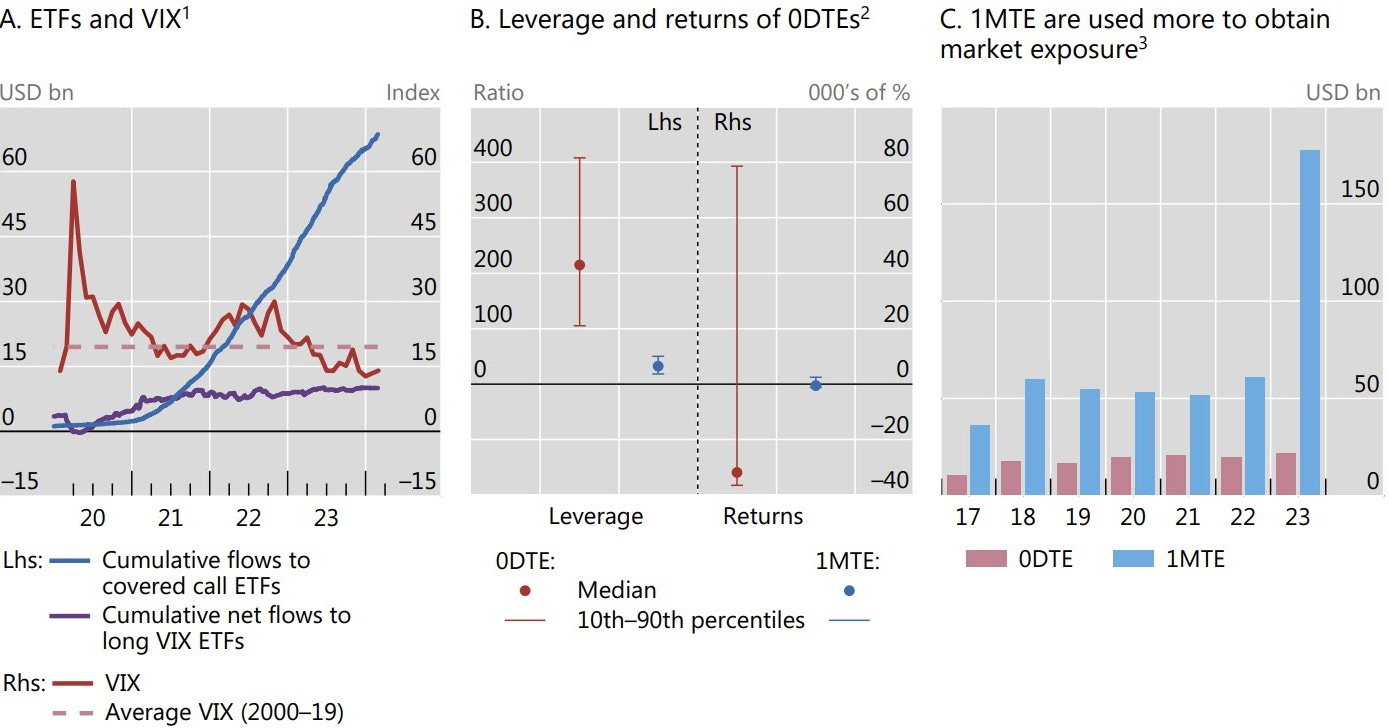
The BIS has commented on some of these trading behaviors, which can drive upward momentum and foster a sense of calm or low volatility. They point to the increased use of yield-enhancing structured products as a critical reason for reducing volatility. These products have stolen the show, boosting investor returns by selling options or betting against market fluctuations. In calm markets, those on the opposite side of these bets hedge in a way that reduces volatility: they buy when underlying asset prices dip and sell when they rise. As the supply of options increases, the liquidity injected to hedge stifles movement, resulting in a stubbornly low Cboe Volatility Index or VIX.
The BIS example illustrates a product that sells call options against an index position to lower the cost basis by collecting premiums. The counterparty buys call options and hedges by selling the same index. If the call options lose value or the market declines, the counterparty buys back the index they sold initially. This strategy is constructive and potentially bullish, especially in a rising market, as one could infer counterparties may postpone rebalancing to optimize profits (i.e., swiftly cut losses and allow profits to accumulate).
However, these trading behaviors come with risks.
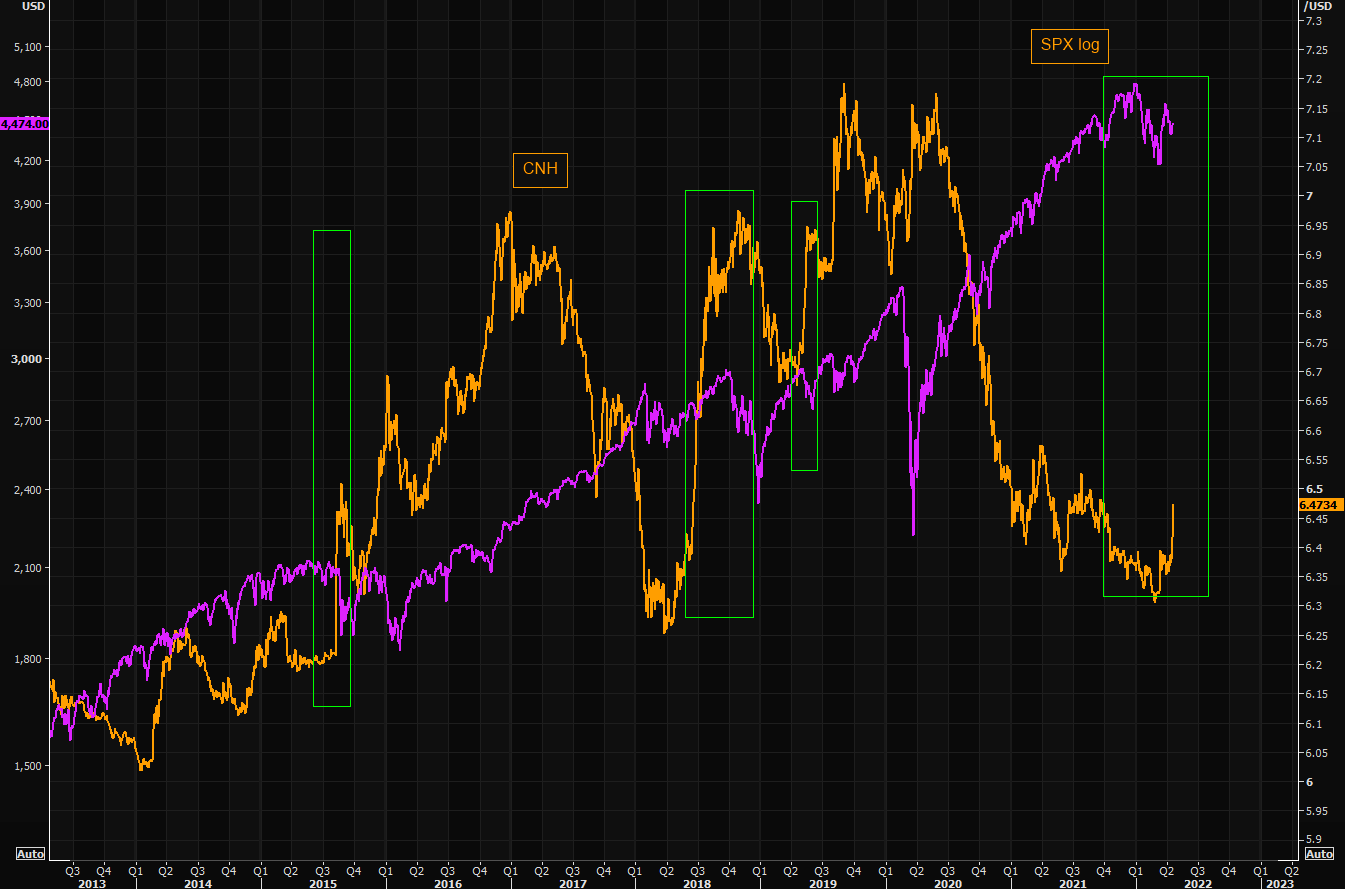
While individual stocks may experience volatility, the indexes representing them move begrudgingly. Investors have concentrated on selling options or volatility (the all-encompassing term) on indexes to fund volatility in individual components, a strategy known as dispersion. Although typically stabilizing, experts caution that it can end dramatically. One can look at the destructive selling in China as a cautionary example.
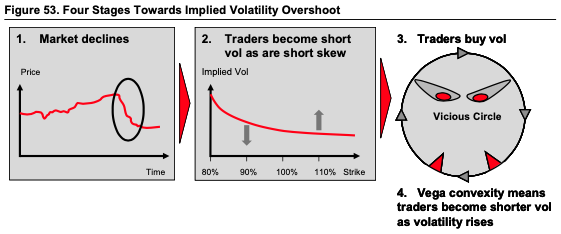
Kai Volatility’s Cem Karsan compares the trade to two sumo wrestlers or colossal plates on the Earth’s core exerting immense pressure against each other. While the trade may appear balanced and continue far longer, the accumulated pressures pose significant risks. Major crashes (up or down) happen when entities are compelled to trade volatility and options. Often, the trigger is the inability to cover the margin and meet regulatory requirements, causing a cascading effect (e.g., GameStop and 2020 crash).
The current scenario mirrors the conditions before Volmageddon, where short-volatility tactics failed.
With implied correlations low, a market shock could see investors exiting their positions abruptly, amplifying volatility. Karsan notes a precursor to such a crash is a weakening supply of margin puts, particularly the highly convex and far out-of-the-money ones. These options play a significant role during stressful market periods, acting as indicators and drivers of impending crashes. The focus is on convexity (i.e., the rate of change of delta for changes in the underlying asset’s price or the nonlinear relationship between the option’s price and the underlying asset) rather than whether there are good odds the underlying asset will trade down to the options in question.
“Implied vol is about liquidity. It isn’t about fear or greed,” writes Capital Flows Research. “Implied vol is about liquidity on specific parts of the distribution of returns on an asset. Remember, even the outright price of an asset is pricing a distribution of outcomes, not a single destination. Options make this even more explicit by having various strikes and expirations with differing premiums and discounts.”
History shows a minor catalyst can lead to a dramatic unwind. Take what happened with S&P 500 options a day before XIV crash day.
“Going into the close the last hour, we saw nickel, ten, and five-cent options trade up to about $0.50 and $0.70,” Karsan elaborates. “They really started to pop in the last hour.”
“And then, the next day, we opened up and they were worth $10.00. You often don’t see them go from a nickel to $0.50. If you do, don’t sell them. Buy them, which is the next trade.”

Similar to downward crashes, there are occasional but now more common upward crashes.
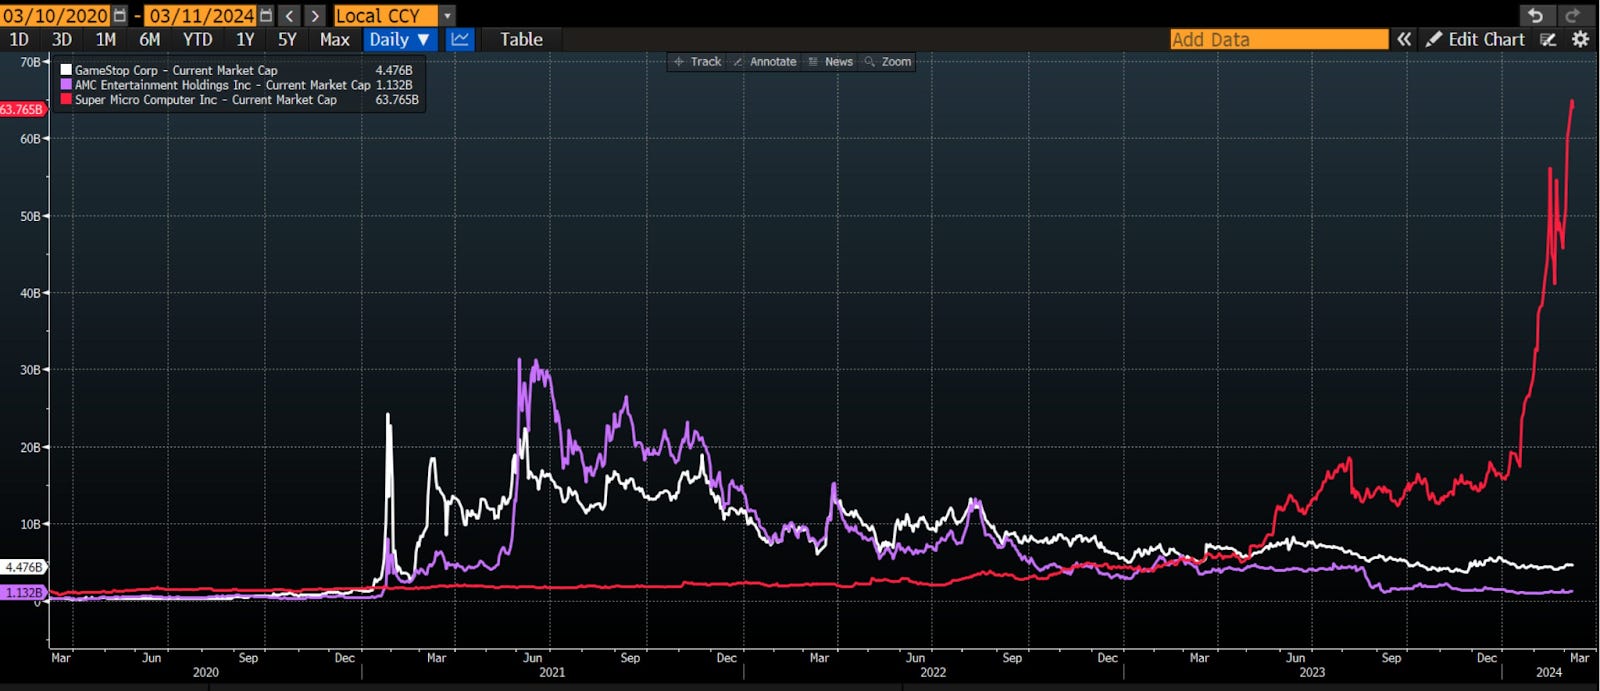
Recent market movements, particularly the surge in stocks such as Nvidia, Super Micro Computer, and MicroStrategy, echo the frenzy seen with high-flying stocks like GameStop in 2021. This caused losses for some liquidity providers and funds that mistakenly equated the price or level of volatility with value, selling it at a discount to where it would eventually trade.
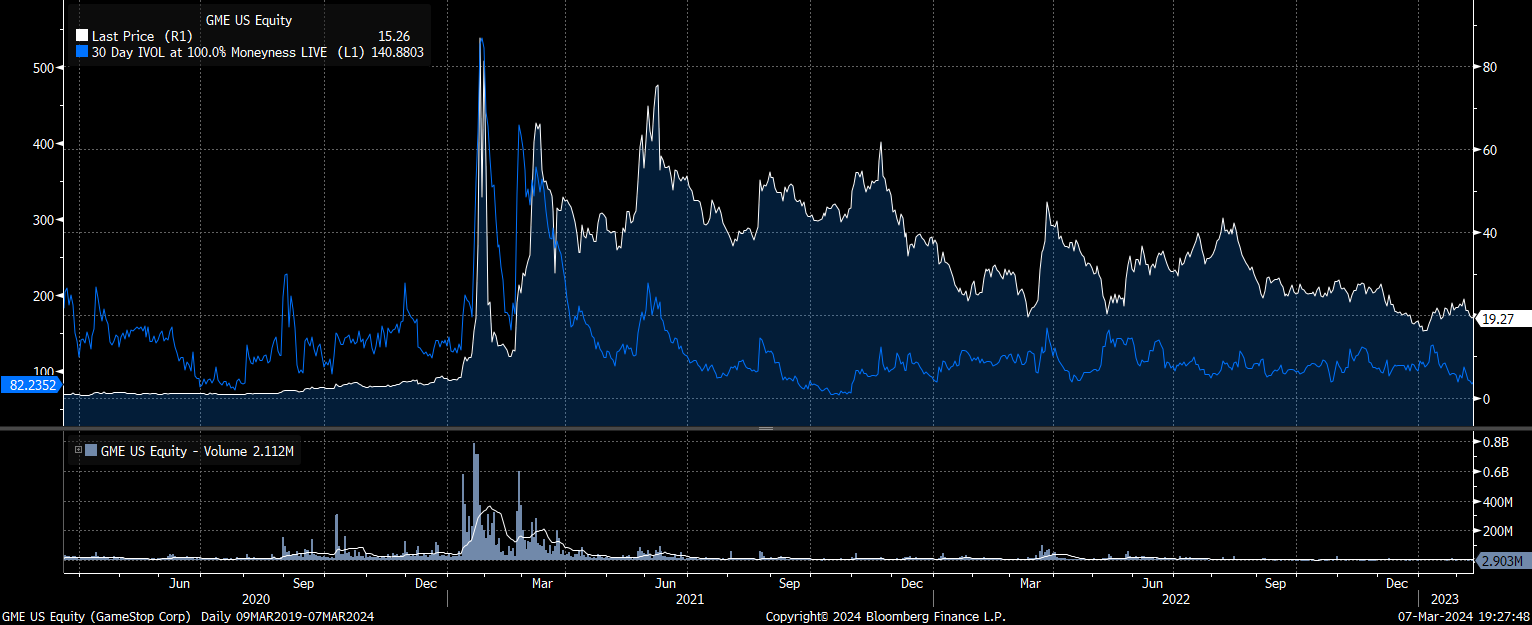
“I remember several traders I knew trying to short-vol on GME when it was at 300 because it was ‘cheap’ due to its level,” Capital Flows Research adds. “They were blown out of those positions.”
So, we have played along, nodding to George Soros’s famous statement: “When I see a bubble forming, I rush in to buy, adding fuel to the fire. That is not irrational.”
To explain, we go deeper into something known as implied volatility skew.
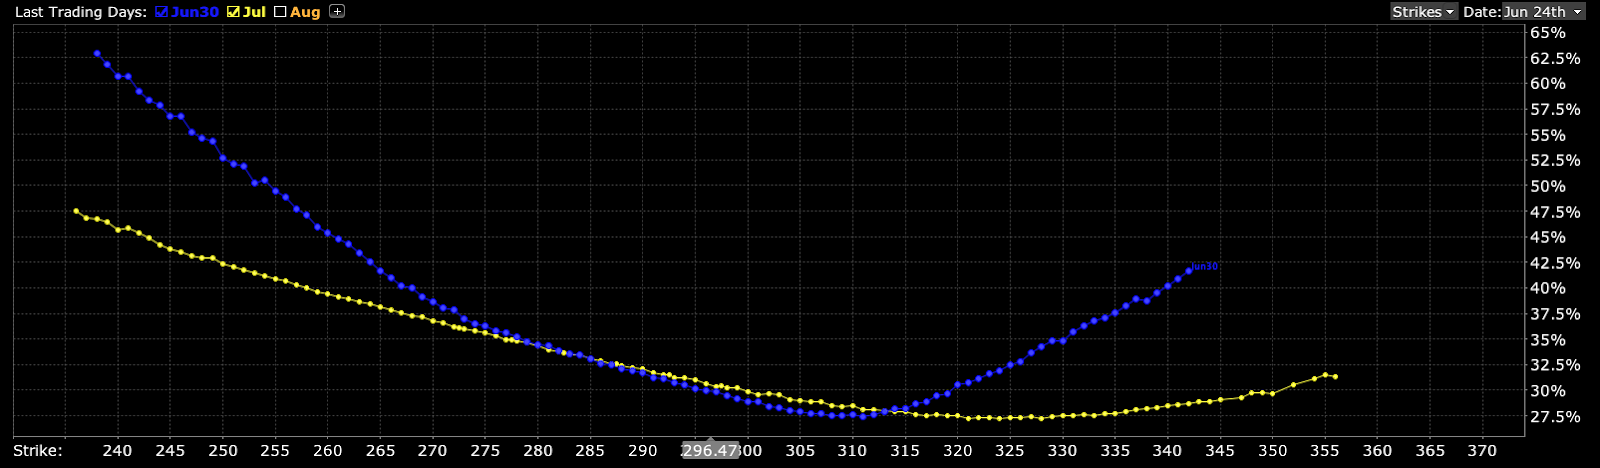
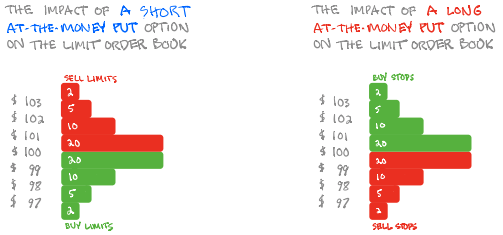
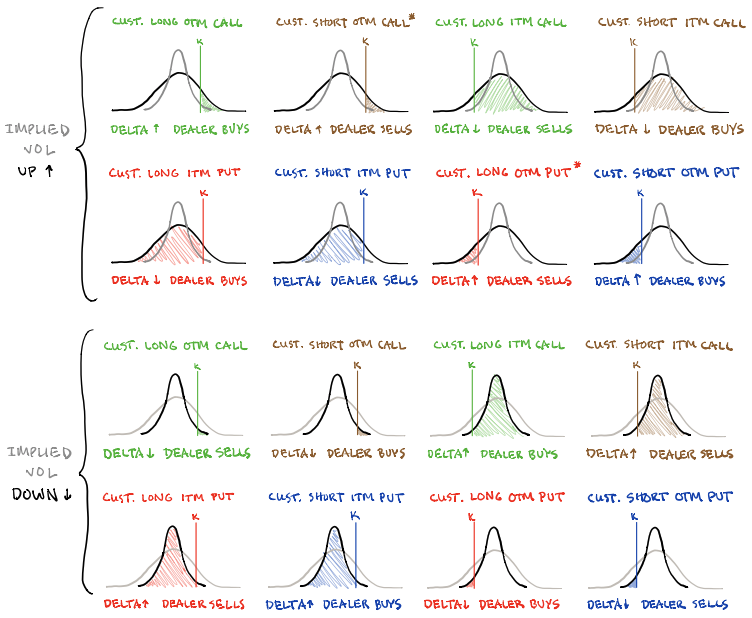
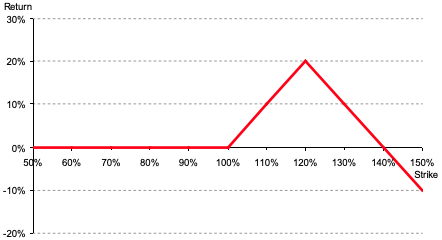
Skew refers to the difference in implied volatility across different strike options on the same underlying asset. Typically, options with farther away strike prices (out-of-the-money puts) have higher implied volatility than options with higher strike prices (at-the-money calls).
Implied volatility skew, as shown below, is often nonsymmetrical due to higher demand for downside protection.
When volatility skews become steeper, the disparity in implied volatility between various strike prices widens. For instance, the implied volatility of out-of-the-money (OTM) puts, which offer protection against market downturns, rises compared to at-the-money (ATM) puts and upside protection (calls). This steepening volatility skew indicates heightened apprehension among investors regarding potentially large downward market movements. Similarly, when the implied volatility of upside protection (calls) surpasses that of downside protection (puts), it signals growing concern (i.e., FOMO) about potential upward market movements. A steepening call volatility skew results from distant call options pricing higher implied volatility than usual due to investor demand/fear.

As savvy traders, we can construct creative structures and sell options against the closer ones we own to lower our costs on bullish trades. We detailed such bullish trades in our last two commentaries titled “BOXXing For Beginners” and “Foreshocks.” The outcomes for one of Physik Invest’s accounts are detailed below.

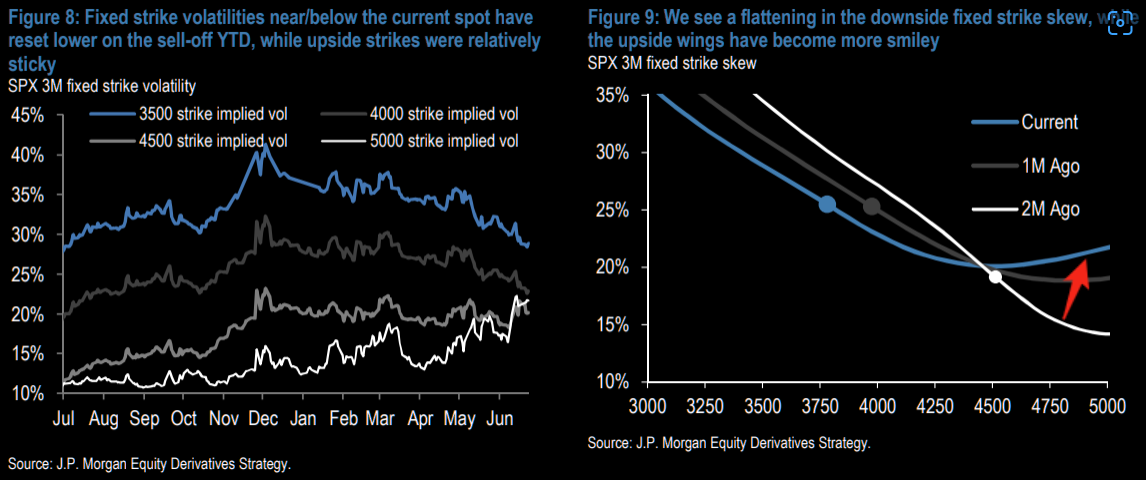
Regrettably, enthusiasm is waning. Using Nvidia as an illustration, the stock surged 2.6% on Friday but plummeted 8% on the same day. The call skew was elevated over the weekend before leveling off earlier this week, which poses difficulties for traders betting on further upward movement.

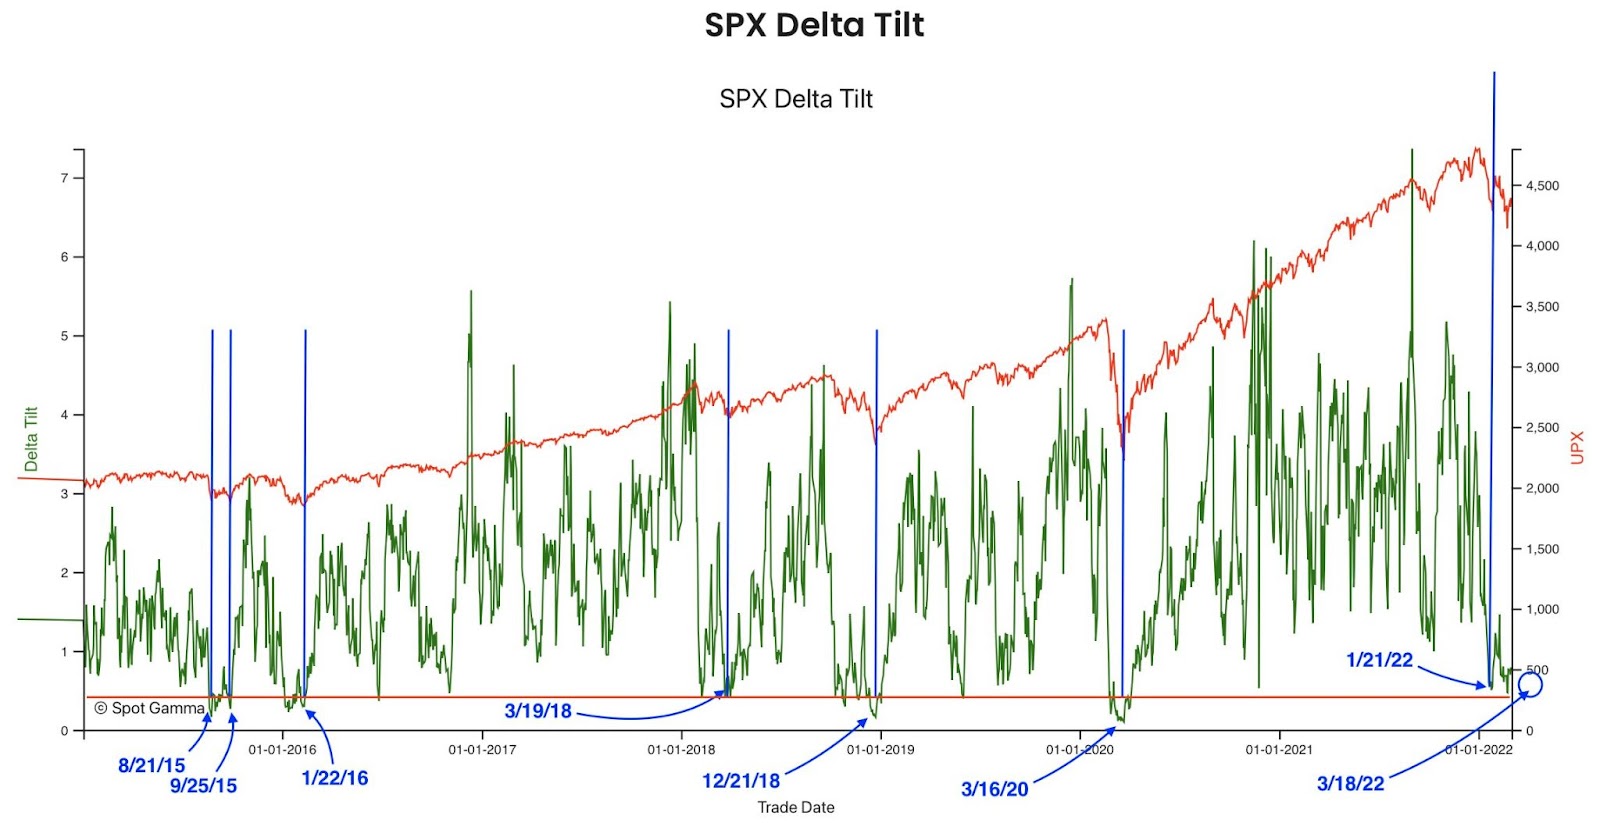
We discussed how such a flattening could foreshadow waning risk appetite and potentially herald market softness. SpotGamma indicates that call skews are flattening across the board, as illustrated in the chart below.
The red bars on the left represent approximately 90th percentile skews during a significant stock rally. However, a week later, on the right side, the skew rankings decline. “This appears like the uniformly bullish action in top tech stocks is breaking apart,” SpotGamma explains. This “is a reduction in bullish exuberance.”

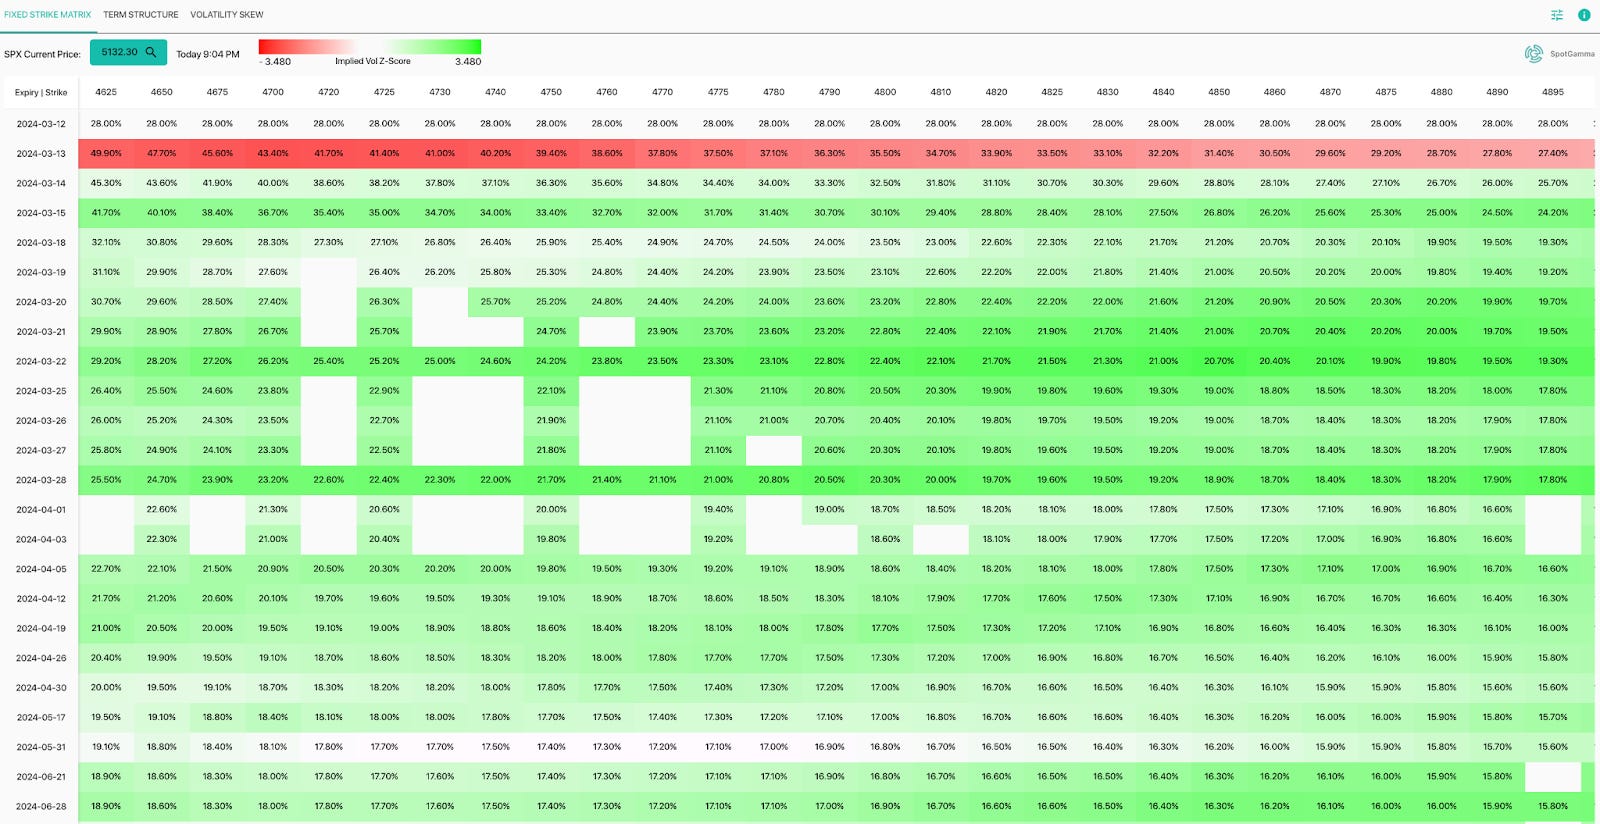
This activity will not likely disrupt the broader market; markets will stay intact as traders double down, selling shorter-dated volatility and buying farther-dated ones. We observe this using SpotGamma’s Fixed Strike Matrix below. In a simplistic sense, red indicates selling, while green suggests buying.
“By default, cells are color-coded red-to-green based on the Implied Volatility Z-Score,” SpotGamma explains. “If the cell is red, Implied Volatility is lower than the average implied volatility over the past two months. If the cell is green, Implied Volatility is higher than the implied volatility over the past two months.”
The recent compression in short-term volatility aids stabilization, leading to restrained ranges in the indexes relative to components. Among these components, which drove the S&P 500 upwards, some big ones face downward pressure, partly due to the expiration of previously demanded/bought call options. This expiration prompts those initially selling these (e.g., call) options to re-hedge by selling the corresponding stocks.
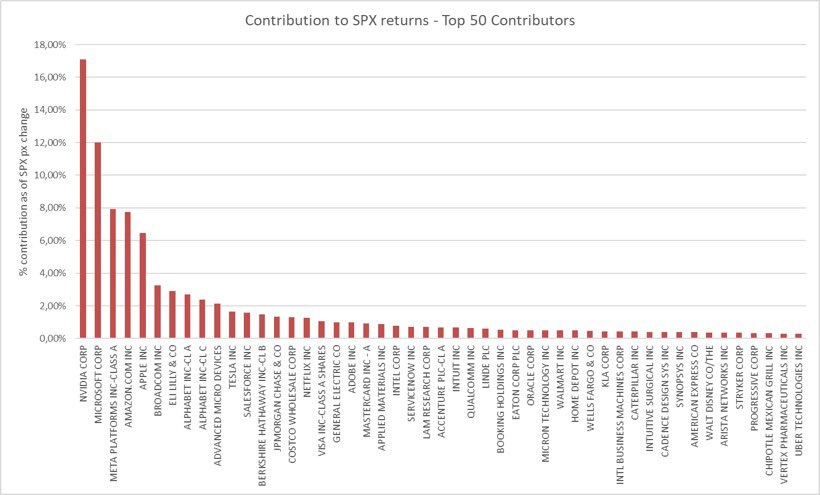
As the indexes remain fixed, the only resolution is a decline in correlation. As larger stocks decline, smaller constituents rise, contributing to the strength observed in the S&P 500 Equal Weight Index.
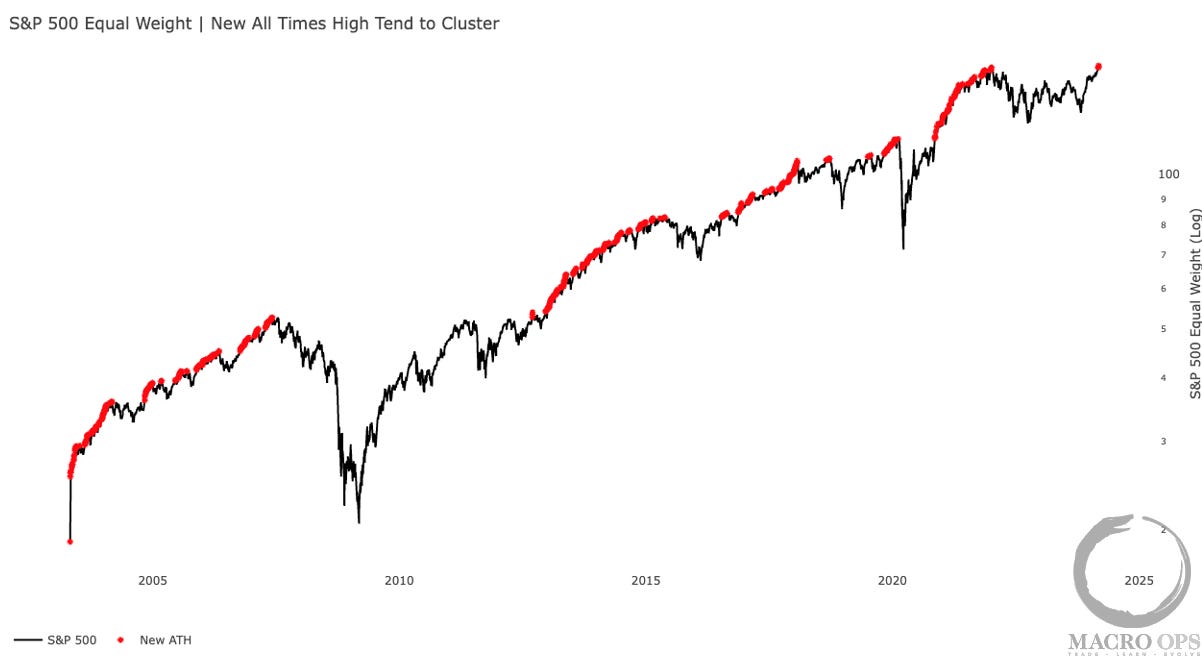
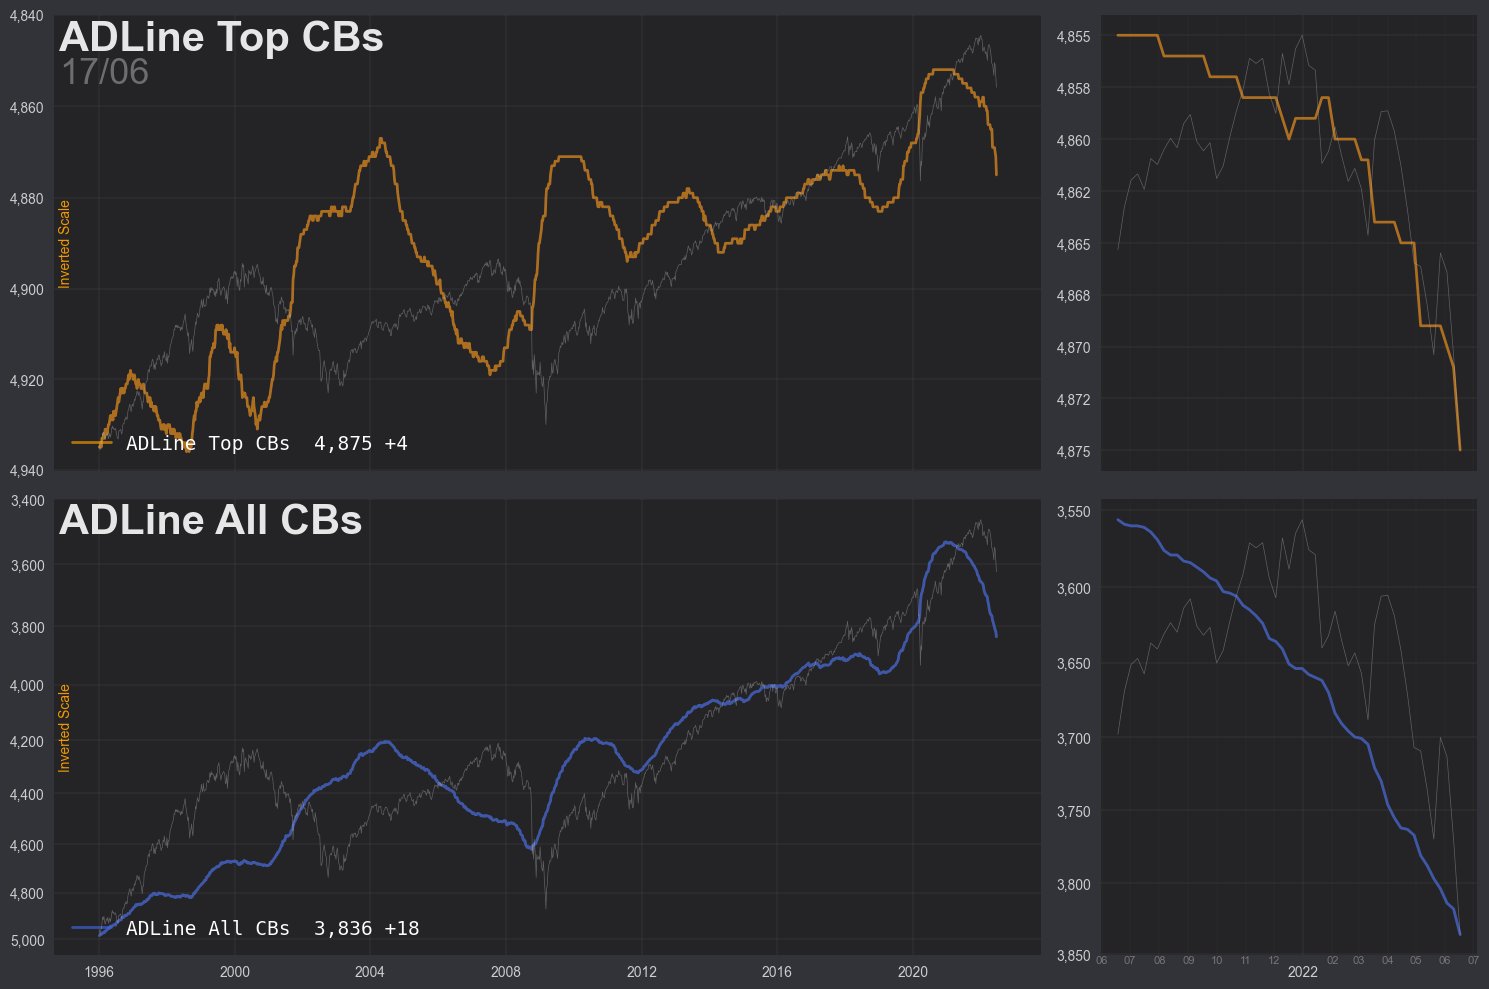
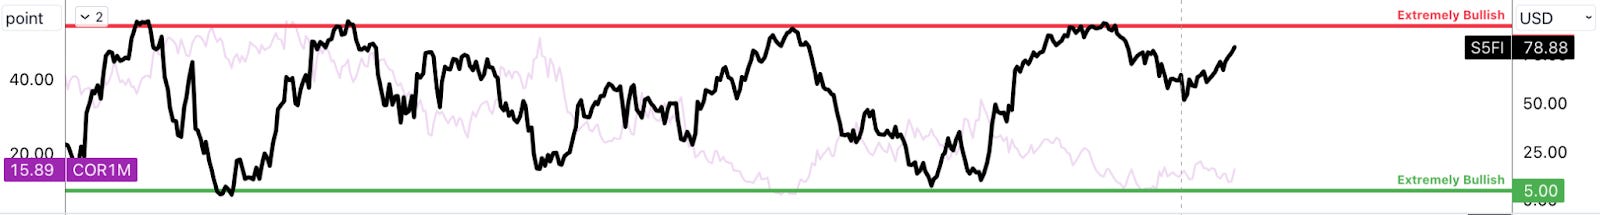
Breadth can be evaluated naively by comparing the S&P 500 stocks trading above their 50-day moving average and examining the proportion of index constituents achieving new highs and lows. We see improvement, per the below.
Based on the above explanation and graphics, after the triple witching expiration of futures, stock, and index options, traders may rebalance their portfolios and sell some of the remaining volatility they’ve bid.
As explained earlier, this will further compress volatility, reducing the potential downside and providing critical support for stocks. Considering it’s an election year and policymakers prioritize growth over instability, Karsan suggests the market may remain stable with these forces above offering an added boost. Therefore, focus on creatively structuring longer-dated call structures and financing them with other trades to amplify return potential.
If the market consolidates without breaking, we may have the groundwork for a much bigger FOMO-driven call-buying rally culminating in a blow-off. Karsan adds that the signs of this “more combustible situation” would appear when “volatility remains persistent during a rally.” To assess combustibility, observe the options market.
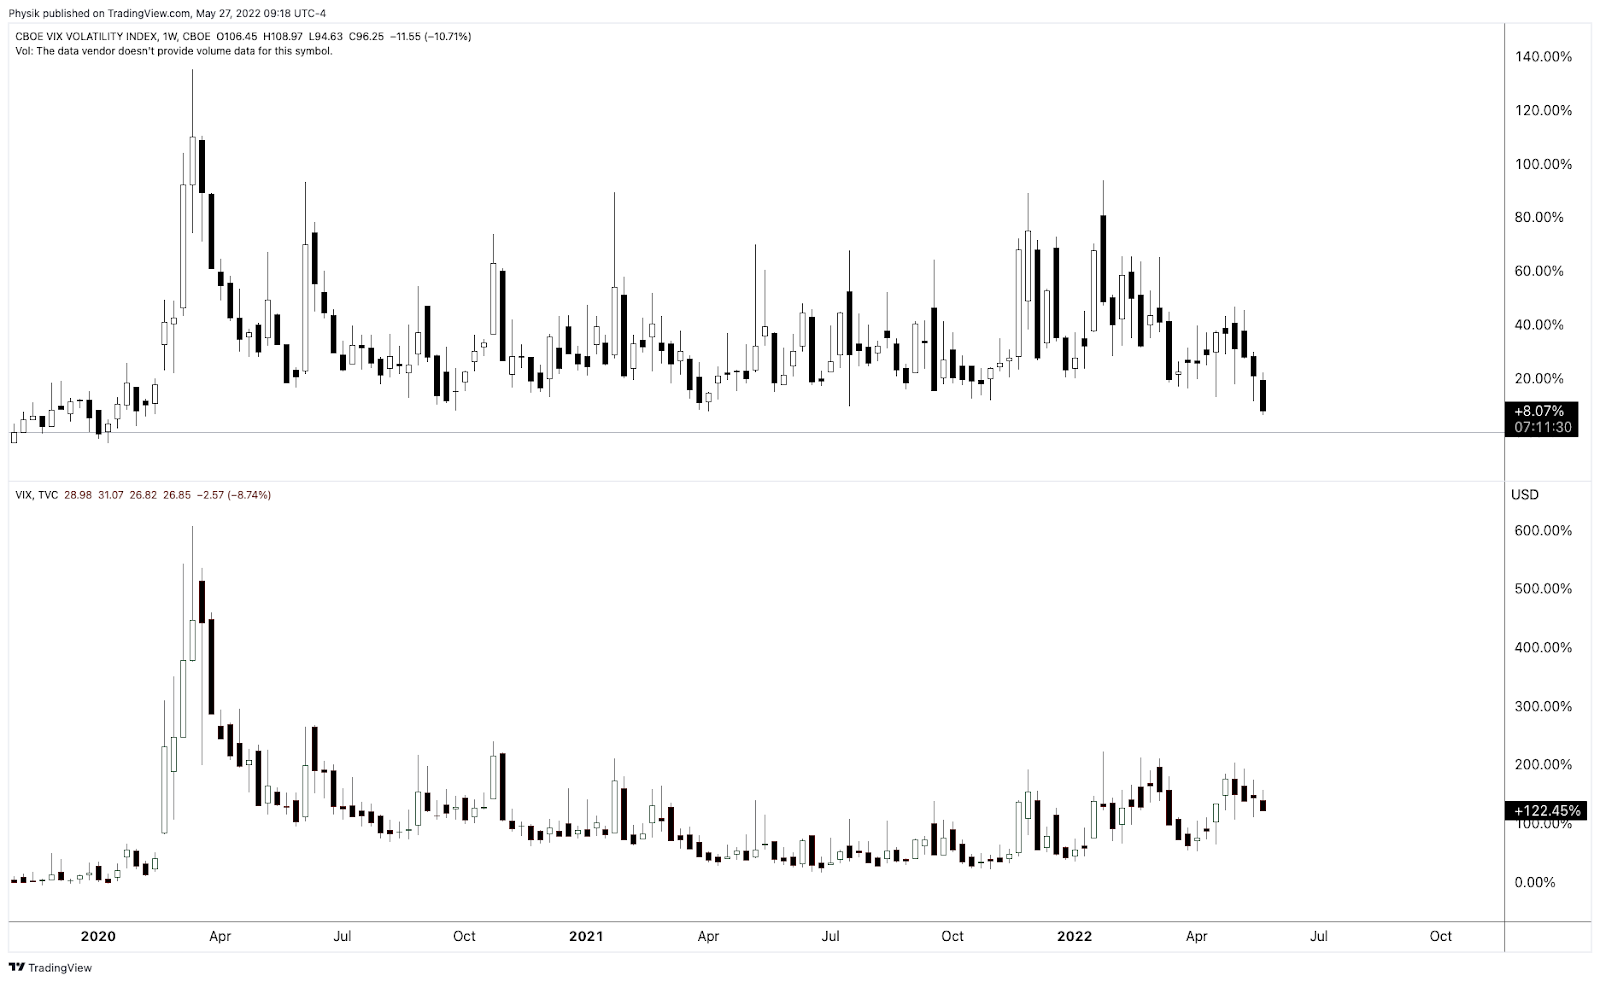
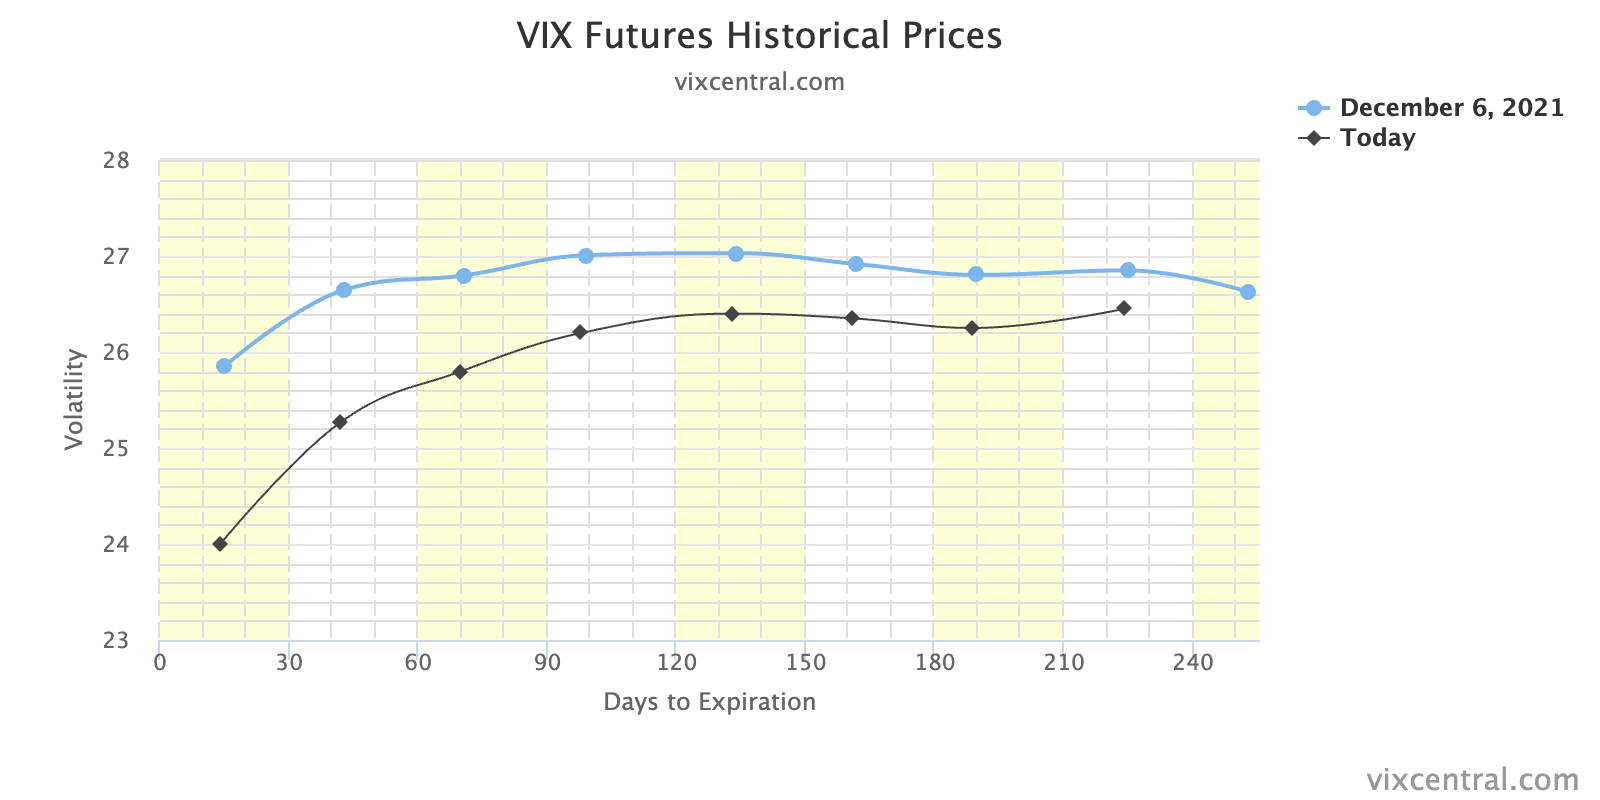
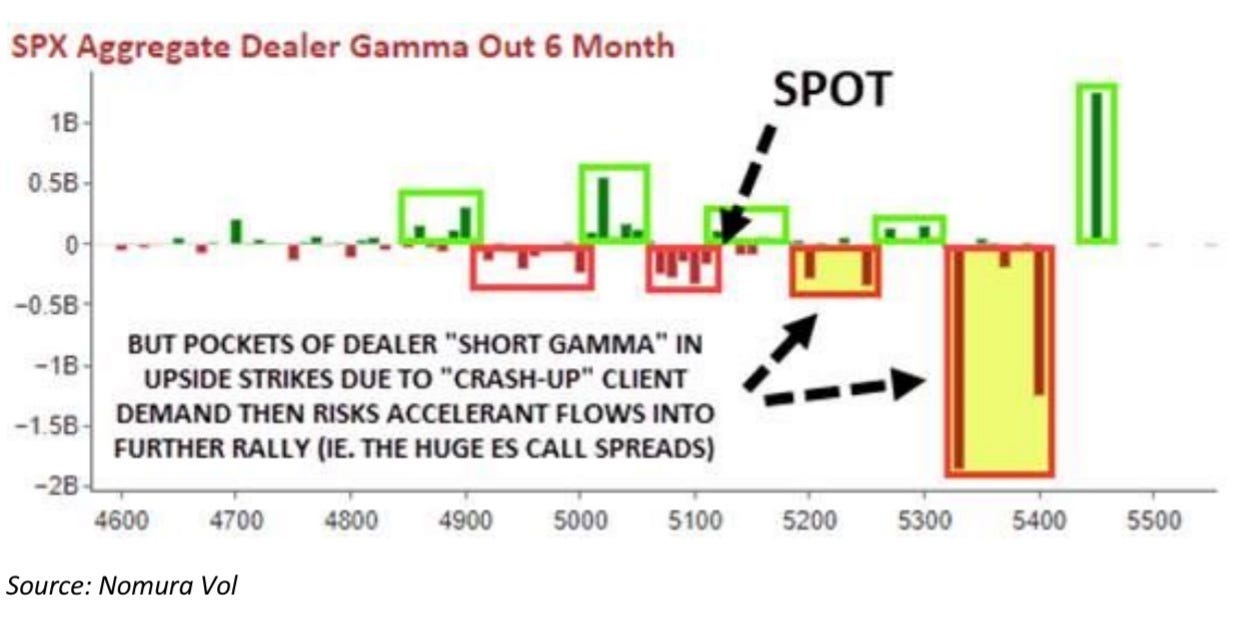
We remember that calls trade at lower implied volatility than puts, particularly from all the supply. As the market moves higher, it transitions to lower implied volatility, reflected in broad measures like the VIX. If the VIX measures remain steady or higher, “that indicates that fixed-strike volatility is increasing, and if this persists, … it can unsettle volatility and create a situation where dealers themselves … begin to reduce their volatility exposure, leading to a more combustible scenario.”
To elaborate on the reducing exposure note in the previous paragraph, if there is greater demand for calls, counterparties will take on more exposure and hedge through purchases of the underlying asset. The support dealers provide will diminish once this exposure expires. If the assumption is that equity markets are currently expensive, then after another rally, there may be more room for a decline, all else being equal (a simplified perspective), thus increasing risk and combustibility.
This week, we discussed a lot of information. Some of it may need to be explained better. Therefore, we look forward to your feedback. Separately, I wish my friend Giovanni Berardi congratulations on starting his newsletter. I worked with Berardi, giving him input on some of his positioning-related research. He shares his insights here. Please consider supporting him with a subscription. Cheers, Giovanni!