Physik Invest’s Daily Brief is read free by thousands of subscribers. Join this community to learn about the fundamental and technical drivers of markets.
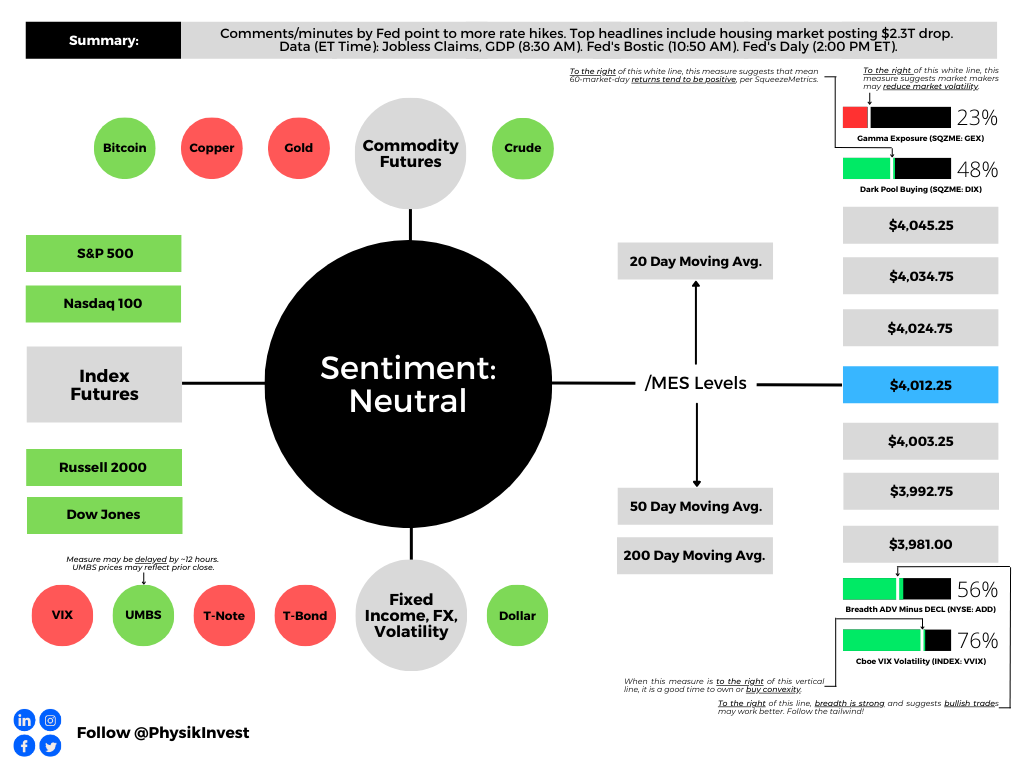
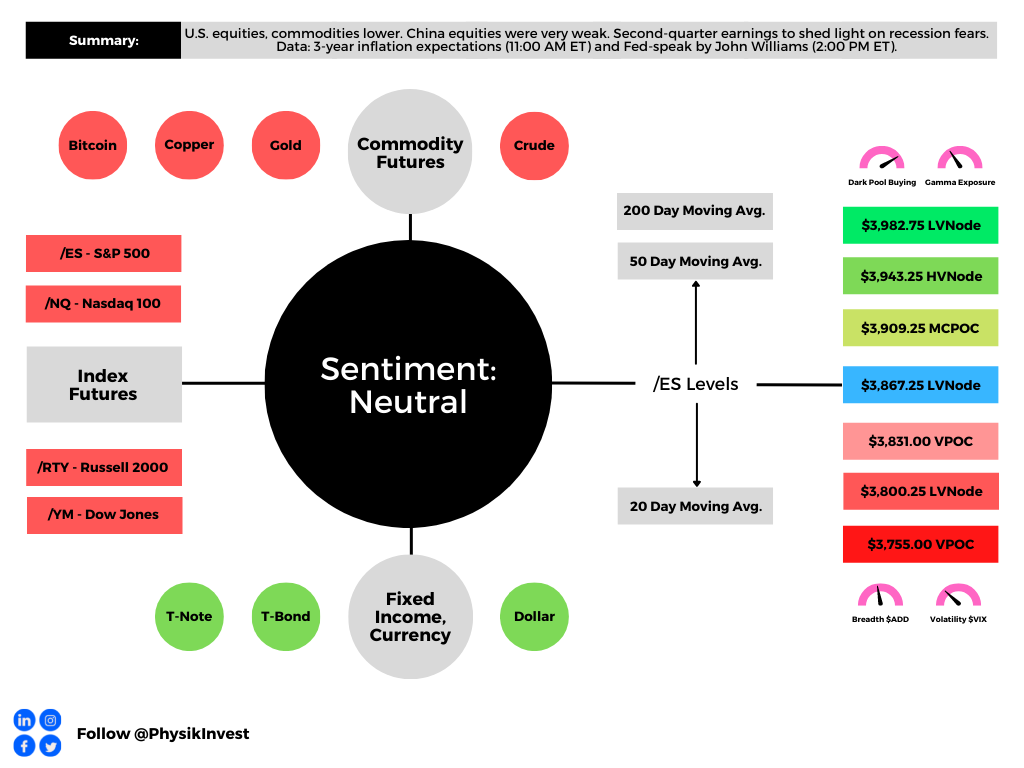
Graphic updated 6:30 AM ET. Sentiment Neutral if expected /MES open is inside of the prior day’s range. /MES levels are derived from the profile graphic at the bottom of this letter. Click here for the latest levels. SqueezeMetrics Dark Pool Index (DIX) and Gamma (GEX) with the latter calculated based on where the prior day’s reading falls with respect to the MAX and MIN of all occurrences available. A higher DIX is bullish. The lower the GEX, the more (expected) volatility. Click to learn the implications of volatility, direction, and moneyness. Breadth reflects a reading of the prior day’s NYSE Advance/Decline indicator. The CBOE VIX Volatility Index (INDEX: VVIX) reflects the attractiveness of owning volatility. UMBS prices via MND. Click here for the economic calendar.
Fundamental
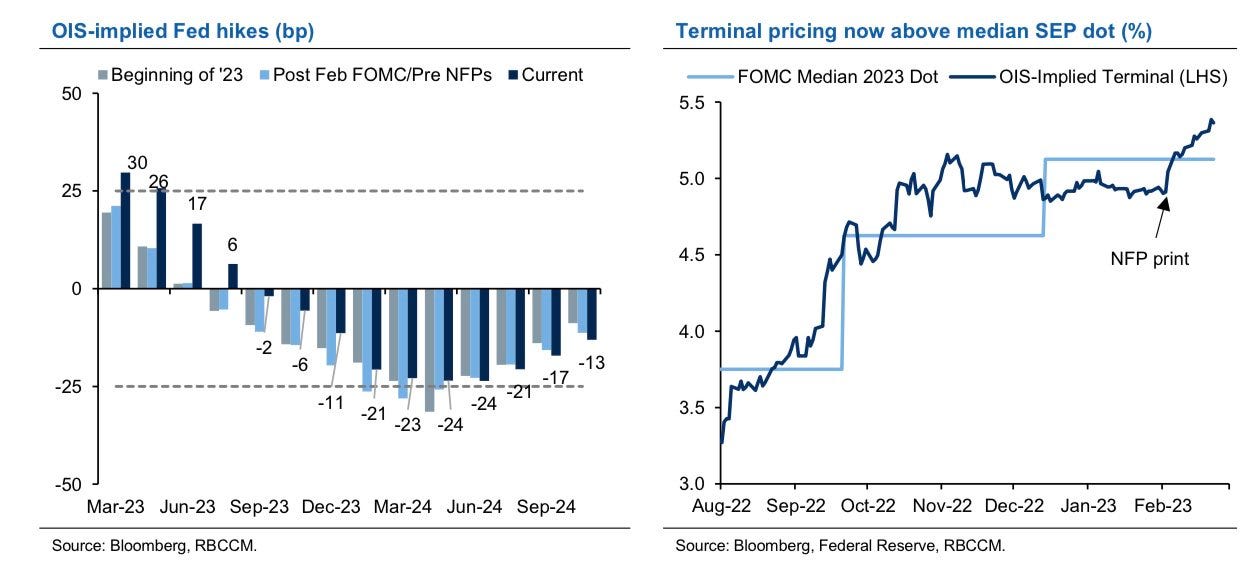
Bloomberg’s John Authers summarized well the release of the Federal Open Market Committee (FOMC) meeting minutes. He said that almost all officials “supported a step down in the pace of tightening by 25 basis points, while a ‘few’ favored or could have supported a bigger 50 basis-point hike. Nobody wanted to stop straightaway.”
“Participants observed that a restrictive policy stance would need to be maintained until the incoming data provided confidence that inflation was on a sustained downward path to 2%, which was likely to take some time,” the minutes said.
Graphic: Retrieved from Royal Bank of Canada (NYSE: RY).
Notwithstanding hits to markets like housing, which news has concentrated on, the S&P 500 (INDEX: SPX) is trading about 18x forward price-to-earnings, Bank of America Corporation (NYSE: BAC) said, the highest since March 2022 and 20% above the last decade’s average P/E.
Graphic: Retrieved from Bloomberg.
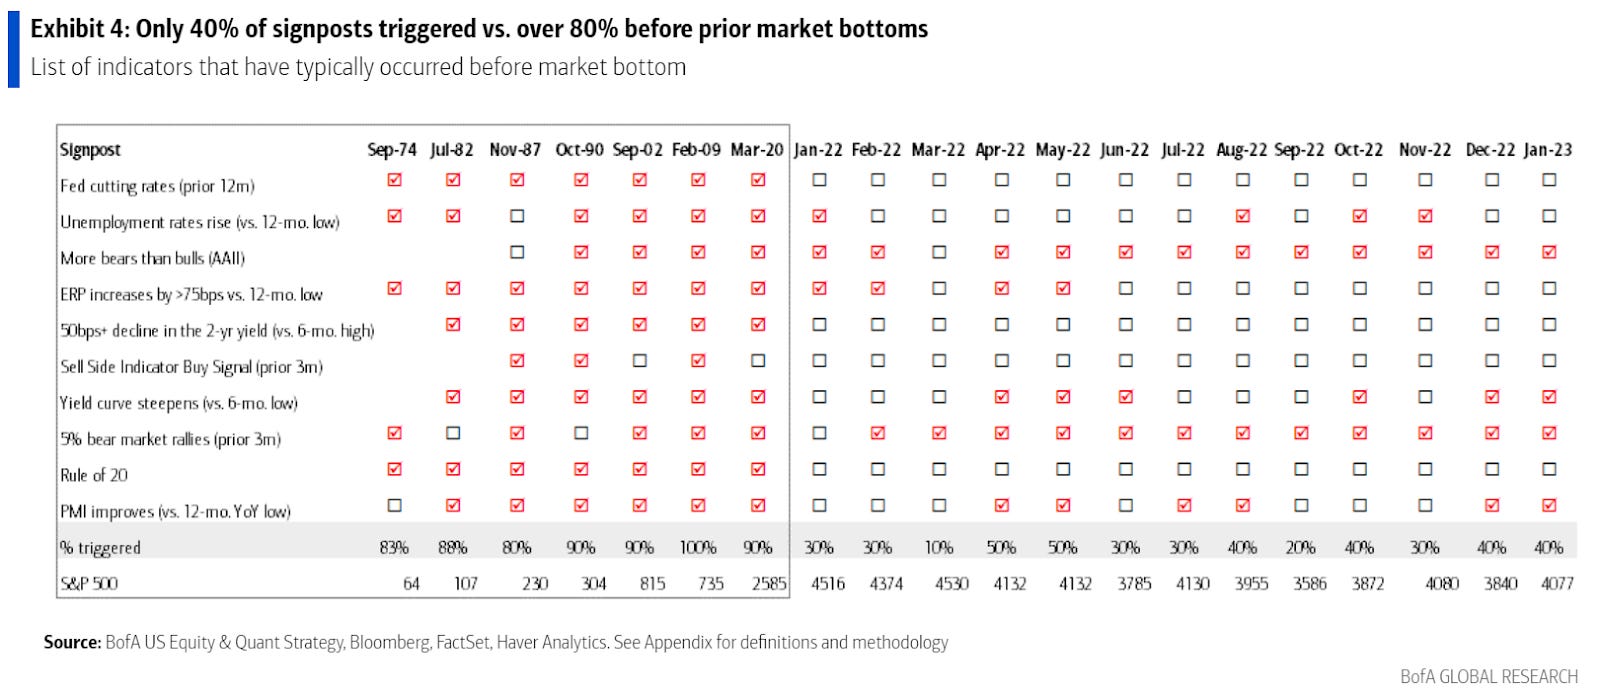
Per Savita Subramanian, “the traditional Rule of 20 … holds that the multiple should be whatever number results by subtracting the inflation rate from 20 — which with inflation at 6.4% would imply that the P/E needs to fall to 13.6.”
Graphic: Retrieved from Bank of America Corporation (NYSE: BAC) via Bloomberg.
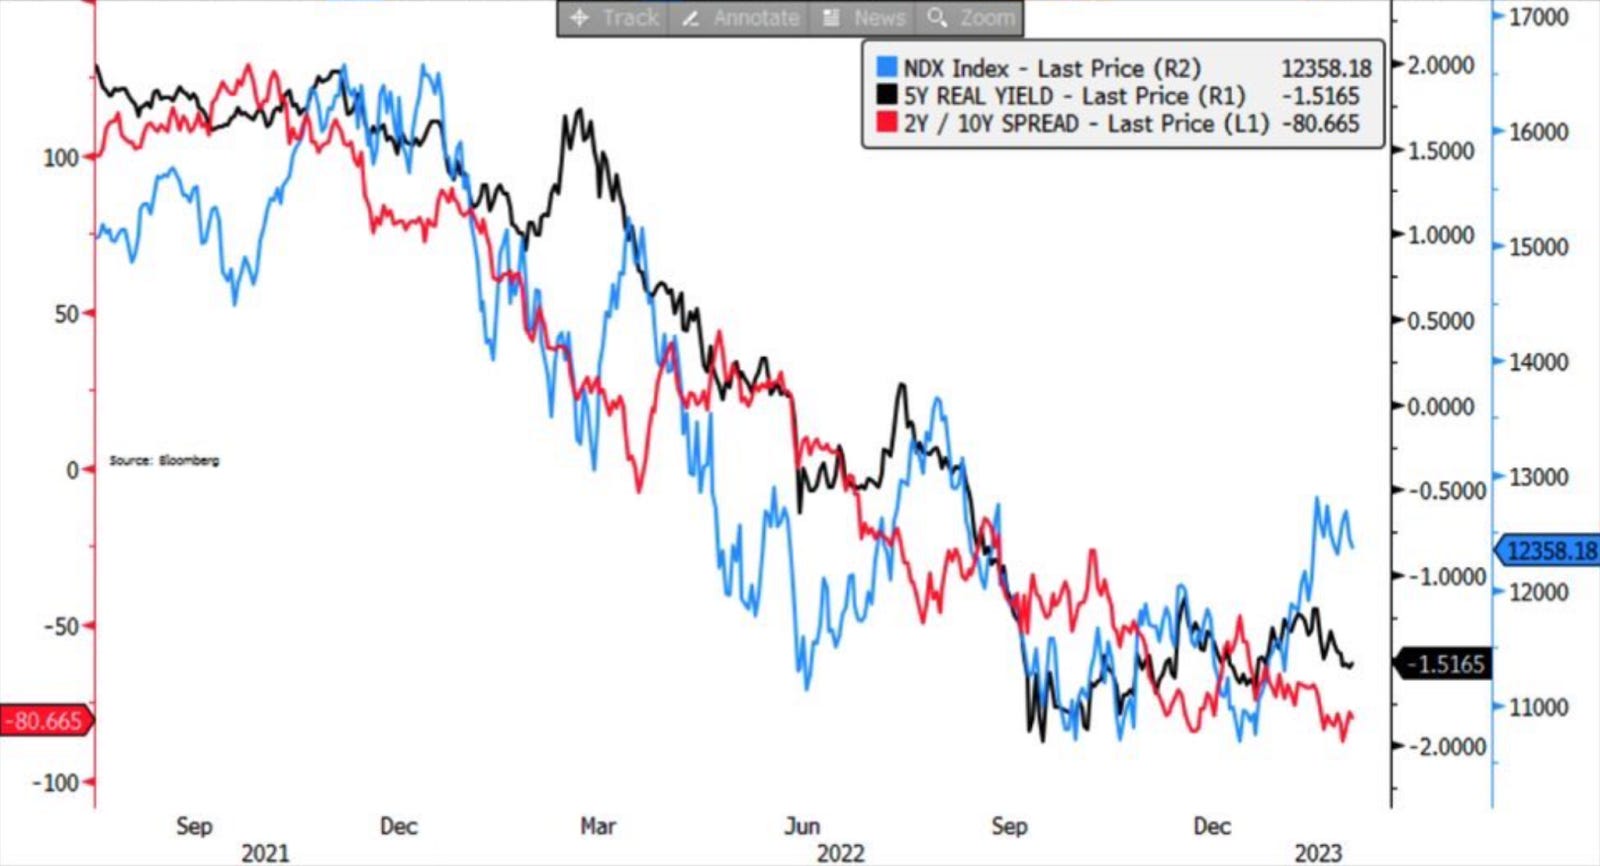
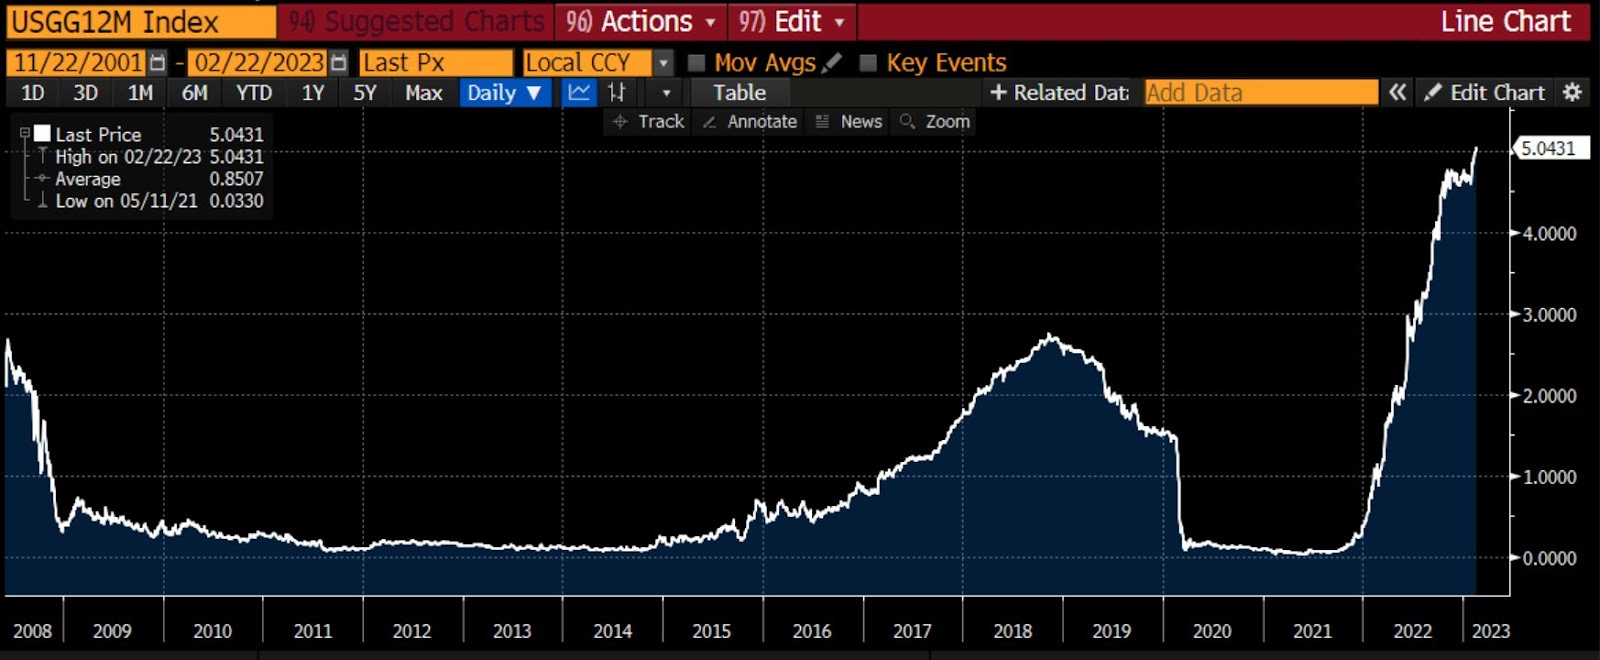
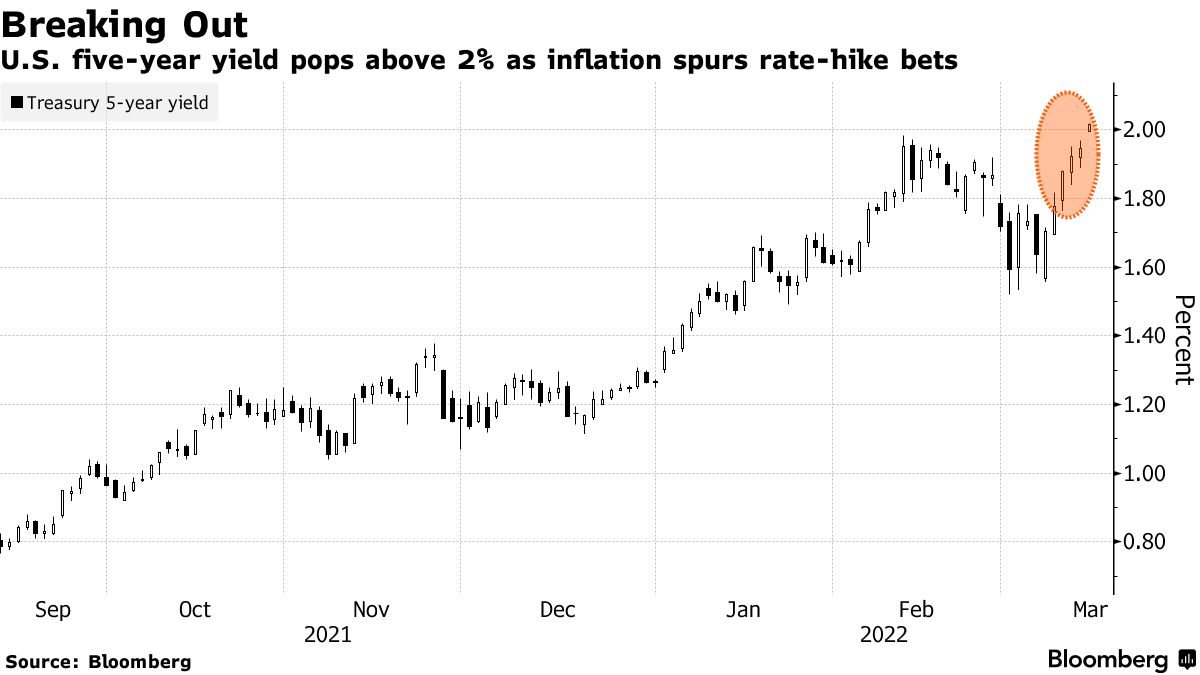
Recall yesterday’s letter discussing the “risk-reward of holding bonds [looking] betterthan equity (earnings yield).”
Graphic: Retrieved from Bloomberg’s Lisa Abramowicz. “Yields on 12-month T-bills have risen to their highest since 2001. Most of this has to do with Fed rate hike expectations.”
Positioning
The SPX’s decline is orderly and contained.
However, the break below $4,000.00 SPX did open the door to a “liquidity hole,” SpotGamma explained. New information has traders anticipating more equity market downside; traders are “reset[ing] to lower equity valuations” on the higher-for-longer rate narrative all the while “vanna and gamma hedging serve to pull markets lower.”
The contexts for a far-reaching rally are weak. A change in the context is likely to coincide with charged options values (i.e., wound implied volatility or big put delta).
Technical
As of 6:30 AM ET, Thursday’s regular session (9:30 AM – 4:00 PM ET), in the S&P 500, is likely to open in the middle part of a positively skewed overnight inventory, inside of the prior day’s range, suggesting a limited potential for immediate directional opportunity.
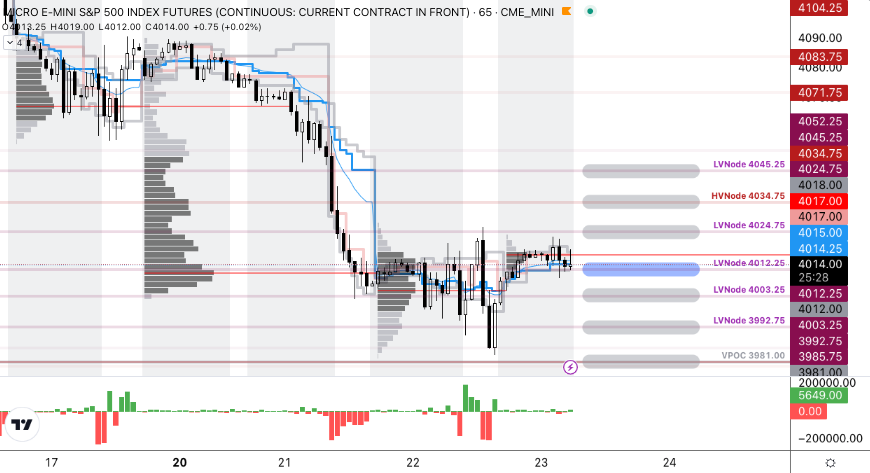
The S&P 500 (FUTURE: /MES) pivot for today is $4,012.25.
Key levels to the upside include $4,024.75, $4,034.75, and $4,045.25.
Key levels to the downside include $4,003.25, $3,992.75, and $3,981.00.
Disclaimer: Click here to load the updated key levels via the web-based TradingView platform. New links are produced daily. Quoted levels likely hold barring an exogenous development.
Graphic: 65-minute profile chart of the Micro E-mini S&P 500 Futures.
Definitions
Volume Areas: Markets will build on areas of high-volume (HVNodes). Should the market trend for a period of time, this will be identified by a low-volume area (LVNodes). The LVNodes denote directional conviction and ought to offer support on any test.
If participants auction and find acceptance in an area of a prior LVNode, then future discovery ought to be volatile and quick as participants look to the nearest HVNodes for more favorable entry or exit.
Delta: An option’s exposure to the direction or underlying asset movement.
Gamma: The sensitivity of an option’s delta to changes in the underlying asset’s price.
Vanna: The rate at which the delta of an option changes with respect to implied volatility.
POCs: Areas where two-sided trade was most prevalent in a prior day session. Participants will respond to future tests of value as they offer favorable entry and exit.
About
The author, Renato Leonard Capelj, works in finance and journalism.
Capelj spends the bulk of his time at Physik Invest, an entity through which he invests and publishes free daily analyses to thousands of subscribers. The analyses offer him and his subscribers a way to stay on the right side of the market. Separately, Capelj is an options analyst at SpotGamma and an accredited journalist.
You may view this letter’s content calendar at this link.
Disclaimer
Do not construe this newsletter as advice. All content is for informational purposes. Capelj and Physik Invest manage their own capital and will not solicit others for it.
The daily brief is a free glimpse into the prevailing fundamental and technical drivers of U.S. equity market products. Join the 300+ that read this report daily, below!
Graphic updated 7:00 AM ET. Sentiment Neutral if expected /ES open is inside of the prior day’s range. /ES levels are derived from the profile graphic at the bottom of the following section. Levels may have changed since initially quoted; click here for the latest levels. SqueezeMetrics Dark Pool Index (DIX) and Gamma (GEX) calculations are based on where the prior day’s reading falls with respect to the MAX and MIN of all occurrences available. A higher DIX is bullish. At the same time, the lower the GEX, the more (expected) volatility. Learn the implications of volatility, direction, and moneyness. Breadth reflects a reading of the prior day’s NYSE Advance/Decline indicator. VIX reflects a current reading of the CBOE Volatility Index (INDEX: VIX) from 0-100.
Fundamental
To start, thank you to the many new subscribers who joined in the past weeks. I’m honored.

Further, today we start broad (fundamental) and hone into specifics on how to act in the current trade environment (positioning), as well as potential inflection (technical) points.

I encourage you to read through to the technicals part, if possible. Have a great week!
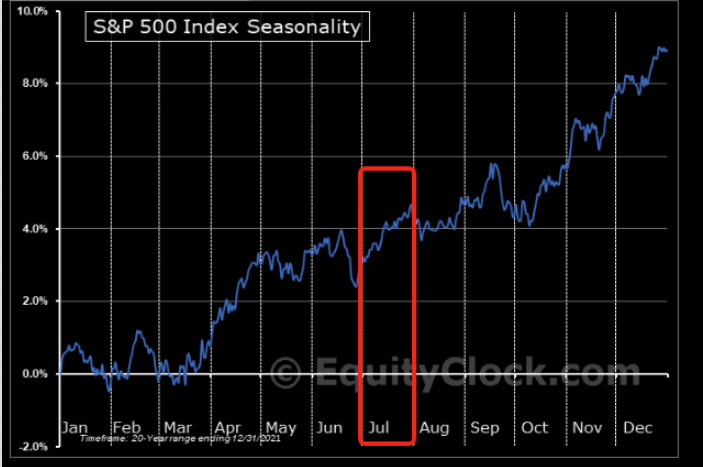
Seasonally speaking, the markets are in the midst of one of the most bullish periods of the year.
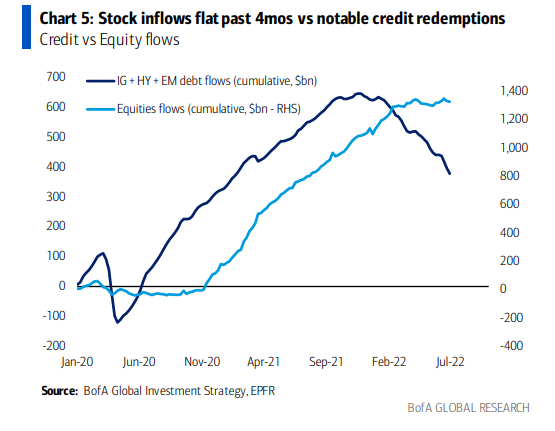
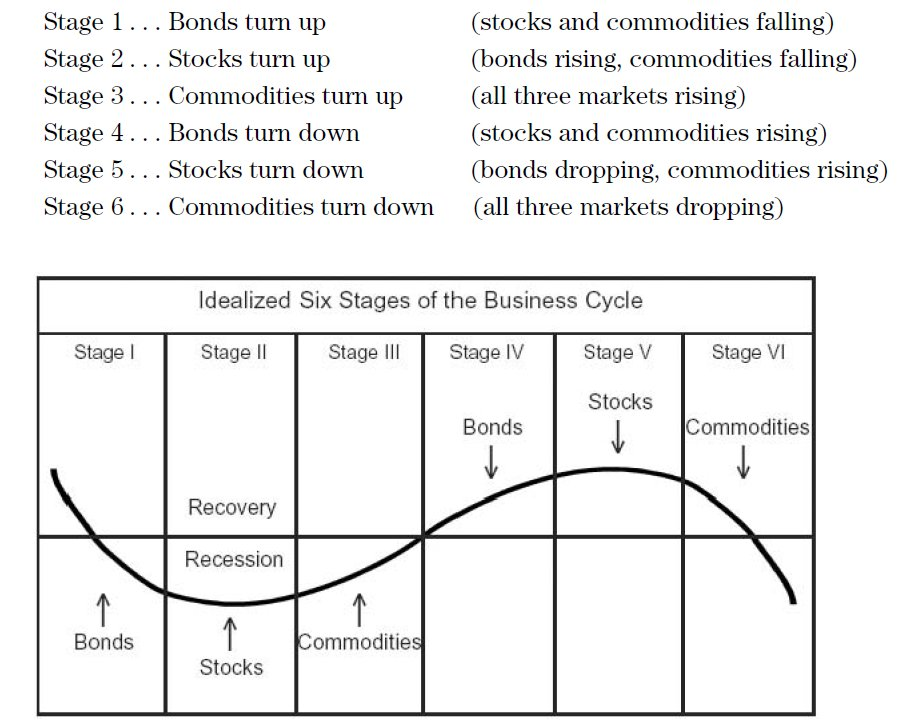
With bonds and equity products now off their swing lows and commodities off their highs (as inflation has, potentially, peaked), we have to question how much more?
Graphic: Retrieved from Goldman Sachs Group Inc (NYSE: GS).
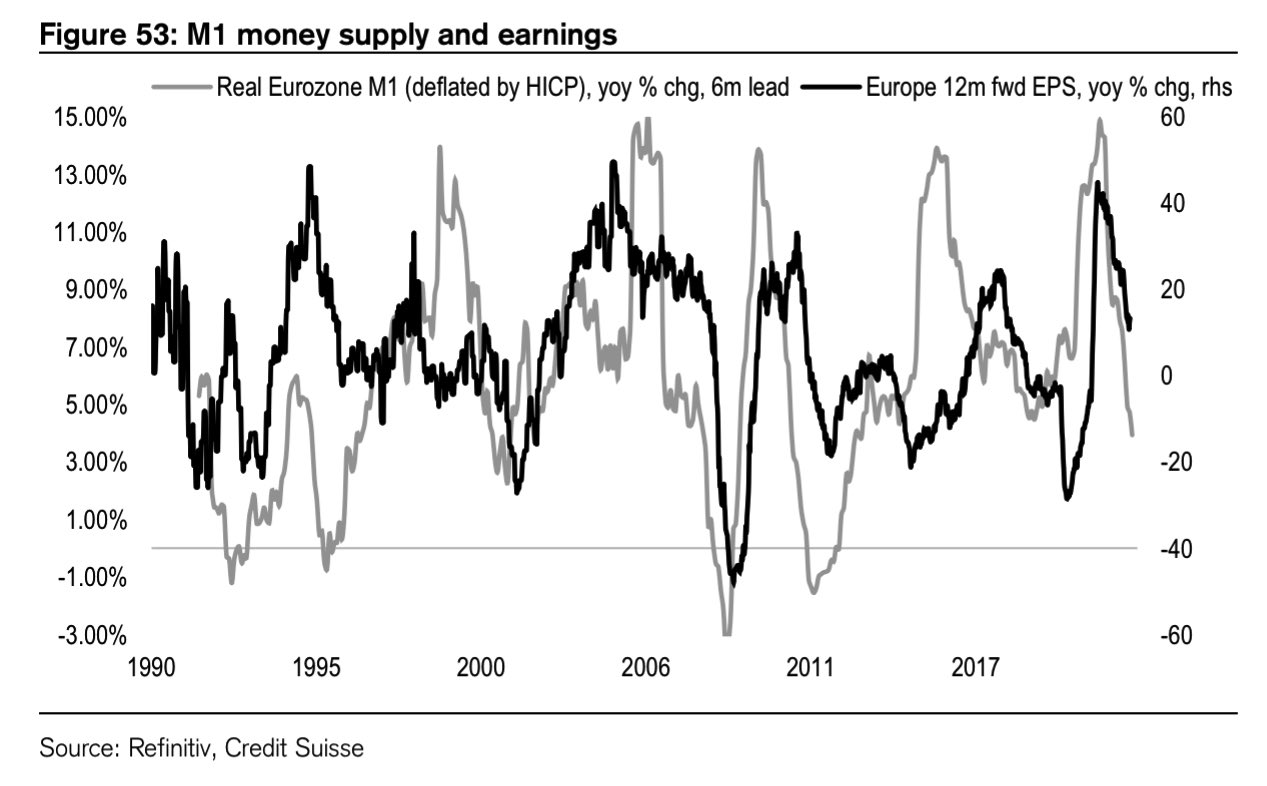
Well, thus far, and this is something we’ve talked about in the past, markets have suffered through compression in multiples. Does it stop or is there a looming earnings compression?
Graphic: Retrieved from Credit Suisse Group AG (NYSE: CS).
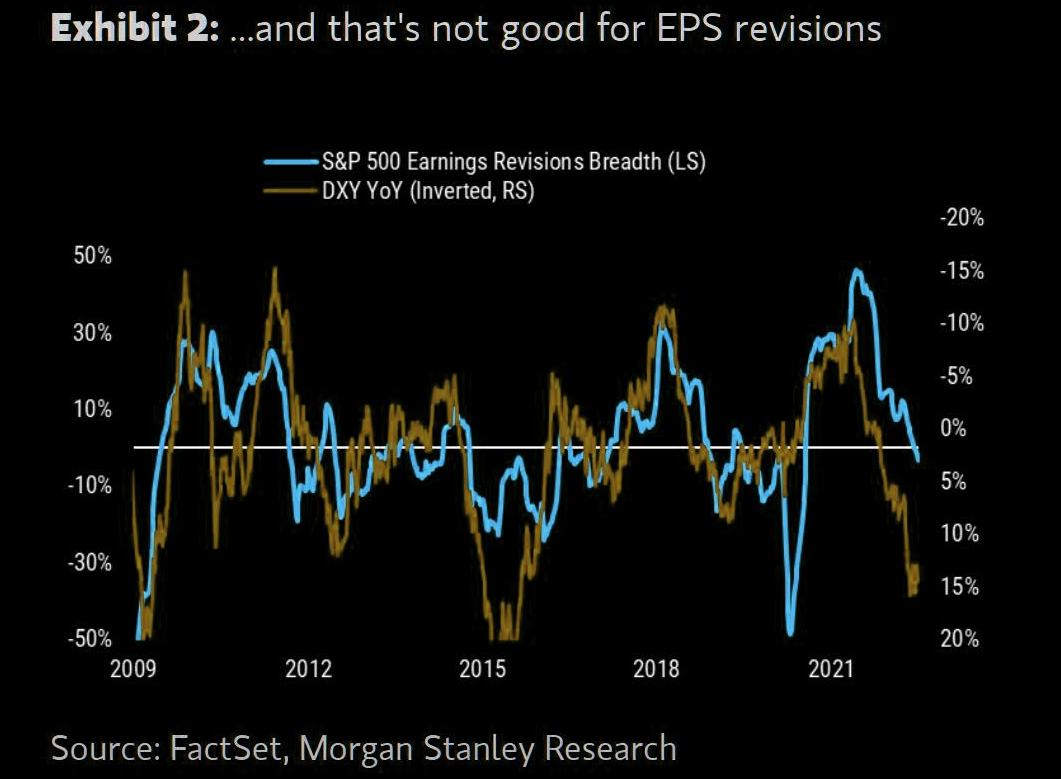
The earnings season shall shed clarity on the answer all the while – what is known – a strong dollar is sure to translate into a headwind for S&P 500 earnings growth.
Graphic: Retrieved from The Market Ear. Via Morgan Stanley (NYSE: MS) research. “The simple math on S&P 500 earnings from currency is that for every percentage point increase on a year-on-year basis it’s approximately a 0.5xhit to EPS growth. At today’s 16% year-on-year level, that translates into an 8% headwind for S&P 500 EPS growth, all else equal”
“The main point for equity investors is that this dollar strength is just another reason to think earnings revisions are coming down,” Morgan Stanley’s Mike Wilson explains.
“[T]he recent rally in stocks is likely to fizzle out before too long.”
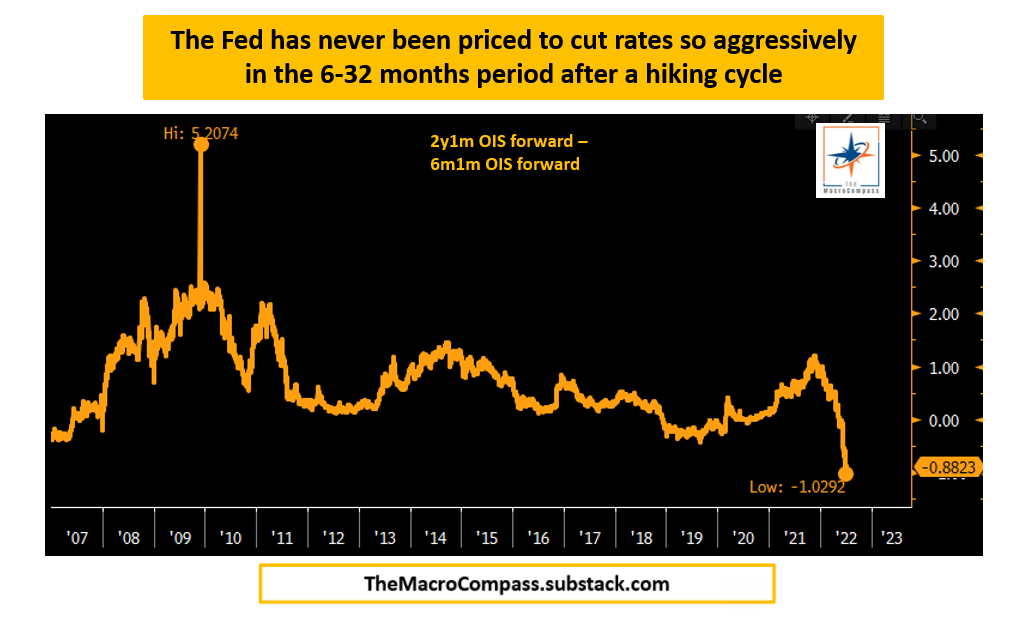
Moreover, with the impulse in credit falling, labor market showing preliminary signs of weakness, a drawdown in commodities (which is consistent with sharply lower economic growth), and bond market pricing rate cuts in early 2023, immediately following the hiking cycle, portfolios can “stay away from highly speculative assets, own USD cash and start allocating towards 5-10y+ government bonds,” as Alfonso Peccatiello explains well in his letter, The Macro Compass.
Graphic: Retrieved from The Macro Compass published by Alfonso Peccatiello.
Positioning
Calmer trade alongside easing volatility and generally rising gamma exposures. Trade, at times, was responsive. Participants would add positive (negative) delta bets into weakness (strength).
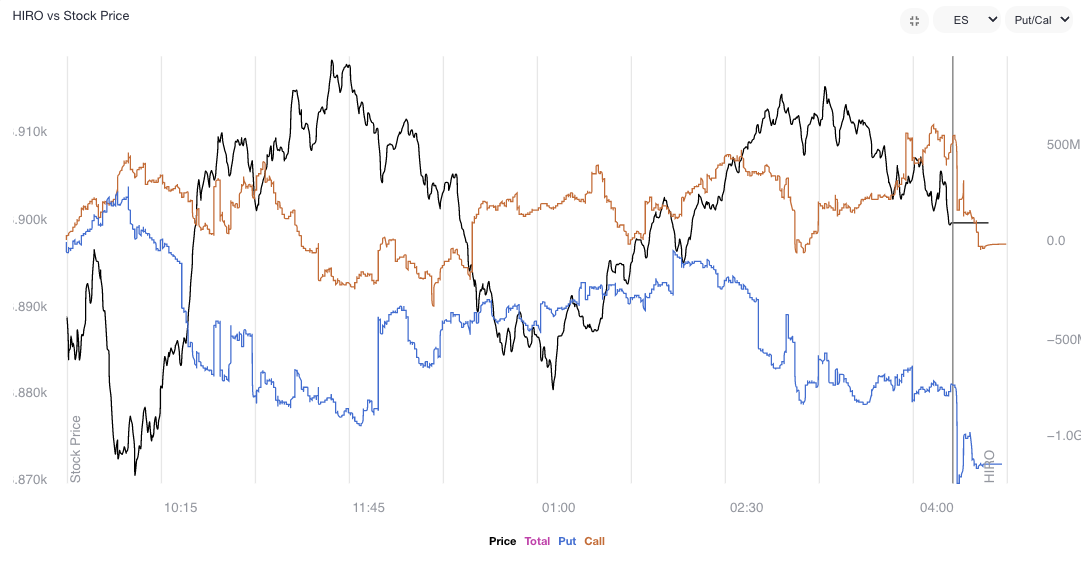
Graphic: Updated 7/8/2022. SpotGamma’s Hedging Impact of Real-Time Options (HIRO) indicator registers the sale of put (blue line) and call (orange) options.
Noteworthy is the continued sale of volatility, particularly across shorter time horizons, as well as increased demand for call options, especially in some of the larger index weights. Volatility sale, on the part of customers, leaves liquidity providers warehousing long volatility (which is kind of a naive thing to say as we’re discounting customer trades being paired off with each other).
Nonetheless, these liquidity providers’ positions, all else equal, will maintain or increase in value if underlying(s) realize volatility (especially that far in excess of implied). To hedge, rips (dips) will be sold (bought) to offset the increasing positive (negative) delta.
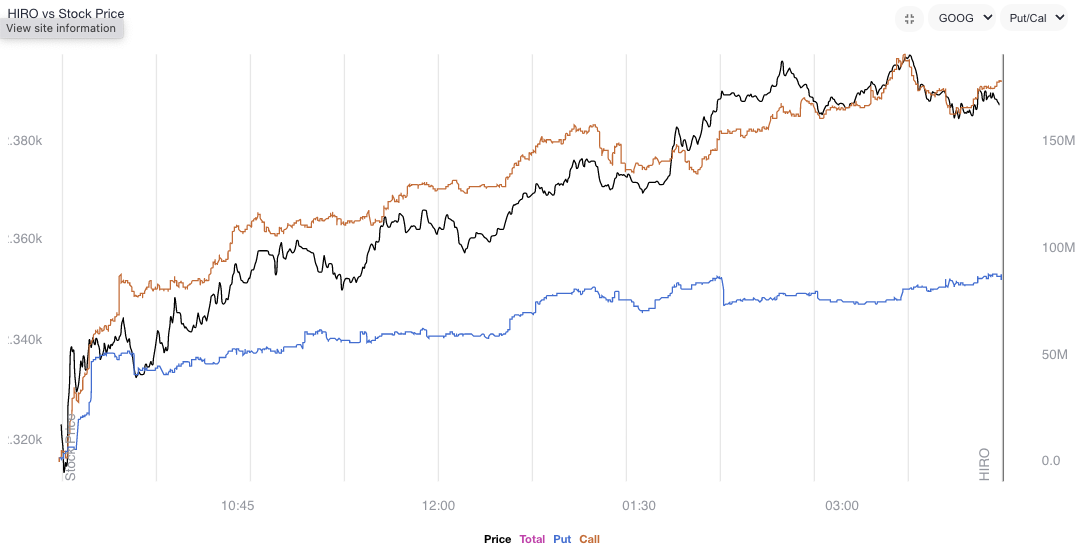
Graphic: Updated 7/7/2022. SpotGamma’s HIRO indicator for Alphabet Inc (NASDAQ: GOOG) (NASDAQ: GOOGL). Rising orange and blue lines point to call buying and put selling, both of which have bullish implications.
Moreover, this trend in volatility supply is in part on the loss of interest in “leveraged long S&P” trades, as well as “marginal demand for puts,” as SqueezeMetrics has stated, before.
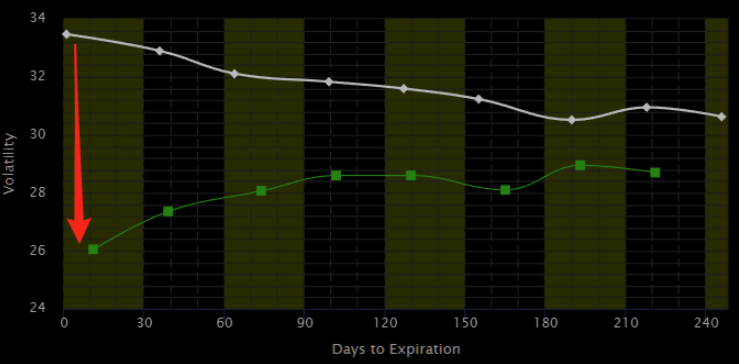
Graphic: Retrieved from The Market Ear. Originally sourced via VIX Central. “Chart shows the VIX term structure ‘crash’ since June 13, which was the most recent VIX peak. The curve is now back to normal with the short end of the curve ‘much’ lower than longer-term maturities. Let’s see how far down they ‘press’ this.”
“Creeping into net selling territory is ‘smart’ bear market positioning. Short delta, short skew.”
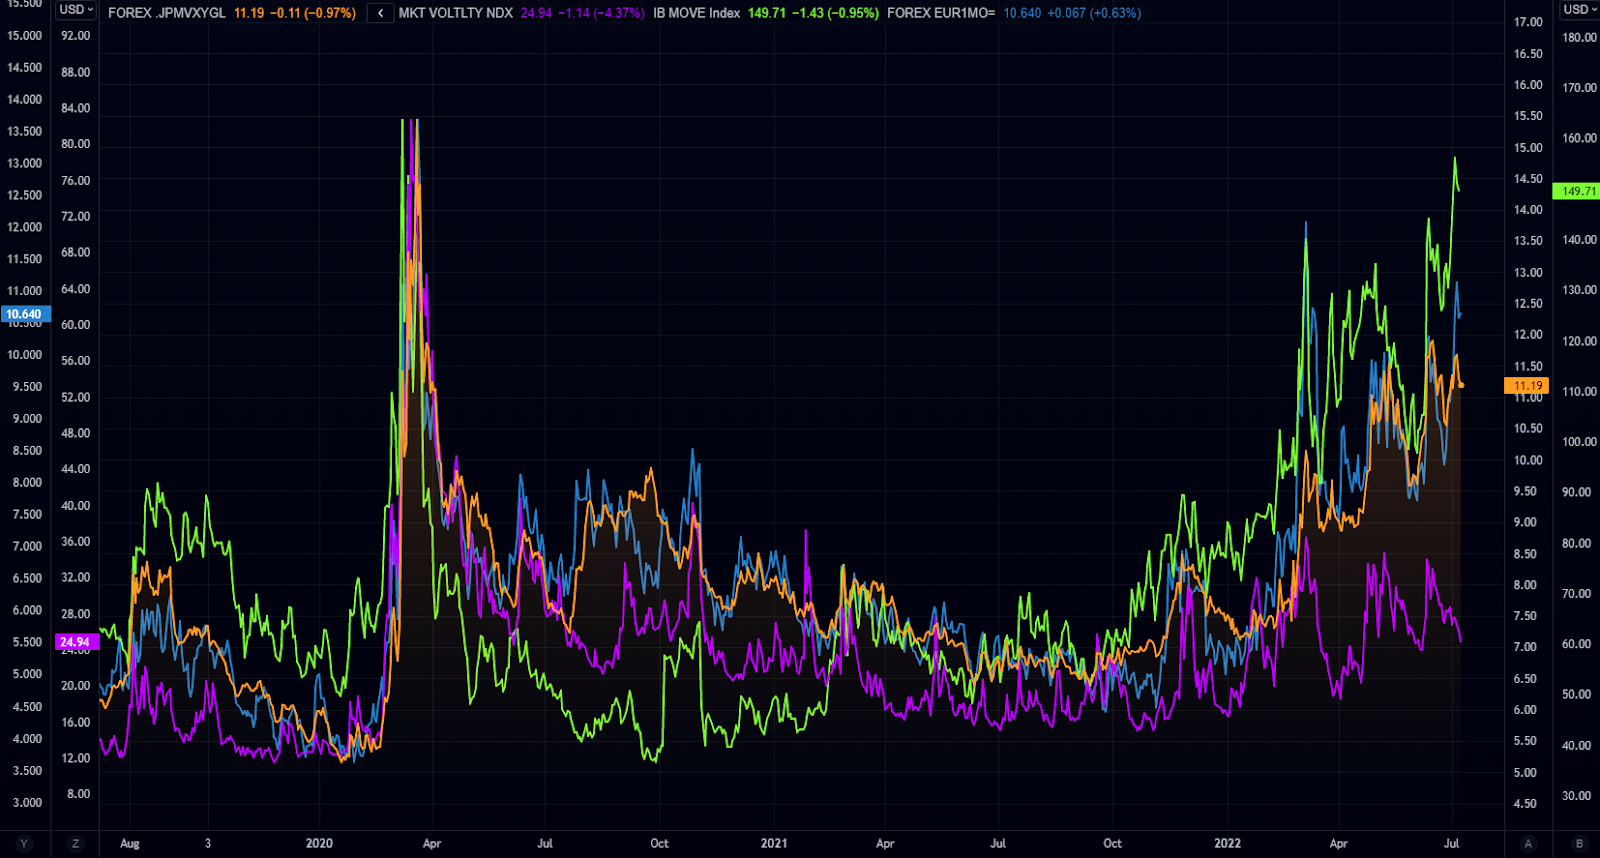
Graphic: Retrieved from The Market Ear. “VIX has decoupled from cross-asset volatilities.”
Accordingly, the volatility markets have realized (RVOL) has crept (and exceeded, at times) the volatility implied (IVOL).
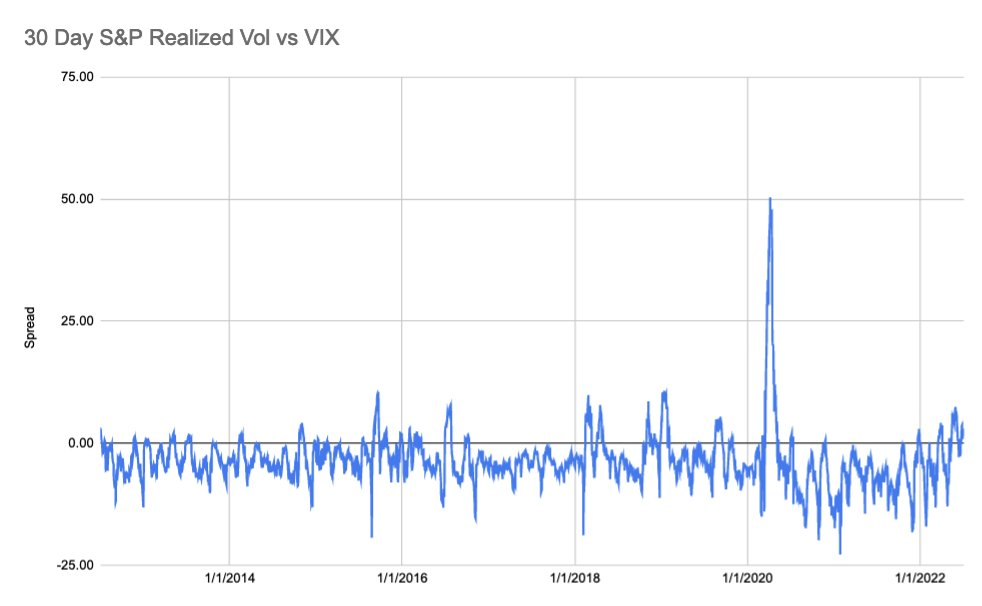
Graphic: Via S&P Global. As explained by SpotGamma, “30-day realized SPX volatility is now trading above the VIX, something that generally shows after major selloffs wherein IV “premium” needs to reset to calmer/higher equity markets.”
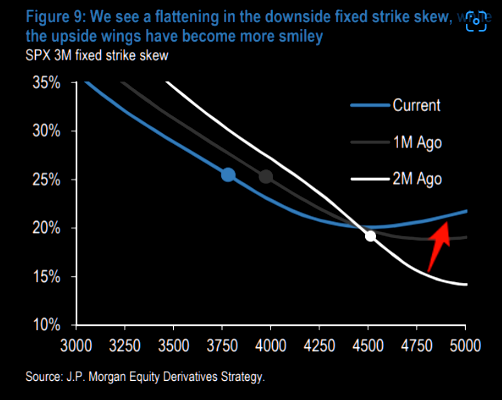
This, coupled with “a flattening in the downside fixed strike skew, while the upside wings [are] more smiley,” as described by JPMorgan Chase & Co (NYSE: JPM), has made for attractive low-cost spread opportunities, as talked about in the July 8, 2022 letter.
Graphic: Via JPMorgan Chase & Co (NYSE: JPM). Taken from The Market Ear.
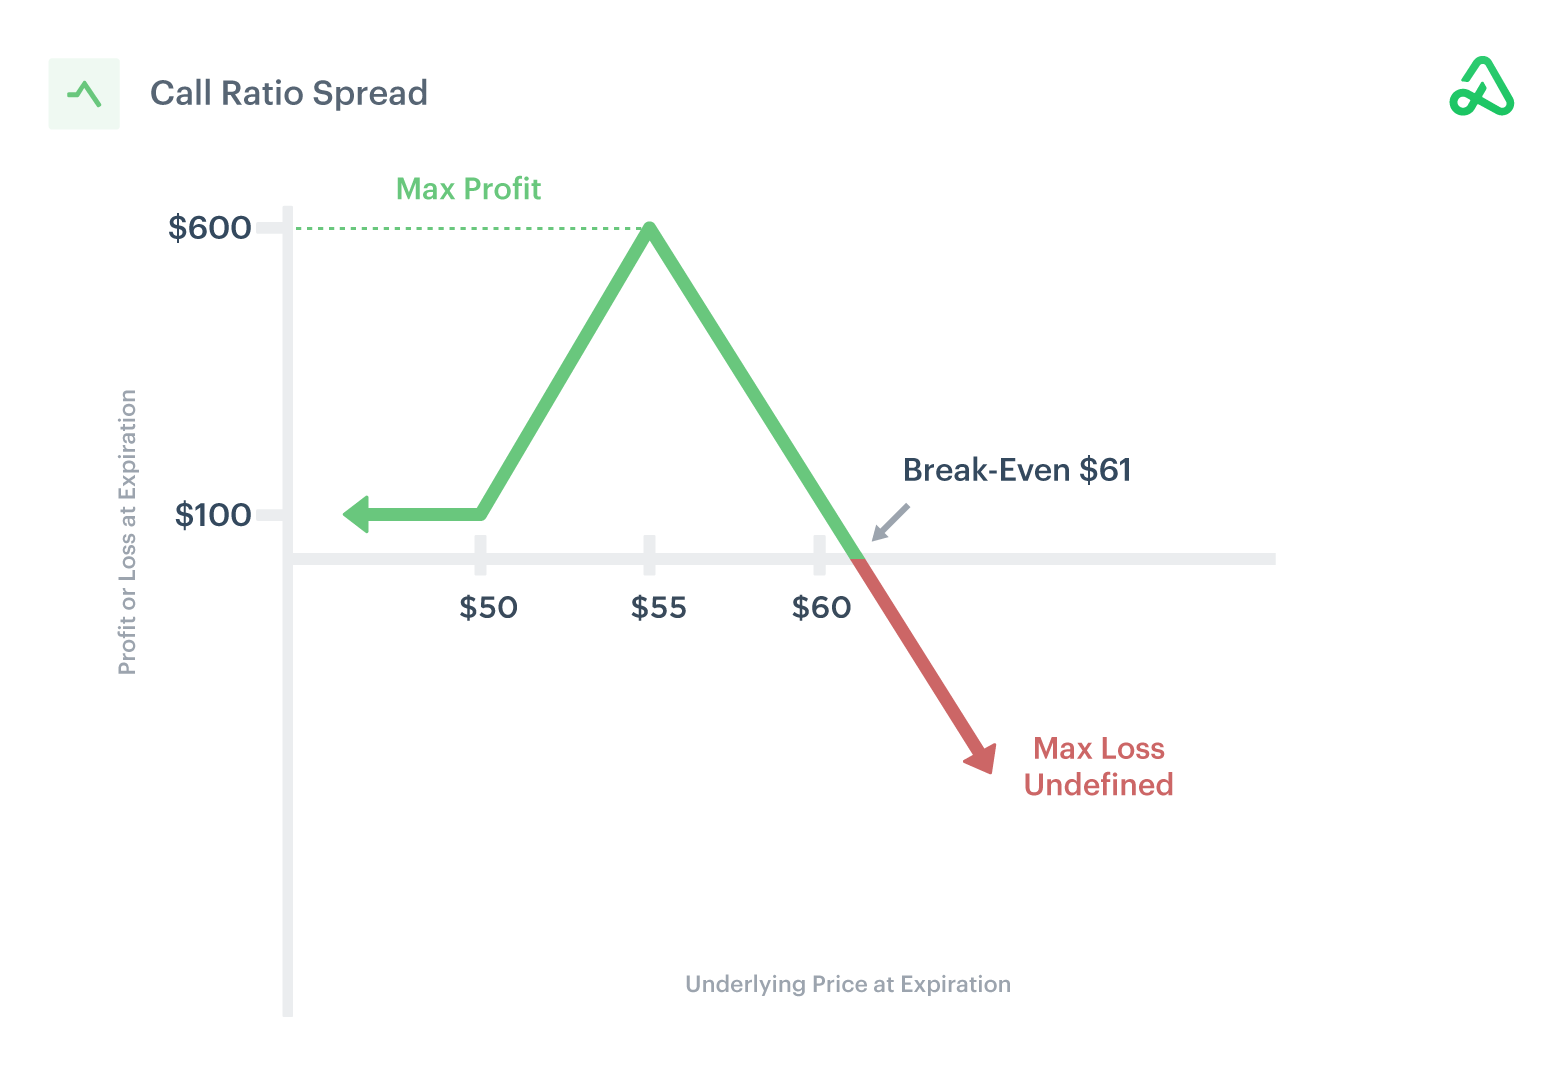
For instance, as discussed Friday, ratio spreads continue to work well for low- or no-cost exposure to the upside.
Pursuant to those remarks, no-cost spreads this letter’s writer has structured in Alphabet Inc (NASDAQ: GOOG) (NASDAQ: GOOGL) are pricing hundreds of dollars in credit to close.
Graphic: Via Charles Schwab Corporation-owned (NYSE: SCHW) TD Ameritrade’s Thinkorswim.
Obviously, there’s no mention, here, of the risk management (e.g., sizing and width) involved. Again, this is as I’m trying to give actionable info without providing explicit recommendations.
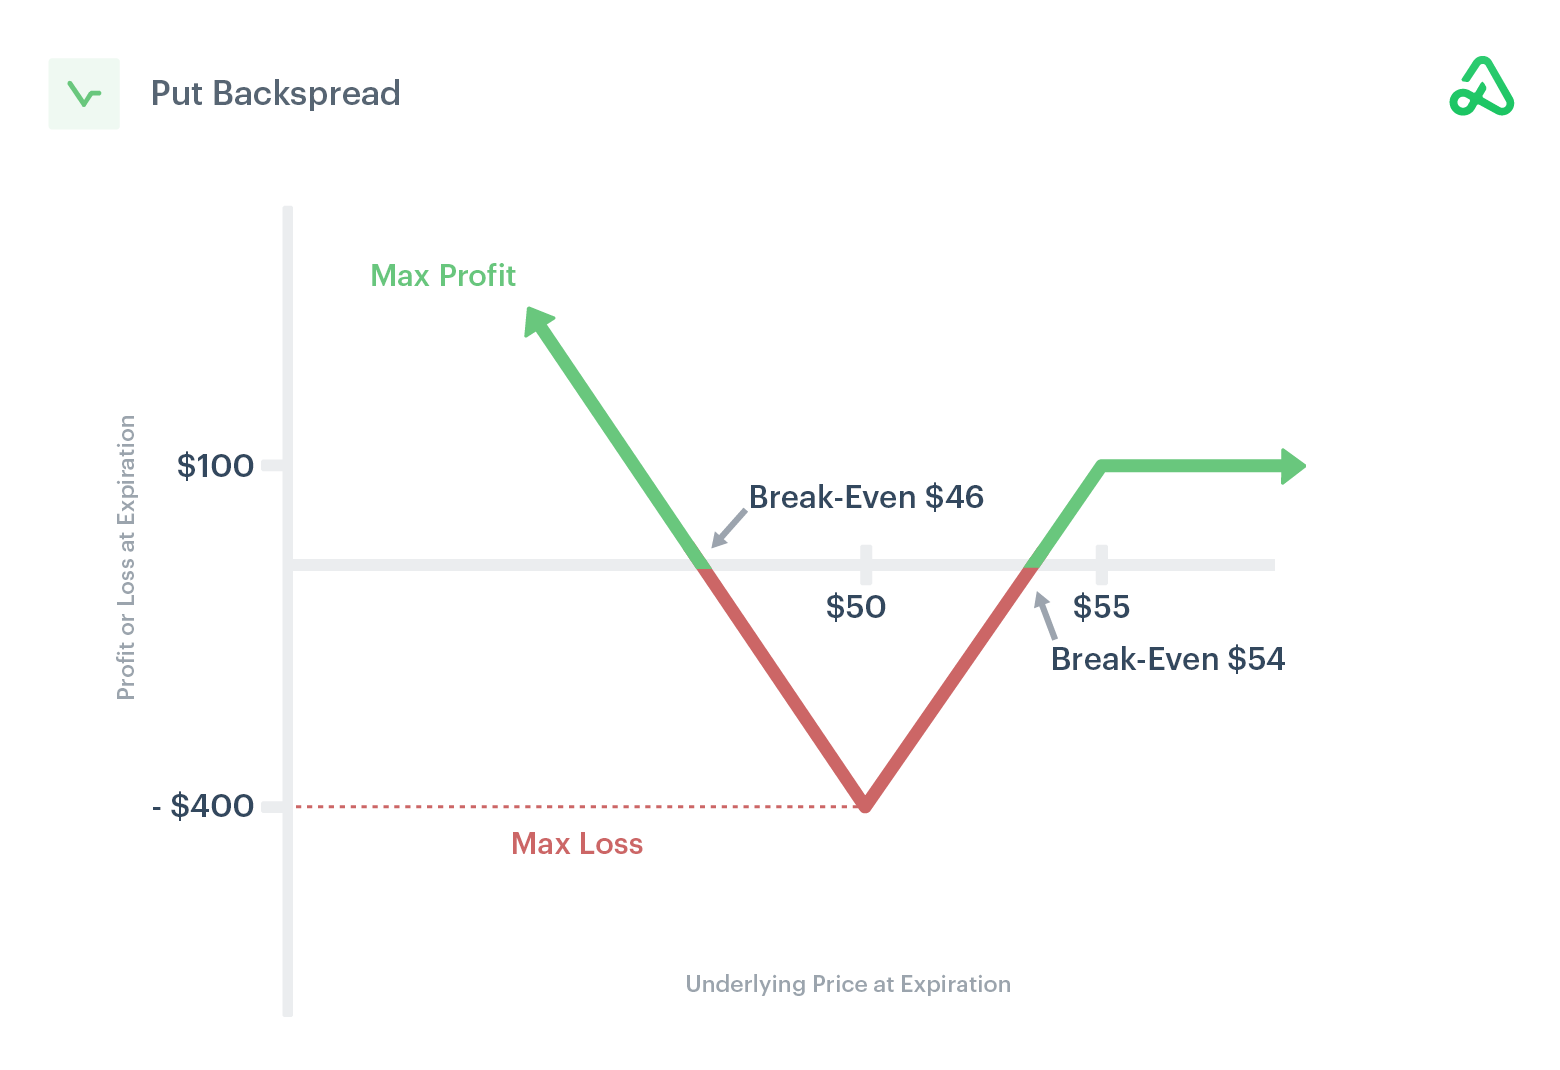
Similarly, if one thought volatility, though at a high starting point particularly at the money (ATM), was due for a repricing, they would look for exposure to the downside via something such as an inverse ratio (or back spread), as said last week.
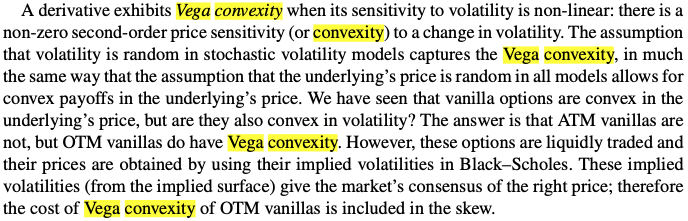
This is as the ATMs, unlike those further out of the money (OTM), are less convex in vega.
Graphic: Via Mohamed Bouzoubaa et al’s Exotic Options and Hybrids.
Technical
As of 7:00 AM ET, Monday’s regular session (9:30 AM – 4:00 PM ET), in the S&P 500, is likely to open in the middle-to-lower part of a negatively skewed overnight inventory, inside of prior-range and -value, suggesting a limited potential for immediate directional opportunity.
In the best case, the S&P 500 trades higher.
Any activity above the $3,867.25 LVNode puts into play the $3,909.25 MCPOC. Initiative trade beyond the MCPOC could reach as high as the $3,943.25 HVNode and $3,982.75 LVNode, or higher.
In the worst case, the S&P 500 trades lower.
Any activity below the $3,867.25 LVNode puts into play the $3,831.00 VPOC. Initiative trade beyond the VPOC could reach as low as the $3,800.25 LVNode and $3,755.00 VPOC, or lower.
Click here to load today’s key levels into the web-based TradingView charting platform. Note that all levels are derived using the 65-minute timeframe. New links are produced, daily.
Graphic: 65-minute profile chart of the Micro E-mini S&P 500 Futures.
Considerations: Responsiveness near key-technical areas (that are discernable visually on a chart), suggests technically-driven traders with short time horizons are very active.
Such traders often lack the wherewithal to defend retests and, additionally, the type of trade may be indicative of the other time frame participants waiting for more information to initiate trades.
Example: The below 65-minute S&P 500 chart with volume profiles was included in the July 8, 2022 edition of the newsletter. Prices were near an inflection (micro-composite point of control and two key volume-weighted average price levels). From thereon, selling surfaced.This is what is meant by responsiveness near key-technical areas.
Graphic: Updated 7/2/22. 65-minute profile chart of the Micro E-mini S&P 500 Futures.
Definitions
Volume Areas: A structurally sound market will build on areas of high volume (HVNodes). Should the market trend for long periods of time, it will lack sound structure, identified as low volume areas (LVNodes). LVNodes denote directional conviction and ought to offer support on any test.
If participants were to auction and find acceptance into areas of prior low volume (LVNodes), then future discovery ought to be volatile and quick as participants look to HVNodes for favorable entry or exit.
POCs: POCs are valuable as they denote areas where two-sided trade was most prevalent in a prior day session. Participants will respond to future tests of value as they offer favorable entry and exit.
MCPOCs: POCs are valuable as they denote areas where two-sided trade was most prevalent over numerous day sessions. Participants will respond to future tests of value as they offer favorable entry and exit.
Volume-Weighted Average Prices (VWAPs): A metric highly regarded by chief investment officers, among other participants, for quality of trade. Additionally, liquidity algorithms are benchmarked and programmed to buy and sell around VWAPs.
About
After years of self-education, strategy development, mentorship, and trial-and-error, Renato Leonard Capelj began trading full-time and founded Physik Invest to detail his methods, research, and performance in the markets.
Capelj also develops insights around impactful options market dynamics at SpotGamma and is a Benzinga reporter.
In no way should the materials herein be construed as advice. Derivatives carry a substantial risk of loss. All content is for informational purposes only.
Editor’s Note: The Daily Brief is a free glimpse into the prevailing fundamental and technical drivers of U.S. equity market products. Join the 200+ that read this report daily, below!
A lot to unpack, today. Part of the newsletter may be cut off, as a result, in your inbox. Just click to view in another window.
Overnight, equity index futures auctioned sideways-to-higher, masking turmoil in products listed abroad, as well as commodities and fixed income.
In regards to bonds, they slumped (globally) in light of participants’ pricing in monetary action given heightened inflation. The Federal Reserve, Bank of England, and Bank of Japan are to issue policy updates this week.
Commodity markets are still roiling after a price spike in some products “created a systemic risk” that prompted exchanges to cancel trades, while equity markets in Asia saw their worst-selling in years.
The Hang Seng China Enterprises Index (INDEX: HSCEI) closed down 7.2%, the biggest drop since 2008. This was after Russia asked for China’s assistance in Ukraine (which could result, later, in sanctions from the U.S.), thus compounding uncertainties with respect to an ongoing regulatory crackdown.
Ahead is data on 1- and 3-year inflation expectations (11:00 AM ET).
Graphic updated 6:11 AM ET. Sentiment Neutral if expected /ES open is inside of the prior day’s range. /ES levels are derived from the profile graphic at the bottom of the following section. Levels may have changed since initially quoted; click here for the latest levels. SqueezeMetrics Dark Pool Index (DIX) and Gamma (GEX) calculations are based on where the prior day’s reading falls with respect to the MAX and MIN of all occurrences available. A higher DIX is bullish. At the same time, the lower the GEX, the more (expected) volatility. Learn the implications of volatility, direction, and moneyness. SHIFT data used for S&P 500 (INDEX: SPX) options activity. Note that options flow is sorted by the call premium spent; if more positive, then more was spent on call options. Breadth reflects a reading of the prior day’s NYSE Advance/Decline indicator. VIX reflects a current reading of the CBOE Volatility Index (INDEX: VIX) from 0-100.
What To Expect
Fundamental: We may attribute participants’ uncertainty to how far monetary policymakers want to tighten, slower economic growth, the implications of geopolitical tensions, imminent Russian defaults, a resurgence in COVID-19 abroad, and more.
Graphic: Via Bloomberg. As Treasury yields rise, participants price in Fed tightening.
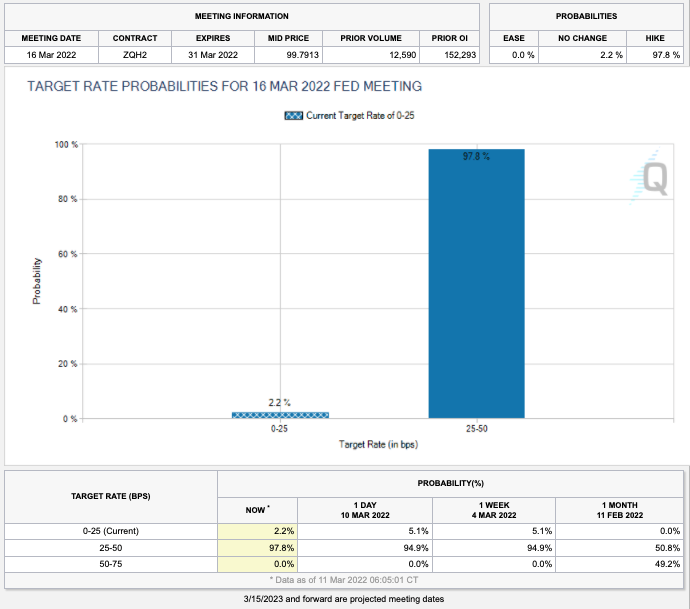
As revealed by metrics like CME Group Inc’s (NASDAQ: CME) FedWatch Tool, for instance, participants are pricing a high certainty of an increase in rates.
Graphic: Via CME Group Inc (NASDAQ: CME). Participants price in an increased probability of a shift in the target rate. Click here to access the FedWatch Tool.
“Yields are reflecting a surprise higher shift upward in inflation expectations,” said Morgan Stanley’s (NYSE: MS) Jim Caron. “Many thought inflation would peak in the first quarter and fall. Now, with oil prices, inflation may stay high.”
At the same time, there are some indications of market stresses.
Graphic: Via McClellan Financial Publications. “The Daily A-D Line for corporate high yield bonds continues to look quite ugly. That is a concern for the overall stock market because high yield bonds drink from the same liquidity pool as stocks do, and these bonds are arguably more sensitive than stocks are to liquidity problems.”
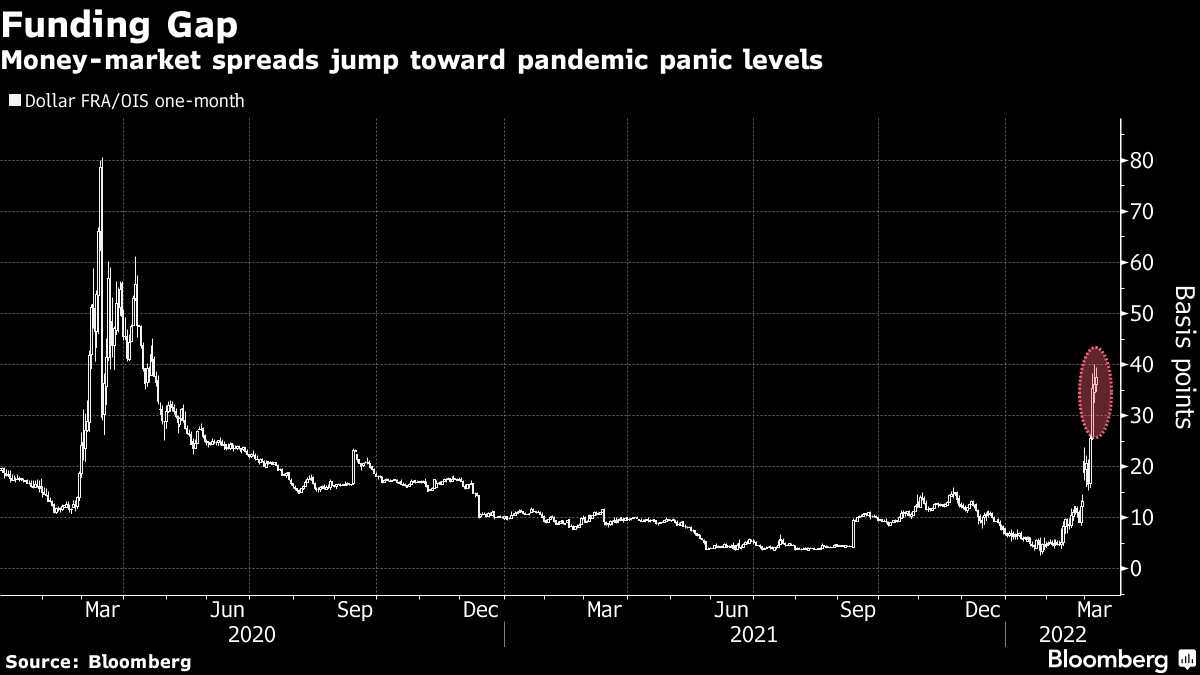
As explained in DC’s Chartbook discussion, however, “stress in money markets is for now mostly contained and not an imminent risk to financial sustainability.”
Graphic: Via DC’s Chartbook. Funding spreads “have stabilized over the past week, not making new highs after the gap-up open on March 7. These are encouraging signs that the stress in money markets is for now mostly contained and not an imminent risk to financial stability.”
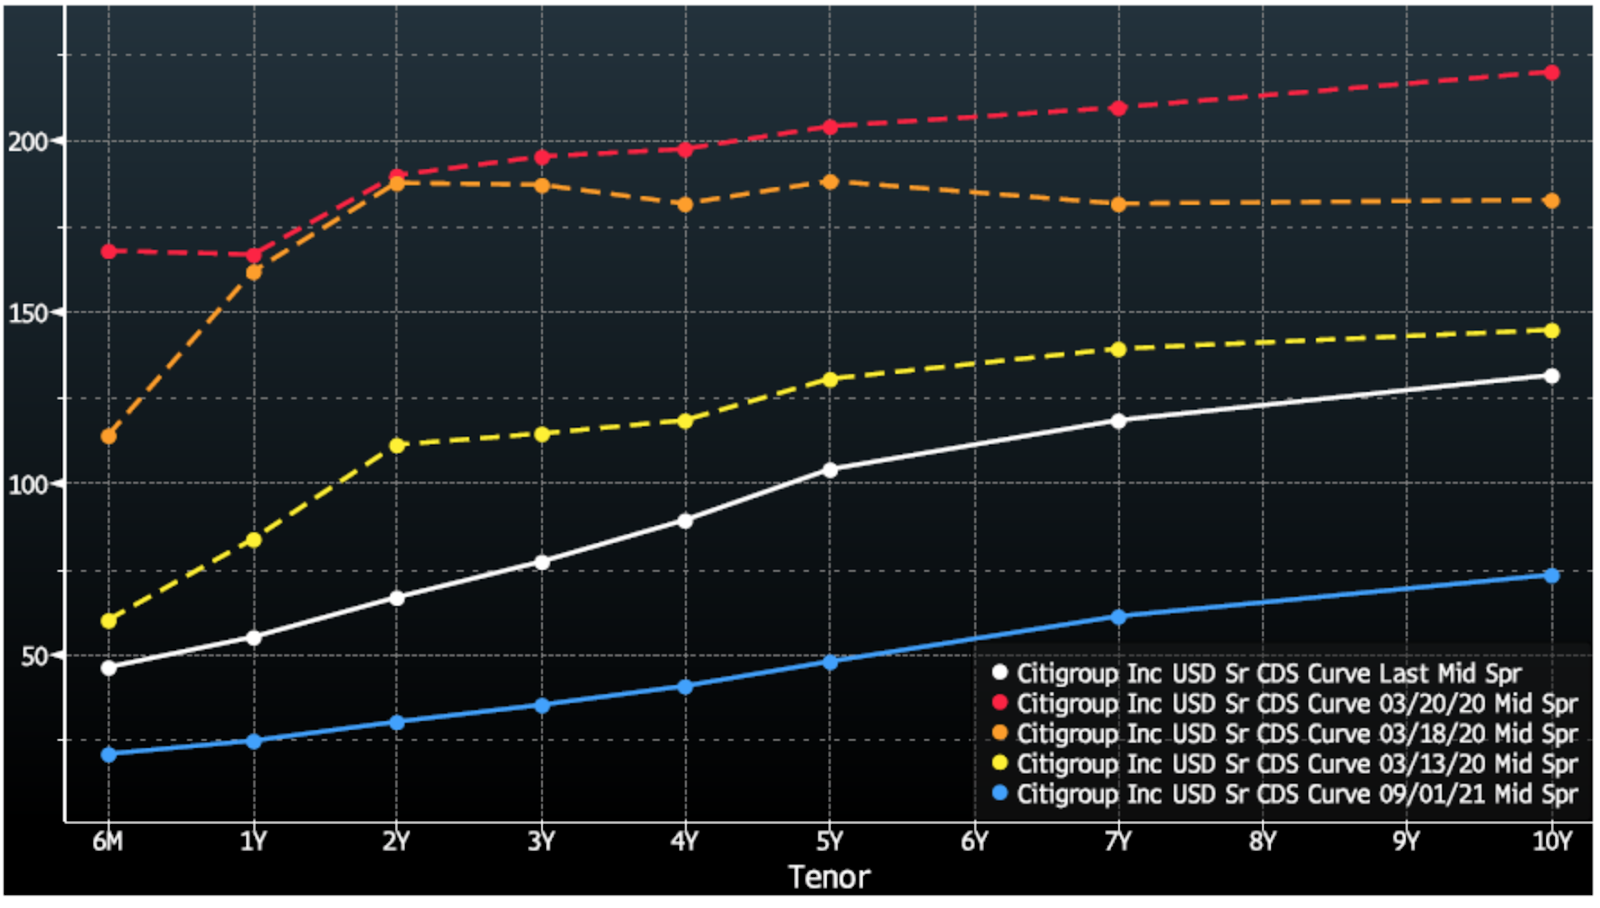
In regards to credit default swap spreads, though they are wider than in recent history, “they are still far below where they were during times of material solvency risk such as March of 2020, and the term structure of CDS spreads suggests this is more due to mechanical de-risking.”
Graphic: Via DC’s Chartbook. Cost of credit insurance for Citigroup Inc (NYSE: C). Hedging with CDS results in mechanical steepening which raises the curve. “This is in sharp contrast to the curve in March 2020 (yellow, orange, and red), when the short end of the CDS curve rose quickly and flattened the curve.”
Okay. So, the “financial system is functioning smoothly.” How do you trade slowing growth in the face of heightened inflation?
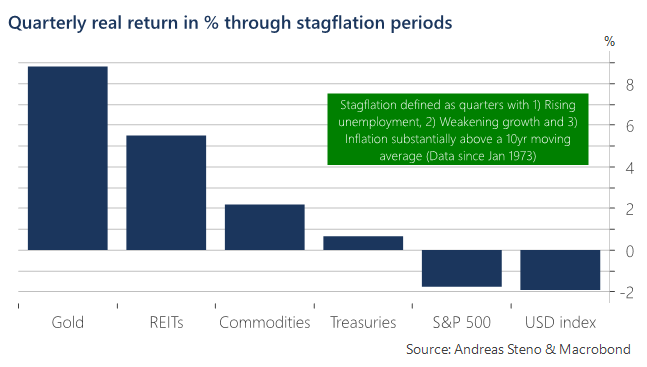
As Andreas Steno Larsen of Heimstaden explains, the “best way to assess this question is via a historical study of empirical returns during times of actual stagflation dating back to the early 1970s.”
Graphic: Via Andreas Steno Larsen. “Heatmap on quarterly inflation-adjusted returns across asset classes during stagflation periods (1973 – today).”
“Assets that tend to keep the value intact or even increase in real terms through stagflation are typically negatively correlated to low or negative real rates, which is why gold and real estate (REITs) are some of the best places to hide during stagflation,” Steno Larsen says.
“Equities overall struggle to perform in real terms and so do bonds, which might be even worse this time around due to the outset of bond yields into this potential stagflationary environment.”
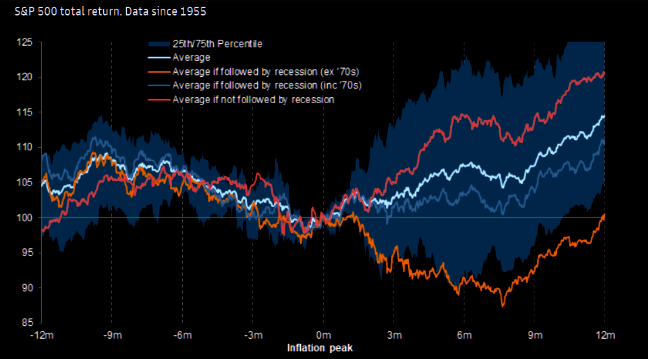
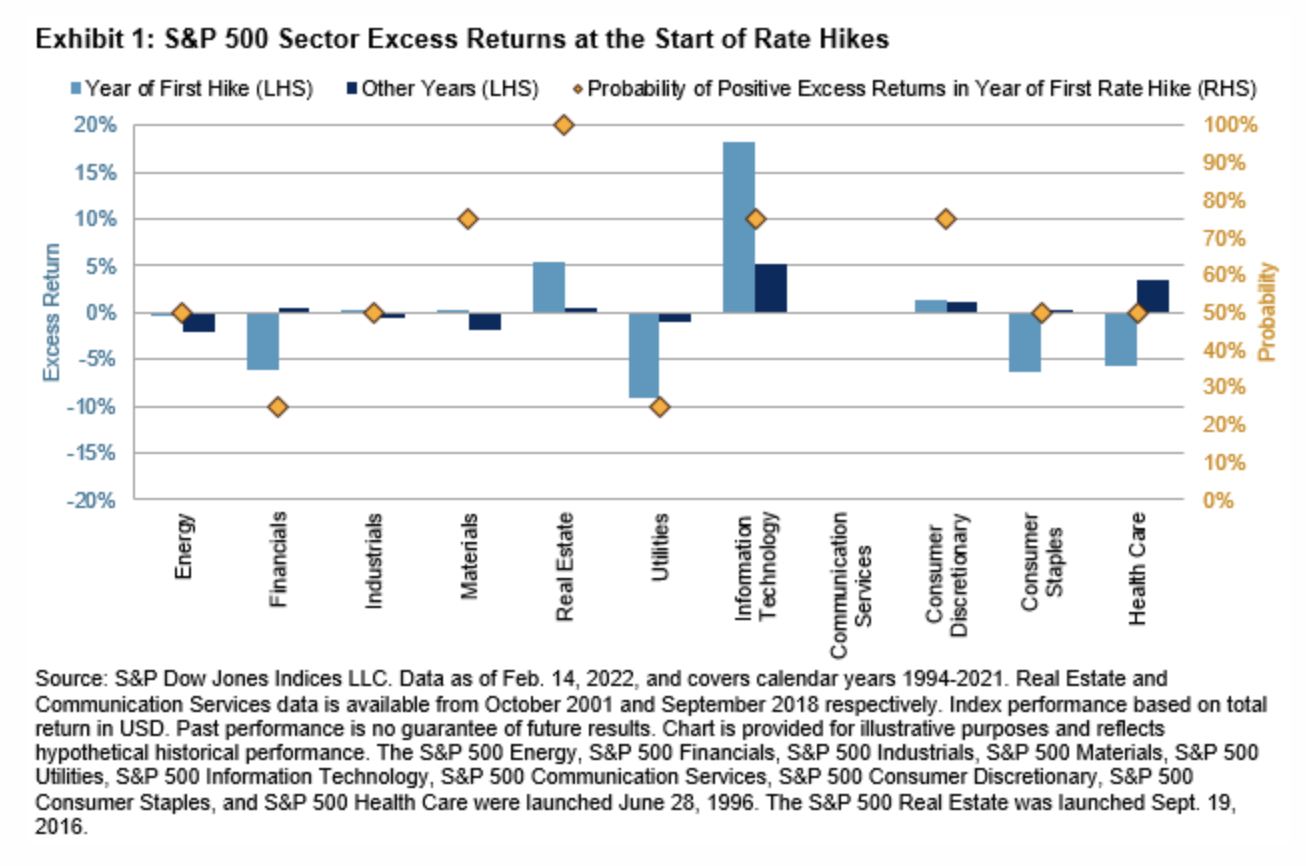
To note, pursuant to the idea that participants have “priced in” the aforementioned, S&P Global Inc (NYSE: SPGI) data suggests “the initial stages of a monetary tightening cycle have not been disastrous for the U.S. stock market historically.”
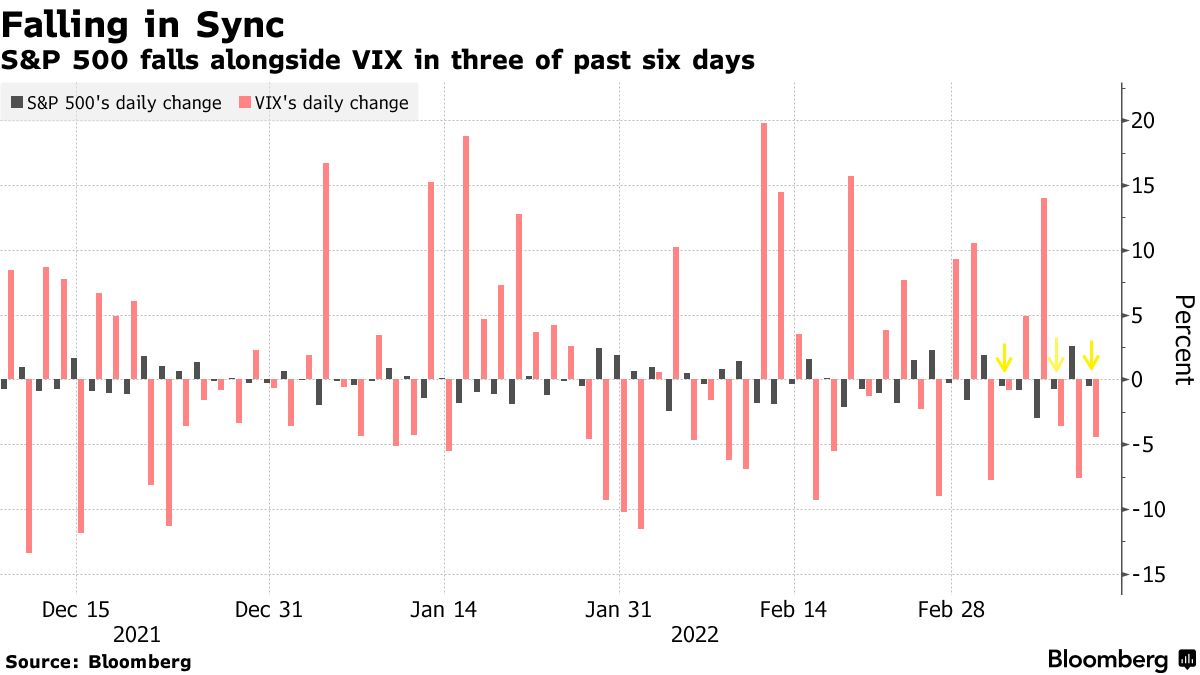
Positioning: Based on a comparison of present options positioning and buying metrics, the returns distribution is skewed positive.
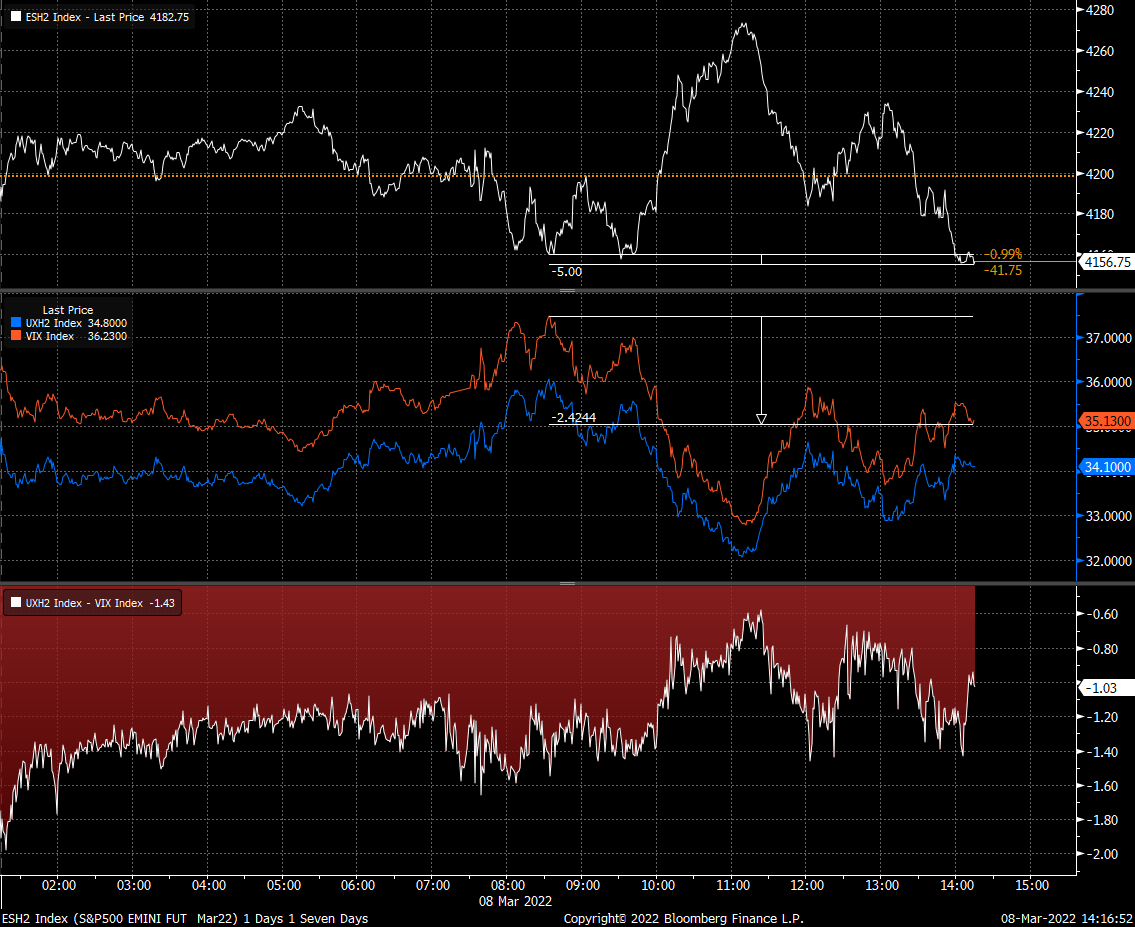
This is in the face of an S&P 500 (INDEX: SPX) and Cboe Volatility Index (INDEX: VIX) down environment.
Graphic: Via Bloomberg. S&P 500 (INDEX: SPX) down, CBOE Volatility Index (INDEX: VIX) down.
In part, this has to do with the supply and demand of protection; mainly, the market is “well hedged and well-positioned,” Amy Wu Silverman of Royal Bank of Canada’s (NYSE: RY) says.
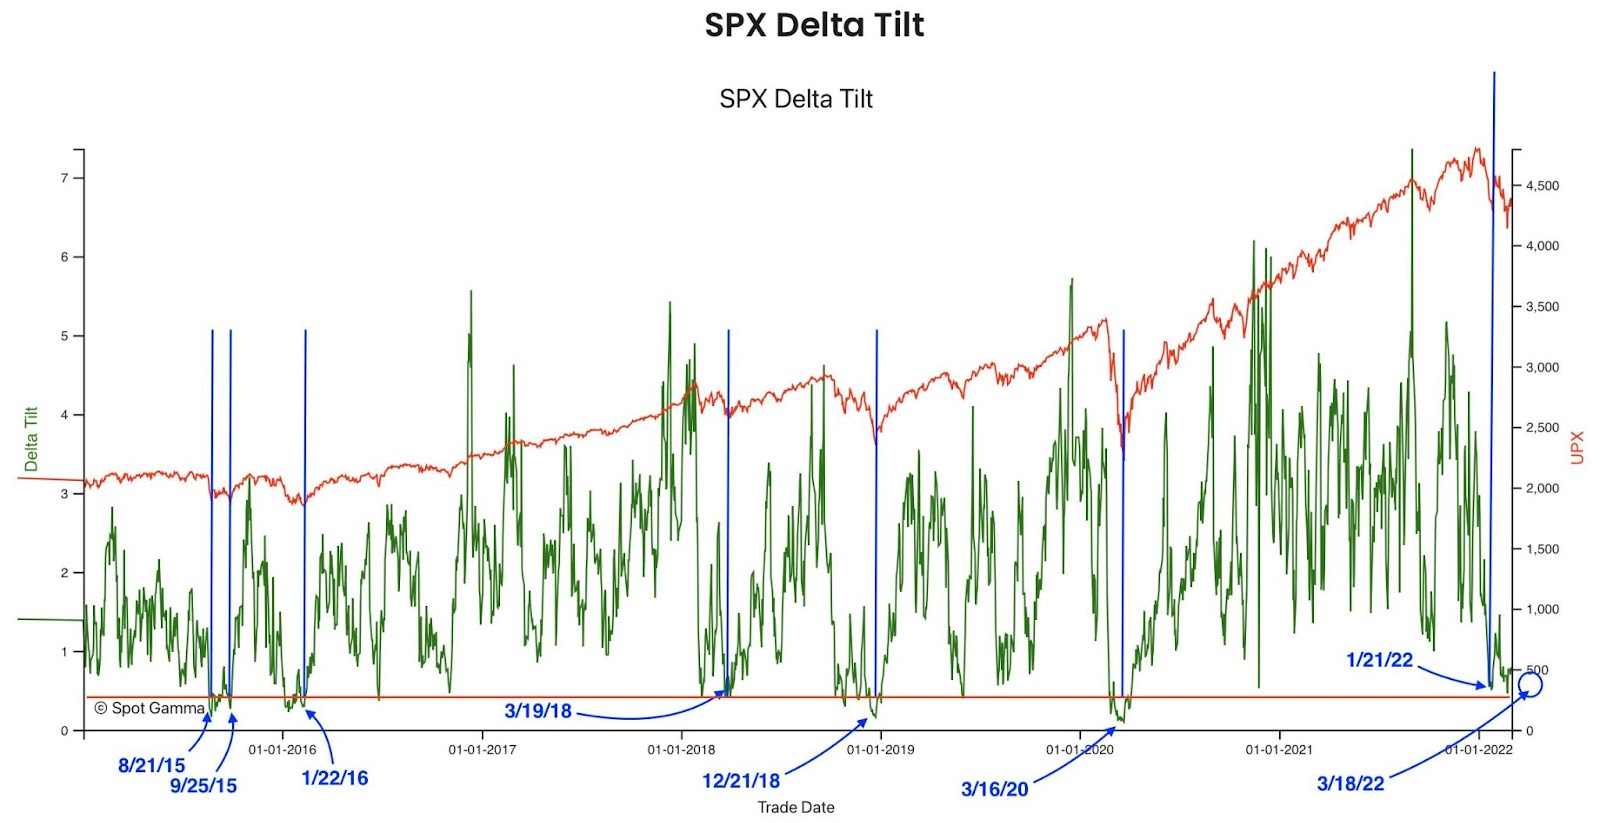
Graphic: Via SpotGamma. “Netting call & put delta, you can see we’re near extremes in terms of put:call positions. Often large put positions are removed by expirations, which seems to coincide with market lows. Many of these are quarterly expirations which coincide w/FOMC meetings – such as next week.”
Given this, as JPMorgan Chase & Co (NYSE: JPM) analysts explain, “we could be closer to the end” of discretionary de-risking, and the compression of volatility (via passage of FOMC), as well as the removal of counterparty negative exposure (via OPEX) may serve to alleviate pressure.
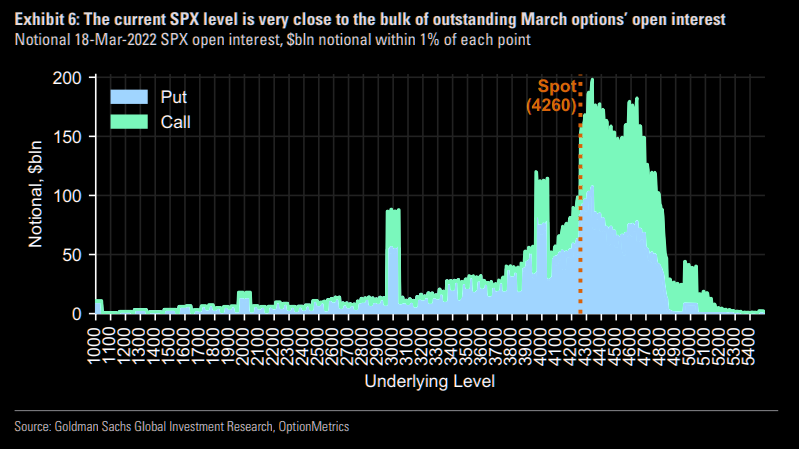
Graphic: Via Goldman Sachs Group Inc (NYSE: GS). Taken from The Market Ear. “18-Mar has more expiring near-the-money SPX open interest than any expiration since 2019.”
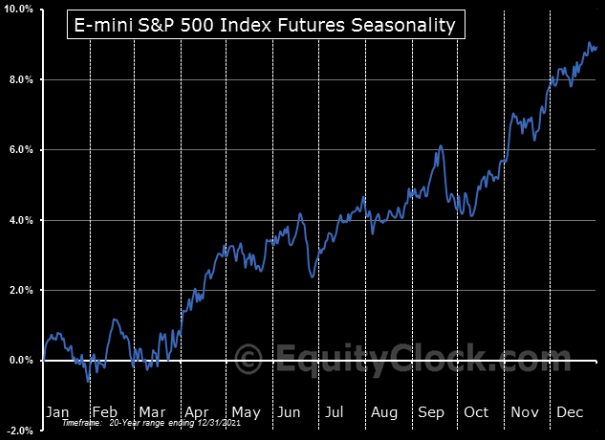
As SpotGamma, explains, “As it stands, without further geopolitical events causing, even more, fear, the markets are due for a relief rally,” on improving seasonality, among other things.
“Following the FOMC meeting, as well as the reduction in put-heavy exposures post-OPEX (options expiration), the need for put ownership (protection) and relative short positions is reduced (less positive delta = less selling to hedge = less pressure).”
Graphic: Via EquityClock. Taken from The Market Ear.
Technical: As of 6:30 AM ET, Monday’s regular session (9:30 AM – 4:00 PM ET), in the S&P 500, will likely open in the middle part of a positively skewed overnight inventory, inside of prior-range and -value, suggesting a limited potential for immediate directional opportunity.
In the best case, the S&P 500 trades higher; activity above the $4,227.75 high volume area (HVNode) puts in play the $4,249.25 low volume area (LVNode). Initiative trade beyond the LVNode could reach as high as the $4,285.25 and $4,314.75 HVNode, or higher.
In the worst case, the S&P 500 trades lower; activity below the $4,227.75 HVNode puts in play the $4,189.00 regular trade low (RTH Low). Initiative trade beyond the RTH Low could reach as low as the $4,138.75 and $4,101.25 overnight low (ONL), or lower.
Considerations: Participants resolve a pinch of two anchored volume-weighted average price indicators (VWAPs). A VWAP is a metric highly regarded by chief investment officers, among other participants, for quality of trade. Additionally, liquidity algorithms are benchmarked and programmed to buy and sell around VWAPs.
We look to buy above a flat/rising VWAP pinch. We look to sell below a flat/declining VWAP pinch.
Click here to load today’s key levels into the web-based TradingView charting platform. Note that all levels are derived using the 65-minute timeframe. New links are produced, daily.
Graphic: 65-minute profile chart of the Micro E-mini S&P 500 Futures.
Definitions
Overnight Rally Highs (Lows): Typically, there is a low historical probability associated with overnight rally-highs (lows) ending the upside (downside) discovery process.
Volume Areas: A structurally sound market will build on areas of high volume (HVNodes). Should the market trend for long periods of time, it will lack sound structure, identified as low volume areas (LVNodes). LVNodes denote directional conviction and ought to offer support on any test.
If participants were to auction and find acceptance into areas of prior low volume (LVNodes), then future discovery ought to be volatile and quick as participants look to HVNodes for favorable entry or exit.
POCs: POCs are valuable as they denote areas where two-sided trade was most prevalent in a prior day session. Participants will respond to future tests of value as they offer favorable entry and exit.
About
After years of self-education, strategy development, mentorship, and trial-and-error, Renato Leonard Capelj began trading full-time and founded Physik Invest to detail his methods, research, and performance in the markets.
Capelj is also a Benzinga finance and technology reporter interviewing the likes of Shark Tank’s Kevin O’Leary, JC2 Ventures’ John Chambers, FTX’s Sam Bankman-Fried, and ARK Invest’s Catherine Wood, as well as a SpotGamma contributor developing insights around impactful options market dynamics.
Disclaimer
Physik Invest does not carry the right to provide advice.
In no way should the materials herein be construed as advice. Derivatives carry a substantial risk of loss. All content is for informational purposes only.
Editor’s Note: The Daily Brief is a free glimpse into the prevailing fundamental and technical drivers of U.S. equity market products. Join the 200+ that read this report daily, below!
Overnight, equity index futures, led by the tech- and growth-heavy Nasdaq 100 auctioned higher. This is immediately after a session characterized by rampant, two-way volatility.
Much of the action in the equity indices and commodity markets is headline-driven.
For instance, at one point, alongside news that Ukraine would no longer insist on NATO membership, the S&P 500 auctioned higher nearly 3%. Thereafter, responsive selling at a very key technical level preceded the index’s over 3% drop shortly after.
This push-and-pull, as well as responsiveness near key-technical areas (that are discernable visually on a chart), suggests technically-driven traders with short time horizons are very active.
Such traders often lack the wherewithal to defend retests and, additionally, the type of trade may be indicative of the other time frame participants waiting for more information to initiate trades.
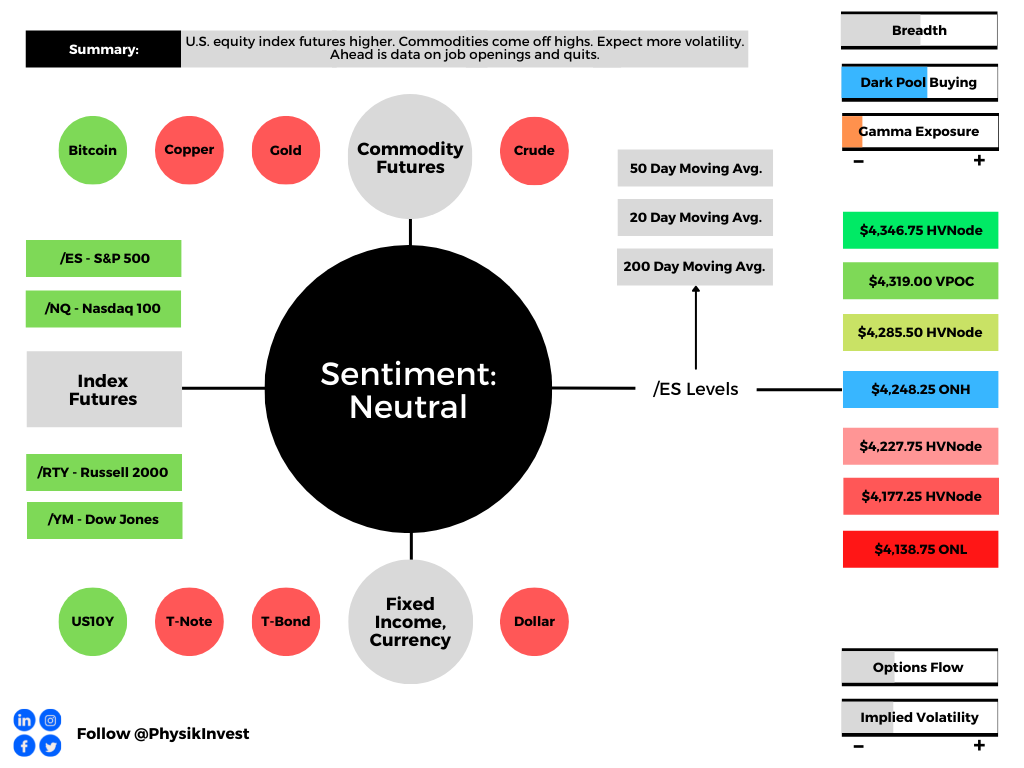
Ahead is data on job openings and quits (10:00 AM ET).
Graphic updated 6:45 AM ET. Sentiment Neutral if expected /ES open is inside of the prior day’s range. /ES levels are derived from the profile graphic at the bottom of the following section. Levels may have changed since initially quoted; click here for the latest levels. SqueezeMetrics Dark Pool Index (DIX) and Gamma (GEX) calculations are based on where the prior day’s reading falls with respect to the MAX and MIN of all occurrences available. A higher DIX is bullish. At the same time, the lower the GEX, the more (expected) volatility. Learn the implications of volatility, direction, and moneyness. SHIFT data used for S&P 500 (INDEX: SPX) options activity. Note that options flow is sorted by the call premium spent; if more positive, then more was spent on call options. Breadth reflects a reading of the prior day’s NYSE Advance/Decline indicator. VIX reflects a current reading of the CBOE Volatility Index (INDEX: VIX) from 0-100.
What To Expect
Fundamental: The prevailing narrative is concerned with the slowdown in economic growth, the intent to withdraw monetary stimulus, and the response to Russia’s invasion of Ukraine.
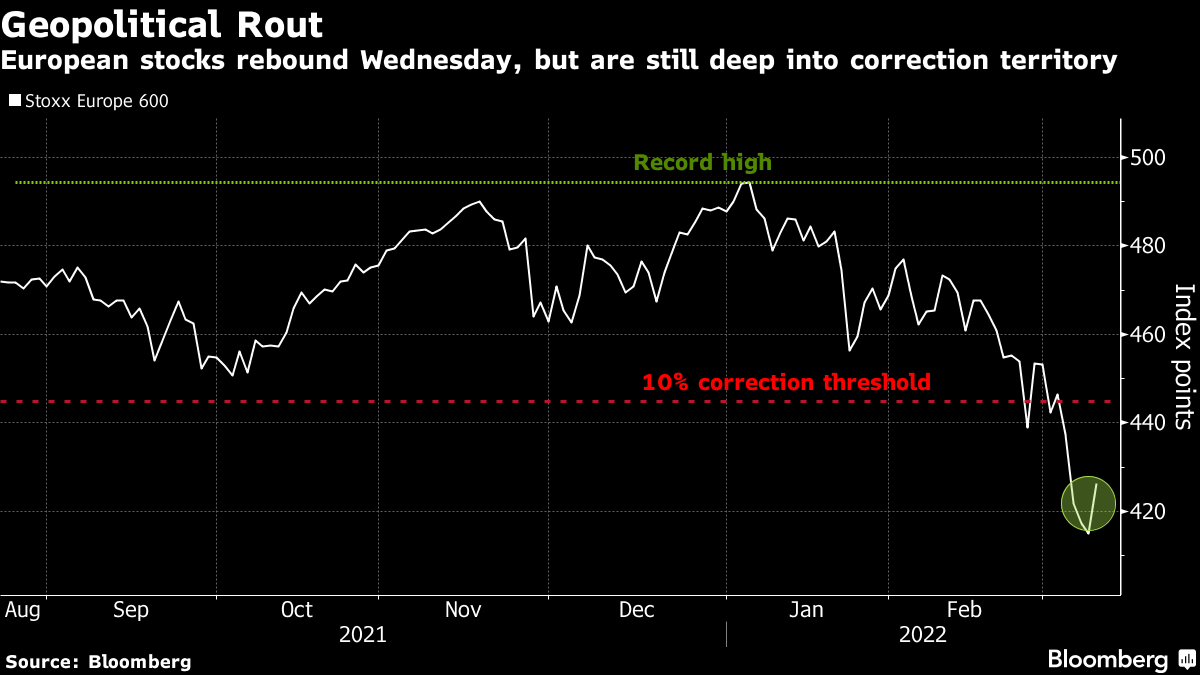
Graphic: Bloomberg. U.S. equity indexes spared of recent bloodshed, abroad.
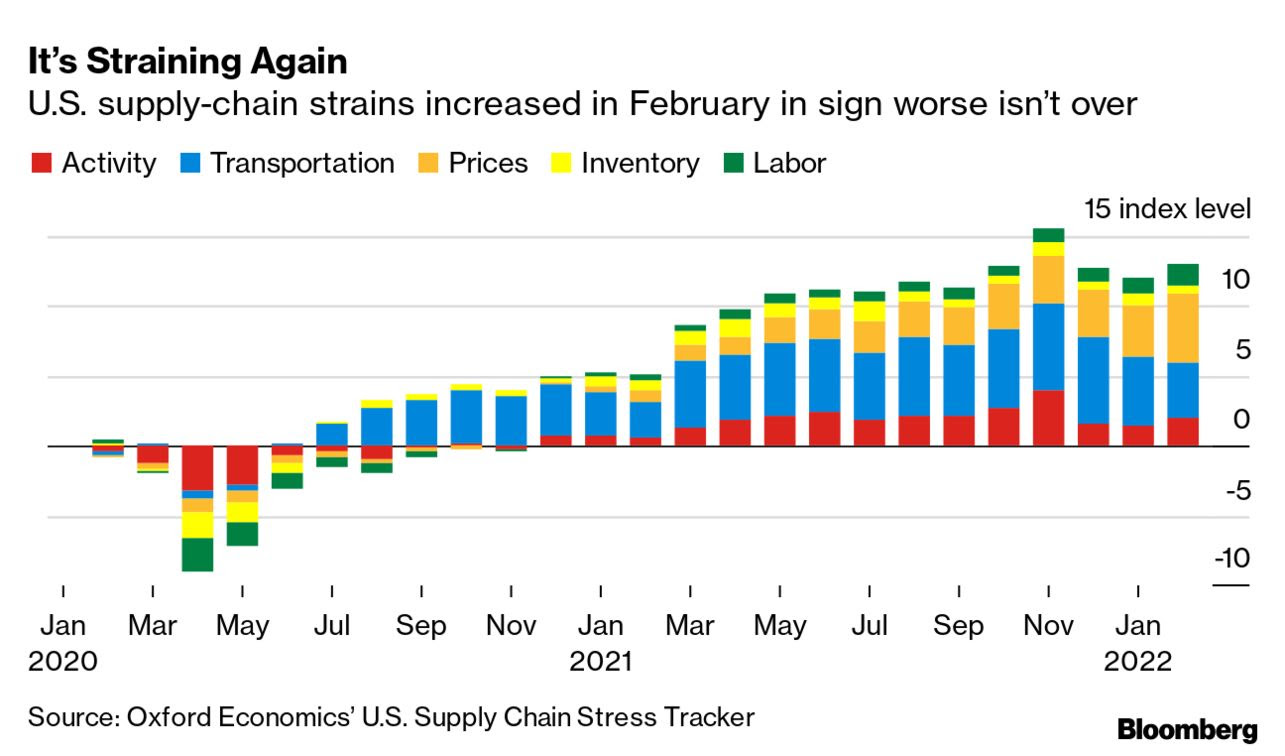
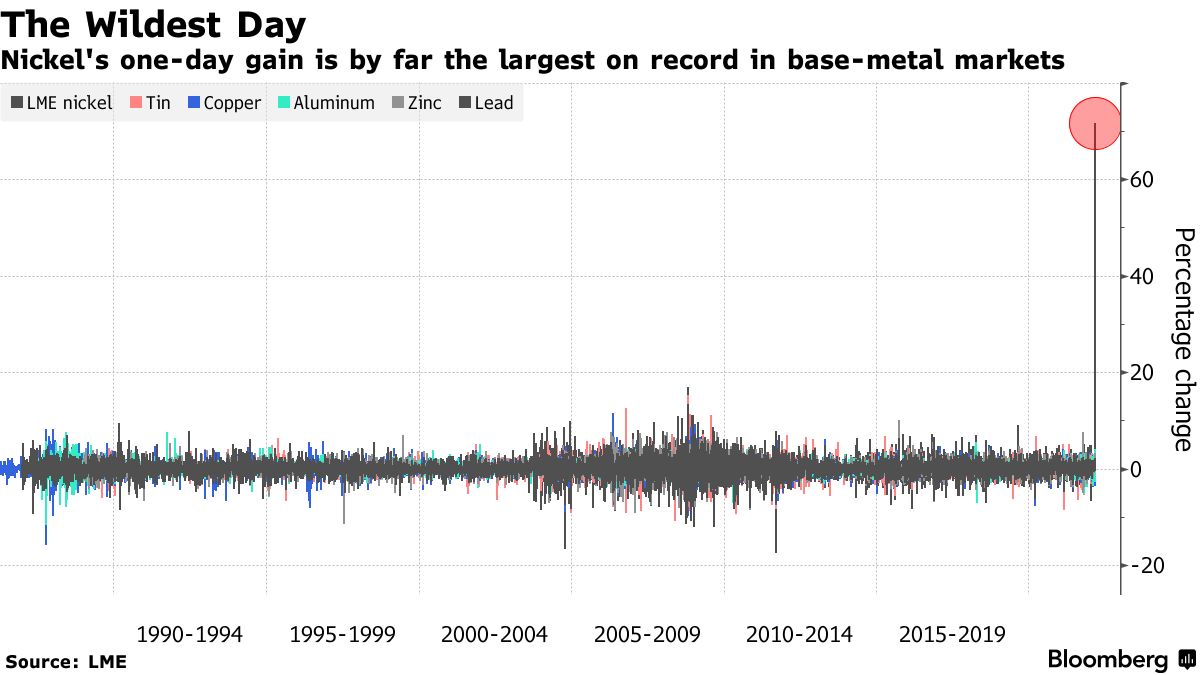
Pursuant to the response to Russia’s invasion of Ukraine has been a disruption in supply chains; commodities, like oil and nickel, have risen and that has inflation and growth impacts.
Graphic: Via Bloomberg, Oxford Economics. “The war in Ukraine is making it harder and more costly for goods to move freely across the globe. Key shipping routes are blocked, and others are feeling ripple effects from the conflict.”
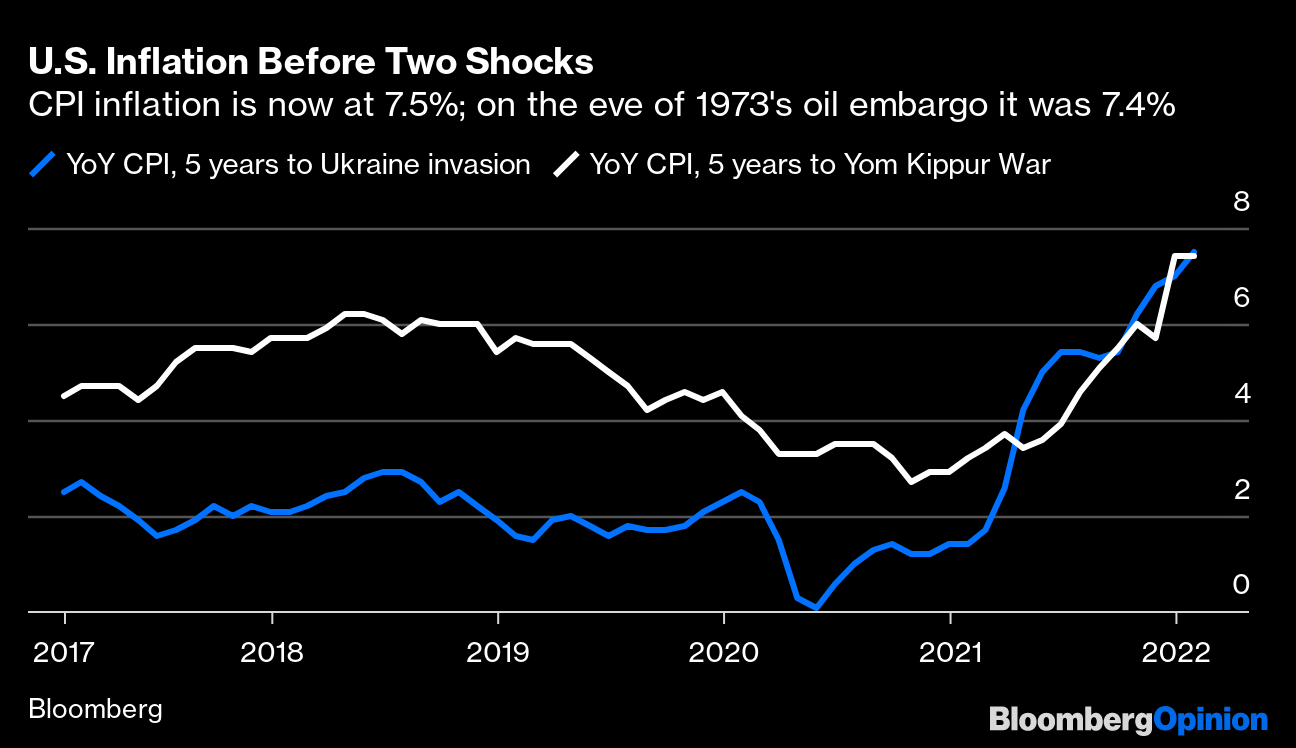
In the coming days and weeks, central banks will announce their monetary policy decisions. Per Bloomberg, commodity costs underline the inflation challenge to the Federal Reserve.
Graphic: Via Bloomberg. The historical analogy is different but close (as today’s economy is less dependent on oil); the “Fed responded to the [1973] shock, and to the growing wave of inflation that preceded it, with a massive tightening.”
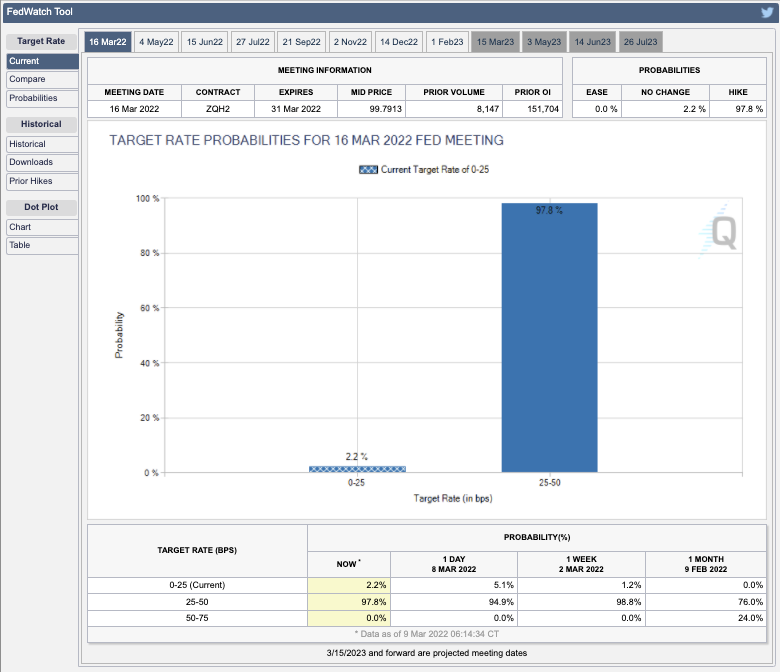
With breakevens on 30-year inflation-linked Treasuries – an indicator of the pace of price gains over three decades – climbing to their highest level, the Fed is expected to hike rates 25 bps.
Graphic: Via CME Group Inc (NASDAQ: CME). Participants price in an increased probability of a shift in the target rate. Click here to access the FedWatch Tool.
In the past days, there have been a variety of takes on what’s going on. A pessimistic, yet, interesting take is offered by Credit Suisse Group AG’s (NYSE: CS) Zoltan Pozsar.
Mainly, there is a commodity crisis. Commodities are collateral and collateral is money.
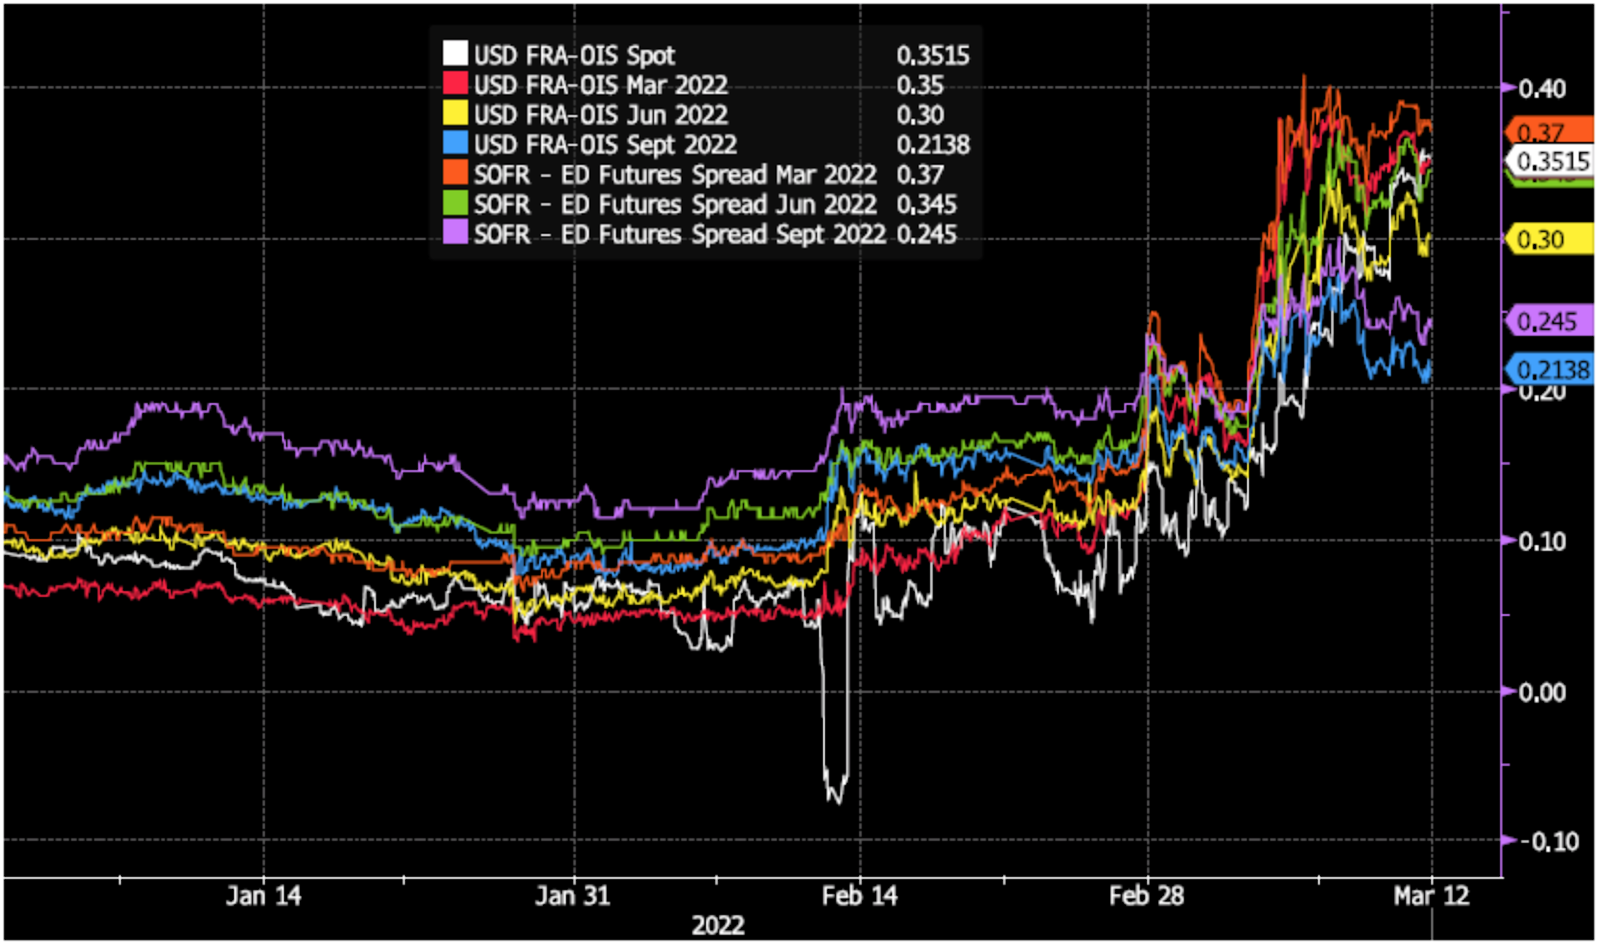
Graphic: Via Bloomberg. The “FRA/OIS, a key gauge of interbank funding risk, as of the close on Monday.” Click here to listen to Zoltan Pozsar’s Bloomberg conversation on Russia, Gold, and the U.S. dollar.
“[E]very crisis occurs at the intersection of funding and collateral markets and that, in the presently unfolding crisis, commodities are collateral, and more precisely, Russian commodities are like subprime collateral and all other stuff is prime.”
Pozsar explains that instability in commodity prices feeds into financial instability as margin calls trigger the failure of commodity traders and (potentially) commodity exchanges.
Graphic: Via Bloomberg. Commodity price rises solicit margin calls.
“Again, commodity correlations are at 1, which is never a good thing,” he says. “The Fed and other central banks will be able to provide liquidity backstops, … but those will be Band-Aid solutions.”
Liquidity is the manifestation of a larger problem – the Russian-non-Russian commodities basis – and its resolve portends a “regime shift” which Pozsar posits China will be at the front of.
“When this crisis (and war) is over, the U.S. dollar should be much weaker and, on the flip side, the renminbi much stronger, backed by a basket of commodities.”
MUFG Securities’ (NYSE: MUFG) George Goncalves makes a similar point, drawing parallels to the early days of 2008.
“The situation in Europe is precarious enough on its own, but if conditions worsen in a highly connected financial system, balance sheets may get curtailed via haircuts,” Concalves wrote.
“Meanwhile there is an eerily similar pattern to the current action in [short-term interest rates] and oil prices to the early summer of 2008. Recall, in response to inflation and central bank hawkishness, markets priced in nearly 150bps in hikes in 2008 before GFC cracked.”
Positioning: Based on metrics often quoted in this morning letter, buying support appears to be cooling. Overlaying options positioning metrics, the returns distribution is skewed positive, still.
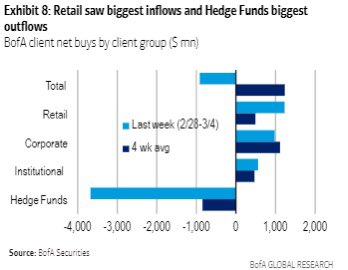
This is in opposition to some of the reporting by large outlets. The narrative is along the lines of institutional investors offloading equities to retail.
Graphic: Via Bank of America Corporation (NYSE: BAC).
According to statements by The Ambrus Group’s Kris Sidial, “This is partially a byproduct of the long equity firms that have programs that are designed to exit when Cboe Volatility Index (INDEX: VIX) gets over a certain level and equities drop under a certain percentage.”
Graphic: Via Pat Hennessy. “ES goes +2%, -2%, +3%, -3% in 14 hours! Yes – the close/close move was weak, but the intraday moves were massive – IMO enough to support a 37 VIX. Strange to see vols so soft given intraday realized + close on lows.”
“There is no doubt about it that we have noticed heavier institutional flow throughout the day over the last two weeks. However, there are still large institutions that are putting cash to work in equities. Ironically a rotation out of some European equities into U.S., [and] there is also a good amount of buyback flow that is projected to hit some areas in U.S equities.
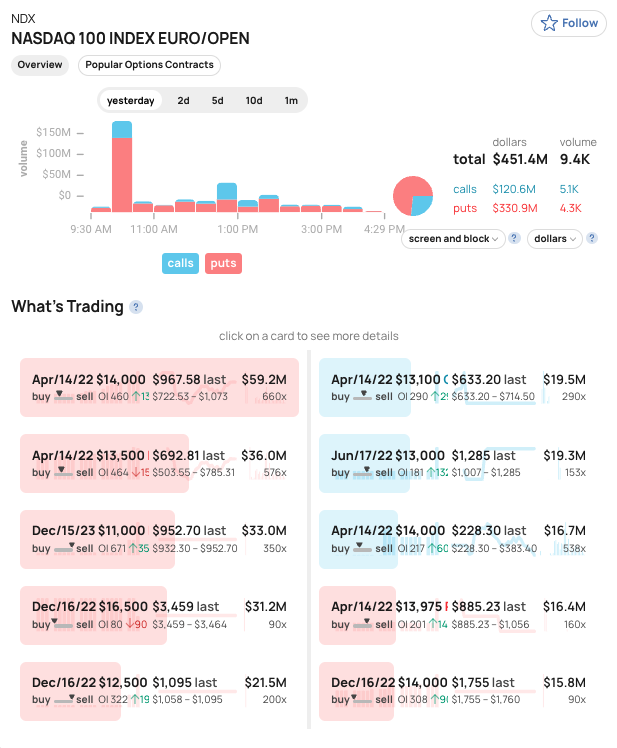
Pursuant to remarks in the fundamental section (and Sidial’s note on the heavier institutional flow), we saw some noteworthy put buying in products like the cash-settled Nasdaq 100 (INDEX: NDX) and iShares iBoxx $ Inv Grade Corporate Bond ETF (NYSE: LQD).
Graphic: Via SHIFT. Buying closer strikes. Selling farther strikes.
Whether these are hedges, the replacement of existing linear short positions, or speculation on the downside, it all plays into this negative gamma environment markets are in.
When customers demand downside (put) protection (a negative delta, positive gamma trade that has its gains multiplied to the downside), counterparties sell underlying futures and stock to hedge their positive delta, negative gamma trade which has the effect of pressuring markets.
The compression of volatility (via passage of FOMC) or removal of counterparty negative exposure (via OPEX) may serve to alleviate some of this pressure. Until then, participants can expect the options landscape to add to market volatility.
Technical: As of 6:45 AM ET, Wednesday’s regular session (9:30 AM – 4:00 PM ET), in the S&P 500, will likely open in the upper part of a positively skewed overnight inventory, inside of prior-range and -value, suggesting a limited potential for immediate directional opportunity.
In the best case, the S&P 500 trades higher; activity above the $4,248.25 overnight high (ONH) puts in play the $4,285.50 high volume area (HVNode). Initiative trade beyond the HVNode could reach as high as the $4,319.00 untested point of control (VPOC) and $4,346.75 high volume area (HVNode), or higher.
In the worst case, the S&P 500 trades lower; activity below the $4,248.25 ONH puts in play the $4,227.75 HVNode. Initiative trade beyond the $4,227.75 HVNode could reach as low as the $4,177.25 HVNode and $4,138.75 ONL, or lower.
Click here to load today’s key levels into the web-based TradingView charting platform. Note that all levels are derived using the 65-minute timeframe. New links are produced, daily.
Graphic: 65-minute profile chart of the Micro E-mini S&P 500 Futures.
Definitions
Overnight Rally Highs (Lows): Typically, there is a low historical probability associated with overnight rally-highs (lows) ending the upside (downside) discovery process.
Volume Areas: A structurally sound market will build on areas of high volume (HVNodes). Should the market trend for long periods of time, it will lack sound structure, identified as low volume areas (LVNodes). LVNodes denote directional conviction and ought to offer support on any test.
If participants were to auction and find acceptance into areas of prior low volume (LVNodes), then future discovery ought to be volatile and quick as participants look to HVNodes for favorable entry or exit.
POCs: POCs are valuable as they denote areas where two-sided trade was most prevalent in a prior day session. Participants will respond to future tests of value as they offer favorable entry and exit.
About
After years of self-education, strategy development, mentorship, and trial-and-error, Renato Leonard Capelj began trading full-time and founded Physik Invest to detail his methods, research, and performance in the markets.
Capelj is also a Benzinga finance and technology reporter interviewing the likes of Shark Tank’s Kevin O’Leary, JC2 Ventures’ John Chambers, FTX’s Sam Bankman-Fried, and ARK Invest’s Catherine Wood, as well as a SpotGamma contributor developing insights around impactful options market dynamics.
Disclaimer
Physik Invest does not carry the right to provide advice.
In no way should the materials herein be construed as advice. Derivatives carry a substantial risk of loss. All content is for informational purposes only.
Editor’s Note: The Daily Brief is a free glimpse into the prevailing fundamental and technical drivers of U.S. equity market products. Join the 200+ that read this report daily, below!
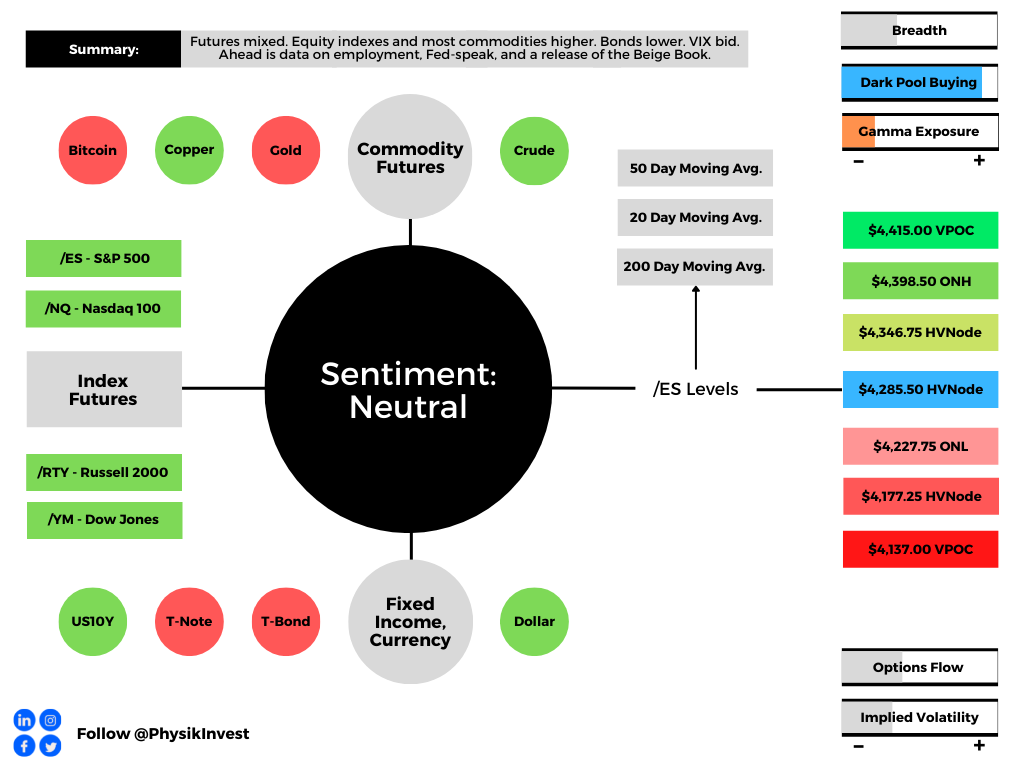
Overnight, futures were mixed. The equity indices auctioned sideways to higher, in line with most commodity products. Bonds were lower, as was the VIX, an implied volatility measure.
Pursuant to the VIX remark, volatility measures in the rates, foreign exchange, and commodity markets are surging amidst geopolitical uncertainties and monetary policy action.
Ahead is data on ADP employment (8:15 AM ET), Fed-speak by Charles Evans (9:00 AM ET), James Bullard (9:30 AM ET), and Jerome Powell (10:00 AM ET). Later, is a release of the Beige Book (2:00 PM ET).
Graphic updated 6:30 AM ET. Sentiment Neutral if expected /ES open is inside of the prior day’s range. /ES levels are derived from the profile graphic at the bottom of the following section. Levels may have changed since initially quoted; click here for the latest levels. SqueezeMetrics Dark Pool Index (DIX) and Gamma (GEX) calculations are based on where the prior day’s reading falls with respect to the MAX and MIN of all occurrences available. A higher DIX is bullish. At the same time, the lower the GEX, the more (expected) volatility. Learn the implications of volatility, direction, and moneyness. SHIFT data used for S&P 500 (INDEX: SPX) options activity. Note that options flow is sorted by the call premium spent; if more positive, then more was spent on call options. Breadth reflects a reading of the prior day’s NYSE Advance/Decline indicator. VIX reflects a current reading of the CBOE Volatility Index (INDEX: VIX) from 0-100.
What To Expect
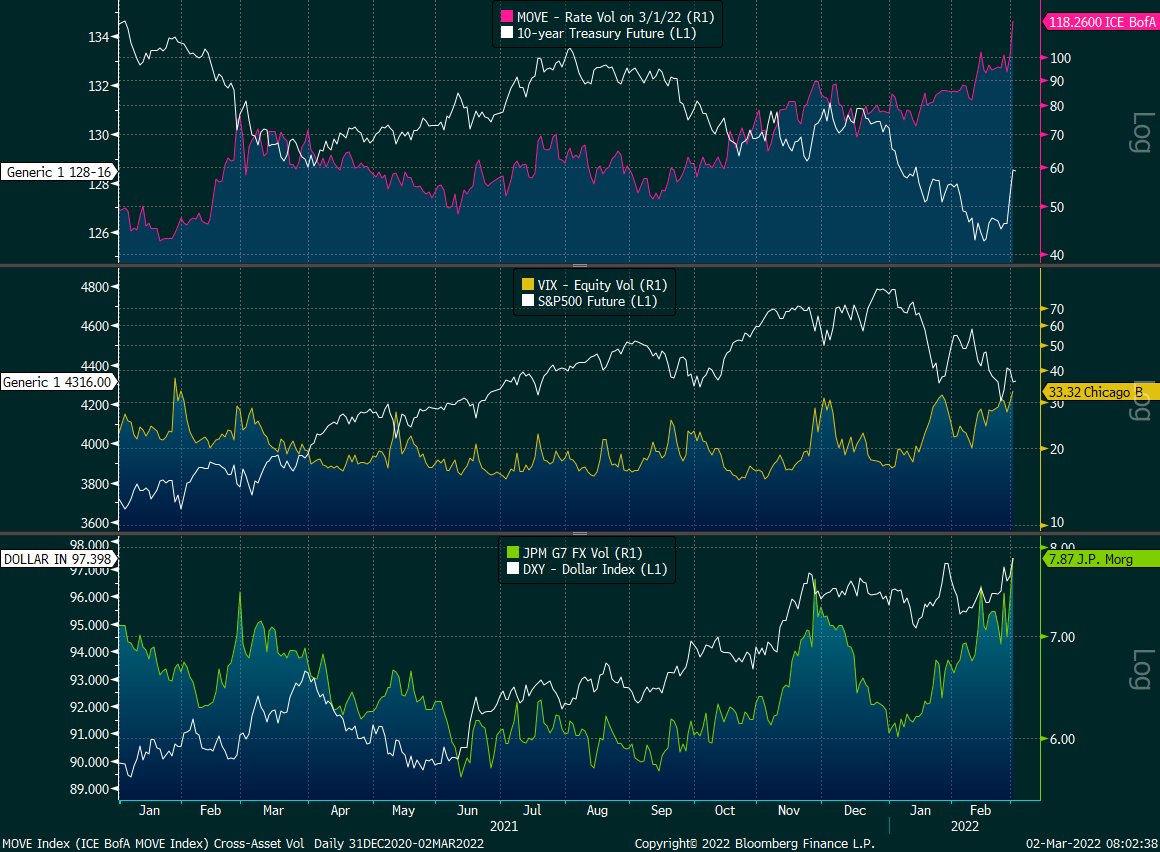
Fundamental: Cross-asset volatility is spiking as investors look to protect against Russia-Ukraine and monetary policy action, among other things.
Graphic: Via @EffMktHype. “Rate vol through the roof, FX picking up steam while equity vol arguably still cheap in comparison despite being at the high end of its 1-year end.” Please note the spike in rate and FX vol versus equity vol (which is sideways to higher, mostly).
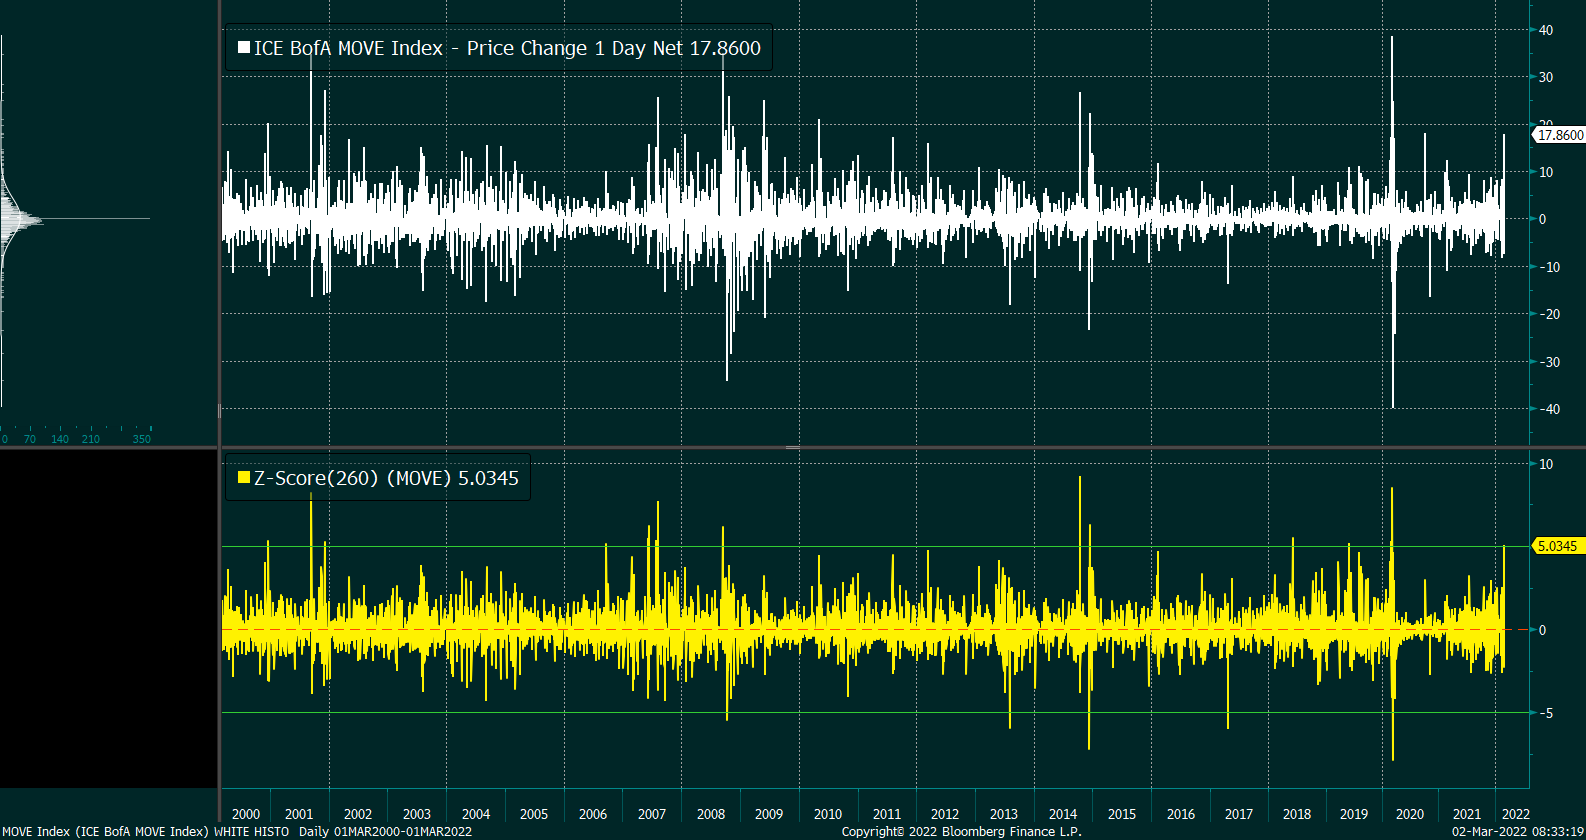
Very interesting is action in the rates market where there was a “5-sigma upward shift in MOVE on 3/1/22. [This] has happened 13 times prior in the last 22 years,” said one commentator.
Graphic: Via @EffMktHype. Merrill Lynch Option Volatility Estimate (INDEX: MOVE).
Taken together, the bond market’s pricing of risk – reflected by the Merrill Lynch Option Volatility Estimate (INDEX: MOVE) – is not in line (or moving in-step) with equity market risk, via the CBOE Volatility Index (INDEX: VIX).
Today is the first day since late Jan that the option market is pricing up volatility a noteworthy but not extreme amount (on a closing basis). $VIX closed at 33.32, ATM implied volatility closed at ~29 highest in over a yr.
The fear in one market tends to feed into the fear of another; regardless of the cause, it seems that equity and bond market participants are not (quite) on the same page.
Moreover, this is in part beyond a decline in liquidity (the variable that’s been connected with the creation of wealth through higher asset prices over time), and has much to do with participants “de-risking” amidst a wide distribution of potential outcomes, another commentator explained.
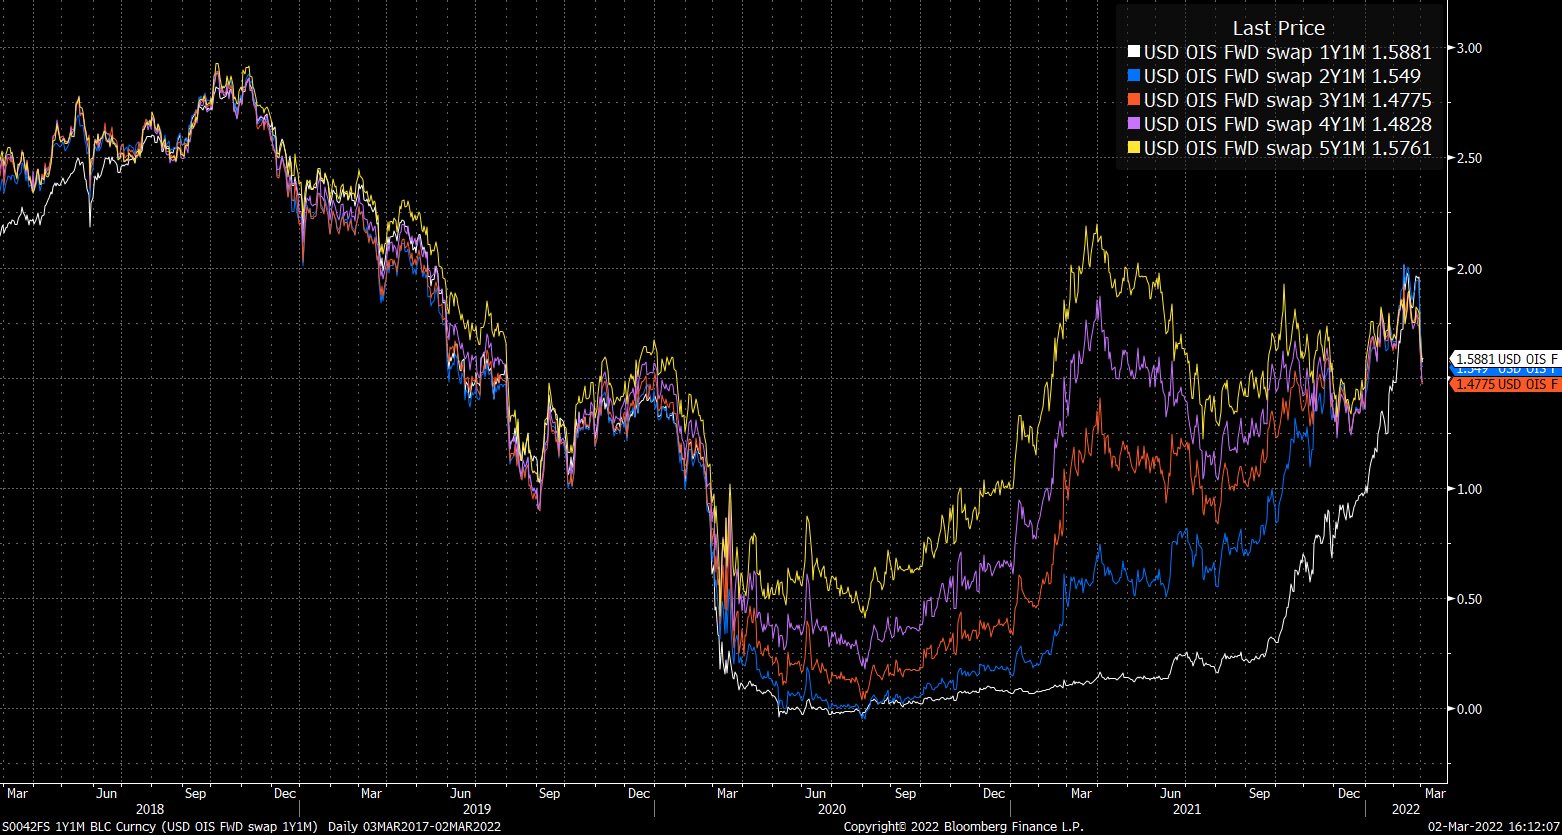
These fears are in the face of emerging risks to growth (given Russia-Ukraine and beyond); the question is whether there is a dovish surprise and this lends to assuaging participants of fear.
Graphic: Via @EffMktHype. “Forward OIS have coalesced since end-Jan and started to aggressively price out rate hikes.”
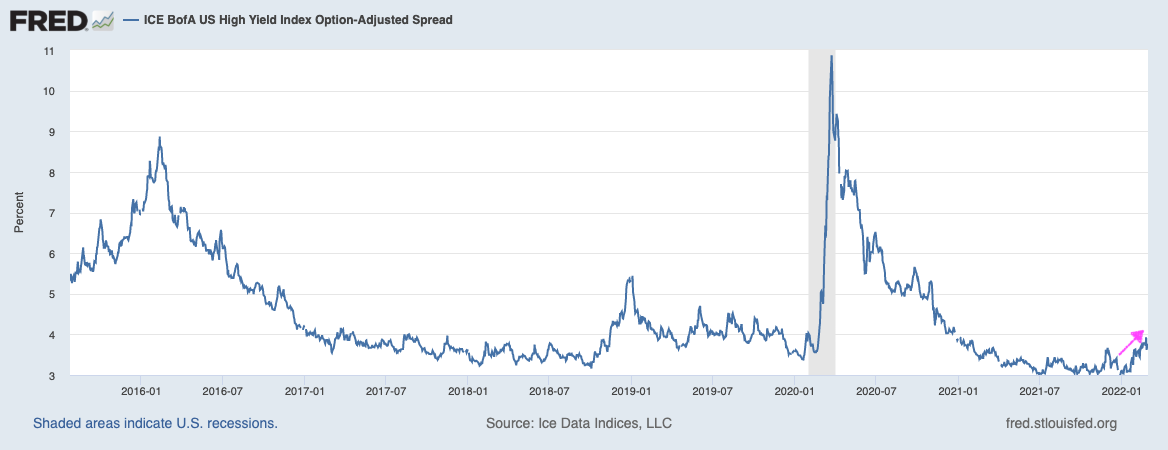
Taking a look at the U.S. high yield OAS (option-adjusted spread), participants see a “risk-off” bottom; deteriorating credit conditions are a bearish leading indicator.
Will there be further deterioration that feeds into an eventual repricing of equity market risk? Or, will there be a pullback on hawkishness like the market has started pricing?
Positioning: Pursuant to the remarks made on equity implied volatility, March 1, 2022, was “the first day since late January that the options market [was] pricing up volatility a noteworthy but not extreme amount (on a closing basis).”
This is, per SpotGamma, amidst participants’ heightened demand for downside (put) protection; in purchasing protection, traders indirectly take liquidity as counterparties hedge exposure in the underlying.
Everyone in the world is sick of the “dealer gamma hedging” narrative. Including myself and the rest of the vol guys.
However, it remains such a big part of this market it’s hard to downplay the implications and not discuss it when talking about the environment. pic.twitter.com/pDLmlALNR1
The effects of this hedging are more notable given reticence on the part of counterparties.
“Essentially, with markets swinging there is a hesitance amongst liquidity providers to step in. This creates an environment in which the absorption of orders deteriorates,” SpotGamma explains. “Given this, the hedging of options exposure further amplifies market moves.”
A heightened VIX, in the face of an equity market that is not trading much weaker, is a clear reflection of this so-called reticence.
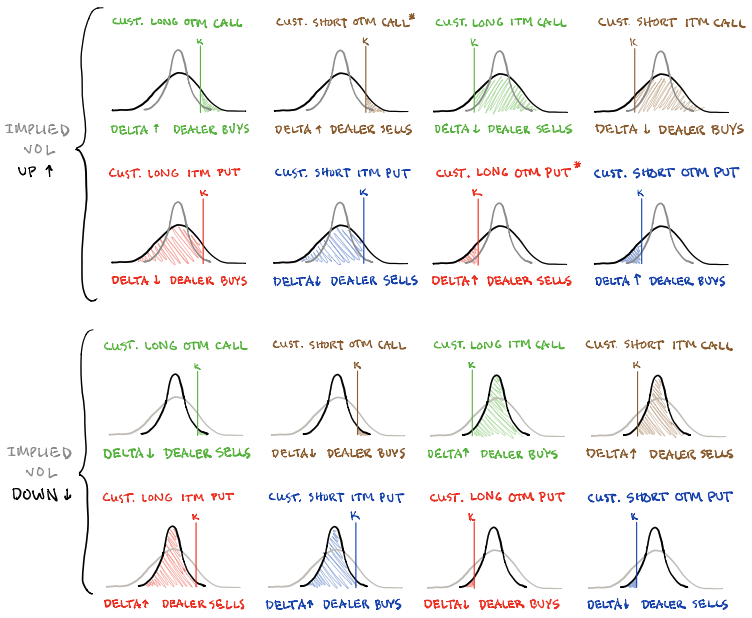
Pictured: SqueezeMetrics highlights implications of volatility, direction, and moneyness.
Going forward, bearing in mind the continued passive buying support alluded to in past commentaries, if participants were to be assuaged of their fears, that would likely coincide with less(er) demand for downside protection and compression in volatility.
The implications of this? Reduced demand for protection coincides with less counterparty negative gamma exposure (as counterparty put buying [a negative delta, positive gamma trade] coincides with the addition of liquidity [purchase of underlying, a positive delta trade]).
In counterparties being less exposed to losses on the downside (via reduced negative gamma exposure), their (re)hedging may bolster attempts higher (i.e., open the door to the upside).
The likelihood of this dynamic coming to fruition is low(er), up until the passage of the Federal Open Market Committee event March 15-16, 2022, and options expiration (that same week).
Graphic: Fear and demand for protection concentrated in shorter-dated contracts most sensitive to changes in implied volatility and direction results in pressure from hedging. The compression of volatility likely coincides with support of attempts higher (as this removes pressure).
Technical: As of 6:30 AM ET, Wednesday’s regular session (9:30 AM – 4:00 PM ET), in the S&P 500, will likely open in the upper part of a balanced overnight inventory, inside of prior-range and -value, suggesting a limited potential for immediate directional opportunity.
In the best case, the S&P 500 trades higher; activity above the $4,285.50 high volume area (HVNode) puts in play the $4,346.75 HVNode. Initiative trade beyond the $4,346.75 HVNode could reach as high as the $4,398.50 overnight high (ONH) and $4,415.00 VPOC, or higher.
In the worst case, the S&P 500 trades lower; activity below the $4,285.50 HVNode puts in play the $4,227.75 overnight low. Initiative trade beyond the ONL could reach as low as the $4,177.25 HVNode and $4,137.00 untested point of control (VPOC), or lower.
Considerations: The market is in balance or rotational trade that suggests current prices offer favorable entry and exit. Balance-areas make it easy to spot a change in the market (i.e., the transition from two-time frame trade, or balance, to one-time frame trade, or trend).
Modus operandi is responsive trade (i.e., fade the edges), rather than initiative trade (i.e., play the break).
Click here to load today’s key levels into the web-based TradingView charting platform. Note that all levels are derived using the 65-minute timeframe. New links are produced, daily.
Graphic: 65-minute profile chart of the Micro E-mini S&P 500 Futures.
What People Are Saying
For investors who imagine the S&P 500 is somehow "cheap" at a P/E above 22 – amid record profit margins – you may want to examine historical data and think through what P/E ratios mean.
Volume Areas: A structurally sound market will build on areas of high volume (HVNodes). Should the market trend for long periods of time, it will lack sound structure, identified as low volume areas (LVNodes). LVNodes denote directional conviction and ought to offer support on any test.
If participants were to auction and find acceptance into areas of prior low volume (LVNodes), then future discovery ought to be volatile and quick as participants look to HVNodes for favorable entry or exit.
Gamma: Gamma is the sensitivity of an option to changes in the underlying price. Dealers that take the other side of options trades hedge their exposure to risk by buying and selling the underlying. When dealers are short-gamma, they hedge by buying into strength and selling into weakness. When dealers are long-gamma, they hedge by selling into strength and buying into weakness. The former exacerbates volatility. The latter calms volatility.
Vanna: The rate at which the delta of an option changes with respect to volatility.
Charm: The rate at which the delta of an option changes with respect to time.
POCs: POCs are valuable as they denote areas where two-sided trade was most prevalent in a prior day session. Participants will respond to future tests of value as they offer favorable entry and exit.
Volume-Weighted Average Prices (VWAPs): A metric highly regarded by chief investment officers, among other participants, for quality of trade. Additionally, liquidity algorithms are benchmarked and programmed to buy and sell around VWAPs.
Rates: Low rates have to potential to increase the present value of future earnings making stocks, especially those that are high growth, more attractive. To note, inflation and rates move inversely to each other. Low rates stimulate demand for loans (i.e., borrowing money is more attractive).
About
After years of self-education, strategy development, mentorship, and trial-and-error, Renato Leonard Capelj began trading full-time and founded Physik Invest to detail his methods, research, and performance in the markets.
Capelj is also a Benzinga finance and technology reporter interviewing the likes of Shark Tank’s Kevin O’Leary, JC2 Ventures’ John Chambers, FTX’s Sam Bankman-Fried, and ARK Invest’s Catherine Wood, as well as a SpotGamma contributor developing insights around impactful options market dynamics.
Disclaimer
Physik Invest does not carry the right to provide advice.
In no way should the materials herein be construed as advice. Derivatives carry a substantial risk of loss. All content is for informational purposes only.
Editor’s Note: The Daily Brief is a free glimpse into the prevailing fundamental and technical drivers of U.S. equity market products. Join the 200+ that read this report daily, below!
Overnight, equity index futures auctioned sharply higher after Russia announced a pullback of some forces near Ukraine.
Ahead is data on the Producer Price Index and Empire State Manufacturing Index (8:30 AM ET).
Graphic updated 6:30 AM ET. Sentiment Risk-On if expected /ES open is above the prior day’s range. /ES levels are derived from the profile graphic at the bottom of the following section. Levels may have changed since initially quoted; click here for the latest levels. SqueezeMetrics Dark Pool Index (DIX) and Gamma (GEX) calculations are based on where the prior day’s reading falls with respect to the MAX and MIN of all occurrences available. A higher DIX is bullish. At the same time, the lower the GEX, the more (expected) volatility. Learn the implications of volatility, direction, and moneyness. SHIFT data used for S&P 500 (INDEX: SPX) options activity. Note that options flow is sorted by the call premium spent; if more positive, then more was spent on call options. Breadth reflects a reading of the prior day’s NYSE Advance/Decline indicator. VIX reflects a current reading of the CBOE Volatility Index (INDEX: VIX) from 0-100.
What To Expect
Fundamental: In the face of what participants feel will be an aggressive wave of monetary tightening and geopolitical tensions, markets had sold.
The number of interest-rate increases implied by the market for overnight index swaps, according to Bloomberg, increased to seven. Higher rates ding valuations, hurting most high-flying technology stocks and junk bonds.
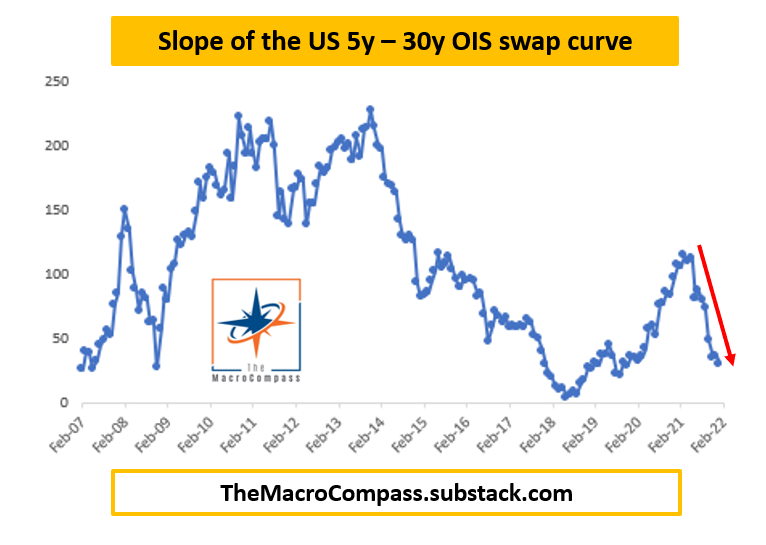
Graphic: Via The Macro Compass – The 5y-30y OIS curve, which is may eventually invert, “trades at a meager 16 bps and Powell didn’t remove the hawkish Fed tail risks (e.g. 50 bps hike in March or hiking at every meeting) and validated the aggressive hiking cycle pricing amidst a clear slowdown in economic growth impulse.”
JPMorgan Chase & Co strategists led by Marko Kolanovic suggest what the market is pricing will not materialize.
“We believe risky asset markets have mostly adjusted to monetary policy shifts by now,” the JPMorgan analysts wrote. “Short-term rates markets have likely moved too far vs. what CBs will ultimately deliver in hikes this year.”
The team at JPMorgan concludes that though the risk of conflict in Ukraine is high, the impact on global equity markets would be limited and “likely prompt a dovish reassessment by CBs.”
“We expect risky asset markets to rebound as they digest these risks and sentiment improves, aided by inflows from systematic investors and corporate buybacks.”
Pursuant to those remarks, Goldman Sachs Group Inc (NYSE: GS) “saw the largest net buying since late December (+1.0SDs), driven by risk-on flows with long buys outpacing short sales 8 to 1.”
“All regions were net bought led by North America (driven by long buys) and to a lesser extent DM Asia (driven by short covers). 8 of 11 global sectors were net bought led in $ terms by Info Tech, Materials, Financials, and Consumer Disc. Net buying in US Info Tech continued this week.”
Positioning: As much as this newsletter sounds like a broken record, not much has changed in terms of positioning.
Lower prices and higher implied volatility (the byproduct of demand for protection) compounded macro flows, exacerbating weakness.
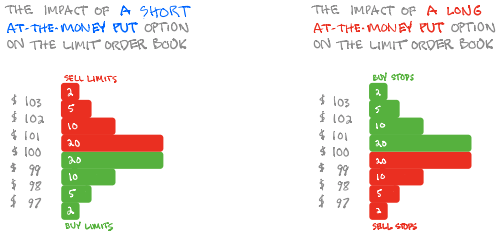
Graphic: SqueezeMetrics details the implications of customer activity in the options market, on the underlying’s order book.
According to options modeling and analysis provider SpotGamma, “When long a put, investors are offered the potential to make asymmetric payouts. They are long gamma and have positive exposure to convexity.”
Dealers, on the other side, have the potential to realize multiplied losses if markets trade down.
“To protect against ‘blowout’ situations, dealers can and will buy puts against their existing exposure. At a certain point, the convexity of the dealers’ own insurance kicks in and basically reduces the amount of added hedges needed on increases in volatility or lower markets.”
Therefore, markets have reached a potential lower bound, in light of this dynamic. Participants, en masse, would have to commit more capital to strike prices much further down and out in time to indirectly add pressure.
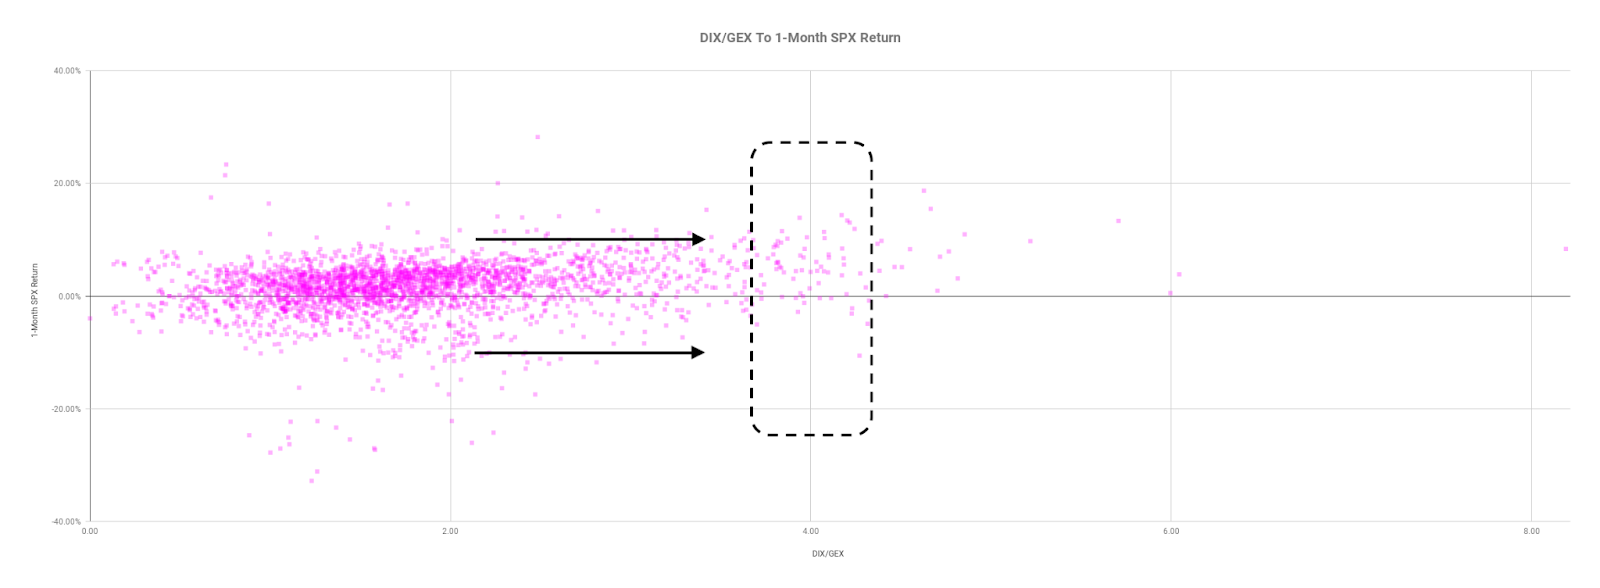
Taking into account this options positioning, versus buying pressure (measured via short sales or liquidity provision on the market-making side), positioning metrics remain positively skewed.
Graphic: Data SqueezeMetrics. Graph via Physik Invest.
To conclude, the dip lower and demand for protection may prime the market for upside (when volatility starts to compress again and counterparties unwind hedges to put-heavy exposures).
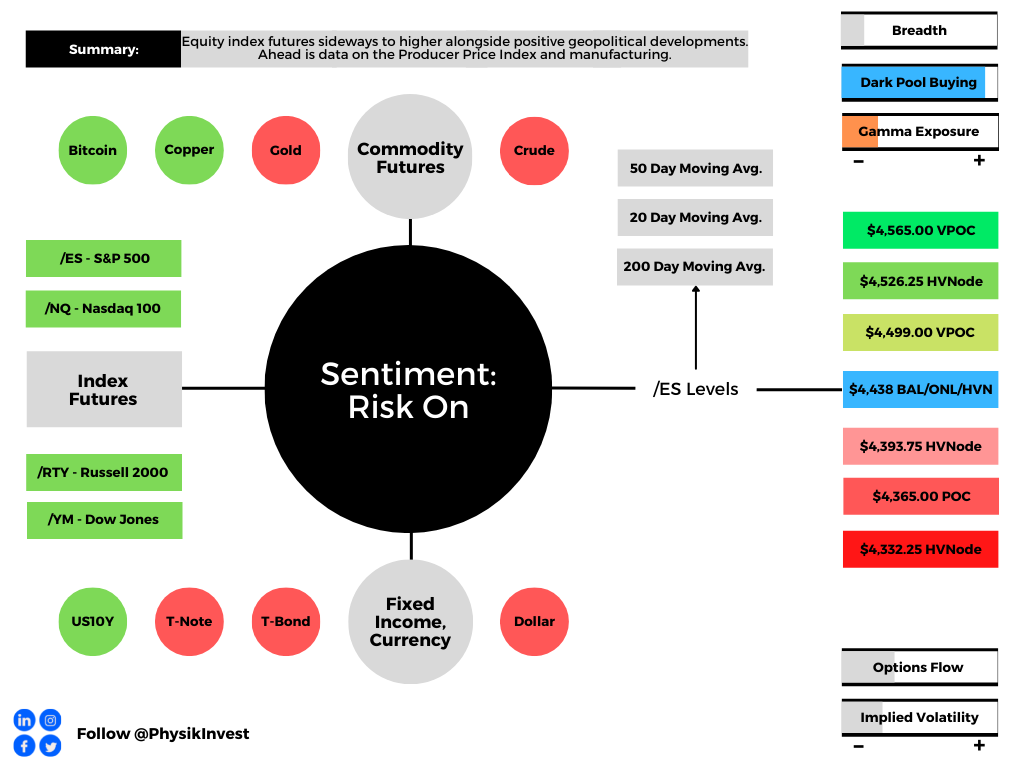
Technical: As of 6:30 AM ET, Tuesday’s regular session (9:30 AM – 4:00 PM ET), in the S&P 500, will likely open in the upper part of a positively skewed overnight inventory, outside of prior-range and -value, suggesting a potential for immediate directional opportunity.
Gap Scenarios: Gaps ought to fill quickly. Should they not, that’s a signal of strength; do not fade. Leaving value behind on a gap-fill or failing to fill a gap (i.e., remaining outside of the prior session’s range) is a go-with indicator.

Auctioning and spending at least 1-hour of trade back in the prior range suggests a lack of conviction; in such a case, do not follow the direction of the most recent initiative activity.
In the best case, the S&P 500 trades higher; activity above the $4,438.00 puts in play the $4,499.00 untested point of control (VPOC). Initiative trade beyond the VPOC could reach as high as the $4,526.25 high volume area (HVNode) and $4,565.00 VPOC, or higher.
In the worst case, the S&P 500 trades lower; activity below the $4,438.00 puts in play the $4,393.75 HVNode. Initiative trade beyond the HVNode could reach as low as the $4,365.00 POC and $4,332.25 HVNode, or lower.
Click here to load today’s key levels into the web-based TradingView charting platform. Note that all levels are derived using the 65-minute timeframe. New links are produced, daily.
Graphic: 65-minute profile chart of the Micro E-mini S&P 500 Futures.
What People Are Saying
In trading you have to face your issues head on. Be honest with with yourself on what you’re doing wrong & fix it in the moment. There may not be a tomorrow if you don’t fix your issues in the moment the next time.
This is an in the moment business, not a fix later business.
Overnight Rally Highs (Lows): Typically, there is a low historical probability associated with overnight rally-highs (lows) ending the upside (downside) discovery process.
Volume Areas: A structurally sound market will build on areas of high volume (HVNodes). Should the market trend for long periods of time, it will lack sound structure, identified as low volume areas (LVNodes). LVNodes denote directional conviction and ought to offer support on any test.
If participants were to auction and find acceptance into areas of prior low volume (LVNodes), then future discovery ought to be volatile and quick as participants look to HVNodes for favorable entry or exit.
POCs: POCs are valuable as they denote areas where two-sided trade was most prevalent in a prior day session. Participants will respond to future tests of value as they offer favorable entry and exit.
About
After years of self-education, strategy development, mentorship, and trial-and-error, Renato Leonard Capelj began trading full-time and founded Physik Invest to detail his methods, research, and performance in the markets.
Capelj is also a Benzinga finance and technology reporter interviewing the likes of Shark Tank’s Kevin O’Leary, JC2 Ventures’ John Chambers, FTX’s Sam Bankman-Fried, and ARK Invest’s Catherine Wood, as well as a SpotGamma contributor developing insights around impactful options market dynamics.
Disclaimer
Physik Invest does not carry the right to provide advice.
In no way should the materials herein be construed as advice. Derivatives carry a substantial risk of loss. All content is for informational purposes only.
Editor’s Note: The Daily Brief is a free glimpse into the prevailing fundamental and technical drivers of U.S. equity market products. Join the 200+ that read this report daily, below!
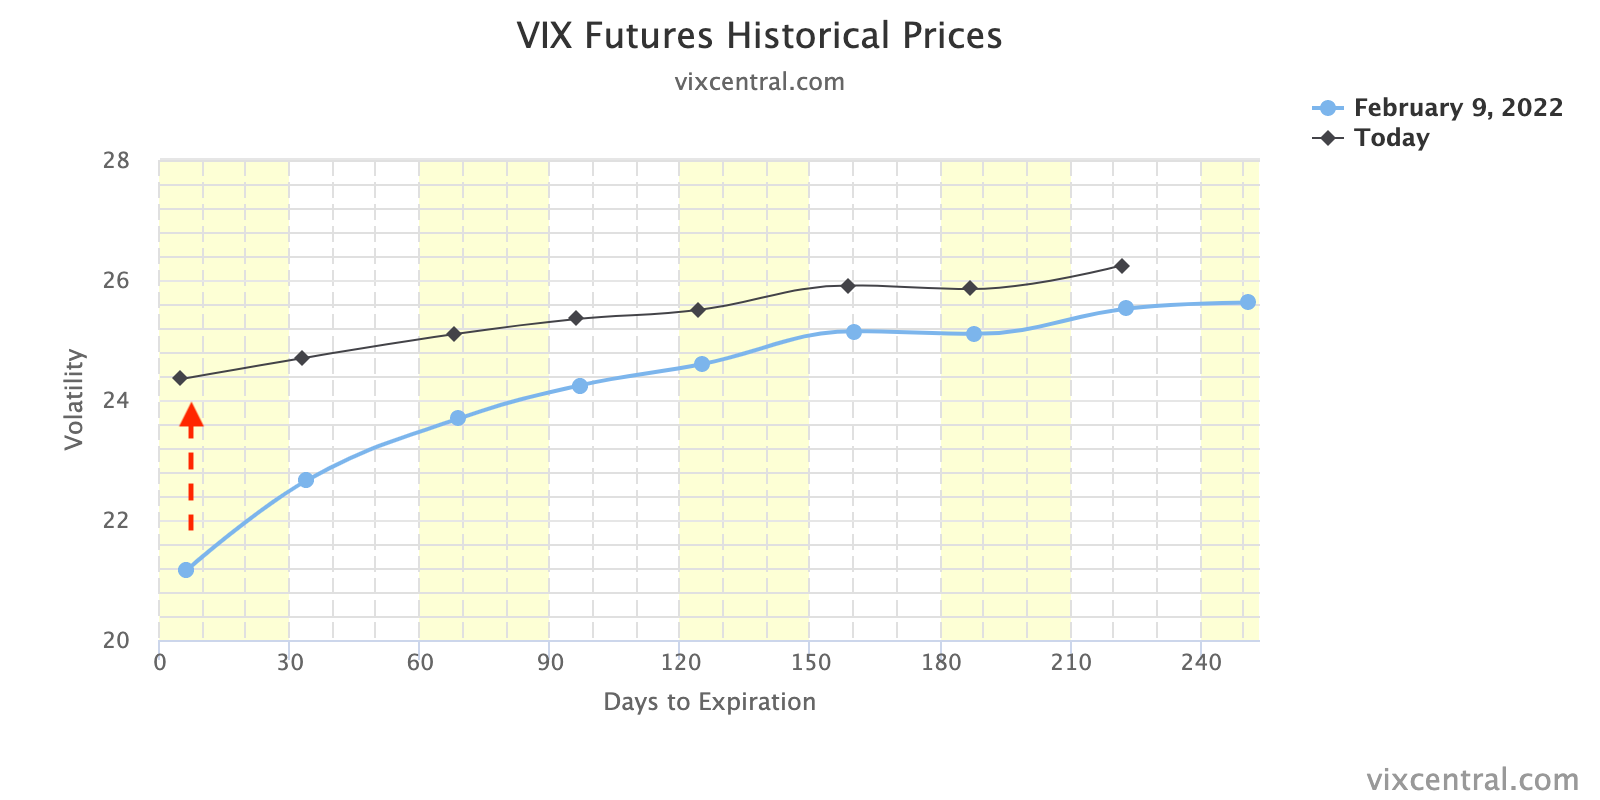
Overnight, equity index futures continued lower after the hottest inflation reading in decades and hawkish (i.e., favoring contractionary policy) Fed-speak by St. Louis Fed Chair James Bullard.
Ahead is data on University of Michigan sentiment and inflation expectations (10:00 AM ET).
Graphic updated 6:30 AM ET. Sentiment Risk-Off if expected /ES open is below the prior day’s range. /ES levels are derived from the profile graphic at the bottom of the following section. Levels may have changed since initially quoted; click here for the latest levels. SqueezeMetrics Dark Pool Index (DIX) and Gamma (GEX) calculations are based on where the prior day’s reading falls with respect to the MAX and MIN of all occurrences available. A higher DIX is bullish. At the same time, the lower the GEX, the more (expected) volatility. Learn the implications of volatility, direction, and moneyness. SHIFT data used for S&P 500 (INDEX: SPX) options activity. Note that options flow is sorted by the call premium spent; if more positive, then more was spent on call options. Breadth reflects a reading of the prior day’s NYSE Advance/Decline indicator. VIX reflects a current reading of the CBOE Volatility Index (INDEX: VIX) from 0-100.
What To Expect
Fundamental: Bonds and equities were sold, yesterday.
This is after the hottest inflation reading in four decades and comments by the Fed’s Bullard that the central bank should hike rates by 100 basis points over the next three meetings.
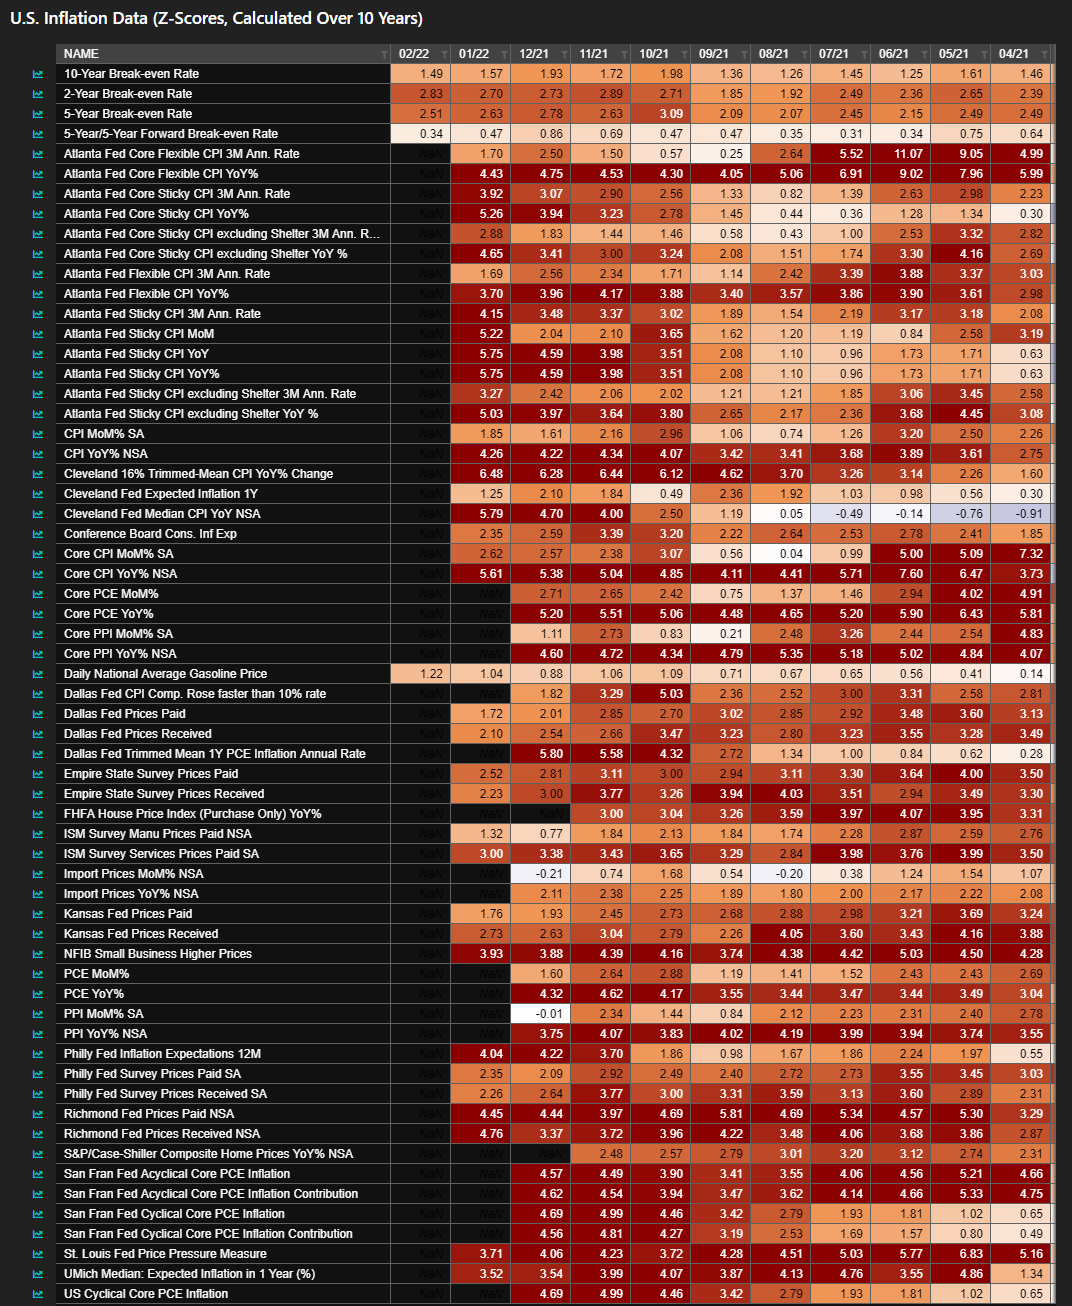
Graphic: Via Bloomberg, “This is a heat map produced by the Bloomberg ECAN function, and it shows every indicator relevant to U.S. inflation now well above its recent mean.”
“Bullard’s plan involves spreading the increases over three meetings, shrinking the Fed’s balance sheet starting in the second quarter and then deciding on the path of rates in the second half based on updated data,” Bloomberg explained.
“Markets boosted bets on rate hikes, pricing a full percentage-point increase over three meetings, which would require the first 50 basis-point increase since 2000 unless a move was made between Fed meetings.”
Further, though this FOMC participant’s more hawkish tilt differs from what the entire committee has committed to, so long as “the market expects it, … the odds of a 50bp hike in March or May are higher.”
This trend in expectations has been worsening with each major macroeconomic event in 2022. The Fed’s Minutes, FOMC meeting, Nonfarm Payrolls, and CPI have all played a part in the disruption of long-term trends in yields which has a negative impact on valuations, to put simply.
Though earnings growth may offset the negative valuation impact of higher rates, as discussed in detail days ago, the yield curve – e.g., spread between 10- and 2-year – is on its way toward an inversion, as is the yield curve measure involving overnight index swaps (OIS).
For context, per Reuters, an “OIS transaction involves exchanging an overnight rate such as the federal funds rate for a fixed one. For instance, in a U.S. 2-year OIS swap, one party to the transaction receives a fixed two-year rate in exchange for paying the fed funds rate daily over the next two years.”
The OIS market is also a reflection of traders’ expectations for rates. An inversion (which may signal the expectation of aggressive action against inflation that could also stifle economic growth) previously occurred in July 2018. Months later, markets sold and the Fed cut rates.
Per Alfonso Peccatiello, the former head of a $20 billion investment portfolio and author of The Macro Compass: The inversion of the OIS curve may worsen a downturn in the economy as short-term refinancing credit becomes more expensive and markets price weaker long-term growth.
The OIS curve is “a cleaner indication of yield curve inversions,” Peccatiello added.
Positioning: Bonds down. Equities down. What the heck?
This newsletter has talked about this dynamic in the past and will borrow from that, below.
In short, over the past 40 or so years, monetary policy was used as a crutch to support the economy. This promoted deflation, innovation, and the subsequent rise in valuations.
With rates near zero and lifting, that’s a headwind; coupled with participants’ increased exposure to rate and equity market risk, which can play into cross-market hedging and de-leveraging cascades, 60/40 turns into somewhat of a poor hedge.
Why? Higher rates have the potential to decrease the present value of future earnings, making stocks, especially those that are high growth, less attractive.
According to a note published by Andy Constan of Damped Spring Advisors, “The lack of additional liquidity provided by Fed purchase will also remove a damper for the market and the economy keeping asset volatility well bid, while also causing asset diversification benefit to fall, generating rising portfolio volatility and the risk demanded to hold assets.”
“Now, with the Fed poised to hike interest rates to combat raging inflation, the bond-stock relationship could be upended,” Bloomberg explains.
“At stake are trillions of dollars that are managed at risk parity funds, balanced mutual funds, and pension funds that follow the framework of 60/40 asset allocation.”
Why mention any of this? Well, it forces us to look elsewhere for protection.
In this case, the growing asset class of volatility, so to speak, is that protection. Investors are aware of both the protective and speculative efficiency afforded to them by options and that is the primary reason option volumes are so comparable to stock volumes, now.
Notwithstanding, with option volumes higher, related hedging flows can represent an increased share of volume in underlying stocks. Therefore, the correlation of stock moves, versus options activity, is more pronounced.
To put it simply, we can look to the options market for clues on where to next, for lack of better phrasing. So, let’s do that!
Heading into Thursday’s session, participants were committing capital to bets on lower volatility.
The counterparties to this short volatility trade were long; if the market were to trade higher (lower), they would sell (buy) futures against increased (decreased) positive delta exposure.
Graphic: A rudimentary example of what is involved in hedging a long call option.
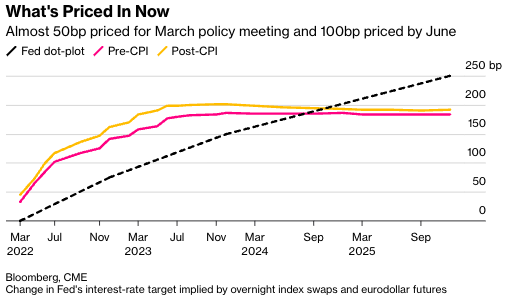
However, Thursday’s post-CPI trade disrupted the balance of trade; lower prices and demand for protection, in the face of lower levels of “on-screen liquidity,” solicited dealer selling to hedge increased exposure to the positive delta from demanded short-dated, highly convex options.
Graphic: SpotGamma’s Hedging Impact of Real-Time Options (HIRO) indicator; “customers bought put options (a negative delta trade) leaving dealers short (a positive delta trade).”
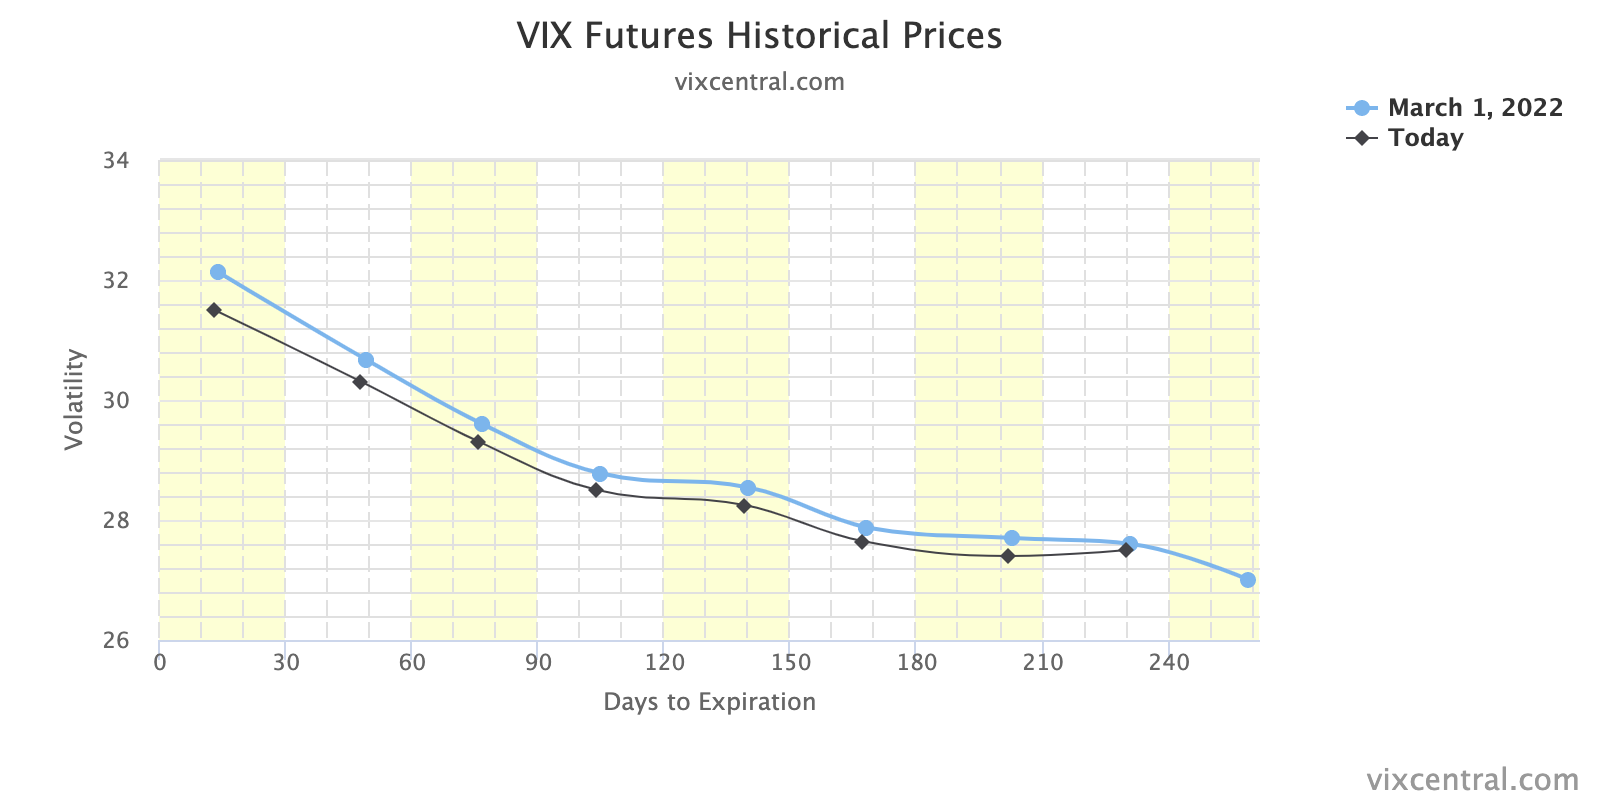
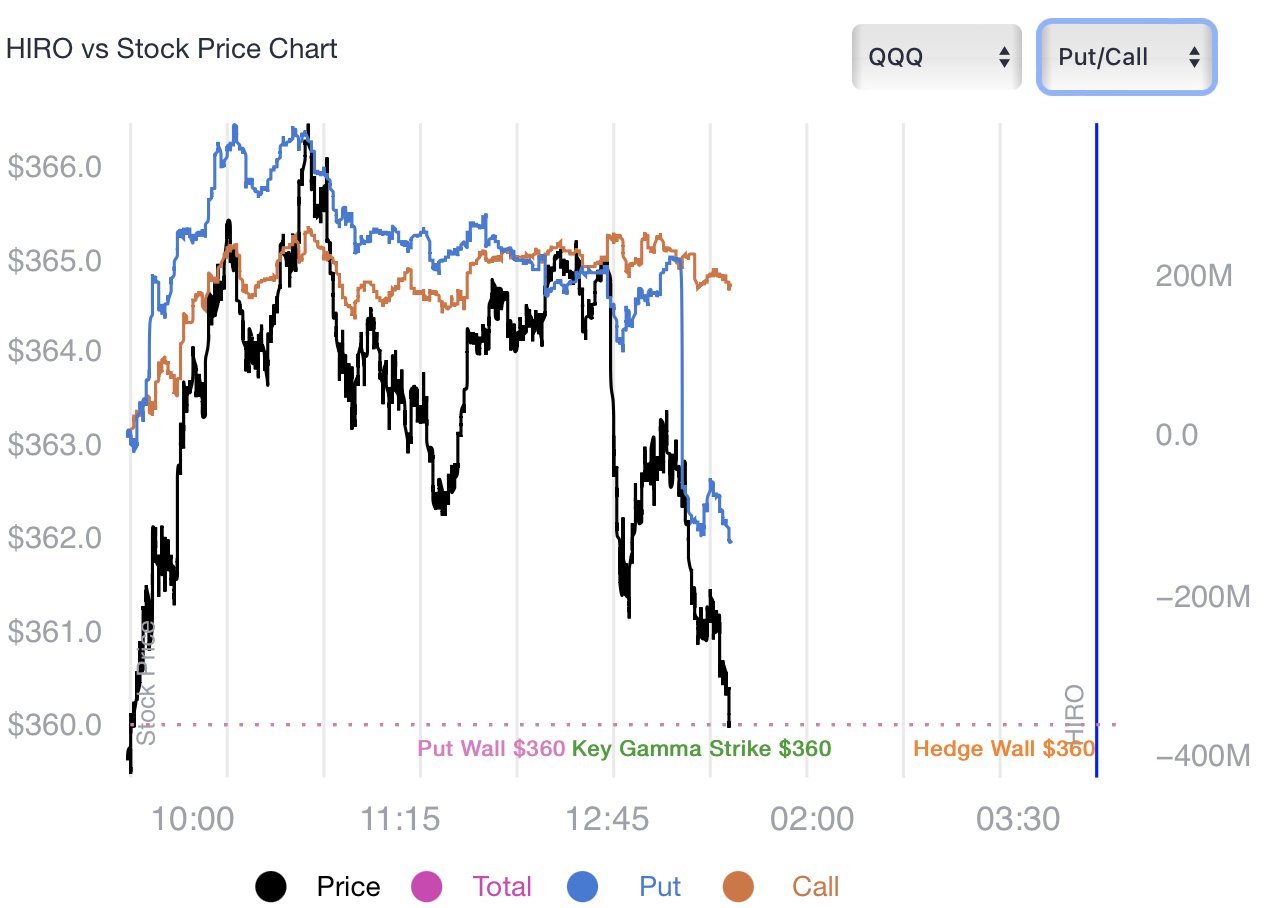
The demand for shorter-dated protection is better visualized by the VIX term structure which shifted markedly at the front-end, yesterday.
Graphic: VIX term structure shifts higher (dramatically at the front-end).
As direction (delta) and volatility (vega) are inputs to the pricing of options, lower prices and higher volatility (a reflection of fear and demand for protection) will mark options higher. Hedging pressures will exacerbate weakness, as a result of real selling (as talked about above), at the index and single-stock level.
Graphic: SqueezeMetrics details the implications of customer activity in the options market, on the underlying’s order book.
Taking into account options positioning, versus buying pressure (measured via short sales or liquidity provision on the market-making side), positioning metrics remain positively skewed.
Graphic: Data SqueezeMetrics. Graph via Physik Invest.
To conclude, the dip lower and demand for protection could serve to prime the market for upside (when volatility starts to compress again and counterparties unwind hedges thus supporting any attempt higher). All eyes are on next week’s monthly options expiration (OPEX). We will discuss the implications of this, later.
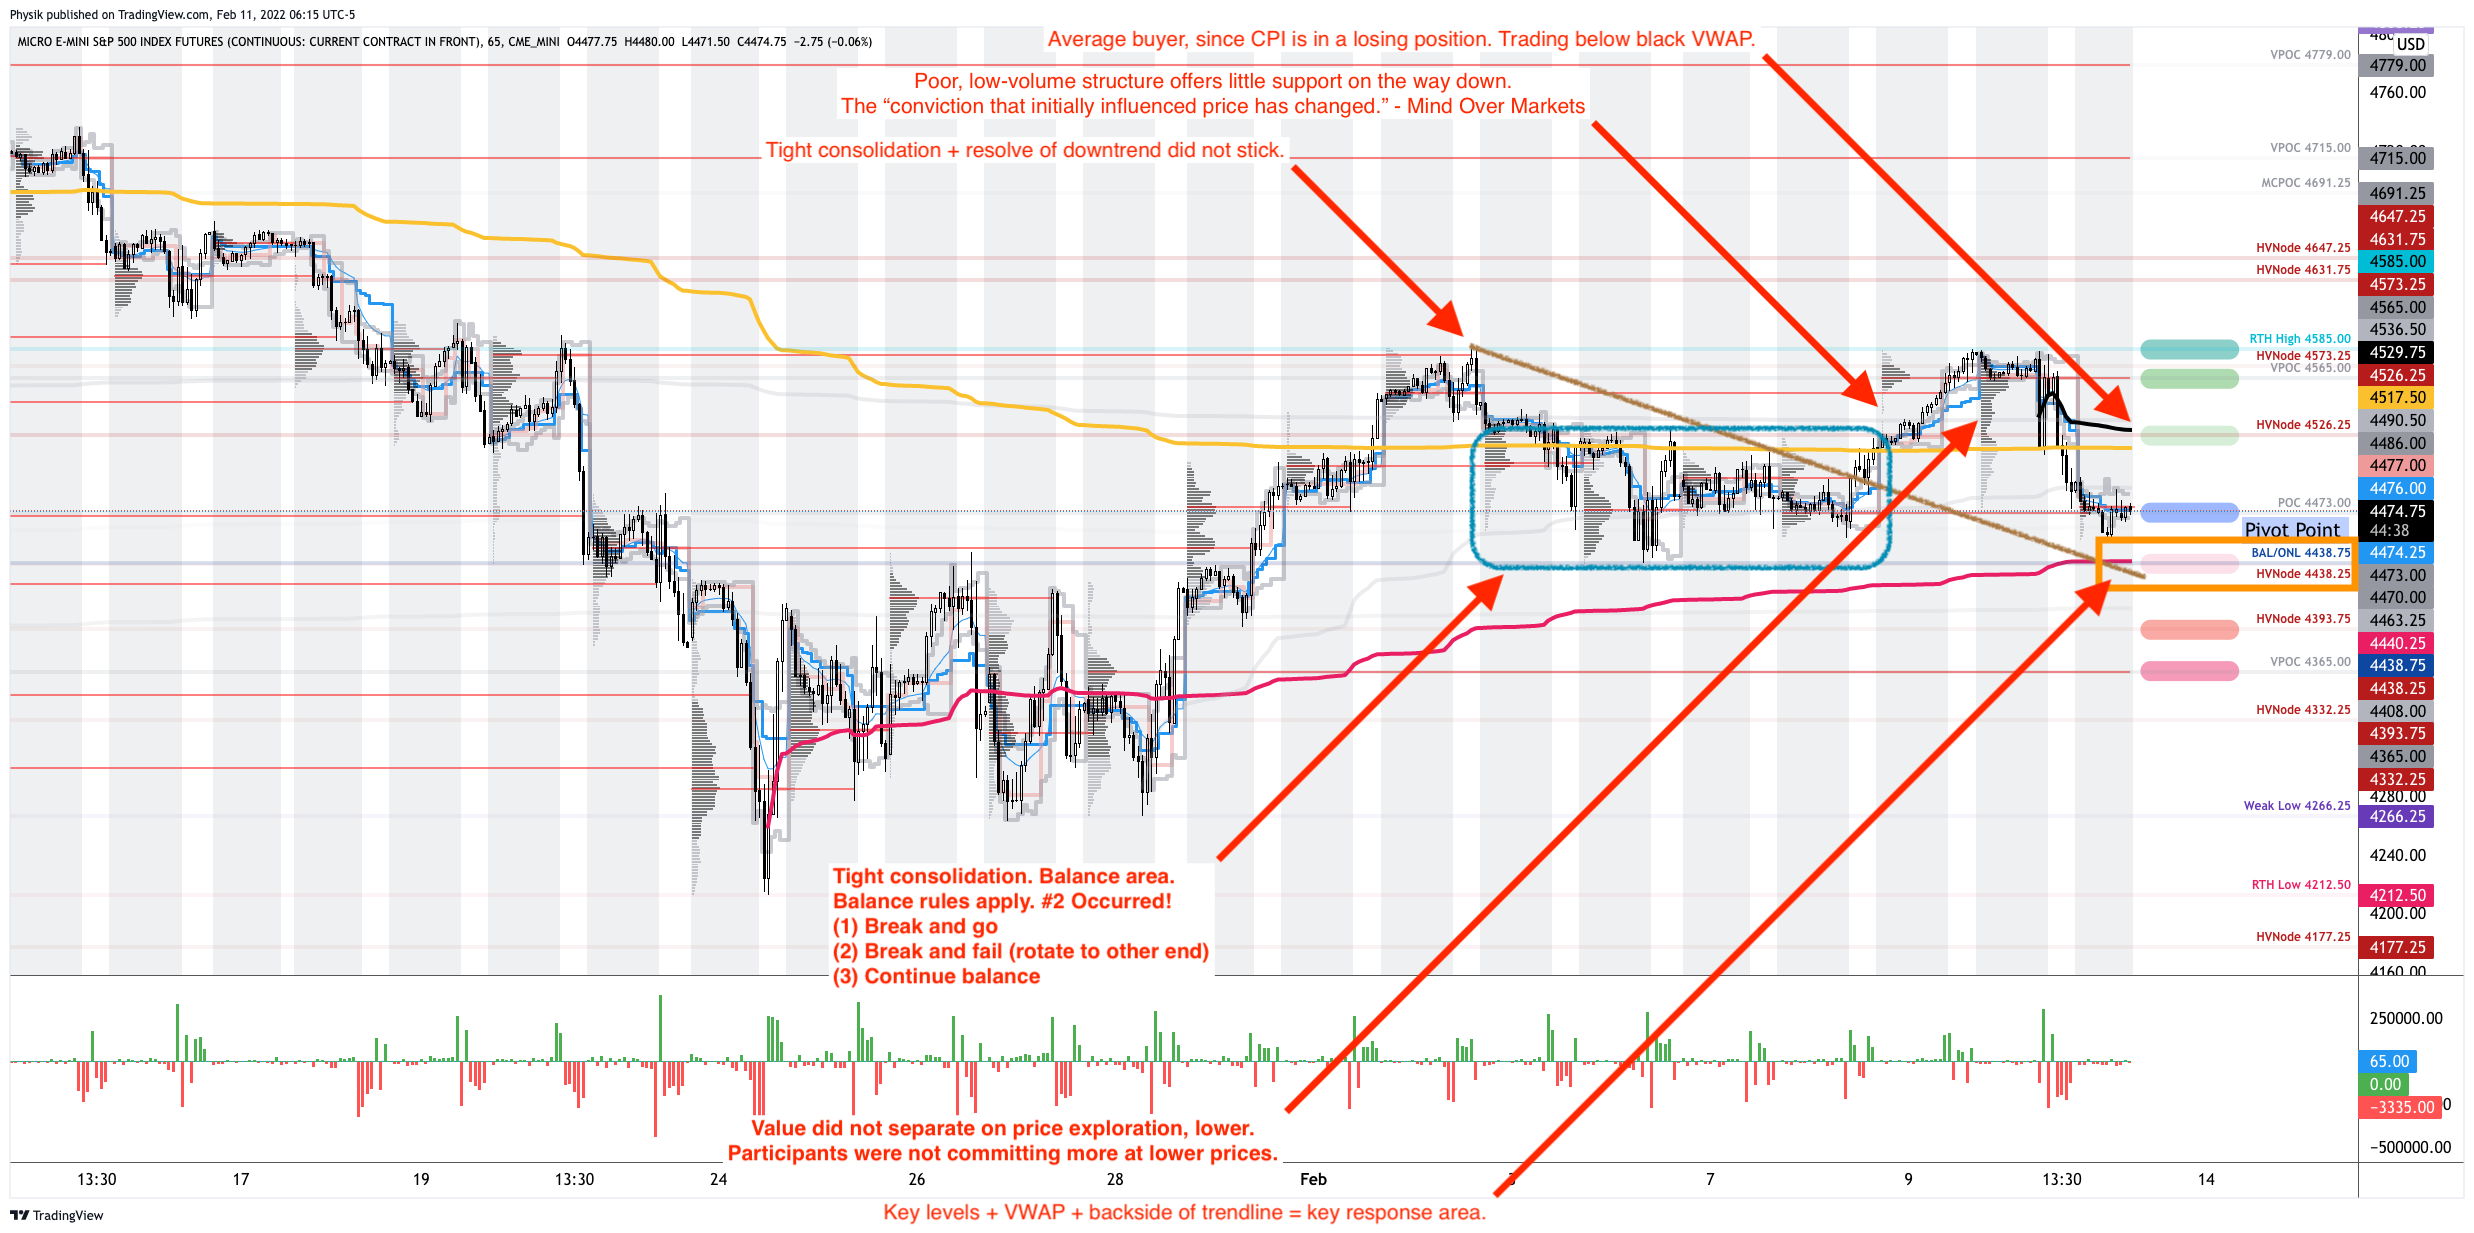
Technical: As of 6:30 AM ET, Friday’s regular session (9:30 AM – 4:00 PM ET), in the S&P 500, will likely open in the middle-to-lower part of a negatively skewed overnight inventory, inside of prior-range and -value, suggesting a limited potential for immediate directional opportunity.
In the best case, the S&P 500 trades higher; activity above the $4,473.00 point of control (POC) puts in play the $4,526.25 high volume area (HVNode). Initiative trade beyond the HVNode could reach as high as the $4,565.00 untested POC (VPOC) and $4,585.00 regular trade high (RTH High), or higher.
In the worst case, the S&P 500 trades lower; activity below the $4,473.00 POC puts in play the key response area at $4,438.75 (BAL/ONL/HVNode). Initiative trade beyond the key response area could reach as low as the $4,393.75 HVNode and $4,365.00 VPOC, or lower.
Click here to load today’s key levels into the web-based TradingView charting platform. Note that all levels are derived using the 65-minute timeframe. New links are produced, daily.
Graphic: 65-minute profile chart of the Micro E-mini S&P 500 Futures.
Definitions
Overnight Rally Highs (Lows): Typically, there is a low historical probability associated with overnight rally-highs (lows) ending the upside (downside) discovery process.
Volume Areas: A structurally sound market will build on areas of high volume (HVNodes). Should the market trend for long periods of time, it will lack sound structure, identified as low volume areas (LVNodes). LVNodes denote directional conviction and ought to offer support on any test.
If participants were to auction and find acceptance into areas of prior low volume (LVNodes), then future discovery ought to be volatile and quick as participants look to HVNodes for favorable entry or exit.
POCs: POCs are valuable as they denote areas where two-sided trade was most prevalent in a prior day session. Participants will respond to future tests of value as they offer favorable entry and exit.
Options Expiration (OPEX): Traditionally, option expiries mark an end to trend or pinning (i.e, the theory that market makers and institutions short options move stocks to the point where the greatest dollar value of contracts will expire) and the reset in dealer gamma exposure.
Volume-Weighted Average Prices (VWAPs): A metric highly regarded by chief investment officers, among other participants, for quality of trade. Additionally, liquidity algorithms are benchmarked and programmed to buy and sell around VWAPs.
About
After years of self-education, strategy development, mentorship, and trial-and-error, Renato Leonard Capelj began trading full-time and founded Physik Invest to detail his methods, research, and performance in the markets.
Capelj is also a Benzinga finance and technology reporter interviewing the likes of Shark Tank’s Kevin O’Leary, JC2 Ventures’ John Chambers, FTX’s Sam Bankman-Fried, and ARK Invest’s Catherine Wood, as well as a SpotGamma contributor developing insights around impactful options market dynamics.
Disclaimer
Physik Invest does not carry the right to provide advice.
In no way should the materials herein be construed as advice. Derivatives carry a substantial risk of loss. All content is for informational purposes only.