Categories
Commentary

Daily Brief For August 18, 2022

The daily brief is a free glimpse into the prevailing fundamental and technical drivers of U.S. equity market products. Join the 800+ that read this report daily, below!

Graphic updated 7:20 AM ET. Sentiment Neutral if expected /ES open is inside of the prior day’s range. /ES levels are derived from the profile graphic at the bottom of the following section. Levels may have changed since initially quoted; click here for the latest levels. SqueezeMetrics Dark Pool Index (DIX) and Gamma (GEX) calculations are based on where the prior day’s reading falls with respect to the MAX and MIN of all occurrences available. A higher DIX is bullish. At the same time, the lower the GEX, the more (expected) volatility. Learn the implications of volatility, direction, and moneyness. Breadth reflects a reading of the prior day’s NYSE Advance/Decline indicator. VIX reflects a current reading of the CBOE Volatility Index (INDEX: VIX) from 0-100.
Hey team – the Daily Brief will be paused until August 29, at least, due to Renato’s travel commitments. 

Apologies and thank you for the support!

Positioning

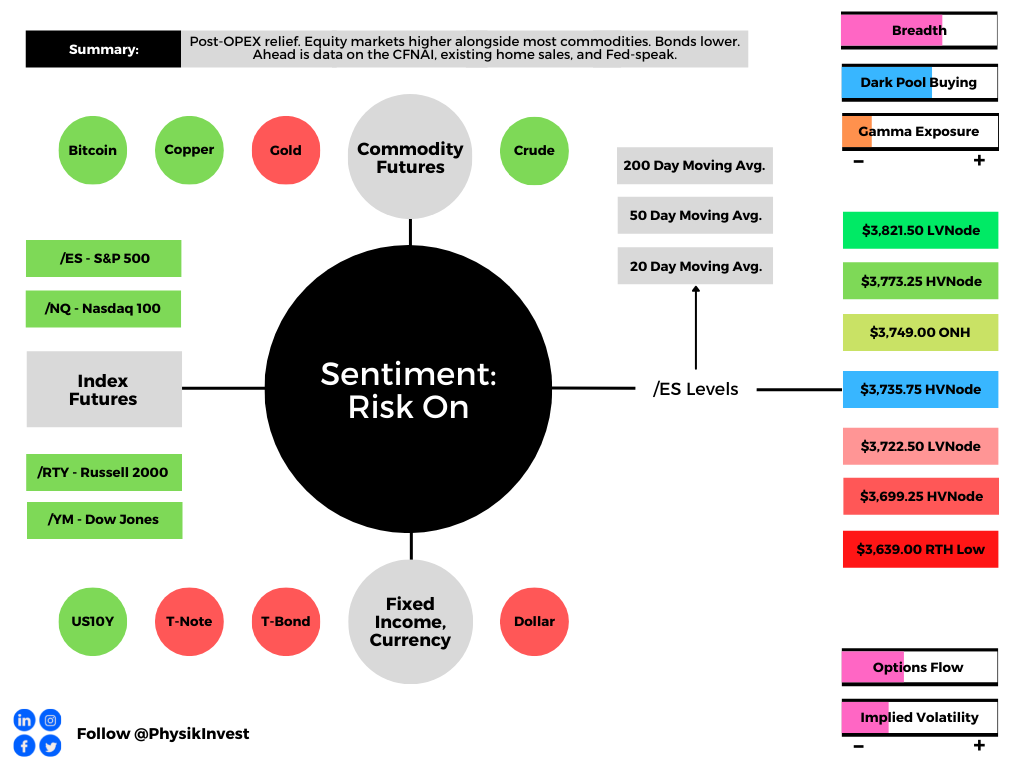
As of 7:20 AM ET, Thursday’s expected volatility, via the Cboe Volatility Index (INDEX: VIX), sits at ~1.05%. Net Gamma exposures (generally) rising may promote tighter trading ranges.

Graphic: Via Physik Invest. Data retrieved from SqueezeMetrics.

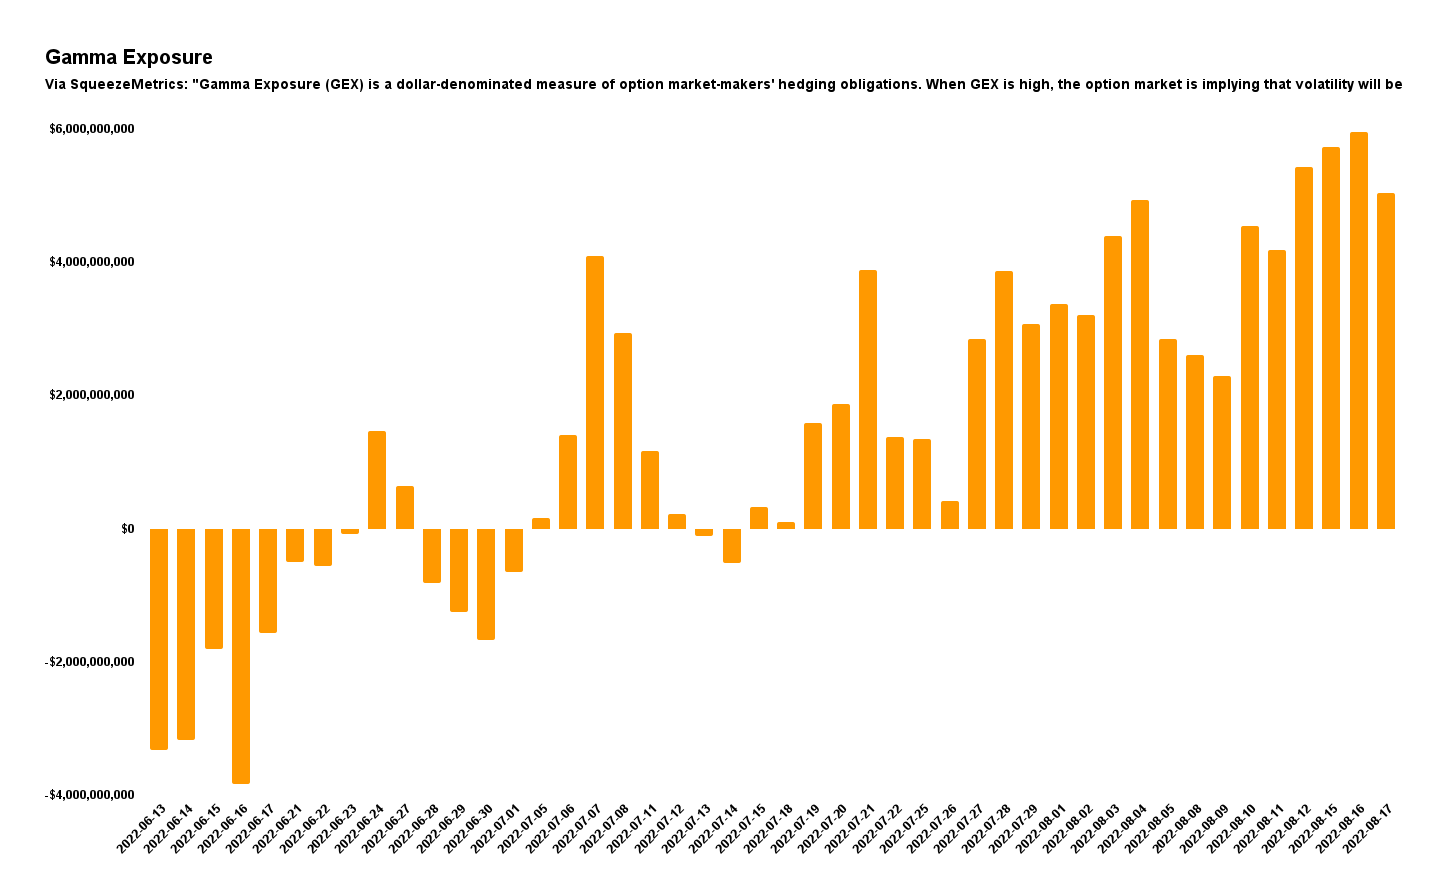
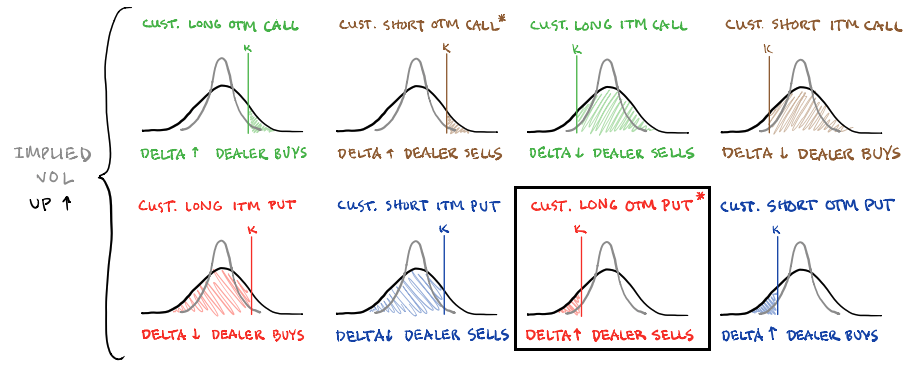
As an aside, real quick, in a rising market, characterized by demand for call options, those who are on the other side of options trades, hedge in a manner that may bolster the upside (i.e., the naive theory is that if customers buy calls, then counterparties sell calls + buy stock to hedge).

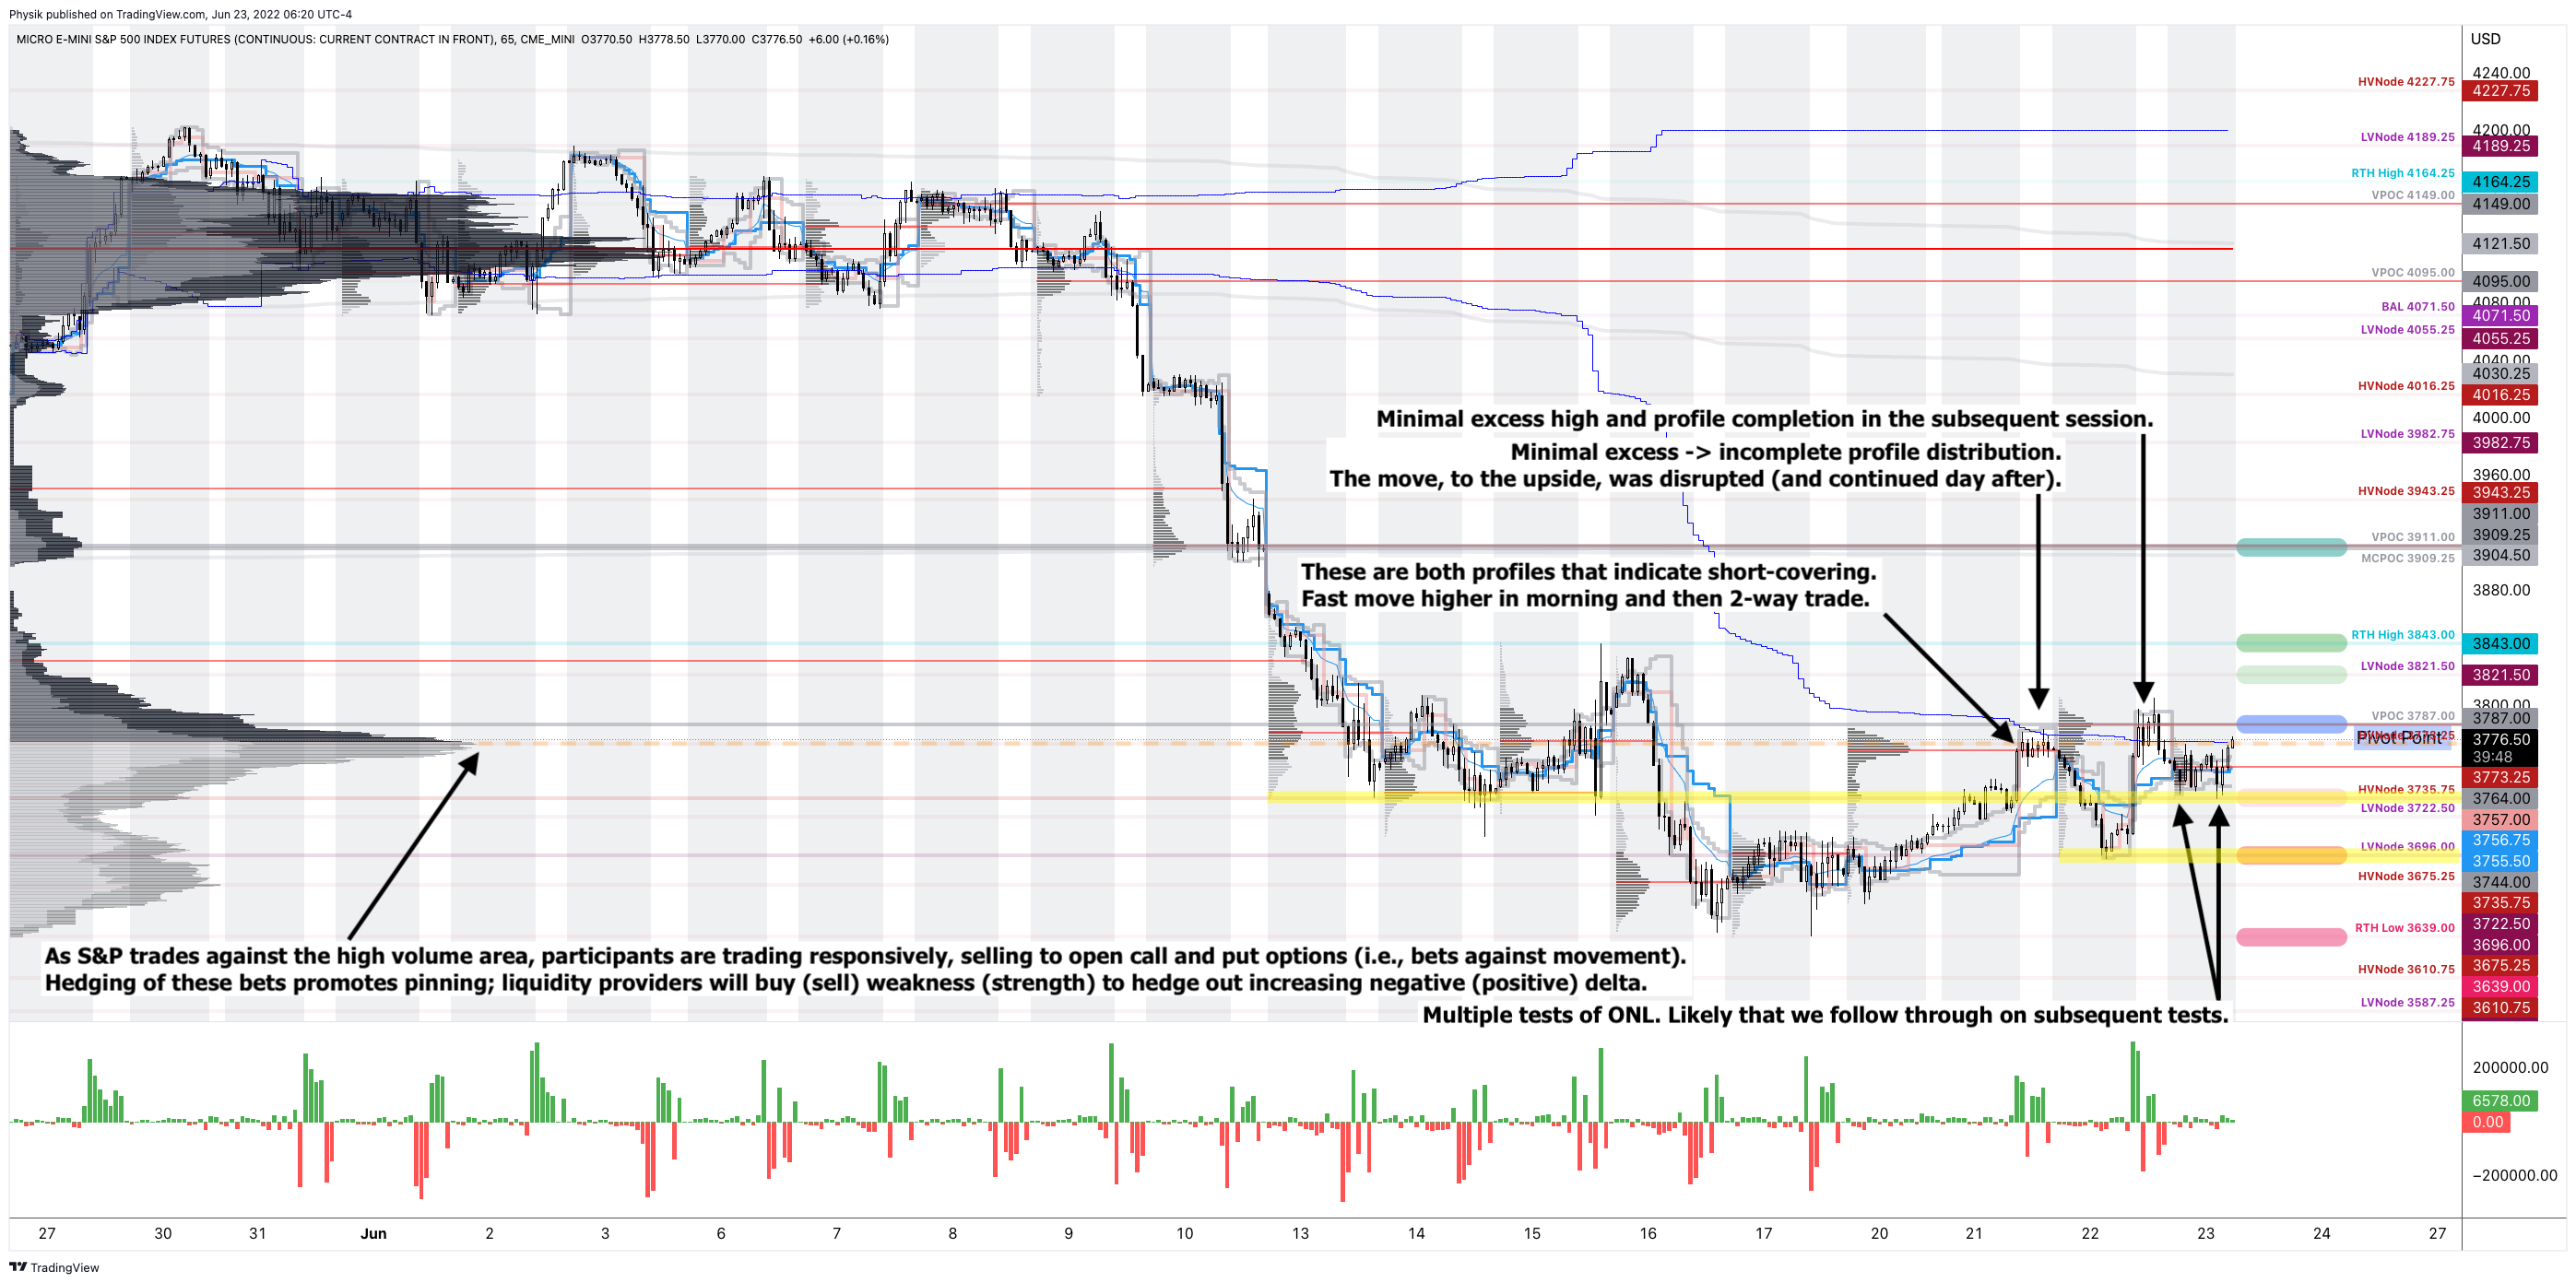
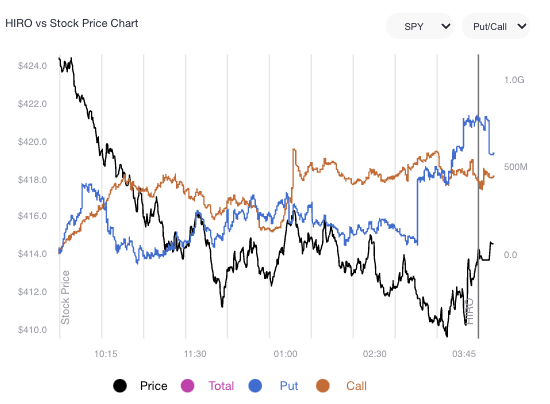
That said, if IVOL drops, liquidity providers’ out-of-the-money (in-the-money) Delta exposures drop (rise) and, thus, they will sell (buy) underlying hedges which may pressure (support) the advance or play into pinning action, as seen over the past week or so at the $4,300.00 options strike, at which there is a lot of open interest and volume, in the S&P 500.

Read: The Implied Order Book by SqueezeMetrics for a sort-of detailed primer on this.

Graphic: Updated 8/15/2022. Retrieved from SqueezeMetrics.

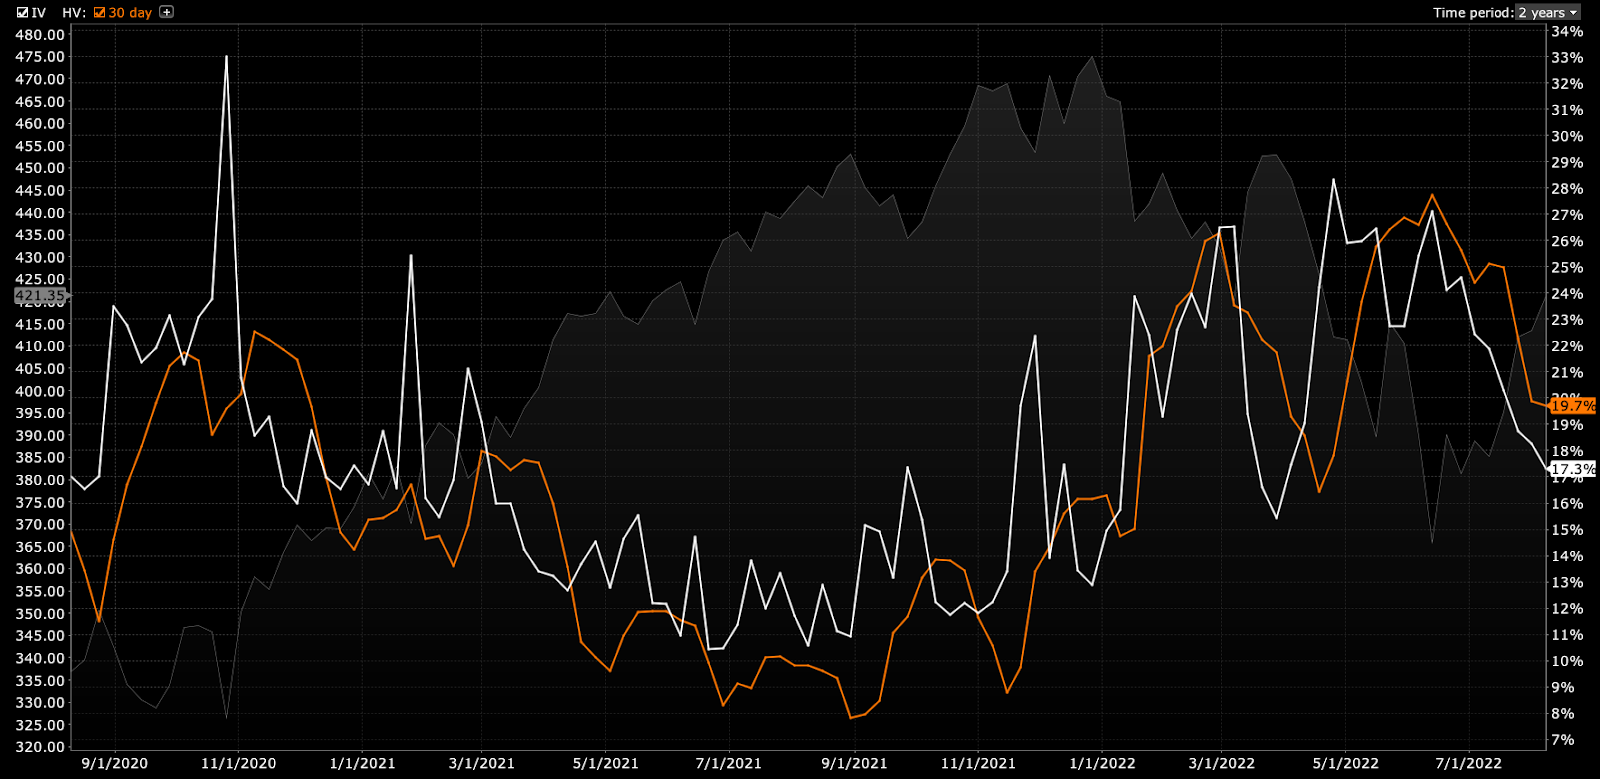
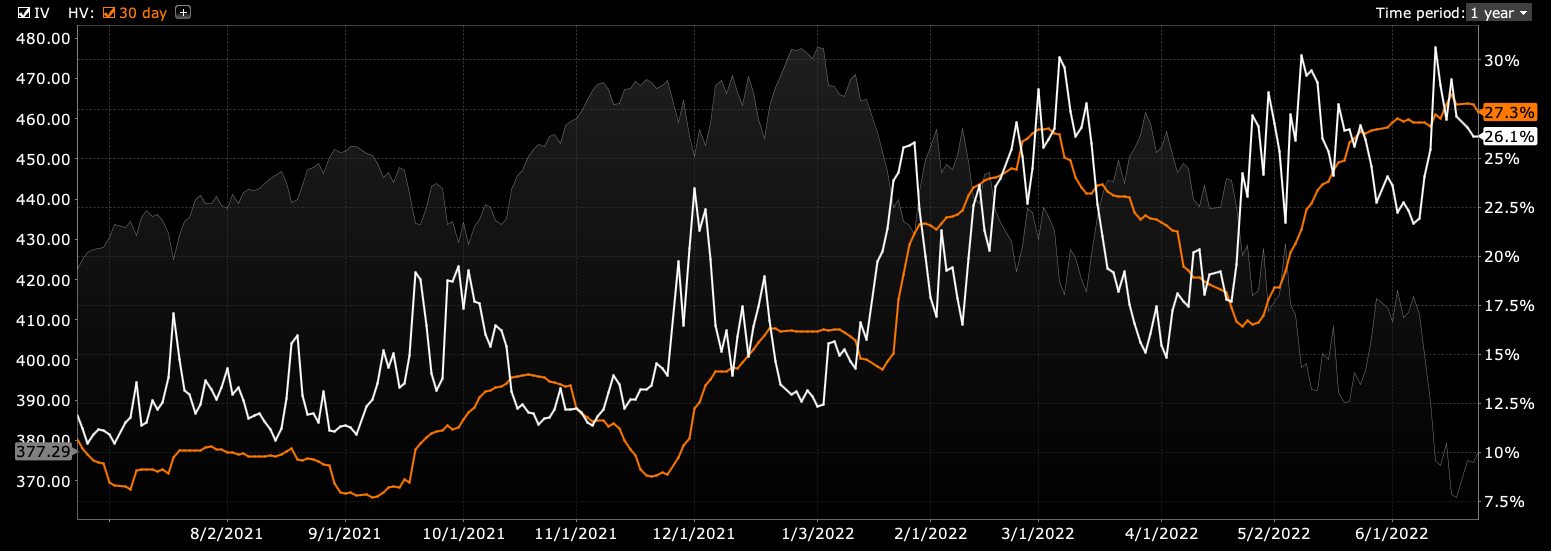
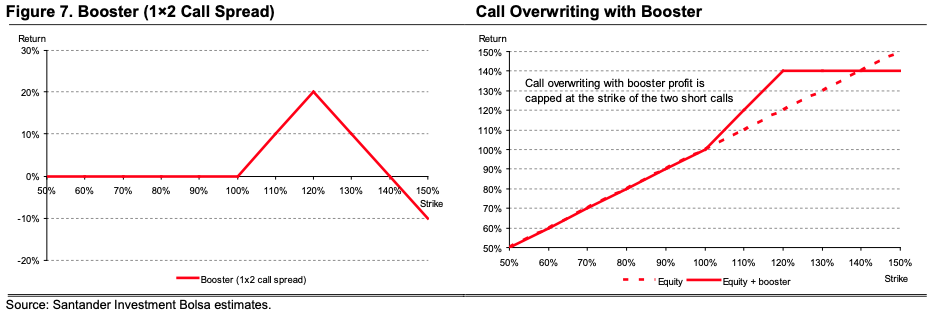
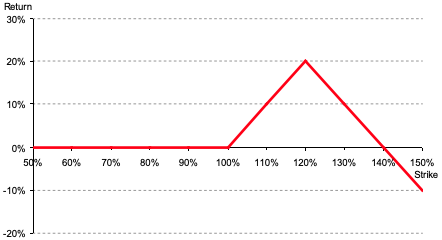
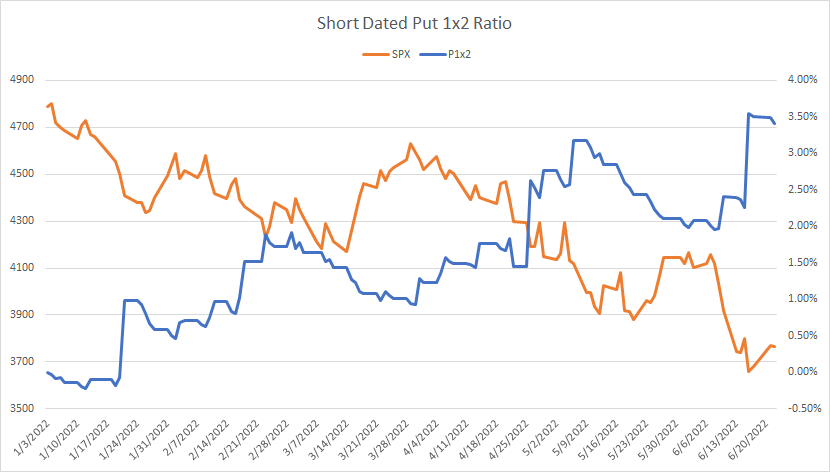
Given realized (RVOL) and implied (IVOL) volatility measures, as well as skew, it is beneficial to be a buyer of options structures to protect against (potential) downside (e.g., S&P 500 [INDEX: SPX] +1 x -2 Short Ratio Put Spread | 200+ Points Wide | 15-30 DTE | @ $0.00 or better).

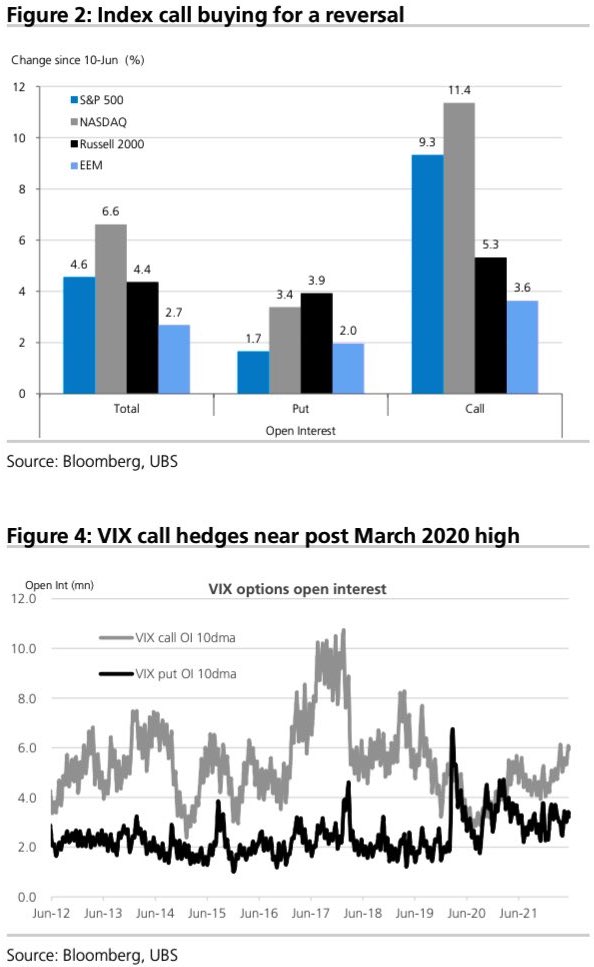
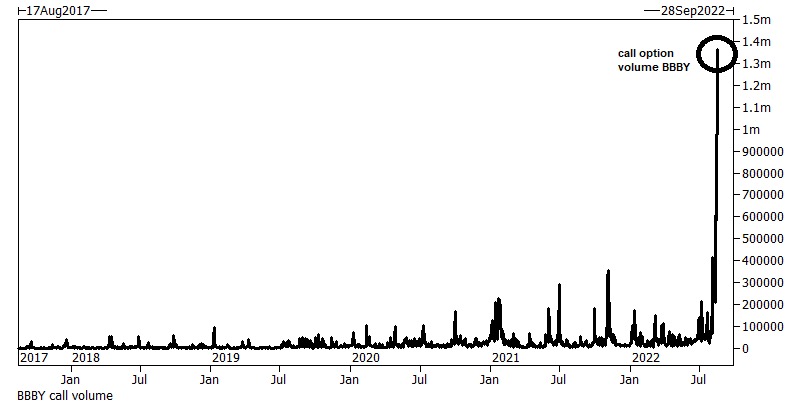
This is not to say that call options, which we said could “outperform” their Delta (i.e., exposure to direction) weeks ago, are out of favor (note: this is the case for something such as an SPX, not a Bed Bath & Beyond Inc [NASDAQ: BBBY]).

Graphic: Retrieved from Corey Hoffstein. Via Goldman Sachs Group Inc (NYSE: GS).

No! On the contrary, Goldman Sachs Group Inc (NYSE: GS) strategists say “call premiums are attractive.” This is “evidenced by [their] GS-EQMOVE model which estimates 33% probability of a 1-month 5% up-move versus only 13% implied by the options market.”

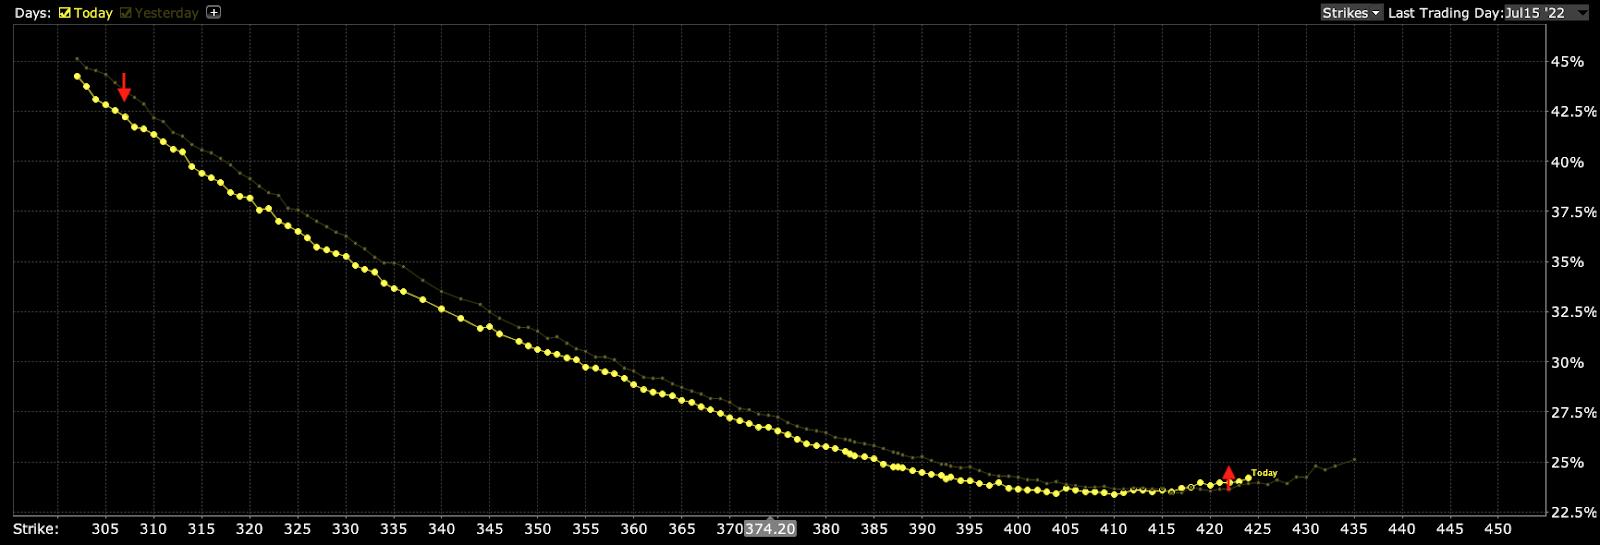
A quick check of implied volatility skew, which is a plot of the implied volatility levels for options across different strike prices, shows a smile in the shortest of tenors, rather than a usual smirk.

Graphic: Retrieved from Cboe Global Markets Inc (BATS: CBOE).

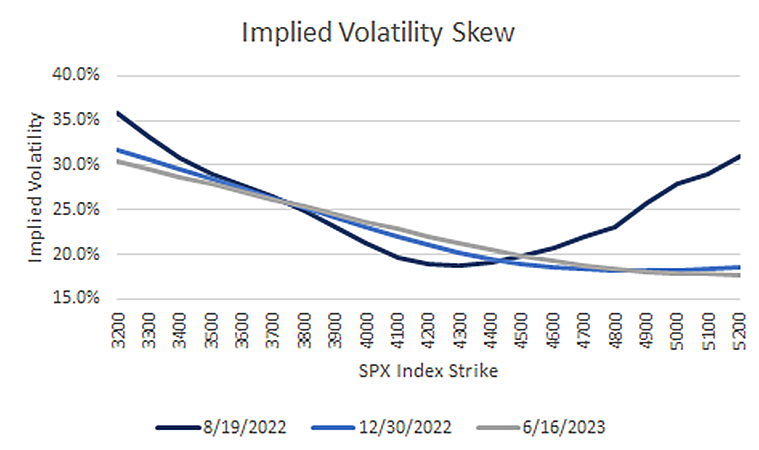
Given this, the options with strike prices above current market prices are seemingly more pricey than those that have more time to expiration. One could think about structuring something like a Short Ratio Call Spread or, even, a Long Call Calendar Spread at or above current prices. 

In the latter, any sideways-to-higher movement would allow for that spread to expand for profit.

Graphic: Via Banco Santander SA (NYSE: SAN) research, the return profile, at expiry, of a classic 1×2 (long 1, short 2 further away) ratio spread.

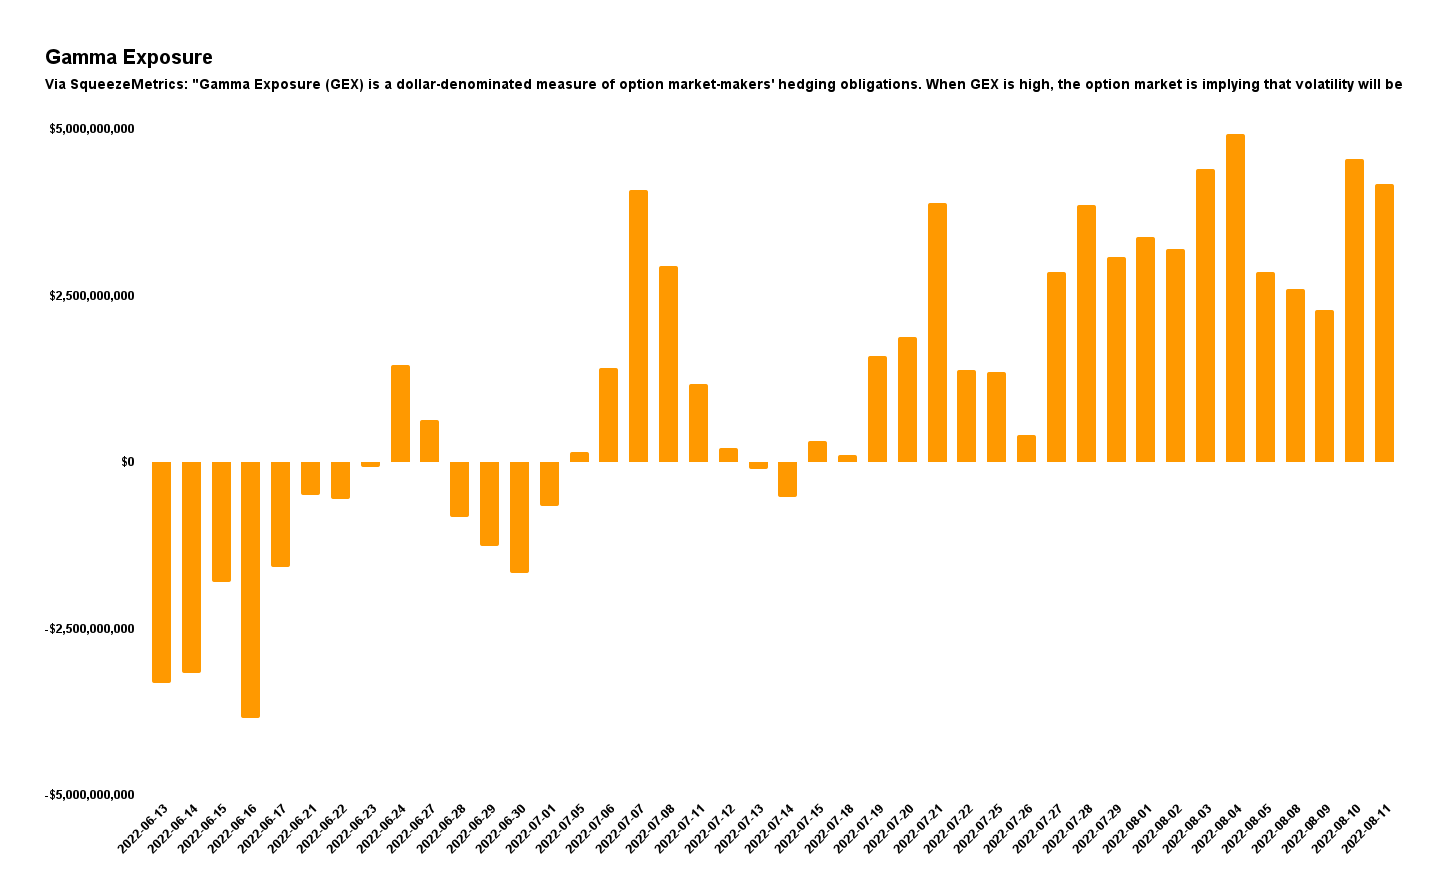
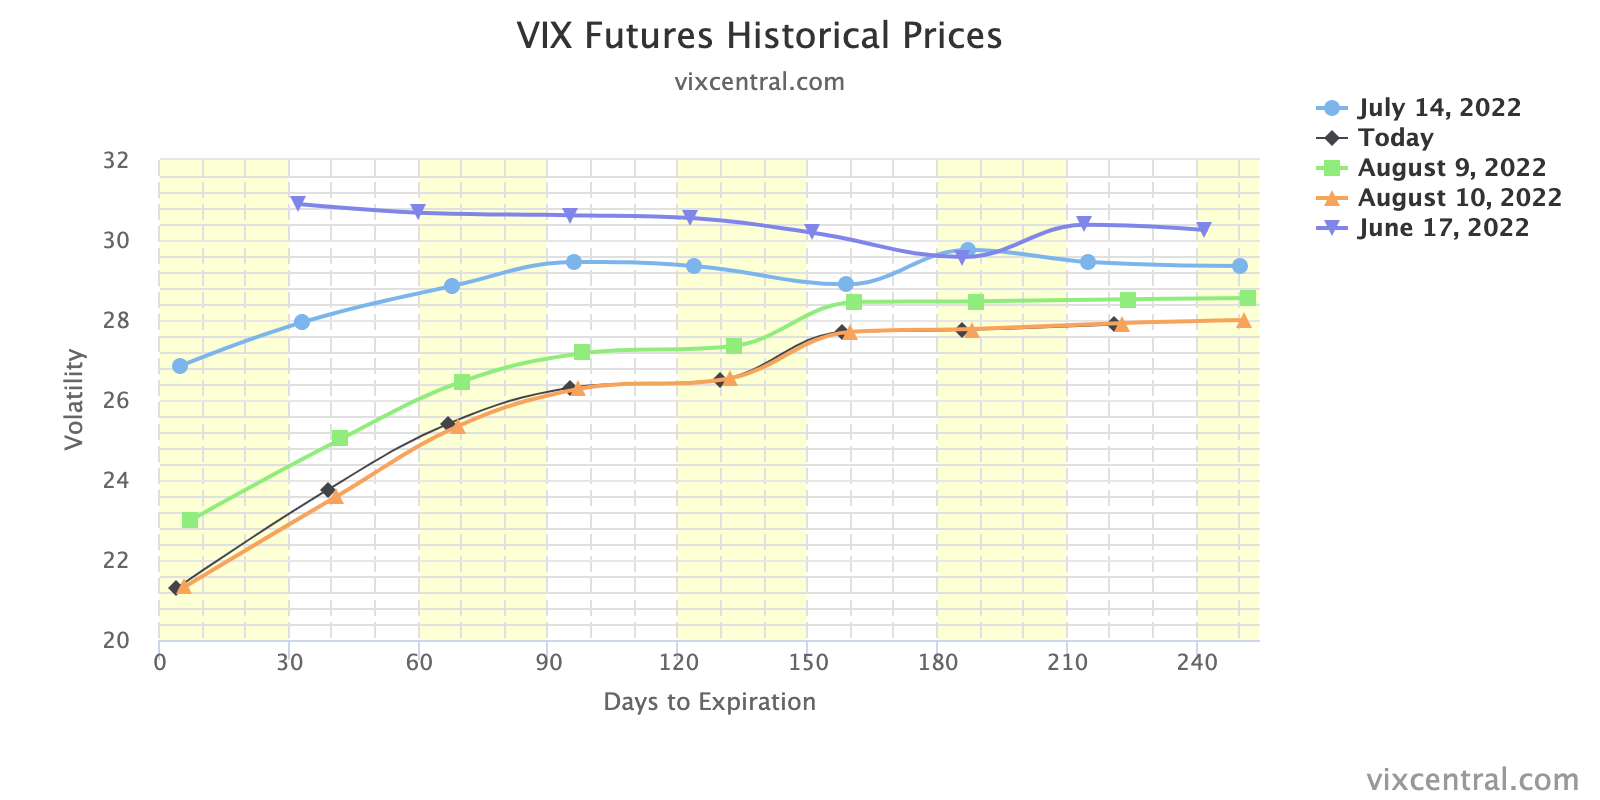
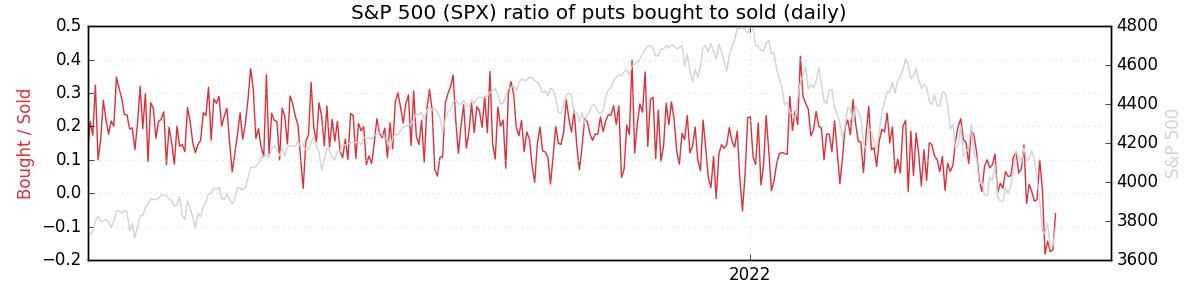
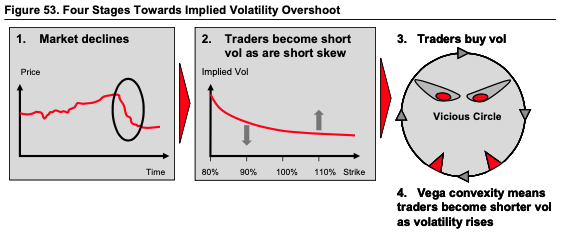
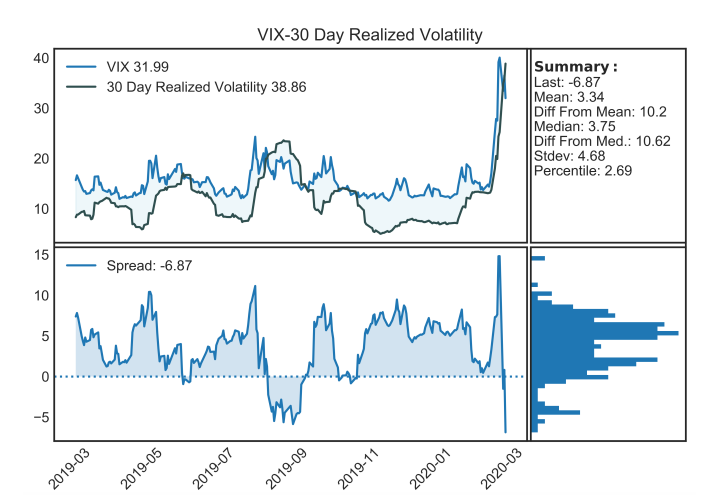
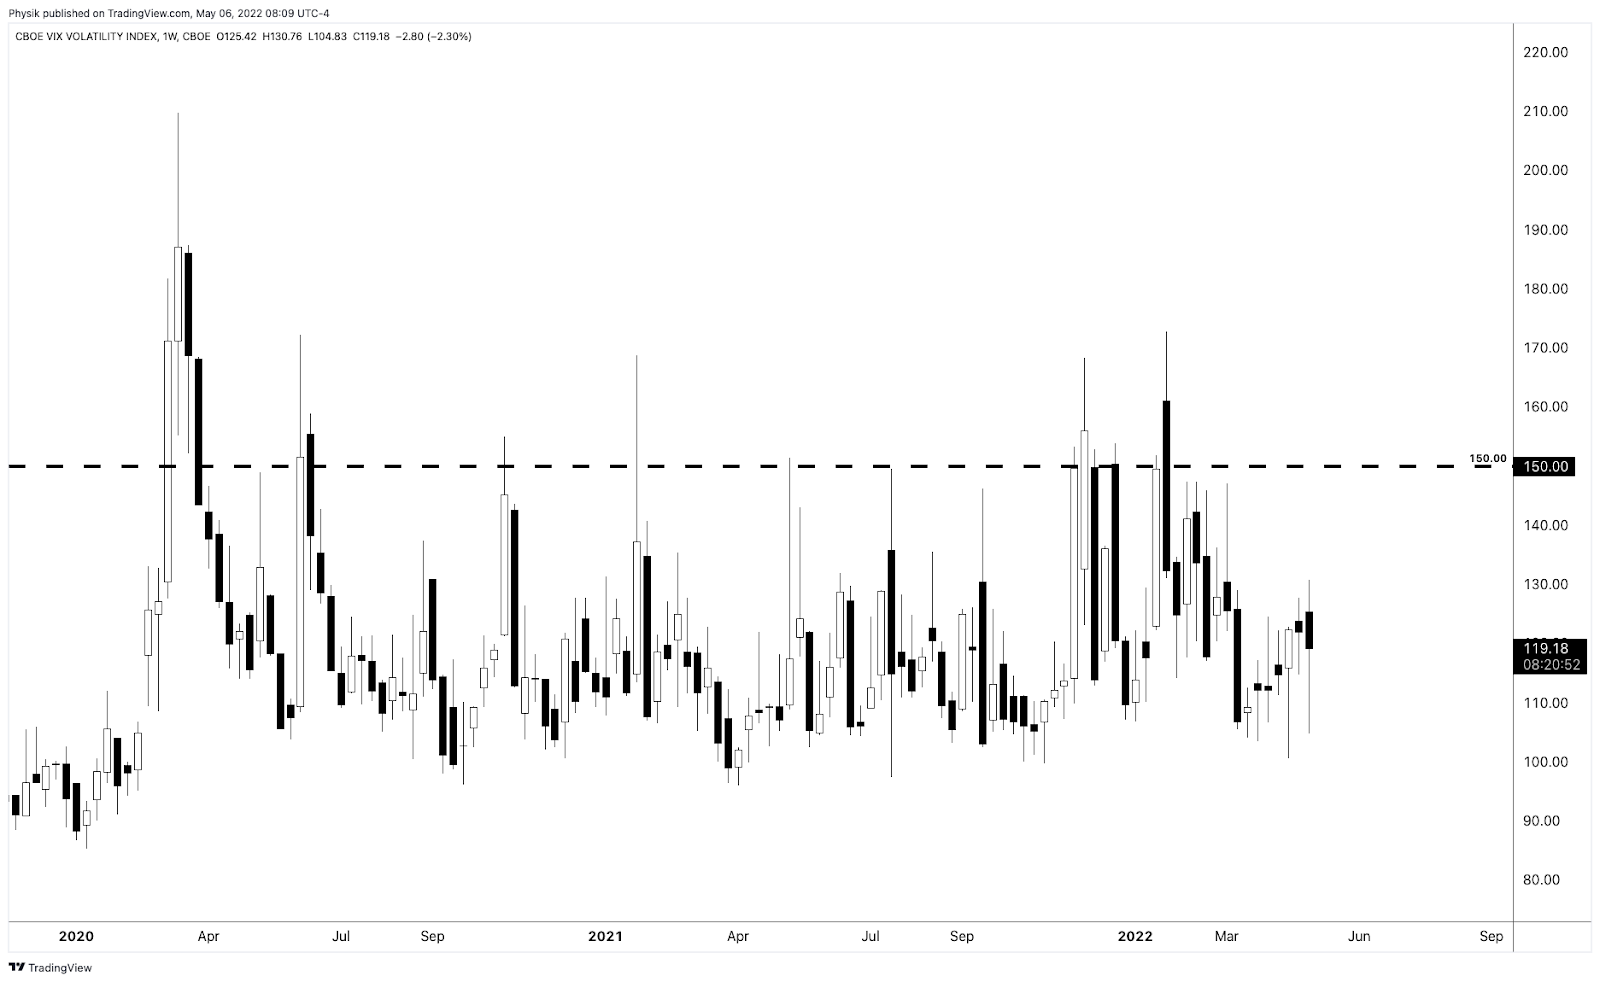
Context: Participants’ proactive hedging of positive Delta equity exposure, via negative Delta put option exposures, as well as the monetization of those hedges into the decline, resulted in poor performance in IVOL metrics like the Cboe Volatility Index (INDEX: VIX).

Therefore, per the Cboe, it’s the case that “since the launch of the VIX Index, the past six-month period has been the weakest for volatility in 29 years, relative to similar [SPX] price moves.”

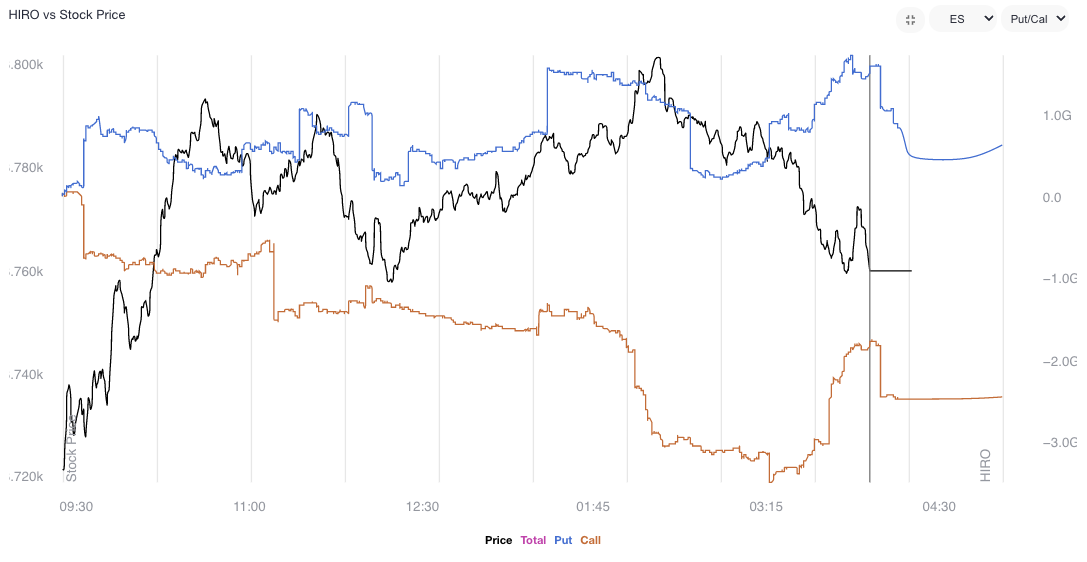
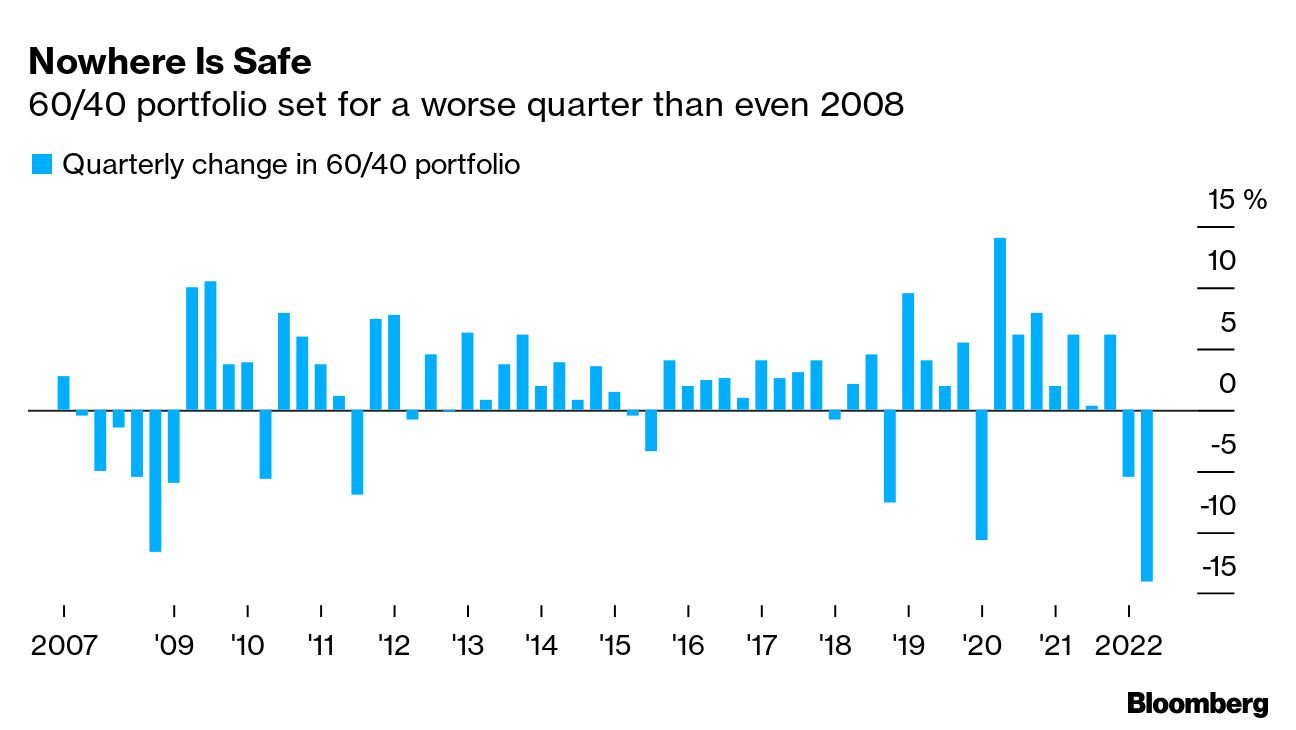
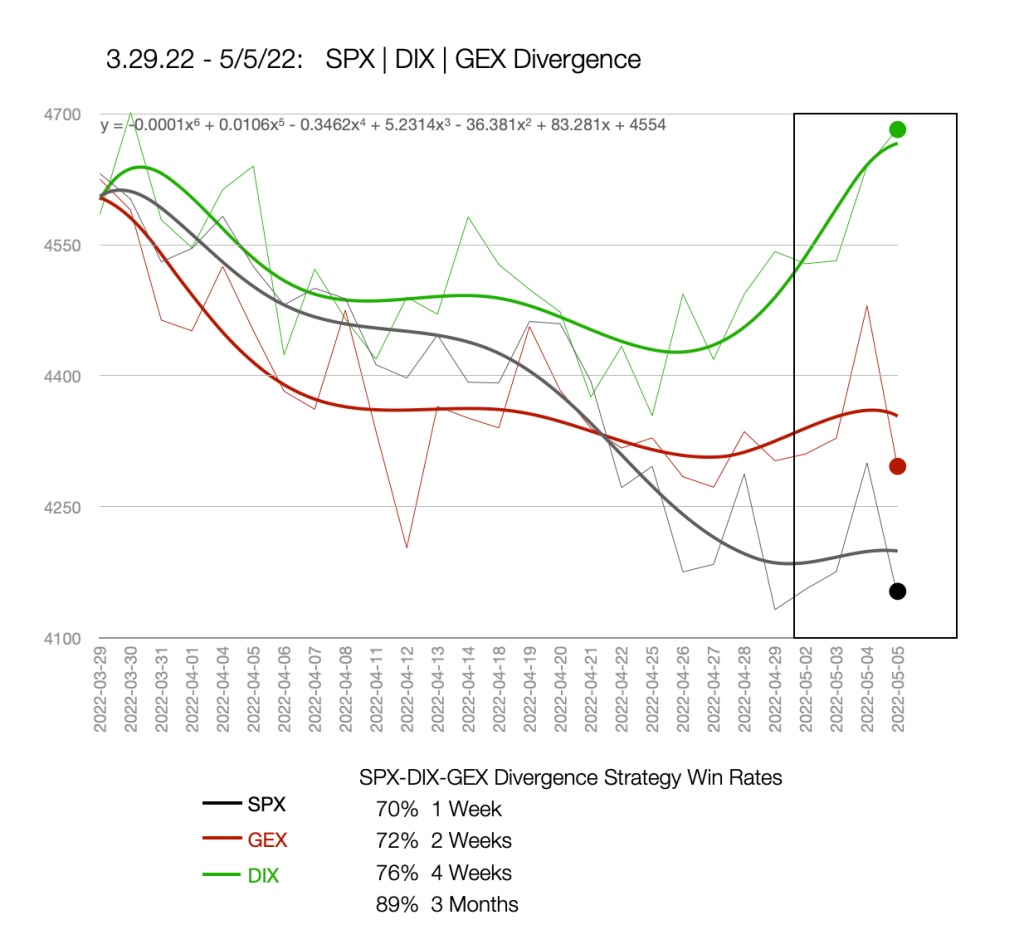
Accordingly, its structures we thought would work best, given the potential for measured selling, which others thought would carry a lot of risks, such as Short Ratio Put Spreads, that performed best, seen below.

Graphic: Via Pat Hennessy. “[T]he performance of short-dated 1×2 put ratios in SPX this year. Despite being short the tail, the grind lower has been well captured by this trade structure.”

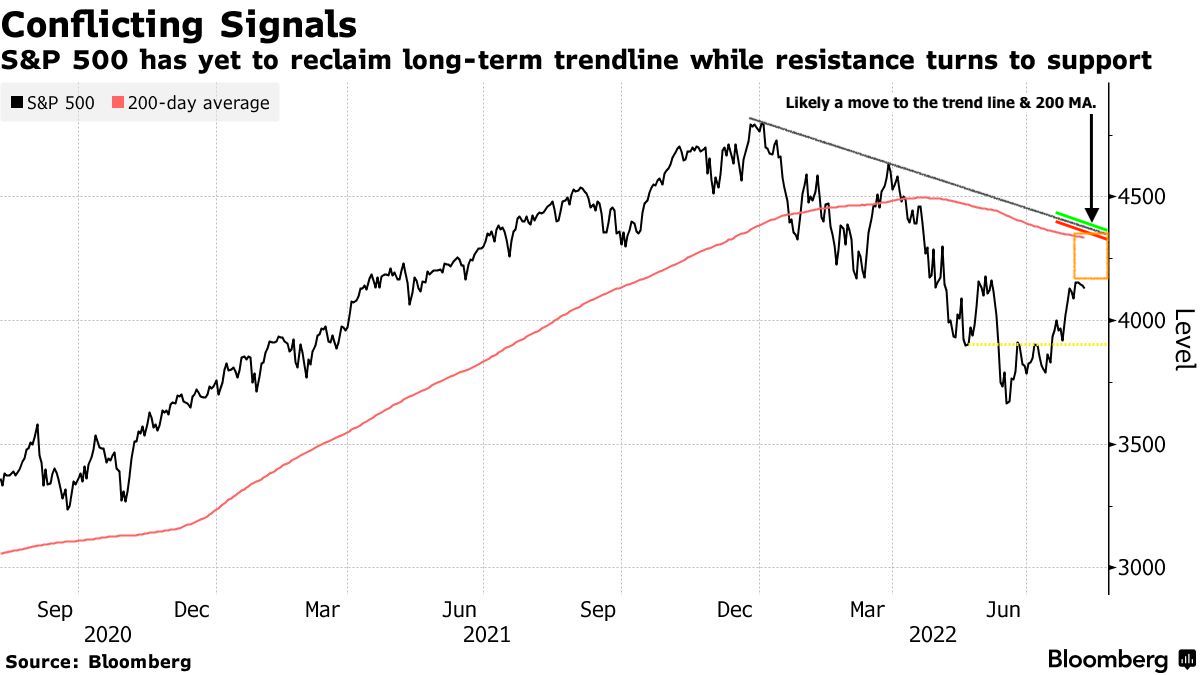
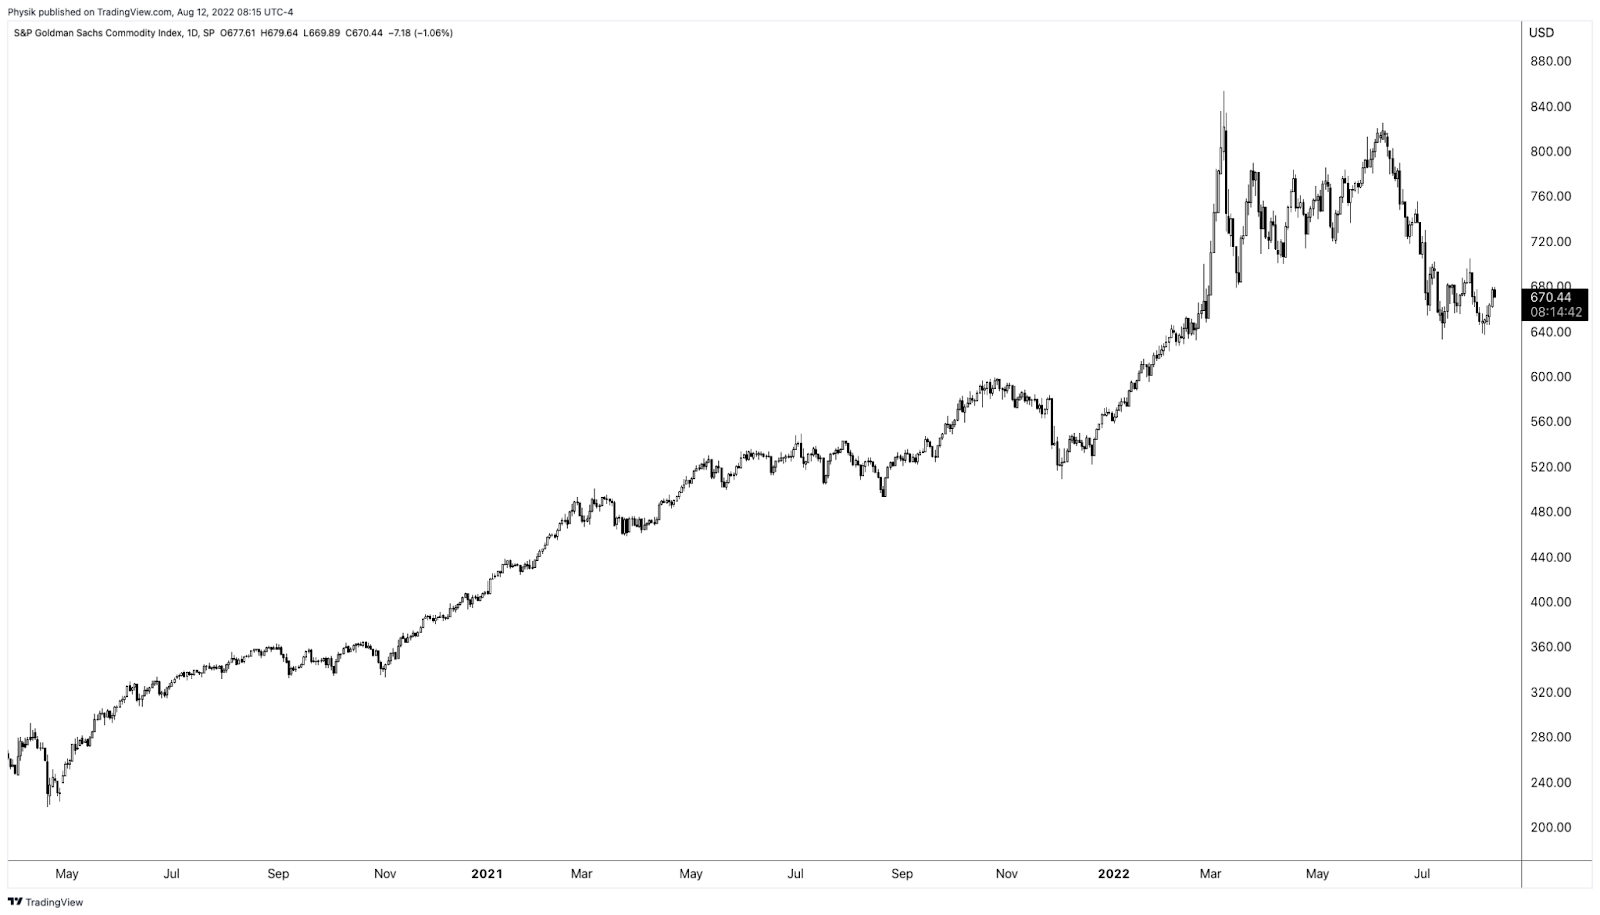
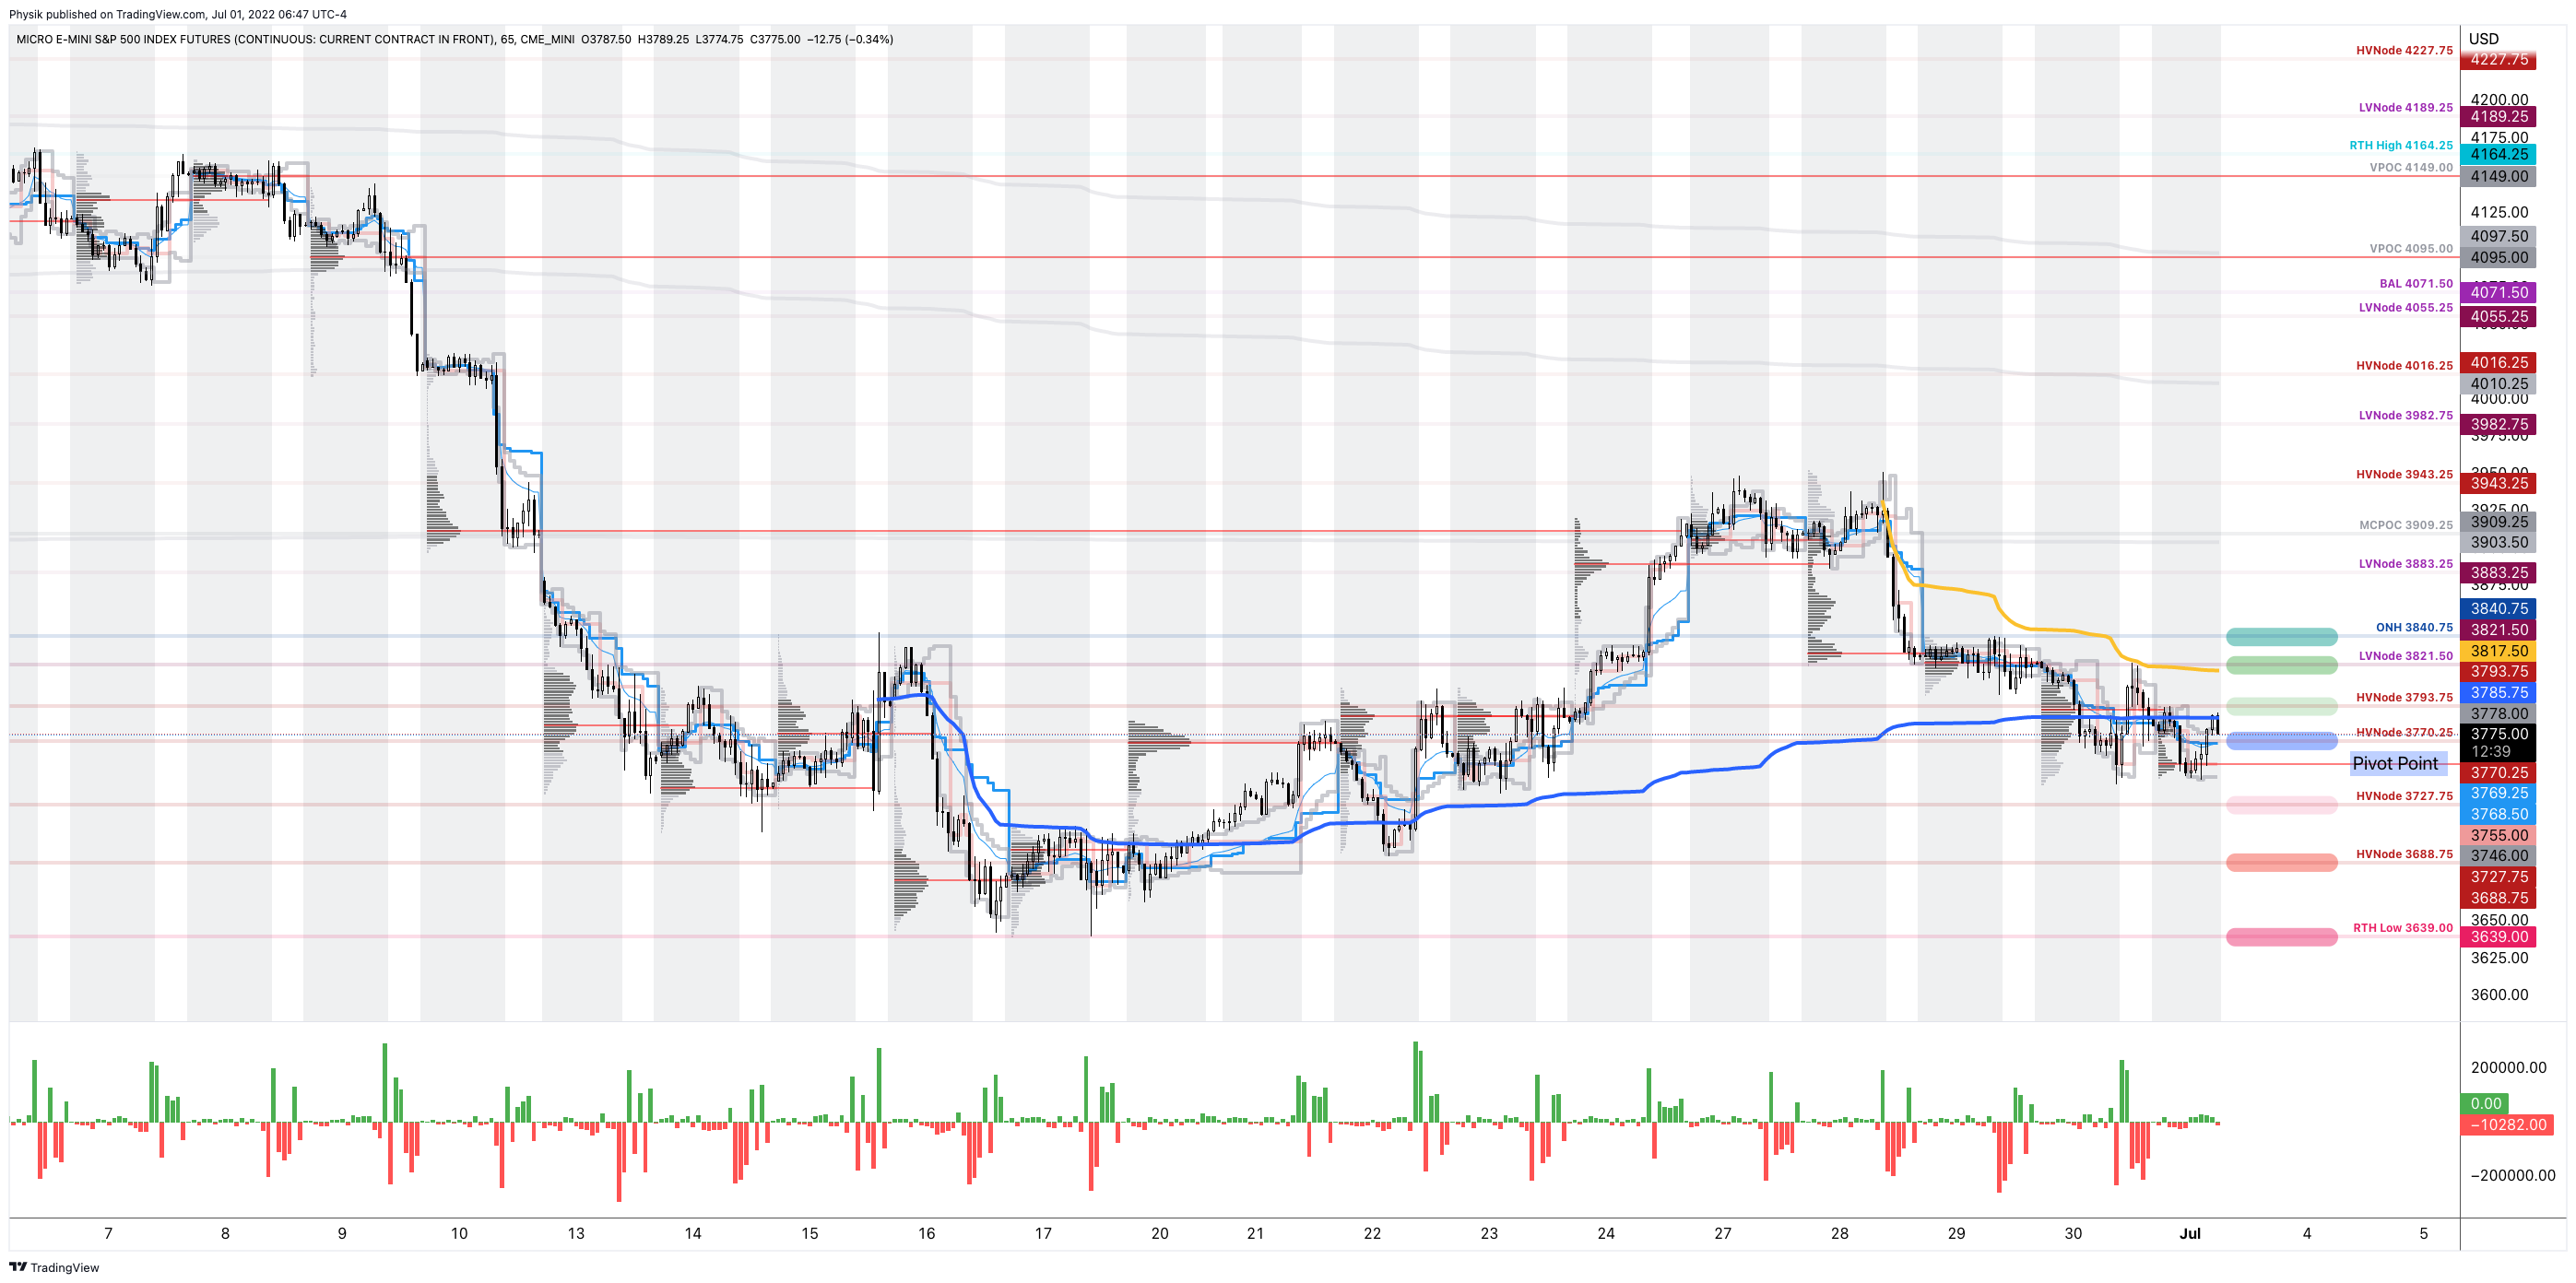
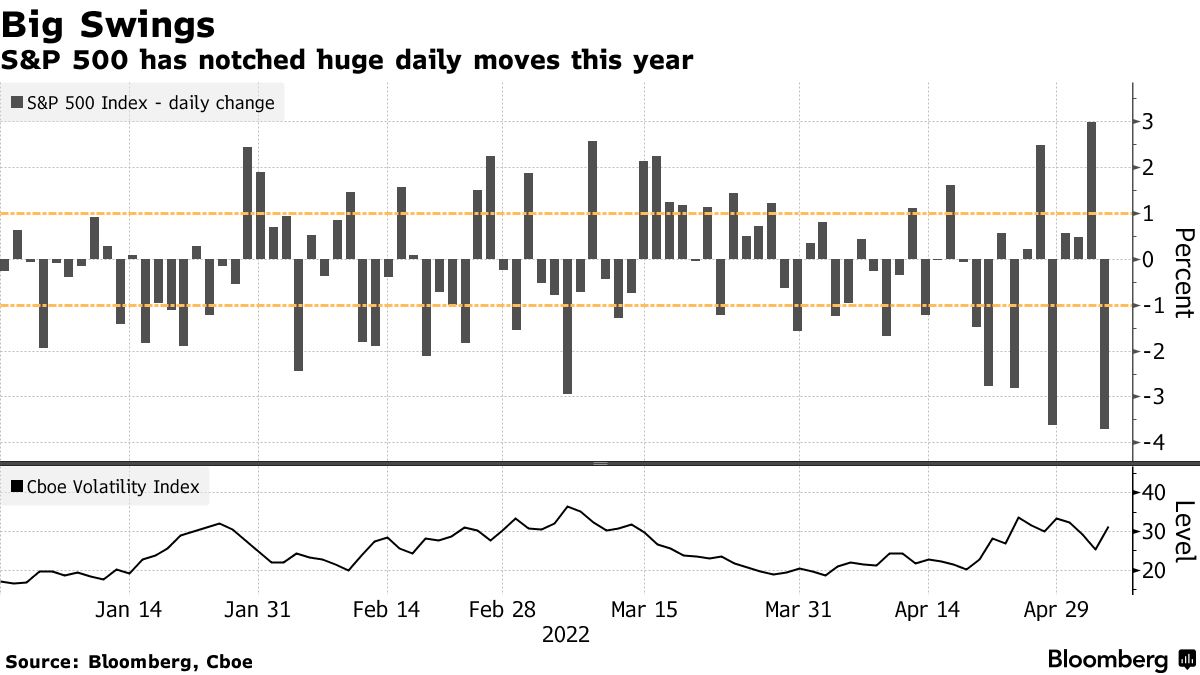
Moreover, it’s the case that after a nearly 20% multi-month run, higher, markets are stretched. 

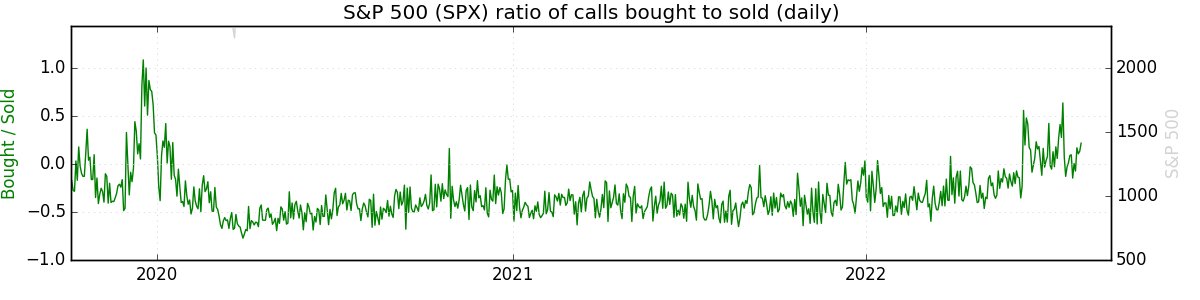
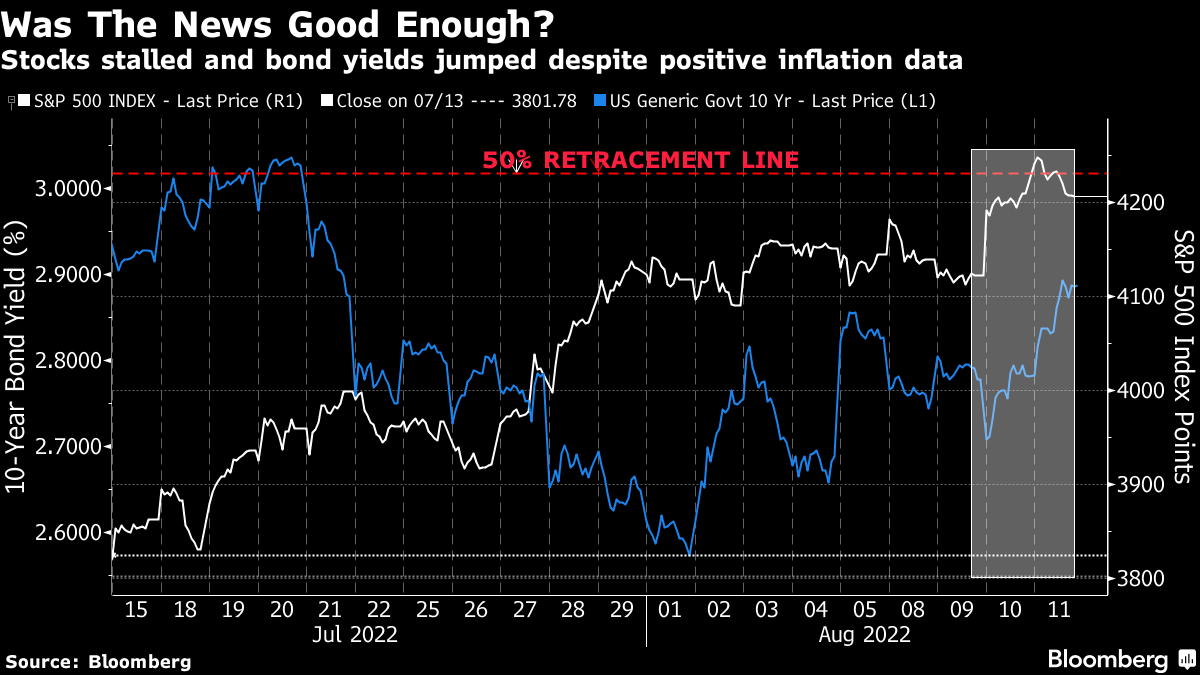
To continue this pace would require, per JPMorgan Chase & Co (NYSE: JPM) strategists, a continued interest in demand for positive Delta exposure via equity or options, lower prints of consumer price data, as well as a dovish Federal Reserve (Fed) inflection.

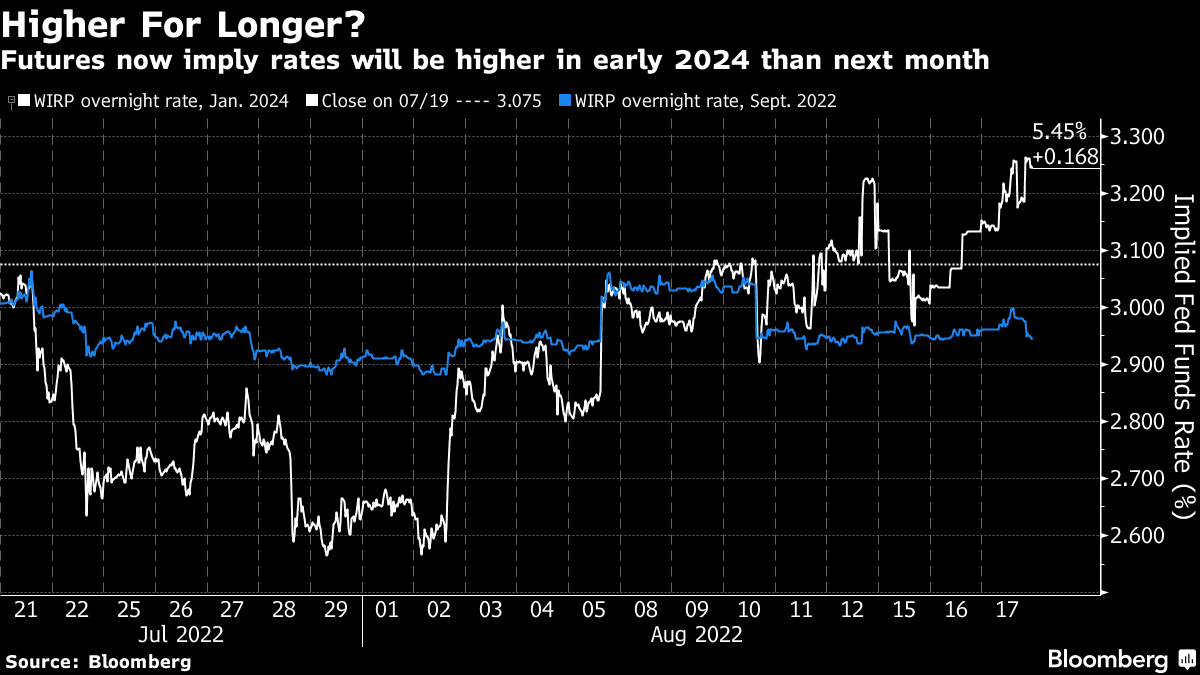
The former we see now via call option volumes. The latter, not so much as the Federal Open Market Committee (FOMC) minutes “left the door open to another ‘unusually large’ increase at the next meeting in September,” in spite of a commitment to dial back if the data supported.

Graphic: Via Physik Invest. Data compiled by @jkonopas623. Fed Balance Sheet data, here. Treasury General Account Data, here. Reverse Repo data, here. NL = BS – TGA – RRP.

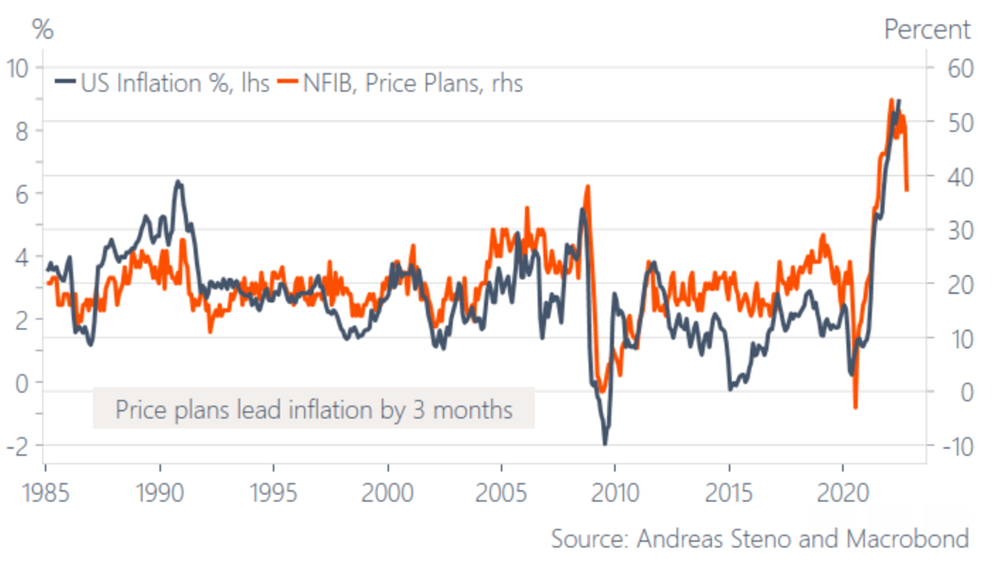
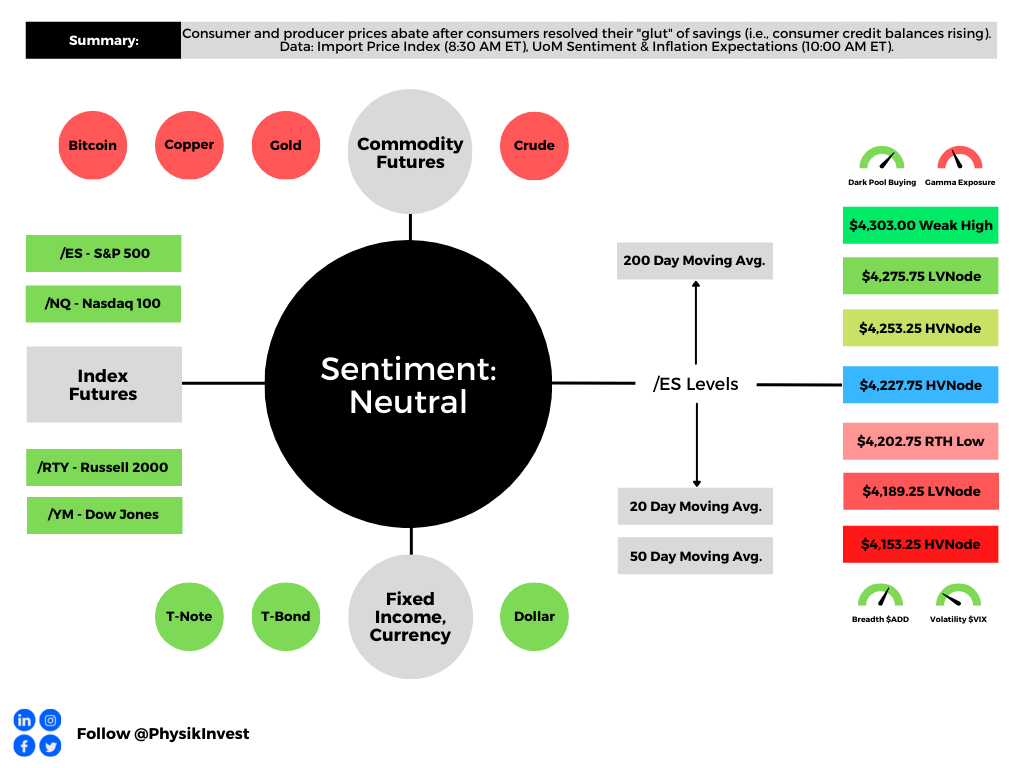
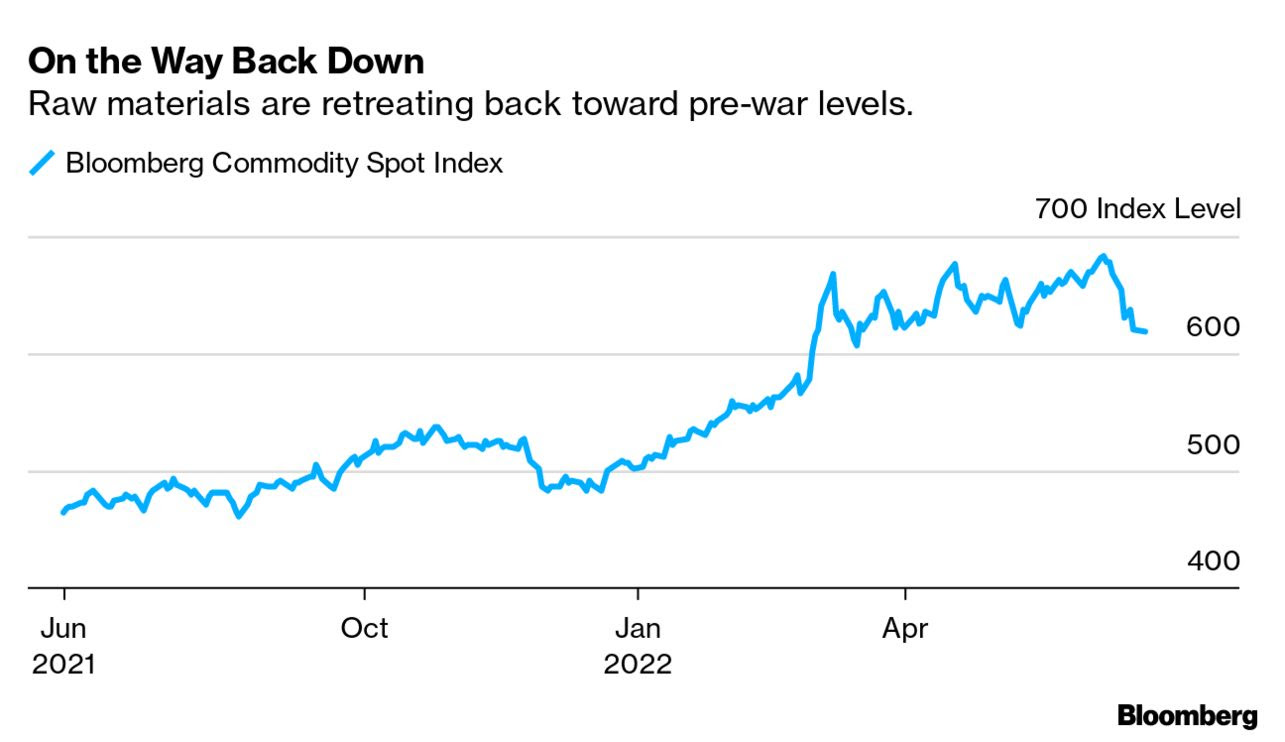
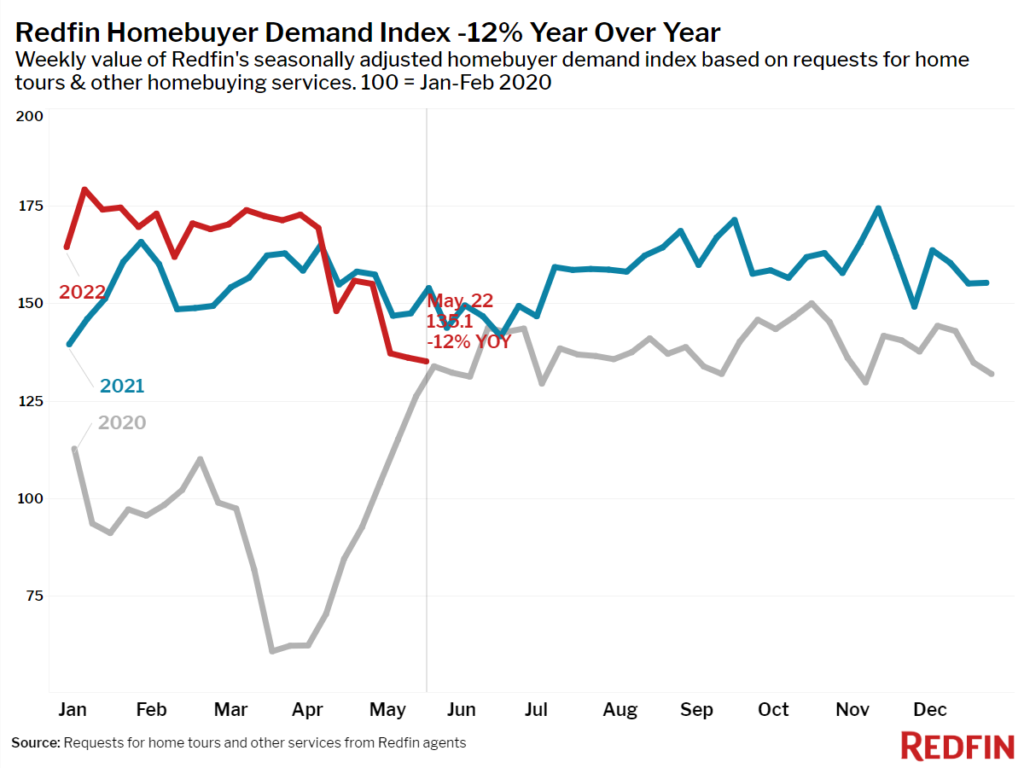
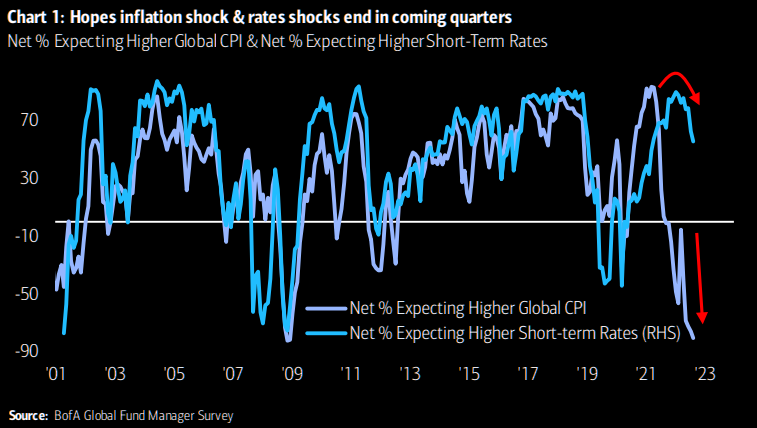
Presently, retail sales are steady, and supply pressures, though starting to ease, remain, bolstering inflation which the Fed is ultimately trying to stop from becoming entrenched.

Graphic: Retrieved from Bloomberg.

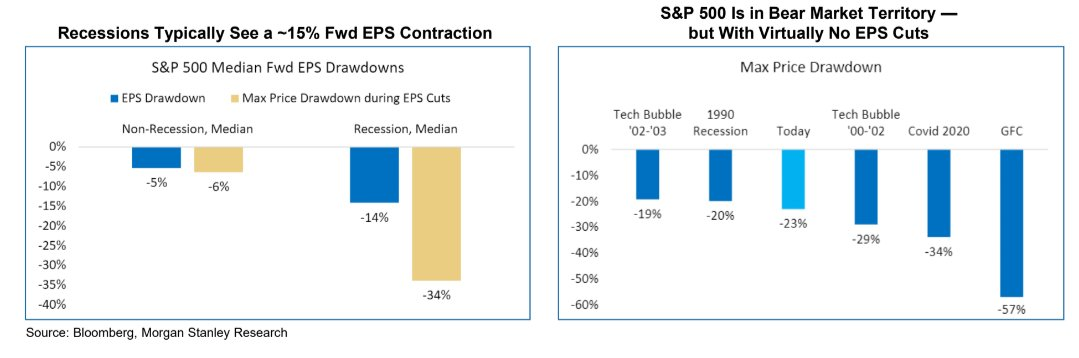
Though there are fundamental contexts we are leaving out (e.g., negative earnings revisions, Chinese retail, industrial output, and investment data missing which prompted an easing, the use of tools like Treasury buybacks to ease disruptions via Fed-action, as well as increasing recession odds), in short, the focus should be on the technicals which actually make us money.

Graphic: Retrieved from The Market Ear. Via Bank of America Corporation (NYSE: BAC).

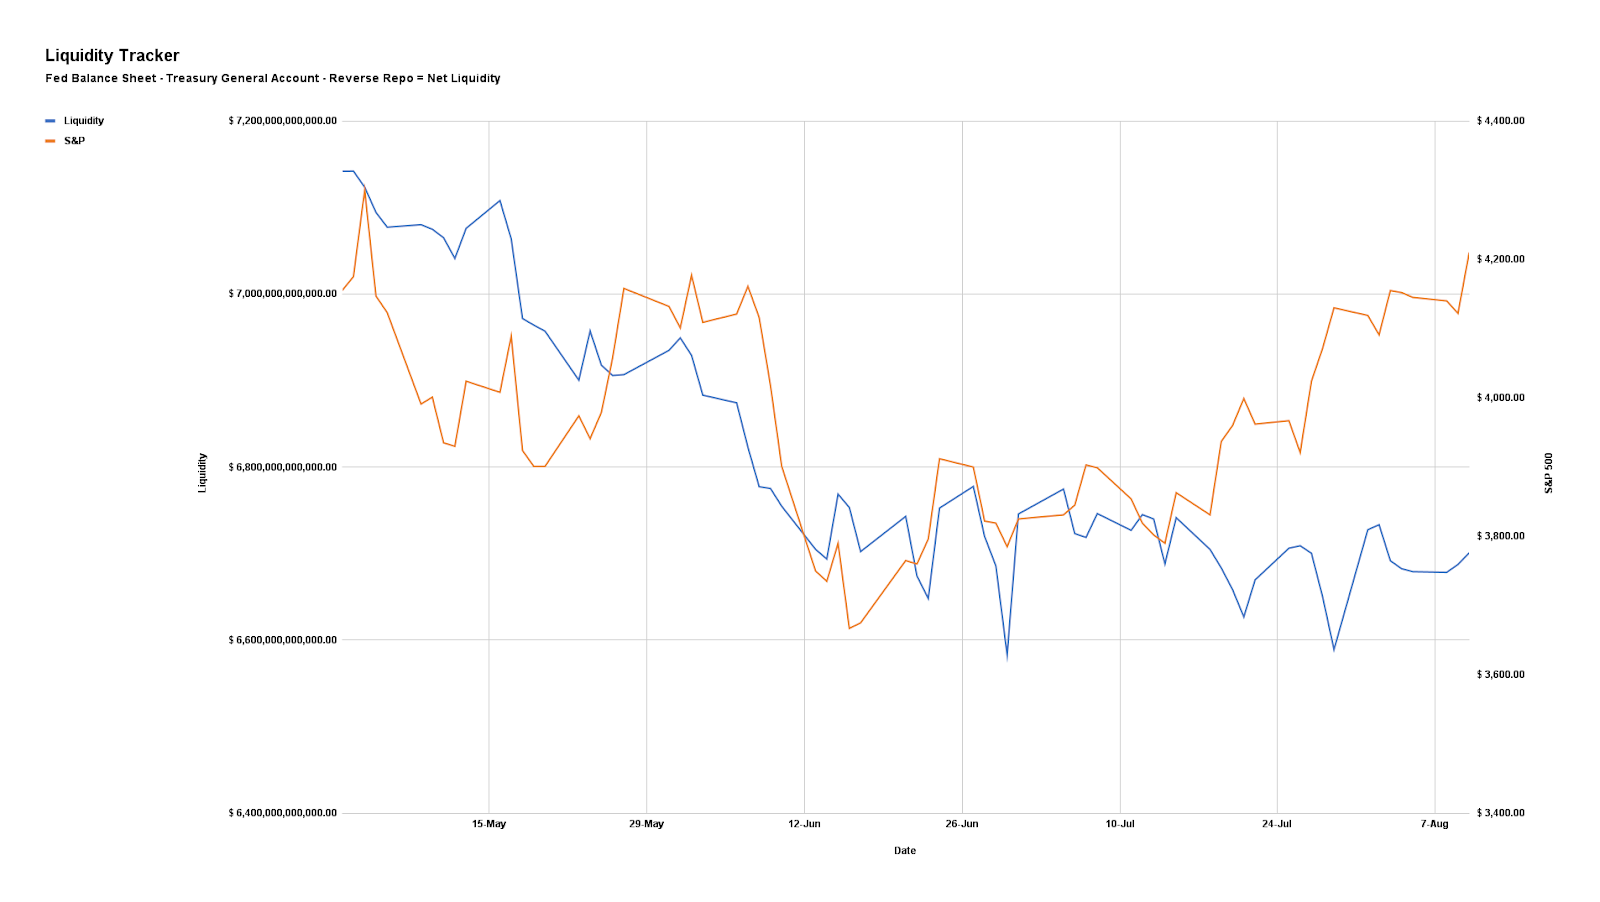
And, presently, on the heels of macro- and volatility-type re-leveraging, per Deutsche Bank AG (NYSE: DB) the technical contexts are bullish. 

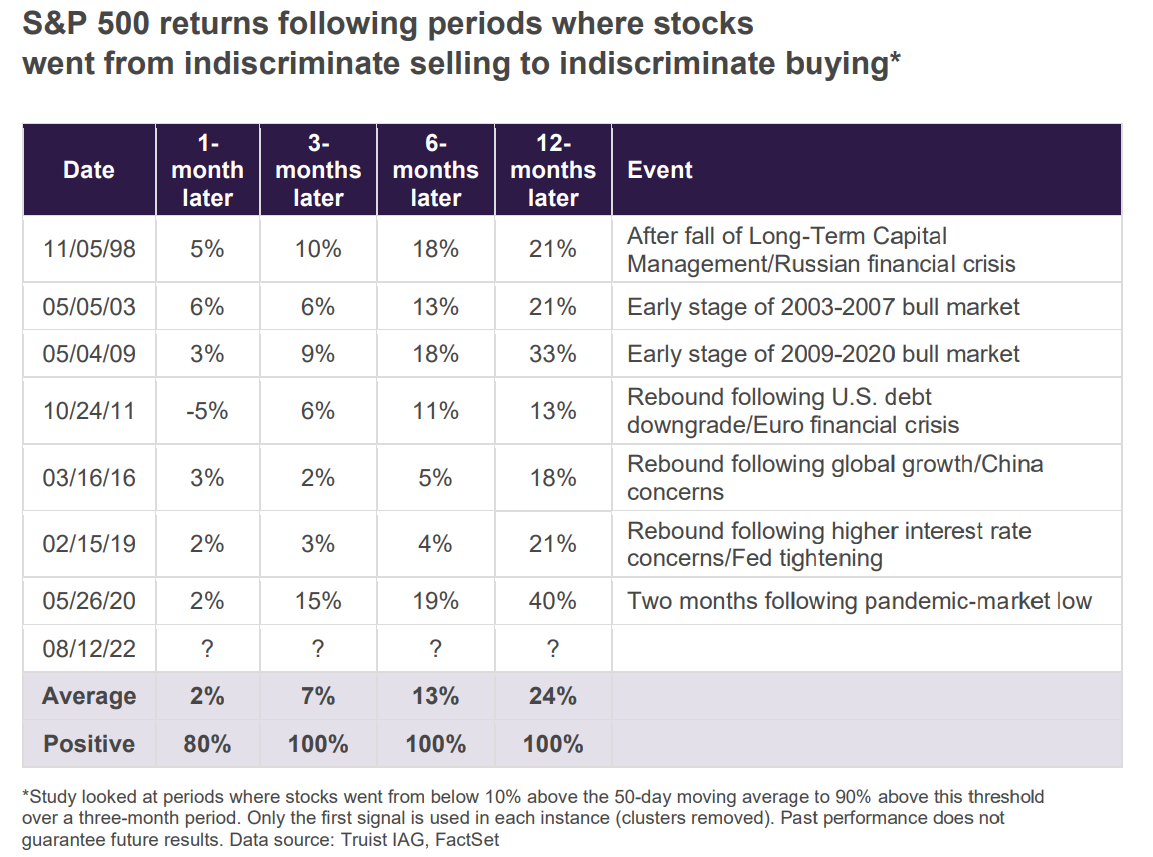
Keith Lerner, the co-chief investment officer and chief market strategist at Truist Financial Corporation’s (NYSE: TFC) Advisory Services puts it all well:

“Even if the Fed does pivot, they are less likely to support the markets as quickly as they have in the past given the scar tissue left behind as a result of the inflation challenges of the past year… The market rally over the past four weeks has been nothing short of impressive. Such strong buying pressure following indiscriminate selling has historically been a very positive sign for the market, often following important market bottoms. This is a welcome sign. Still, other factors in our work are less supportive. Indeed, markets are not only fighting the Fed, but the most aggressive global monetary tightening cycle in decades.”

Graphic: Retrieved from Bloomberg. Via Truist Financial Corporation (NYSE: TFC).

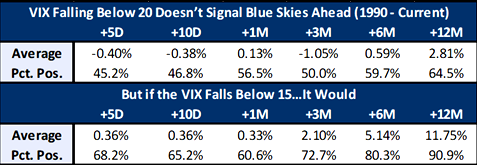
Beyond this, from a volatility perspective, we’d look for the VIX to sink below 15 to increase our optimism over a “sustained [and] better-than-typical” rally, per Jefferies Financial Group Inc (NYSE: JEF). Look at this last remark through the lens of participation on the part of traders who employ volatility-targeting strategies, for instance.

Graphic: Retrieved from The Market Ear. Via Jefferies Financial Group Inc (NYSE: JEF).

Technical

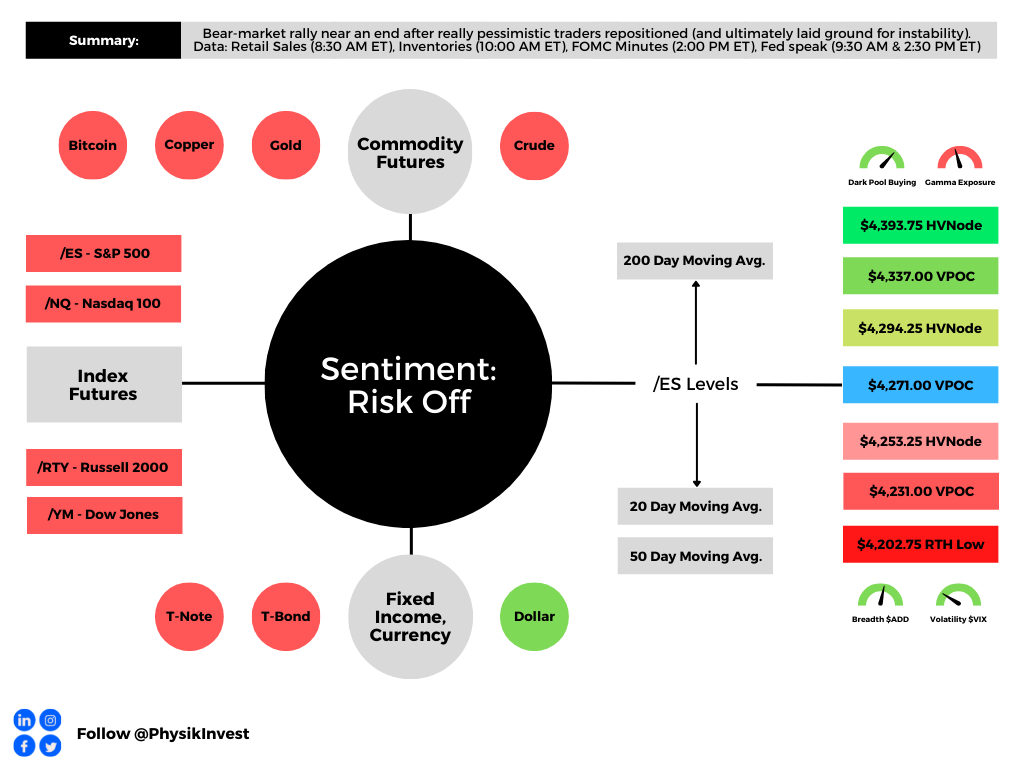
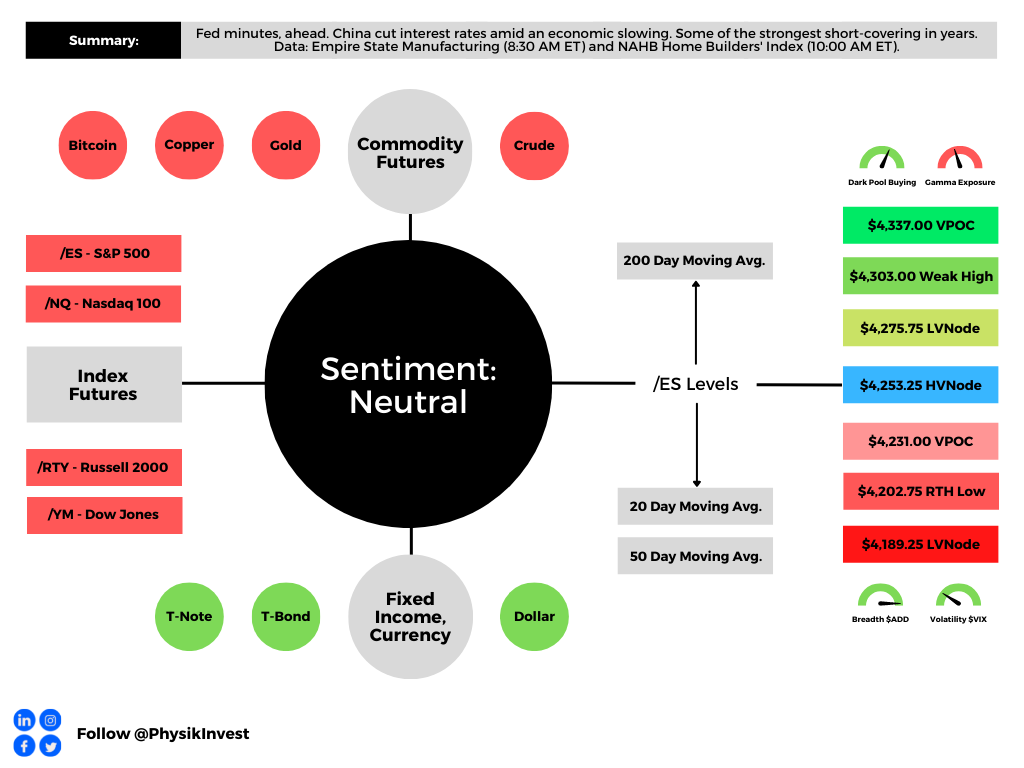
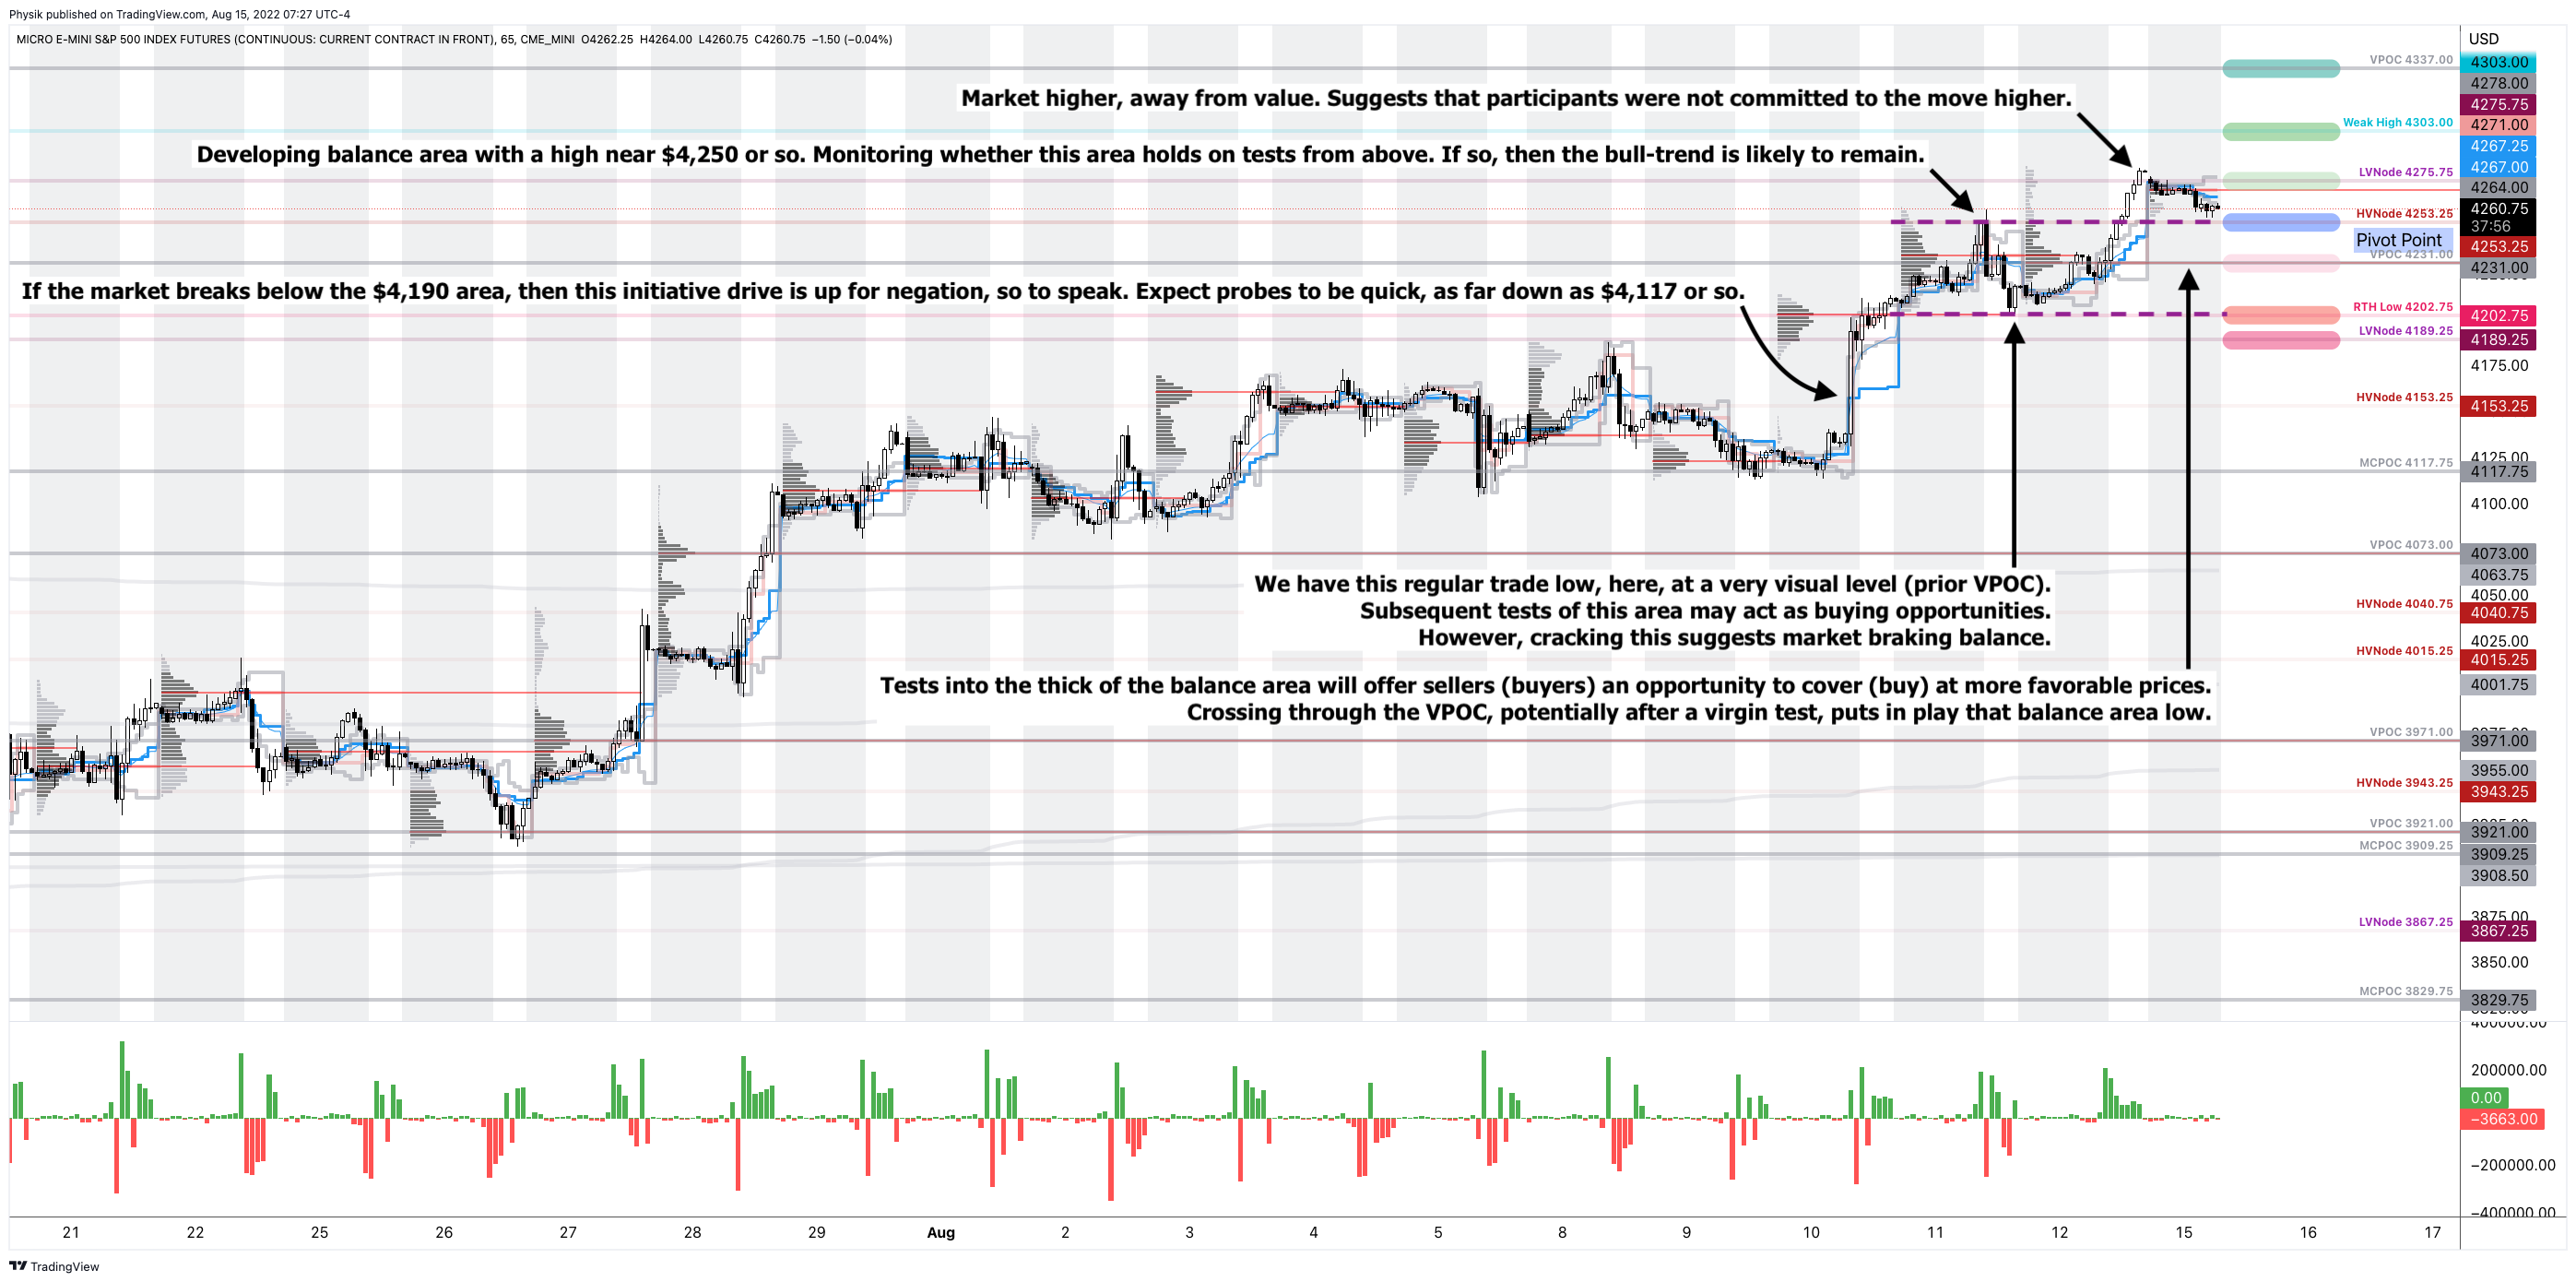
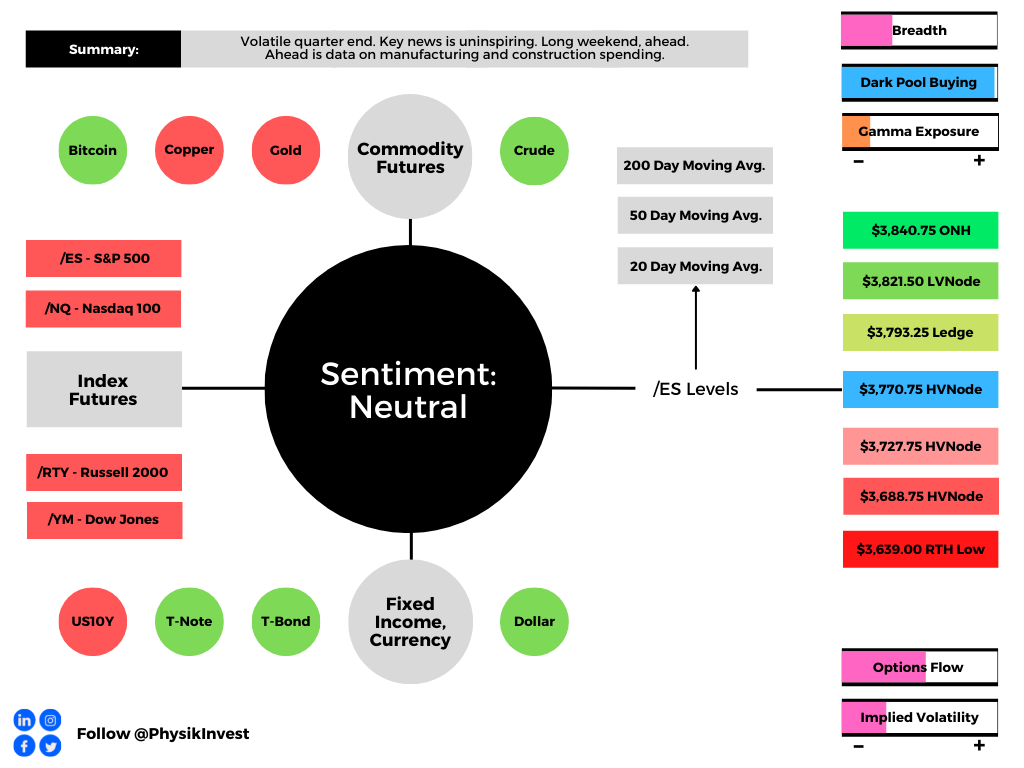
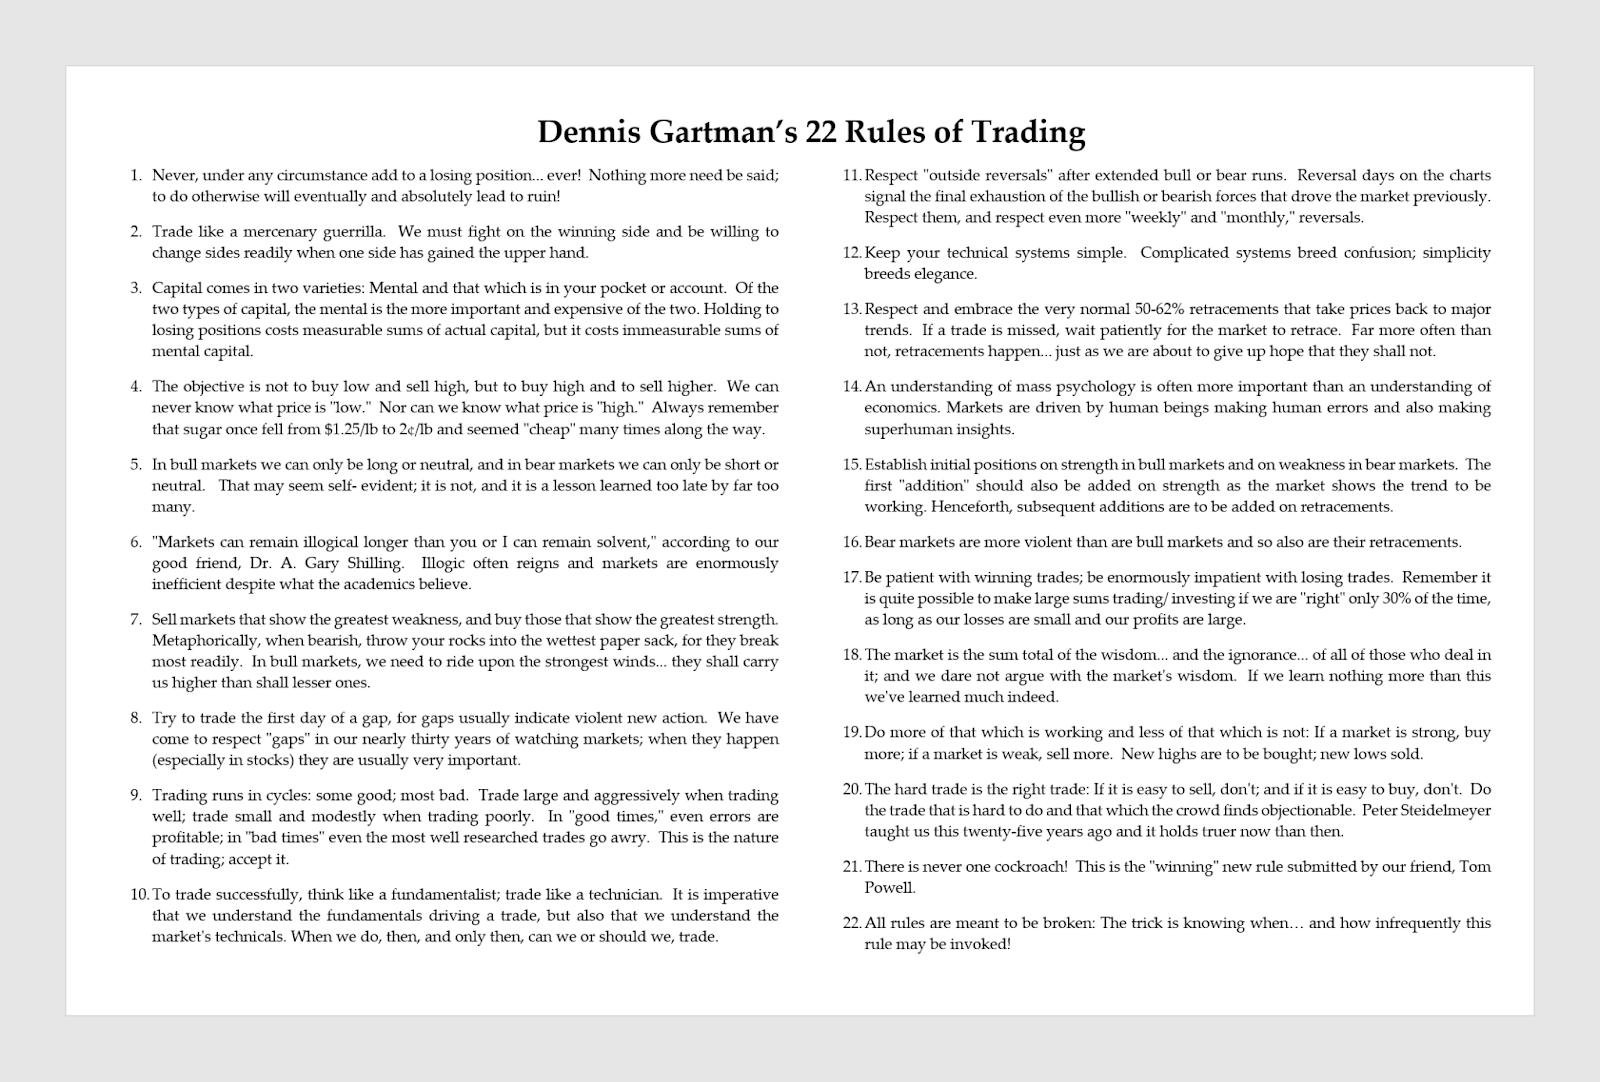
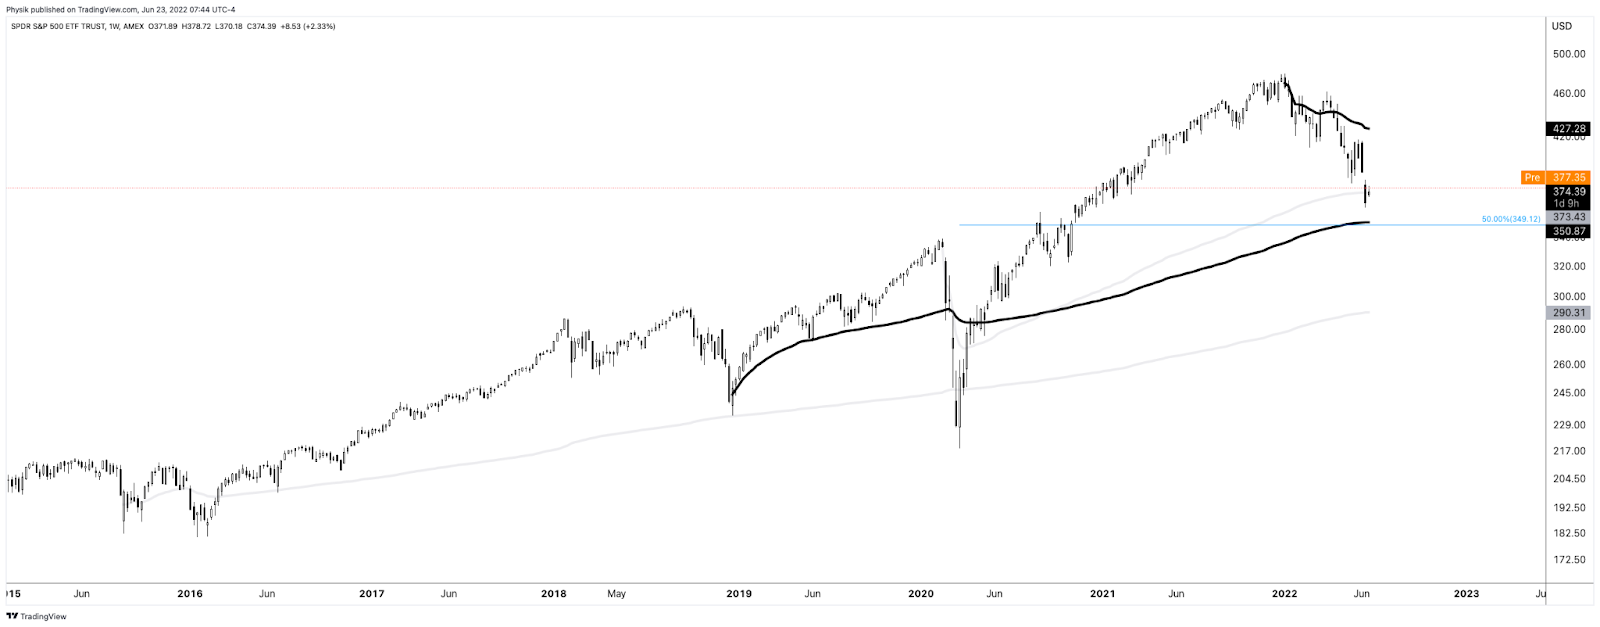
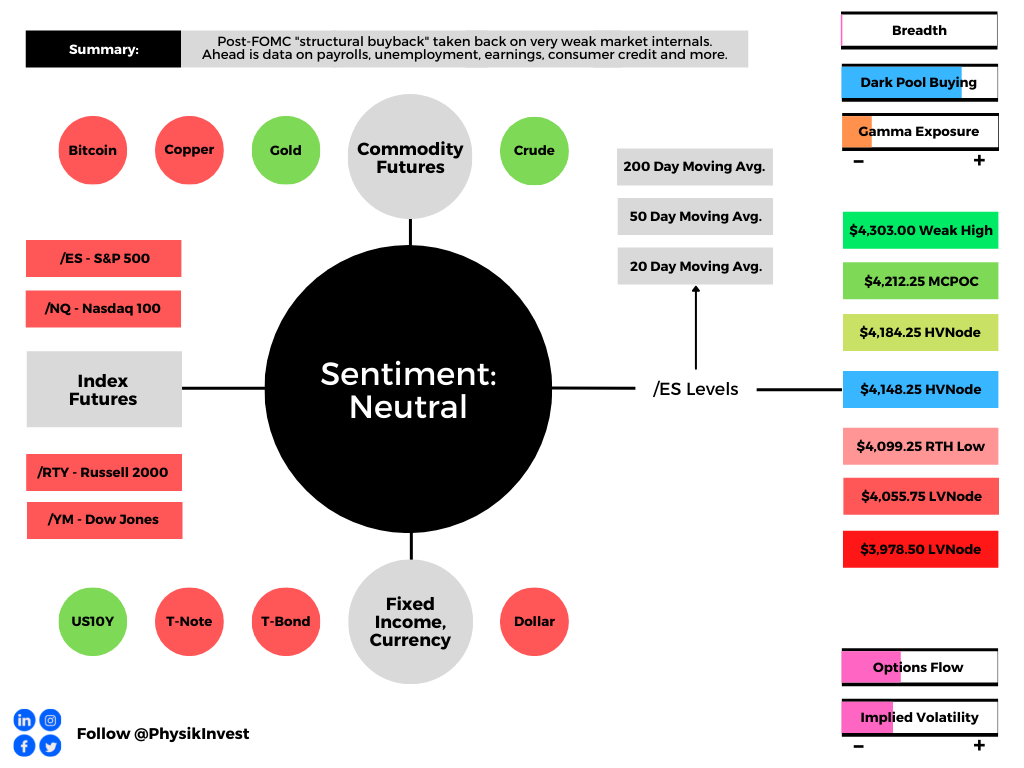
As of 7:20 AM ET, Thursday’s regular session (9:30 AM – 4:00 PM ET), in the S&P 500, is likely to open in the middle part of a balanced overnight inventory, inside of prior-range and -value, suggesting a limited potential for immediate directional opportunity.

In the best case, the S&P 500 trades higher.

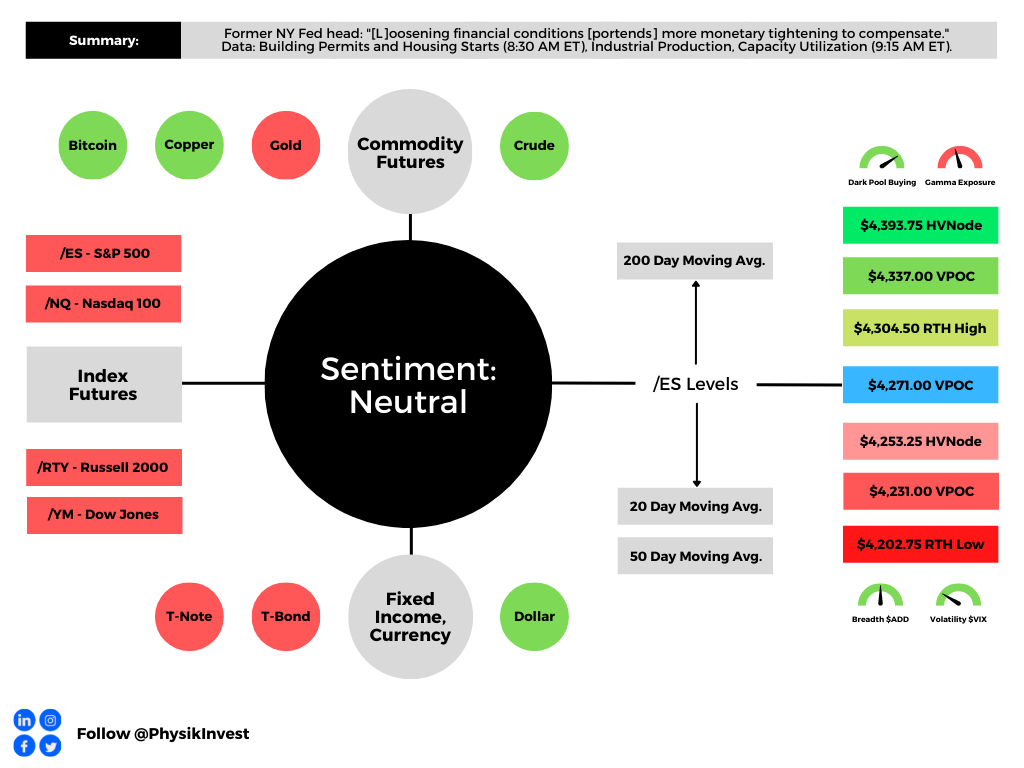
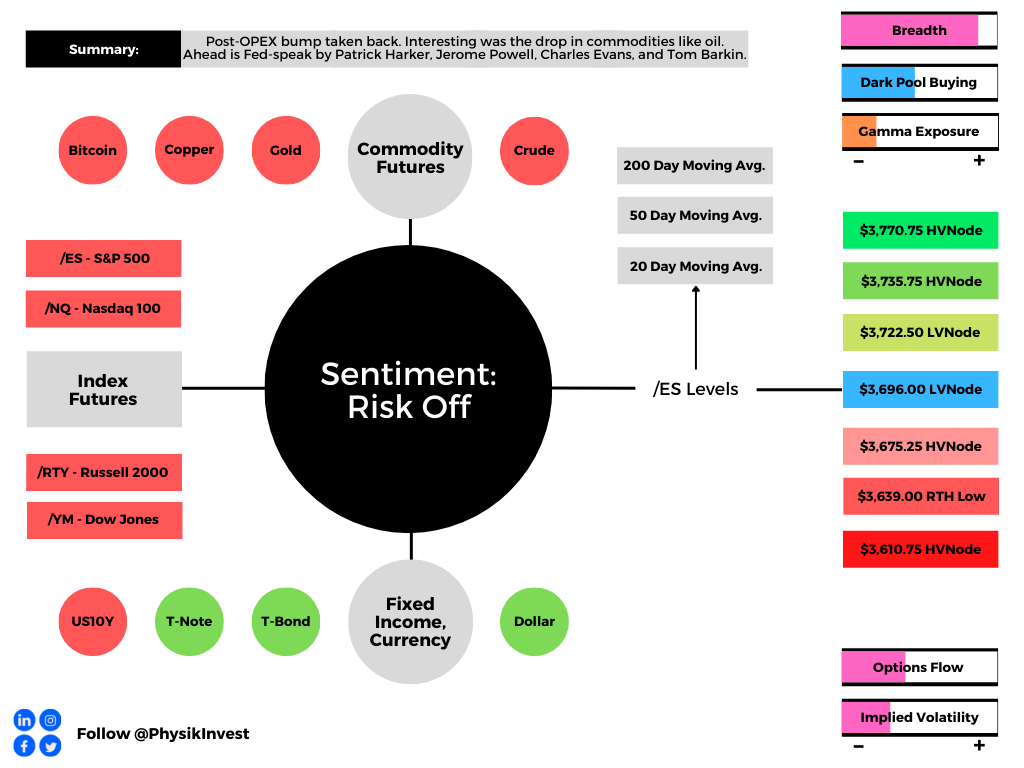
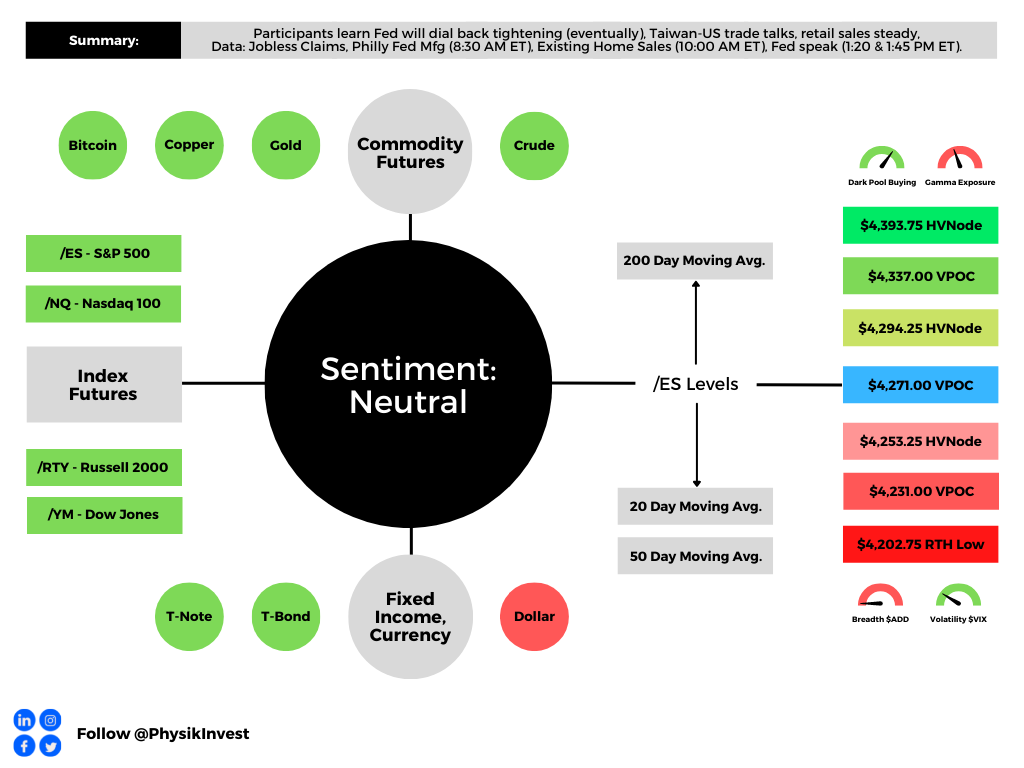
Any activity above the $4,273.00 VPOC puts into play the $4,294.25 HVNode. Initiative trade beyond the HVNode could reach as high as the $4,337.00 VPOC and $4,393.75 HVNode, or higher.

In the worst case, the S&P 500 trades lower.

Any activity below the $4,273.00 VPOC puts into play the $4,253.25 HVNode. Initiative trade beyond the HVNode could reach as low as the $4,231.00 VPOC and $4,202.75 RTH Low, or lower.

Click here to load today’s key levels into the web-based TradingView charting platform. Note that all levels are derived using the 65-minute timeframe. New links are produced, daily.
Graphic: 65-minute profile chart of the Micro E-mini S&P 500 Futures.

Considerations: Responsiveness near key-technical areas (that are discernable visually on a chart), suggests technically-driven traders with short time horizons are very active. 

Such traders often lack the wherewithal to defend retests and, additionally, the type of trade may be indicative of the other time frame participants waiting for more information to initiate trades.

Definitions

Volume Areas: A structurally sound market will build on areas of high volume (HVNodes). Should the market trend for long periods of time, it will lack sound structure, identified as low volume areas (LVNodes). LVNodes denote directional conviction and ought to offer support on any test. 

If participants were to auction and find acceptance into areas of prior low volume (LVNodes), then future discovery ought to be volatile and quick as participants look to HVNodes for favorable entry or exit.

POCs: POCs are valuable as they denote areas where two-sided trade was most prevalent in a prior day session. Participants will respond to future tests of value as they offer favorable entry and exit.

Gamma: Gamma is the sensitivity of an option to changes in the underlying price. Dealers that take the other side of options trades hedge their exposure to risk by buying and selling the underlying. When dealers are short-gamma, they hedge by buying into strength and selling into weakness. When dealers are long-gamma, they hedge by selling into strength and buying into weakness. The former exacerbates volatility. The latter calms volatility.

Vanna: The rate at which the delta of an option changes with respect to volatility.

Charm: The rate at which the delta of an option changes with respect to time.

About

After years of self-education, strategy development, mentorship, and trial-and-error, Renato Leonard Capelj began trading full-time and founded Physik Invest to detail his methods, research, and performance in the markets.

Capelj also develops insights around impactful options market dynamics at SpotGamma and is a Benzinga reporter.

Some of his works include conversations with ARK Invest’s Catherine Wood, investors Kevin O’Leary and John Chambers, FTX’s Sam Bankman-Fried, ex-Bridgewater Associate Andy Constan, Kai Volatility’s Cem Karsan, The Ambrus Group’s Kris Sidial, among many others.

Disclaimer

In no way should the materials herein be construed as advice. Derivatives carry a substantial risk of loss. All content is for informational purposes only.

Categories
Commentary

Daily Brief For August 17, 2022

The daily brief is a free glimpse into the prevailing fundamental and technical drivers of U.S. equity market products. Join the 800+ that read this report daily, below!

Graphic updated 7:00 AM ET. Sentiment Risk-Off if expected /ES open is below the prior day’s range. /ES levels are derived from the profile graphic at the bottom of the following section. Levels may have changed since initially quoted; click here for the latest levels. SqueezeMetrics Dark Pool Index (DIX) and Gamma (GEX) calculations are based on where the prior day’s reading falls with respect to the MAX and MIN of all occurrences available. A higher DIX is bullish. At the same time, the lower the GEX, the more (expected) volatility. Learn the implications of volatility, direction, and moneyness. Breadth reflects a reading of the prior day’s NYSE Advance/Decline indicator. VIX reflects a current reading of the CBOE Volatility Index (INDEX: VIX) from 0-100.

Fundamental

Working through some in-depth coverage for this fundamental section. Report back, soon.

Positioning

As of 7:00 AM ET, Wednesday’s expected volatility, via the Cboe Volatility Index (INDEX: VIX), sits at ~1.07%. Tighter ranges, as a result of a sticky, long-gamma environment (in which the participants, who are on the other side of customer trades, hedge in a manner that takes from volatility) are likely to remain.

The potential for trading ranges to expand increases after large options expiries this week.

Further, given where realized (RVOL) and implied (IVOL) volatility measures are, as well as skew, it is beneficial to be a buyer of options structures. It is weeks prior to this near-vertical price rise that we mulled rotating into dynamic (options) bets and structures lined up against some key resistances.

Graphic: Retrieved from Bloomberg. Drawn on by Physik Invest.

Moreover, where are we, right now?

As well explained in the Daily Brief for July 21, 2022, heading into the 2022 decline, institutions repositioned and hedged, even allocating to “commodity trend following,” per our Daily Brief for July 15, 2022, which worked well the first two quarters.

The monetization and counterparty hedging of existing customer hedges, as well as the sale of short-dated volatility, particularly in some of the single names where there was “rich” volatility, into the fall, lent to lackluster performance in equity IVOL and index mean reversion.

This trend came to an end as entities were squeezed out of trades not working (i.e., participants rotated out of volatility and commodities). This, alongside a re-leveraging on inflation cooling and better-than-expected earnings, bolstered a historic near-vertical price rise in equity markets.

Graphic: Retrieved from The Market Ear. Via Goldman Sachs Group Inc.

Continuing to bolster the near-vertical price rise is a rotation into bets on upside (call options). It is the hedging of this exposure, by counterparties, that can add to the follow-on buying (i.e., in selling a call option, the liquidity provider will, all else equal, buy underlying stock).

Graphic: Updated 8/15/2022. Retrieved from SqueezeMetrics.

Accordingly, participants have been squeezed out of their (put) volatility hedges, “on the equity side,” and are now “less and less hedged,” as Kai Volatility’s Cem Karsan explains.

Given this, the “market can really begin to respond to the core macro factors.”

It is the case that when the macro re-leveraging ceases, and the present supportive volatility conditions ease, “the incremental effects” of liquidity (i.e., quantitative easing and tightening) may set the stage for a rollover.

Graphic: Via Physik Invest. Data compiled by @jkonopas623. Fed Balance Sheet data, here. Treasury General Account Data, here. Reverse Repo data, here. NL = BS – TGA – RRP.

If during this rollover, some shock was to surface, then the demand for hedges may assist in an “untethering” in IVOL, “one of the most supportive things into the decline,” Karsan explained.

Graphic: Retrieved from SqueezeMetrics. Learn the implications of volatility, direction, and moneyness.

So, what’s the takeaway?

The near-vertical price rise (alongside reports of better-than-expected earnings and the potential that inflation is beginning to cool) is sputtering. Follow-on support from a desire by participants to participate in upside synthetically and continued re-leveraging may ease in the next weeks.

Technical

As of 7:00 AM ET, Wednesday’s regular session (9:30 AM – 4:00 PM ET), in the S&P 500, is likely to open in the lower part of a negatively skewed overnight inventory, outside of prior-range and -value, suggesting a potential for immediate directional opportunity.

In the best case, the S&P 500 trades higher.

Any activity above the $4,271.00 VPOC puts into play the $4,294.25 HVNode. Initiative trade beyond the HVNode could reach as high as the $3,337.00 VPOC and $4,393.75 HVNode, or higher.

In the worst case, the S&P 500 trades lower.

Any activity below the $4,271.00 VPOC puts into play the $4,253.25 HVNode. Initiative trade beyond the HVNode could reach as low as the $4,231.00 VPOC and $4,202.75 RTH Low, or lower.

Click here to load today’s key levels into the web-based TradingView charting platform. Note that all levels are derived using the 65-minute timeframe. New links are produced, daily.
Graphic: 65-minute profile chart of the Micro E-mini S&P 500 Futures.

Considerations: Responsiveness near key-technical areas (that are discernable visually on a chart), suggests technically-driven traders with short time horizons are very active. 

Such traders often lack the wherewithal to defend retests and, additionally, the type of trade may be indicative of the other time frame participants waiting for more information to initiate trades.

Definitions

Volume Areas: A structurally sound market will build on areas of high volume (HVNodes). Should the market trend for long periods of time, it will lack sound structure, identified as low volume areas (LVNodes). LVNodes denote directional conviction and ought to offer support on any test. 

If participants were to auction and find acceptance into areas of prior low volume (LVNodes), then future discovery ought to be volatile and quick as participants look to HVNodes for favorable entry or exit.

POCs: POCs are valuable as they denote areas where two-sided trade was most prevalent in a prior day session. Participants will respond to future tests of value as they offer favorable entry and exit.

About

After years of self-education, strategy development, mentorship, and trial-and-error, Renato Leonard Capelj began trading full-time and founded Physik Invest to detail his methods, research, and performance in the markets.

Capelj also develops insights around impactful options market dynamics at SpotGamma and is a Benzinga reporter.

Some of his works include conversations with ARK Invest’s Catherine Wood, investors Kevin O’Leary and John Chambers, FTX’s Sam Bankman-Fried, ex-Bridgewater Associate Andy Constan, Kai Volatility’s Cem Karsan, The Ambrus Group’s Kris Sidial, among many others.

Disclaimer

In no way should the materials herein be construed as advice. Derivatives carry a substantial risk of loss. All content is for informational purposes only.

Categories
Commentary

Daily Brief For August 16, 2022

The daily brief is a free glimpse into the prevailing fundamental and technical drivers of U.S. equity market products. Join the 800+ that read this report daily, below!

Graphic updated 7:00 AM ET. Sentiment Neutral if expected /ES open is inside of the prior day’s range. /ES levels are derived from the profile graphic at the bottom of the following section. Levels may have changed since initially quoted; click here for the latest levels. SqueezeMetrics Dark Pool Index (DIX) and Gamma (GEX) calculations are based on where the prior day’s reading falls with respect to the MAX and MIN of all occurrences available. A higher DIX is bullish. At the same time, the lower the GEX, the more (expected) volatility. Learn the implications of volatility, direction, and moneyness. Breadth reflects a reading of the prior day’s NYSE Advance/Decline indicator. VIX reflects a current reading of the CBOE Volatility Index (INDEX: VIX) from 0-100.

Fundamental

The Daily Brief for Monday, August 15, 2022, provided us with a great start to the week. Today, unfortunately, we add only lightly to this narrative, and we will elaborate in later sessions.

In short, markets experienced one of the largest, wide-ranging, short-covering rallies, in years, bolstered by machines “hell-bent on pushing the financial conditions easing trade,” as well put by Dennis DeBusschere, the founder of 22V Research.

Graphic: Retrieved from Bloomberg.

Notwithstanding improving sentiment and data on jobs, as well as cooler inflation figures, former New York Federal Reserve (Fed) President William Dudley, thinks markets have underestimated the Fed’s determination to stem inflation.

To summarize, the Fed will keep hiking until inflation is back to its 2% target and there is more slack in the labor market

“I think the Fed is going to be higher for longer than what market participants understand at this point,” he explained. This action ought to last at least until the unemployment rate is “well above 4%,” above today’s 3.5%.

Accordingly, “whenever the unemployment rate has risen by a half percentage point or more, the result has been a full-blown recession.”

There is also quantitative tightening (QT), the direct flow of capital from capital markets.

Bank of America Corporation (NYSE: BAC) strategists see the prevailing assumption as if “QT is already priced into the market.”

“The market does not seem to be looking ahead,” the strategists said, suggesting the S&P 500 could print 7% lower, at least. “If financial conditions tighten in a meaningful way, then that could make QT a more important topic.”

Still, Treasury buybacks are among the tools that could be used to strengthen markets against the rising tide of “issuance and potential structural inflation, … [easing] QT by moving liquidity out of the RRP and into the banking sector,” per Joseph Wang.

More on this, later!

Graphic: Via Physik Invest. Data compiled by @jkonopas623. Fed Balance Sheet data, here. Treasury General Account Data, here. Reverse Repo data, here. NL = BS – TGA – RRP.

Positioning

Please refer to our detailed Daily Brief for August 12, 2022. We shall add to this narrative in the coming sessions.

Technical

As of 7:00 AM ET, Tuesday’s regular session (9:30 AM – 4:00 PM ET), in the S&P 500, is likely to open in the middle part of a negatively skewed overnight inventory, inside of prior-range and -value, suggesting a limited potential for immediate directional opportunity.

In the best case, the S&P 500 trades higher.

Any activity above the $4,271.00 VPOC puts into play the $4,304.50 RTH High. Initiative trade beyond the RTH High could reach as high as the $4,337.00 VPOC and $4,393.75 HVNode, or higher.

In the worst case, the S&P 500 trades lower.

Any activity below the $4,271.00 VPOC puts into play the $4,253.25 HVNode. Initiative trade beyond the HVNode could reach as low as the $4,231.00 VPOC and $4,202.75 RTH Low, or lower.

Click here to load today’s key levels into the web-based TradingView charting platform. Note that all levels are derived using the 65-minute timeframe. New links are produced, daily.
Graphic: 65-minute profile chart of the Micro E-mini S&P 500 Futures.

Considerations: Responsiveness near key-technical areas (that are discernable visually on a chart), suggests technically-driven traders with short time horizons are very active. 

Such traders often lack the wherewithal to defend retests and, additionally, the type of trade may be indicative of the other time frame participants waiting for more information to initiate trades.

Definitions

Volume Areas: A structurally sound market will build on areas of high volume (HVNodes). Should the market trend for long periods of time, it will lack sound structure, identified as low volume areas (LVNodes). LVNodes denote directional conviction and ought to offer support on any test. 

If participants were to auction and find acceptance into areas of prior low volume (LVNodes), then future discovery ought to be volatile and quick as participants look to HVNodes for favorable entry or exit.

POCs: POCs are valuable as they denote areas where two-sided trade was most prevalent in a prior day session. Participants will respond to future tests of value as they offer favorable entry and exit.

About

After years of self-education, strategy development, mentorship, and trial-and-error, Renato Leonard Capelj began trading full-time and founded Physik Invest to detail his methods, research, and performance in the markets.

Capelj also develops insights around impactful options market dynamics at SpotGamma and is a Benzinga reporter.

Some of his works include conversations with ARK Invest’s Catherine Wood, investors Kevin O’Leary and John Chambers, FTX’s Sam Bankman-Fried, ex-Bridgewater Associate Andy Constan, Kai Volatility’s Cem Karsan, The Ambrus Group’s Kris Sidial, among many others.

Disclaimer

In no way should the materials herein be construed as advice. Derivatives carry a substantial risk of loss. All content is for informational purposes only.

Categories
Commentary

Daily Brief For August 15, 2022

The daily brief is a free glimpse into the prevailing fundamental and technical drivers of U.S. equity market products. Join the 800+ that read this report daily, below!

Graphic updated 7:30 AM ET. Sentiment Neutral if expected /ES open is inside of the prior day’s range. /ES levels are derived from the profile graphic at the bottom of the following section. Levels may have changed since initially quoted; click here for the latest levels. SqueezeMetrics Dark Pool Index (DIX) and Gamma (GEX) calculations are based on where the prior day’s reading falls with respect to the MAX and MIN of all occurrences available. A higher DIX is bullish. At the same time, the lower the GEX, the more (expected) volatility. Learn the implications of volatility, direction, and moneyness. Breadth reflects a reading of the prior day’s NYSE Advance/Decline indicator. VIX reflects a current reading of the CBOE Volatility Index (INDEX: VIX) from 0-100.

Fundamental

According to Goldman Sachs Group Inc (NYSE: GS) Prime Services, this is the third largest short-covering rally in three years.

Graphic: Retrieved from The Market Ear. Via Goldman Sachs Group Inc.

The rally, as discussed in past commentaries, is, in part, the result of “volatility-target funds” and “trend-following funds” getting back into the market as volatility falls, sentiment and data on jobs improve, as well as cooler-than-expected inflation figures.

Graphic: Retrieved from Stenos Signals. “Unless SMEs are lying, inflation has peaked for now … Will it change the market psychology?”

“The machines seem hell-bent on pushing the financial conditions easing trade,” said Dennis DeBusschere, the founder of 22V Research. 

“Machines are eating the words from the Fed speakers for breakfast.”

Graphic: Retrieved from Bloomberg. “The issue is the giant pool of systematic funds that moves in and out of the market based on how turbulent prices are. With peace at hand of late amid a four-week rally, so-called volatility-target funds and similar strategies such as risk parity are buying between $2 billion to $4 billion of stocks per day, according to an estimate by JPMorgan Chase & Co.’s Kate Gandolfo.”

Notwithstanding, JPMorgan Chase & Co (NYSE: JPM) estimates overall CTA exposures remain subdued. To incite ultra-impactful “buy signals” the S&P 500 would have to rise to $4,400.00.

This “would prompt CTAs to step up buying” and, potentially, turn “‘max long’ on stocks, buying probably $100 billion to $200 billion across various trend-following strategies.”

Graphic: Retrieved from Yardeni Research Inc.

Though the S&P 500 has yet to retake the $4,400.00 level, likely to remain as support until the end of the week, at least, are options hedging flows, which we talked about last week. 

“That can last perhaps another 100 days if volatility stays low,” JPM’s Kate Gandolfo suggested.

For context, at least at the index level, customers are short call, long put against their equity. In a rising market, the call side solicits increased hedging on the part of counterparties. 

If counterparties are long the call, and the market is rising (falling), they must sell (buy) underlying to re-hedge. This can further contain realized volatility and support the market.

To act on this information, you are best off shrinking your timeframe and using if/then statements to put on trades. For instance, if the market rises past the downtrend line in the S&P 500, then the 2022 equity bear market is over. We should bias ourselves long, at that point.

Graphic: Retrieved from Bloomberg. Drawn on by Physik Invest.

Accordingly, over a larger horizon, its growth impulses, as well as the availability of credit and liquidity determine whether a market’s movements have legs.

Accordingly, “in the 1970s, the peak in inflation proved THE timing to load up on risk assets, but the missing link is a bottoming growth cycle,” Andreas Steno Larsen explained.

“The swiftly weakening growth cycle may rather be the EXACT reason why inflation has started to fade.”

The likes of Campbell Harvey, PhD, Kai Volatility’s Cem Karsan, among others, share a similar belief. 

In fact, Credit Suisse Group AG’s (NYSE: CS) Zoltan Pozsar sees inflation as a longer-lasting structural issue as “the pillars of the low inflation world – [de-globalization and populism] – are changing.”

As Crossmark Global Investments’ Victoria Fernandez puts it well, “We have probably reached peak inflation, but the stickiness of the inflation that remains (i.e., rents) keeps pressure on the Fed and therefore the markets.”

Graphic: Retrieved from The Macro Compass.

“We expected a summer rally due to better-than-expected earnings, but we aren’t satisfied that this is sustainable. A soft landing is still achievable, but we still anticipate volatility with so many unknowns out there.”

Graphic: Retrieved from Callum Thomas’ Weekly S&P 500 ChartStorm. The “seasonal/cycle outlook is for a lower low or retest of the lows over the next three months as we are in the worst two months of the year and are smack dab in the *Weak Spot* of the 4-Year Cycle”

Positioning

Please refer to our detailed Daily Brief for August 12, 2022. We shall add to this narrative in the coming sessions.

Technical

As of 7:30 AM ET, Monday’s regular session (9:30 AM – 4:00 PM ET), in the S&P 500, is likely to open in the lower part of a negatively skewed overnight inventory, inside of prior-range and -value, suggesting a limited potential for immediate directional opportunity.

In the best case, the S&P 500 trades higher.

Any activity above the $4,253.25 HVNode puts into play the $4,275.75 LVNode. Initiative trade beyond the LVNode could reach as high as the $4,303.00 Weak High and $4,337.00 VPOC, or higher.

In the worst case, the S&P 500 trades lower.

Any activity below the $4,253.25 HVNode puts into play the $4,231.00 VPOC. Initiative trade beyond the VPOC could reach as low as the $4,202.75 RTH Low and $4,189.25 LVNode, or lower.

Click here to load today’s key levels into the web-based TradingView charting platform. Note that all levels are derived using the 65-minute timeframe. New links are produced, daily.
Graphic: 65-minute profile chart of the Micro E-mini S&P 500 Futures.

Definitions

Volume Areas: A structurally sound market will build on areas of high volume (HVNodes). Should the market trend for long periods of time, it will lack sound structure, identified as low volume areas (LVNodes). LVNodes denote directional conviction and ought to offer support on any test. 

If participants were to auction and find acceptance into areas of prior low volume (LVNodes), then future discovery ought to be volatile and quick as participants look to HVNodes for favorable entry or exit.

POCs: POCs are valuable as they denote areas where two-sided trade was most prevalent in a prior day session. Participants will respond to future tests of value as they offer favorable entry and exit.

MCPOCs: POCs are valuable as they denote areas where two-sided trade was most prevalent over numerous day sessions. Participants will respond to future tests of value as they offer favorable entry and exit.

Volume-Weighted Average Prices (VWAPs): A metric highly regarded by chief investment officers, among other participants, for quality of trade. Additionally, liquidity algorithms are benchmarked and programmed to buy and sell around VWAPs.

About

After years of self-education, strategy development, mentorship, and trial-and-error, Renato Leonard Capelj began trading full-time and founded Physik Invest to detail his methods, research, and performance in the markets.

Capelj also develops insights around impactful options market dynamics at SpotGamma and is a Benzinga reporter.

Some of his works include conversations with ARK Invest’s Catherine Wood, investors Kevin O’Leary and John Chambers, FTX’s Sam Bankman-Fried, ex-Bridgewater Associate Andy Constan, Kai Volatility’s Cem Karsan, The Ambrus Group’s Kris Sidial, among many others.

Disclaimer

In no way should the materials herein be construed as advice. Derivatives carry a substantial risk of loss. All content is for informational purposes only.

Categories
Commentary

Daily Brief For August 12, 2022

The daily brief is a free glimpse into the prevailing fundamental and technical drivers of U.S. equity market products. Join the 750+ that read this report daily, below!

Graphic updated 7:00 AM ET. Sentiment Neutral if expected /ES open is inside of the prior day’s range. /ES levels are derived from the profile graphic at the bottom of the following section. Levels may have changed since initially quoted; click here for the latest levels. SqueezeMetrics Dark Pool Index (DIX) and Gamma (GEX) calculations are based on where the prior day’s reading falls with respect to the MAX and MIN of all occurrences available. A higher DIX is bullish. At the same time, the lower the GEX, the more (expected) volatility. Learn the implications of volatility, direction, and moneyness. Breadth reflects a reading of the prior day’s NYSE Advance/Decline indicator. VIX reflects a current reading of the CBOE Volatility Index (INDEX: VIX) from 0-100.

Fundamental

We’ll skip the fundamentals section, today, and do an in-depth review, sometime next week.

Positioning

As of 7:00 AM ET, Friday’s expected volatility, via the Cboe Volatility Index (INDEX: VIX), sits at ~1.06%. Net gamma exposures generally rising may promote tighter trading ranges.

Graphic: Via Physik Invest. Data retrieved from SqueezeMetrics.

As stated yesterday, it may be beneficial for traders to shift their focus to dynamic structures. In other words, be a buyer of options structures (i.e., replace static directional exposures or Delta with those that are dynamic).

This is (1) due to where realized (RVOL) and implied (IVOL) volatility measures, and skew. 

Graphic: Retrieved from Interactive Brokers Group Inc’s (NASDAQ: IBKR) Trader Workstation.

As well as (2) increased average stock correlation and lower return dispersion which, per Societe Generale SA (OTC: SCGLY) research, make stock picking hard(er).

It can be the case that Delta hedging becomes easier, too, as one asset, in a more correlated environment, can better offset the first-order sensitivities elsewhere.

Graphic: Retrieved from Bloomberg. Via Societe Generale.

The reason why? 

In regards to the correlation and dispersion remark, that’s more to do with the risk-off sentiment and the impact of tightening liquidity affecting all risk assets, basically.

Graphic: Via Physik Invest. Data compiled by @jkonopas623. Fed Balance Sheet data, here. Treasury General Account Data, here. Reverse Repo data, here. NL = BS – TGA – RRP.

Regarding the volatility issue (RVOL, IVOL, and skew), that’s more to do with hedging trends. 

Essentially, the monetization and counterparty hedging of existing customer hedges, as well as the sale of short-dated volatility, particularly in some of the single names where there was “rich” volatility, into the fall, lent to lackluster performance in IVOL and index mean reversion.

Accordingly, “if commodities are not performing … as a hedge, that opens the door,” to markets falling and traders demand equity volatility hedges, per The Ambrus Group’s Kris Sidial.

Learn about options dealer flows, inflation, and investing in a changing world with Cem Karsan.
Graphic: Retrieved by Physik Invest from TradingView. S&P Goldman Sachs Commodity Index.

Adding, per to SpotGamma, “a lot of the boost from volatility compression has played out. With IVOL at a lower bound, it may be opportune to replace static Delta bets for those that are dynamic (i.e., long option exposures) and have less to lose in this lower volatility environment.”

Graphic: Retrieved from Vix Central. The term structure of IVOL.

“In a case where market participants see the Fed keeping its commitment to aggressive monetary policy action, negative Delta options exposures may outperform static short equity (bets on the downside).”

Graphic: Retrieved from Bloomberg. “Thursday’s message was that on mature reflection, the progress on the economy didn’t justify taking the stock market any higher than it was at the start of the day.”

If bullish, sample structures to consider, given a smiley skew, include low- or zero-cost bullish call ratio spreads, against the trend resistances in products like the S&P 500 (INDEX: SPX).

Graphic: Retrieved from Bloomberg. Drawn on by Physik Invest.

Technical

As of 7:00 AM ET, Friday’s regular session (9:30 AM – 4:00 PM ET), in the S&P 500, is likely to open in the middle part of a nearly balanced overnight inventory, inside of prior-range and -value, suggesting a limited potential for immediate directional opportunity.

In the best case, the S&P 500 trades higher.

Any activity above the $4,227.75 HVNode puts into play the $4,253.25 HVNode. Initiative trade beyond the latter could reach as high as the $4,275.75 LVNode and $4,303.00 Weak High, or higher.

In the worst case, the S&P 500 trades lower.

Any activity below the $4,227.75 HVNode puts into play the $4,202.75 RTH Low. Initiative trade beyond the RTH Low could reach as low as the $4,189.25 LVNode and $4,153.25 HVNode, or lower.

Click here to load today’s key levels into the web-based TradingView charting platform. Note that all levels are derived using the 65-minute timeframe. New links are produced, daily.
Graphic: 65-minute profile chart of the Micro E-mini S&P 500 Futures.

Definitions

Volume Areas: A structurally sound market will build on areas of high volume (HVNodes). Should the market trend for long periods of time, it will lack sound structure, identified as low volume areas (LVNodes). LVNodes denote directional conviction and ought to offer support on any test. 

If participants were to auction and find acceptance into areas of prior low volume (LVNodes), then future discovery ought to be volatile and quick as participants look to HVNodes for favorable entry or exit.

POCs: POCs are valuable as they denote areas where two-sided trade was most prevalent in a prior day session. Participants will respond to future tests of value as they offer favorable entry and exit.

MCPOCs: POCs are valuable as they denote areas where two-sided trade was most prevalent over numerous day sessions. Participants will respond to future tests of value as they offer favorable entry and exit.

Volume-Weighted Average Prices (VWAPs): A metric highly regarded by chief investment officers, among other participants, for quality of trade. Additionally, liquidity algorithms are benchmarked and programmed to buy and sell around VWAPs.

About

After years of self-education, strategy development, mentorship, and trial-and-error, Renato Leonard Capelj began trading full-time and founded Physik Invest to detail his methods, research, and performance in the markets.

Capelj also develops insights around impactful options market dynamics at SpotGamma and is a Benzinga reporter.

Some of his works include conversations with ARK Invest’s Catherine Wood, investors Kevin O’Leary and John Chambers, FTX’s Sam Bankman-Fried, ex-Bridgewater Associate Andy Constan, Kai Volatility’s Cem Karsan, The Ambrus Group’s Kris Sidial, among many others.

Disclaimer

In no way should the materials herein be construed as advice. Derivatives carry a substantial risk of loss. All content is for informational purposes only.

Categories
Commentary

Daily Brief For July 1, 2022

The daily brief is a free glimpse into the prevailing fundamental and technical drivers of U.S. equity market products. Join the 300+ that read this report daily, below!

What Happened

Overnight, equity index futures were sideways to lower. Commodities and bonds were mixed. Implied volatility measures fell. The dollar rose.

A volatile quarter-end ahead of a long weekend. Noteworthy is the market’s responsiveness to visual levels. For instance, the S&P 500’s (FUTURE: /ES) high of the day printed at $3,821.50 or so, a key level in yesterday’s morning letter. 

This points to heightened activity by technically-driven traders with short time horizons. Such traders often lack the wherewithal to defend retests and, additionally, the type of trade may be indicative of the other time frame participants waiting for more information to initiate trades.

Moreover, on an annual basis, core inflation was the lowest since November while consumers’ spending cooled suggesting the economy is on a weaker footing. In Europe, inflation hit a record, boosting calls for more aggressive monetary policy action.

Adding, Goldman Sachs Group Inc (NYSE: GS) strategists see equity valuations falling further “[u]nless bond yields start to decline and buffer rising equity risk premiums.” Michael Burry, the Founder of Scion Asset Management, too, sees declines lasting on “earnings compression.”

Ahead is data on S&P Global Inc’s (NYSE: SPGI) manufacturing PMI (9:45 AM ET), as well as the ISM manufacturing index and construction spending (10:00 AM ET).

Graphic updated 6:45 AM ET. Sentiment Neutral if expected /ES open is inside of the prior day’s range. /ES levels are derived from the profile graphic at the bottom of the following section. Levels may have changed since initially quoted; click here for the latest levels. SqueezeMetrics Dark Pool Index (DIX) and Gamma (GEX) calculations are based on where the prior day’s reading falls with respect to the MAX and MIN of all occurrences available. A higher DIX is bullish. At the same time, the lower the GEX, the more (expected) volatility. Learn the implications of volatility, direction, and moneyness. SHIFT data used for S&P 500 (INDEX: SPX) options activity. Note that options flow is sorted by the call premium spent; if more positive, then more was spent on call options. Breadth reflects a reading of the prior day’s NYSE Advance/Decline indicator. VIX reflects a current reading of the CBOE Volatility Index (INDEX: VIX) from 0-100.

What To Expect

Fundamental: A bit philosophical here, today, as a difficult half-year has passed and I’m low on the time I have to commit to analysis this morning.

Markets are substantially lower from the end of 2021, all the while there are now, in greater quantity and frequency, calls being made that equities have more room to the downside.

That very well may be the case, and the upcoming earnings season is likely to provide investors clarity with respect to corporates’ ability to weather or pass on higher costs, among other things.

Read: Former Bridgewater Associate Talks Recession Odds, Capturing A Macro Edge.

Regardless, everything we discuss on a daily basis – fundamental and technical market drivers – will do little for us if we do not have a framework for assessing risk and opportunity

Before ever taking a position, I ask myself the following: What is it that I have to lose? For me, the answer depends. 

At times, it is dependent on a position’s payoff profile. At others, it’s the max pain I’m willing to subject myself to during adverse market conditions or when I have limited mental capital. 

As Dennis Gartman of the Gartman Letter said:

“Capital comes in two varieties: Mental and that which is in your pocket or account.”

“[T]he mental is the more important and expensive of the two. Holding to losing position costs measurable sums of actual capital, but costs immeasurable sums of mental capital.”

Graphic: Retrieved from Twitter. Dennis Gartman’s Rules of Trading.

And, with that, the other key is that the money is made in not losing it. Fortunately, this law was impressed on me, early. Returning 100%, only to suffer a 50% loss, sets you back to where you were, initially.

These comments are pursuant to traders I’ve had the honor of connecting with over the past year or so. Many made a killing to only have given most, if not all of it, back.

This has an immeasurable effect on one’s mental capital.

Though I’ve not participated in the most recent weaknesses, my mental capital has suffered. I’ve, subsequently, reduced the size of my positions and opted to define my losses, buying into volatility while it is cheap, as I view it, and waiting for the relationship to flip to sell in size.

Returning to the comment on whether the market’s de-rate has played out. I do not know. Can it go further? Probably. There are a host of references converging below current market prices, as pointed to in the Technicals section, below, that probably are taken at some point in the year.

That said, whether long or short, ask what it is that you have to lose? 

If it’s a number, define your loss and take the trade. Take (or provide) liquidity when others don’t want to. Buy (or sell) volatility when it is cheap (or expensive). Let the trade work.

It’s a coinflip, probably, at the end of the day. If we know what we have to gain and lose, we’ve moved the expected outcome that much further our way. Have a good long weekend, team.

Read: A guide to making money for individual traders retrieved from SqueezeMetrics.

Technical: As of 6:30 AM ET, Friday’s regular session (9:30 AM – 4:00 PM ET), in the S&P 500, will likely open in the middle part of a balanced overnight inventory, inside of prior-range and -value, suggesting a limited potential for immediate directional opportunity.

In the best case, the S&P 500 trades higher; activity above the $3,770.25 HVNode puts in play the $3,793.75 HVNode. Initiative trade beyond the latter HVNode could reach as high as the $3,821.50 LVNode and $3,840.75 ONH, or higher.

In the worst case, the S&P 500 trades lower; activity below the $3,770.25 HVNode puts in play the $3,727.75 HVNode. Initiative trade beyond the latter HVNode could reach as low as the $3,688.75 HVNode and $3,639.00 RTH Low, or lower.

Click here to load today’s key levels into the web-based TradingView charting platform. Note that all levels are derived using the 65-minute timeframe. New links are produced, daily.
Graphic: 65-minute profile chart of the Micro E-mini S&P 500 Futures.

Considerations: At $3,500.00 in the S&P 500 (INDEX: SPX), or $350.00 in the SPDR S&P 500 ETF Trust (NYSE: SPY) is the convergence of multiple visual references.

The 50.00% retracement (COVID-19 low through to 2021 peak), the 200-week moving average, and the volume-weighted average price anchored from the 2018 market bottom all converge at this $3,500.00 ($350.00) high open interest strike.

Graphic: Via TradingView. Taken by Physik Invest. SPDR S&P 500 ETF Trust (NYSE: SPY).

Definitions

Overnight Rally Highs (Lows): Typically, there is a low historical probability associated with overnight rally-highs (lows) ending the upside (downside) discovery process.

Volume Areas: A structurally sound market will build on areas of high volume (HVNodes). Should the market trend for long periods of time, it will lack sound structure, identified as low volume areas (LVNodes). LVNodes denote directional conviction and ought to offer support on any test. 

If participants were to auction and find acceptance into areas of prior low volume (LVNodes), then future discovery ought to be volatile and quick as participants look to HVNodes for favorable entry or exit.

About

After years of self-education, strategy development, mentorship, and trial-and-error, Renato Leonard Capelj began trading full-time and founded Physik Invest to detail his methods, research, and performance in the markets.

Capelj also develops insights around impactful options market dynamics at SpotGamma and is a Benzinga reporter.

Some of his works include conversations with ARK Invest’s Catherine Wood, investors Kevin O’Leary and John Chambers, FTX’s Sam Bankman-Fried, Kai Volatility’s Cem Karsan, The Ambrus Group’s Kris Sidial, among many others.

Disclaimer

In no way should the materials herein be construed as advice. Derivatives carry a substantial risk of loss. All content is for informational purposes only.

Categories
Commentary

Daily Brief For June 23, 2022

The daily brief is a free glimpse into the prevailing fundamental and technical drivers of U.S. equity market products. Join the 300+ that read this report daily, below!

What Happened

Overnight, equity index futures auctioned higher, inside of the prior range, with bonds. Commodities were mixed and implied volatility measures were bid.

Yields fell after comments by Federal Reserve (Fed) Chair Jerome Powell and growth updates in Europe stoked fears of a global downturn, per Bloomberg, as the prospects of a soft-landing look “very challenging.” 

“Financial conditions have tightened and priced in a string of rate increases and that’s appropriate,” Powell said. “We need to go ahead and have them.”

Today we’ll dive into positioning – what’s promoting responsive trade – and how to think about the market, accordingly.

Ahead is data on jobless claims and current account (8:30 AM ET), as well as S&P Global Inc (NYSE: SPGI) manufacturing and services PMI (9:45 AM ET), followed by the Federal Reserve (Fed) Chair Jerome Powell’s testimony (10:00 AM ET).

Graphic updated 7:50 AM ET. Sentiment Neutral if expected /ES open is inside of the prior day’s range. /ES levels are derived from the profile graphic at the bottom of the following section. Levels may have changed since initially quoted; click here for the latest levels. SqueezeMetrics Dark Pool Index (DIX) and Gamma (GEX) calculations are based on where the prior day’s reading falls with respect to the MAX and MIN of all occurrences available. A higher DIX is bullish. At the same time, the lower the GEX, the more (expected) volatility. Learn the implications of volatility, direction, and moneyness. SHIFT data used for S&P 500 (INDEX: SPX) options activity. Note that options flow is sorted by the call premium spent; if more positive, then more was spent on call options. Breadth reflects a reading of the prior day’s NYSE Advance/Decline indicator. VIX reflects a current reading of the CBOE Volatility Index (INDEX: VIX) from 0-100.

What To Expect

Positioning: Fed Chair Powell added clarity to the central bank’s stance on policy, and its intent to tighten without pushing the economy into a recession, which we’ve argued we’re already in. 

Graphic: Via Morgan Stanley (NYSE: MS).

“The other risk, though, is that we would not manage to restore price stability and that we would allow this high inflation to get entrenched in the economy,” Powell said. “We can’t fail on that task. We have to get back to 2% inflation.”

The peak of the Fed-rate-hike cycle – terminal rate – now sits at December 2022.

Graphic: Via Charles Schwab Corporation-owned (NYSE: SCHW) TD Ameritrade’s Thinkorswim. The Eurodollar (FUTURE: /GE) futures curve is a reflection of participants’ outlook on interest rates. The peak of the Fed-rate-hike cycle – terminal rate – is around DEC 2022.

A feature of the equity sell-off is the suppression of implied volatility (IVOL) versus that which the market realizes (RVOL).

Graphic: Taken by Physik Invest from Interactive Brokers Group Inc (NASDAQ: IBKR). The divergence in IVOL by participants’ options activity, versus RVOL, continues to resurface in the S&P 500 via the SPDR S&P 500 ETF Trust (NYSE: SPY).

As talked about before, participants are hedged and volatility remains in strong supply. Options data and insights platform SqueezeMetrics explains that this is due in part to lower leverage.

Graphic: Via SpotGamma’s Hedging Impact of Real-Time Options (HIRO) indicator points to selling of put and call options in the S&P 500 (INDEX: SPX) and S&P 500 ETF (SPY). Those liquidity providers, who are on the other side, are more exposed to long volatility, which they hedge by buying (selling) into weakness (strength) underlying.

“Leveraged long S&P lost favor (understandable), and marginal demand for puts went with it. Creeping into net selling territory is ‘smart’ bear market positioning. Short delta, short skew.”

Graphic: Via SqueezeMetrics.

Accordingly, it remains profitable to own options structures.

“This is the opposite of 2017 where the VIX was at 10% and the realized was 7%,” a trade that leverage poured into and resulted in the spectacular short-volatility ‘Volmageddon’ blow-up in February of 2018,” Dennis Davitt of Millbank Dartmoor Portsmouth explains.

Read: Daily Brief for May 24, 2022.

Graphic: Via Millbank Dartmoor Portsmouth.

How to play?

IVOL is bid and at a “higher starting point,” as I described in a SpotGamma note. Noteworthy, too, was the change in tone with respect to the non-linearity and strength of volatility with respect to linear changes in asset prices.

Read: Daily Brief for June 16, 2022.

In the current environment, we have to ask ourselves what would hurt participants the most?

It’d likely be forced selling or demand for protection by a greater share of the market in ways not seen. The associated repricing of IVOL would be a boon for those who own options, particularly in strikes further from current prices where there is a ton more convexity in volatility.

Graphic: Taken by Physik Invest from Interactive Brokers Group Inc (NASDAQ: IBKR). SPDR S&P 500 ETF Trust (NYSE: SPY) implied volatility skew, or the difference in IVOL – an estimate of potential price changes given the fear of movement – between options strikes that are close and far from the underlying’s current price. Notice the sensitivity of this curve farther out.

Still, with volatility at that higher starting point, many have exposure to positive delta (options that increase in value if the market goes up, all else equal) and gamma (the amplification of profits as the underlying continues to trade higher). 

That (insignificant) demand in the right tail still makes it so we may position, for cheap, in spread structures that still offer attractive and asymmetric payouts (e.g., 500 to 1000 point wide Nasdaq 100 butterflies and ratio spreads maturing up to 20 or 30 days out).

Read: Trading Volatility, Correlation, Term Structure and Skew by Colin Bennett et al. Originally sourced via Academia.edu.

Graphic: Via Banco Santander SA (NYSE: SAN) research, the return profile, at expiry, of a classic 1×2 (long 1, short 2 further away) ratio spread (the inverse of a back spread).

Technical: As of 6:30 AM ET, Thursday’s regular session (9:30 AM – 4:00 PM ET), in the S&P 500, will likely open in the upper part of a positively skewed overnight inventory, inside of prior-range and -value, suggesting a limited potential for immediate directional opportunity.

In the best case, the S&P 500 trades higher; activity above the $3,787.00 VPOC puts in play the $3,821.50 LVNode. Initiative trade beyond the LVNode could reach as high as the $3,843.00 RTH High and $3,911.00 VPOC, or higher.

In the worst case, the S&P 500 trades lower; activity below the $3,787.00 VPOC puts in play the $3,735.75 HVNode. Initiative trade beyond the $3,735.75 HVNode could reach as low as the $3,696.00 LVNode and $3,639.00 RTH Low, or lower.

Click here to load today’s key levels into the web-based TradingView charting platform. Note that all levels are derived using the 65-minute timeframe. New links are produced, daily.
Graphic: 65-minute profile chart of the Micro E-mini S&P 500 Futures.

Considerations: The SPDR S&P 500 ETF Trust (NYSE: SPY) is above the convergence of a key anchored volume-weighted average price level and retracement.

In the case of a continued downside, that is an area where participants may see a response.

Graphic: Via TradingView. Taken by Physik Invest. SPDR S&P 500 ETF Trust (NYSE: SPY).

Definitions

Volume Areas: A structurally sound market will build on areas of high volume (HVNodes). Should the market trend for long periods of time, it will lack sound structure, identified as low volume areas (LVNodes). LVNodes denote directional conviction and ought to offer support on any test. 

If participants were to auction and find acceptance into areas of prior low volume (LVNodes), then future discovery ought to be volatile and quick as participants look to HVNodes for favorable entry or exit.

POCs: POCs are valuable as they denote areas where two-sided trade was most prevalent in a prior day session. Participants will respond to future tests of value as they offer favorable entry and exit.

Balance (Two-Timeframe Or Bracket): Rotational trade that denotes current prices offer favorable entry and exit. Balance areas make it easy to spot a change in the market (i.e., the transition from two-time frame trade, or balance, to one-time frame trade, or trend). 

Modus operandi is responsive trade (i.e., fade the edges), rather than initiative trade (i.e., play the break).

Volume-Weighted Average Prices (VWAPs): A metric highly regarded by chief investment officers, among other participants, for quality of trade. Additionally, liquidity algorithms are benchmarked and programmed to buy and sell around VWAPs.

About

After years of self-education, strategy development, mentorship, and trial-and-error, Renato Leonard Capelj began trading full-time and founded Physik Invest to detail his methods, research, and performance in the markets.

Capelj also develops insights around impactful options market dynamics at SpotGamma and is a Benzinga reporter.

Some of his works include conversations with ARK Invest’s Catherine Wood, investors Kevin O’Leary and John Chambers, FTX’s Sam Bankman-Fried, Kai Volatility’s Cem Karsan, The Ambrus Group’s Kris Sidial, among many others.

Disclaimer

In no way should the materials herein be construed as advice. Derivatives carry a substantial risk of loss. All content is for informational purposes only.

Categories
Commentary

Daily Brief For June 22, 2022

The daily brief is a free glimpse into the prevailing fundamental and technical drivers of U.S. equity market products. Join the 300+ that read this report daily, below!

What Happened

Overnight, equity index and commodity futures were sideways to lower all the while bonds and volatility were bid. 

This is after participants, based on metrics included later in the letter, took the advance as an opportunity to sell at higher prices. Demanded was protection, and this bid implied volatility.

Big headlines include China sending warplanes near Taiwan after the U.S. rejected its strait claims. The Taiwanese Foreign Minister Joseph Wu wrote that the threat was “more serious than ever.” This is, also, ahead of Taiwan and U.S. officials talking about arms sales.

In other news, Congress was called on to pass a $0.184 per gallon gasoline tax holiday. Growth in job postings slowed as Q2 GDP forecasts have been revised lower, Chinese manufacturing orders declined by 20-30%, U.K. inflation hit a 40-year record, and sellers of homes are cutting prices in some of the hottest markets while the demand for adjustable-rate mortgages surges.

Ahead, the Federal Reserve’s (Fed) Patrick Harker speaks at 9:00 AM ET. Then, Jerome Powell testifies to the Senate Banking Committee at 9:30 AM ET. Later, Charles Evans speaks at 12:50 PM ET, followed by Harker and Barkin, again, at 1:30 PM ET.

Graphic updated 6:30 AM ET. Sentiment Risk-Off if expected /ES open is below the prior day’s range. /ES levels are derived from the profile graphic at the bottom of the following section. Levels may have changed since initially quoted; click here for the latest levels. SqueezeMetrics Dark Pool Index (DIX) and Gamma (GEX) calculations are based on where the prior day’s reading falls with respect to the MAX and MIN of all occurrences available. A higher DIX is bullish. At the same time, the lower the GEX, the more (expected) volatility. Learn the implications of volatility, direction, and moneyness. SHIFT data used for S&P 500 (INDEX: SPX) options activity. Note that options flow is sorted by the call premium spent; if more positive, then more was spent on call options. Breadth reflects a reading of the prior day’s NYSE Advance/Decline indicator. VIX reflects a current reading of the CBOE Volatility Index (INDEX: VIX) from 0-100.

What To Expect

Fundamental: For what it is worth when it comes to talking of theory and the economy, ARK Invest’s Cathie Wood has been spot on, in many ways.

Somewhat pursuant to our detailed analysis on May 18, 2022, which talked about the impact of reduced liquidity and credit on the real economy and asset prices, Wood explained that the U.S. fell into a recession during the first quarter.

Read: Daily brief for May 18, 2022.

“If massive inventor[ies] bloat real GDP in the second quarter, they will unwind and hurt growth for the rest of the year,” she said. Last year, though badly timed, Wood said that inflation would be on its way out due in part to excess inventory which would be reflected in commodity prices.

Read: Walmart Inc’s (NYSE: WMT) inventory glut to reduce in a “couple of quarters” and how Target Corporation’s (NYSE: TGT) oversupply problem should scare all retailers.

Graphic: Via Bloomberg. “The hot commodities rally is cooling off fast as recession fears again ground and cloud the outlook for demand.”

“If inventories and stock prices are leading indicators for employment and wages, … then fears of cost-push inflation a la 1970’s should disappear during the next six months.”

To put it briefly, as we’ve talked about in the past, the recent market rout is a recession and the direct reflection of the unwind of carry. It is the manifestation of a deflationary shock, and today’s sentiment and reducing demand for goods, among other things, reflect this.

And, with that, after a period during which capital was misallocated, the Fed is not in a position to control price stability “without bringing down the markets,” per Kai Volatility’s Cem Karsan.

Read: Kris Abdelmessih’s Moontower #148 on prevailing macroeconomic perspectives.

In light of these efforts to control price stability, to remain is a continued reach for cash (or bank deposits) and the sale of non-cash assets.

Graphic: Via Redfin Corporation (NASDAQ: RDFN).

“Bonds are not acting as a hedge and appear to be becoming less ‘money’ like due persistent declines in price and elevated rate vol,” as Joseph Wang, who was a trader at the Fed, puts it.

Bank deposits are to drain about $1 trillion or so by year-end, prompting investors to “continue to lower their selling prices to compete for the cash they want.”

Graphic: Per Bloomberg, “[E]very $1 trillion of QT will equate to a decline of roughly 10% in stocks over the next 12 months or so.”

If it provides any solace, per comments by Credit Suisse Group AG’s (NYSE: CS) Zoltan Pozsar, the Fed, which “can only deal with nominal [and] not real chokepoints,” is likely to change course.

This is as “nominal balance sheet and liquidity trends will, at some point, clash with the realities of a garden variety of supply chain issues.”

Likewise, Andreas Steno Larsen explains that bond yields remain governed by demographics, and this is good news for stocks, in general.

“Just look at the growth rate of the working-age population (10 years forward) versus the term premium of US Treasury bonds. The current bond bear market is not standing on structural pillars.”

Graphic: Via Andreas Steno Larsen. “Bond yields remain governed by demographics over the medium-term. Low(er) for longer.”

Positioning: To preface, I encourage everyone to check out the Daily Brief for June 17, 2022.

Moving on. So, last week, we had a large monthly options expiration (OPEX). After this, liquidity providers’ re-hedging flows supported the market.

Over the weekend, into Tuesday’s U.S. close, equities, then, traded higher. The rally, however, was not confidence-inspiring and was indicative of short-covering.

Per SpotGamma’s Hedging Impact of Real-Time Options (HIRO) indicator, participants took the relief rally “as an opportunity to hedge/sell,” as I wrote for SpotGamma, yesterday.

Graphic: SpotGamma’s combined HIRO reading for the S&P 500 (INDEX: SPX) and SPDR S&P 500 ETF Trust (NYSE: SPY). Trade was responsive (i.e., buy dip, sell rip) up until 2:00 PM ET when demand for negative delta (i.e., put buying, call selling) outweighed that for positive delta.

This ultimately showed up in broad measures of implied volatility. As The Ambrus Group’s Kris Sidial said: “[I]n the final hour, spot [and] vol up.”

This plays into decreased odds for a far-reaching rally. Participants are positioned out in strikes that are lower and the activity in those strikes plays into a change in tone with respect to the non-linearity and strength of volatility and skew with respect to linear changes in asset prices.

As Karsan spoke to, last week, the spikes in short-dated -sticky skew – the “first we’ve seen since [the] secular decline began” – hints at a “critical change in dealer positioning.”

“We’re transitioning to a fat left tail, right-based distribution,” Karsan adds

So why does any of this matter?

There still appears to be a heavy supply of options, particularly those with less time to maturity, and skew remains poor-performing (hence comments in prior letters on the benefit of buying into implied skew convexity should volatility reprice).

Graphic: Via Charles Schwab Corporation-owned (NYSE: SCHW) TD Ameritrade’s Thinkorswim. Note historical or realized volatility (RVOL) versus that which is implied (IVOL).

Basically, participants are hedged and volatility remains well-supplied. 

If there was to be forced selling or demand for protection by a greater share of the market in ways not recently seen, then the repricing of the aforementioned structures would be a boon for those who own them.

Graphic: Via Banco Santander SA (NYSE: SAN) research.

Options have a “non-zero second-order price sensitivity (or convexity) to a change in volatility,” as Mohamed Bouzoubaa et al explain well in the book Exotic Options and Hybrids.

“ATM vanillas are [not] convex in the underlying’s price, … but OTM vanillas do have vega convexity … [so], when the holder of an option is long vega convexity, we say she is long vol-of-vol.”

In other words, by owning that protection – e.g., butterfly and back spreads – you are positioned to monetize on a continued non-linear repricing of volatility. The difficult part is cutting the decay of those spreads when nothing happens.

Read: Trading Volatility, Correlation, Term Structure and Skew by Colin Bennett et al. Originally sourced via Academia.edu.

As an aside, despite the bearish tilt in positioning, there has been a notable uptick in index call buying per UBS Group AG (NYSE: UBS), presumably so that participants don’t miss out on a vicious reversal, should one transpire.

Graphic: Via UBS Group AG.

Adding, the “high starting point” in IVOL makes it possible to put on zero- and low-cost bets that deliver asymmetric payouts in case of violent and short-lived reversals. 

Read: Daily Brief for May 13, 2022.

Graphic: Via Banco Santander SA (NYSE: SAN) research, the return profile, at expiry, of a classic 1×2 (long 1, short 2 further away) ratio spread (the inverse of a back spread).

Technical: As of 6:30 AM ET, Wednesday’s regular session (9:30 AM – 4:00 PM ET), in the S&P 500, will likely open in the lower part of a negatively skewed overnight inventory, inside of prior-range and -value, suggesting a limited potential for immediate directional opportunity.

In the best case, the S&P 500 trades higher; activity above the $3,696.00 low volume area (LVNode) puts in play the $3,722.50 LVNode. Initiative trade beyond the LVNodes could reach as high as the $3,735.75 and $3,770.75 high volume areas (HVNodes), or higher.

In the worst case, the S&P 500 trades lower; activity below the $3,696.00 LVNode puts in play the $3,675.25 HVNode. Initiative trade beyond the HVNode could reach as low as the $3,639.00 RTH Low and $3,610.75 HVNode, or lower.

Click here to load today’s key levels into the web-based TradingView charting platform. Note that all levels are derived using the 65-minute timeframe. New links are produced, daily.
Graphic: 65-minute profile chart of the Micro E-mini S&P 500 Futures.

Considerations: Gap scenarios are in play, today.

Gaps ought to fill quickly. Should they not, that’s a signal of strength; do not fade. Leaving value behind on a gap-fill or failing to fill a gap (i.e., remaining outside of the prior session’s range) is a go-with indicator.

Auctioning and spending at least 1-hour of trade back in the prior range suggests a lack of conviction; in such a case, do not follow the direction of the most recent initiative activity.

Definitions

A structurally sound market will build on areas of high volume (HVNodes). Should the market trend for long periods of time, it will lack sound structure, identified as low volume areas (LVNodes). LVNodes denote directional conviction and ought to offer support on any test. 

If participants were to auction and find acceptance into areas of prior low volume (LVNodes), then future discovery ought to be volatile and quick as participants look to HVNodes for favorable entry or exit.

About

After years of self-education, strategy development, mentorship, and trial-and-error, Renato Leonard Capelj began trading full-time and founded Physik Invest to detail his methods, research, and performance in the markets.

Capelj also develops insights around impactful options market dynamics at SpotGamma and is a Benzinga reporter.

Some of his works include conversations with ARK Invest’s Catherine Wood, investors Kevin O’Leary and John Chambers, FTX’s Sam Bankman-Fried, Kai Volatility’s Cem Karsan, The Ambrus Group’s Kris Sidial, among many others.

Disclaimer

In no way should the materials herein be construed as advice. Derivatives carry a substantial risk of loss. All content is for informational purposes only.

Categories
Commentary

Daily Brief For June 21, 2022

The daily brief is a free glimpse into the prevailing fundamental and technical drivers of U.S. equity market products. Join the 300+ that read this report daily, below!

What Happened

Overnight, the equity index and commodity futures were bid, all the while bonds and the dollar edged lower. This is after a week-long or so de-rate on tougher monetary policies.

Big headlines include the White House’s mulling of a U.S. gas tax suspension, Russia’s status as a top exporter of crude to China, Goldman Sachs Group Inc’s (NYSE: GS) recession warning, Elon Musk’s intent to cut Tesla Inc’s (NASDAQ: TSLA) workforce, and falling Iron ore prices on China’s building downturn.

Interesting reads from over the weekend include Dr. Pippa Malmgren’s letter on the market’s “nosedive” which is likely to be “followed by a newfound understanding of what is possible,” and how that plays into economic strength and military superiority. 

Adding, timely was a Sohn 2022 conversation with Stanley Druckenmiller on his experiences and the current market environment. 

Ahead is data on the Chicago Fed National Activity Index (8:30 AM ET), existing-home sales (10:00 AM ET), as well as Fed-speak by Loretta Mester (12:00 PM ET) and Tom Barkin (3:30 PM ET).

Graphic updated 6:30 AM ET. Sentiment Risk-On if expected /ES open is above the prior day’s range. /ES levels are derived from the profile graphic at the bottom of the following section. Levels may have changed since initially quoted; click here for the latest levels. SqueezeMetrics Dark Pool Index (DIX) and Gamma (GEX) calculations are based on where the prior day’s reading falls with respect to the MAX and MIN of all occurrences available. A higher DIX is bullish. At the same time, the lower the GEX, the more (expected) volatility. Learn the implications of volatility, direction, and moneyness. SHIFT data used for S&P 500 (INDEX: SPX) options activity. Note that options flow is sorted by the call premium spent; if more positive, then more was spent on call options. Breadth reflects a reading of the prior day’s NYSE Advance/Decline indicator. VIX reflects a current reading of the CBOE Volatility Index (INDEX: VIX) from 0-100.

What To Expect

Fundamental: Keeping this letter brief, today.

The sale of both bonds and equities worsened in part due to the implications of inflation and the Federal Reserve’s (Fed) response to that inflation.

Graphic: Via Nordea Bank’s (OTC: NRDBY) research. “We suspect that the real economy will be less sensitive to a rise in interest rates this time, which means that the Fed could have to move rates more-than-expected before policy gets restrictive. The strongest argument is that the household balance sheets are in a much better shape to sustain their level of spending as the massive injections of money and credit through both monetary and fiscal stimulus have changed household balance sheets dramatically.”

We talked about this in the weeks prior. 

Essentially, as Joseph Wang, who was a trader at the Fed, puts it, “[b]onds are not acting as a hedge and appear to be becoming less ‘money’ like due persistent declines in price and elevated rate vol.”

“Investors in both bonds and stocks are reaching for cash by selling their assets, driving further asset price declines. For non-bank investors, ‘cash’ means bank deposits.” 

Graphic: Via Bloomberg.

Ultimately, an increase in the RRP (reverse repo) and QT (which is a direct flow of capital to capital markets) “would drain the pool of bank deposits by ~$1t by year-end,” and this may prompt investors to “continue to lower their selling prices to compete for the cash they want.” 

Graphic: Via CrossBorder Capital.

Positioning: Detailed was Friday, June 17’s commentary that honed in on some of the implications of pre- and post-Federal Reserve meeting positioning. 

Essentially, with the June monthly options expiration (OPEX), there was a roll-off of a large amount of customer negative delta exposure (via put options they owned). 

Graphic: Via SpotGamma’s S&P 500 Index (INDEX: SPX) Gamma Model. Updated June 17, 2022.

With expiration, liquidity providers (who were short these put options, as well as underlying to hedge) re-hedged (bought back some of their static short-delta), and this removes pressure.

“The SPX index quarterly option notional is higher than usual, but the market is below the concentration of risk given the recent selloff,” said Tanvir Sandhu, chief global derivatives strategist at Bloomberg Intelligence, who we quoted last week.

“Price action will reflect the economic context, but flows from expiring in-the-money hedges may support the market.”

Accordingly, markets are off their lows. However, in the above text, we made little mention of participants’ rolling forward of their options bets to lower strikes, further out in time, as well as the impact of customers still maintaining a “sizable short put position,” a dynamic we’ve talked about before.

Graphic: Via SpotGamma. “Options flow, last week, was unsurprisingly dominated by index puts (red lines). Most interesting was index puts bought to cover (third chart) indicating there was a fairly sizable short put position heading into last week.”

Taken together, coupled with what SpotGamma observes is “anemic” call buying (viewed as the blue line in the top chart above), participants are hedged and volatility remains well-supplied. 

Graphic: Via Nomura Holdings Inc (NYSE: NMR). Taken from The Market Ear. “The ‘muted’ VIX narrative goes on. The VIX vs SPX gap remains rather wide here. The second chart shows just how ‘depressed’ VIX remains vs the underlying px action. Most people have been stopped out/de-grossed risk, so there isn’t much demand to hedge exposure.”

Despite being stretched from a technical perspective, positioning-wise, lower prices are sticky and the context for a far-reaching bounce, all else equal, is not there.

We shall provide updates to this, later in the week. Read the Daily Brief for June 17, 2022, for more on how to position in light of the above information.

Technical: As of 6:30 AM ET, Tuesday’s regular session (9:30 AM – 4:00 PM ET), in the S&P 500, will likely open in the upper part of a positively skewed overnight inventory, outside of prior-range and -value, suggesting a potential for immediate directional opportunity.

In the best case, the S&P 500 trades higher; activity above the $3,735.75 HVNode puts in play the $3,749.00 ONH. Initiative trade beyond the ONH could reach as high as the $3,773.25 HVNode and $3,821.50 LVNode, or higher.

In the worst case, the S&P 500 trades lower; activity below the $3,735.75 HVNode puts in play the $3,722.50 LVNode. Initiative trade beyond the $3,722.50 LVNode could reach as low as the $3,690.25 HVNode and $3,639.00 RTH Low, or lower.

Click here to load today’s key levels into the web-based TradingView charting platform. Note that all levels are derived using the 65-minute timeframe. New links are produced, daily.
Graphic: 65-minute profile chart of the Micro E-mini S&P 500 Futures.

Definitions

Volume Areas: Should the market trend for long periods of time, it will lack sound structure, identified as low volume areas (LVNodes). LVNodes denote directional conviction and ought to offer support on any test. 

If participants were to auction and find acceptance into areas of prior low volume (LVNodes), then future discovery ought to be volatile and quick as participants look to HVNodes for favorable entry or exit.

Overnight Rally Highs (Lows): Typically, there is a low historical probability associated with overnight rally-highs (lows) ending the upside (downside) discovery process.

About

After years of self-education, strategy development, mentorship, and trial-and-error, Renato Leonard Capelj began trading full-time and founded Physik Invest to detail his methods, research, and performance in the markets.

Capelj also develops insights around impactful options market dynamics at SpotGamma and is a Benzinga reporter.

Some of his works include conversations with ARK Invest’s Catherine Wood, investors Kevin O’Leary and John Chambers, FTX’s Sam Bankman-Fried, Kai Volatility’s Cem Karsan, The Ambrus Group’s Kris Sidial, among many others.

Disclaimer

In no way should the materials herein be construed as advice. Derivatives carry a substantial risk of loss. All content is for informational purposes only.

Categories
Commentary

Daily Brief For May 6, 2022

The Daily Brief is a free glimpse into the prevailing fundamental and technical drivers of U.S. equity market products. Join the 200+ that read this report daily, below!

What Happened

Overnight, equity index futures auctioned weak, inside of the prior day’s large trading range.

Yesterday, the equity indexes, bonds, and crypto (which many saw as a hedge against equities) were sold, aggressively. The selling came one day after the Federal Reserve hiked 0.50 basis points and outlined its balance sheet reduction timeline.

Notable was ten-year Treasury yields breaking the 3.00% barrier.

Despite a more dovish tone (i.e., Fed assuaging participants of a 0.75 basis point hike in the coming meetings), the near-vertical price rise (which we discussed was a function of “structural buyback” in yesterday’s morning letter) was taken back in a fire sale across all sectors.

Today is data on nonfarm payrolls, unemployment rates, average hourly earnings, and labor force participation (8:30 AM ET). Later, consumer credit data is released (3:00 PM ET).

Speaking today is the Fed’s John Williams (9:15 AM ET), Raphael Bostic (3:20 PM ET), James Bullard and Chris Waller (7:15 PM ET), as well as Mary Daly (8:00 PM ET).

Graphic updated 6:45 AM ET. Sentiment Neutral if expected /ES open is inside of the prior day’s range. /ES levels are derived from the profile graphic at the bottom of the following section. Levels may have changed since initially quoted; click here for the latest levels. SqueezeMetrics Dark Pool Index (DIX) and Gamma (GEX) calculations are based on where the prior day’s reading falls with respect to the MAX and MIN of all occurrences available. A higher DIX is bullish. At the same time, the lower the GEX, the more (expected) volatility. Learn the implications of volatility, direction, and moneyness. SHIFT data used for S&P 500 (INDEX: SPX) options activity. Note that options flow is sorted by the call premium spent; if more positive, then more was spent on call options. Breadth reflects a reading of the prior day’s NYSE Advance/Decline indicator. VIX reflects a current reading of the CBOE Volatility Index (INDEX: VIX) from 0-100.

What To Expect

Positioning: In yesterday’s detailed letter, we talked about the implications of participants’ hedging heading into and after the Federal Open Market Committee (FOMC) event.

Mainly, markets were stretched and participants were demanding protection in size. As said:

“Barring a worst-case scenario, if markets do not perform to the downside (i.e., do not trade lower), those highly-priced (often very short-dated) bets on direction will quickly decay, and hedging flows with respect to time and volatility may bolster sharp rallies.” 

After that “structural buyback,” as Kai Volatility’s Cem Karsan explained clearly, it was highly likely the bear trend would hold. Participants not shifting their bets on direction (via options) to higher prices, further out in time, further suggested very little change in sentiment.

Toggle, which is an AI and machine learning research firm tracking 35,000 securities globally, sent us, yesterday, their post-Fed analysis. According to them, “during the first week after the Fed’s 50 bps hike markets broadly headed lower.”

“In fact, 1 in 5 times the drop reached more than 5%.”

Graphic: Via Toggle.

The firm’s CEO and founder – Jan Szilagyi – said, in response to the market action that “market bulls should root for stocks to go down first.”

That’s actually a powerful statement. For markets to break (rally), they sometimes need to rally (break). Said another way, at times the market is stretched. Sellers (buyers) are either too short (or too long), if we will.

In order to trade lower, for instance, that short inventory (which in and of itself is a support mechanism as it is a bunch of buy orders sitting at lower prices) must be cleared (i.e., covered).

After that support is removed, the market can succumb to whatever fundamental weaknesses it was trying to price in. 

In this case, “the incremental effects on liquidity (QE/QT),” as Karsan says.

Moreover, what’s interesting, and this is something others have picked up on, is the difference between the level of volatility that is realized and implied by activity in the derivatives market.

Another time we saw such divergences was during the 2020 Coronacrisis sell-off.

Graphic: Via @HalfersPower. On March 2, 2020, “VIX-30 day realized vol go from 99 percentile yesterday to inverted and 9 percentile today lol. (left vs. right).

Let’s unpack. So, the Cboe Volatility Index (INDEX: VIX), as described by Cboe Global Markets Inc (BATS: CBOE), is a “constant, 30-day expected volatility of the U.S. stock market, derived from real-time, mid-quote prices of S&P 500 Index (INDEX: SPX) call and put options.”

Essentially, to make it simple, VIX is the equity market’s pricing of risk or insurance and it has a strong inverse relationship with the SPX. If SPX is lower, the VIX higher, basically.

Then, just as we have metrics to measure the change in an option’s sensitivity to the underlying direction (delta) or gamma, we have the sensitivity of an option to changes in volatility (vega) or volga.

Volga has different names. Vomma. The convexity of vega (i.e., change in vega based on change in volatility implied by market participants’ activity). The volatility of volatility. And so on.

The volatility of volatility can naively be measured through the Cboe VVIX Index (INDEX: VVIX) which, according to Cboe, “represents a volatility of volatility in the sense that it measures the expected volatility of the 30-day forward price of VIX.”

Historically, the gauge has a mean somewhere beneath 100 and a high correlation with the VIX at times of heightened stress (e.g., Coronacrisis).

Graphic: The VVIX via Physik Invest.

What’s going on is there is really negative sentiment and emotion, both of which are playing into market weaknesses and realized volatility. However, that realized volatility is not priced in.

In other words, the volatility of volatility – VVIX – is low relative to the volatility realized (and implied) and that, as I take it, essentially means that the market is not pricing up protection.

Graphic: Via The Ambrus Group’s Kris Sidial. “Trotting out the good old VVIX/VIX (trader heuristic) to compare SPX skew to VIX Vol. Negative sentiment but lack of fear continues.”

Why does this matter? Well, when you think there is to be an outsized move, relative to what is priced, you buy options (positive exposure to gamma) so that you may have gains that are potentially amplified in case of directional movement.

You also buy can buy options for positive exposure to volga. This is so that you may have gains that are potentially amplified in case of movement (repricing) in implied volatility.

Graphic: Via @Alpha_Ex_LLC. “Here’s 10-day realized vs VVIX on a scatter. The ‘white star’ is 40 realized but only 117 VVIX. When realized this high, VVIX typically closer to 150.”

With back-to-back daily price changes sometimes in excess of 2%, this essentially suggests to us the potential for the pricing of equity market risk to “catch up.”

Graphic: Via Bloomberg. The realized volatility for the SPX versus the VIX.

Per SpotGamma, much of this has to do with market participants being “well-hedged.”

“From an options perspective, participants would have to demand en masse protection (buy puts, sell calls) for liquidity providers to further take from market liquidity (sell into weakness) and that volatility skew to, essentially, blowout (e.g., Corona crisis, Meme mania, and the like).”

The Ambrus Group’s Kris Sidial, who felt that the liquidation was likely large desks de-risking their book, explains, well, too: 

“Vol is mainly used as a source of hedging. We are coming off of a big FOMC meeting where vol was slightly elevated. Think about this for a second, although SPX had a nasty day today, we are still right where we were at Tuesday… what does that tell you?”

“That means there wasn’t really a NEED to rehedge that same exposure. Volatility didn’t compress much after FOMC and when the market gave it all back it brought us right back to where we started. Put yourself in the shoes of an institution.”

Graphic: SpotGamma’s Hedging Impact of Real-Time Options Indicator (HIRO) for SPY shows light put selling and call buying. Participants are (likely) hedged and are not demanding protection in size amid lower prices.

Pursuant to those remarks, SpotGamma sees markets reaching a lower limit near the $4,000.00 SPX area. At that juncture, the rate at which liquidity providers add pressure in their hedging activities flattens as they, too, have hedges.

Graphic: Via SpotGamma. Updated April 27, 2022.

“In turn, dealers may be able to advantageously reduce delta hedging (sell less), and supply markets with more liquidity (buy more stock). This could serve to reduce volatility.”

So, what do you do with this information? The idea is that volatility implied may reprice to reflect what is realized. In such a case, you’d want positive exposure to volga (i.e., don’t sell volatility).

This is more of a view on volatility rather than direction, at this juncture.

Directionally speaking, the returns distribution is skewed positive. This is from an overlay of proxies for buying and naive gamma exposure.

Here’s one model using similar data we often look at in this letter.

Graphic: Via nextSignals. “When SPX and [gamma exposure] nosedive after an extended selloff while dark pools’ buying sharply diverges to the upside … buy the S&P 500.”

Technical: As of 6:45 AM ET, Friday’s regular session (9:30 AM – 4:00 PM ET), in the S&P 500, will likely open in the middle part of a negatively skewed overnight inventory, inside of prior-range and -value, suggesting a limited potential for immediate directional opportunity.

In the best case, the S&P 500 trades higher; activity above the $4,148.25 high volume area (HVNode) puts in play the $4,184.25 HVNode. Initiative trade beyond the $4,184.25 HVNode could reach as high as the $4,212.25 micro composite point of control (MCPOC) and $4,303.00 weak high (obvious breakout level), or higher.

In the worst case, the S&P 500 trades lower; activity below the $4,148.25 HVNode puts in play the $4,099.25 regular trade low (RTH Low). Initiative trade beyond the RTH Low could reach as low as the $4,055.75 low volume area (LVNode) and $3,978.50 LVNode, or lower.

Click here to load today’s key levels into the web-based TradingView charting platform. Note that all levels are derived using the 65-minute timeframe. New links are produced, daily.
Graphic: 65-minute profile chart of the Micro E-mini S&P 500 Futures.

Definitions

Overnight Rally Highs (Lows): Typically, there is a low historical probability associated with overnight rally-highs (lows) ending the upside (downside) discovery process.

Volume Areas: A structurally sound market will build on areas of high volume (HVNodes). Should the market trend for long periods of time, it will lack sound structure, identified as low volume areas (LVNodes). LVNodes denote directional conviction and ought to offer support on any test. 

If participants were to auction and find acceptance into areas of prior low volume (LVNodes), then future discovery ought to be volatile and quick as participants look to HVNodes for favorable entry or exit.

POCs: POCs are valuable as they denote areas where two-sided trade was most prevalent in a prior day session. Participants will respond to future tests of value as they offer favorable entry and exit.

Volume-Weighted Average Prices (VWAPs): A metric highly regarded by chief investment officers, among other participants, for quality of trade. Additionally, liquidity algorithms are benchmarked and programmed to buy and sell around VWAPs.

About

After years of self-education, strategy development, mentorship, and trial-and-error, Renato Leonard Capelj began trading full-time and founded Physik Invest to detail his methods, research, and performance in the markets.

Capelj also develops insights around impactful options market dynamics at SpotGamma and is a Benzinga reporter.

Some of his works include conversations with ARK Invest’s Catherine Wood, investors Kevin O’Leary and John Chambers, FTX’s Sam Bankman-Fried, Kai Volatility’s Cem Karsan, The Ambrus Group’s Kris Sidial, among many others.

Disclaimer

In no way should the materials herein be construed as advice. Derivatives carry a substantial risk of loss. All content is for informational purposes only.