The Daily Brief is a free glimpse into the prevailing fundamental and technical drivers of U.S. equity market products. Join the 200+ that read this report daily, below!
What Happened
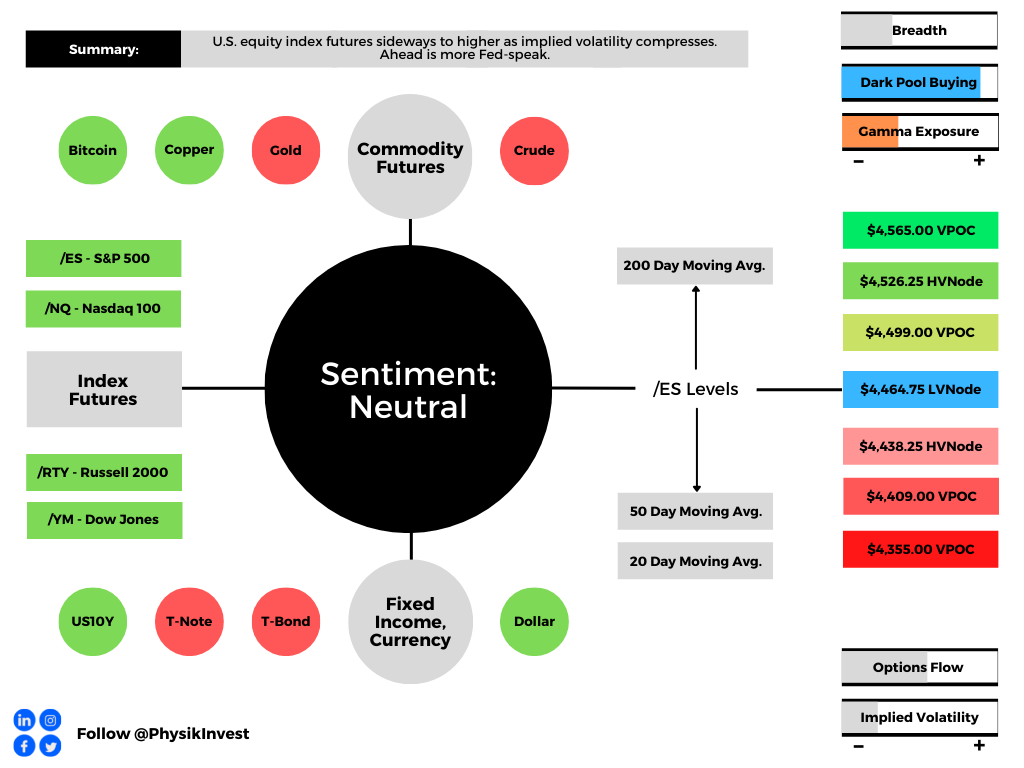
Overnight, equity index futures auctioned sideways to higher, inside of the prior day’s range. Most other commodity and bond futures were bid while implied volatility metrics came in a bit.
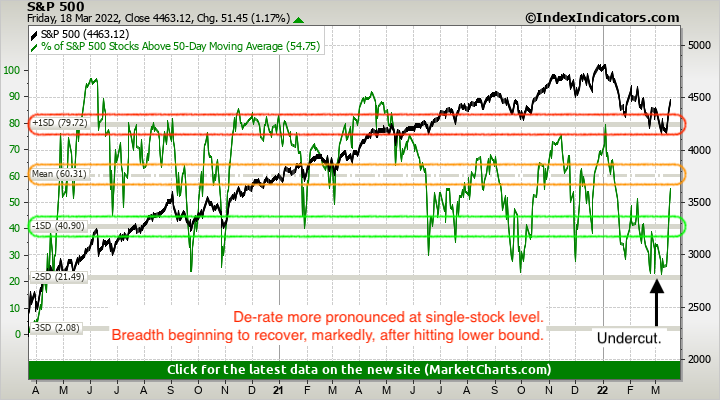
Notable was the depth and breadth of Monday’s decline. Though the indexes were tame, some of which is attributable to suppressive hedging, single stocks expanded their ranges, greatly, to the downside, and this points to potential capitulation.
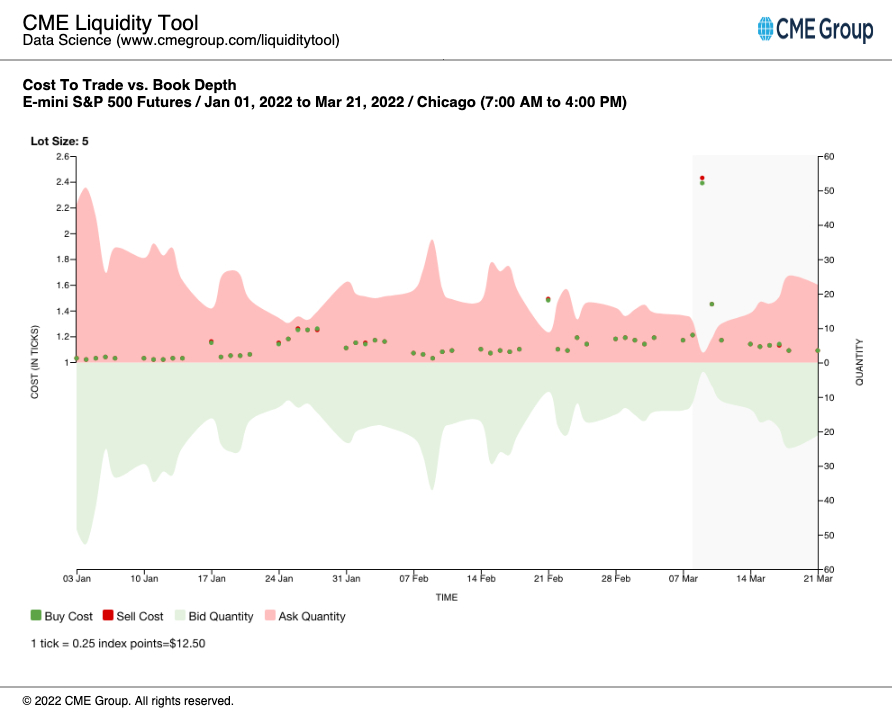
On the news front, a U.S. central bank report found that “the risk of a sudden significant deterioration [in liquidity] appears higher than normal” and stablecoin use to meet margin requirements in crypto trades makes them “vulnerable to runs.”
This is just as some algorithmic stablecoins have lost their peg (e.g., UST/USD ~$0.60).
Additionally, the report found elevated inflation, as well as the reaction to that “could negatively affect domestic economic activity, asset prices, credit quality, and financial conditions.”
Ahead is data on real household debt (11:00 AM ET).
What To Expect
Context: We continue to build out the narrative.
A market-wide drop, Monday, pointed to signs of capitulation as “small-time investors offloaded a net of about $1 billion in equities, the most aggressive selling in 14 months,” per JPMorgan Chase & Co (NYSE: JPM).

Notwithstanding, the volatility divergences this letter has pointed to, in the face of pronounced realized volatility, continue.
As Pat Hennessy of IPS Strategic Capital explains, at-the-money implied volatility is high and term structure is in backwardation, which are reflections of uncertainty and demand for hedges.
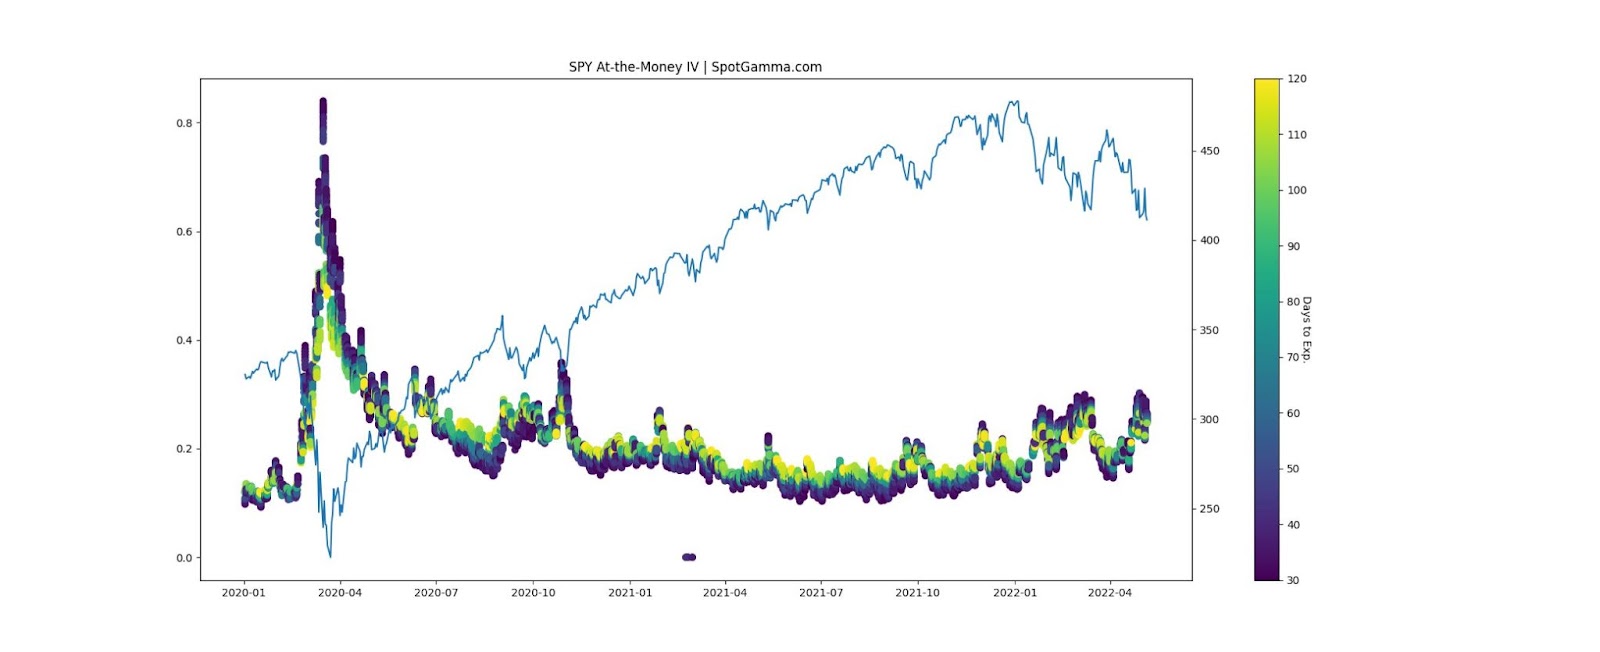
“It’s just rare to see wingy short-dated puts like this so cheap relative to ATM.”
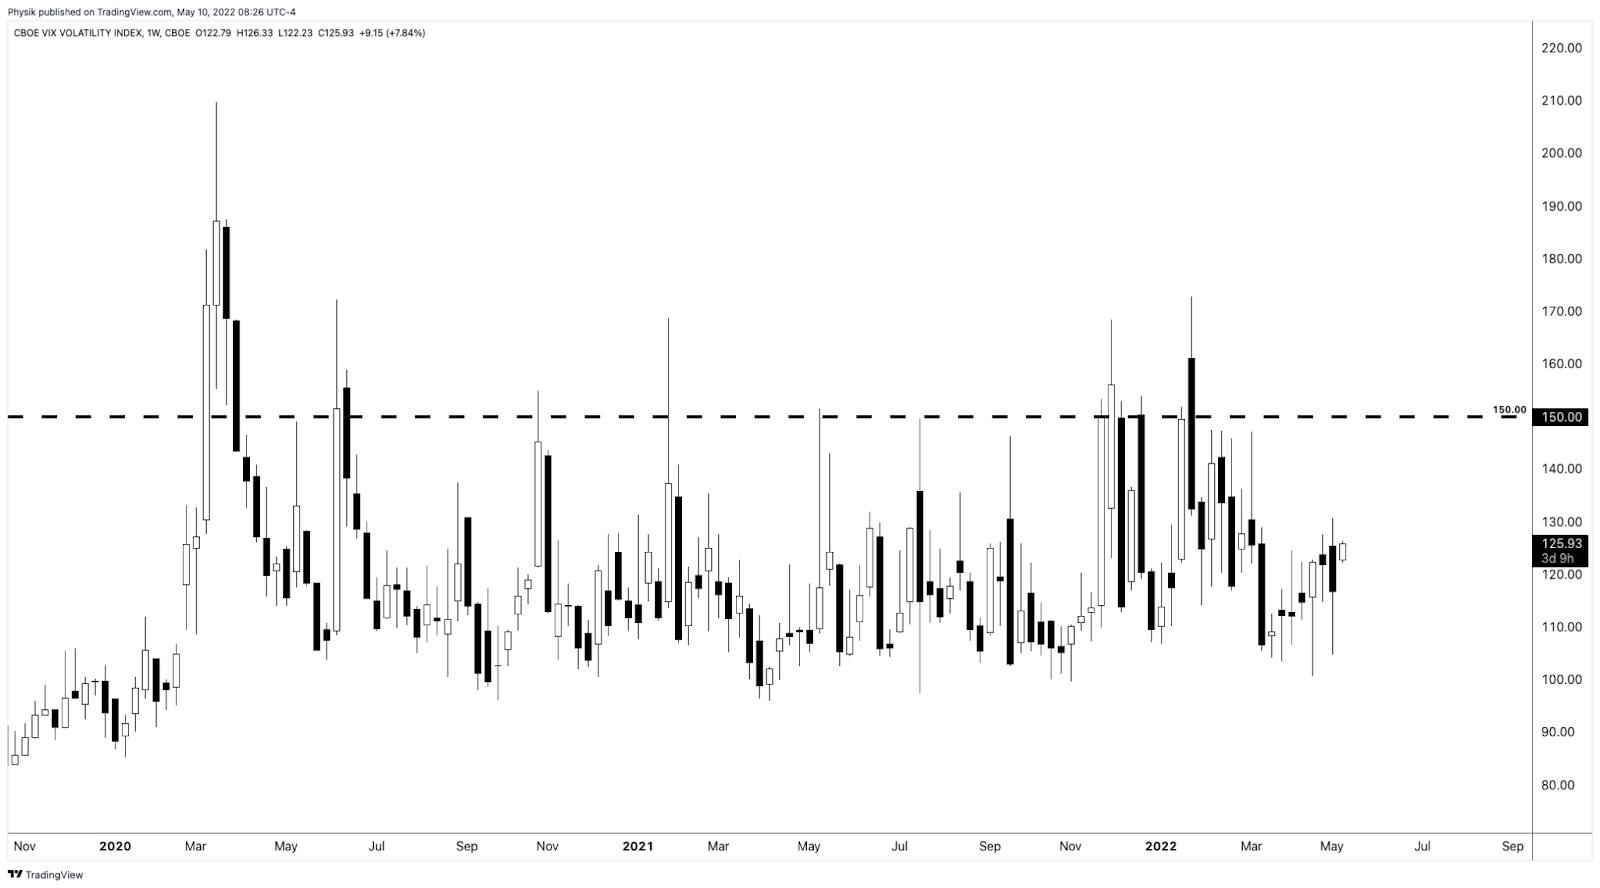
As explained in Monday’s letter (and in greater detail, Friday), a measure like the Cboe VVIX Index (INDEX: VVIX), or the volatility of volatility, has a mean below 100 and a high correlation with the Cboe Volatility Index (INDEX: VIX) during times of stress.
When realized volatility is as high as it is, today, the VVIX typically trades closer to 150.
To quote Benn Eifert of QVR Advisors: “Skew goes up if vol outperforms the skew curve a lot on a selloff.”
What’s going on?
There is really negative sentiment and emotion, both of which are playing into market weaknesses and realized volatility. However, that realized volatility is not priced in.
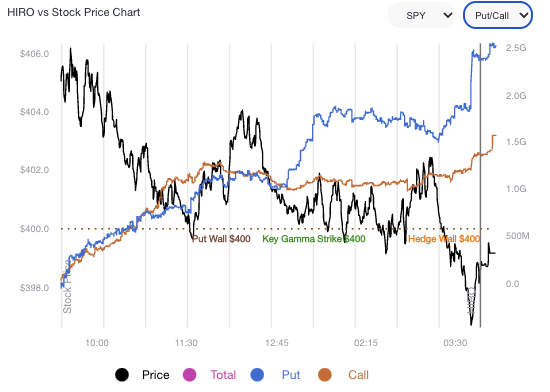
There are “plenty of put-buyers, but nearly as many sellers,” SqueezeMetrics explains.
You “don’t have to protect what you don’t own. Some investors de-grossed. Short momo (e.g., CTA) wants to bet on a bleed (a la 2000), but not on a crash. Put underwriting! No carry trades elsewhere. Sell SPX vol!”
Why does this matter?
When you think there is to be an outsized move in the underlying, relative to what is priced, you buy options (positive exposure to gamma) so that you may have gains that are potentially amplified in case of directional movement.
When you think there is to be an outsized move in the implied volatility, relative to what is priced, you buy options (positive exposure to volga) so that you may have gains that are potentially amplified in case of implied volatility repricing.
So, in all, it is a question of whether the reward is worth the risk (see below “How To Play”).
Based on stretched positioning, equity markets are positioned for upside. Notwithstanding, the potential for large negative outliers, remains. In the case of an outlier, the consequent repricing of volatility may increase the reward, relative to the risk, for selling options, particularly puts.
As The Ambrus Group’s Kris Sidial sums well:
With an S&P 500 below $4,000.00, “I would expect more of an aggressive reach for hedges … that spot- vol correlation break (weakness) would not be as present.”
“Spot- vol correlation has sucked recently, but vol relative strength should kick in.”
How I’m Playing: Borrowing from May 3’s letter, here.
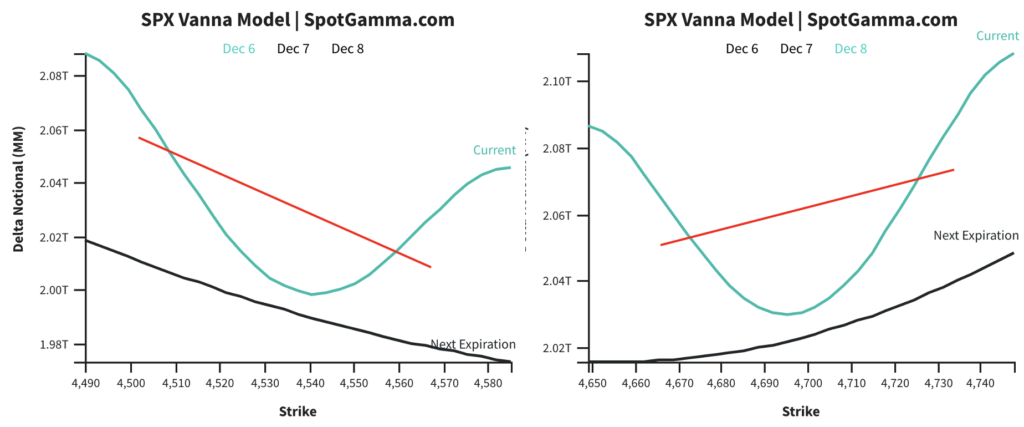
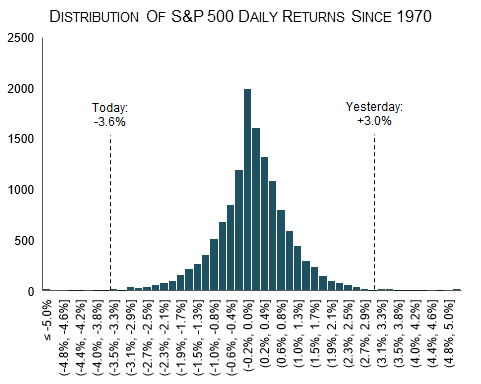
Presently, the market is stretched to the downside and, as SpotGamma says, “traders are underpricing right-tail risk,” which opens the window for unique ways to play a returns distribution that continues to be skewed positive (albeit with large negative outliers).
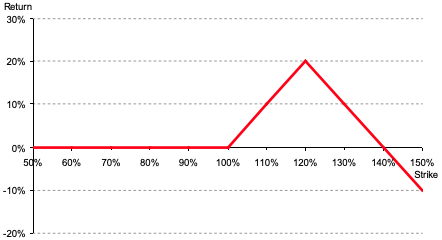
This letter’s author is concentrated on zero- and low-cost bets ($0.00-$1.00 debit to open) that deliver asymmetric payouts (sometimes in excess of $10.00 credit to close) in case of violent and short-lived reversals.
This letter’s author is structured positive delta and gamma in the Nasdaq 100 (INDEX: NDX) via ratios spread (1×2) and butterfly (1x2x1) structures.

The concern with these strategies is the width and time to expiry. Should either of those be wrong, then spreads initially positive gamma turn negative, meaning losses are amplified.
For instance, in the Nasdaq 100, to put in short, 500-1000 points wide ratio spreads (buy the closer leg, sell two of the farther legs) expiring in ten to fifteen days work well.
For those spreads that are not zero cost, debits can be offset with credit sales (on the put side) in products that have shown relative strength like the S&P 500 (INDEX: SPX). This, inherently, carries more risk, and, as explained, the risk has yet to meet the reward.
Read more about these strategies, here. The above is NOT a trade recommendation or advice.
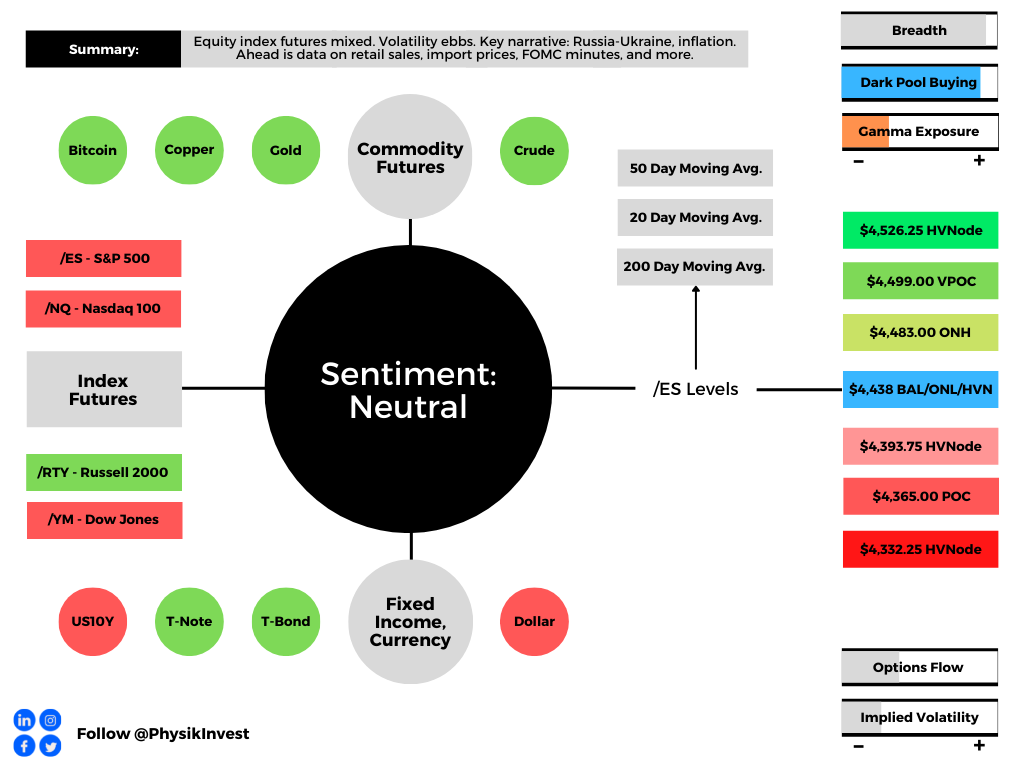
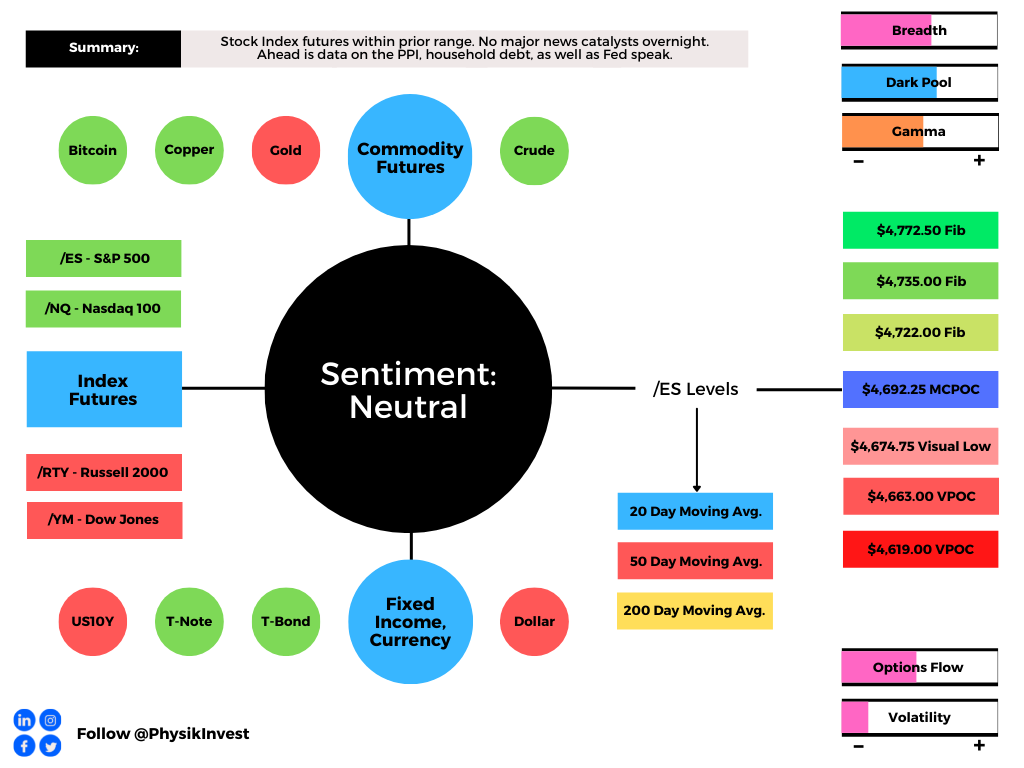
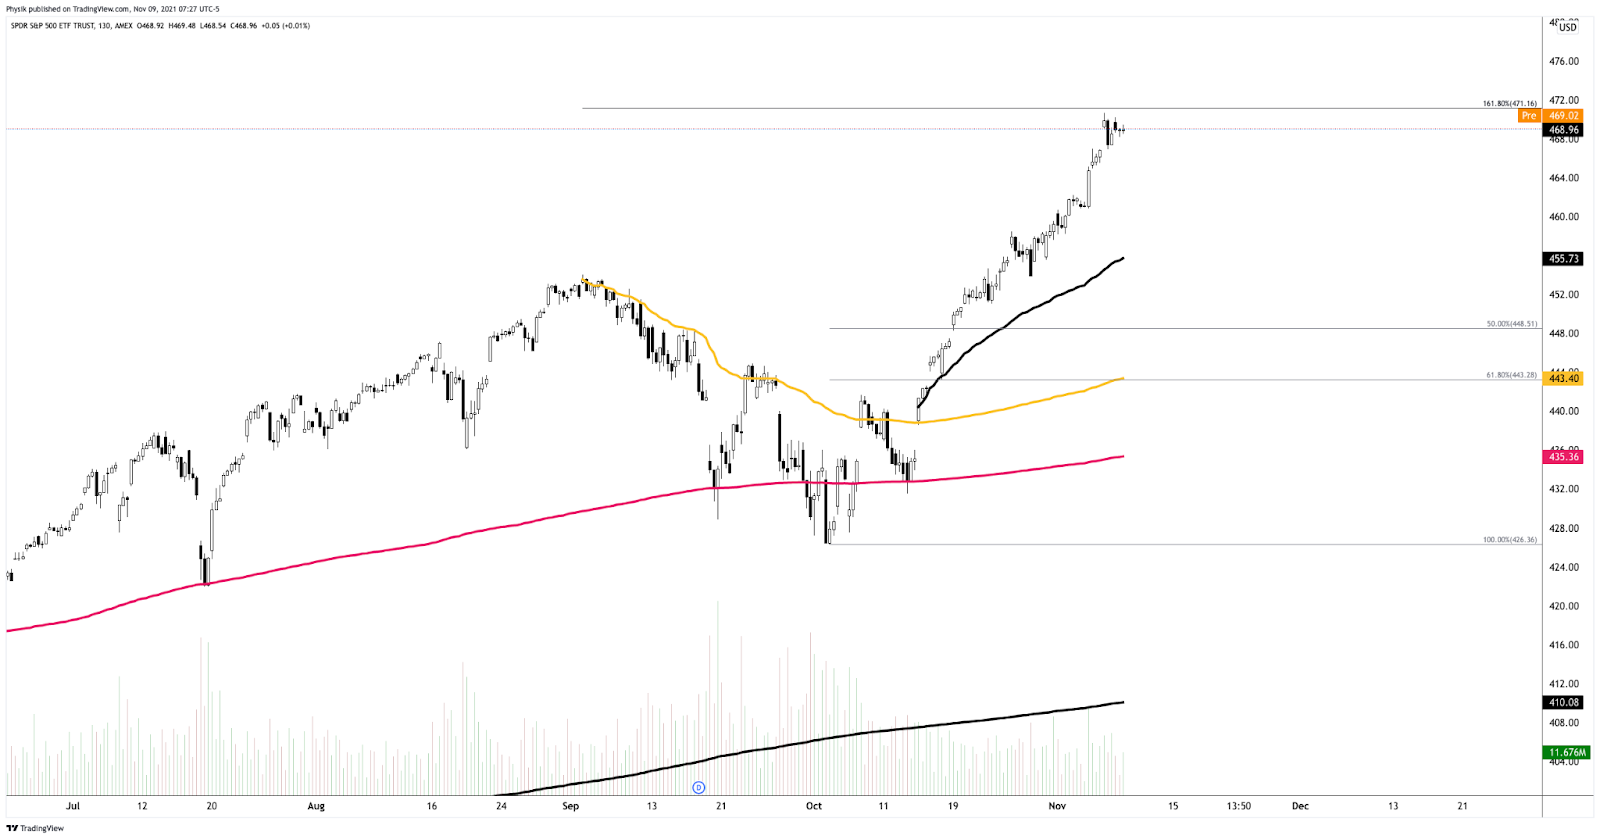
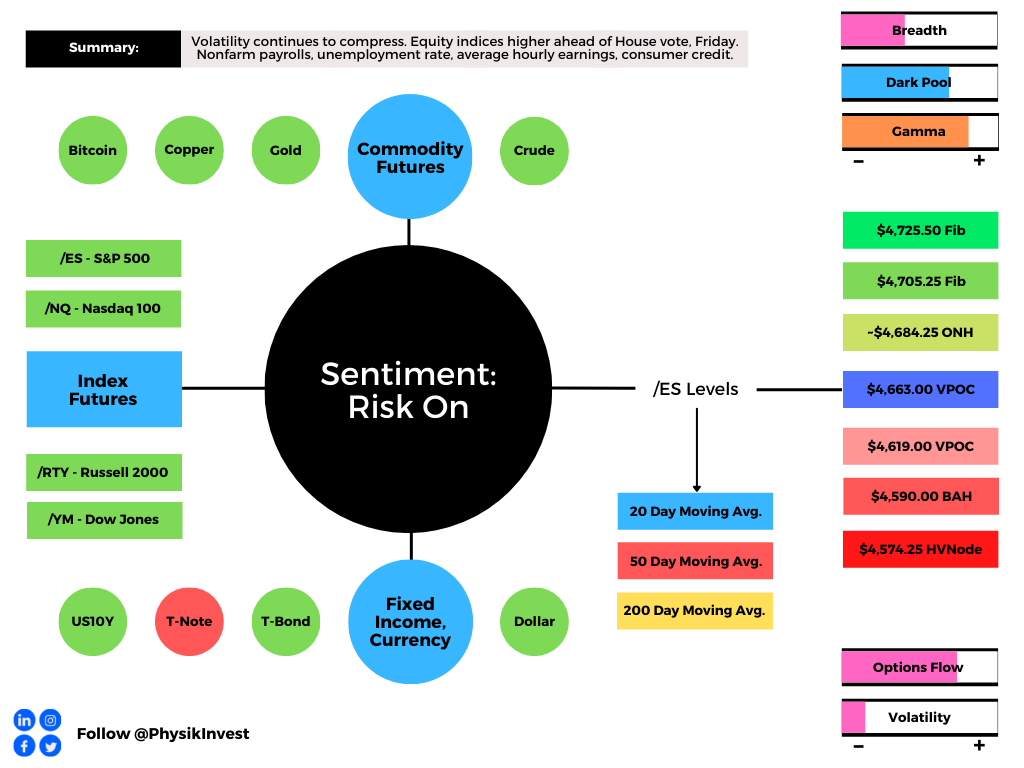
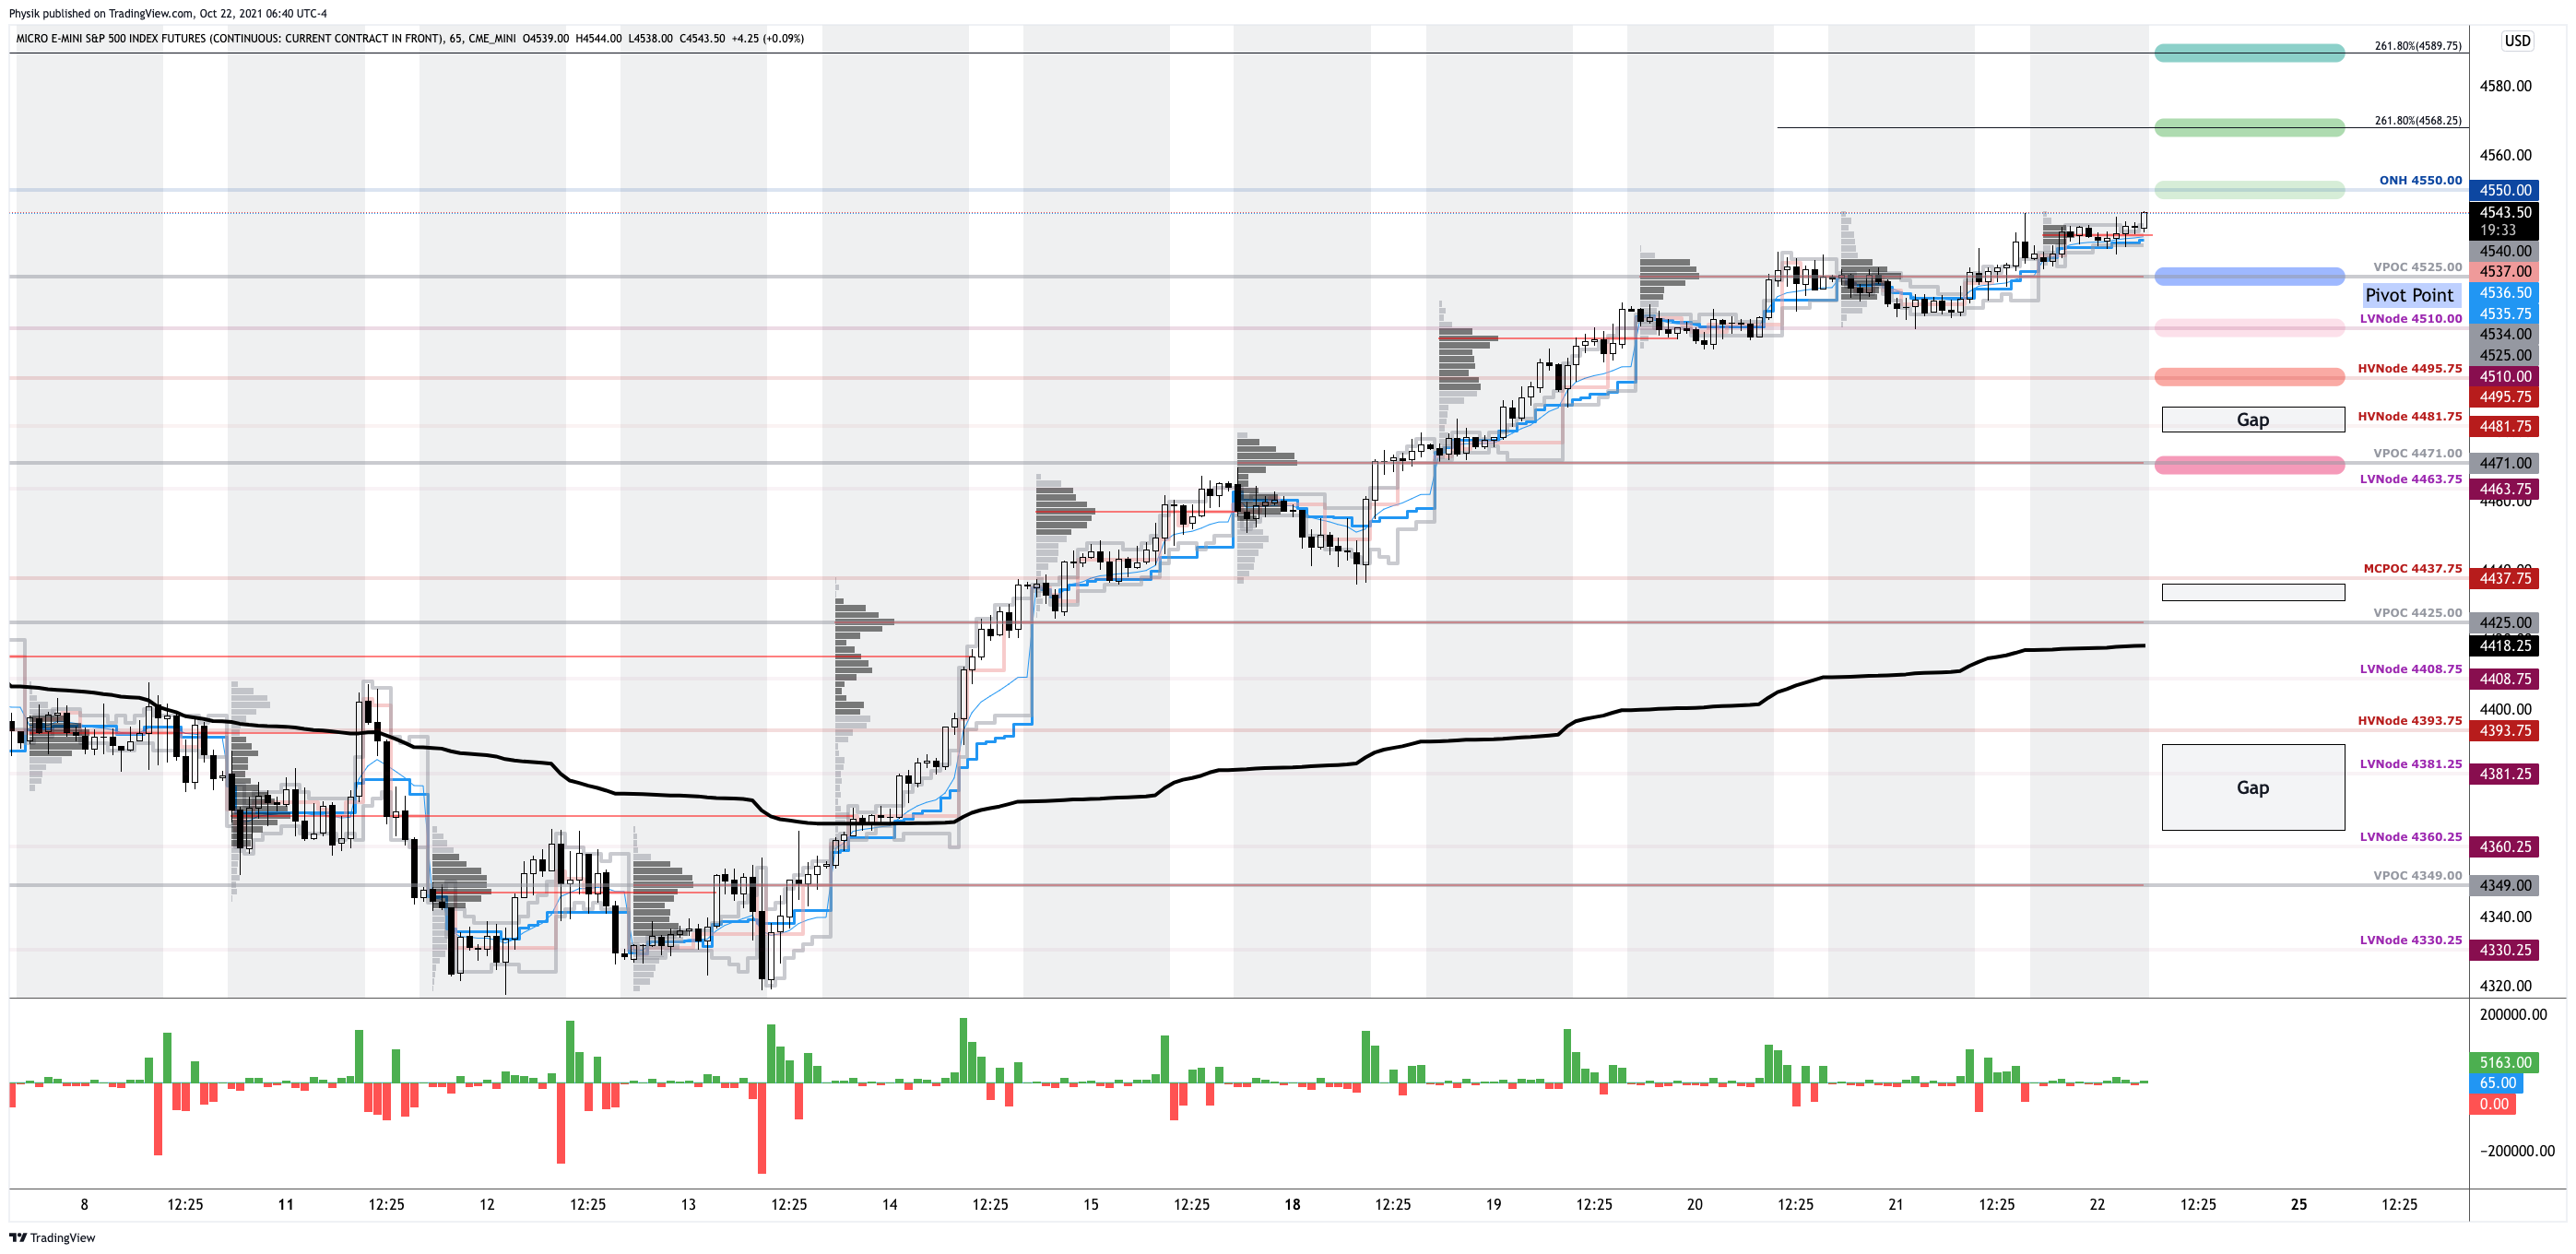
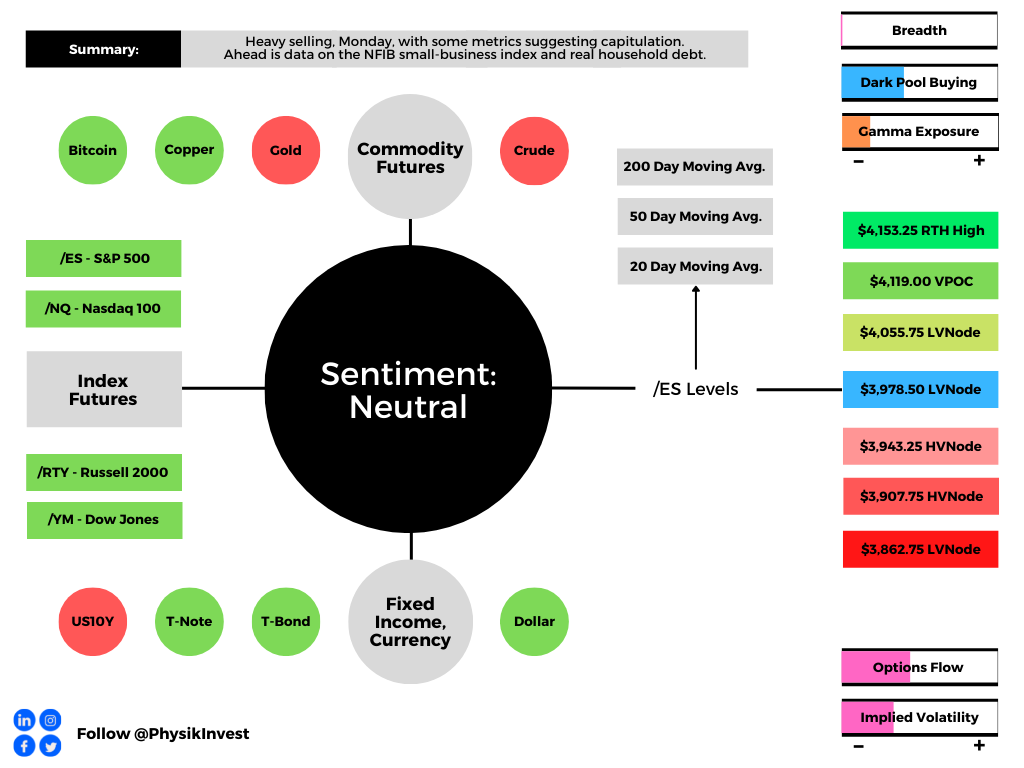
Technical: As of 6:30 AM ET, Tuesday’s regular session (9:30 AM – 4:00 PM ET), in the S&P 500, will likely open in the middle part of a balanced overnight inventory, inside of prior-range and -value, suggesting a limited potential for immediate directional opportunity.
In the best case, the S&P 500 trades higher; activity above the $3,978.50 low volume area (LVNode/gap boundary) puts in play the $4,055.75 LVNode/gap boundary. Initiative trade beyond the $4,055.75 could reach as high as the $4,119.00 untested point of control (VPOC) and $4,153.25 regular trade high (RTH High), or higher.
In the worst case, the S&P 500 trades lower; activity below the $3,978.50 LVNode/gap boundary puts in play the $3,943.25 high volume area (HVNode). Initiative trade beyond the $3,943.25 could reach as low as the $3,907.75 HVNode and $3,862.75 LVNode, or lower.
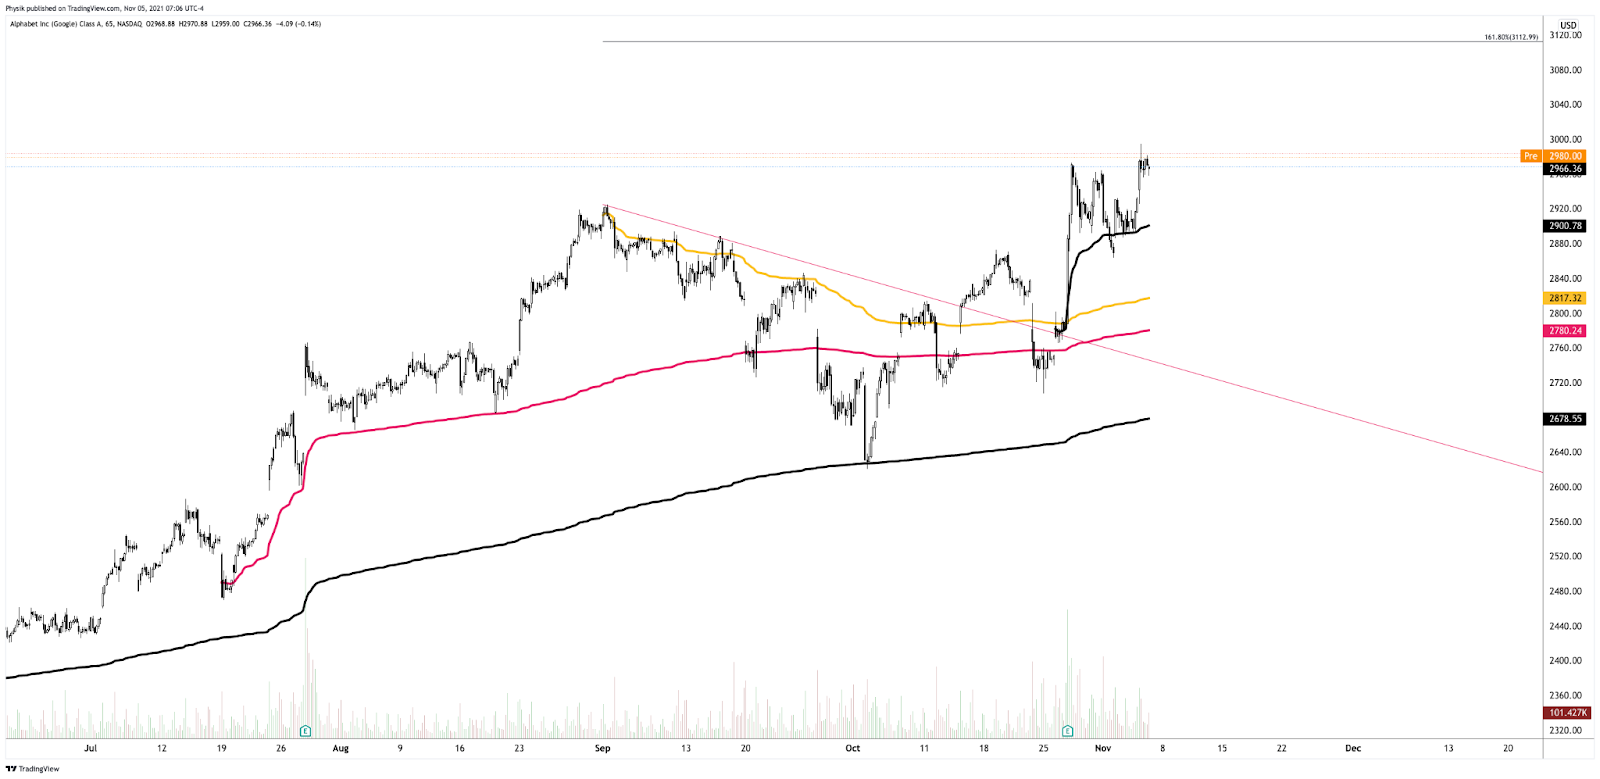
Click here to load today’s key levels into the web-based TradingView charting platform. Note that all levels are derived using the 65-minute timeframe. New links are produced, daily.

Definitions
Cave-Fill Process: Widened the area deemed favorable to transact at by an increased share of participants. This is a good development.
Volume Areas: A structurally sound market will build on areas of high volume (HVNodes). Should the market trend for long periods of time, it will lack sound structure, identified as low volume areas (LVNodes). LVNodes denote directional conviction and ought to offer support on any test.
If participants were to auction and find acceptance into areas of prior low volume (LVNodes), then future discovery ought to be volatile and quick as participants look to HVNodes for favorable entry or exit.
Gamma: Gamma is the sensitivity of an option to changes in the underlying price.
Vanna: The rate at which the delta of an option changes with respect to volatility.
Charm: The rate at which the delta of an option changes with respect to time.
Options: If an option buyer was short (long) stock, he or she would buy a call (put) to hedge upside (downside) exposure. Option buyers can also use options as an efficient way to gain directional exposure.
POCs: POCs are valuable as they denote areas where two-sided trade was most prevalent in a prior day session. Participants will respond to future tests of value as they offer favorable entry and exit.
MCPOCs: POCs are valuable as they denote areas where two-sided trade was most prevalent over numerous day sessions. Participants will respond to future tests of value as they offer favorable entry and exit.
Options Expiration (OPEX): Reduction of dealer gamma exposure.
Volume-Weighted Average Prices (VWAPs): A metric highly regarded by chief investment officers, among other participants, for quality of trade. Additionally, liquidity algorithms are benchmarked and programmed to buy and sell around VWAPs.
About
After years of self-education, strategy development, mentorship, and trial-and-error, Renato Leonard Capelj began trading full-time and founded Physik Invest to detail his methods, research, and performance in the markets.
Capelj also develops insights around impactful options market dynamics at SpotGamma and is a Benzinga reporter.
Some of his works include conversations with ARK Invest’s Catherine Wood, investors Kevin O’Leary and John Chambers, FTX’s Sam Bankman-Fried, Kai Volatility’s Cem Karsan, The Ambrus Group’s Kris Sidial, among many others.
Disclaimer
In no way should the materials herein be construed as advice. Derivatives carry a substantial risk of loss. All content is for informational purposes only.