Categories
Commentary

The End Game

Good Morning! I hope you have a great start to the week. I would be so honored if you could comment and/or share this post. Cheers!

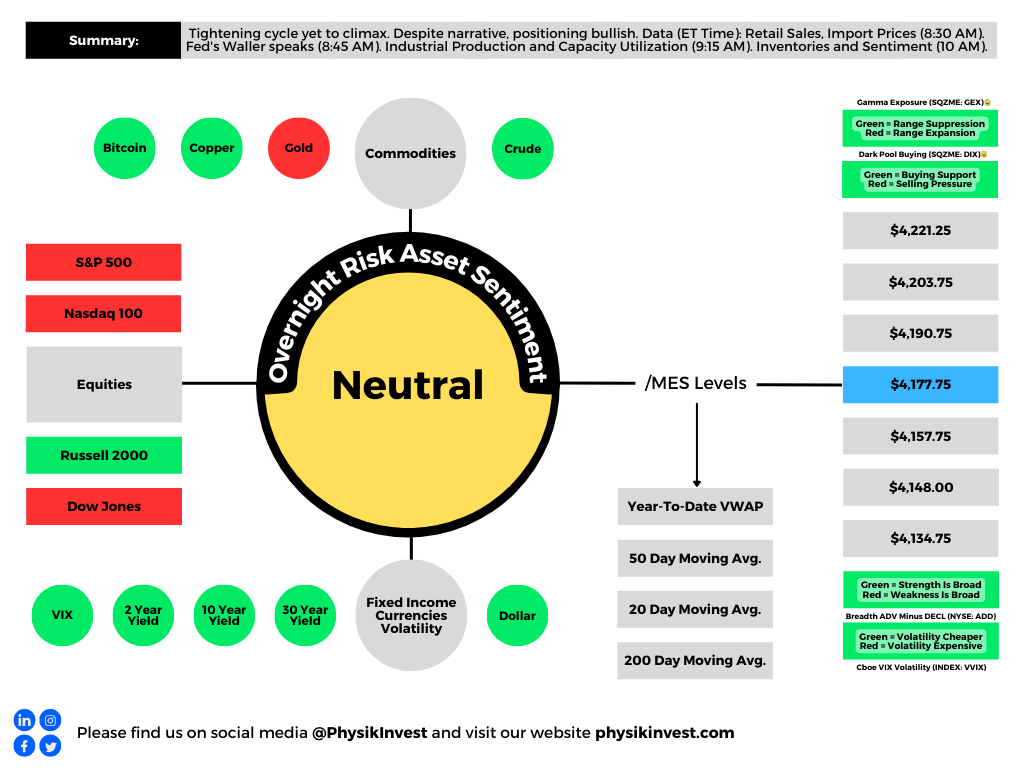
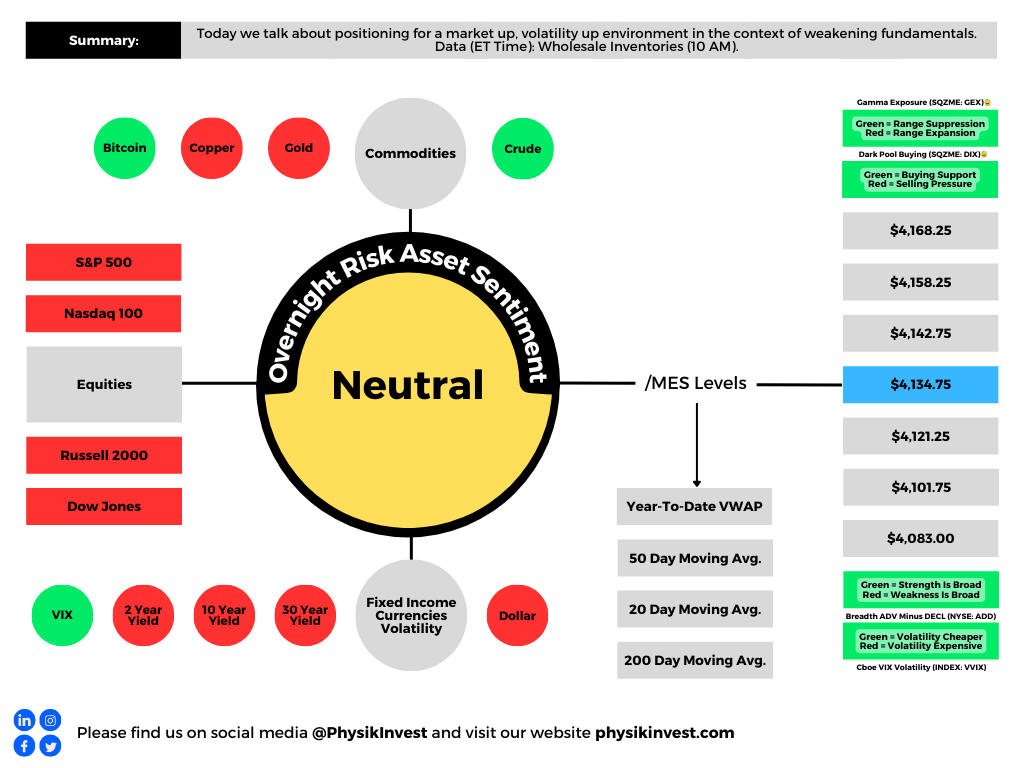
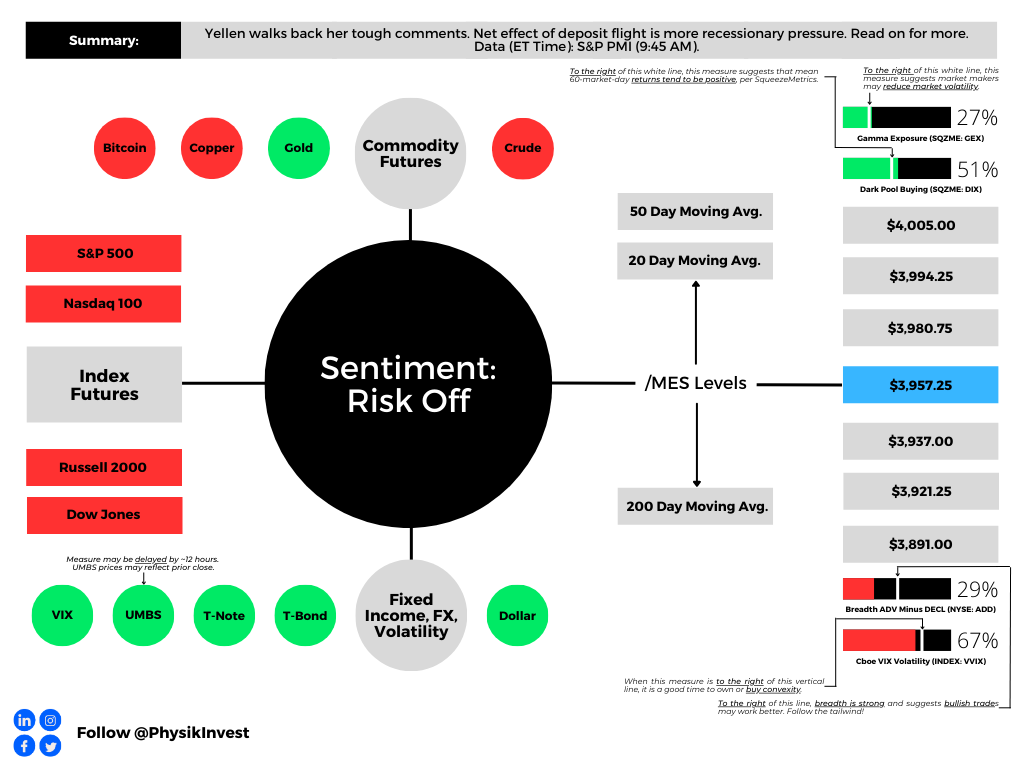
Bursts of volatility punctuate calm and resilience, resulting in demand for safety and protection in everything from stocks and commodities to bonds and currencies. The general agreement is that macroeconomic policy and geopolitics are to blame, and investors are repositioning to stem risk and potential bleeding in their portfolios. This sometimes disturbs historical trends and relationships. 

Thank you for tuning in. We will unpack much of it herein. Let’s get into it.

Graphic: Retrieved from Bloomberg.

Hedging Against Monetary Inflation, Weaponized Dollars, And Debt Monetization

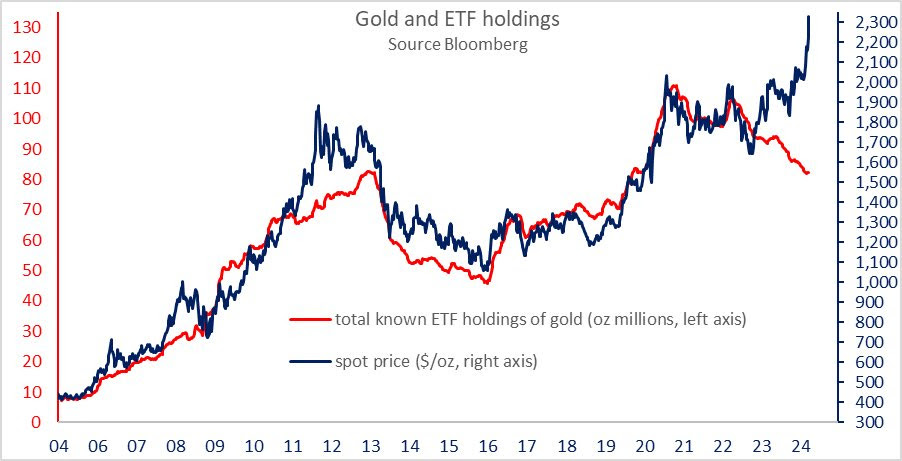
Gold serves as a prime example. Instead of being guided by conventional catalysts, including real interest rates (i.e., nominal interest rate minus inflation), growth prospects, and currencies like the dollar, recent movements are more likely driven by factors like central bank accumulation on macroeconomic and geopolitical shifts.

For instance, China may increase its gold reserves to hedge potential disruptions and sanctions, as Russia saw after it invaded Ukraine in February 2022, or establish a collateral reserve for an autonomous financial system. Likewise, Poland, the Czech Republic, and Singapore have also increased their gold reserves.

As liquidity in the gold market is thinner, this buying activity amplifies volatility and disrupts established trends. Therefore, fast moves up!

Graphic: Retrieved from Bloomberg via SuperMacro.

Why could gold continue this upward trajectory?

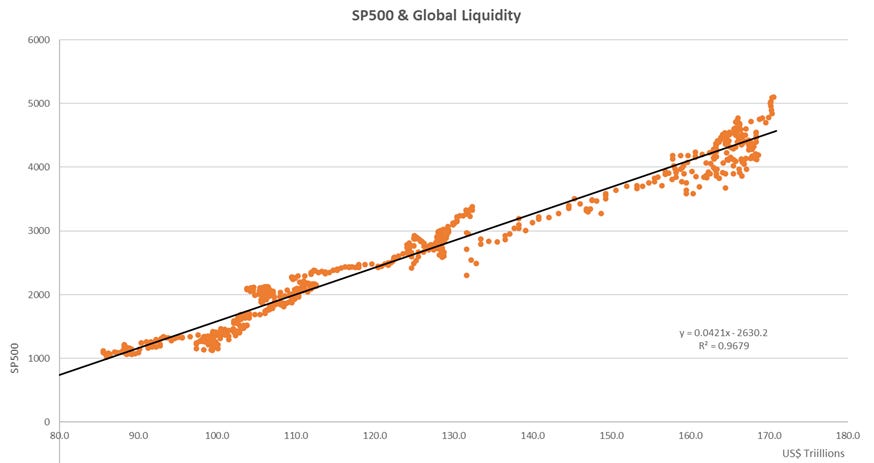
The typical trajectory is guided by monetary inflation, characterized by increasing liquidity within the financial system. According to CrossBorder Capital, gold moves 1.5 times the liquidity growth, a solid sensitivity to so-called monetary expansion. Bitcoin, often considered a digital gold, moves sooner and exhibits higher sensitivity.

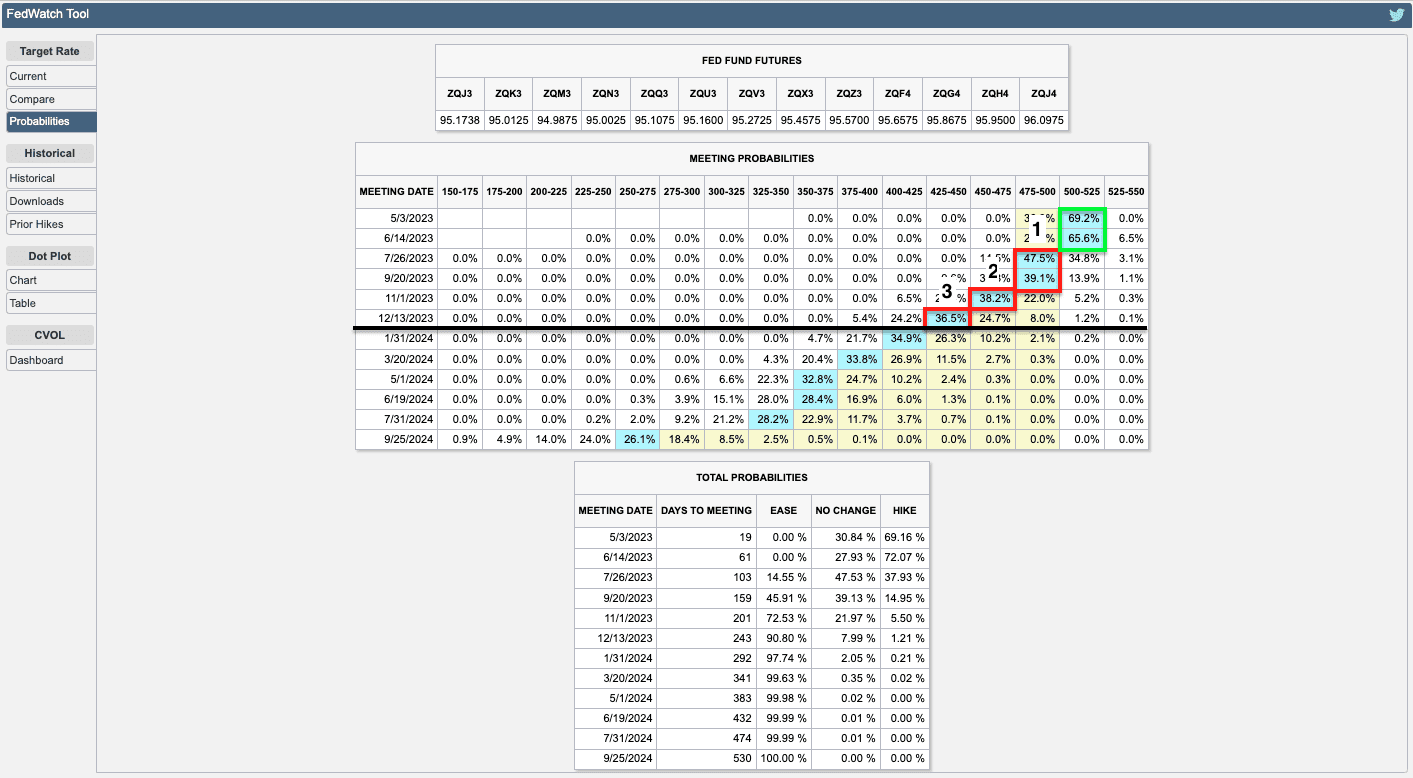
Recent expressions of interest in Treasury securities by central banking authorities, such as Federal Reserve Governor Christopher Waller, further fuel ascents. New demand would lead to higher bond prices and lower yields.

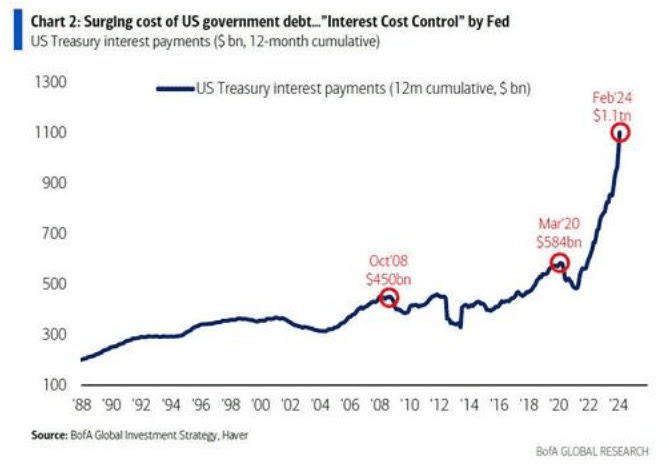
Therefore, gold continues surging due to geopolitical shifts, liquidity in the financial system, and the potential for debt monetization. The latter occurs when excessive debts prompt central bank authorities to intervene, using printed money to purchase bonds to manage interest rate levels more effectively.

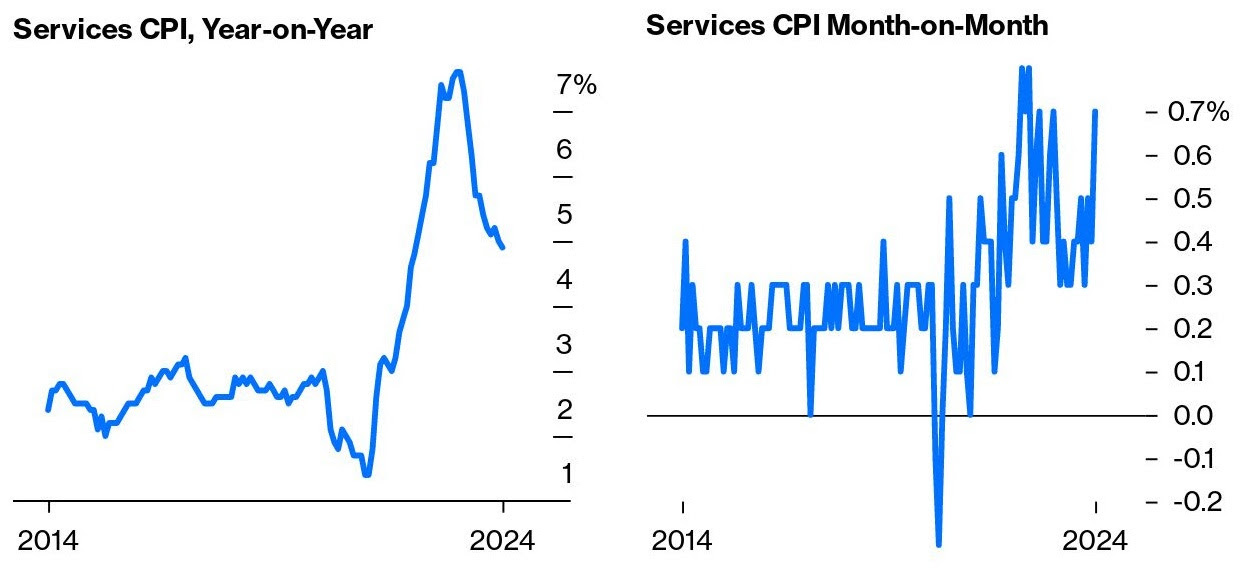
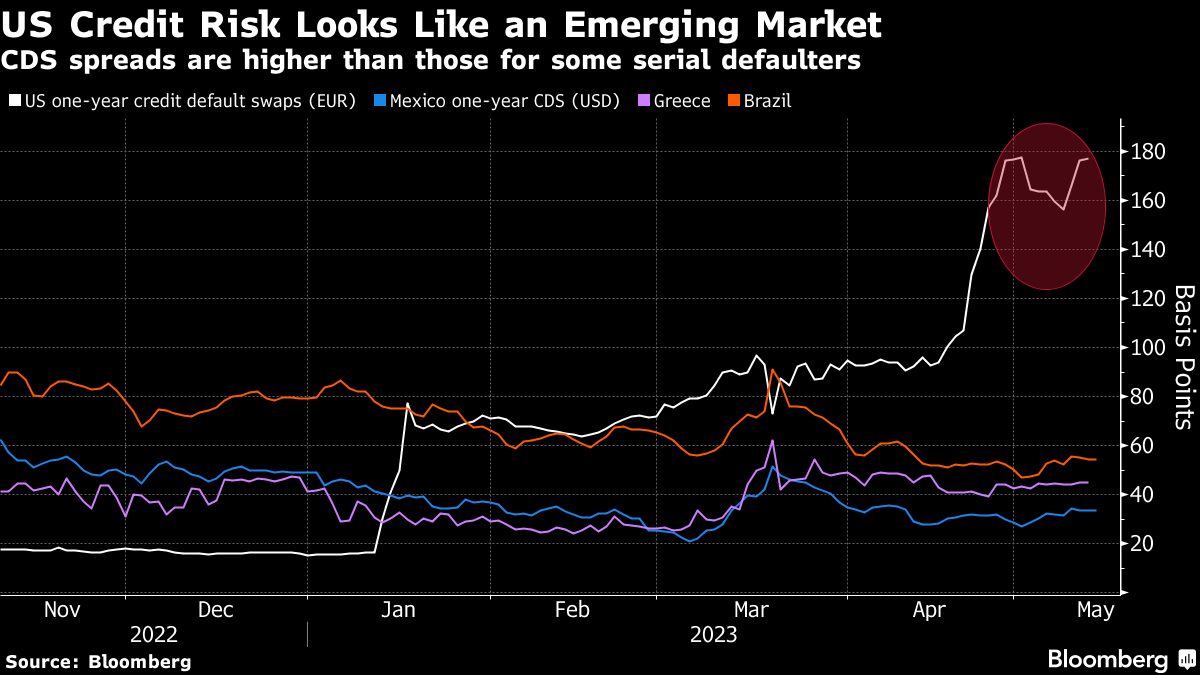
“Investors are looking beyond the ‘here and now,’ realizing that there is no way markets or the economy can sustain 5% nominal and 2% real rates,” Bank of America elaborates. Investors are “hedging two things: i) the risk that the Fed cuts as CPI accelerates, and ii) and more ominously, the ‘endgame of Fed Interest Cost Control (‘ICC’), Yield Curve Control (YCC) and QE to backstop US government spending.’”

Graphic: Retrieved from Bank of America.

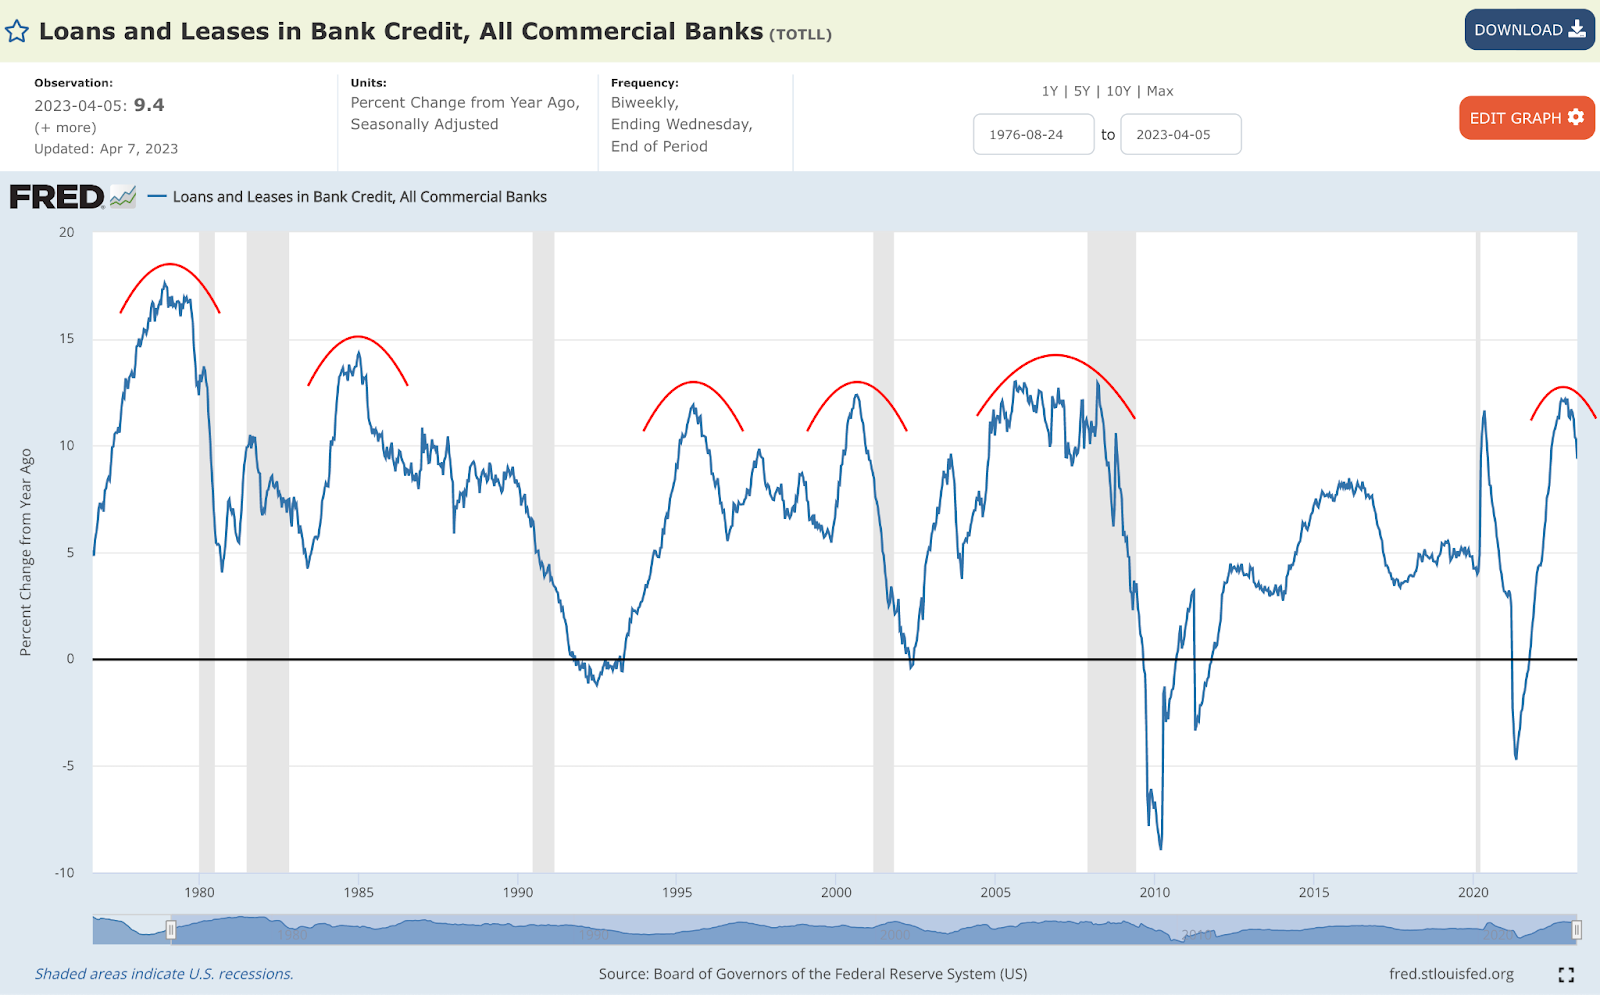
There is bi-modality. Typically, high rates are bad for gold. But, with debts and rates as they are, the probability of debt monetization increases. For now, we have a cycle wherein stocks and commodities may rise with a firming economy, and bonds may offer limited salvation, nodding to higher-for-longer rates.

Hedging Loss Of Momentum And Left Tails Following Big Move-Up And De-levering

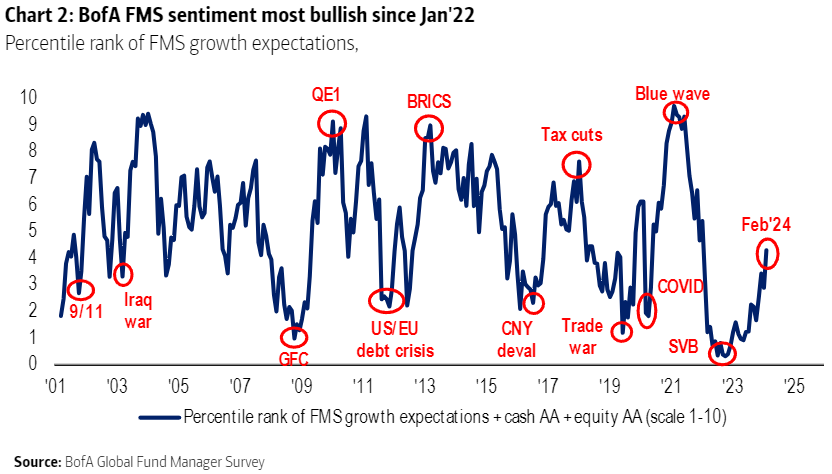
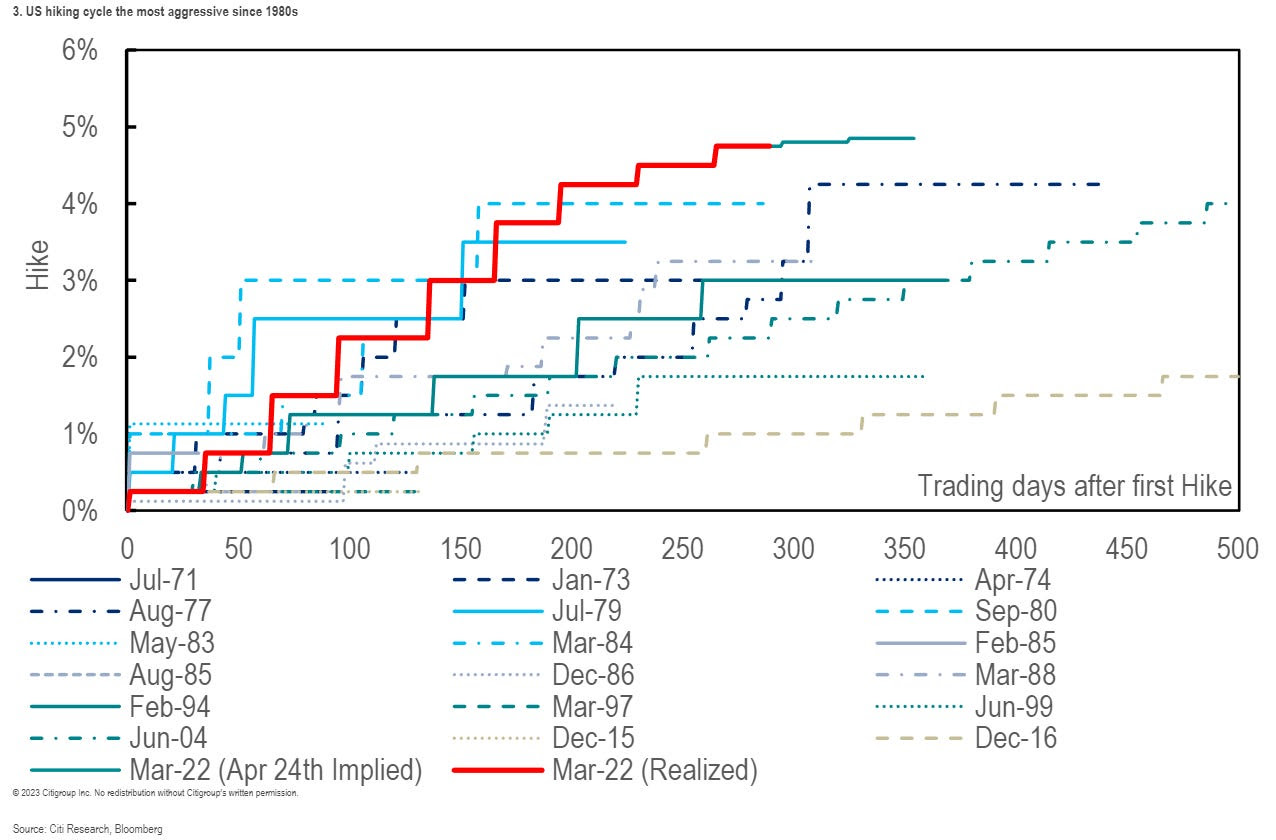
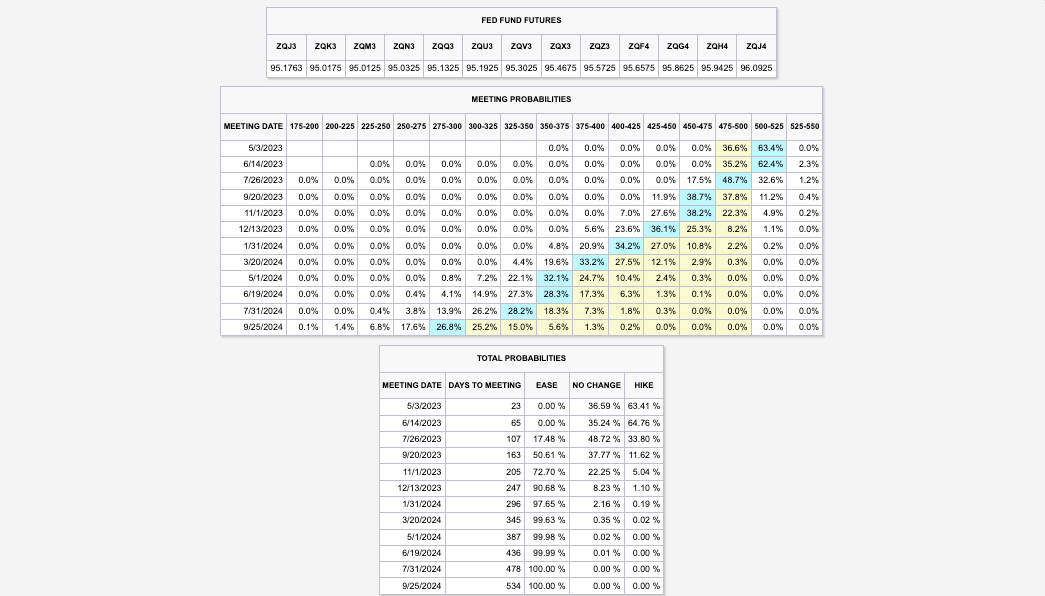
Interest rate increases are likely only on the horizon if something unexpected occurs. Given that stocks are priced well, the question arises: how can we protect ourselves while many anticipate, based on market pricing, either minimal changes to the status quo or a substantial event triggering a broad downturn?

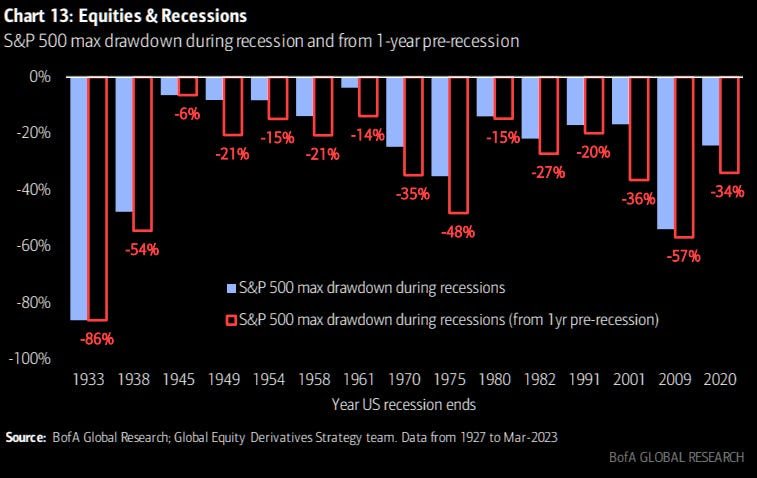
For one, commodities don’t do much good in a broad downturn.

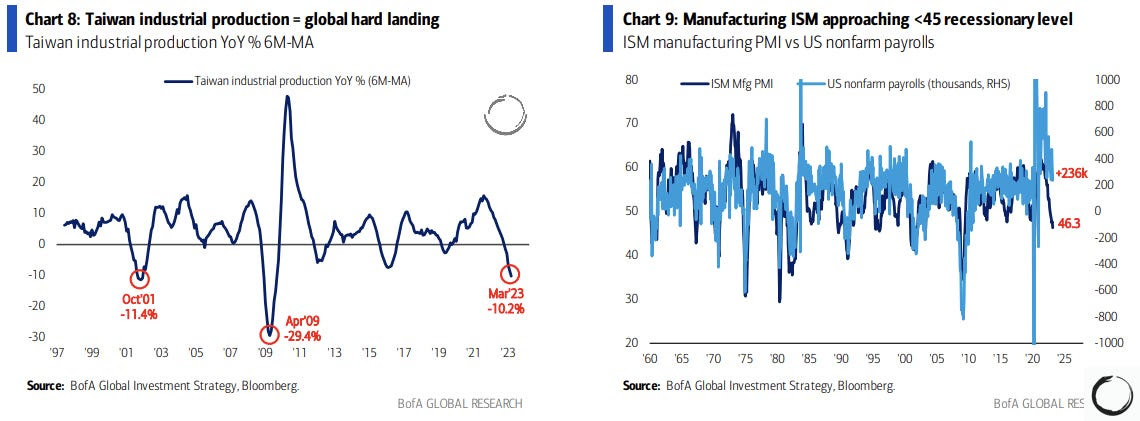
Consider the years 2001 (during the tech bubble), 2008 (amidst the global financial crisis), 2015 (the flash crash), 2018 (during Volmageddon), and 2020 (amidst the pandemic). According to Kris Sidial of The Ambrus Group, gold was an ineffective hedge against equities during these periods.

So, how do we hedge the middle reality between “minimal” and “substantial.”

Graphic: Retrieved from Bloomberg.

While direct bets on equity volatility bursts have been prominent, digestion trades may be a better alternative. Let’s unpack why.

Graphic: Retrieved from Bloomberg.

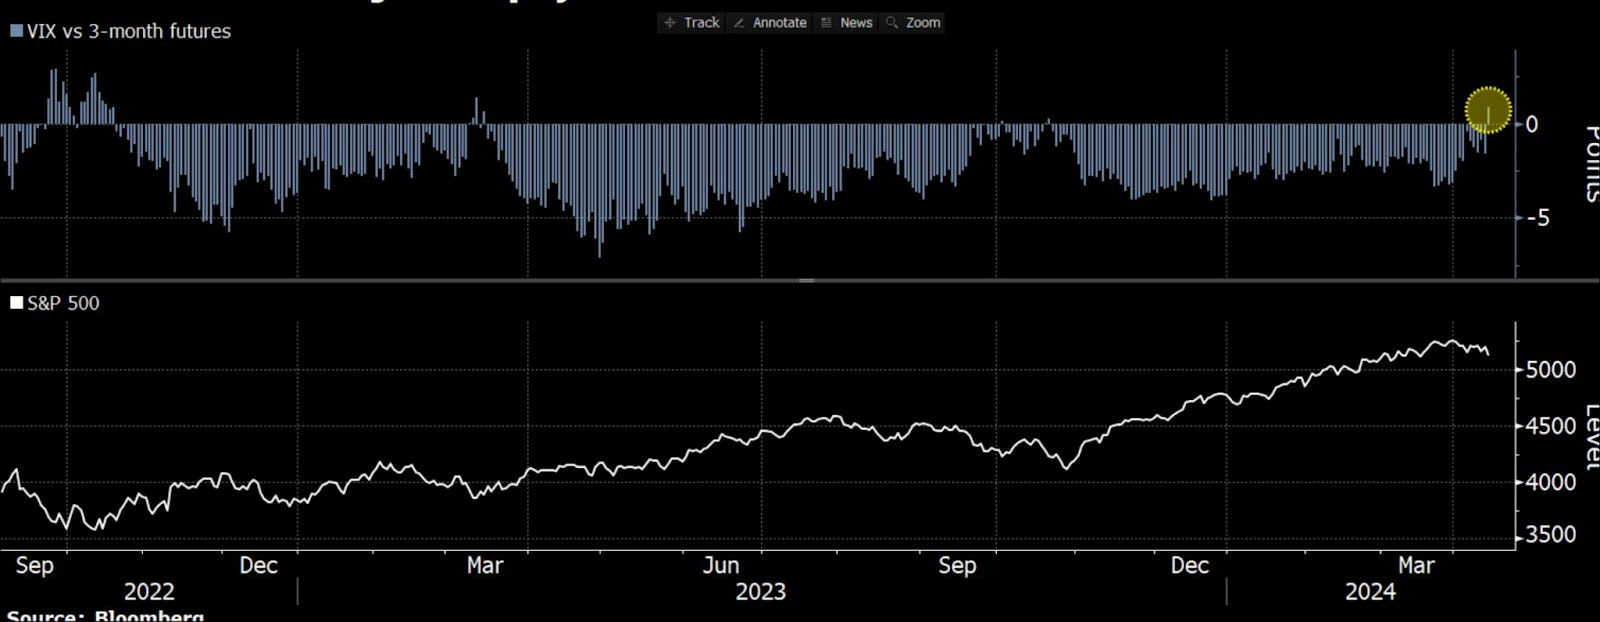
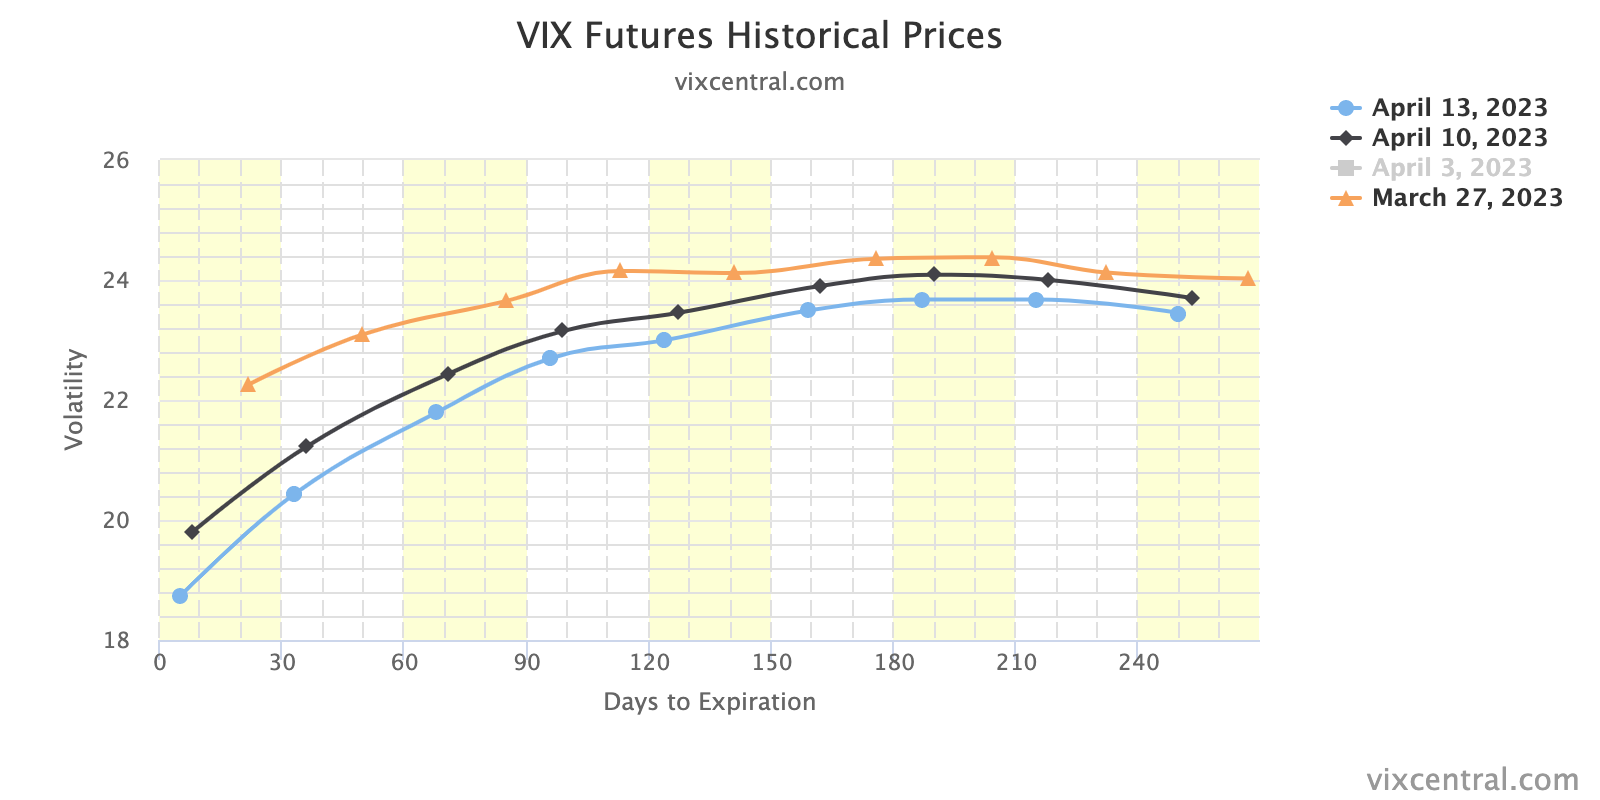
The first idea involves hedging downside thrusts in equities via call options in the Cboe Volatility Index (INDEX: VIX), Goldman Sachs, and UBS note. This isn’t necessarily optimal. Volatility is high over the short term and may revert quickly, indirectly boosting stocks. The alternative strategy entails selling options and utilizing the funds to purchase similar options with later expiration dates. Such digestion trades enable traders to capitalize on increases in volatility in the near term, reducing their costs on longer-term trades.

Graphic: Retrieved from SpotGamma’s April 15, 2024 Founder Note.

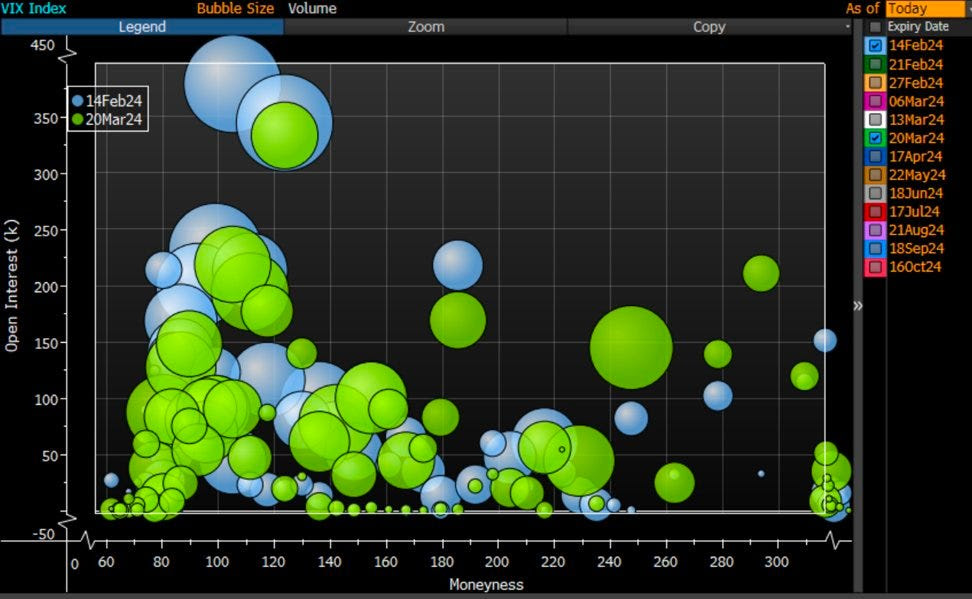
To explain, in a recent letter to subscribers, SpotGamma shared that numerous expiring VIX call options were in the money. In other words, this exposure, which makes money if the VIX and S&P 500 implied volatility (or the options market’s anticipation of future movement in the underlying), was soon to disappear. Accordingly, the hedges to this exposure would do the same, and the rebalancing after that would be enough to buoy markets.

We’ll try to break it down further in the simplest way possible. 

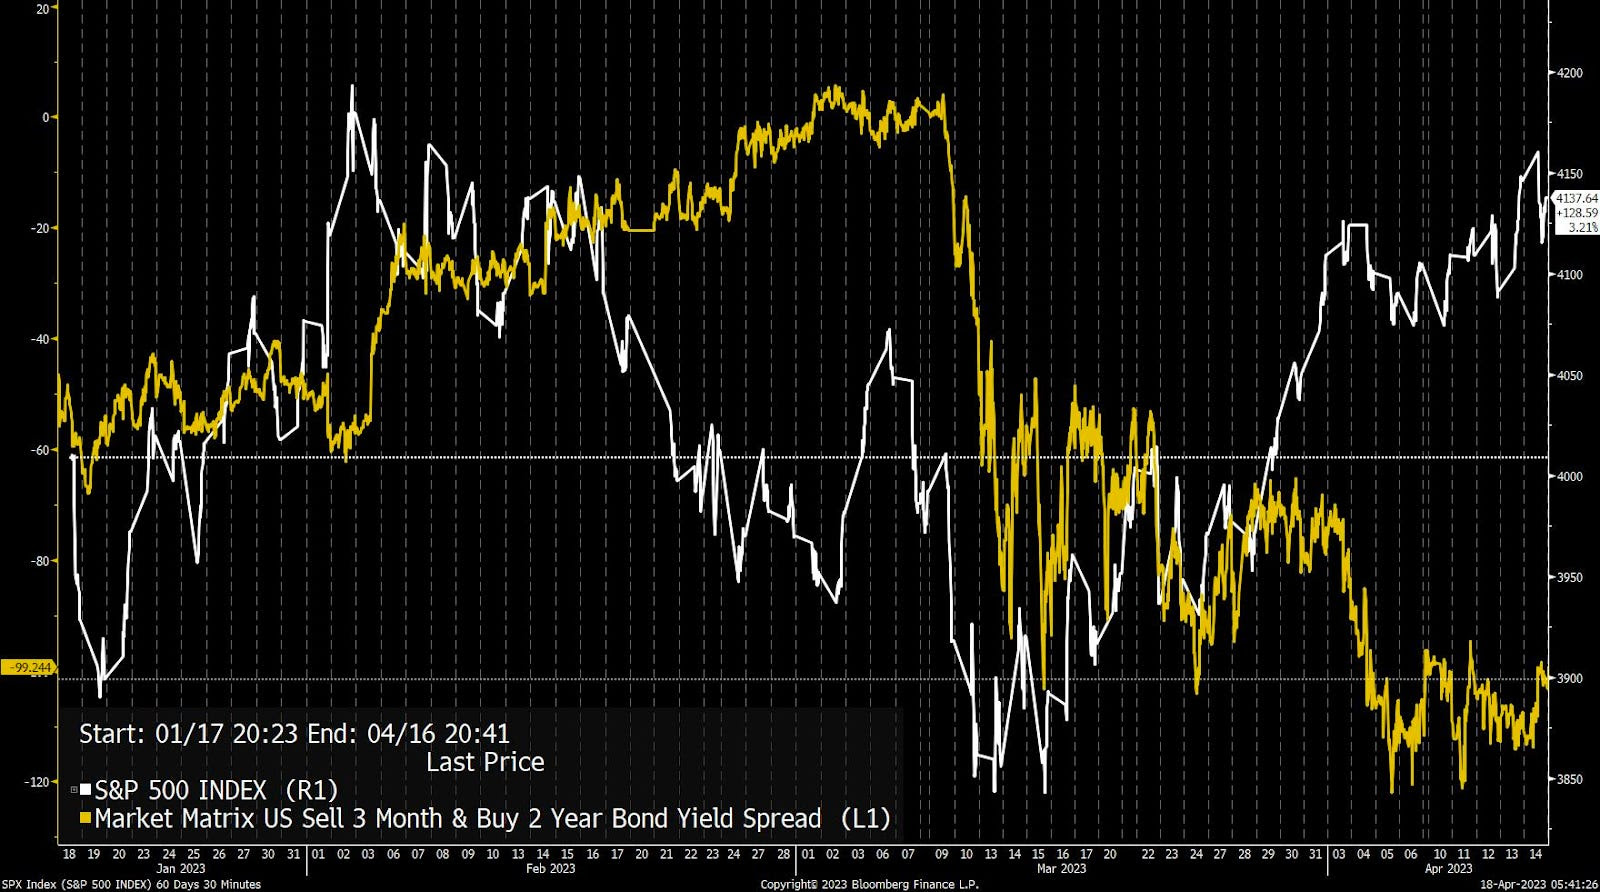
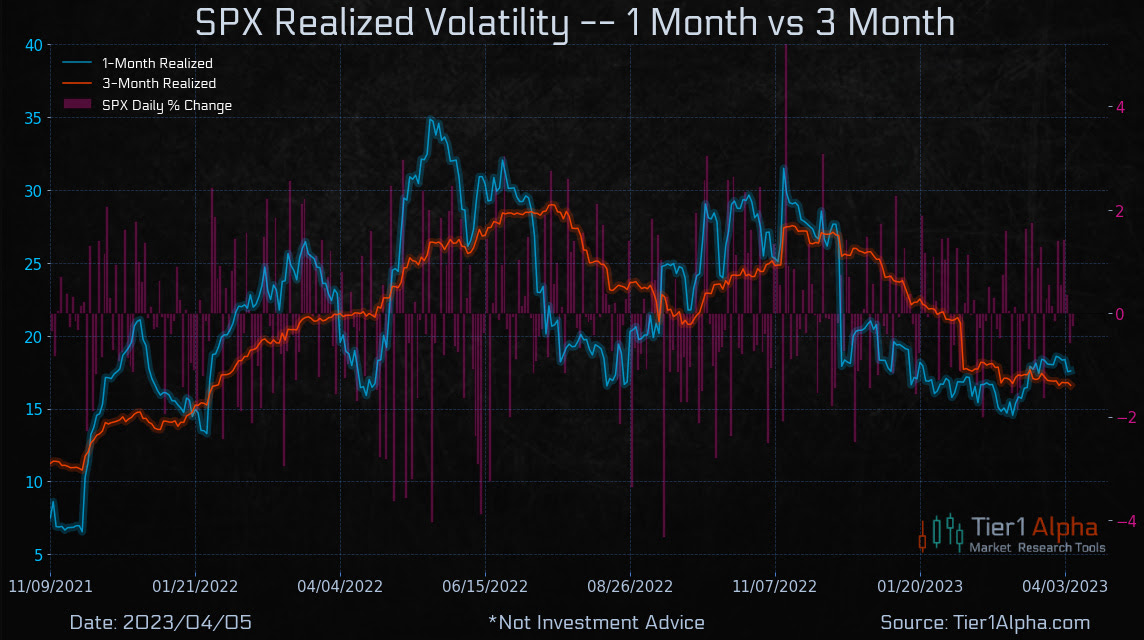
The S&P 500 (INDEX: SPX) and VIX are inversely correlated. When the S&P 500 falls, the VIX tends to rise. Naive of us to say, we know, but bear with us.

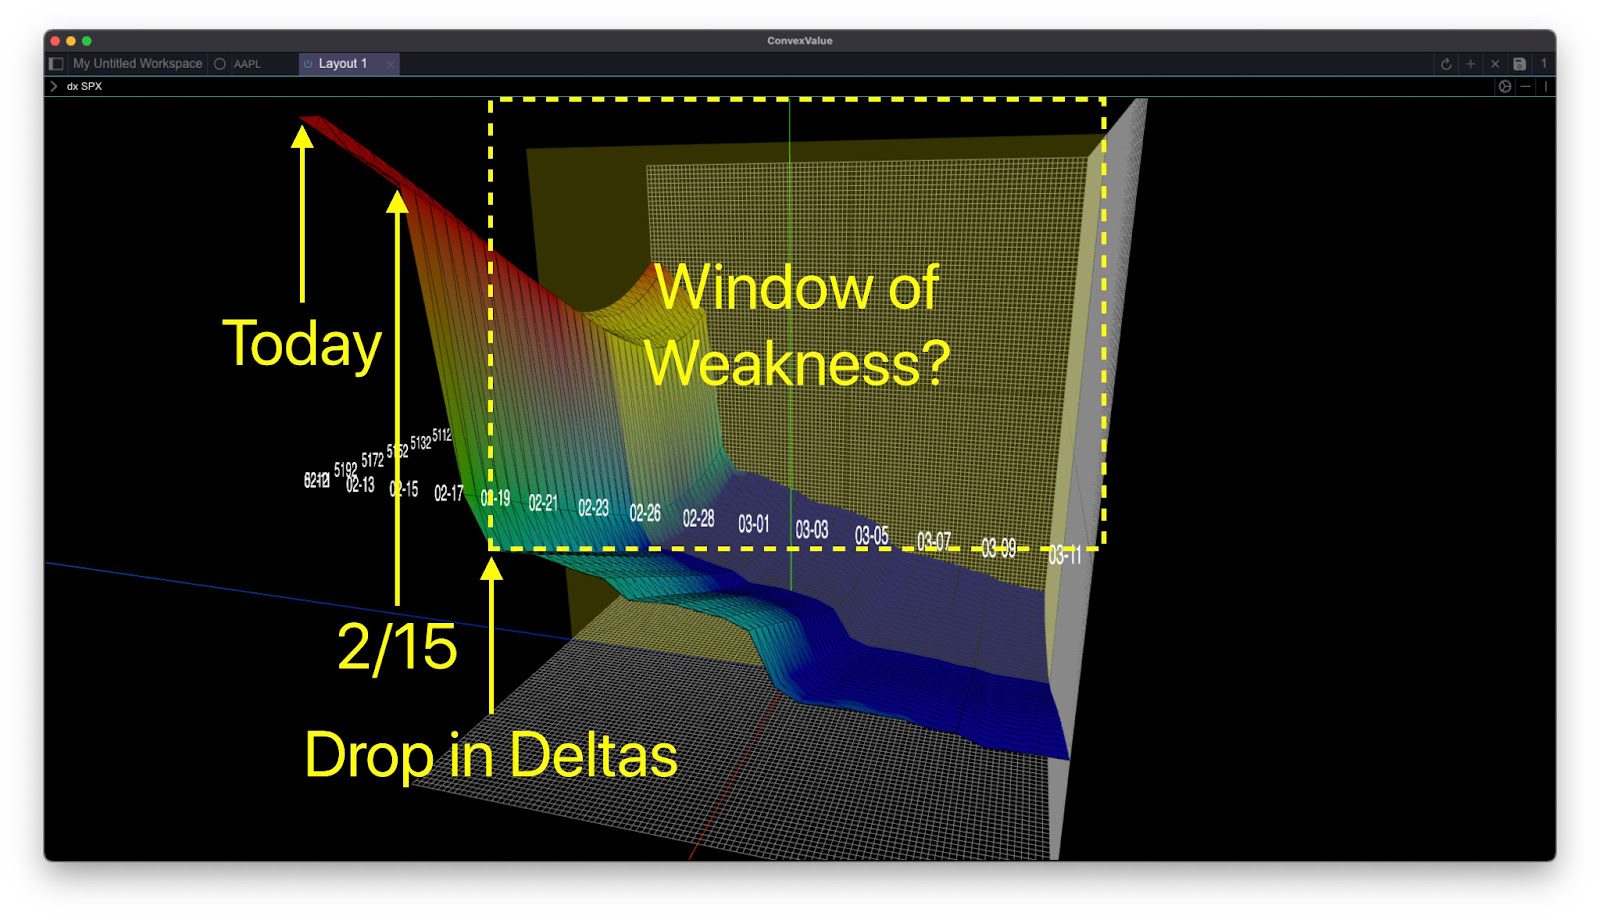
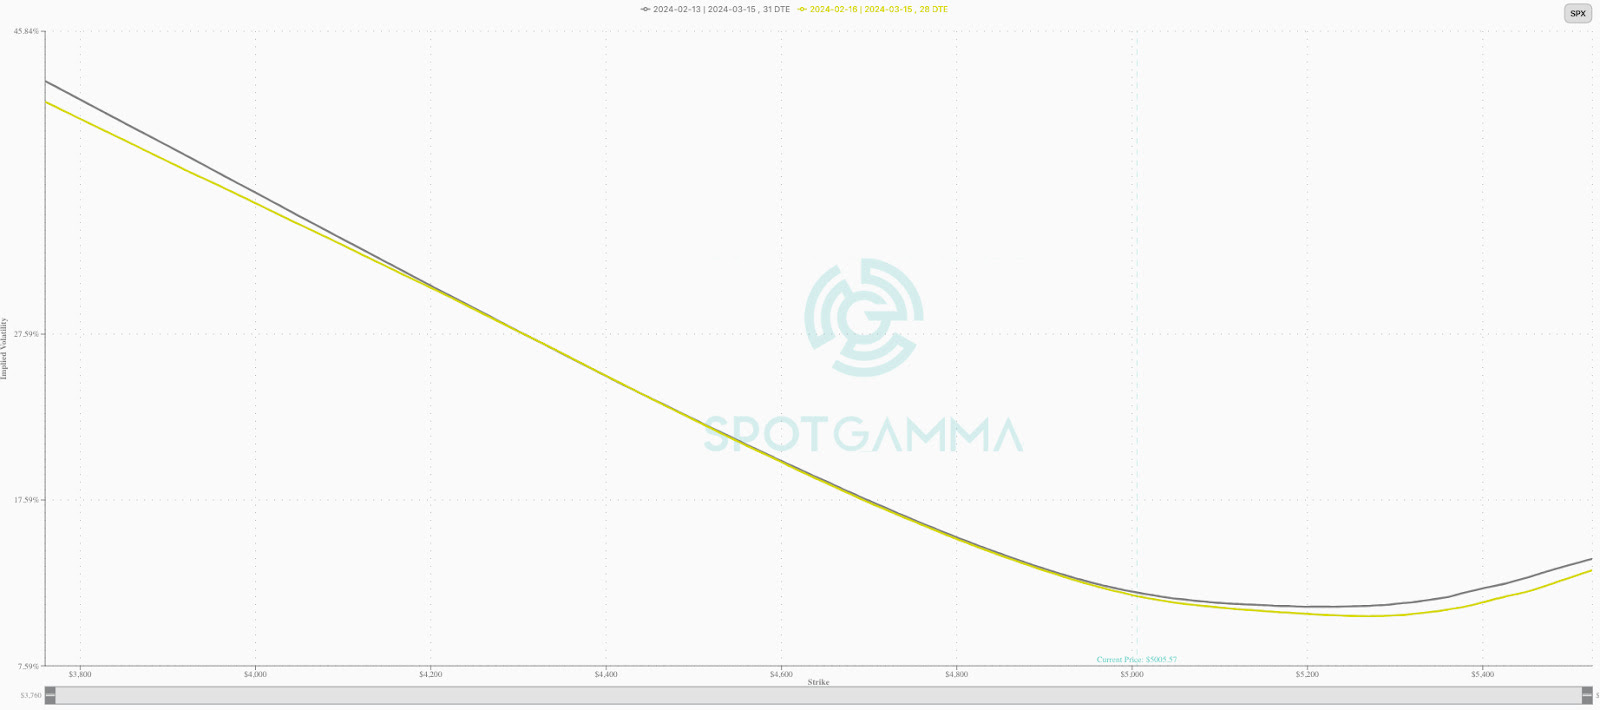
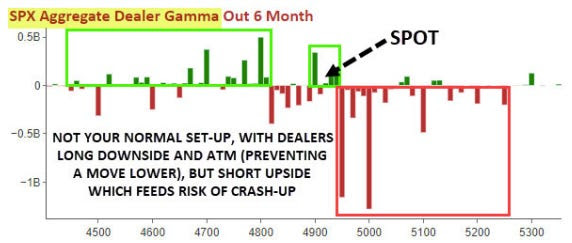
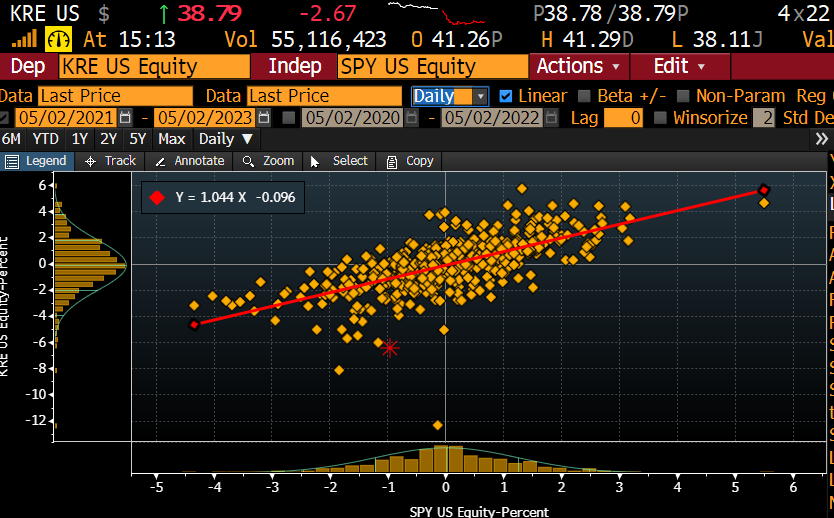
One can buy an SPX put or a VIX call to hedge a portfolio’s volatility. Let’s say one buys an SPX put, and the other side of this trade sells an SPX put. The other side may hedge this short put by selling stock and futures correlated to the S&P 500. Let us say the S&P 500 falls and volatility rises (pictured below). That counterparty may have to sell more stock and futures, pressuring markets. If this now valuable put expires, the counterparty will buy back the stock and futures it sold. This can support markets or do less to exacerbate movement and underlying volatility.

Graphic: Retrieved from SqueezeMetrics.

SpotGamma’s data suggests the markets are not facing an impending crash; instead, per their April 17, 2024 note, “if stocks rally and IV drops, it may add more stock for dealers to buy.” I plug SpotGamma because I worked there. Check them out! 😀

Graphic: Retrieved from SpotGamma.

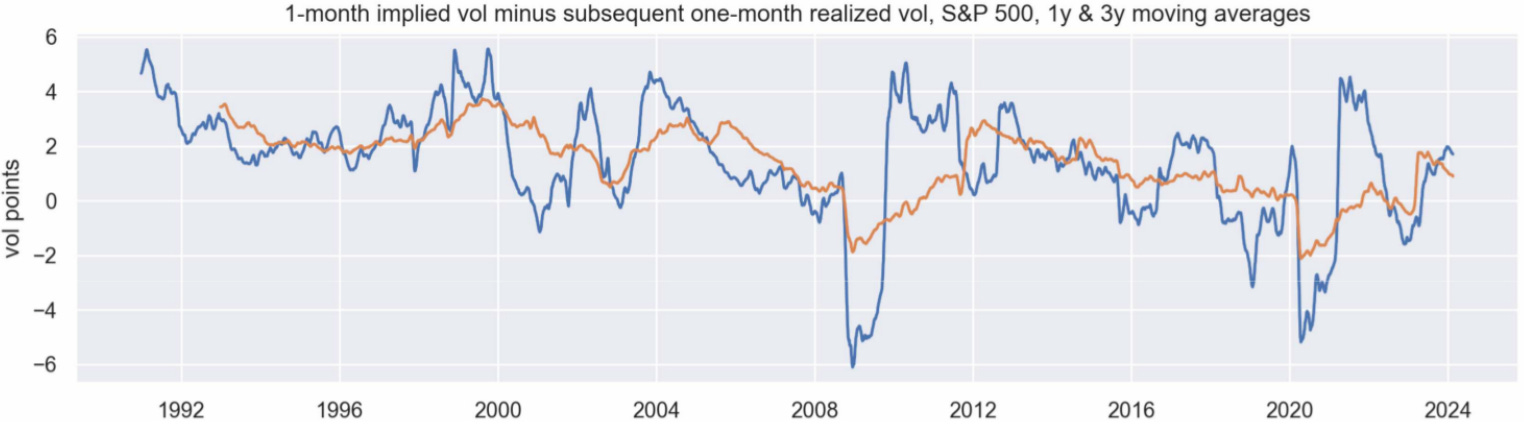
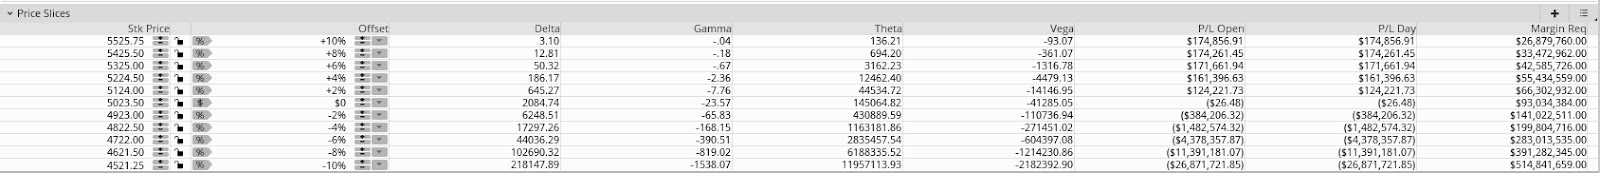
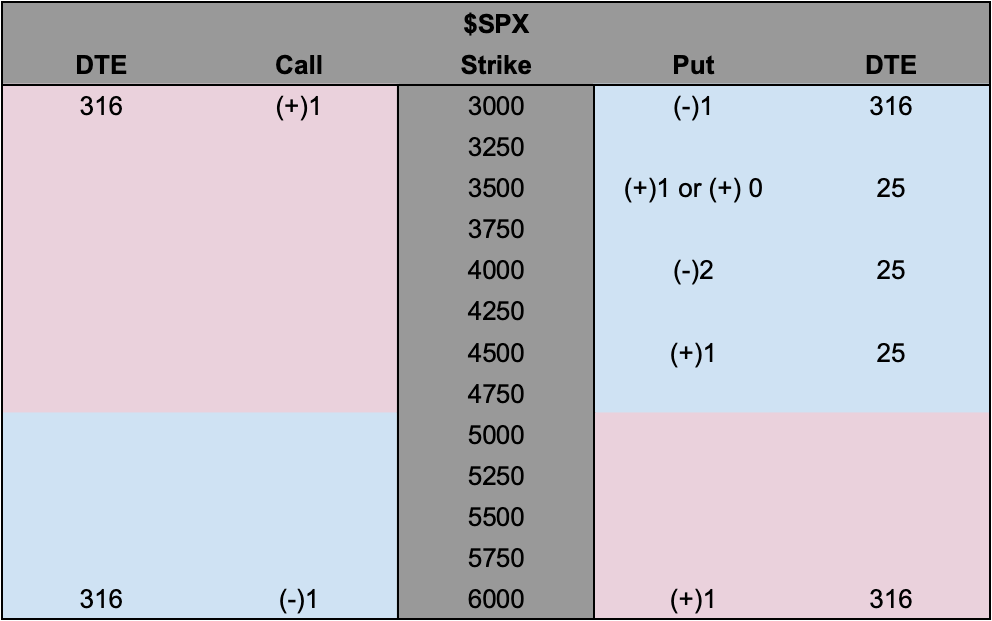
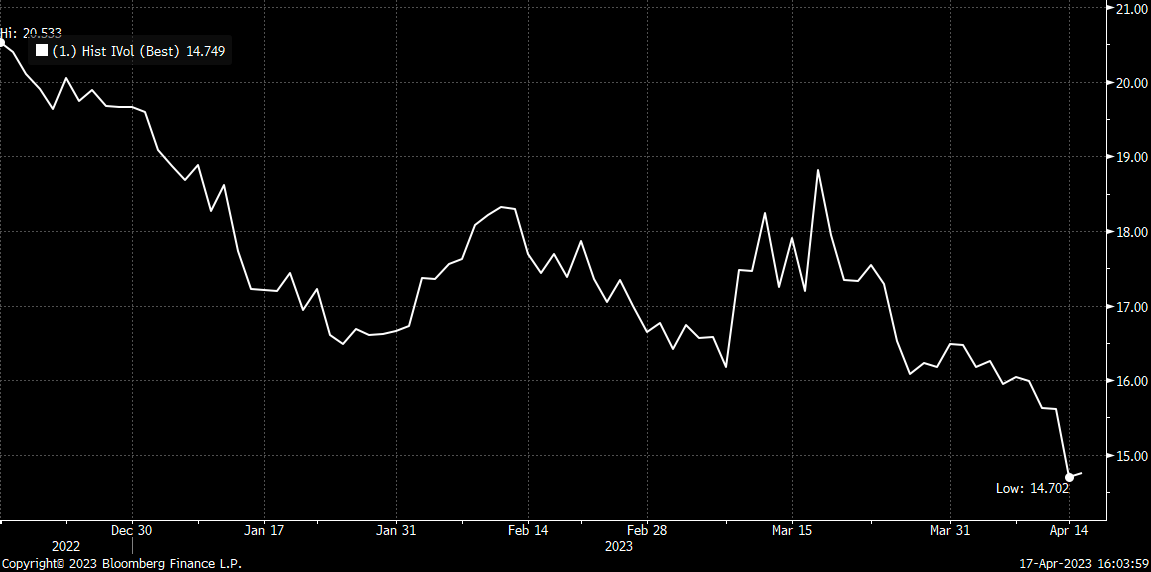
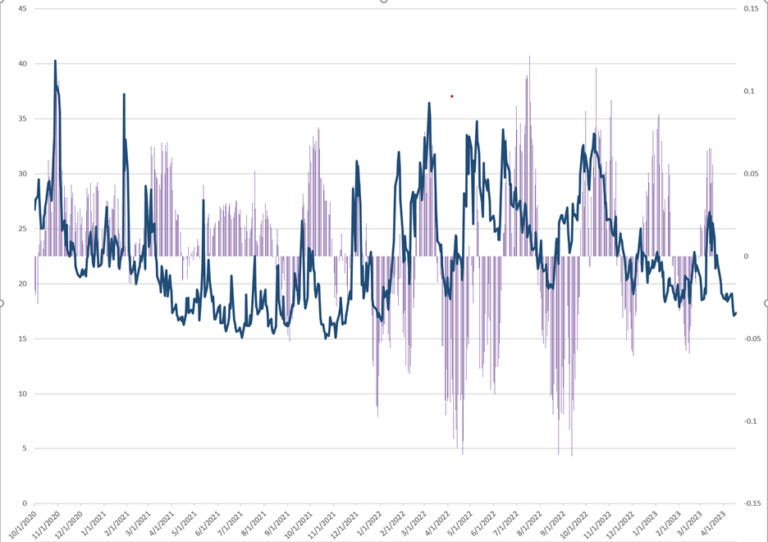
So, calendar and unbalanced butterfly or ratio spread trades (pictured naively below), a play on the recent richness (pictured much further above) of options, may help capture the low case of downside and stem potential portfolio volatility.

Graphic: Retrieved from Physik Invest.

Flipping these trades (i.e., using call options in the SPX instead of put options) allows one to play the market rising. For instance, let us say the upside of gold and silver will continue, but only after stopping and digesting recent movements. You can sell a call expiring soon and buy one later at the same strike price. Your loss is, technically, limited to the amount paid for the trade.

Graphic: Retrieved from Schwab’s thinkorswim platform.

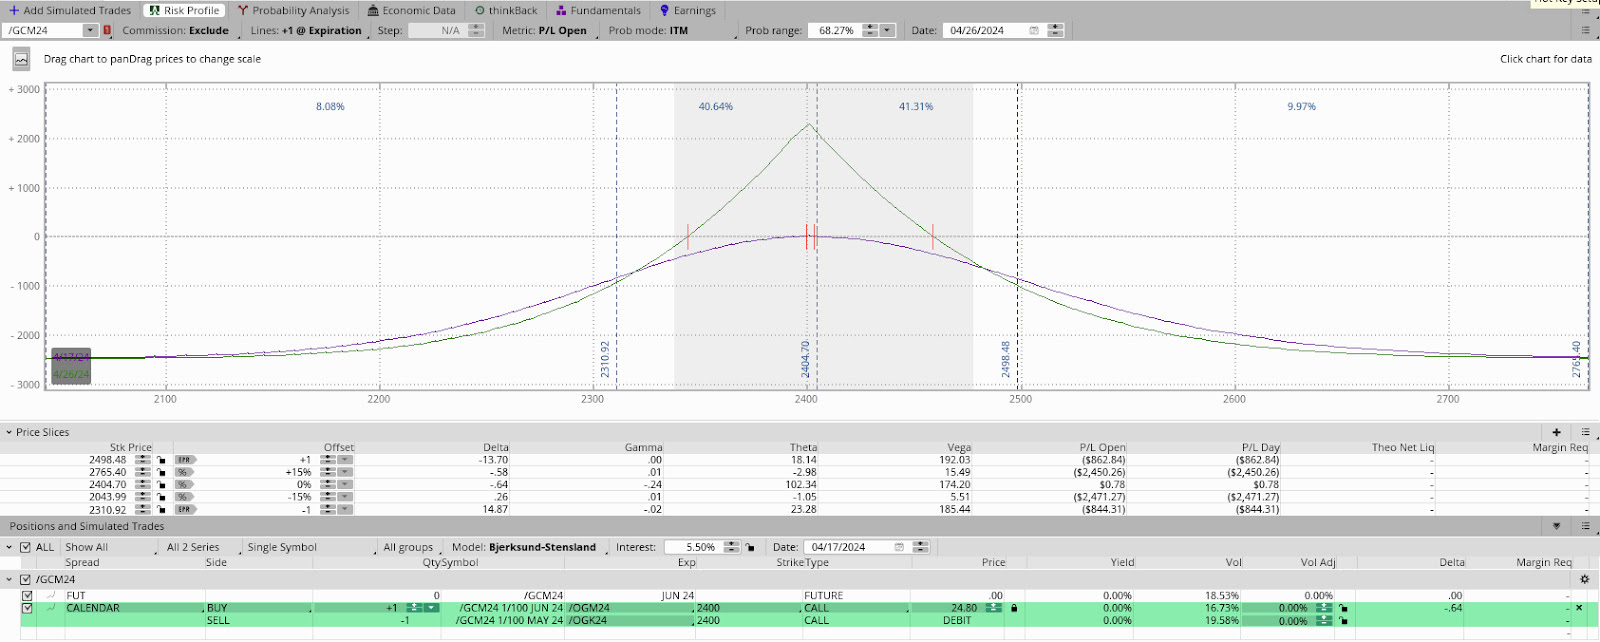
In general, ratio spreads, and butterfly trades are designed to capitalize on movement toward specific price levels, while outright calls and puts are better suited for hedging sharp movements.

The former two strategies serve as practical tools for safeguarding the value of your positions during periods of heightened volatility. In such environments, the options you own are positioned closer to the market, usually retaining their value well, while the options you sell are priced higher than usual and located farther from the market, with more value to decay into expiry. 

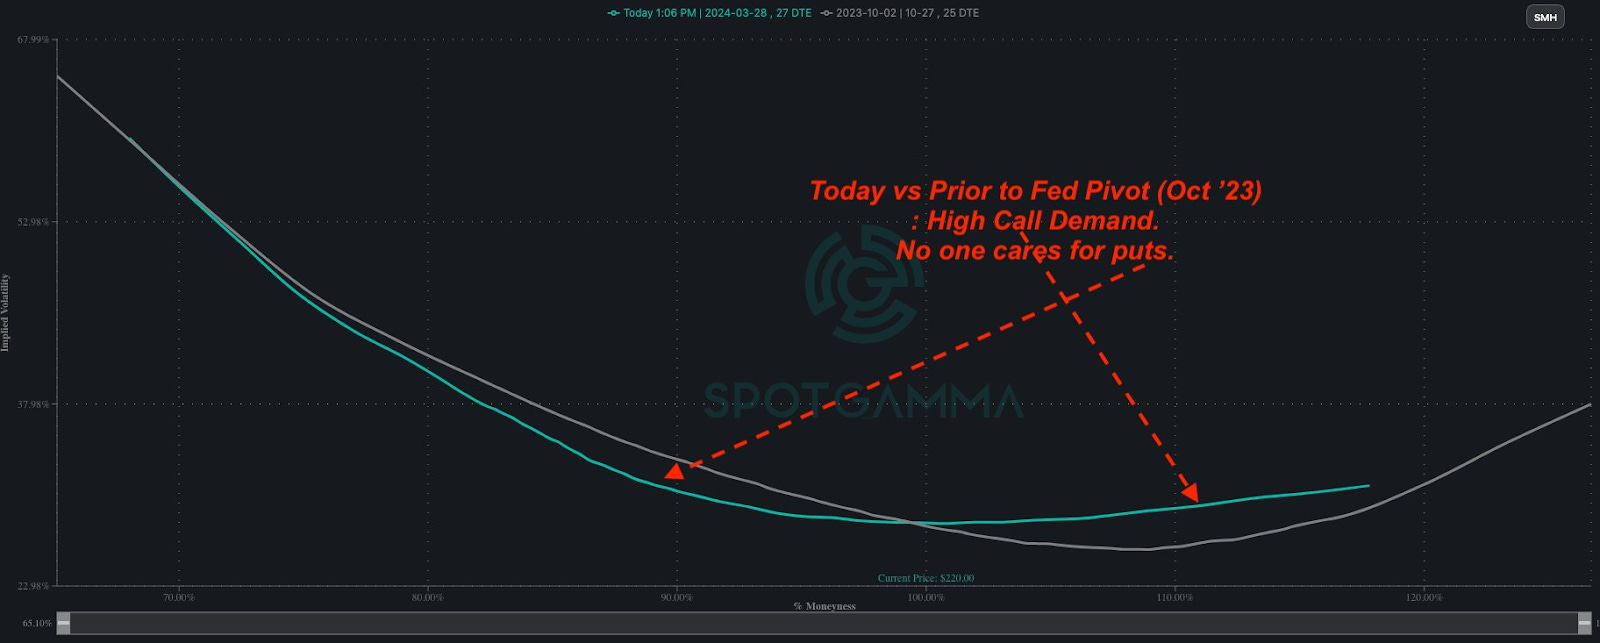
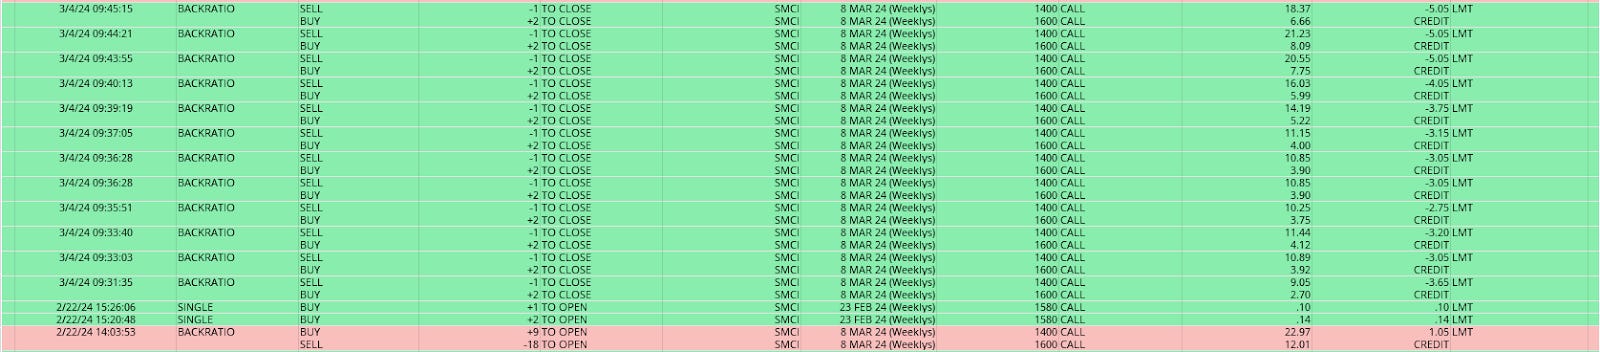
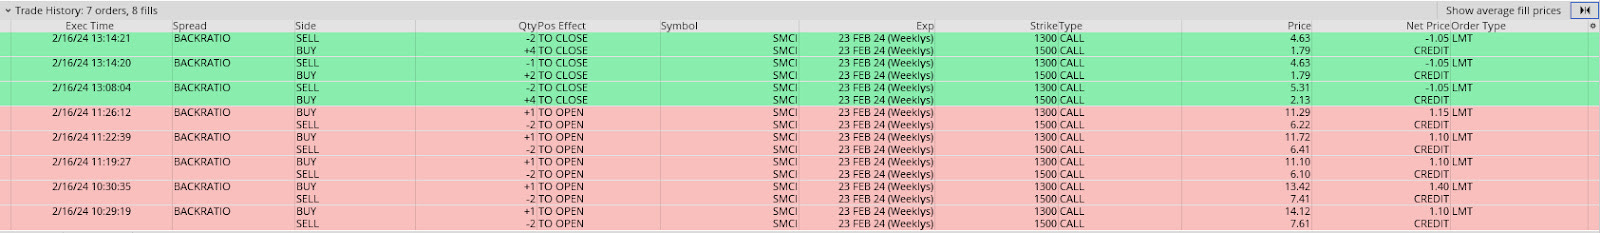
Consequently, while the options you own tend to keep their value, the options you sell struggle to retain theirs. As a result, the spread can appreciate even without significant movement, particularly if implied volatility declines significantly at the furthest strikes. Earlier this year, such was true in Super Micro Computer Inc (NASDAQ: SMCI) and Nvidia Corp (NASDAQ: NVDA).

SMCI was trending up, and traders were feverishly betting/hedging this reality. In a 20-page case study we may release, we detail how Physik Invest navigated this environment successfully. In short, we bought options closer to where the market was trading and sold more of them in places where we thought the market wouldn’t end up going. With implied volatility jacked, for lack of better phrasing, it was often difficult for those far-away and short-dated options to keep their value. Hence, we managed to put trades on for low or no cost and flip them for significant credits!!!

Graphic: Retrieved from SpotGamma. SMCI volatility skew.

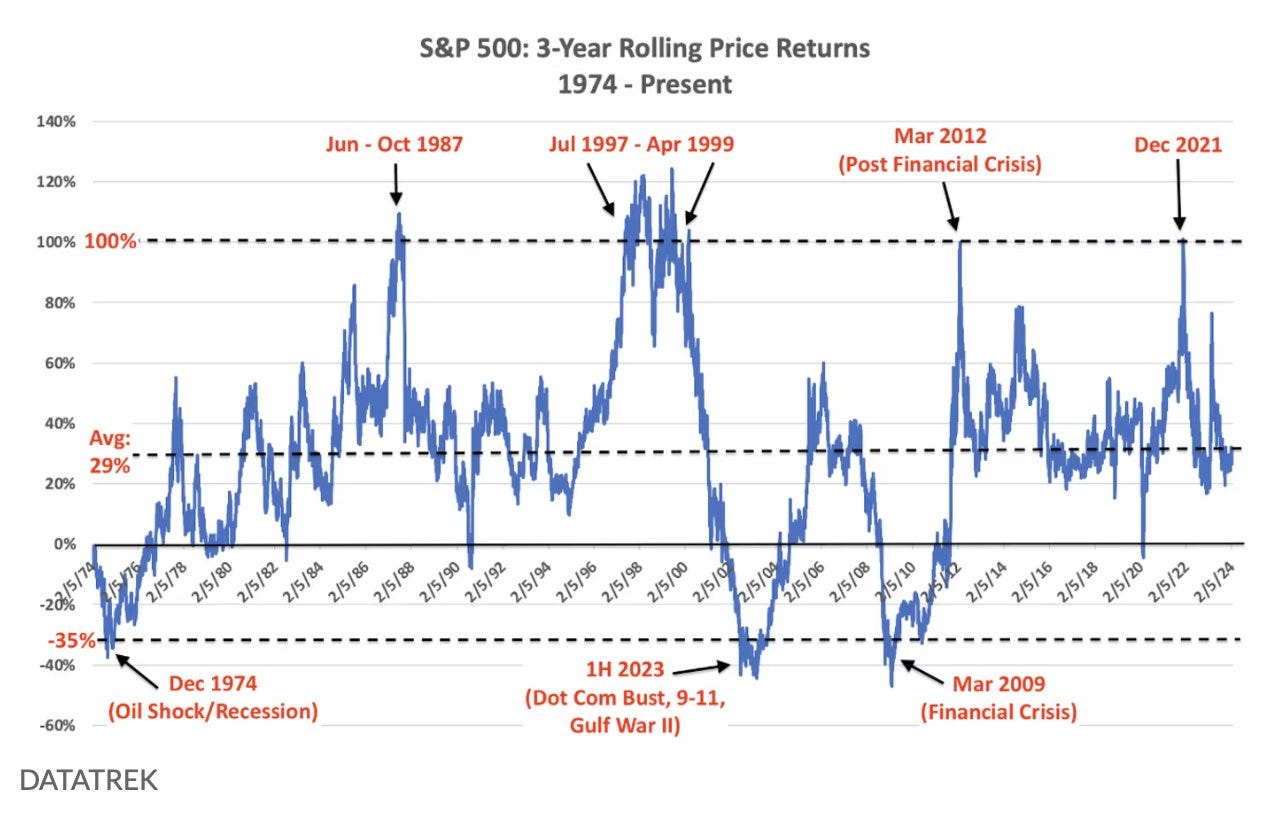
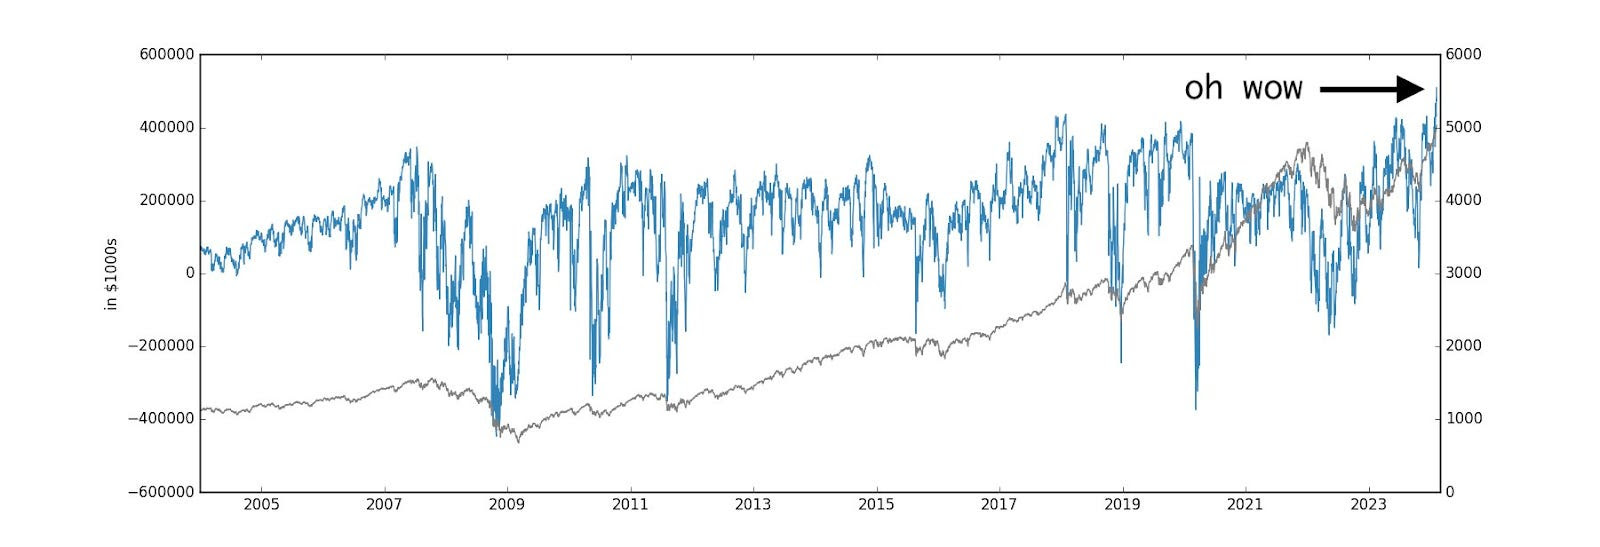
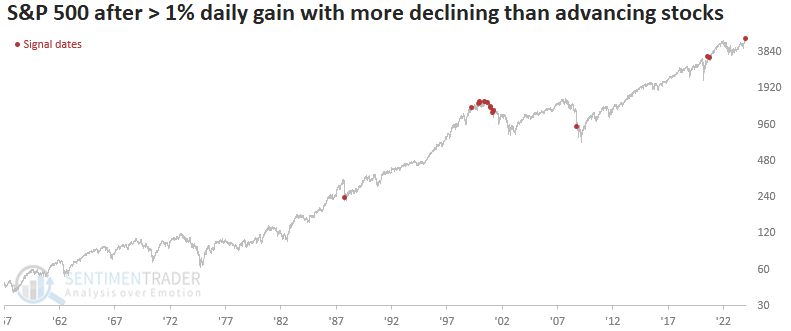
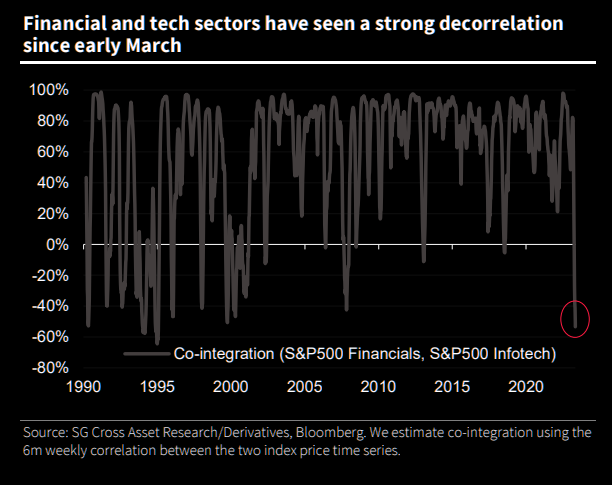
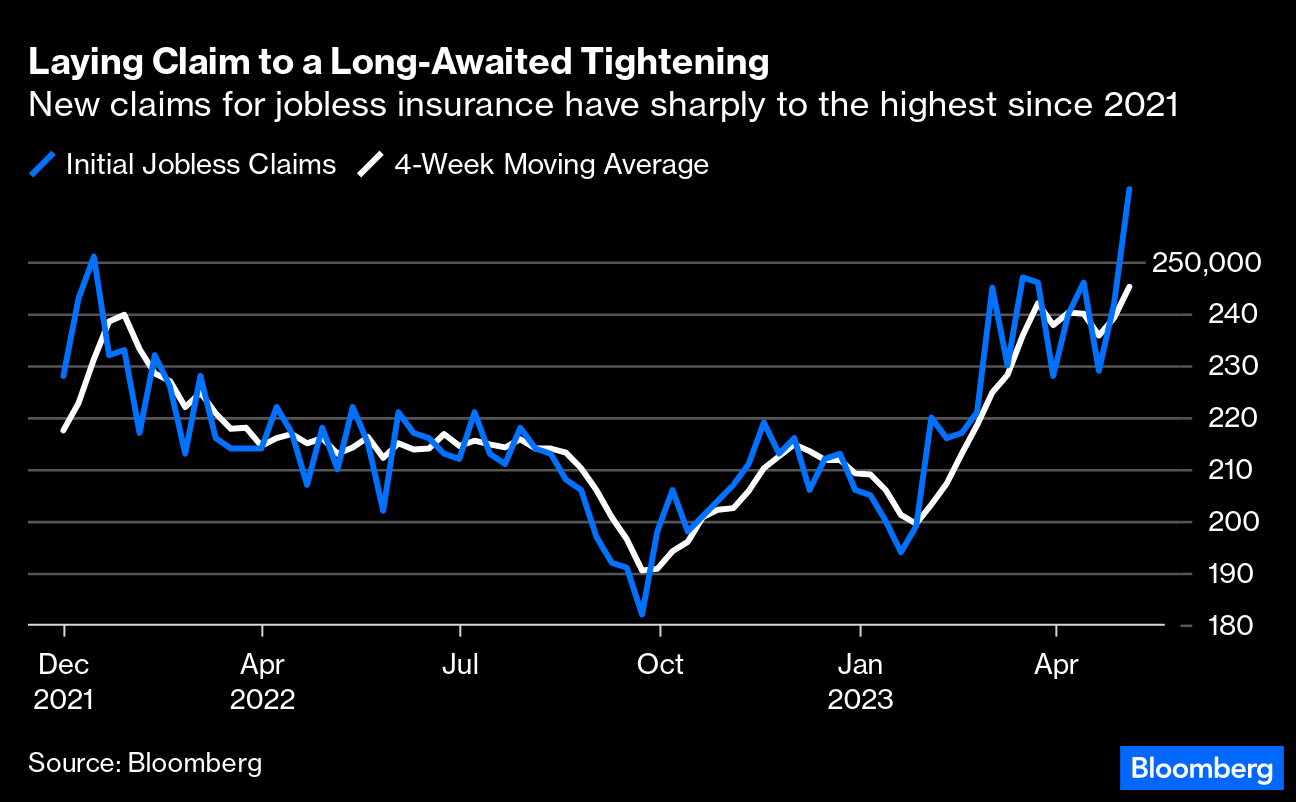
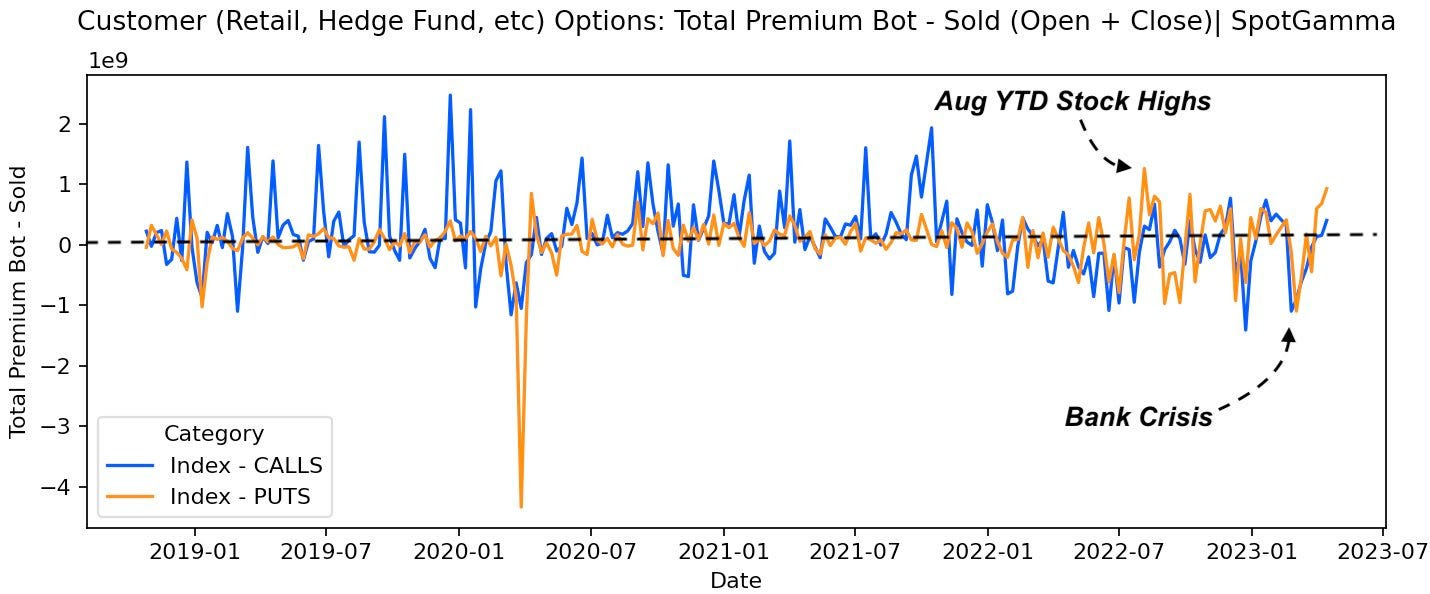
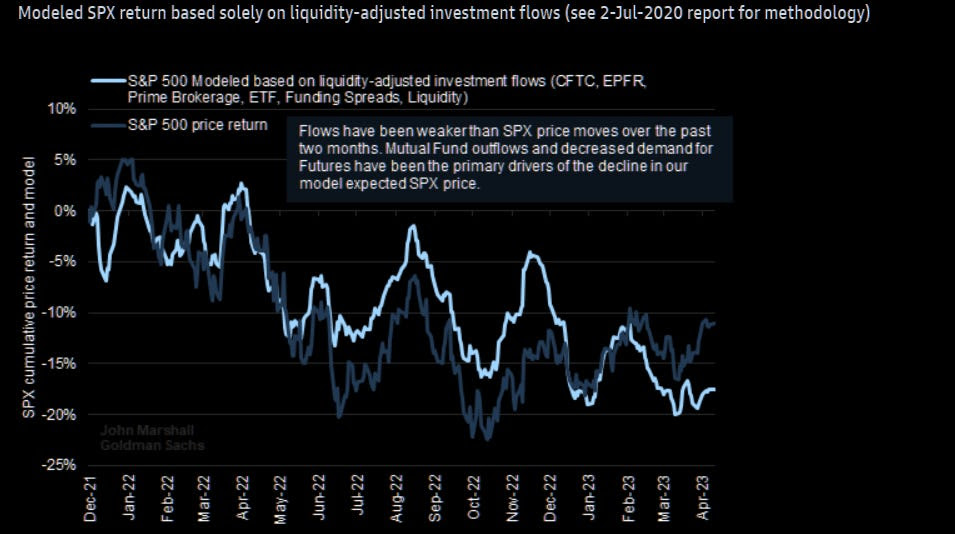
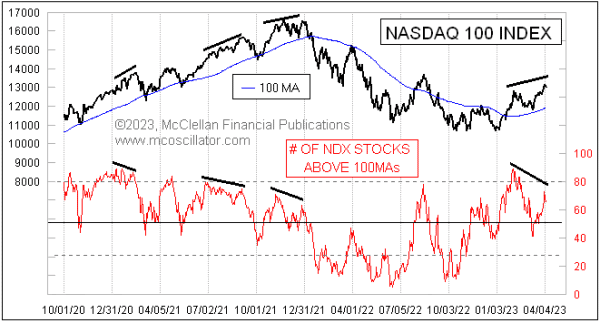
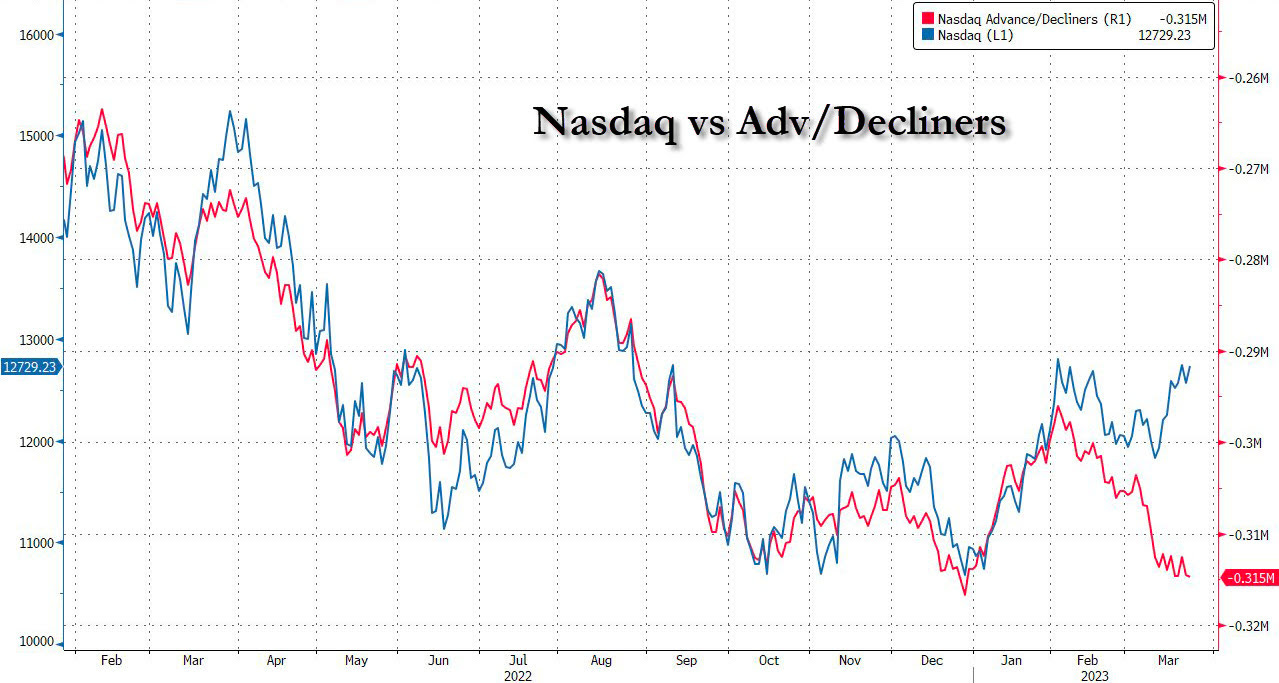
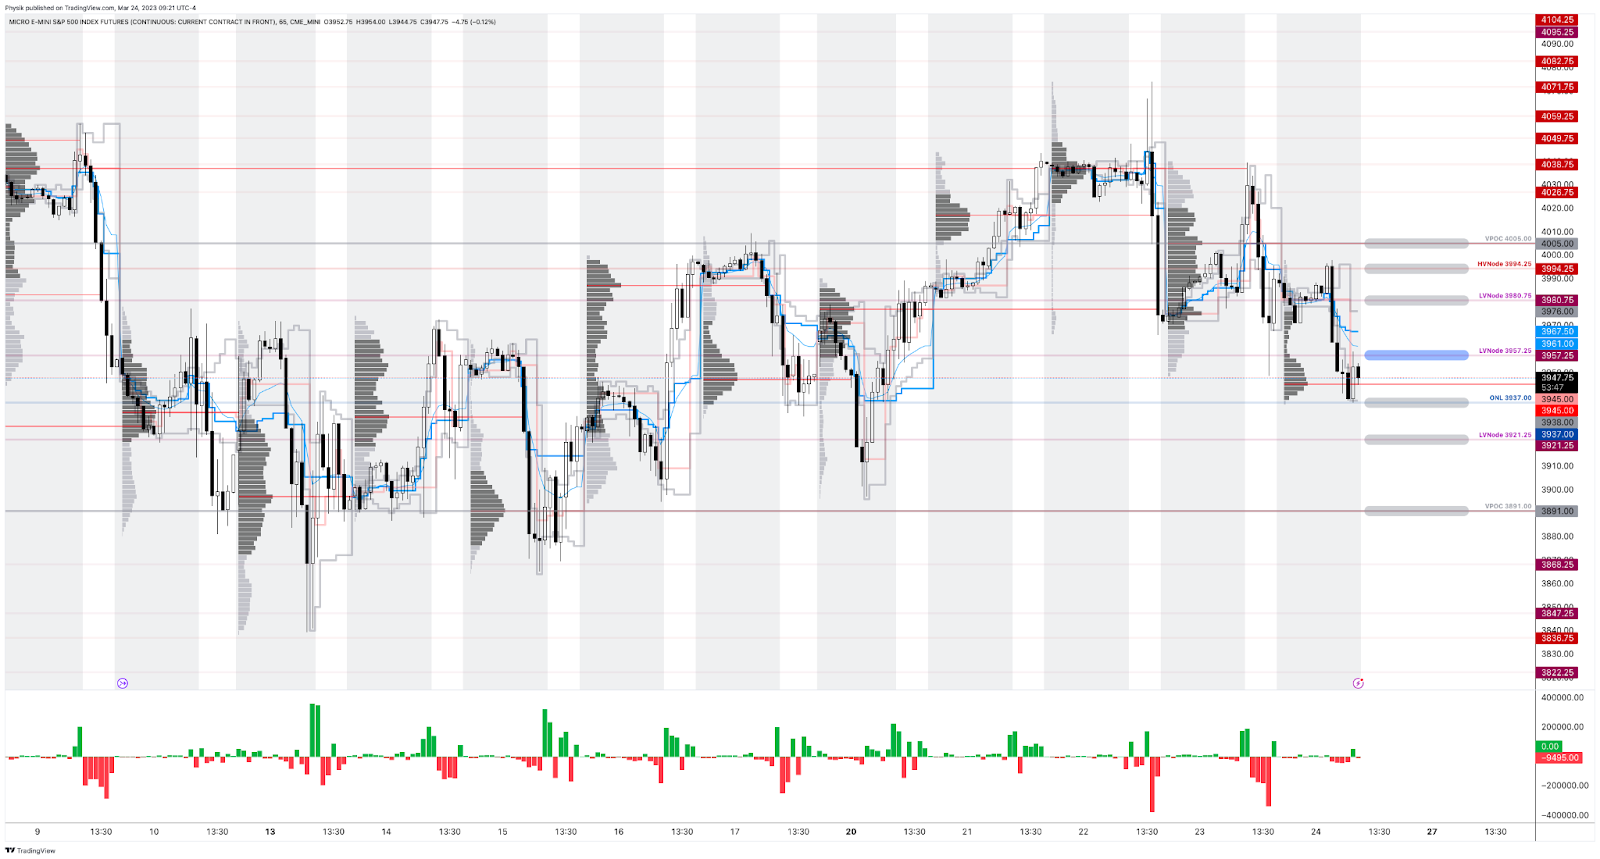
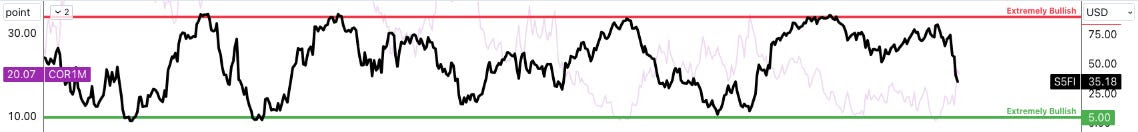
In any case, there’s been a weakening under the surface of the indexes (see below).

Graphic: Retrieved from TradingView via Physik Invest. Black = Breadth Measure.

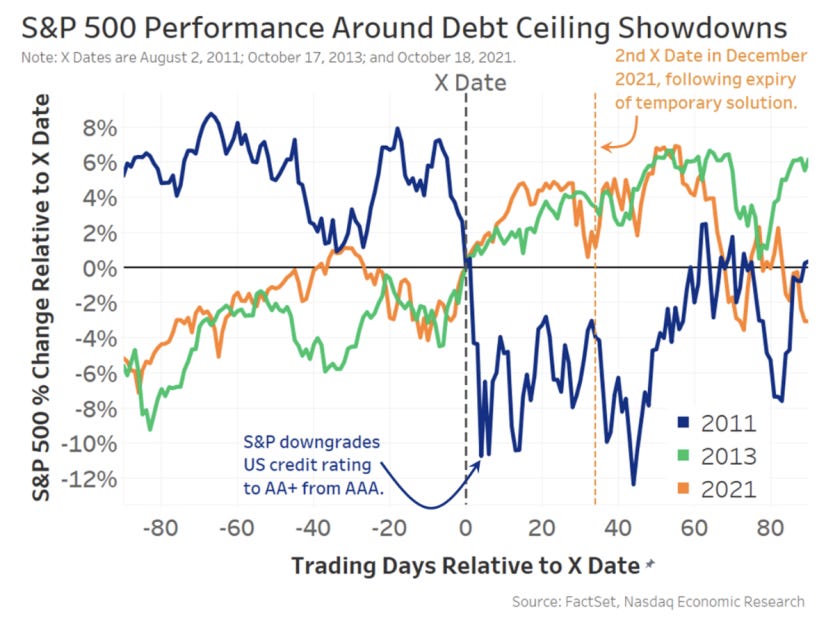
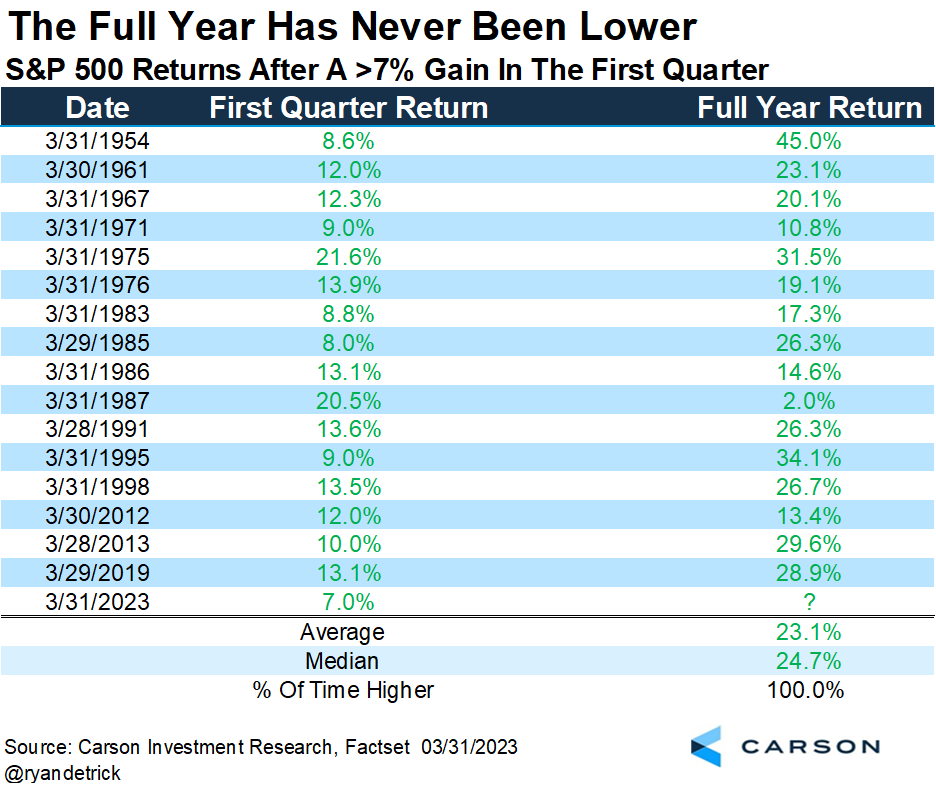
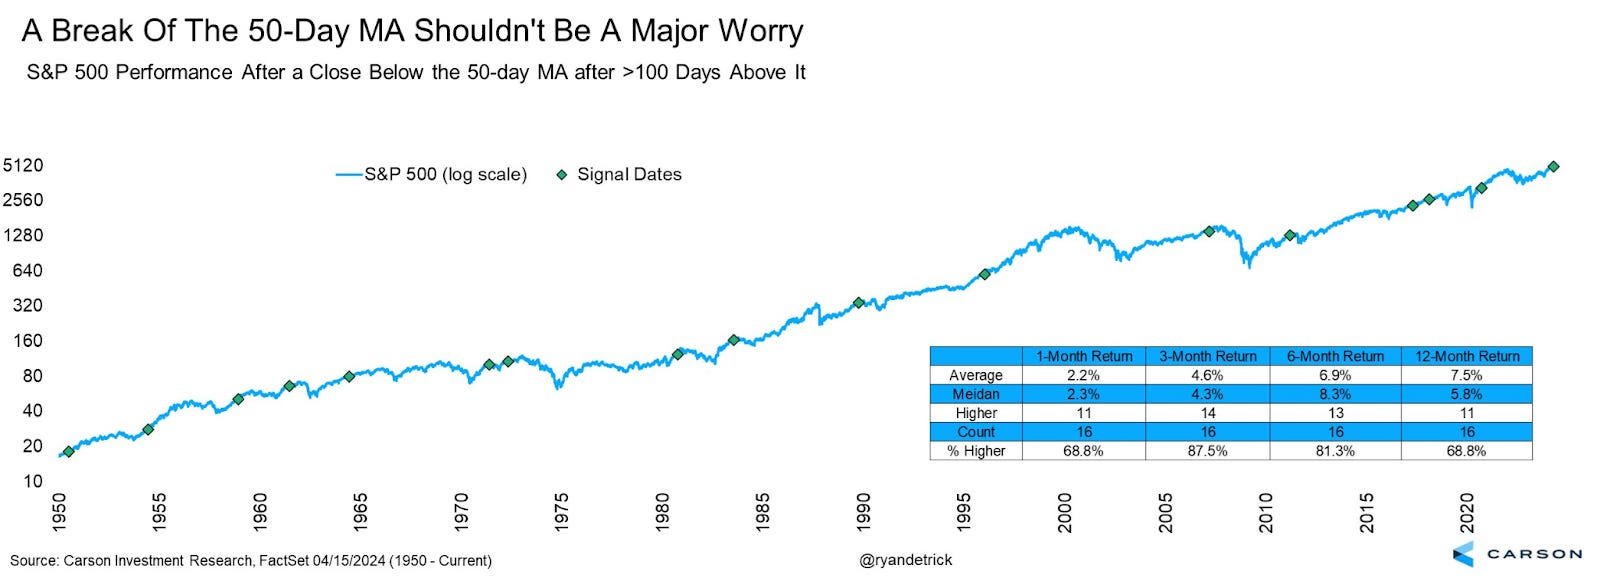
Later, when breadth improves, we can use the portfolio volatility-reducing trades discussed to cut costs or buy more stocks, anticipating upside continuation. According to Carson Group’s Ryan Detrick, the S&P 500 experienced its first close below the 50-day moving average in 110 trading days, marking the longest streak since 2011. Following similar streaks, stocks were higher three months later, 88% of the time, and six months later, 81% of the time. “A warning? Maybe, but maybe not.”

Graphic: Retrieved from Ryan Detrick of Carson Group.

If you enjoyed this week’s letter, comment below and share. Thanks and take care!

Categories
Commentary

Foreshocks

Good Morning! I hope you are having a good start to the week. I would be so honored if you could comment and/or share this post. Cheers!

There is lots of buzz around bubbles and euphoria.

Since late 2022, the Nasdaq 100 has increased by ~75%, and the S&P 500 has increased by ~50%. However, there were some bumps along the way. In mid-to-late 2023, people got worried about the economy, which boosted interest rates. But in November 2023, investors discovered the government would issue less debt, decreasing interest rates. This was good news because future profits are more valuable now when interest rates drop (i.e., lower discount rates elevate the present value of future cash flows), so stocks tend to rise.

The general idea is that stocks will likely keep rising because of the promise of AI and expected profits growing faster than stock prices. Also, people think this will happen as the economy grows and inflation decreases. But it’s not just those factors. How people invest right now is also a big reason why stocks may increase.

Much Further To Run?

The primary catalyst lies in the imbalance of investor positioning stemming from the aftermath of ZIRP (Zero Interest Rate Policy), Fallacy Alarm elaborates. The conclusion of ZIRP reintroduced fixed-income securities as viable investments, prompting investors to boost their fixed-income allocations significantly in recent times.

Further asset rotation could manifest through a stagnant or declining stock market coupled with rising yields or through a robust stock market alongside stagnant or falling yields.

Accordingly, investors are now pursuing stocks at seemingly elevated valuations.

Graphic: Retrieved from Bank of America via Bloomberg.

Fallacy Alarm adds color, making an interesting point on elevated valuations.

Bubbles (the hot topic) are not solely about prices; the collective portfolio allocation characterizes them. We dive further, finding there is room to expand. Per Bloomberg’s John Authers, the market is not as absurd, with the Magnificent Seven aligning more closely with the broader market than before.

Graphic: Retrieved from Ray Dalio.

Additionally, Authers says that the S&P 500 remains relatively inexpensive, with room to go based on global liquidity, subdued margin debt levels, and not overly elevated single-stock call option volumes.

Graphic: Retrieved from Ray Dalio.

“The S&P 500 looks extended in absolute terms when measured by US domestic liquidity flows, but it looks far more comfortably placed when Global Liquidity is the benchmark,” CrossBorder Capital’s Mike Howell states. “US equities have got much further to run if we can reassure ourselves that Wall Street has become the ‘World market’ for stocks. Indeed, this might be plausible given the dominance of US firms in tech and AI applications?”

Graphic: Retrieved from CrossBorder Capital via Bloomberg.

Embedded Risks To Rally

Some others are more cautious regarding the options volumes.

Nomura’s Charlie McElligott suggests the fear of a “crash up” causes a steeper call skew (i.e., the asymmetry in implied volatility levels across different strike prices). We see this with the positive relationship between spot prices and implied volatility. Additionally, volatility selling and structured product issuance may present risky dislocations.

Graphic: Retrieved from SpotGamma.

Some experts, like QVR Advisors, agree, note that selling volatility doesn’t offer the same returns with less risk as it used to. Instead, it’s now seen as taking on more risk for lower returns.

Graphic: Retrieved from QVR Advisors.

Options Volatility And Pricing

SpotGamma acknowledges these trends and dislocations can persist for some time.

So, what do we do about that?

In last week’s detailed “BOXXing For Beginners” letter, we discussed getting selective and trading soaring stocks using creative options structures. Remaining faithful to our approach, we traded Super Micro Computer Inc (NASDAQ: SMCI) throughout the past week, utilizing a steep call skew to play upside potential at lower costs.

The outcomes for one of our accounts are detailed below.

Most positions were opened with modest credits and gradually closed with larger ones following news of its upcoming inclusion in the S&P 500. A significant portion of the profits were captured when the value of the 8 MAR 24 series reached its peak on Monday morning. During such moments, especially when nearing expiry, it’s crucial to pay attention to the market, closely monitoring the responsiveness of the spreads to underlying price action. When this responsiveness slipped in the morning, we closed all the positions, timing the peak on the structures at ~$5.00.

Graphic: Retrieved from TD Ameritrade’s thinkorswim platform.

Managing ‘Greeks’ Versus ‘PnL’

When it is that late, as it was in the above trade, you are more focused on managing the PnL (i.e., profit and loss) and not Greek risk (i.e., the set of risk measures used to assess the sensitivity of option prices to changes in various factors, such as underlying asset price or delta, time decay or theta, volatility or vega, and interest rates or rho).

Accordingly, despite SMCI moving higher, the same spreads traded at a ~90% discount per late-Monday pricing. On Tuesday, that discount lessened to ~60%. Regardless, the right decision was to roll into similar, albeit wider, structures in anticipation of that same index effect that drove shares of Tesla Inc (NASDAQ: TSLA) higher in 2020 with its inclusion in the S&P 500.

Graphic: Retrieved from Physik Invest.

When trading these high-flying stocks, the level of risk often hinges on your exposure to vega. This risk can be mitigated by widening the gap between the closer long (+1) and farther away short (-2) options strikes. 

Here’s the rationale.

As the underlying asset moves along its skew curve, the impact of volatility on delta shifts, driven by increased implied volatility from options demand. Events, such as the market decline in 2020 and the meme stock frenzy in 2021, have illustrated how the implied volatility of out-of-the-money options can spike significantly more than the underlying asset’s movement.

Option exposures can exacerbate volatile situations through covering and hedging activities—a squeeze can occur caused by substantial movements and dramatic increases in options prices.

As mentioned last week, a straightforward method to assess the safety of such trades is by examining the pricing of fully in-the-money spreads. If these spreads trade at large credits to close, they are worth considering. Conversely, if the spreads require a debit to close, it’s advisable to steer clear. For those focused on the Greeks, aim for flat or positive exposure to vega.

Conclusions

In any case, the moral is as follows: many seem to be turning optimistic and raising their expectations while some pockets of irrationality, albeit not extreme, are popping up.

Sure, stocks may be cheap and not in a bubble to some, with added support coming from investors (re)positioning, earnings growth, and falling inflation, but there are slight shifts that may draw concern.

Such slight shifts can include the flattening of call skew, foreshadowing a waning appetite for risk, and potentially heralding market softness. Additionally, SpotGamma’s Brent Kochuba has shared data that points to lower correlations aligning with interim stock market highs, presenting more cause for caution.

While the allure of record highs may be enticing, we look to lock in some inflation protection as shared last week, participate in the upside creatively, be that in metals or high-flying stocks, and hedge using similarly creative structures on the downside, albeit much wider and with protection (e.g., Long Put Butterfly), and favorable Greeks (-delta, +gamma, +vega). There are many more details to add, but we will finish here to publish the newsletter as soon as possible. Cheers!

Graphic: Retrieved from DATATREK via Barchart. The current market conditions, again, don’t indicate a bubble.
Categories
Commentary

Reversion To The Meme

Good Morning! I hope you had a great weekend and enjoy today’s letter. I would be so honored if you could comment and/or share this post. Cheers!

After a period of taking the stairs up, markets took the elevator down last week. Through Tuesday, the S&P 500 fell over 2.5% on a Consumer Price Index (CPI) print, which signaled higher-than-expected inflation. Internally, the selling was heavy.

Graphic: Retrieved from TradingView. Market Internals as taught by Shadowtrader’s Peter Reznicek.

Additionally, options were repriced in a big way.

Graphic: Retrieved from Bloomberg via Options Insight.

Let’s digress. 

Recall that options implied volatility is a measure of the market’s expectation of the future volatility of an underlying asset, as reflected by the supply and demand of options themselves. Higher implied volatility indicates more significant expected price fluctuations.

Options implied volatility skew refers to the unevenness in implied volatility levels across different strike prices. Steep, smile-looking, or v-shaped volatility skew reflects a scenario where increased market volatility disproportionately impacts farther away strike options due to (expected) losses from more frequent delta rebalancing in a moving market. Options traders assign higher implied volatility to those farther away strike options to compensate for increased risk/cost, often enabling savvy traders to exploit these variations to reduce their hedging costs.

Moreover, before last week’s drop, the S&P 500’s implied volatility skew was subdued, as indicated by the grey-shaded area below. Tuesday’s decline coincided with increased options trading activity and demand, leading to a notable upward shift in skew. Distant S&P 500 put options experienced significant increases in implied volatility (see the below grey line moving away from the shaded area).

Graphic: Retrieved from SpotGamma. Volatility skew for S&P 500 options expiring March 15, 2024.

Though skew remains elevated, broader implied volatility measures, such as the Cboe Volatility Index or VIX, declined as rapidly as markets rallied in the days following Tuesday’s downturn.

What’s happening?

Despite further negative economic indicators, such as hot producer prices or weaker retail sales and manufacturing output, markets surged strongly, closing the week almost unchanged. Beyond significant investor inflows into stocks, totaling approximately $16 billion on Wednesday, according to Bank of America Corporation, analysis of S&P options positioning revealed mechanical demand for the S&P 500, as highlighted by SqueezeMetrics. Higher implied volatility strengthened an automatic buying mechanism, supporting markets.

Graphic: Retrieved from SqueezeMetrics. Dealer S&P 500 Vanna Exposure or VEX.

This phenomenon is partially attributed to the significant options selling discussed in our recent newsletters, acknowledging the warnings issued by Cem Karsan of Kai Volatility and Kris Sidial of The Ambrus Group. Essentially, there’s been a rush among options sellers to enter into sizable positions, exemplified by the substantial options selling activity observed last week. UBS Group highlighted the persistence of this concerning toxic flow, noting aggressive trader actions, such as the sale of “70K of Thursday expiry 4120 puts at 0.05 on Wednesday.”

Graphic: Retrieved from Goldman Sachs Group Inc.

The estimated risk profile of this position is provided below (please allow for a margin of error of a day or two due to expiry). Essentially, it’s unfavorable, with the option seller at risk of losing much money if the market drops or implied volatility increases. Please be aware that we’re assessing this position independently, without knowledge of the option seller’s overall portfolio, including potential risk offsets from other positions they may hold.

Graphic: Retrieved from TD Ameritrade’s thinkorswim platform using the Analyze function.

Customers favoring such positive delta “short skew” positions prompt dealers on the other side to assume a negative delta (i.e., make money if the market is lower or implied volatility is higher) “long skew” or “long options” position, which they may manage through the sale of put options or the purchase of call options, underlying stock shares, or futures for hedging purposes. For a deeper understanding of these mechanisms, refer to SqueezeMetrics’ paper, “The Implied Order Book.”

Graphic: Retrieved from SqueezeMetrics.

This all happened during a seasonally weak period. We’ll go past the positioning side of things in a moment, so bear with me, but you can see the drop-off in options deltas following mid-February below.

Graphic: Retrieved from ConvexValue.

In essence, despite the anticipated reduction in options-based support, which Cem Karsan describes as a “window of non-strength” or a scenario conducive to increased volatility, the market’s reaction to Tuesday’s drop stemmed volatility. Observing these dynamics in real-time, here’s how we responded.

Graphic: Retrieved from Goldman Sachs Group Inc.

We had proactively positioned ourselves for a potentially weaker February, capitalizing on overlooked hedge opportunities outlined in recent newsletters—specifically, put spreads like butterflies. Others did similar, with Nomura Americas Cross-Asset Macro Strategist Charlie McElligott noting increased buying of put butterfly spreads in recent weeks (please see our late January and early February letters).

Depending on their setup (including the distance between strikes, the distance from the spot price, and the expiration timeframe), these spreads were positioned to profit from market declines. When the drop occurred, the unbalanced, very far out-of-the-money structures were priced to be closed at a small debit loss when the skew elevated substantially. Utilizing real-time analysis, we concluded it was opportune to increase our exposure to these far out-of-the-money units, capitalizing on the surge in implied volatility while cashing in on the closer spreads priced for a credit profit.

Graphic: Retrieved from Goldman Sachs Group Inc.

As markets recovered, we closed the recently initiated riskier spreads, freeing up buying power for opportunities elsewhere, such as in NVIDIA Corporation (NASDAQ: NVDA) and Super Micro Computer Inc (NASDAQ: SMCI), where a significant volatility skew, driven by heightened call options trading, enabled us to generate credit from short-dated spread trades.

By Friday’s end, we achieved one of our most successful weeks of the year, boosting our confidence and reinforcing our patience with underperforming trades, like the put butterfly hedges. PAY-tience!

Graphic: Retrieved from TD Ameritrade’s thinkorswim platform.

What motivated our actions? Let’s elaborate.

Tactically, we favor owning options to express our opinions efficiently selling options further out to reduce costs. Occasionally, we will utilize a ratio, such as selling two options for every one purchased. For those less experienced, simplicity often proves effective. Consider straightforward approaches like purchasing a wide put vertical, entailing buying a put, and selling a put at some greater distance. Depending on your position, the returns may come in at multiples of each unit of risk undertaken.

Furthermore, the speculative trading and crowded positions in equities (as previously discussed in this and prior newsletters), along with the persistent volatility skew (as indicated by the yellow line compared to the grey line below), imply that hedging strategies (such as owning longer-dated calls and selling stock/futures as a combination, or using put option spread strategies to hedge shares) may continue to be appealing.

Graphic: Retrieved from SpotGamma. Volatility skew for S&P 500 options expiring March 15, 2024.

In terms of what to hedge, as highlighted by Fallacy Alarm, mid-February traditionally signals local market peaks due to significant cash injections followed by selling pressure to cover tax obligations. Additionally, a dilemma presents itself: should the focus be on combating inflation or stimulating growth? Presently, the data would dissuade anticipated rate cuts, though such actions might be contemplated if the Personal Consumption Expenditure, a key metric, points to lower price increases, particularly in services. Current interest rate projections suggest a bimodal scenario with a low probability of sudden rate declines.

Graphic: Retrieved from Bloomberg.

As further context, John Authers of Bloomberg says there remains a risk of overheating or a scenario where the economy remains robust, eventually forcing the Federal Reserve (Fed) to tighten policies until it precipitates a recession. This is in disagreement with TS Lombard. They question whether the Fed’s current stance is overly restrictive, while Bob Elliott of Unlimited Funds suggests that rates may decrease in response to slowing growth. Eventually, the persistent inflation stemming from structural factors could prompt subsequent rate hikes driven by increased funding needs.

Graphic: Retrieved from Sven Henrich.

Traders must remain vigilant, adopting strategic approaches to hedge exuberance and so-called windows of non-strength. Should there be “a stronger catalyst than a telegraphed CPI print,” says Kris Sidial, then “both tails and skew are likely to perform well,” with any rally, given the short-volatility, likely to unsettle positioning, leading dealers to boost momentum and whipsaw. In other words, much lower or higher markets, coupled with more demand for puts or calls respectively, means dealers take on more short volatility risk, which they adjust for by repricing options higher and hedging with underlying asset sales (in the case of puts) or purchases (in the case of calls).

Graphic: Retrieved from Bank of America Corporation.

In conclusion, we remain mindful that it’s an election year, which could lead to heightened monetary and fiscal support in response to any weaknesses. While we maintain a positive outlook over the long term, we’re less optimistic in the short term.

This week, our attention is directed toward protecting our cash by rolling our remaining S&P 500 box spreads (acting as synthetic T-bills without impacting our buying power). We aim to secure these interest rates, keep a close watch on high-performing assets like silver, and replenish our long put skew (i.e., purchasing put spreads) in equities to hedge against potential vulnerabilities ahead. Following earnings announcements, we may resume engagement with companies such as Nvidia.

Graphic: Example of trade structuring. Retrieved from Physik Invest. This does not accurately represent this newsletter writer’s position. However, it is close. Note that one may own stock on top of this and view positions in aggregate.

If you’re wondering what’s up with the newsletter formatting over the past weeks, we are trying stuff. Let us know what you like and don’t like. Cheers, and have a good week! And, finally, if you can, share!

The cover photo was retrieved from a RidgeHaven Capital post on Seeking Alpha.

Categories
Commentary

Bubblicious

Good Morning! I hope you had a great weekend and enjoy today’s letter. I would be so honored if you could comment and/or share this post. Cheers!

Optimism from earnings growth among large stocks overshadows concerns about instability abroadquarterly debt sales, and the diminishing likelihood of an immediate interest rate cut.

“The U.S. is doing pretty well,” Yardeni Research founder Ed Yardeni remarks, noting a shift from speculation about interest rates allows the market to focus on fundamentals. “Right now, the fundamentals are good for the economy. And, there’s plenty of hype around about.”

Multiple rate cuts totaling nearly 125 basis points in the next year remain expected. This seems extreme unless there’s a market crash, says Harley Bassman, inventor of the MOVE Index measuring bond market volatility. Bassman believes current pricing reflects a bimodal scenario, with an 85% chance rates remain stable and a 15% chance they drop to 1%. Combining these probabilities, the market arrives at the anticipated cuts by year-end.

Naturally, markets are cyclical, moving from one extreme to another. Despite the fundamentals being in order, a lack of broad participation is evident in the more significant number of declining stocks than advancing ones. This situation, resembling patterns seen during the late ‘90s infotech-and-telecom boom, is frequently an indicator of less resilient future returns.

Graphic: Retrieved from Bank of America Global Research.

Ryan Detrick of Carson Group notes that February typically experiences less momentum than January, often due to reinvestment and bonus inflows. Data shows that when the S&P 500 recorded a 20% gain for the year, February tended to underperform, especially in the latter half of the month, which typically marked the weakest two-week period of the year.

Graphic: Retrieved from SentimenTrader via Jason Goepfert.

While the same volatility-suppressing trades detailed in last week’s letter continue to support markets where they are ceteris paribus (where customers sell volatility, and dealers hedge by buying stock/futures during declines and selling during strength), there has been “SPX/SPY downside buying (put flys) and ongoing VIX call buying,” Nomura Americas Cross-Asset Macro Strategist Charlie McElligott writes. This steepens implied volatility skew, benefitting the underappreciated hedge opportunities shared in Physik Invest’s Market Intelligence letters.

Graphic: Retrieved from SpotGamma on February 5, 2024.

The recent repricing has allowed unbalanced, out-of-the-money options spreads to retain their value better amid ongoing market gains. The focus has shifted from worries about missed opportunities to safeguarding against potential downturns. This shift may be attributed to concerns beyond poor market breadth and the possibility of localized issues in places like China impacting global markets. These include geopolitical tensionsturbulence in specific capital market segments, lingering effects of extensive government spending, and looming debt crises.

Graphic: Retrieved from SpotGamma on February 1, 2024.

With the popularity of yield-enhancing trades like selling options, there’s concern that if significant market movements materialize, a greater share of end users will shift to buying options, indirectly exacerbating market volatility and downside.

Graphic: Retrieved from QVR Advisors.

To explain this phenomenon, we start with the options delta, which measures how much an option’s price will change for every $1 change in the underlying asset’s price. When end users sell put options, market makers buy them, assuming a negative delta stance, thus prompting them to acquire the underlying asset to hedge (which has a positive delta). Conversely, when end users buy put options, dealers sell them, taking on a positive delta. Consequently, they need to sell the underlying asset (which has a negative delta) to hedge. In sharp and volatile market declines, options sellers may opt to cover their positions by purchasing options, thereby diminishing stability as counterparties hedge in line with the market movement.

Graphic: Retrieved from Nomura.

Kris Sidial from The Ambrus Group emphasizes second-order effects are further amplified due to the large scale of options selling, adding concentration among market makers as another risk to watch. Scott Rubner, a tactical specialist at Goldman Sachs Group, concurs current market problems, and the unwind of stretched positioning may lead to a weak February.

Categories
Commentary

Daily Brief For May 12, 2023

LOAD LEVELS ON TRADINGVIEW BY CLICKING HERE.

Bloomberg reports that if the US defaults on its debt, which could happen as soon as June 1 if President Biden and House Speaker McCarthy fail to reach a deal on raising the ceiling, homebuyer borrowing costs may surge to 8.40%. As a consequence, the typical home’s monthly payment would increase by 22.00% and cool property sales; the monthly payment on a $500,000.00 mortgage may rise to $3,800.00, compared to about $3,095.00 at the current rate of 6.30%.

Image
Graphic: Retrieved from WSJ.

In prior letters, we concluded that past monetary action made stocks less sensitive to interest rates, quoting JPMorgan Chase & Co (NYSE: JPM) strategists that the market would likely continue to “artificially suppress perceptions of fundamental macro risks,” barring surprises like a debt limit breach.

US Tech Stocks Outperform | The Nasdaq 100 has soared amid expectations of easier Fed policy
Graphic: Retrieved from Bloomberg.

With a debt limit breach a potential reality, Moody’s Corporation (NYSE: MCO) says a breach may compound recessionary pressures; expect a drop in equities, a volatility spike, and a disruption of funding markets.

Graphic: Retrieved from Nasdaq Inc (NASDAQ: NDAQ).

“Data show that short-term bonds have the most predictable reaction – with interest rates and default insurance costs rising significantly – before quickly returning to normal after the uncertainty has passed,” Nasdaq’s Phil Mackintosh writes. “In reality, a crisis was averted in all [prior] cases, with the government able to increase or suspend the debt limit before the X Date.”

Graphic: Retrieved from Bloomberg.

Notwithstanding the short-term uncertainty regarding the debt limit, Bank of America Corporation (NYSE: BAC) is adamant there will be a recession that manifests cracks in “credit and tech,” similar to the situation in 2008. BAC sees the bubble in technology, media, and telecommunication stocks soon deflating as they face higher-for-longer interest rates and a tempered earnings outlook.

Graphic: Retrieved from Societe Generale SA (OTC: SCGLY) via The Market Ear. While investors poured $3.8 billion into technology stocks in the week through May 10, $2.1 billion was pulled from financial equities, the most significant redemption since May 2022.

Compounding the recessionary pressures BAC sees, EPB Research adds, are banks’ funding costs, which have increased too much relative to prevailing asset yields. If the spread drops too low, bank lending tightens, and a recession occurs. Also, other data suggests tightening is finally starting to have an impact. Bloomberg reports that initial claims for unemployment insurance are on the rise. There has been a drop in overall wage growth to 5.1% last month, too, the biggest fall in the rate of increase since the series began.

Graphic: Retrieved from Bloomberg.

Separately, breadth divergences are becoming more frequent, with the Daily Advance-Decline (A-D) Line for the NYSE showing lower highs while DJIA and S&P 500 show slightly higher highs, McClellan Financial Publications writes. The bond CEF A-D Line is also showing a bearish divergence, indicating a shift in liquidity that could weigh on other stocks, including the big-cap stocks holding up the SP500 and the Nasdaq 100.

bond cef a-d line
Graphic: Retrieved from McClellan Financial Publications.

McClellan adds that the A-D Line originated from data collected by Leonard Ayres and James Hughes in the 1920s. It was made famous in 1962.

nyse a-d line 1929
Graphic: Retrieved from McClellan Financial Publications.

That’s when Joe Granville and Richard Russell commented on it in their newsletters, noting how it had shown a big bearish divergence ahead of the 1962 bear market.

a-d line 1962
Graphic: Retrieved from McClellan Financial Publications.

To end, the economic calendar next week is focused on manufacturing and housing. The housing market is showing some downside risk for existing-home sales for April due to a weak reading on pending sales, MCO says, adding that housing permits and starts are expected to move sideways as builders remain cautious amid high-interest rates and economic uncertainty. Regional Fed surveys in New York and Philadelphia will provide the first read on factory activity for May, with little hope for a significant rebound in manufacturing. Jobless claims will be critical, as continuing the recent trend would likely signal a rapid deceleration in monthly job gains. Other critical data to be released include retail sales, industrial production, and business inventories.

Should readers wish to hedge the debt ceiling debacle, June call options on the Cboe Volatility Index appear attractive, some suggest. But, with RVOL as low as it is, owning optionality is not generally warranted. The risk is lower lows in volatility.

Image
Graphic: Retrieved from SpotGamma.

About

Welcome to the Daily Brief by Physik Invest, a soon-to-launch research, consulting, trading, and asset management solutions provider. Learn about our origin story here, and consider subscribing for daily updates on the critical contexts that could lend to future market movement.

Separately, please don’t use this free letter as advice; all content is for informational purposes, and derivatives carry a substantial risk of loss. At this time, Capelj and Physik Invest, non-professional advisors, will never solicit others for capital or collect fees and disbursements. Separately, you may view this letter’s content calendar at this link.

Categories
Commentary

Daily Brief For May 3, 2023

LOAD ALL LEVELS ON TRADINGVIEW BY CLICKING HERE.

The S&P 500 (INDEX: SPX) recovered after a violent sell-off led by products like the SPDR S&P Regional Banking ETF (NYSE: KRE). This is before updates on the Federal Reserve’s (Fed) monetary policy today.

Graphic: Retrieved from Danny Kirsch of Piper Sandler Companies (NYSE: PIPR).

The consensus is the Fed ratchets up the target rate to 5.00-5.25%. Following this, it is likely to keep rates at this higher level for longer than markets expect, letting the effects of the tightening work through the economy and tame the still-sticky inflation (e.g., lenders eating the cost of interest to sell more goods, job vacancies dropping, and payrolls surprising higher).

Graphic: Retrieved from Citigroup Inc (NYSE: C) via Bloomberg. “The Fed’s own projections from March suggest rates will be only just above 5% by year’s end — implying a protracted pause with no cuts, after the most aggressive hiking campaign in decades. It’s marked in red in the chart [above].”

Strategists at JPMorgan Chase & Co (NYSE: JPM) think a “hike and pause” scenario prompts a push higher in stocks.

“Here, the Fed would be relying on a tightening of lending standards stemming from the banking crisis to act as de facto rate hikes. Any language that the market interprets as the Fed being on pause should benefit stocks,” JPM wrote. “This outcome is not fully priced into equities.”

This idea was alluded to in yesterday’s letter; stocks likely do “ok” in a higher rates for longer environment. Beyond economic surprises and the debt ceiling issue, the Fed’s balance sheet (not likely to be addressed in this next announcement) strategists like Andy Constan of Damped Spring Advisors are most concerned about, since the size of quantitative easing or QE made stocks less sensitive to interest rates. Ratcheting quantitative tightening or QT, the flow of capital out of markets, would prompt some increased bearishness among those strategists.

Graphic: Retrieved from Bank of America Corporation (NYSE: BAC) via Macro Ops.

JPM strategists add the market may continue “artificially suppress[ing] perceptions of fundamental macro risks,” prompting upside momentum.

“We expect these inflows to persist over the next two weeks, with several more large returns expected to drop from the trailing sample window,” Tier1Alpha explains. “Even if market volatility increases during this time, it would take exceptionally significant moves to trigger substantial selling. While these inflows are advantageous during market upswings, it’s essential to remember that they can be particularly brutal on the way back down once volatility inevitably returns.”

Eventually, “as recessionary conditions proliferate,” EPB’s Eric Basmajian says, asset prices will turn. Downside accelerants include the debt limit breach, which Nasdaq Inc (NASDAQ: NDAQ) and Moody’s Corporation (NYCE: MCO) think portends recession and volatility spike.

Trade ideas and more in our recently published report.

Graphic: Retrieved from Bloomberg.

About

Welcome to the Daily Brief by Physik Invest, a soon-to-launch research, consulting, trading, and asset management solutions provider. Learn about our origin story here, and consider subscribing for daily updates on the critical contexts that could lend to future market movement.

Separately, please don’t use this free letter as advice; all content is for informational purposes, and derivatives carry a substantial risk of loss. At this time, Capelj and Physik Invest, non-professional advisors, will never solicit others for capital or collect fees and disbursements. Separately, you may view this letter’s content calendar at this link.

Categories
Commentary

Daily Brief For April 18, 2023

LOAD LEVELS ON TRADINGVIEW BY CLICKING HERE.

Bank of America Corporation (NYSE: BAC) sees allocations to equities versus bonds falling. That’s amid recession fears. Per EPB, “the cyclical economy has just started to shed jobs today, and leading indicators signal the recession is likely underway.”

“To get advanced warning of recessions, you must look at the construction and manufacturing sectors, even though these two sectors are only 13% of the labor market,” EPB adds, noting traditional indicators’ weakening predictability is not so great to ignore the insight. “It’s clear that the composition of traditional leading indicators remains appropriate, and thus, the current resounding recessionary signal should not be ignored.”

BAC strategist Michael Hartnett said, though, that this “consensus lust for recession” must soon be satisfied. Otherwise, the “pain trade” would be even higher yields and stocks; the S&P 500 (INDEX: SPX) is enjoying an accelerated rally which Jefferies Financial Group (NYSE: JEF) strategists think portends a period of flatness, now, over the coming weeks …

Graphic: Retrieved from Jefferies Financial Group (NYSE: JEF) via The Market Ear.

… and through options expiration (OpEx), typically a poor performance period for the SPX.

Displaying
Graphic: Retrieved from Tier1Alpha. 

Beyond the uninspiring fundamentals, the positioning contexts are supportive. Recall our letters published earlier this year. If the market consolidated and failed to break substantially, then falling implied volatility (IVOL) and time passing would bolster markets and, potentially, help build a platform for a rally into mid-year. A check of fixed-strike and top-line measures of IVOL like the Cboe Volatility Index or VIX confirms options activities are keeping markets intact.

Graphic: Retrieved from Danny Kirsch of Piper Sandler (NYSE: PIPR). “SPX May $4,150.00 call volatility, the lack of realized volatility weighing on the market. Volatility low, not cheap.”

Beyond the rotation into shorter-dated options, just one of the factors exacerbating the decimation of longer-dated volatility, traders’ consensus is that markets won’t move a lot and/or they don’t need to hedge over longer time horizons; traders want punchier exposure to realized volatility (RVOL), and that they can get through shorter-dated options that have more gamma (i.e., exposure to changes in movement), not vega (i.e., exposure to changes in implied volatility).

Graphic: Retrieved from Goldman Sachs Group Inc (NYSE: GS) via Bloomberg.

Consequently, counterparties may be less dangerous to accelerating movement in either direction; hence, the growing likelihood of a period of flatness.

Graphic: Retrieved from SpotGamma.

“Despite the collapse in the 1-month realized volatility, we suspect most vol control funds have scaled into using their longer-term realized vols, which by design, lead to less aggressive rebalancing flows,” Tier1Alpha says. “For example, the 3-month rVol, which is currently driving our model, was essentially unchanged yesterday, which means volatility targets were maintained, and very little additional rebalancing had to occur. So even with the decline in the 1-month vol, overall risk exposure remained the same.”

With IVOL at a lower bound, the bullish impacts yielded by its compressing have largely played out. There may be more to be gained by movements higher in IVOL, in addition to the expiry of many call options this OpEx. By owning protection, particularly far from current prices, you are positioned to monetize on the market downside and non-linear repricings of volatility, as this letter has discussed in recent history. The caveat is that volatility can cluster and revert for longer; hence, your structure matters.

“I am concerned that VIX is underpricing the series of events that we know to expect over the coming weeks,” says Interactive Brokers Group Inc’s (NASDAQ: IBKR) Steve Sosnick. “While there is now an 88% implied likelihood of a 25 basis point hike, the likely path of any potential future hikes and assumed cuts should be more clarified at the meeting and in its aftermath.  And oh, has anyone ever heard the expression “sell in May and go away?”

Graphic: Retrieved from Interactive Brokers Group Inc (NASDAQ: IBKR).

With call skews far up meaningfully steep in some products, still-present low- and zero-cost call structures this letter has talked about in the past remain attractive. If the market falls apart, your costs are low, and losses are minimal. If markets move higher into a “more combustible” position, wherein “volatility is sticky into a rally,” you may monetize your call structures and roll some of those profits into bear put spreads (i.e., buy put and sell another at a lower strike). An alternative option is neutral. Own something such as a T-bill or box spread (i.e., buy call and sell put at one strike and sell call and buy put at another higher strike). Some boxes are yielding upwards of 5.4% as of yesterday’s close.

To end, though the short-dated options activity may prompt cascading events in market downturns, the main issue is the reduced use of longer-dated options; a supply and demand imbalance likely resolves itself with an implied volatility repricing of a great size where longer-dated options outperform those that are shorter-dated.

Our locking in of rates or using the profits of call structures to position for a potential IVOL repricing, particularly in the back half of the year when dealer positioning is less clear, buybacks are to fall off of a cliff, rates may fall, and the boost from short-covering has played its course, is an attractive proposition given the context.

Graphic: Retrieved from Bloomberg. “The S&P 500 (white line) is well above its levels from early March, while the yield on the 3m-2y spread remains in a deep inversion, signifying meaningful expectations of cuts in the months ahead.”

About

Welcome to the Daily Brief by Physik Invest, a soon-to-launch research, consulting, trading, and asset management solutions provider. Learn about our origin story here, and consider subscribing for daily updates on the critical contexts that could lend to future market movement.

Separately, please don’t use this free letter as advice; all content is for informational purposes, and derivatives carry a substantial risk of loss. At this time, Capelj and Physik Invest, non-professional advisors, will never solicit others for capital or collect fees and disbursements. Separately, you may view this letter’s content calendar at this link.

Categories
Commentary

Daily Brief For April 14, 2023

LOAD LEVELS ON TRADINGVIEW BY CLICKING HERE.

Consensus is a tightening cycle that climaxes on May 3 with one final 25 basis point hike. Most traders price three cuts after—one in July, November, and December.

Note: After the release of strong bank earnings today, this analysis remains intact.

Graphic: Retrieved from CME Group Inc (NASDAQ: CME).

Though policymakers are successful in walking up traders’ interest rate expectations, the long end of the yield curve hasn’t budged much; despite the response to banking turmoil helping “calm conditions, … and lessen the near-term risks,” many believe the Fed will have to pivot, soon.

The Federal Reserve’s ranks expect a “mild recession,” too, validating people such as Bank of America Corporation’s (NYSE: BAC) Michael Hartnett, who said investors should steer clear of stocks. Hartnett added the expectations of a recession would solidify following the upcoming earnings season, a test of how companies have managed headwinds like the bank crisis and slowing demand.

Graphic: Retrieved from Bank of America Corporation (NYSE: BAC).

Despite billions in redemptions over the past week or so, the market’s strength can continue for longer, though. Here’s why.

Graphic: Retrieved from Goldman Sachs Group Inc (NYSE: GS) via The Market Ear.

Contextually, positioning overwhelmingly supports the market at this juncture. That’s per the likes of Cem Karsan of Kai Volatility have explained.

Falling volatility has led to billions more in buying flows from volatility-controlled funds rebalancing their risk exposures, Tier1Alpha adds, noting “there is a chance realized volatility [or RVOL] will continue to decrease until the end of next week as long as the SPX returns stay muted. If volatility rises beyond the +/- 2% threshold, net equity sales could exceed $5 billion.”

“This is not expected due to favorable CPI data and dealer positioning,” however.

With markets likely to be contained in the short to medium term, and fundamental weaknesses, such as the Fed hiking long-end yields, likely to cause them to fail in the long run—play near- or medium-term strength via call spread structures, and use the profits to lower the cost of longer-dated bets on markets or rates falling. 

In support of this view, per The Market Ear’s summary of some Goldman Sachs Group Inc (NYSE: GS) analyses, “the disconnect between Nasdaq 100 (INDEX: NDX) and bond yields has grown to statistically significant levels.” Thus, “owning downside asymmetry” is starting to look “more attractive.”

Graphic: Retrieved from VIX Central. The compression of implied volatility, or IVOL, is a booster for equities. ​​Investors are mostly bullish with a +1 Put, +100 Stock, -1 Call position, while dealers hold the opposite with a -1 Put, -100 Stock, +1 Call position. As the volatility trends lower (e.g., S&P 500 realized volatility or RVOL is ~10), options lose value, and dealers must buy back their short stock to re-hedge. This supports the market.

About

Welcome to the Daily Brief by Physik Invest, a soon-to-launch research, consulting, trading, and asset management solutions provider. Learn about our origin story here, and consider subscribing for daily updates on the critical contexts that could lend to future market movement.

Separately, please don’t use this free letter as advice; all content is for informational purposes, and derivatives carry a substantial risk of loss. At this time, Capelj and Physik Invest, non-professional advisors, will never solicit others for capital or collect fees and disbursements. Separately, you may view this letter’s content calendar at this link.

Categories
Commentary

Daily Brief For April 10, 2023

LOAD LEVELS ON TRADINGVIEW BY CLICKING HERE.

US payroll data has increased the possibility of a rate hike by the Federal Reserve or Fed in early May, leading to higher rates and affecting those who expected a pause or pivot through poorly performing yield curve steepener trades. The market expects the Fed to raise its target rate to 5.00-5.25% and keep it there through mid-year.

Graphic: Retrieved from CME Group Inc’s (NASDAQ: CME) FedWatch Tool.

There is more to the pressure than just yields. Surveys indicate a drop in profits for sensitive areas of the equity market, such as technology and banks; as soon as the labor market starts softening, a credit crunch is expected to accelerate by some.

Graphic: Retrieved from the St. Louis Fed via Cubic Analytics.

Despite the turbulence from earnings, data suggests the S&P 500 (INDEX: SPX) may perform well through year-end. Historically, the full-year return was always positive when the S&P 500 had a positive first quarter. However, there have been exceptions, says Callum Thomas, quoting data gathered by Ryan Detrick.

Graphic: Retrieved from Ryan Detrick via Callum Thomas’ Weekly S&P 500 ChartStorm.

Peeking beneath the hood, only a few (primarily rate-sensitive) stocks have bolstered recent index strength; many components are not participating in the rally, which could be a harbinger of potential post-earnings weaknesses. 

Graphic: Retrieved from McClellan Financial Publications.

Notwithstanding, if rates continue to fall, so do borrowing costs; falling inflation cuts pressures on input cost; rising unemployment helps keep labor costs under control, Bloomberg reports. The forecasts (not surveys) actually show earnings holding up better than the narrative suggests.

Graphic: Retrieved from Bloomberg.

So what, then? In an annual report, JPMorgan Chase & Co (NYSE: JPM) concludes that if “we have higher inflation for longer, the Fed may be forced to increase rates higher than people expect despite the recent bank crisis.” Compounding the rate hikes is quantitative tightening or QT, the process of a central bank reducing the amount of money it has injected into an economy by selling bonds or other financial assets, which “may have ongoing impacts that might, over time, be another force, pushing longer-term rates higher than currently envisioned.” The net effect, though insights gleaned from the curve may be muddied due to the scale of recent interventions, is an “inverted yield curve [implying] we are going into a recession” and lower credit creation because, as Sergei Perfiliev well puts it, “if capital ends with the Fed, it is dead – it has left the economy and the banking system.”

Graphic: Retrieved from Bank of America Corporation (NYSE: BAC) via TheMarketEar.

How do we position ourselves, given all these narratives? Equity volatility implied (IVOL) and realized (RVOL) decreased. This may continue to be a booster. In fact, “if markets remain within a +/-1.5% range, a drop in volatility could trigger significant buying activity from the vol-control space, with up to $14 billion in notional flows hitting the tape, creating a favorable environment for equities,” says Tier1Alpha.

Graphic: Retrieved from Tier1Alpha.

So, positioning-wise, stocks could trade up into a “more combustible” state where “volatility is sticky into a rally,” as Kai Volatility’s Cem Karsan said would happen.

SpotGamma confirms that, based on current positioning, SPX IVOL is projected to move up as the underlying index moves up; there are likely many people chasing the rally with long calls, “creating a swelling of call skew.”

In this environment, very wide call ratio spread structures discussed in past letters may continue to do well. We can use the profits from those call structures to cut the cost of our bets on the equity market downside and lower interest rates.

Graphic: Retrieved from SpotGamma’s Weekend Note.

About

Welcome to the Daily Brief by Physik Invest, a soon-to-launch research, consulting, trading, and asset management solutions provider. Learn about our origin story here, and consider subscribing for daily updates on the critical contexts that could lend to future market movement.

Separately, please don’t use this free letter as advice; all content is for informational purposes, and derivatives carry a substantial risk of loss. At this time, Capelj and Physik Invest, non-professional advisors, will never solicit others for capital or collect fees and disbursements. Separately, you may view this letter’s content calendar at this link.

Categories
Commentary

Daily Brief For March 24, 2023

Physik Invest’s Daily Brief is read free by thousands of subscribers. Join this community to learn about the fundamental and technical drivers of markets.

Graphic updated 9:20 AM ET. Sentiment Risk-Off if expected /MES open is below the prior day’s range. /MES levels are derived from the profile graphic at the bottom of this letter. Click here for the latest levels. SqueezeMetrics Dark Pool Index (DIX) and Gamma (GEX) with the latter calculated based on where the prior day’s reading falls with respect to the MAX and MIN of all occurrences available. A higher DIX is bullish. The lower the GEX, the more (expected) volatility. Click to learn the implications of volatility, direction, and moneyness. Breadth reflects a reading of the prior day’s NYSE Advance/Decline indicator. The CBOE VIX Volatility Index (INDEX: VVIX) reflects the attractiveness of owning volatility. UMBS prices via MNDClick here for the economic calendar.

Fundamental

Our Daily Brief for 3/23 discussed reactions to the Federal Reserve’s (Fed) interest rate decision being countered by Treasury secretary Janet Yellen’s deposit guarantee comments. Accordingly, doom and gloom are in full bloom prompting Yellen to walk back her toughness and tell lawmakers that regulators would protect the banking system if warranted. However, this did little to assuage markets, hence the neutral-to-risk-off sentiment this morning.

Based on the Fed’s Overnight Reverse Repo (RRP) and Bank Term Funding Program (BTFP), as well as money-market flows, strategists believe the deposit flight has not stabilized. To explain, policymakers intervened on the heels of the banking crisis in a way that’s not to be confused with quantitative easing or QE (i.e., flow of capital into markets). The Fed’s balance sheet swelled (from the discount window, the new bank funding facilities, and spillover from the FDIC insurance backstop). The balance sheet has continued to swell while money market funds and the RRP facility see big inflows.

Strategists like Andreas Steno Larsen allege that the maturity of 3-month T-bills and deposit flights partly drives this swell.

Graphic: Retrieved from ZeroHedge.

Rather than being used to boost liquidity (i.e., “lend or to finance trading activities,” as discussed in previous letters, including 9/20), reserves are being sterilized. “The Fed’s actions to stem the banking crisis are beginning to accelerate the effects of [quantitative tightening or] QT, causing money velocity to drop and intensifying the tightening of financial conditions,” Bloomberg’s Simon White reports. “In the coming weeks and months, we are likely to see reserves leaving the high-velocity world of smaller banks, where they were being lent out more, to the effectively zero-velocity black-hole of” money-market funds and RRP.

Graphic: Retrieved from ZeroHedge.

JPMorgan Chase & Co (NYSE: JPM) validates this view. They think the Fed’s rate hikes and QT have coincided with funds going to money-market funds and larger banks. They add that the banking crisis has accelerated this movement.

Graphic: Retrieved from Bloomberg.

“Deposit movements could cause banks to be cautious on lending, with mid- and small-size banks playing a large role in US lending,” thus exacerbating recessionary pressures, they note. Bank of America Corporation (NYSE: BAC) strategists add that investors should sell equities after the last rate hike to sidestep “the biggest declines.”

Graphic: Retrieved from Goldman Sachs Group Inc (NYSE: GS).

Positioning

Brief positioning update.

As proposed in previous letters, low- or zero-cost call options structures have worked and may continue to work.

Notwithstanding, look for opportunities to play the downside as markets trade higher into a “more combustible” position. Attractive bear put spread trades are showing in the previously depressed Nasdaq 100, where boosts have, in part, been the result of “volatility compression and options decay.” If you’re participating in the Nasdaq, at least you have breadth on your side.

Graphic: Retrieved from ZeroHedge.

Technical

As of 9:20 AM ET, Friday’s regular session (9:30 AM – 4:00 PM ET) in the S&P 500 will likely open in the lower part of a negatively skewed overnight inventory, outside of the prior day’s range, suggesting a potential for immediate directional opportunity.

The S&P 500 pivot for today is $3,957.25. 

Key levels to the upside include $3,980.75, $3,994.25, and $4,005.00.

Key levels to the downside include $3,937.00, $3,921.25, and $3,891.00.

Disclaimer: Click here to load the updated key levels via the web-based TradingView platform. New links are produced daily. Quoted levels likely hold, barring an exogenous development.

Graphic: 65-minute profile chart of the Micro E-mini S&P 500 Futures.

Definitions

Overnight Rally Highs (Lows): Typically, there is a low historical probability associated with overnight rally-highs (lows) ending the upside (downside) discovery process.

Volume Areas: Markets will build on areas of high-volume (HVNodes). Should the market trend for some time, this will be identified by a low-volume area (LVNodes). The LVNodes denote directional conviction and ought to offer support on any test.

If participants auction and find acceptance in an area of a prior LVNode, then future discovery ought to be volatile and quick as participants look to the nearest HVNodes for more favorable entry or exit.

POCs: Areas where two-sided trade was most prevalent in a prior day session. Participants will respond to future value tests as they offer favorable entry and exit.


About

The author, Renato Leonard Capelj, spends the bulk of his time at Physik Invest, an entity through which he invests and publishes free daily analyses to thousands of subscribers. The analyses offer him and his subscribers a way to stay on the right side of the market. 

Separately, Capelj is an accredited journalist with past works including interviews with investor Kevin O’Leary, ARK Invest’s Catherine Wood, FTX’s Sam Bankman-Fried, North Dakota Governor Doug Burgum, Lithuania’s Minister of Economy and Innovation Aušrinė Armonaitė, former Cisco chairman and CEO John Chambers, and persons at the Clinton Global Initiative.

Connect

Direct queries to renato@physikinvest.com. Find Physik Invest on TwitterLinkedInFacebook, and Instagram. Find Capelj on TwitterLinkedIn, and Instagram. Only follow the verified profiles.

Calendar

You may view this letter’s content calendar at this link.

Disclaimer

Do not construe this newsletter as advice. All content is for informational purposes. Capelj and Physik Invest manage their own capital and will not solicit others for it.