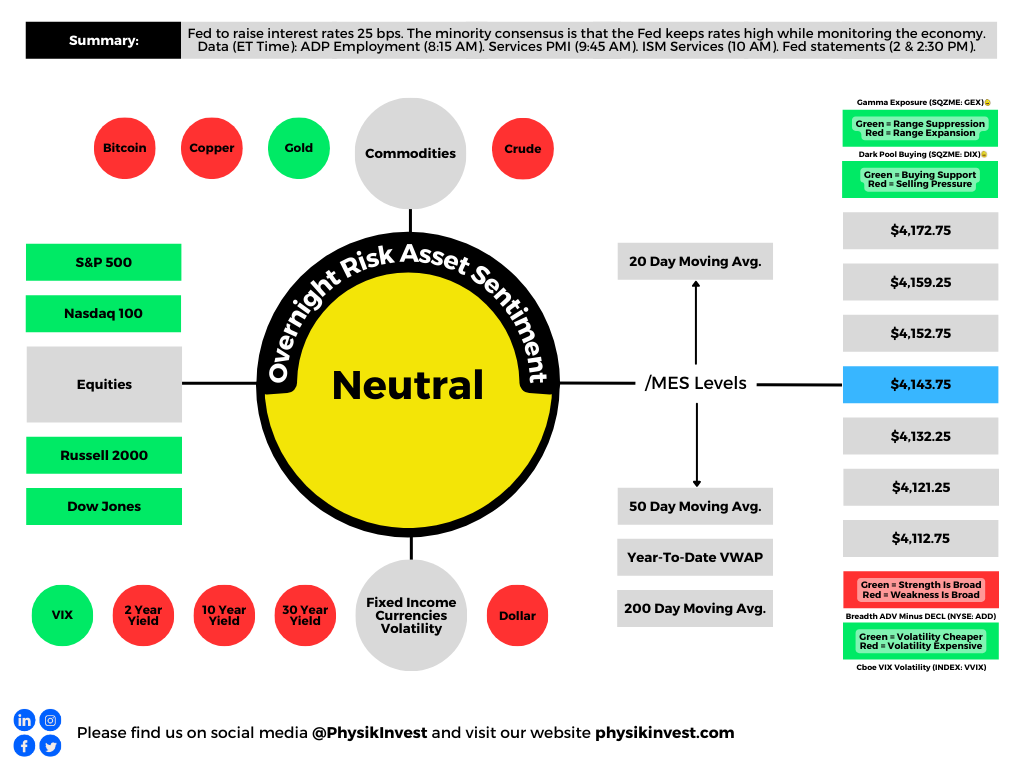
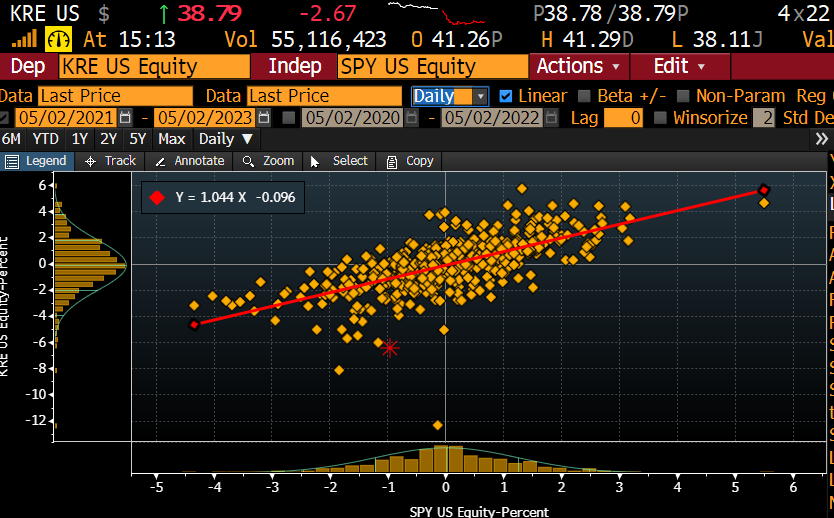
The S&P 500 (INDEX: SPX) recovered after a violent sell-off led by products like the SPDR S&P Regional Banking ETF (NYSE: KRE). This is before updates on the Federal Reserve’s (Fed) monetary policy today.
Graphic: Retrieved from Danny Kirsch of Piper Sandler Companies (NYSE: PIPR).
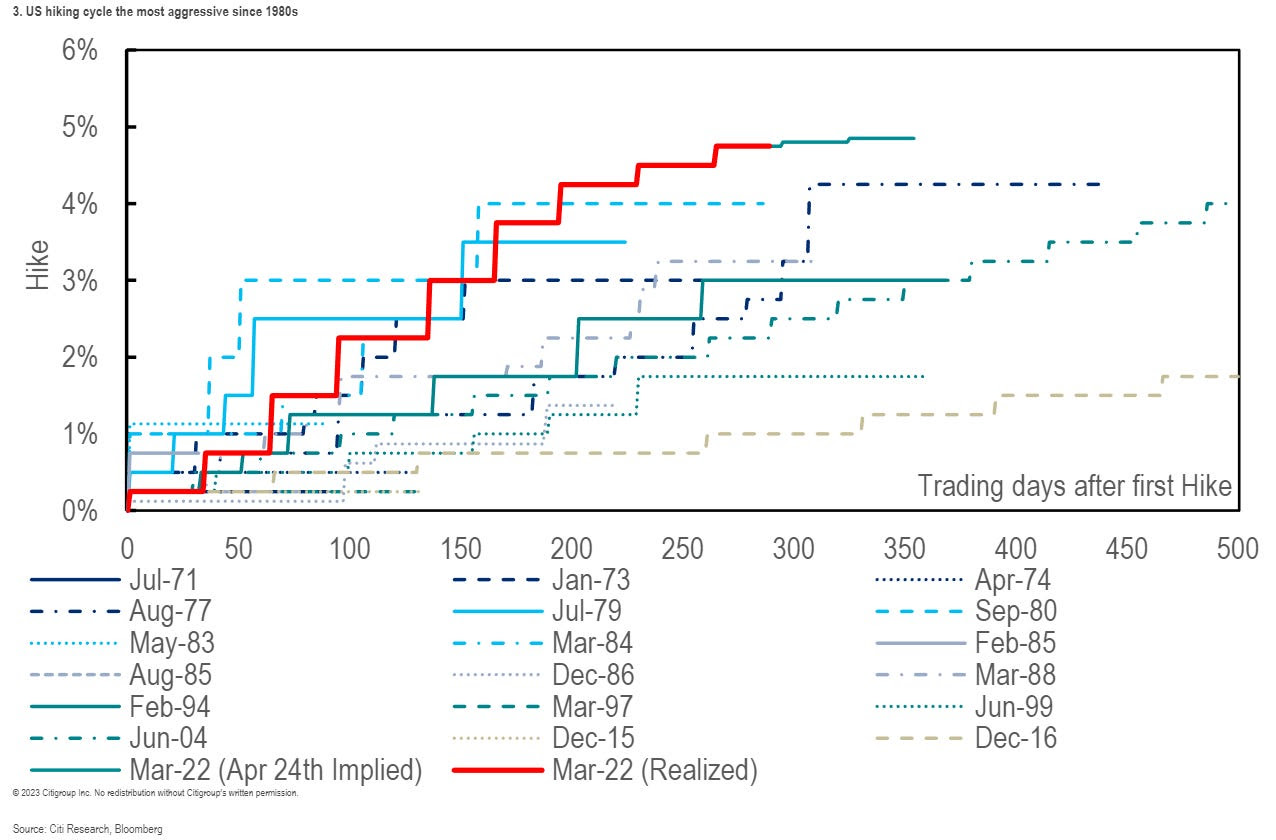
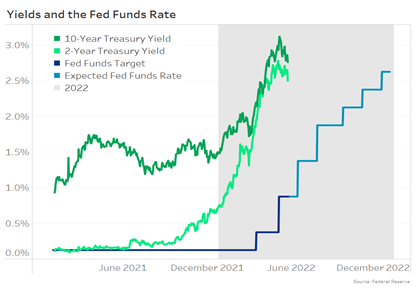
The consensus is the Fed ratchets up the target rate to 5.00-5.25%. Following this, it is likely to keep rates at this higher level for longer than markets expect, letting the effects of the tightening work through the economy and tame the still-sticky inflation (e.g., lenders eating the cost of interest to sell more goods, job vacancies dropping, and payrolls surprising higher).
Graphic: Retrieved from Citigroup Inc (NYSE: C) via Bloomberg. “The Fed’s own projections from March suggest rates will be only just above 5% by year’s end — implying a protracted pause with no cuts, after the most aggressive hiking campaign in decades. It’s marked in red in the chart [above].”
Strategists at JPMorgan Chase & Co (NYSE: JPM) think a “hike and pause” scenario prompts a push higher in stocks.
“Here, the Fed would be relying on a tightening of lending standards stemming from the banking crisis to act as de facto rate hikes. Any language that the market interprets as the Fed being on pause should benefit stocks,” JPM wrote. “This outcome is not fully priced into equities.”
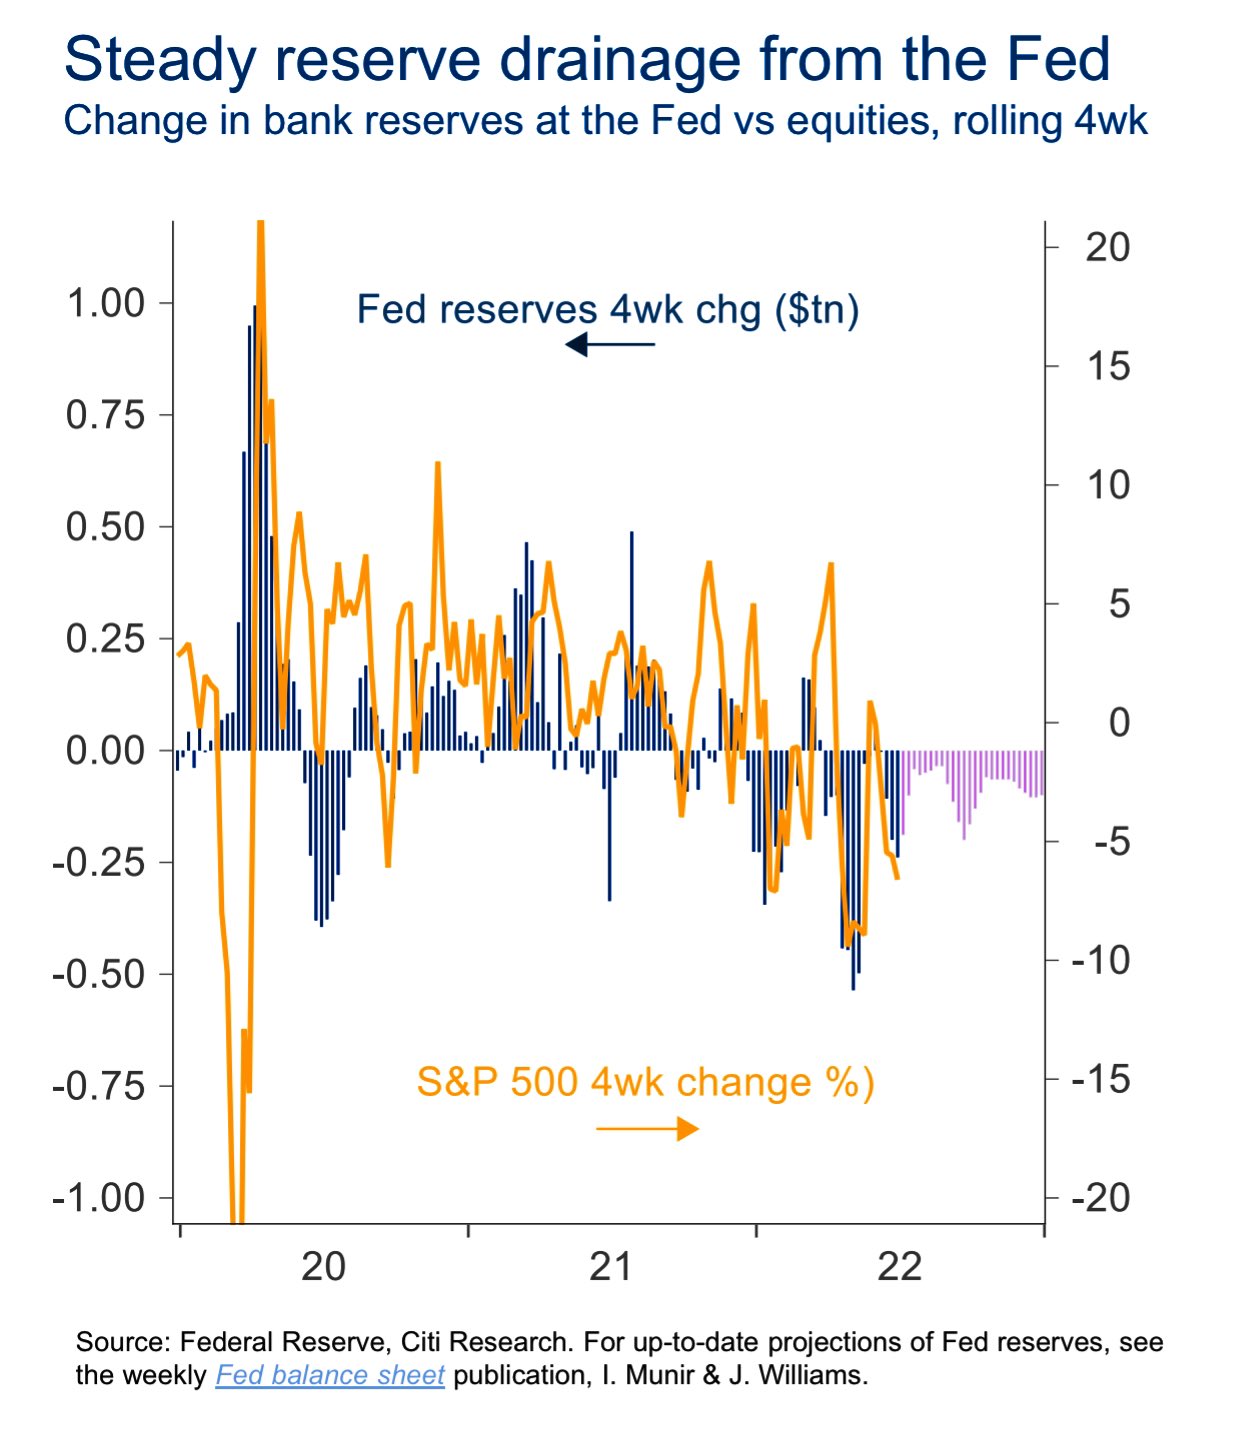
This idea was alluded to in yesterday’s letter; stocks likely do “ok” in a higher rates for longer environment. Beyond economic surprises and the debt ceiling issue, the Fed’s balance sheet (not likely to be addressed in this next announcement) strategists like Andy Constan of Damped Spring Advisors are most concerned about, since the size of quantitative easing or QE made stocks less sensitive to interest rates. Ratcheting quantitative tightening or QT, the flow of capital out of markets, would prompt some increased bearishness among those strategists.
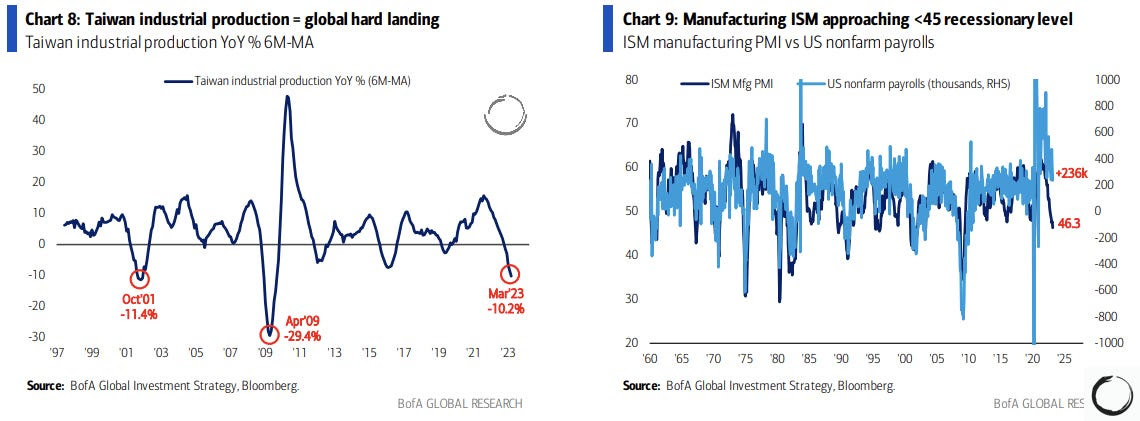
Graphic: Retrieved from Bank of America Corporation (NYSE: BAC) via Macro Ops.
JPM strategists add the market may continue “artificially suppress[ing] perceptions of fundamental macro risks,” prompting upside momentum.
“We expect these inflows to persist over the next two weeks, with several more large returns expected to drop from the trailing sample window,” Tier1Alpha explains. “Even if market volatility increases during this time, it would take exceptionally significant moves to trigger substantial selling. While these inflows are advantageous during market upswings, it’s essential to remember that they can be particularly brutal on the way back down once volatility inevitably returns.”
Eventually, “as recessionary conditions proliferate,” EPB’s Eric Basmajian says, asset prices will turn. Downside accelerants include the debt limit breach, which Nasdaq Inc (NASDAQ: NDAQ) and Moody’s Corporation (NYCE: MCO) think portends recession and volatility spike.
Trade ideas and more in our recently published report.
Welcome to the Daily Brief by Physik Invest, a soon-to-launch research, consulting, trading, and asset management solutions provider. Learn about our origin story here, and consider subscribing for daily updates on the critical contexts that could lend to future market movement.
Separately, please don’t use this free letter as advice; all content is for informational purposes, and derivatives carry a substantial risk of loss. At this time, Capelj and Physik Invest, non-professional advisors, will never solicit others for capital or collect fees and disbursements. Separately, you may view this letter’s content calendar at this link.
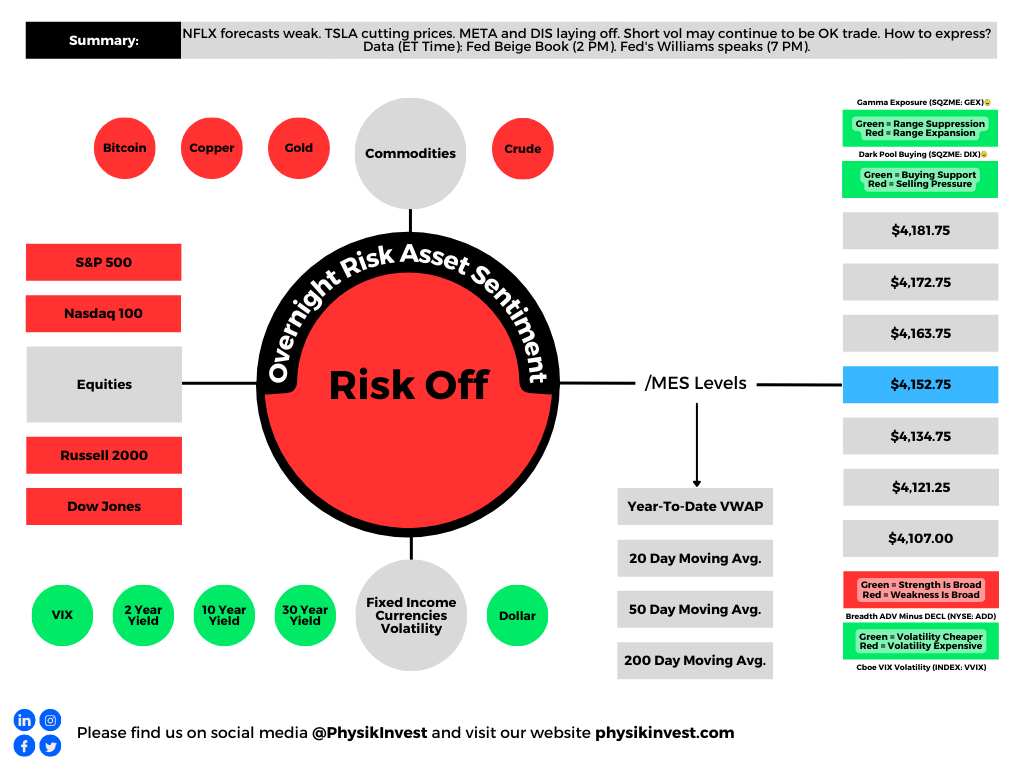
Big news includes Netflix Inc (NASDAQ: NFLX) beating earnings estimates but having a weaker-than-expected forecast, Tesla Inc (NASDAQ: TSLA) cutting prices the sixth time this year, Meta Platforms Inc (NASDAQ: META) and Walt Disney Co (NYSE: DIS) commencing layoffs, and mortgage rates edging higher to ~6.4%.
Graphic: Retrieved from Bloomberg. “US mortgage rates increased last week by the most in two months to 6.43%, denting already sluggish demand.”
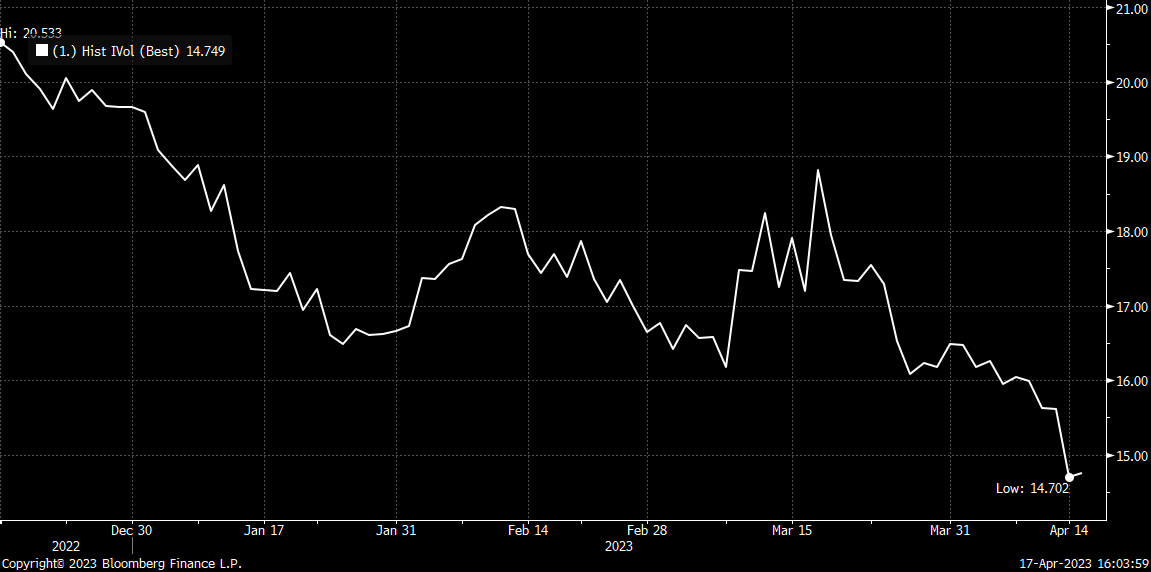
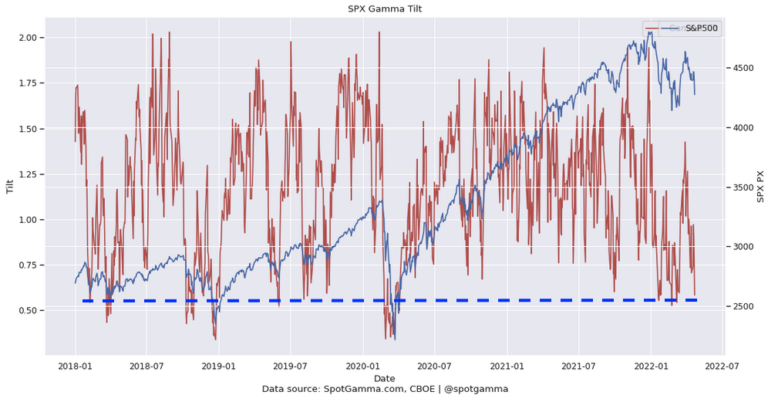
Equity markets are down, and equity implied volatility (IVOL) measures, including the Cboe Volatility Index or VIX, are climbing. Notwithstanding, the trend lower in IVOL is intact, and that’s good for traders biased short volatility.
Graphic: Retrieved from Bloomberg via Danny Kirsch of Piper Sandler Companies (NYSE: PIPR). Call option volatility for the $4,150.00 strike. May monthly expiration.
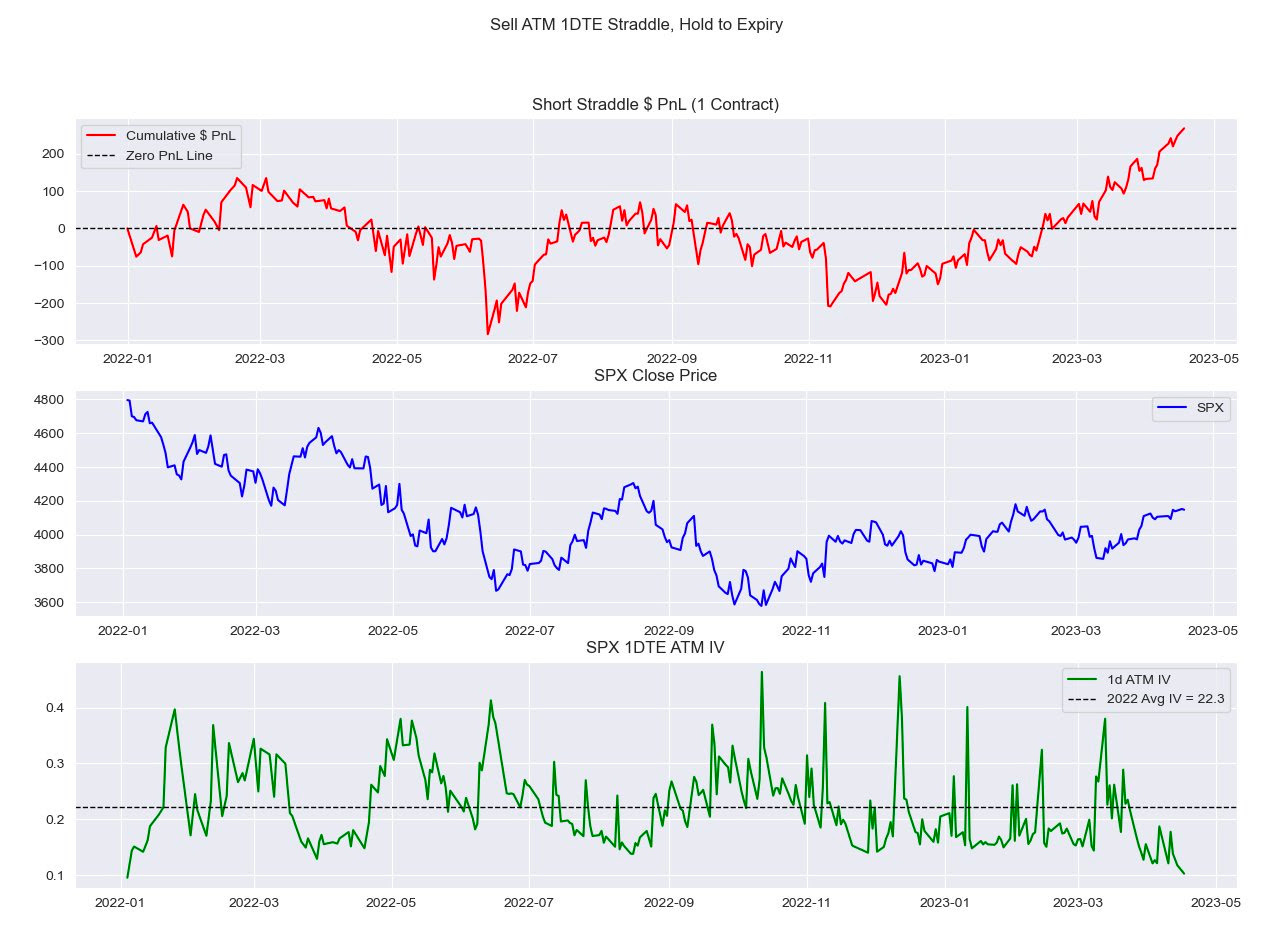
“With all the focus [on S&P 500 (INDEX: SPX)] 0 DTE lately, I look at how expensive these have been since 2022,” IPS Strategic Capital’s Pat Hennessy says, referencing a backtest he conducted selling a 1 DTE straddle and holding till maturity.
“Performance since the November CPI has been stellar, with a 63% win rate and an average gain of $20.00.”
Graphic: Retrieved from IPS Strategic Capital’s Pat Hennessy.
Volatility trader Darrin John agrees, noting volatility remains expensive, a detriment to those who may be biased long volatility.
“The VRP is so wide across all of the tenors I track,” John elaborates. “It’s going to be hard for gamma buyers to cover daily theta bills.”
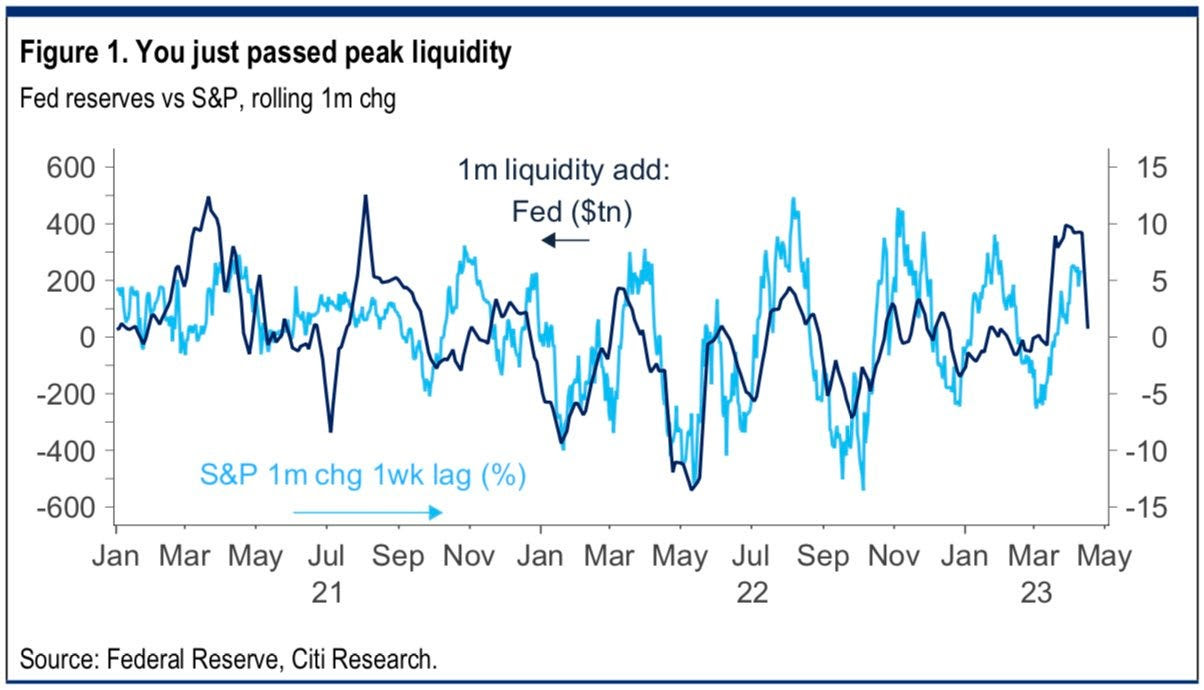
Clouds are appearing on the horizon, however, and the trend higher (lower) in stocks (volatility) may not last. Bloomberg forecasts the largest fall in SPX earnings since the start of 2020. Notwithstanding, strength can continue for longer …
Graphic: Retrieved from Citigroup Inc Research (NYSE: C) via @tr8derz. “YTD rally stems from $1tn in CB liquidity. High-frequency indicators suggest this is already stalling, and coming weeks seem increasingly likely to bring a sharp reversal. Higher TGA and RRP, ECB QT and reduced China easing could easily see a net drain of some $6-800bn.”
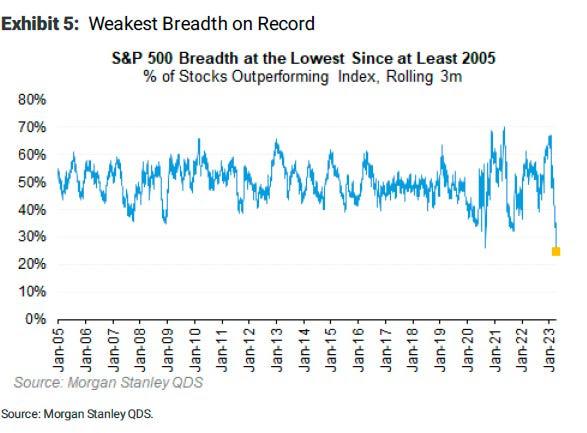
… even with the SPX breadth reading poor. The SPX has rallied with multiples rising; strength came with positive earnings surprises, bond demand, and other things.
Graphic: Retrieved from Morgan Stanley (NYSE: MS) via Bloomberg.
Hence, at the risk of sounding like a broken record, the low-cost call structures we’ve talked about in the past remain attractive.
If markets move higher, you can monetize and roll profits into put spreads (i.e., buy put and sell another at a lower strike). This may work well if JPMorgan Chase & Co’s (NYSE: JPM) call that “even a mild recession would warrant retesting the previous lows” is realized.
Such structures work well as “a big pop in the market can result in a decent drop in the VIX…and vice versa, a market sell-off will result in a greater increase in the VIX now than it did in 2022,” says Alpha Exchange.
Alternatively, lean neutral and buy into cash or bonds yielding 4-5%. Some long box spreads yield 5.4% as of yesterday’s close.
In other news, Physik Invest’s first in-depth note is nearing completion and will be available for public viewing in short order. Take care and watch your risk!
About
Welcome to the Daily Brief by Physik Invest, a soon-to-launch research, consulting, trading, and asset management solutions provider. Learn about our origin story here, and consider subscribing for daily updates on the critical contexts that could lend to future market movement.
Separately, please don’t use this free letter as advice; all content is for informational purposes, and derivatives carry a substantial risk of loss. At this time, Capelj and Physik Invest, non-professional advisors, will never solicit others for capital or collect fees and disbursements. Separately, you may view this letter’s content calendar at this link.
The daily brief is a free glimpse into the prevailing fundamental and technical drivers of U.S. equity market products. Join the 1,200+ that read this report daily, below!
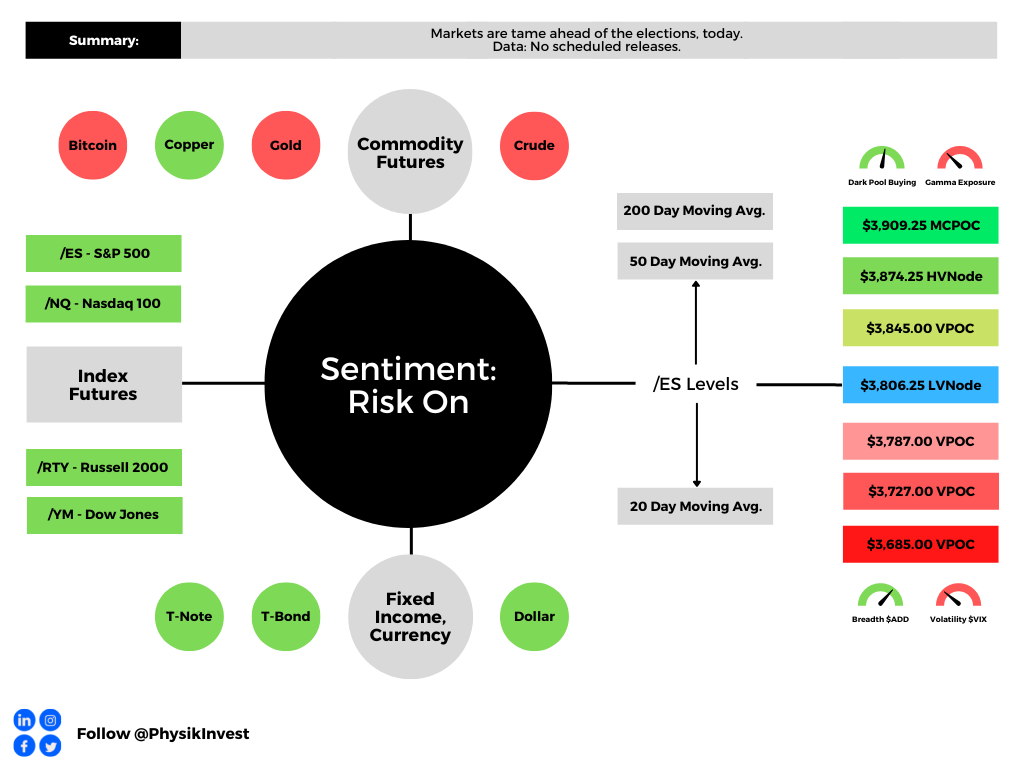
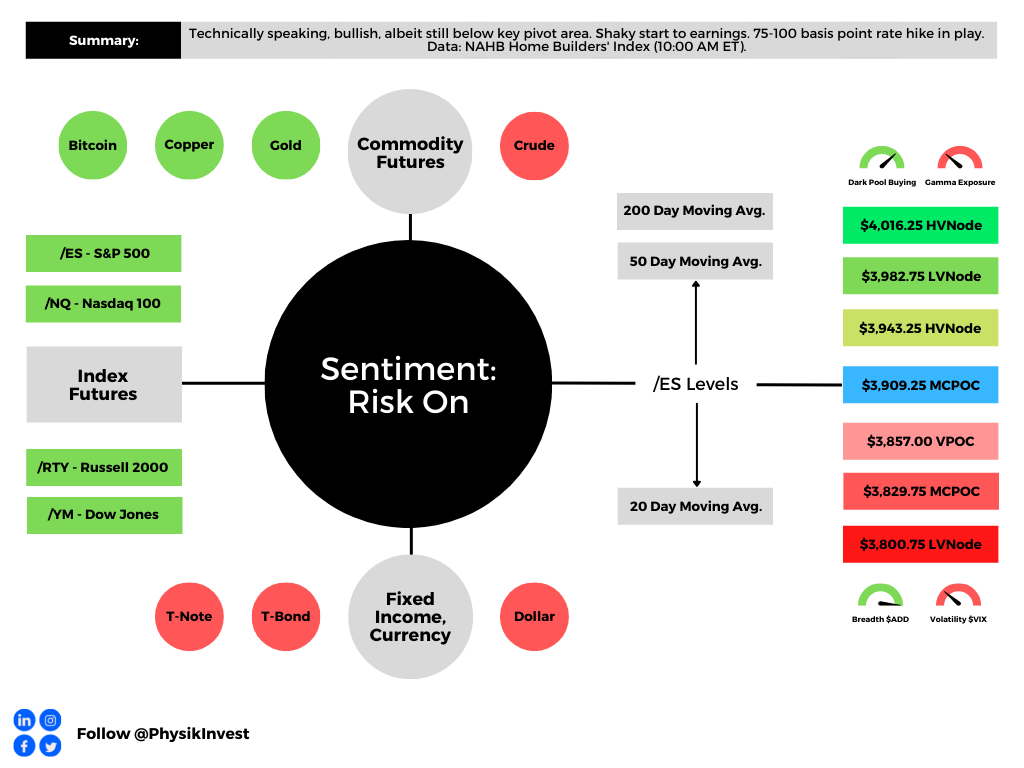
Graphic updated 9:15 AM ET. Sentiment Risk-On if expected /ES open is above the prior day’s range. /ES levels are derived from the profile graphic at the bottom of the following section. Levels may have changed since initially quoted; click here for the latest levels. SqueezeMetrics Dark Pool Index (DIX) and Gamma (GEX) calculations are based on where the prior day’s reading falls with respect to the MAX and MIN of all occurrences available. A higher DIX is bullish. At the same time, the lower the GEX, the more (expected) volatility. Learn the implications of volatility, direction, and moneyness. Breadth reflects a reading of the prior day’s NYSE Advance/Decline indicator. VIX reflects a current reading of the CBOE Volatility Index (INDEX: VIX) from 0-100.
Administrative
This letter’s author is ramping up coverage and returning to speed after a short hiatus. Today’s focus will be on adding to the “Positioning” section of Monday’s letter.
Positioning
After some late-October weakness that is coinciding with the Federal Reserve’s (Fed) decision to raise rates, stocks are tame. This is heading into midterm elections, today, and inflation updates, Thursday.
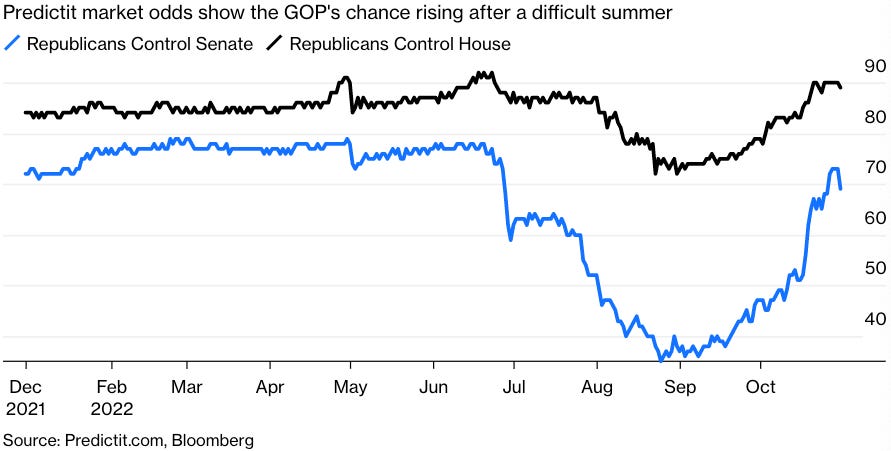
Graphic: Retrieved from Bloomberg. Created by JPMorgan Chase & Co (NYSE: JPM).
Republicans are likely to add to their control of the House and Senate.
Having fewer Democrats in Congress would lower “the odds of fiscal measures [that would] embolden a hawkish Federal Reserve.”
This is a boon for stocks.
Graphic: Retrieved from Bloomberg. “With things looking that bad, current polls show the Democrats appear to be headed for a drubbing, almost certain to lose control of the House and increasingly likely to see the Senate slip away.”
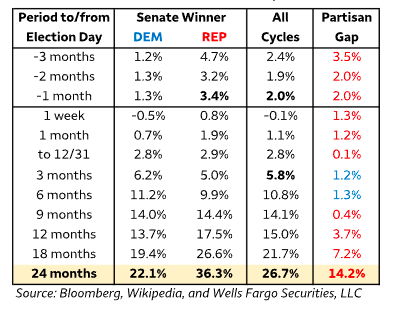
Indeed, Wells Fargo & Co (NYSE: WFC) strategists found a “GOP-controlled Senate historically is associated with superior equity returns.”
Graphic: Retrieved from Wells Fargo & Co (NYSE: WFC).
In spite of recessions, even, the S&P 500, a year after midterms, often netted positive 20% or so returns Citigroup Inc (NYSE: C) strategists add.
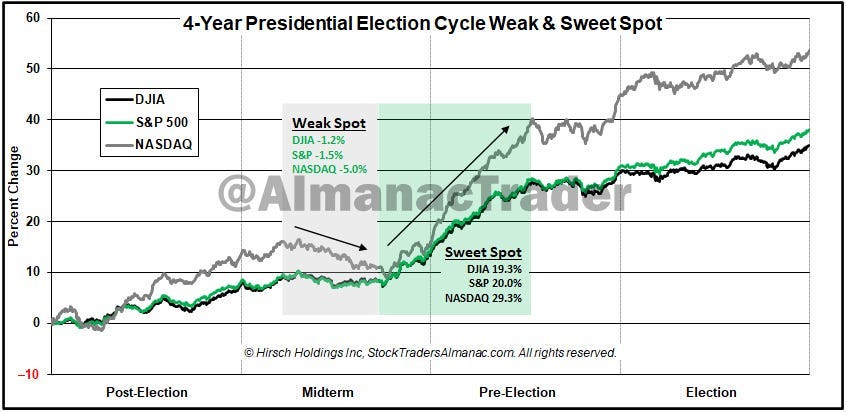
Graphic: Retrieved from Callum Thomas’ Weekly S&P 500 ChartStorm. The “seasonal/cycle outlook is for a lower low or retest of the lows over the next three months as we are in the worst two months of the year and are smack dab in the *Weak Spot* of the 4-Year Cycle”
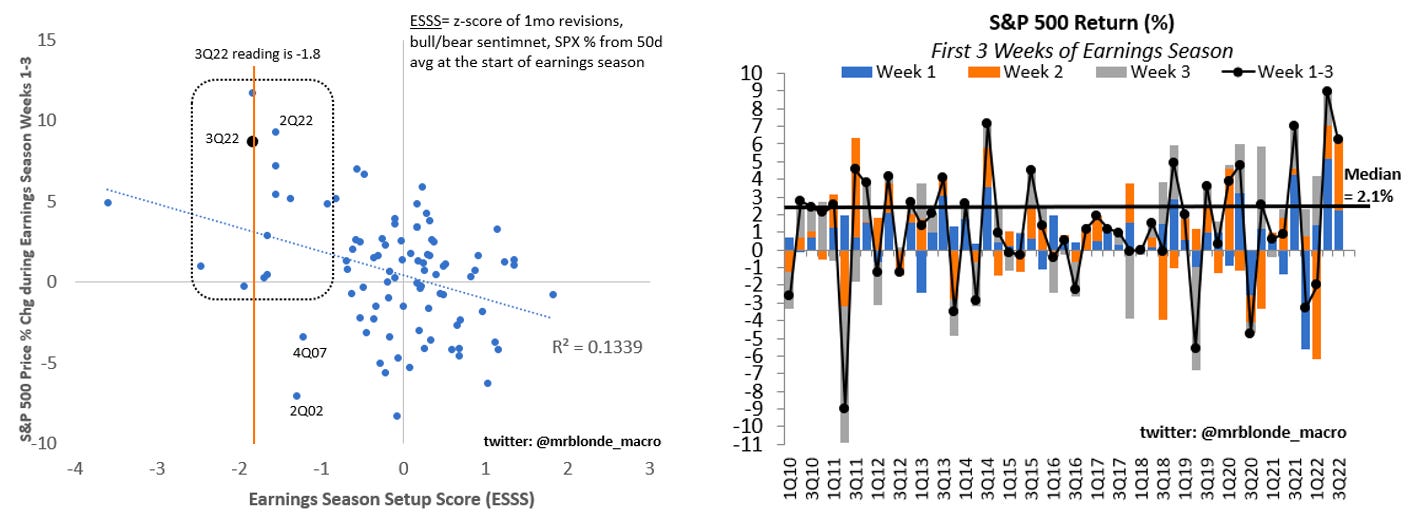
A post-election bump is on top of the general positiveness of equity performance during the earnings season and periods of strong pessimism as we have today.
Graphic: Retrieved from Mr. Blonde’s Stuck in the Middle letter.
Why all the potential positivity over this short period?
The aforementioned events are happening during a period wherein market liquidity eases (i.e., the holiday season).
It’s during this period, from a positioning perspective, the effects of decay (which we discuss more below) accelerate, and a lack of liquidity, according to Kai Volatility’s Cem Karsan, makes markets sensitive to positive-leaning flows.
Pessimism and hedging may indirectly give rise to bullishness. Why is that?
Demand for options exposures, especially across shorter time horizons, evidenced by heightened implied volatility (IVOL) at the front end (see below), has indirectly added to the pressures of de-grossing, as observed.
Though positioning is generally thin, as we also talked about in yesterday’s newsletter, thus reducing the impact of the hedging of this positioning, demand remains “strong,” per Karsan, and “dealers are short that volatility.”
Derivatives strategists at the likes of the Royal Bank of Canada (NYSE: RY) agree with Karsan’s remarks; Amy Wu Silverman said that the Cboe Volatility Index’s (INDEX: VIX) elevation was the result of demand for hedges after October options expiry.
“Part of today’s move at least is a function of new positions. There is likely demand for future months since we just went through October options expiry,” she said. “Part of it is a function of the ‘floor’ of a new volatility regime.”
So, what’s the point to make?
For IVOL measures to remain wound, something bad needs to happen, in short.
Otherwise, per SpotGamma, a “decline in IVOL … can aid in a push-and-pull that actually serves to … resist far-reaching weakness” and keep selling orderly.
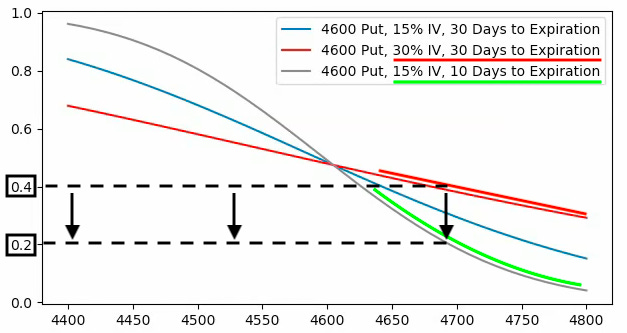
That’s because, from here, the removal of the protection that’s been demanded in the past days and weeks compounds the sped-up effects of Charm.
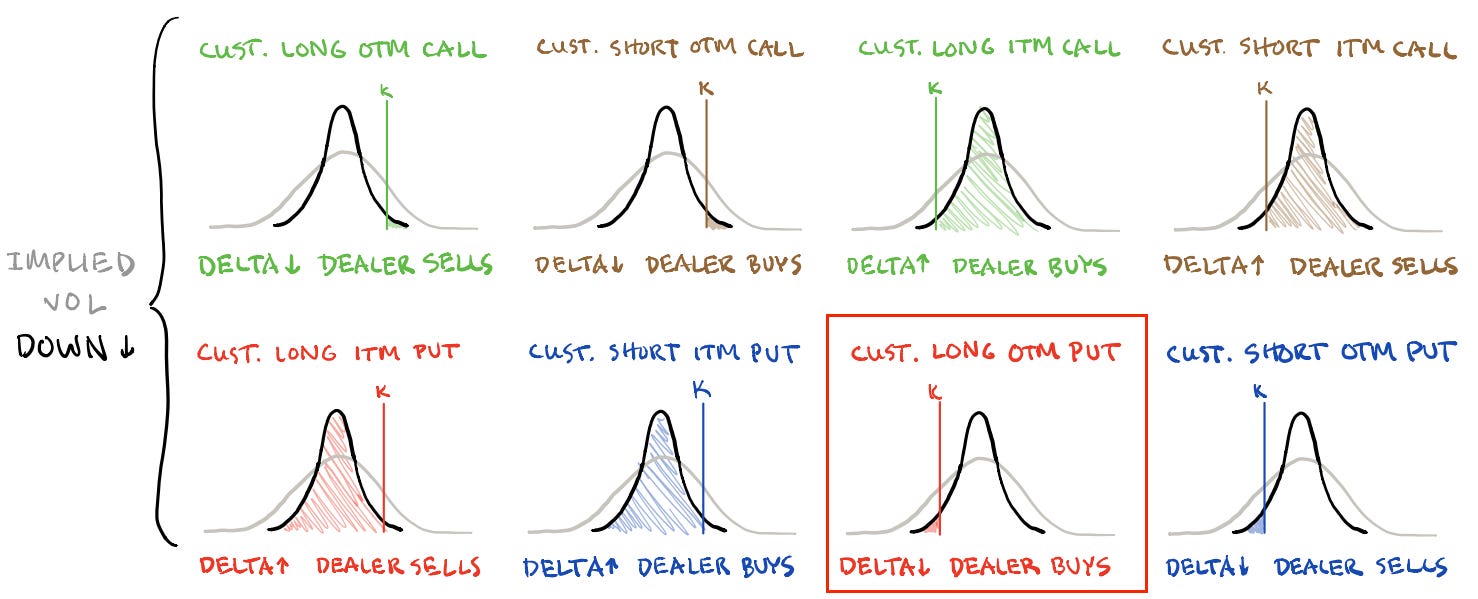
Graphic: Retrieved from SpotGamma. SPX prices X-axis. Option delta Y-axis. When the factors of implied volatility (Vanna) and time change (Charm), hedging ratios change. The graphic is for illustrational purposes, only.
Charm, which is the change in options Delta (i.e., exposure to direction) with respect to changes in time, “drives a positive window or seasonality”; “the reduction in time” and “lack of liquidity” make markets more sensitive to those positive flows.
Graphic: Retrieved from Corey Hoffstein on Twitter.
Technical
As of 6:45 AM ET, Tuesday’s regular session (9:30 AM – 4:00 PM ET), in the S&P 500, is likely to open in the upper part of a positively skewed overnight inventory, just outside of prior-range and -value, suggesting a limited potential for immediate directional opportunity.
In the best case, the S&P 500 trades higher.
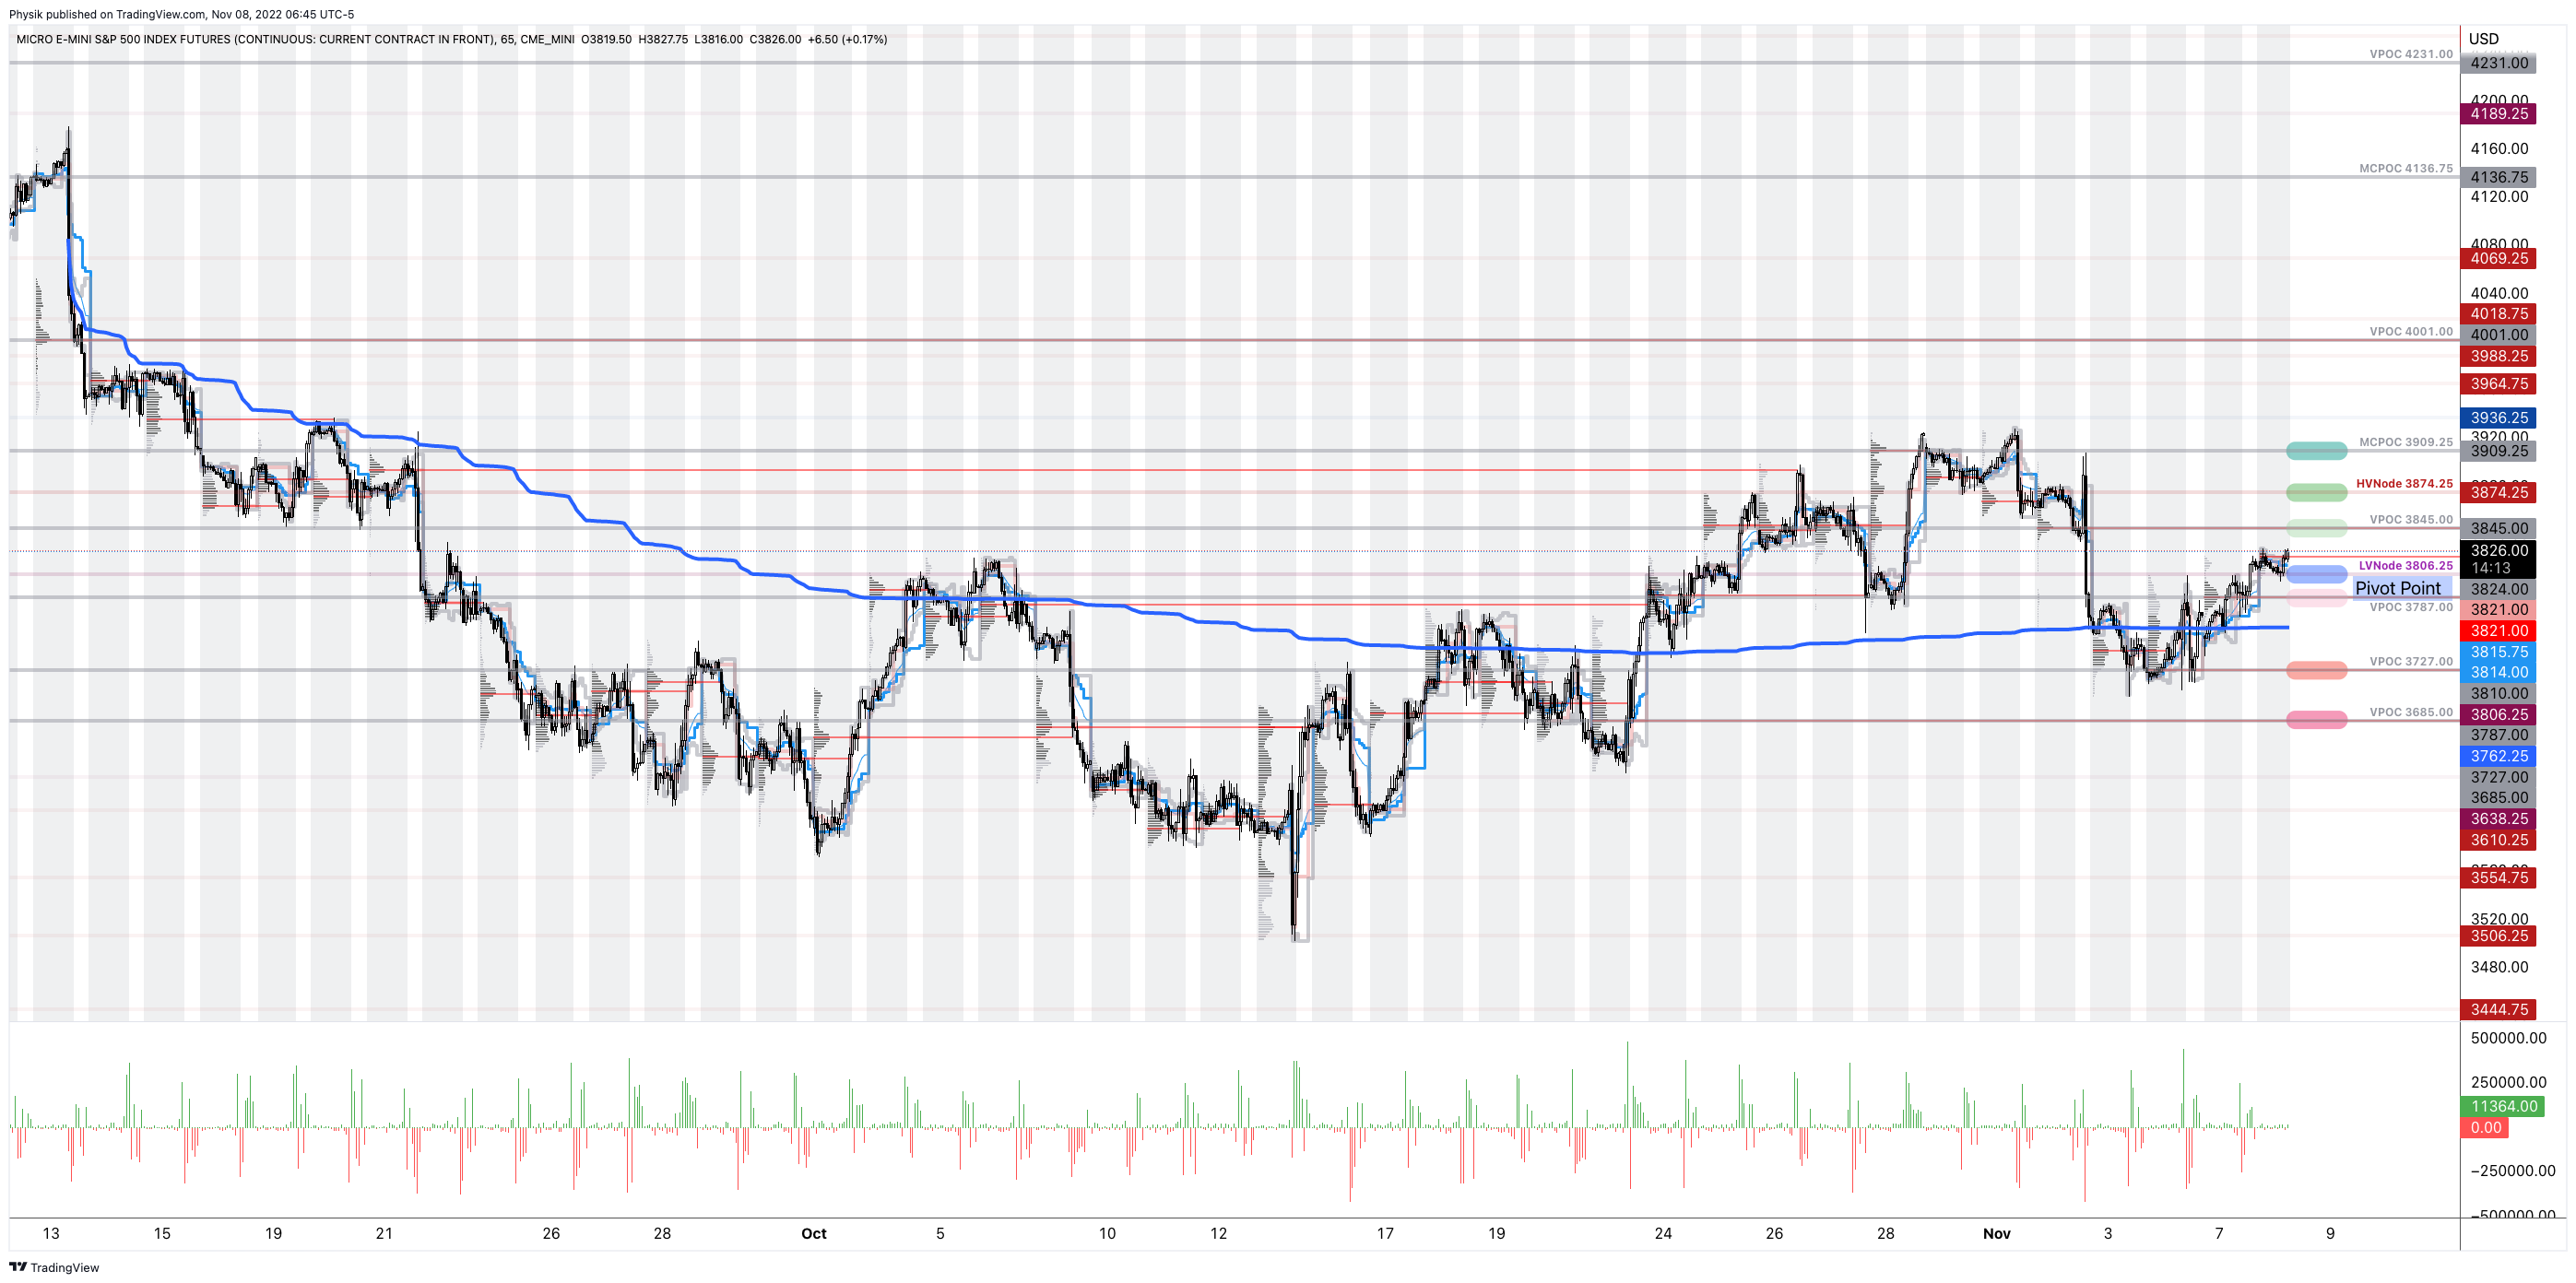
If above the $3,806.25 LVNode, the $3,845.00 VPOC is in play. Initiative trade beyond the latter could reach as high as the $3,874.25 HVNode and $3,909.25 MCPOC, or higher.
In the worst case, the S&P 500 trades lower.
If above the $3,806.25 LVNode, the $3,787.00 VPOC is in play. Initiative trade beyond the latter could reach as low as the $3,727.00 and $3,685.00 VPOC, or lower.
Click here to load today’s key levels into the web-based TradingView charting platform. Note that all levels are derived using the 65-minute timeframe. New links are produced, daily.
Graphic: 65-minute profile chart of the Micro E-mini S&P 500 Futures.
Considerations: Futures tied to the S&P 500 are trading within close proximity to a blue line in the above graphic. This blue line depicts a volume-weighted average price (VWAP) anchored to price action following the release of consumer price data on September 13, 2022.
The VWAP metric is highly regarded by chief investment officers, among other participants, for the quality of trade. Additionally, liquidity algorithms are benchmarked and programmed to buy and sell around VWAPs.
Should the S&P 500 auction away from this level, and come back to it, a prudent response is to fade. If the price is above the VWAP, and it auctions lower, into the VWAP, traders would buy. On the other hand, if the price is below the VWAP, and it auctions higher, into the VWAP, sell.
At this time, the S&P 500 is near VWAP offering traders lower (directional) opportunities.
Definitions
Volume Areas: A structurally sound market will build on areas of high volume (HVNodes). Should the market trend for long periods of time, it will lack sound structure, identified as low volume areas (LVNodes). LVNodes denote directional conviction and ought to offer support on any test.
If participants were to auction and find acceptance into areas of prior low volume (LVNodes), then future discovery ought to be volatile and quick as participants look to HVNodes for favorable entry or exit.
Gamma: Gamma is the sensitivity of an option to changes in the underlying price. Dealers that take the other side of options trades hedge their exposure to risk by buying and selling the underlying. When dealers are short-gamma, they hedge by buying into strength and selling into weakness. When dealers are long-gamma, they hedge by selling into strength and buying into weakness. The former exacerbates volatility. The latter calms volatility.
Vanna: The rate at which the delta of an option changes with respect to volatility.
Charm: The rate at which the delta of an option changes with respect to time.
POCs: POCs are valuable as they denote areas where two-sided trade was most prevalent in a prior day session. Participants will respond to future tests of value as they offer favorable entry and exit.
MCPOCs: POCs are valuable as they denote areas where two-sided trade was most prevalent over numerous day sessions. Participants will respond to future tests of value as they offer favorable entry and exit.
About
After years of self-education, strategy development, mentorship, and trial-and-error, Renato Leonard Capelj began trading full-time and founded Physik Invest to detail his methods, research, and performance in the markets.
Capelj also develops insights around impactful options market dynamics at SpotGamma and is a Benzinga reporter.
In no way should the materials herein be construed as advice. Derivatives carry a substantial risk of loss. All content is for informational purposes only.
The daily brief is a free glimpse into the prevailing fundamental and technical drivers of U.S. equity market products. Join the 990+ that read this report daily, below!
Graphic updated 9:20 AM ET. Sentiment Risk-On if expected /ES open is above the prior day’s range. /ES levels are derived from the profile graphic at the bottom of the following section. Levels may have changed since initially quoted; click here for the latest levels. SqueezeMetrics Dark Pool Index (DIX) and Gamma (GEX) calculations are based on where the prior day’s reading falls with respect to the MAX and MIN of all occurrences available. A higher DIX is bullish. At the same time, the lower the GEX, the more (expected) volatility. Learn the implications of volatility, direction, and moneyness. Breadth reflects a reading of the prior day’s NYSE Advance/Decline indicator. VIX reflects a current reading of the CBOE Volatility Index (INDEX: VIX) from 0-100.
Fundamental
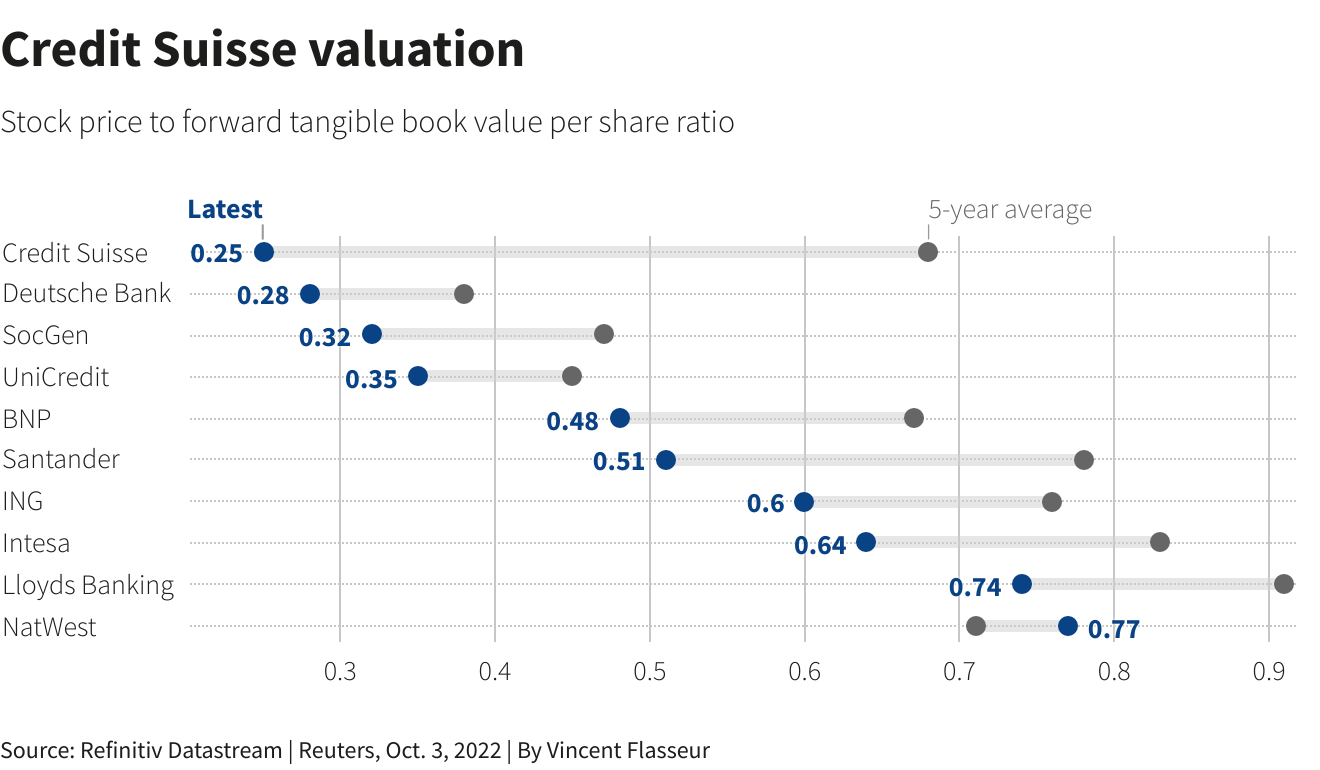
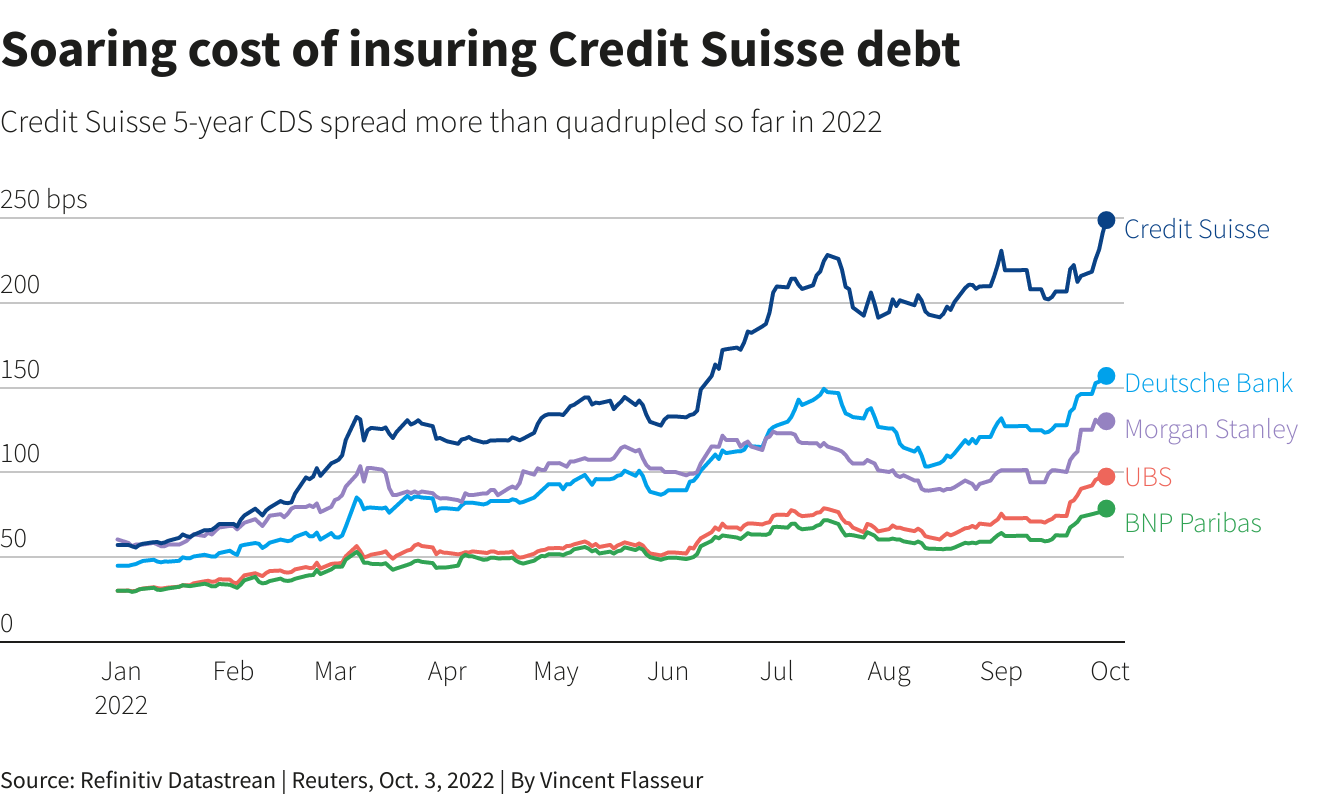
Fresh and top of mind, still, is the Credit Suisse Group AG (NYSE: CS) debacle. However, despite the bank’s “critical moment,” as discussed in yesterday’s letter, credit default swap (CDS) levels, though still rising, are “far from distressed.”
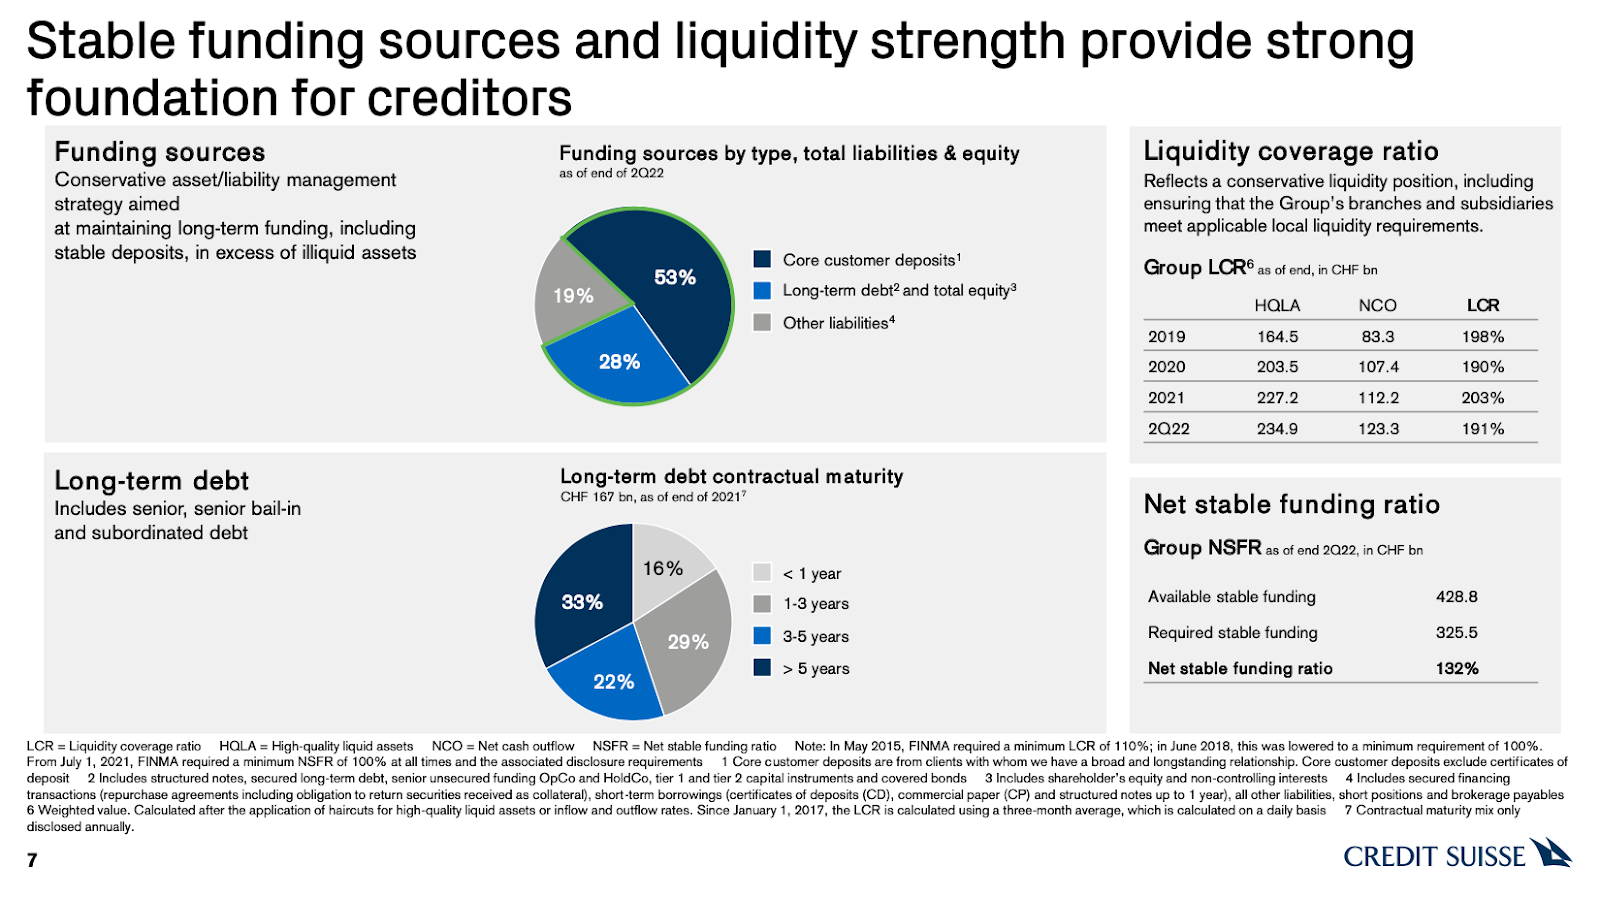
Adding, not reflected by the stock is a “strong capital base and liquidity position,” per CS.
Graphic: Retrieved from Credit Suisse Group AG (NYSE: CS).
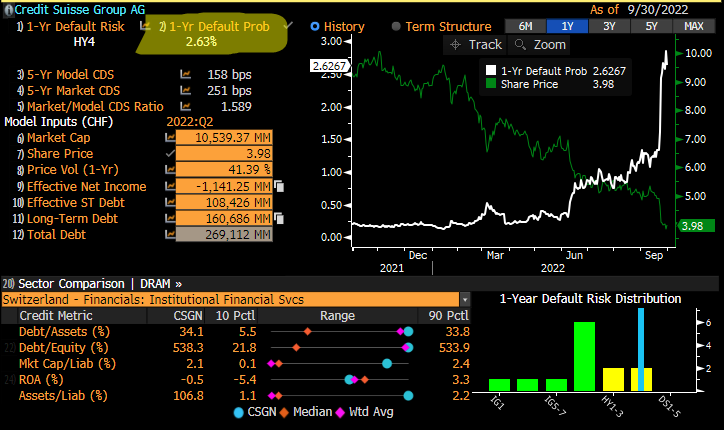
A big topic speculated on was CS’ probability of default. At its core, CDS spreads relate to the probability of default in the following way, per Deutsche Bank AG (NYSE: DB) research:
(CDS Spread) / (1 – Recovery Rate) = Implied Probability Of Default.
The recovery rate is basically the (estimated) amount of a loan that will be repaid in the case of a bankruptcy or default. Per European Central Bank research, “the standard recovery rate used by the industry in price calculations is 40%.”
Roughly speaking, below is a quick calculation:
250 basis points / (1 – 0.40) = 416.67 basis points = 4.17% Implied Probability Of Default
In CS’ case, if the spread is 250 basis points, assuming a 40% recovery, that’s a 4.17% default probability implied. If the spread was at 150 basis points, then, assuming a 40% recovery, that’s a 2.5% chance of default.
Graphic: Taken from @EffMktHype who retrieved from Bloomberg. “So many [Bloomberg] screenshots of CS CDS levels and talking about massive default prob numbers. Zero people actually using [the] same terminal to look at default risk screen.”
Taken together, in short, similar to as we put forth, yesterday, “[t]his is not 2008,” per Citigroup Inc’s (NYSE: C) Andrew Coombs. Bloomberg adds that Morgan Stanley (NYSE: MS) faced its own credit spread debacle during 2011 European debt exposure rumors; “it took months for the price of the default swaps to fall as the feared losses never materialized.”
Ahead of an October 27 CS review covering topics including “a large-scale investment banking retreat, … [i]nvestors are worried about how much the bank will [have to] cover” a restructuring.
Bloomberg adds: “A sale of Credit Suisse’s structured-products group, which trades securitized debt, has attracted interest from potential buyers, … [amid] rising interest rates.”
Per UBS Group AG (NYSE: UBS) research, a sale of such businesses, which may be worth more than the market is currently implying, “could help to avoid a dilutive capital increase.”
Positioning
“Month-end portfolio rebalances and [the] expiration of quarterly option strategies [acted] in support of the market,” JPMorgan Chase & Co’s (NYSE: JPM) Marko Kolanovic stated in a September 30, 2022 commentary titled “Throwing rocks in glass houses.”
In that same commentary, Kolanovic eased support for his 2022 price targets on economic volatility led by central banks, the war in Europe, and beyond.
As stated last week, per Kai Volatility’s Cem Karsan, it’s the case that the removal of options strategies and potential supply of protection (as investors further come to the realization that options protection has done little to protect against downside) may provide markets a boost.
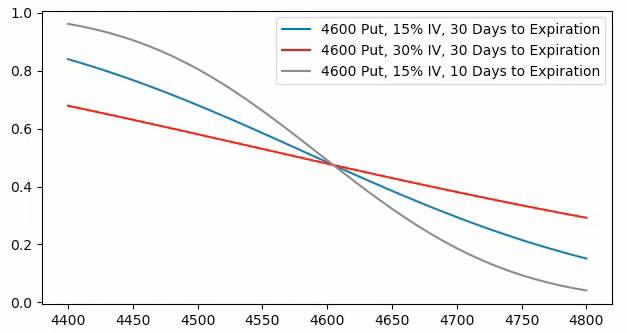
Graphic: Taken from @Alpha_Ex_LLC who retrieved from Bloomberg. S&P 500 (INDEX: SPX) October put option lower in price and volatility.
Ultimately, though, a final resolution would be “tied to the incremental effects on liquidity,” (e.g., QT manifesting itself as “$4.5 billion less in demand for assets per day,” and buyback blackout) while options repositioning may make the case for increased fragility, as traders’ falling demand for put protection opens the door to less supportive hedging flows with respect to time (Charm) and volatility (Vanna) changes.
Therefore, trades such as the Short Ratio Put Spread, particularly if narrower, may be far riskier to employ into the end of this year and the middle half of next year. For context, this was a trade to have on this year.
As participants continue to make the aforementioned realizations and supply to the market put (downside protection), tails may “continue to be cheap,” and discount “crash risk,” according to The Ambrus Group’s Kris Sidial.
A lot more to resolve this jumbled mess of a newsletter in the coming days.
Technical
As of 9:10 AM ET, Tuesday’s regular session (9:30 AM – 4:00 PM ET), in the S&P 500, is likely to open in the upper part of a positively skewed overnight inventory, outside of prior-range and -value, suggesting a potential for immediate directional opportunity.
In the best case, the S&P 500 trades higher.
Any activity above the $3,771.25 HVNode puts into play the $3,826.25 HVNode. Initiative trade beyond the last-mentioned could reach as high as the $3,862.25 HVNode and $3,893.00 VPOC, or higher.
In the worst case, the S&P 500 trades lower.
Any activity below the $3,771.25 HVNode puts into play the $3,722.50 LVNode. Initiative trade beyond the LVNode could reach as low as the $3,671.00 VPOC and $3,610.75 HVNode, or lower.
Click here to load today’s key levels into the web-based TradingView charting platform. Note that all levels are derived using the 65-minute timeframe. New links are produced, daily.
Graphic: 65-minute profile chart of the Micro E-mini S&P 500 Futures.
Definitions
Volume Areas: A structurally sound market will build on areas of high volume (HVNodes). Should the market trend for long periods of time, it will lack sound structure, identified as low volume areas (LVNodes). LVNodes denote directional conviction and ought to offer support on any test.
If participants were to auction and find acceptance into areas of prior low volume (LVNodes), then future discovery ought to be volatile and quick as participants look to HVNodes for favorable entry or exit.
POCs: POCs are valuable as they denote areas where two-sided trade was most prevalent in a prior day session. Participants will respond to future tests of value as they offer favorable entry and exit.
Vanna: The rate at which the delta of an option changes with respect to volatility.
Charm: The rate at which the delta of an option changes with respect to time.
About
After years of self-education, strategy development, mentorship, and trial-and-error, Renato Leonard Capelj began trading full-time and founded Physik Invest to detail his methods, research, and performance in the markets.
Capelj also develops insights around impactful options market dynamics at SpotGamma and is a Benzinga reporter.
In no way should the materials herein be construed as advice. Derivatives carry a substantial risk of loss. All content is for informational purposes only.
The daily brief is a free glimpse into the prevailing fundamental and technical drivers of U.S. equity market products. Join the 950+ that read this report daily, below!
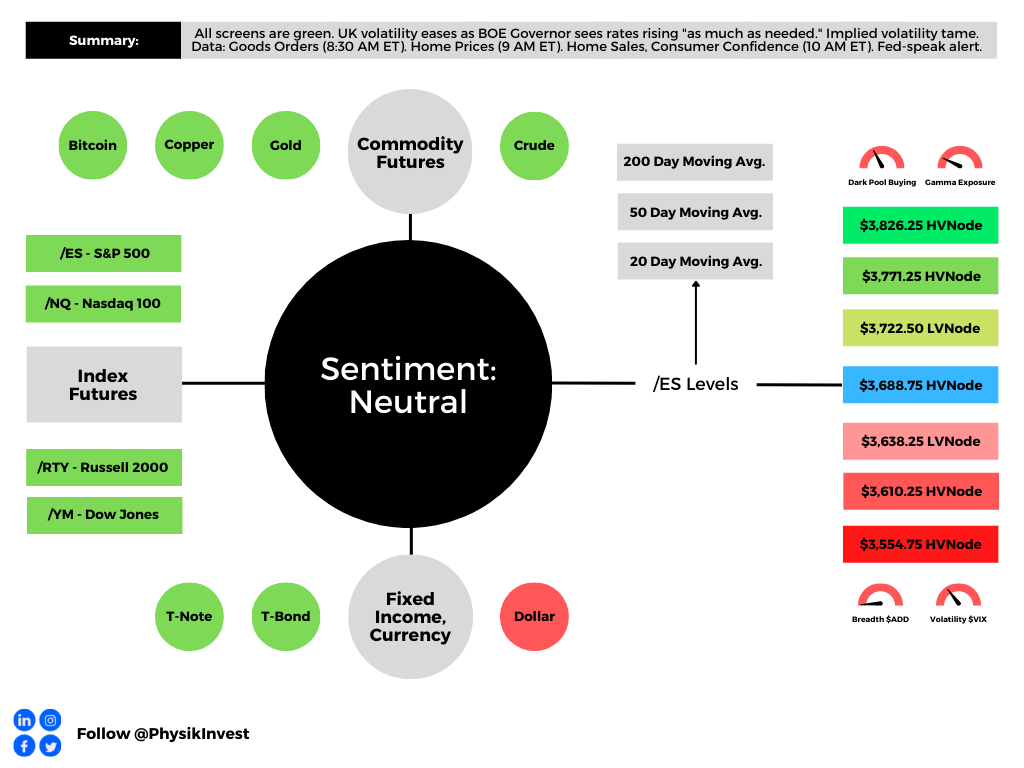
Graphic updated 6:45 AM ET. Sentiment Neutral if expected /ES open is inside of the prior day’s range. /ES levels are derived from the profile graphic at the bottom of the following section. Levels may have changed since initially quoted; click here for the latest levels. SqueezeMetrics Dark Pool Index (DIX) and Gamma (GEX) calculations are based on where the prior day’s reading falls with respect to the MAX and MIN of all occurrences available. A higher DIX is bullish. At the same time, the lower the GEX, the more (expected) volatility. Learn the implications of volatility, direction, and moneyness. Breadth reflects a reading of the prior day’s NYSE Advance/Decline indicator. VIX reflects a current reading of the CBOE Volatility Index (INDEX: VIX) from 0-100.
Fundamental
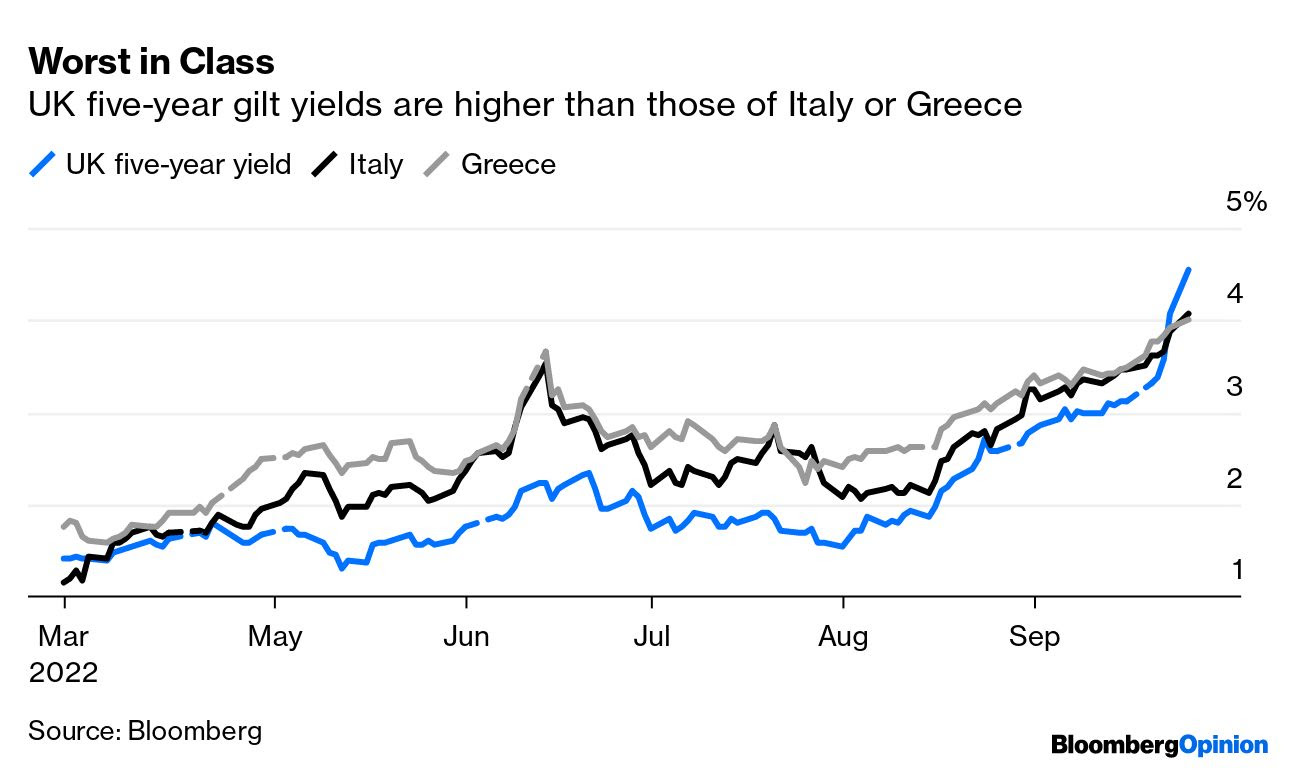
Top of mind, yesterday, was the drop in Britain’s currency (GBP) and a surge in bond yields on the back of new fiscal plans and pledged tax cuts, alongside a more easy pace of interest rate hikes by the Bank of England (BoE). See the Daily Brief for September 26, 2022, for context.
Graphic: Retrieved from Bloomberg.
Knowing that the fiscal stimulus and an easy-moving BoE would add to inflation that is already high and sticky, traders began pricing emergency rate hikes, all the while conversation around the impacts of the UK’s rising rates on mortgage lending and the “dollar doom loop” surfaced.
In response, the BoE’s Governor Andrew Bailey said they were “monitoring developments in financial markets,” and at the “next scheduled meeting of the impact on demand and inflation from the Government’s announcement, and the fall in sterling, … [t]he MPC [won’t] hesitate to change interest rates by as much as needed to return inflation to the 2% target.”
Per Citigroup Inc (NYSE: C), however, “[m]onetary policy will struggle to save FX when fiscal policy is the culprit.”
Lawrence Henry Summers, a former US Secretary of the Treasury, also commented that he “would not be amazed if British short rates more than triple in the next two years and reach levels above 7 percent.”
That’s “because US rates are now projected to approach 5 percent and Britain, [which] has much more serious inflation, is pursuing more aggressive fiscal expansion and has larger financing challenges.”
On the topic of rising yields and lenders’ disinterest to issue mortgages, among other things, it is the case that bond buying, via tools such as quantitative easing (QE), left room for confidence to eventually run out and the bond market to revolt.
Read our monetary policy explainers published on September 19 and 20.
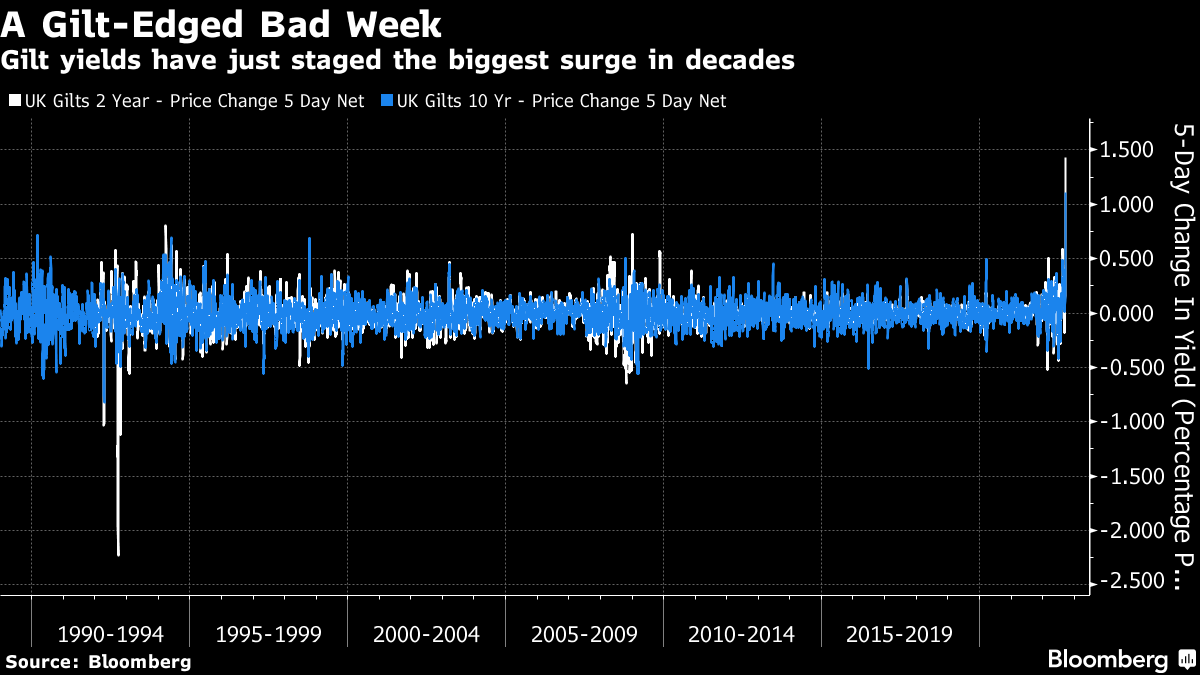
Per statements authored by Bloomberg’s John Authers, the “UK appears to be the first case of a true disorderly bond selloff, where the moves are so swift that they affect the functioning of the financial system. It’s been triggered by a combination of inflation and rash fiscal policy.”
Accordingly, the actions by policymakers abroad serve to reinforce the earlier discussed “dollar doom loop”; the rising USD, though reducing the impact of inflation in the US, ultimately hurts most dollar-denominated debt servicing (see Latin America in the 1980s).
So, “less support from Vanna and Charm, less support through QT, and less buyback,” presents a “fragile moment” with the next week representing the most “dangerous period” on record.
Graphic: Retrieved from SpotGamma. “SPX prices X-axis. Option delta Y-axis. When the factors of implied volatility (Vanna) and time change (Charm), hedging ratios change. The graphic is for illustrational purposes, only.”
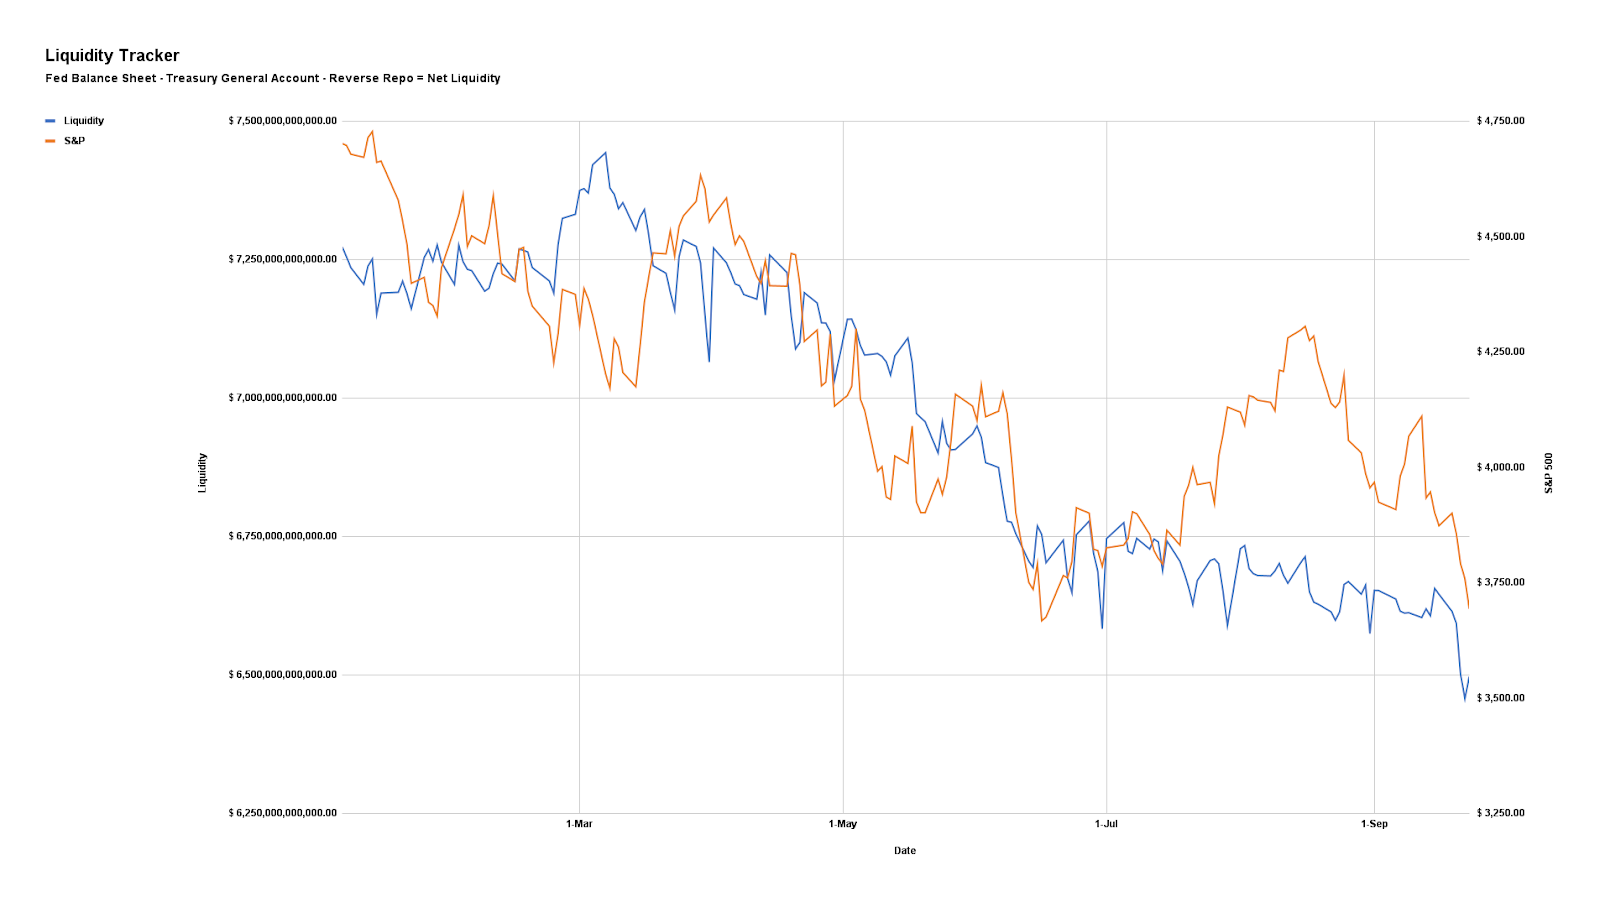
For context, it is the impacts of quantitative tightening (QT) which is manifesting itself as “$4.5 billion less in demand for assets per day,” as well as the blackout period for buybacks (which were consistently “supporting the market”) and options repositioning bolstering the weakness.
Graphic: Via Physik Invest. Data compiled by @jkonopas623. Fed Balance Sheet data, here. Treasury General Account Data, here. Reverse Repo data, here. NL = BS – TGA – RRP.
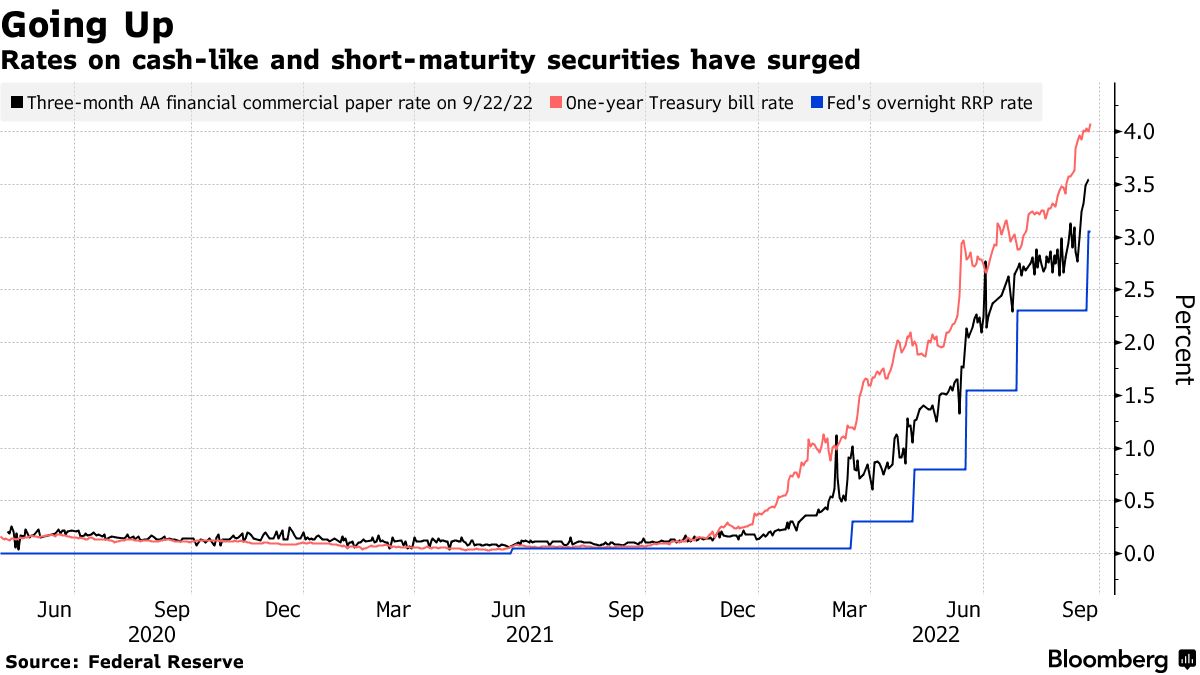
Separately, a hot topic concerns the money that is piling into money funds where “the vast bulk now earns upwards of 2%, with pockets paying 3%, 4% or more.”
Graphic: Retrieved from Bloomberg. “Money funds, banks, and others are so flush with cash these days that they’re shoveling record amounts into the Fed’s overnight reverse repurchase agreement facility, a short-term instrument that, following the central bank’s 75 basis point hike last week, now pays a rate of 3.05%.”
The theory is as follows: if “cash is yielding 4%, why not just sit in cash while the macro environment clarifies a little bit?”
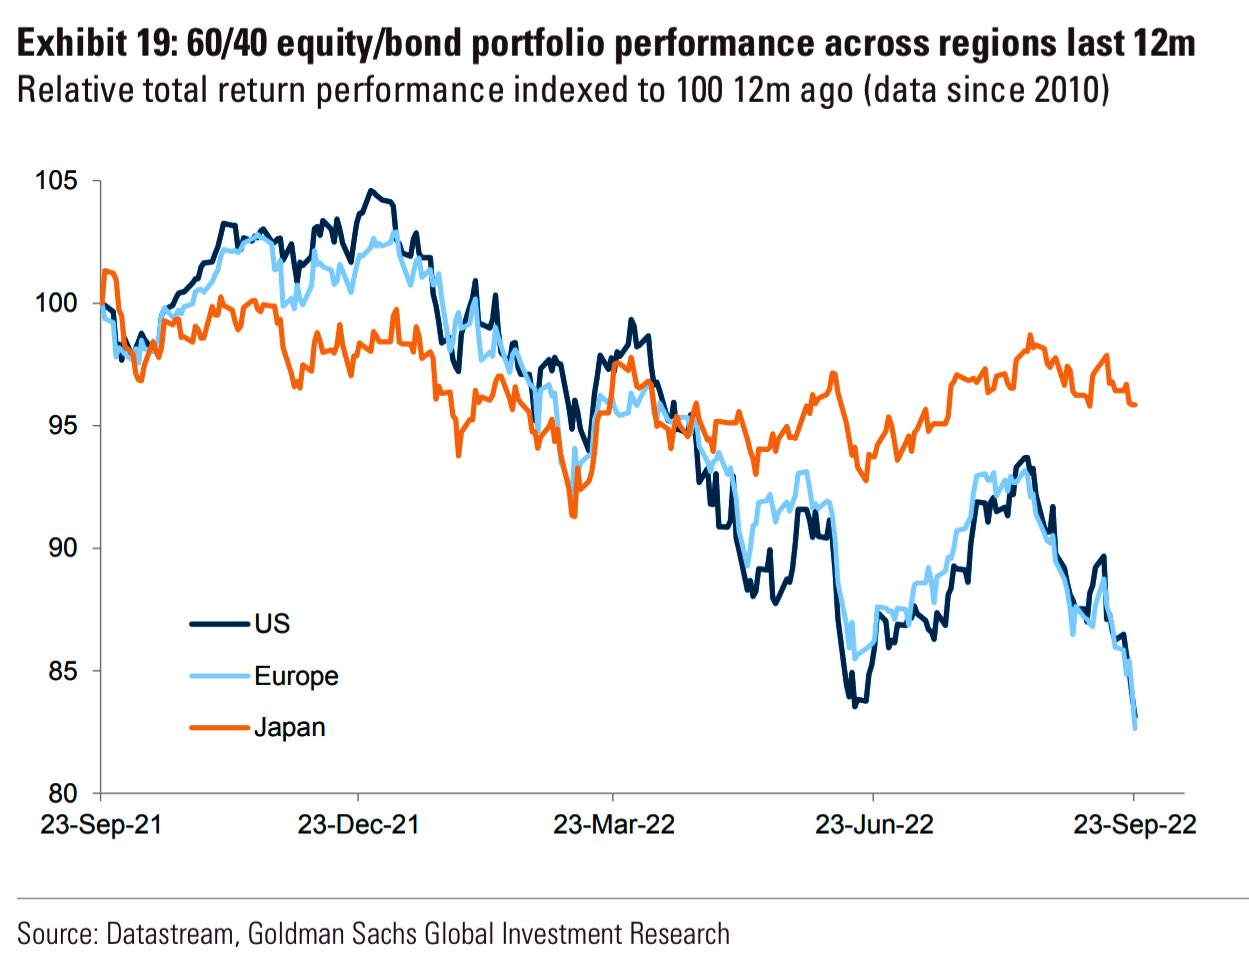
With traditional 60/40 upended, and the gap “between what banks are paying on deposits and what money-market funds are offering” widening, “money funds are likely to attract more inflows going forward as a result, pushing [the] usage of the RRP facility even higher.”
Graphic: Retrieved from Goldman Sachs Group Inc (NYSE: GS).
This is all, however, money that is waiting to be deployed, “should market sentiment improve, or asset prices tumble to levels too attractive to pass up.”
Should you, too, desire to pursue guaranteed rates of return, last week Box Spreads were put forth as a solution. These trades “allow market participants to create a loan structure similar to a Treasury bill.” Upon maturity, the Box Spread earns a competitive interest rate.
As of 6:30 AM ET, Tuesday’s regular session (9:30 AM – 4:00 PM ET), in the S&P 500, is likely to open in the middle part of a positively skewed overnight inventory, inside of prior-range and -value, suggesting a limited potential for immediate directional opportunity.
In the best case, the S&P 500 trades higher.
Any activity above the $3,688.75 HVNode puts into play the $3,722.50 LVNode. Initiative trade beyond the LVNode could reach as high as the $3,771.25 and $3,826.25 HVNode, or higher.
In the worst case, the S&P 500 trades lower.
Any activity below the $3,688.75 HVNode puts into play the $3,638.25 LVNode. Initiative trade beyond the LVNode could reach as low as the $3,610.75 and $3,554.75 HVNode, or lower.
Click here to load today’s key levels into the web-based TradingView charting platform. Note that all levels are derived using the 65-minute timeframe. New links are produced, daily.
Graphic: 65-minute profile chart of the Micro E-mini S&P 500 Futures.
Definitions
Volume Areas: A structurally sound market will build on areas of high volume (HVNodes). Should the market trend for long periods of time, it will lack sound structure, identified as low volume areas (LVNodes). LVNodes denote directional conviction and ought to offer support on any test.
If participants were to auction and find acceptance into areas of prior low volume (LVNodes), then future discovery ought to be volatile and quick as participants look to HVNodes for favorable entry or exit.
Vanna: The rate at which the delta of an option changes with respect to volatility.
Charm: The rate at which the delta of an option changes with respect to time.
About
After years of self-education, strategy development, mentorship, and trial-and-error, Renato Leonard Capelj began trading full-time and founded Physik Invest to detail his methods, research, and performance in the markets.
Capelj also develops insights around impactful options market dynamics at SpotGamma and is a Benzinga reporter.
In no way should the materials herein be construed as advice. Derivatives carry a substantial risk of loss. All content is for informational purposes only.
The daily brief is a free glimpse into the prevailing fundamental and technical drivers of U.S. equity market products. Join the 300+ that read this report daily, below!
Graphic updated 6:30 AM ET. Sentiment Risk-On if expected /ES open is above the prior day’s range. /ES levels are derived from the profile graphic at the bottom of the following section. Levels may have changed since initially quoted; click here for the latest levels. SqueezeMetrics Dark Pool Index (DIX) and Gamma (GEX) calculations are based on where the prior day’s reading falls with respect to the MAX and MIN of all occurrences available. A higher DIX is bullish. At the same time, the lower the GEX, the more (expected) volatility. Learn the implications of volatility, direction, and moneyness. Breadth reflects a reading of the prior day’s NYSE Advance/Decline indicator. VIX reflects a current reading of the CBOE Volatility Index (INDEX: VIX) from 0-100.
Fundamental
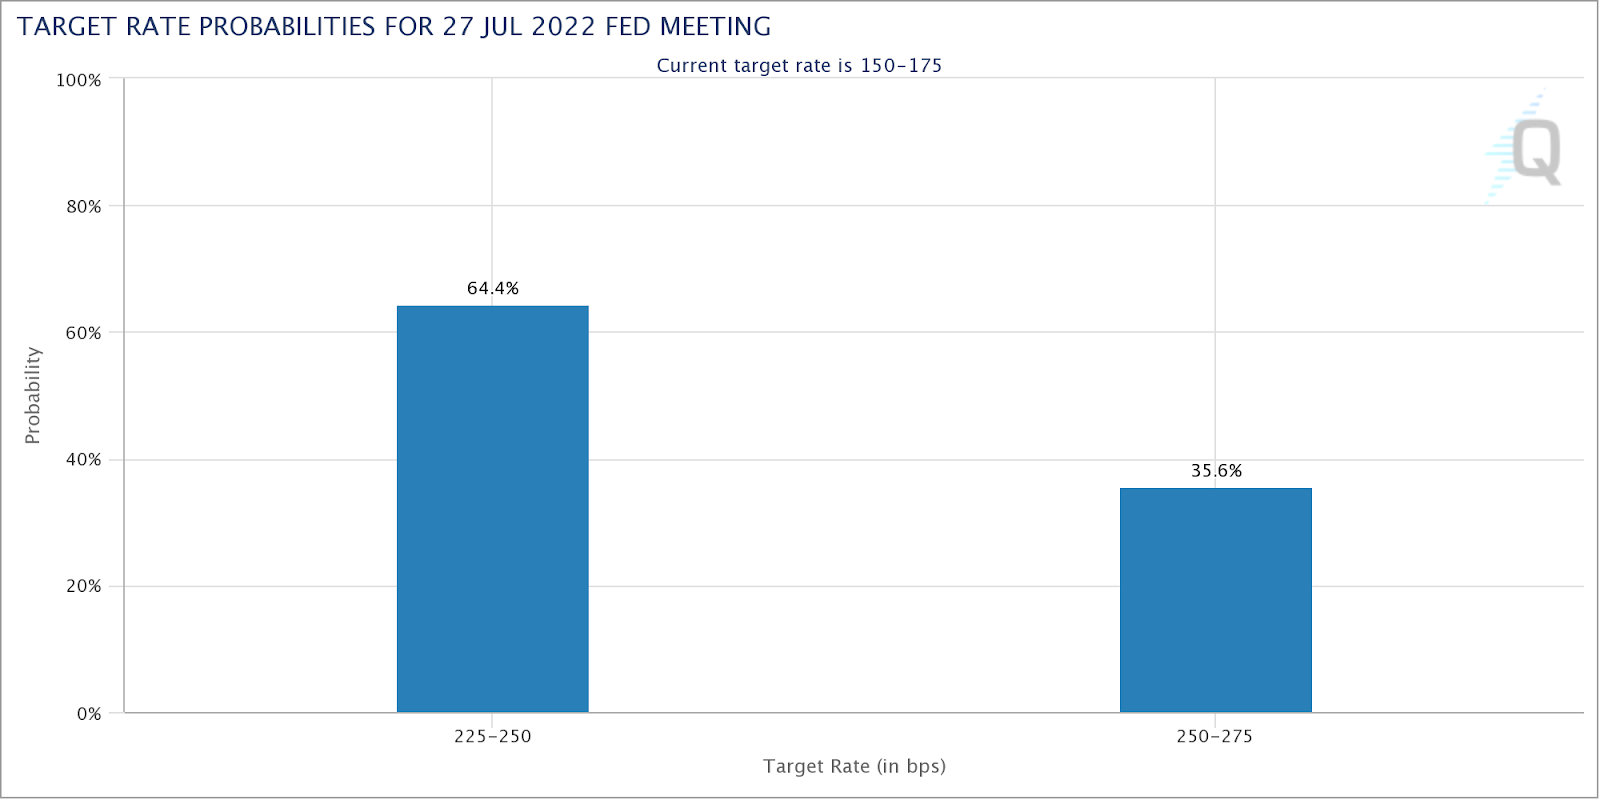
Positivity across most products we monitor in this letter. This is alongside participants’ paring of bets on more aggressive Federal Reserve (Fed) action. It was just last week, right after the CPI dump, that participants were pricing a near-50% chance of a 100 basis point rate hike in July.
That is no longer the case. The odds are 60-40 in favor of a 50 to 75 basis point hike.
Graphic: Via CME Group Inc’s (NASDAQ: CME) FedWatch Tool.
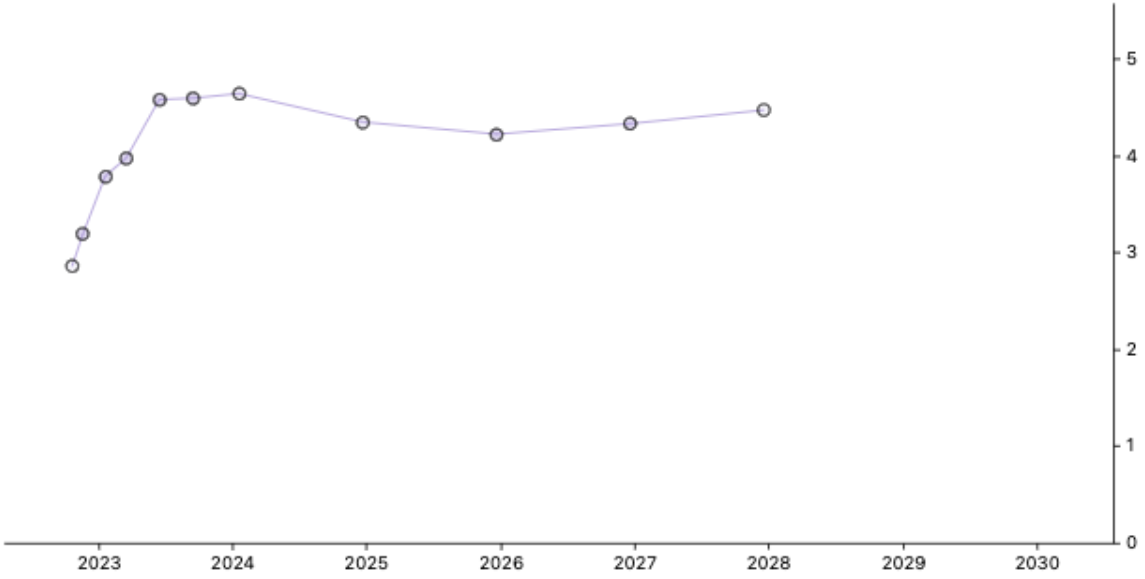
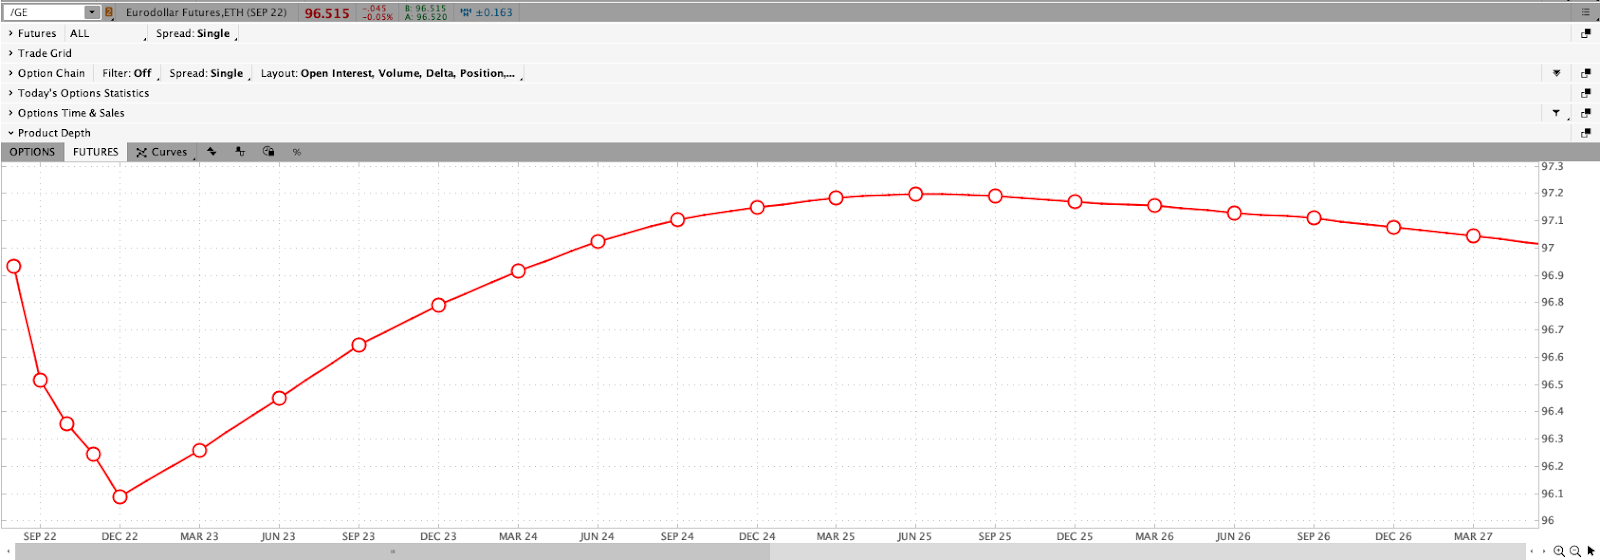
A quick check of the Eurodollar (FUTURE: /GE) curve, a reflection of participants’ outlook on interest rates, we see a peak of the Fed-rate-hike cycle – the terminal rate – near DEC 2022.
Below, we see the overnight rate expected to peak near 3.915% by late 2022.
Graphic: Via Charles Schwab Corporation-owned (NYSE: SCHW) TD Ameritrade’s Thinkorswim.
For context, the price of /GE reflects the interest offered on U.S. dollar-denominated deposits at banks outside of the U.S. With that, they’re “expressed numerically using 100 minus the implied 3-month U.S. dollar LIBOR interest rate,” per Investopedia. This means that at current DEC 2022 prices (96.085), this reflects an implied interest rate settlement rate of 3.915%.
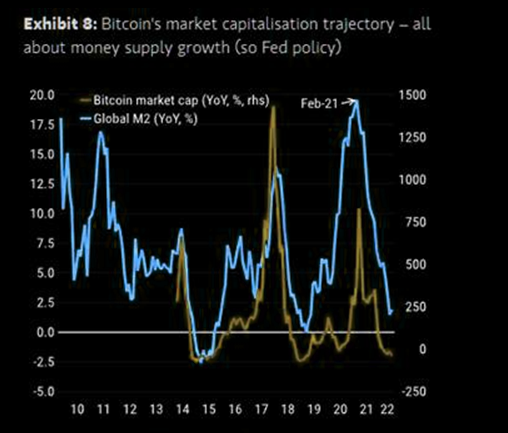
Further, it is policy adjustments that are inflicting damage on some inflated areas of the market like crypto and private equity.
Recall that prevailing monetary policies made it easier to borrow and make longer-duration bets on ideas with a lot of promise in the future. Central banks, too, underwrote losses of this regime and encouraged continued growth. This had consequences on the real economy and asset prices which rose and kept deflationary pressures at bay.
As well put forth in our May 18, 2022 commentary, the recent market rout is a recession and the direct reflection of the unwind of carry. Capital was “misallocated” and the Fed’s move to control price stability is “completely unreasonable” as they’re not in a position to do it “without bringing down the markets,” per Kai Volatility’s Cem Karsan.
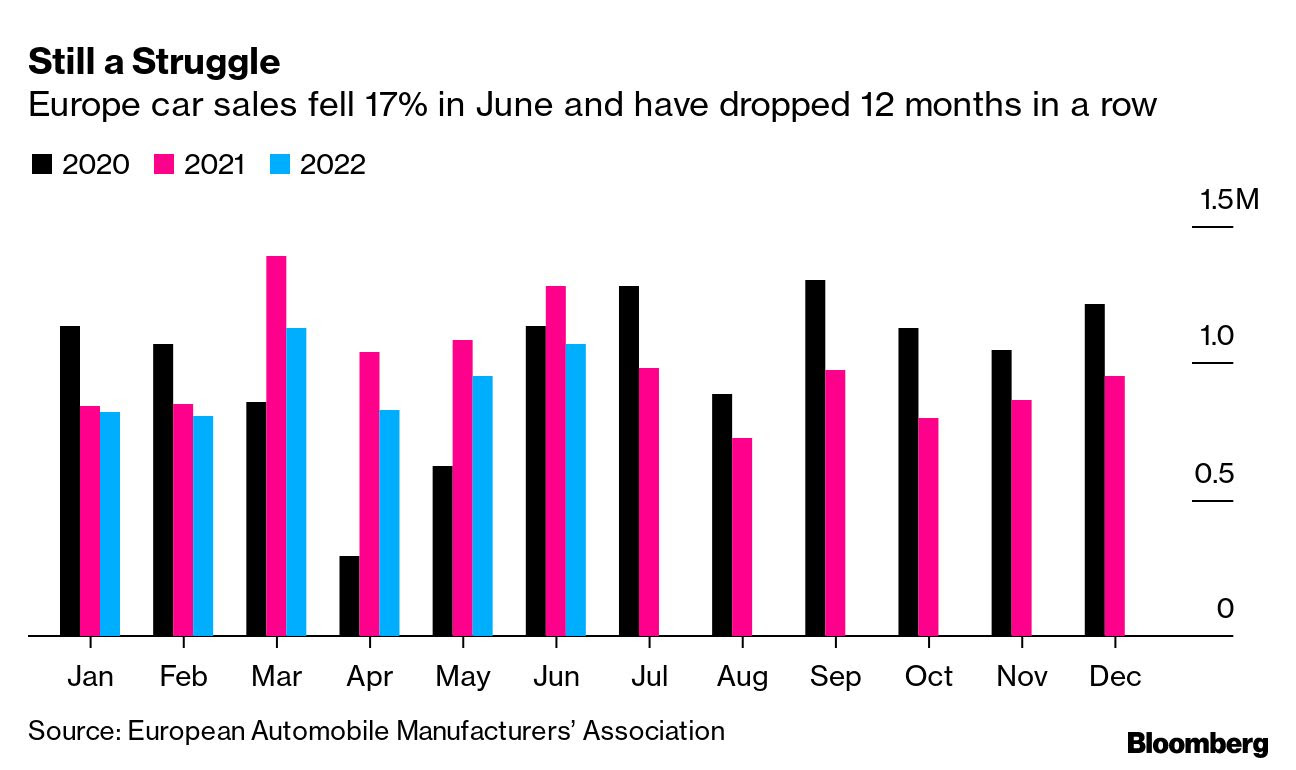
“The bad news is that this looks to be occurring on the back of a slowing in the global consumer’s demand for goods, especially discretionary goods, and thus may also signal rising recession risks.”
Graphic: Via Bloomberg. “Carmakers registered the fewest new vehicles in the European Union since 1996 as persistent supply chain snarls and record inflation afflict the industry. New-car sales in the EU and four other states tracked by the European Automobile Manufacturers’ Association fell 17% to 1.07 million last month, according to a statement. Volkswagen AG was the hardest-hit major carmaker, with registrations dropping 24% from a year ago.”
It is the case that as the “Fed is pursuing demand destruction through negative wealth effects,” it will, ultimately, pivot because “central banks can only deal with nominal [and] not real chokepoints,” according to Credit Suisse Group AG’s (NYSE: CS) Zoltan Pozsar.
The “risk of recession, whether it is real or merely implied by an inversion of the yield curve, won’t deter the Fed from hiking rates higher faster or from injecting more volatility to build up negative wealth effects.”
“Rallies could beget more forceful pushback from the Fed – the new game.”
Please check out the Daily Brief for July 15, 2022. There we summarized, well, the implication of the macro landscape and options positioning.
The summary was that with commodities not offering protection, one has to be concerned if “the flock move[s],” per The Ambrus Group’s Kris Sidial and, ultimately, “if you wanted to go out and hedge, the opportunity is still there in the equity space.”
This is as markets are in a window of “non-strength,” says Karsan in the video below.
Technical
As of 6:30 AM ET, Monday’s regular session (9:30 AM – 4:00 PM ET), in the S&P 500, is likely to open in the upper part of a positively skewed overnight inventory, outside of prior-range and -value, suggesting a potential for immediate directional opportunity.
In the best case, the S&P 500 trades higher.
Any activity above the $3,909.25 MCPOC puts into play the $3,943.25 HVNode. Initiative trade beyond the HVNode could reach as high as the $3,982.75 LVNode and $4,016.25 HVNode, or higher.
In the worst case, the S&P 500 trades lower.
Any activity below the $3,909.25 MCPOC puts into play the $3,857.00 VPOC. Initiative trade beyond the VPOC could reach as low as the $3,829.75 MCPOC and $3,800.75 LVNode, or lower.
Click here to load today’s key levels into the web-based TradingView charting platform. Note that all levels are derived using the 65-minute timeframe. New links are produced, daily.
Graphic: 65-minute profile chart of the Micro E-mini S&P 500 Futures.
Considerations: Responsiveness near key-technical areas (that are discernable visually on a chart), suggests technically-driven traders with short time horizons are very active.
Such traders often lack the wherewithal to defend retests and, additionally, the type of trade may be indicative of the other time frame participants waiting for more information to initiate trades.
Definitions
Volume Areas: A structurally sound market will build on areas of high volume (HVNodes). Should the market trend for long periods of time, it will lack sound structure, identified as low volume areas (LVNodes). LVNodes denote directional conviction and ought to offer support on any test.
If participants were to auction and find acceptance into areas of prior low volume (LVNodes), then future discovery ought to be volatile and quick as participants look to HVNodes for favorable entry or exit.
POCs: POCs are valuable as they denote areas where two-sided trade was most prevalent in a prior day session. Participants will respond to future tests of value as they offer favorable entry and exit.
MCPOCs: POCs are valuable as they denote areas where two-sided trade was most prevalent over numerous day sessions. Participants will respond to future tests of value as they offer favorable entry and exit.
Volume-Weighted Average Prices (VWAPs): A metric highly regarded by chief investment officers, among other participants, for quality of trade. Additionally, liquidity algorithms are benchmarked and programmed to buy and sell around VWAPs.
About
After years of self-education, strategy development, mentorship, and trial-and-error, Renato Leonard Capelj began trading full-time and founded Physik Invest to detail his methods, research, and performance in the markets.
Capelj also develops insights around impactful options market dynamics at SpotGamma and is a Benzinga reporter.
In no way should the materials herein be construed as advice. Derivatives carry a substantial risk of loss. All content is for informational purposes only.
The daily brief is a free glimpse into the prevailing fundamental and technical drivers of U.S. equity market products. Join the 300+ that read this report daily, below!
Graphic updated 7:00 AM ET. Sentiment Risk-Off if expected /ES open is below the prior day’s range. /ES levels are derived from the profile graphic at the bottom of the following section. Levels may have changed since initially quoted; click here for the latest levels. SqueezeMetrics Dark Pool Index (DIX) and Gamma (GEX) calculations are based on where the prior day’s reading falls with respect to the MAX and MIN of all occurrences available. A higher DIX is bullish. At the same time, the lower the GEX, the more (expected) volatility. Learn the implications of volatility, direction, and moneyness. Breadth reflects a reading of the prior day’s NYSE Advance/Decline indicator. VIX reflects a current reading of the CBOE Volatility Index (INDEX: VIX) from 0-100.
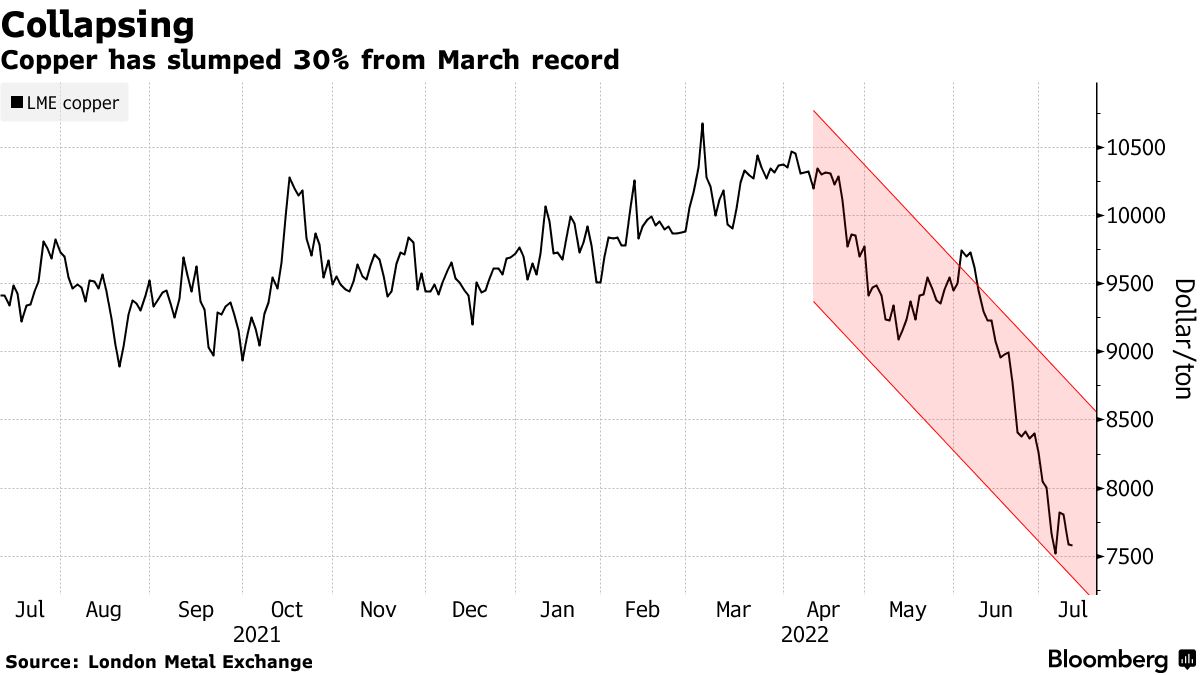
Graphic: Via Bloomberg. Dollar surge, European growth path, waning demand, and increasing supply weigh on copper, a bellwether of the world economy.
A boiling point, if not already, is soon to be reached, in short.
For instance, the energy crisis, which is, in part, the result of earlier capacity erosion, short-term triggers, and panic, is expected to worsen according to the International Energy Agency (IEA).
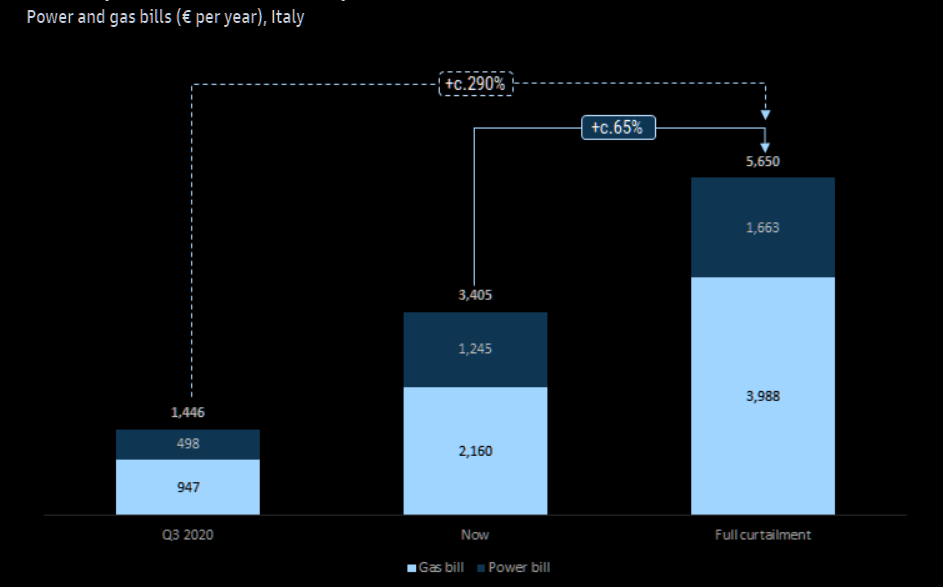
Per Goldman Sachs Group Inc (NYSE: GS), a “full interruption to Russian flows to Europe would be equivalent to a 35% supply shock to the European gas market.”
Graphic: Retrieved via The Market Ear. Via Goldman Sachs Group Inc (NYSE: GS). “[W]e estimate bills would increase by c.65% from here in this event, bringing the total household cost for power and gas to nearly €500/month, creating a meaningful affordability problem. Versus the summer-2020 trough, we estimate that gas/power bills would have increased by nearly 300% on this basis.”
What does this mean for the markets we’re focused on day-to-day in this letter?
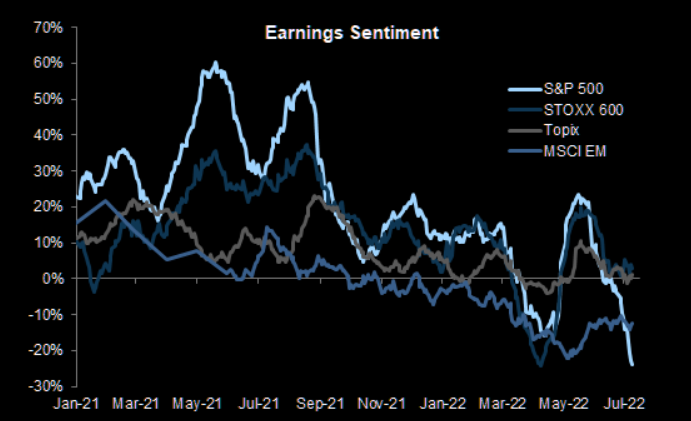
Well – and this is pursuant to the Daily Brief for Monday, July 11 – markets have only suffered through compression in multiples. Does it stop or is there a looming earnings compression?
Most likely there is an earnings compression. For now, it is only sentiment that is taking the hit.
Graphic: Retrieved via The Market Ear. Taken from FactSet Research Systems Inc (NYSE: FDS).
When will the turn occur?
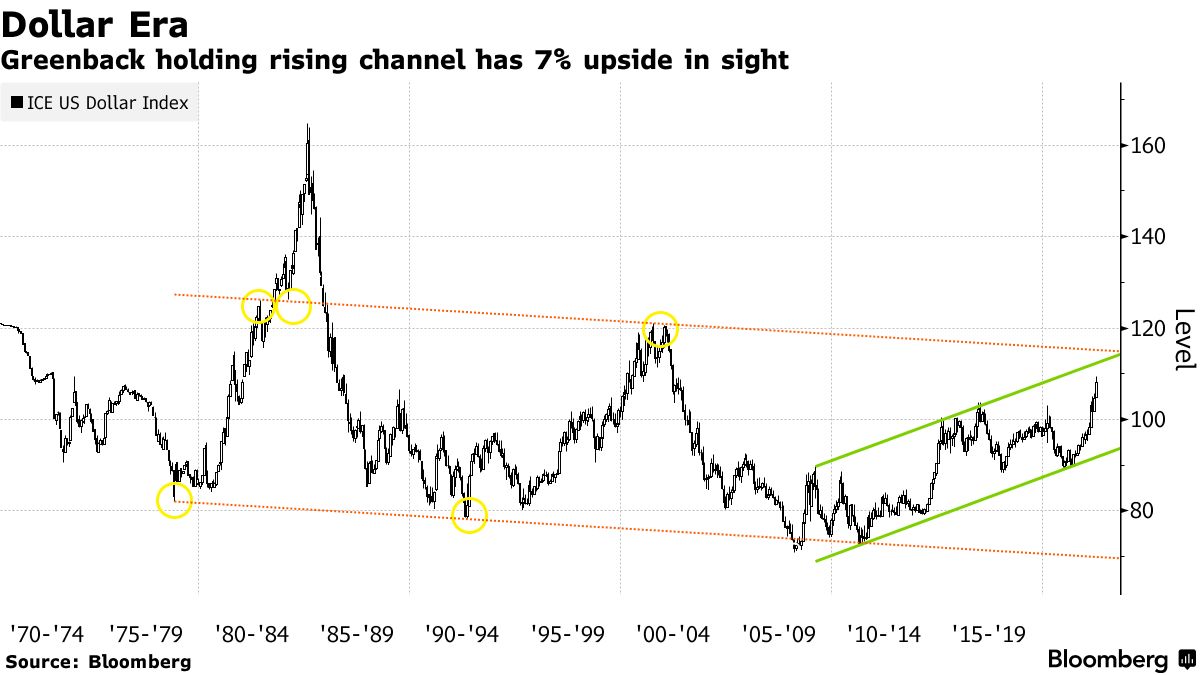
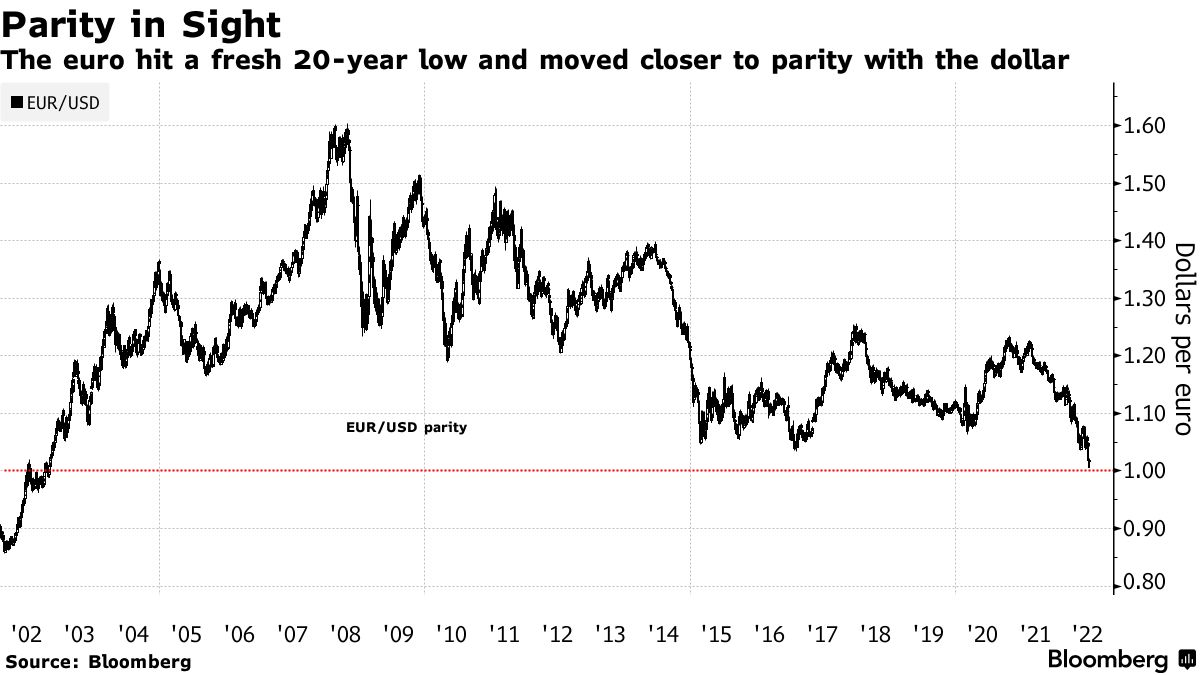
As stated yesterday, it will be the earnings season that is likely to shed clarity on the answer all the while – what is known right now – a strong dollar is for sure to translate into a headwind for S&P 500 earnings growth.
Graphic: Via Bloomberg. The “Fed is still perceived as having more room to hike rates going forward, also on the back of the strong US jobs report for June,” Unicredito SPA (OTC: UNCRY) analysts explained. “On the other hand, other central banks, such as the ECB and the BoE, might be forced to become more prudent, given the more direct exposure their respective economies have to the gas and energy crisis.”
What’s lending to the dollar’s strength?
Let’s start with the following. Participants were extending moneyness to nonmonetary assets, given easy monetary policies and an environment of ample debt and leverage (which cuts into asset price volatility).
Graphic: Retrieved from The Market Ear. Via Morgan Stanley (NYSE: MS).
When the reverse happens – tighter liquidity and credit – and volatility eventually rises, the demand (and competition) for money (or cash) deflates assets.
Graphic: Via Citigroup Inc (NYSE: C). According to Joseph Wang, amidst asset price volatility and bank deposits to drain about $1 trillion or so by year-end, investors will “continue to lower their selling prices to compete for the cash they want.”
It is a deflationary pulse manifesting disinflation in consumer prices, that will prompt the Fed to reverse itself on rates and quantitative tightening (QT).
What does this mean?
Depends on the timeframe.
Though the policy pivot may come alongside a peak in the de-rate markets are experiencing, now, longer-term there are multi-decade trends brewing on the back of the de-globalization pulse, for instance, and a tendency to spend wealth, instead of creating it (as supply chains are replicated here at home), is inflationary which makes the context for a more two-sided market in the future (rather than straight up or down).
With the Fed “still perceived as having more room to hike rates going forward,” per Unicredito SPA (OTC: UNCRY), all the while “other central banks, such as the ECB and the BoE … [are] more prudent, given … the[ir] gas and energy crisis,” short-term dollar strength does more to diminish the global reliance on the U.S.
This is explained even better by Lyn Alden of Lyn Alden Investment Strategy.
The dollar is the dominant currency for carry primarily due to easy monetary policies removing the risk of an ultra-strong dollar. Accordingly, the dollar is “the currency that most offshore debt is denominated in all over the world,” as explained by Bankless, who interviewed Alden.
“Non-US entities make dollar-based loans and transactions in pretty much all markets everywhere because it’s considered more trustworthy than native fiat,” they add. “When there’s a disruption in global cash flows, there’s effectively a short squeeze on the dollar.”
“The stronger the dollar gets in comparison, the less tenable it becomes as a global reserve,” and that is a pressure on the long-term trajectory of that currency.
Positioning
Yesterday’s letter was spot on with respect to positioning.
We can speculate as to where the market may move next, after the release of inflation figures, this week. What’s likely is that, even if the print is hot, the first move is to be structural, per Kai Volatility’s Cem Karsan.
“A function of inevitable rebalancing of dealer inventory post-event. The second move and final resolution, if you wait for it, is usually tied to the incremental effects on liquidity (QE/QT).”
Rising inflation probably bolsters the Fed’s backing of a 75 basis point rate hike on July 27. So, don’t fight the Fed. Rising rates and the withdrawal of liquidity prompts a continued de-rate.
Knowing this, the “flattening in the downside fixed strike skew, while the upside wings [are] more smiley,” as described by JPMorgan Chase & Co (NYSE: JPM), has made for attractive low-cost spread opportunities, as talked about yesterday and in the July 8, 2022 letter.
The moral is as follows: own volatility where the market is likely to not expire. Sell it where the market is likely to expire. Just because implied (IVOL) volatility is at a high starting point does not mean it should be sold, blindly.
As of 7:00 AM ET, Tuesday’s regular session (9:30 AM – 4:00 PM ET), in the S&P 500, is likely to open in the lower part of a negatively skewed overnight inventory, outside of prior-range and -value, suggesting a potential for immediate directional opportunity.
In the best case, the S&P 500 trades higher.
Any activity above the $3,830.75 MCPOC puts into play the $3,867.25 LVNode. Initiative trade beyond the LVNode could reach as high as the $3,909.25 MCPOC and $3,943.25 HVNode, or higher.
In the worst case, the S&P 500 trades lower.
Any activity below the $3,830.75 MCPOC puts into play the $3,800.25 LVNode. Initiative trade beyond the LVNode could reach as low as the $3,774.75 HVNode and $3,755.00 VPOC, or lower.
Click here to load today’s key levels into the web-based TradingView charting platform. Note that all levels are derived using the 65-minute timeframe. New links are produced, daily.
Graphic: 65-minute profile chart of the Micro E-mini S&P 500 Futures.
Considerations: Responsiveness near key-technical areas (that are discernable visually on a chart), suggests technically-driven traders with short time horizons are very active.
Such traders often lack the wherewithal to defend retests and, additionally, the type of trade may be indicative of the other time frame participants waiting for more information to initiate trades.
Example: The below 65-minute S&P 500 chart with volume profiles was included in the July 8, 2022 edition of the newsletter. Prices were near an inflection (micro-composite point of control and two key volume-weighted average price levels). From thereon, selling surfaced.
This is what is meant by responsiveness near key-technical areas.
Graphic: Updated 7/2/22. 65-minute profile chart of the Micro E-mini S&P 500 Futures.
Definitions
Volume Areas: A structurally sound market will build on areas of high volume (HVNodes). Should the market trend for long periods of time, it will lack sound structure, identified as low volume areas (LVNodes). LVNodes denote directional conviction and ought to offer support on any test.
If participants were to auction and find acceptance into areas of prior low volume (LVNodes), then future discovery ought to be volatile and quick as participants look to HVNodes for favorable entry or exit.
POCs: POCs are valuable as they denote areas where two-sided trade was most prevalent in a prior day session. Participants will respond to future tests of value as they offer favorable entry and exit.
MCPOCs: POCs are valuable as they denote areas where two-sided trade was most prevalent over numerous day sessions. Participants will respond to future tests of value as they offer favorable entry and exit.
Volume-Weighted Average Prices (VWAPs): A metric highly regarded by chief investment officers, among other participants, for quality of trade. Additionally, liquidity algorithms are benchmarked and programmed to buy and sell around VWAPs.
About
After years of self-education, strategy development, mentorship, and trial-and-error, Renato Leonard Capelj began trading full-time and founded Physik Invest to detail his methods, research, and performance in the markets.
Capelj also develops insights around impactful options market dynamics at SpotGamma and is a Benzinga reporter.
In no way should the materials herein be construed as advice. Derivatives carry a substantial risk of loss. All content is for informational purposes only.
Overnight, U.S. equity index futures came off of their Thursday peaks before, late in the morning, trading to a new rally high, at which is a confluence of technical nuances.
Thursday’s cash session was characterized by a near-vertical advance into mid-day. Then, trade became two-sided, a feature of short-covering and not new buying. More on this, later.
In the news was Citigroup Inc’s (NYSE: C) downgrading of U.S. stocks on recession risks and the “elements of a deflating bubble,” while leaning optimistic on China assets due to marginal policy support, there. This is on the heels of similar conclusions put forward by BlackRock Inc (NYSE: BLK) and Morgan Stanley (NYSE: MS).
Mortgage rates staged their biggest drop since April of 2020 as “the housing market has clearly slowed, and the deceleration is spreading to other segments of the economy,” the Federal Home Loan Mortgage Corporation’s (OTC: FMCC) Sam Khater explained.
In other news, Secretary of State Antony Blinken took aim at China, commenting on the U.S.’s intention to “shape the strategic environment around Beijing to advance [its] vision for an open, inclusive international system.” This is as the U.S. also plans economic talks with Taiwan.
Pippa Malmgren, who is a former White House adviser and economist we wrote on earlier this week, discussed more of this decoupling and coordination among Eastern and Western powers.
In a two-part series, she explains the challenging of U.S. island bases by China and Russia, as well as their maritime strategies, “island hopping [and] shopping.” Check them out.
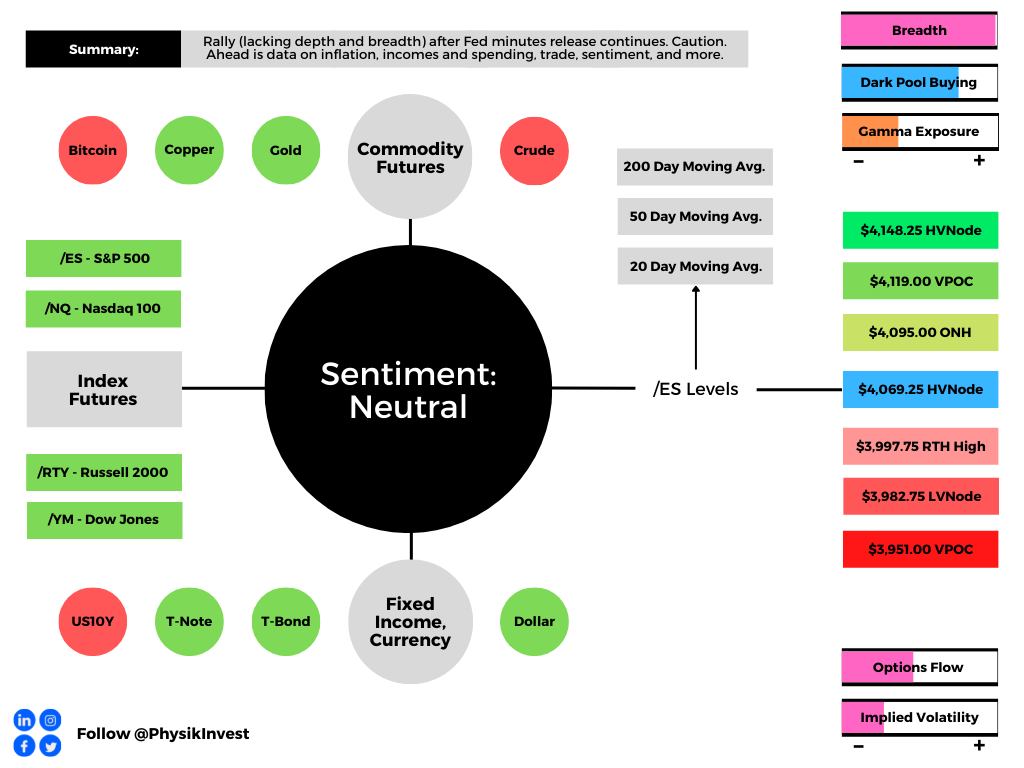
Today we received data on PCE inflation, real disposable and personal income, along with consumer spending and trade in goods (8:30 AM ET). University of Michigan Sentiment and five-year inflation expectations come later (10:00 AM ET).
Graphic updated 6:45 AM ET. Sentiment Neutral if expected /ES open is inside of the prior day’s range. /ES levels are derived from the profile graphic at the bottom of the following section. Levels may have changed since initially quoted; click here for the latest levels. SqueezeMetrics Dark Pool Index (DIX) and Gamma (GEX) calculations are based on where the prior day’s reading falls with respect to the MAX and MIN of all occurrences available. A higher DIX is bullish. At the same time, the lower the GEX, the more (expected) volatility. Learn the implications of volatility, direction, and moneyness. SHIFT data used for S&P 500 (INDEX: SPX) options activity. Note that options flow is sorted by the call premium spent; if more positive, then more was spent on call options. Breadth reflects a reading of the prior day’s NYSE Advance/Decline indicator. VIX reflects a current reading of the CBOE Volatility Index (INDEX: VIX) from 0-100.
What To Expect
Fundamental: At its core, there’s a commitment to cutting liquidity and credit after the spending of COVID-era “benefits and lockdown savings … created a lot of demand,” and inflation.
Graphic: Via the Federal Reserve. Taken from Nasdaq Inc (NASDAQ: NDAQ). “Rates have risen dramatically this year, impacting valuations of stocks and bonds.”
This has consequences on the real economy and asset prices, accordingly, which rose and kept the deflationary pressures of prevailing monetary policies at bay.
Graphic: Taken from Nasdaq Inc. “At a very simple level, rising rates increase interest expenses, reducing profits. But they also cause investors, who can earn more interest on safe cash deposits, to demand stronger returns from all other investments too.”
As unpacked, in detail, on May 18, 2022, there is an argument that stock market drops are both a recession and a reflection of the unwind of carry (or investment in long-duration bets with cheap debt) – a deflationary shock.
Graphic: Via Bloomberg. “Tighter financial conditions themselves are a clear success story for the Fed — it is the only way they can reduce inflationary pressures,” said Seema Shah, chief strategist at Principal Global Investors.
“The Fed has a mandate … to control price stability,” Kai Volatility’s Cem Karsan had explained.
“With supply-side economics, the only way that they can control this ultimately is to pull back. And slow capital markets decrease via the wealth effect. Ultimately, there’s a significant lag, so they are not in a position to ultimately control inflation without bringing down markets.”
Graphic: Via Bloomberg. “Of course, economic growth is a good thing. But too much of that good thing will just continue to stoke inflation. With that perspective in mind, the slowdown in surprises is positive.”
Accordingly, in our May 25, 2022 commentary, in which we discussed what to search for in the minutes of the last Federal Open Market Committee (FOMC) meeting. Knowing that there’s a lag in policy impact, we accurately floated the potential for the Federal Reserve (Fed) to “shift gears” late this summer if further cooling of inflation and “evidence of a growth slowdown.”
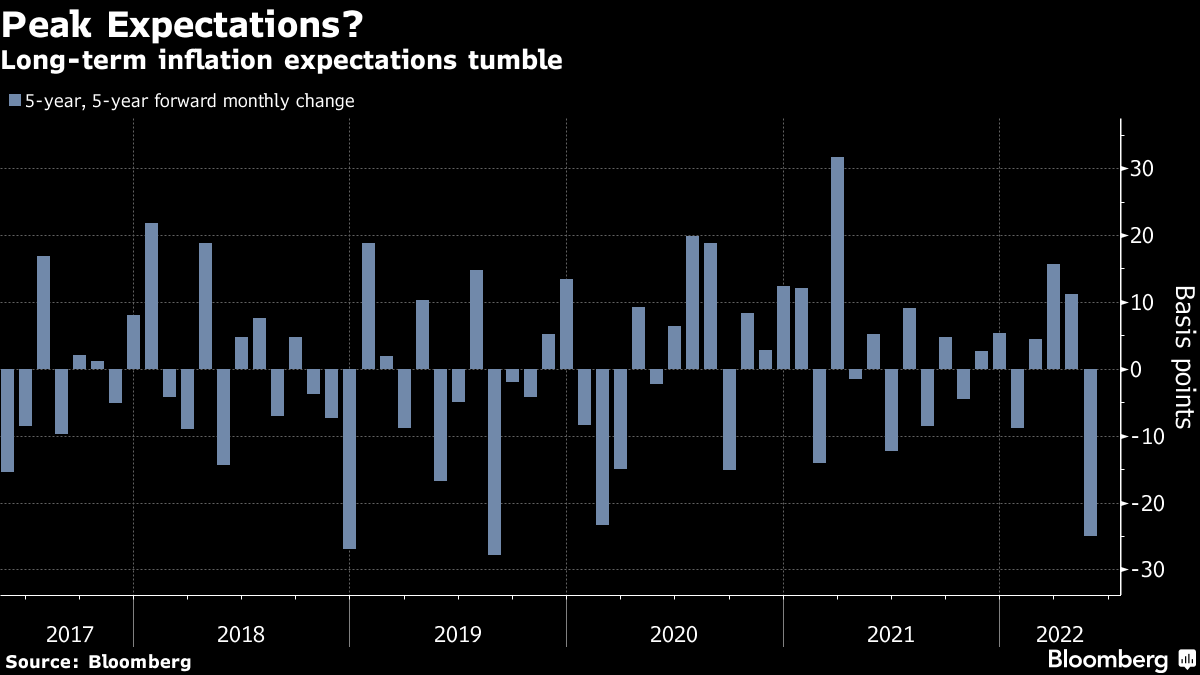
Graphic: Via Bloomberg. “After hitting a record above 3% last month, 10-year breakevens are on track for their biggest monthly drop since March 2020. The so-called five-year, five-year forward — the Fed’s favored measure — is set to post its biggest drop in May since August 2019.”
“Policy works with a lag,” as Diane Swonk of Grant Thorton explained. The Fed may pause as it seeks to “catch up but not outrun the market in its effort to tighten credit market conditions.”
“There is still more progress to be made in bringing inflation expectations down to resonate with the Committee’s target, but current valuations are at least in the realm of acceptable,” Ian Lyngen, who is head of U.S. rates strategy at the Bank of Montreal (NYSE: BMO), said.
“The market is showing some faith in Powell’s inflation-fighting creditability.”
Graphic: Taken from Nasdaq Inc. “Although inflation is high right now, it’s because of Covid and the Ukraine war. Both, hopefully, will pass, and 3%-4% inflation a year from now seems possible if the economy slows to a more normal level. In turn, that means the interest rate that keeps the U.S. economy growing slowly is likely much lower than we might currently be thinking. It might, in fact, be right around where bond rates are now.”
Concluding the fundamental section with remarks from a March 2022 Substack newsletter published by Andreas Steno Larsen of the Stenos Signals Substack.
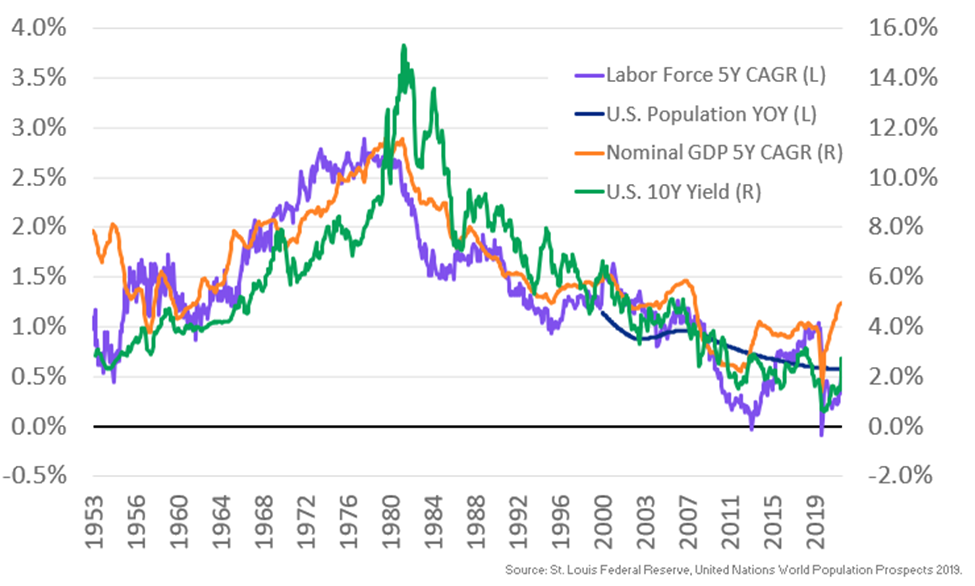
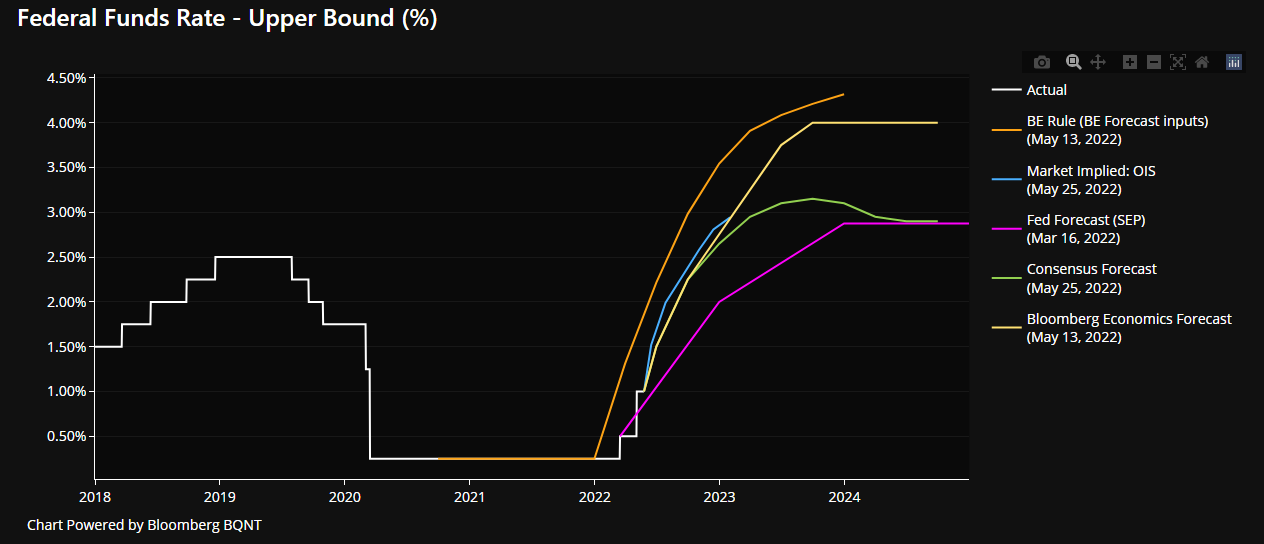
“I simply don’t find >3.5% territory for the Fed Funds feasible as the hiking cycle peaked at 2.25-2.50% in 2018/2019 and fundamentals have worsened since. Debt loads are much higher, demographics have weakened, and the labour force is smaller, which suggests that the neutral rate is lower, not higher, than in 2018/2019.”
Graphic: Via Bloomberg. “The swaps market and consensus forecasts to Bloomberg Economics both imply considerably faster rate hikes, while Bloomberg’s own forecast is more hawkish still.”
Positioning: Per Bank of America Corporation (NYSE: BAC) notes, investors poured nearly $20 billion into global stocks (in the week to May 25, 2022).
As I wrote in a SpotGamma note, notable was the reversal in beaten-down areas of the market, as well as the implosion at the front-end of the volatility term structure, affecting protection most sensitive to changes in direction and volatility.
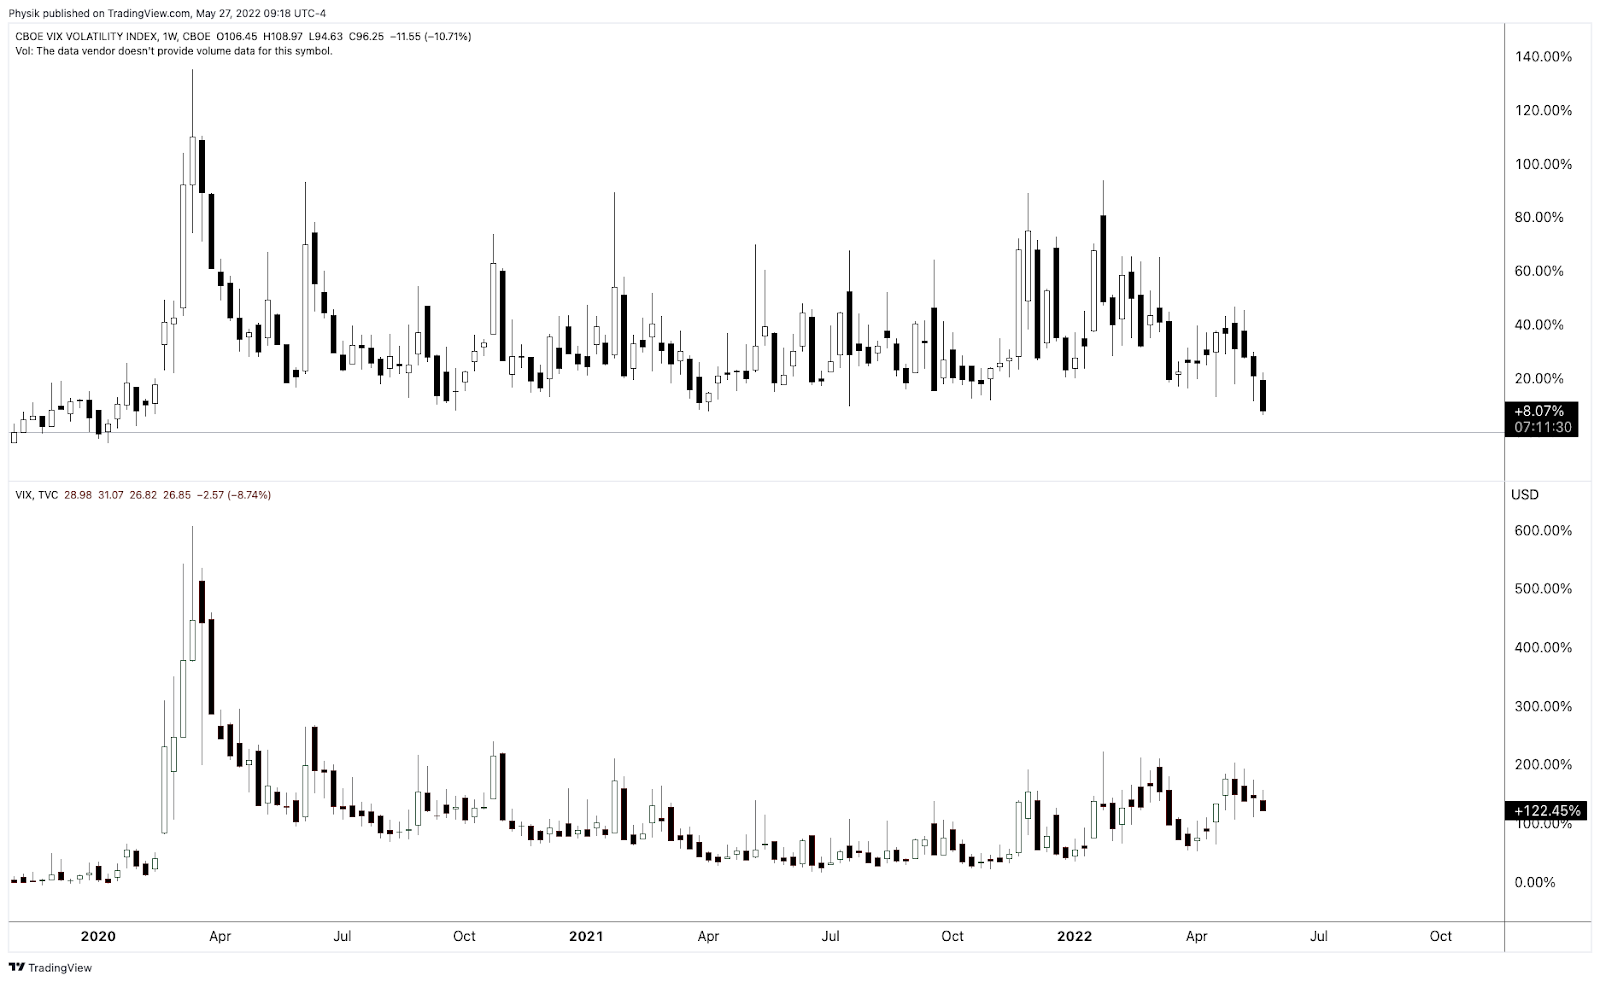
The Cboe VVIX Index (INDEX: VVIX), the expected volatility of the 30-day forward price of the VIX or the volatility of volatility (a naive but useful measure of skew), dropped off markedly, too, in comparison to the VIX, itself.
Graphic: Via Physik Invest. Taken from TradingView. VVIX, top. VIX, bottom.
Further, as stated in SpotGamma’s note, a “falling VVIX (and VIX term structure drop off) may be the product of a collapse in the value of customers’ long put exposures concentrated in very short-dated timeframes (potentially exposures hedging tail risks with respect to the release of FOMC minutes, among other things).”
“It is then as the skew, here, decays, and term structure compresses, that liquidity providers buy back their hedges to the puts they are short (i.e., the vanna dynamic pointed to, earlier).”
This market-generated information helps us give context to this most recent equity market rally that is characterized by a little change in demand for bets on upside further in price and time
All else equal, this is not a feature of sustainable market rallies.
Why you ask?
Those names that have been most depressed, and are now reversing, were recipients of heavy demand for protection in the months prior.
For this reason – participants being well hedged – selling was orderly, rather than violent as in past episodes of market shock when the reach for protection solicited a cascading reaction that exacerbated underlying price movements due to liquidity providers’ hedging.
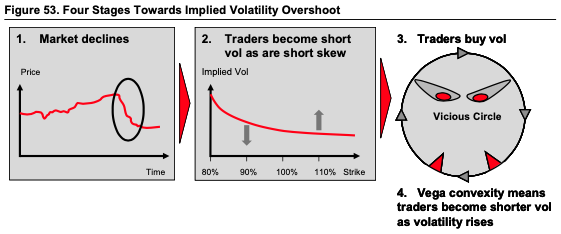
Graphic: Via Banco Santander SA (NYSE: SAN) research.
The large drop off in term structure, as well as the VVIX versus the VIX, is affecting protection most sensitive to changes in direction and volatility and the unwind of liquidity providers’ short futures and stock hedges to this protection is, in part, playing into this internally weak rally.
So, what? How do you play this? Good question.
It still may make sense to have exposure to underlying markets, synthetically (i.e., own options), as detailed, well, May 25, 2022. Read that letter for detail on how to think about trade structure.
Technical: As of 6:45 AM ET, Friday’s regular session (9:30 AM – 4:00 PM ET), in the S&P 500, will likely open in the upper part of a positively skewed overnight inventory, inside of prior-range and -value, suggesting a limited potential for immediate directional opportunity.
In the best case, the S&P 500 trades higher; activity above the $4,069.25 HVNode puts in play the $4,095.00 ONH. Initiative trade beyond the ONH could reach as high as the $4,119.00 VPOC and $4,148.25 HVNode, or higher.
In the worst case, the S&P 500 trades lower; activity below the $4,069.25 HVNode puts in play the $3,997.75 RTH High. Initiative trade beyond the RTH High could reach as low as the $3,982.75 LVNode and $3,951.00 VPOC, or lower.
Click here to load today’s key levels into the web-based TradingView charting platform. Note that all levels are derived using the 65-minute timeframe. New links are produced, daily.
Graphic: 65-minute profile chart of the Micro E-mini S&P 500 Futures.
Definitions
Overnight Highs And Lows (ONH and ONL): Typically, there is a low historical probability associated with overnight rally-highs (lows) ending the upside (downside) discovery process.
Volume Areas: A structurally sound market will build on areas of high volume (HVNodes). Should the market trend for long periods of time, it will lack sound structure, identified as low volume areas (LVNodes). LVNodes denote directional conviction and ought to offer support on any test.
If participants were to auction and find acceptance into areas of prior low volume (LVNodes), then future discovery ought to be volatile and quick as participants look to HVNodes for favorable entry or exit.
POCs: POCs are valuable as they denote areas where two-sided trade was most prevalent in a prior day session. Participants will respond to future tests of value as they offer favorable entry and exit.
MCPOCs: POCs are valuable as they denote areas where two-sided trade was most prevalent over numerous day sessions. Participants will respond to future tests of value as they offer favorable entry and exit.
About
After years of self-education, strategy development, mentorship, and trial-and-error, Renato Leonard Capelj began trading full-time and founded Physik Invest to detail his methods, research, and performance in the markets.
Capelj also develops insights around impactful options market dynamics at SpotGamma and is a Benzinga reporter.
In no way should the materials herein be construed as advice. Derivatives carry a substantial risk of loss. All content is for informational purposes only.
The daily brief is a free glimpse into the prevailing fundamental and technical drivers of U.S. equity market products. Join the 300+ that read this report daily, below!
Overnight, equity index futures auctioned lower, mostly, alongside most commodities and crypto.
Notable is how orderly the selling has been, particularly in the equity space. That’s due in part to suppressive volatility selling, as well as passive flows supporting the largest index constituents.
The fundamental narrative has changed little. Chief among participants’ worries are growth and inflation, the monetary response to the two, as well as chokepoints not limited to supply chains.
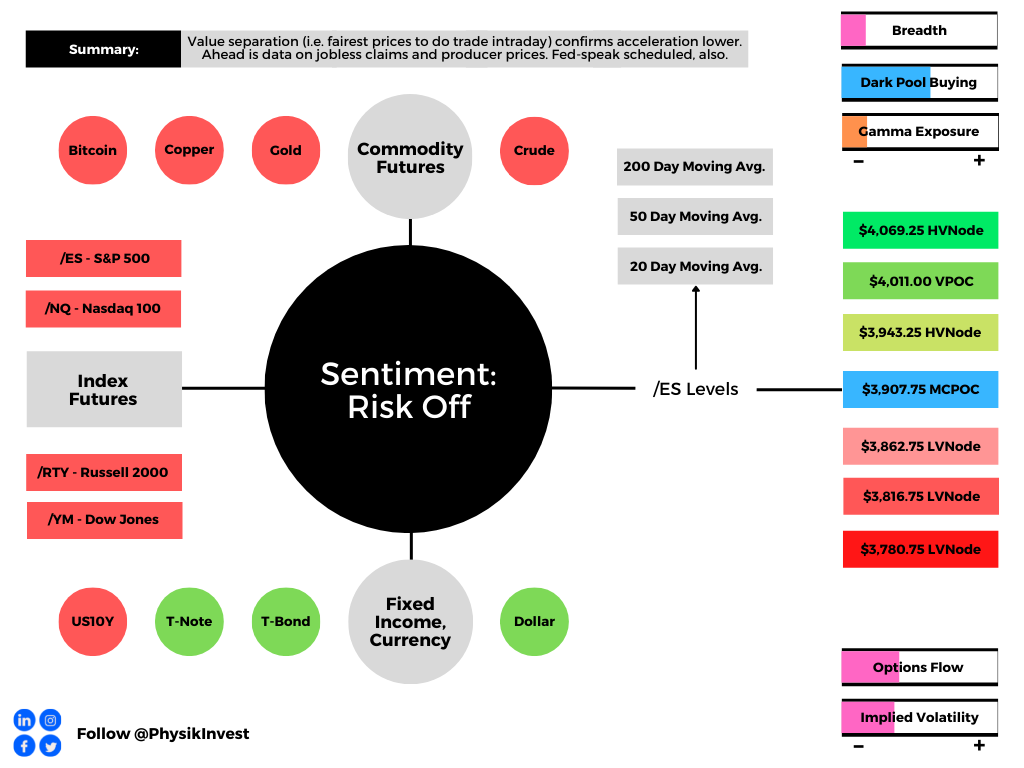
Ahead is data on jobless claims and the producer price index (8:30 AM ET), as well as Fed-speak by Mary Daly (4:00 PM ET).
Graphic updated 7:15 AM ET. Sentiment Risk-Off if expected /ES open is below the prior day’s range. /ES levels are derived from the profile graphic at the bottom of the following section. Levels may have changed since initially quoted; click here for the latest levels. SqueezeMetrics Dark Pool Index (DIX) and Gamma (GEX) calculations are based on where the prior day’s reading falls with respect to the MAX and MIN of all occurrences available. A higher DIX is bullish. At the same time, the lower the GEX, the more (expected) volatility. Learn the implications of volatility, direction, and moneyness. SHIFT data used for S&P 500 (INDEX: SPX) options activity. Note that options flow is sorted by the call premium spent; if more positive, then more was spent on call options. Breadth reflects a reading of the prior day’s NYSE Advance/Decline indicator. VIX reflects a current reading of the CBOE Volatility Index (INDEX: VIX) from 0-100.
What To Expect
Fundamental: In Wednesday’s morning letter, we talked about the expectations for annual inflation to have peaked and month-on-month inflation to have risen a small amount.
Per Bloomberg, “the broader CPI rose 0.3% from the prior month and 8.3% on an annual basis, a slight cooling but still among the highest readings in decades.”
Stocks were sold, after, on the limited change to the broader fundamental outlook. The hardest hit was growth and technology, including cryptocurrency.
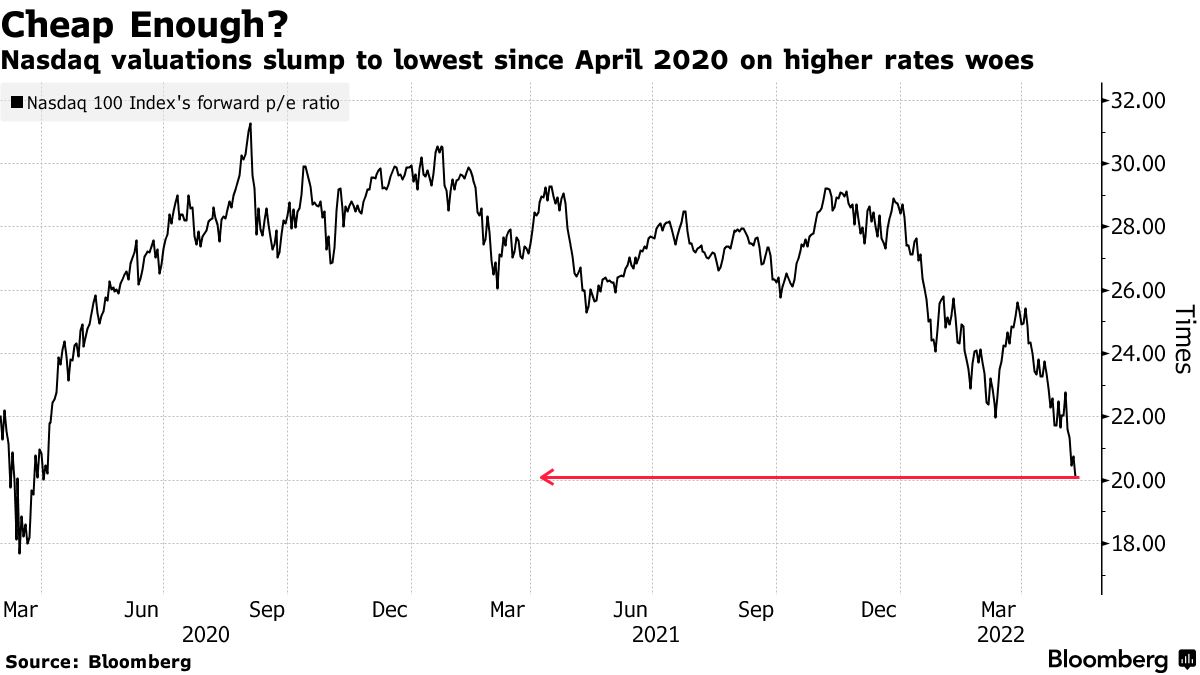
“Now that central banks are unwinding monetary support, growth stocks’ valuations have further to fall,” Citigroup Inc (NYSE: C) strategists including Robert Buckland said.
Notwithstanding, “any stabilization in nominal yields should eventually help to stabilize real yields and hence equity valuations.”
This is because higher rates play into bigger discounts on future profit.
Despite falling about the same distance (peak to present low) during the equity market rout of 2020, selling, this time around is steady and there is no panic, and that’s partly the result of there being “plenty of put-buyers, but nearly as many sellers,” according to SqueezeMetrics.
Accordingly, using off-exchange short sales as a proxy for buying activity, we see implicit buying support, and that’s due in part to “passive flows” which ultimately end up “supporting the largest stocks,” hence the index’s strength versus smaller (and much weaker) constituents.
Taken together, some metrics this letter often looks to for insight into the potential distribution of future returns, carry less weight; it’s odds and when the largest stocks succumb to fundamental weaknesses, for lack of a better way of expressing it, that likely takes the indexes with it.
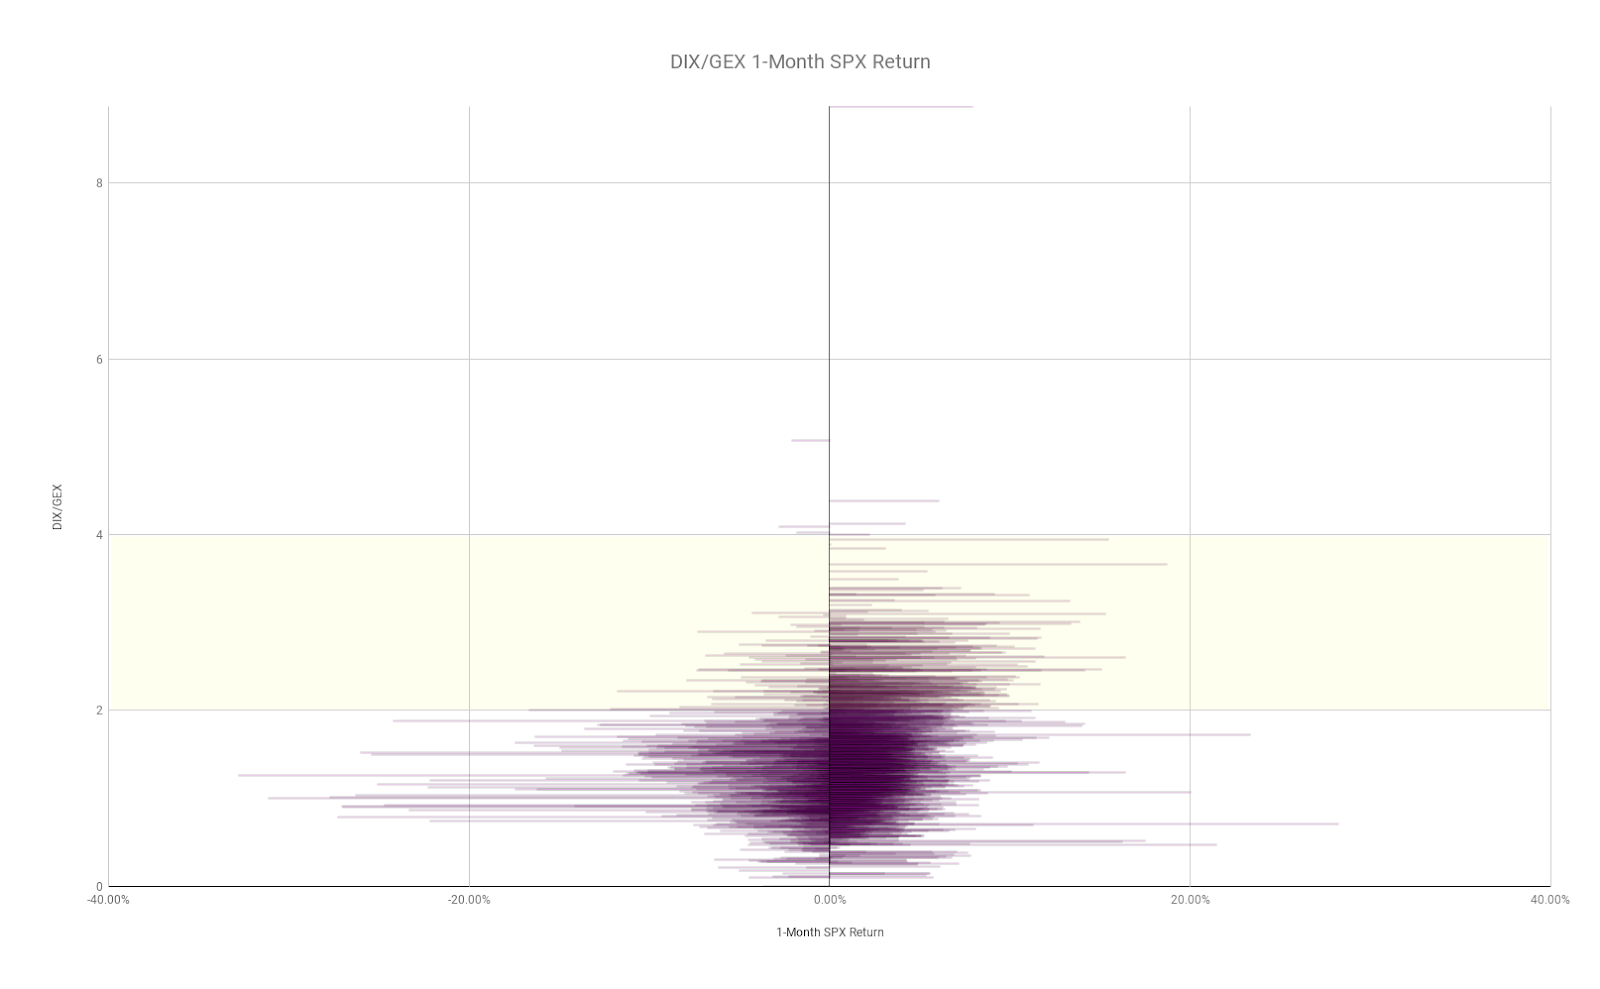
Graphic: Via Physik Invest. Data retrieved from SqueezeMetrics. A higher DIX/GEX ratio has historically been associated with S&P 500 outperformance in the subsequent month. A very low DIX/GEX ratio has historically been associated with positive S&P 500 performance in the subsequent month, though there are many more negative outliers.
Moreover, with the S&P 500’s break of $4,000.00, an area around which there is a lot of open interest, particularly on the put side, “increases capitulation risk” in the case participants start reaching for protection and indirectly taking from market liquidity as liquidity providers sell into weakness to hedge.
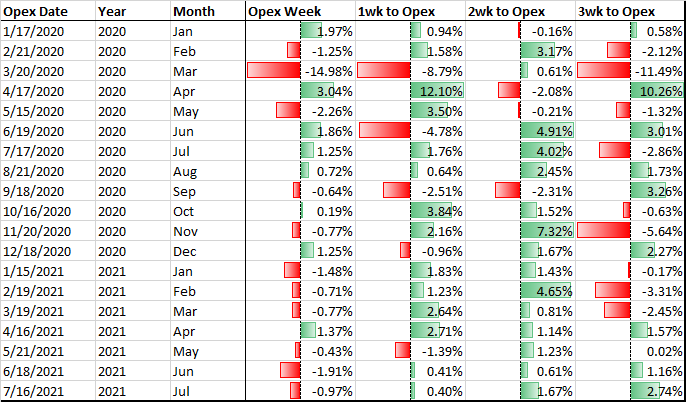
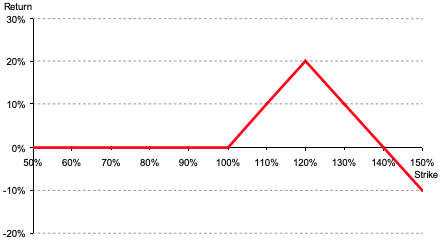
Notwithstanding, later this month is a large options expiration (OPEX), and expected is the roll-off of a large amount of put-heavy negative gamma. Per Pat Hennessy of IPS Strategic Capital, returns one to two weeks prior are skewed bullish.
Ways to participate in upside, while limiting downside, markedly, were discussed on May 10. Making money is one thing. Not losing money is another.Lose less when wrong. Make more when right.
Graphic: @pat_hennessy breaks down returns for the S&P 500, categorized by the week relative to OPEX.
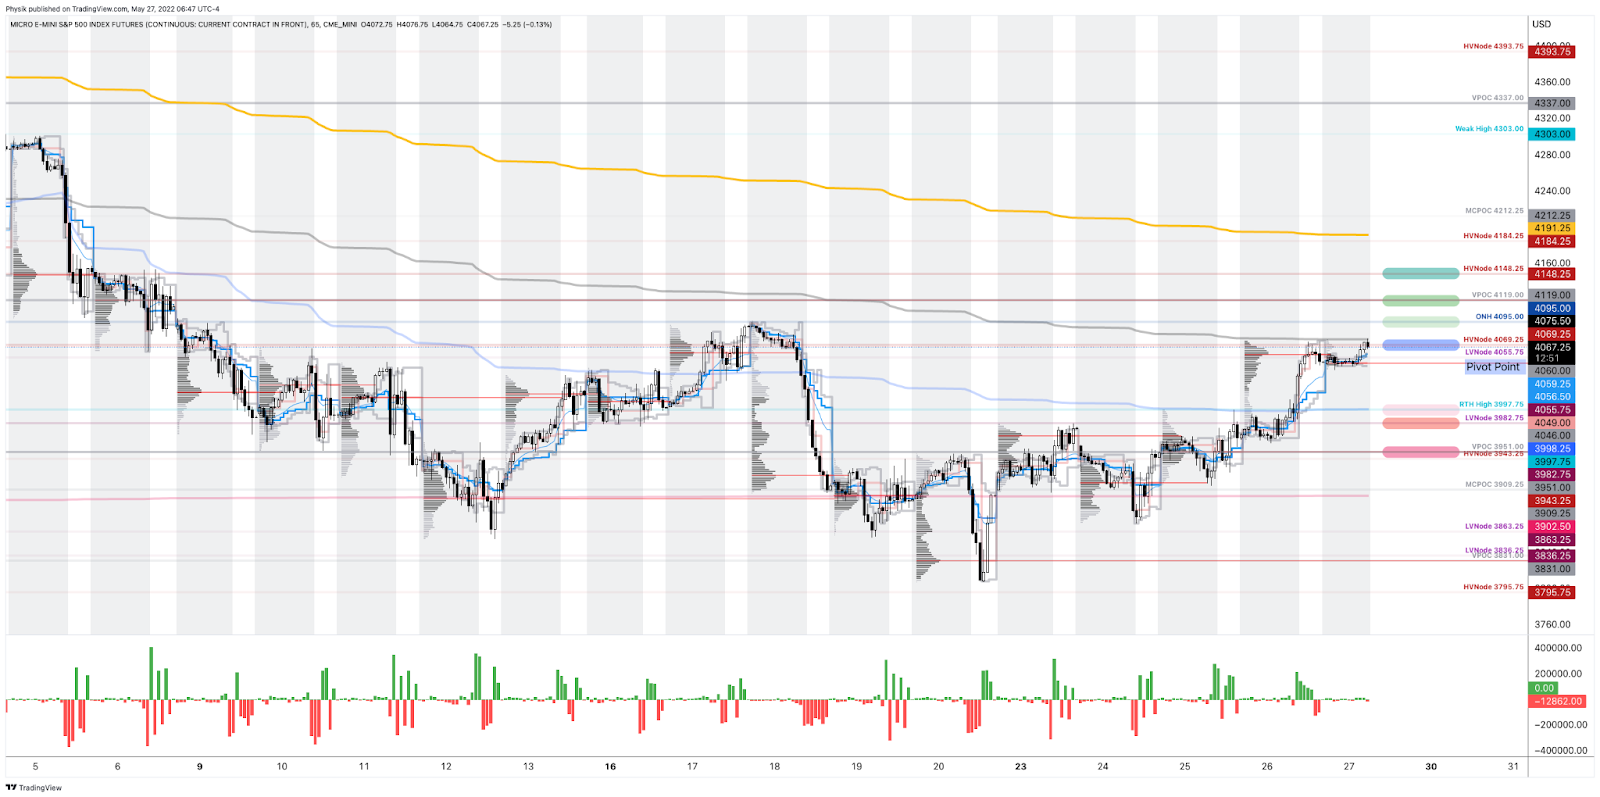
Technical: As of 6:45 AM ET, Thursday’s regular session (9:30 AM – 4:00 PM ET), in the S&P 500, will likely open in the lower part of a negatively skewed overnight inventory, outside of prior-range and -value, suggesting a potential for immediate directional opportunity.
In the best case, the S&P 500 trades higher; activity above the $3,907.75 micro composite point of control (MCPOC) puts in play the $3,943.25 high volume area (HVNode). Initiative trade beyond the $3,943.25 HVNode could reach as high as the $4,011.00 untested point of control (VPOC) and $4,069.25 HVNode, or higher.
In the worst case, the S&P 500 trades lower; activity below the $3,907.75 MCPOC puts in play the $3,862.75 LVNode. Initiative trade beyond the $3,862.75 LVNode could reach as low as the $3,816.75 and $3,780.75 LVNodes, or lower.
Click here to load today’s key levels into the web-based TradingView charting platform. Note that all levels are derived using the 65-minute timeframe. New links are produced, daily.
Graphic: 65-minute profile chart of the Micro E-mini S&P 500 Futures.
Volume Areas: A structurally sound market will build on areas of high volume (HVNodes). Should the market trend for long periods of time, it will lack sound structure, identified as low volume areas (LVNodes). LVNodes denote directional conviction and ought to offer support on any test.
If participants were to auction and find acceptance into areas of prior low volume (LVNodes), then future discovery ought to be volatile and quick as participants look to HVNodes for favorable entry or exit.
POCs: POCs are valuable as they denote areas where two-sided trade was most prevalent in a prior day session. Participants will respond to future tests of value as they offer favorable entry and exit.
MCPOCs: POCs are valuable as they denote areas where two-sided trade was most prevalent over numerous day sessions. Participants will respond to future tests of value as they offer favorable entry and exit.
About
After years of self-education, strategy development, mentorship, and trial-and-error, Renato Leonard Capelj began trading full-time and founded Physik Invest to detail his methods, research, and performance in the markets.
Capelj also develops insights around impactful options market dynamics at SpotGamma and is a Benzinga reporter.
In no way should the materials herein be construed as advice. Derivatives carry a substantial risk of loss. All content is for informational purposes only.
The Daily Brief is a free glimpse into the prevailing fundamental and technical drivers of U.S. equity market products. Join the 200+ that read this report daily, below!
Overnight, equity index futures were sideways, inside of the prior range, after exploring much lower, Monday. Measures of implied volatility, bonds, and most commodities were bid.
This is alongside news that Russia is dodging default, the necessity for the Fed to drop inflation down to 4% by year-end per Citadel’s Ken Griffin, the U.S. Treasury’s intent to scale back sales of longer-term debt, falling earnings estimates, Taiwan preparing to fend-off a potential invasion as Beijing ordered officials to find ways to fight against western sanctions, similar to those used against Russia, among other things including Fitch trimming China’s 2022 growth forecast.
Also, near risk-free, inflation-protected I bonds will pay 9.62% through October, the Treasury said, and here’s more on the Citigroup Inc (NYSE: C) trader that’s behind a European crash.
Ahead is data on job openings and quits, as well as factory and core capital goods orders (10:00 AM ET).
Read on for coverage on the fundamental and technical position of the market, as well as ways to position for future trade.
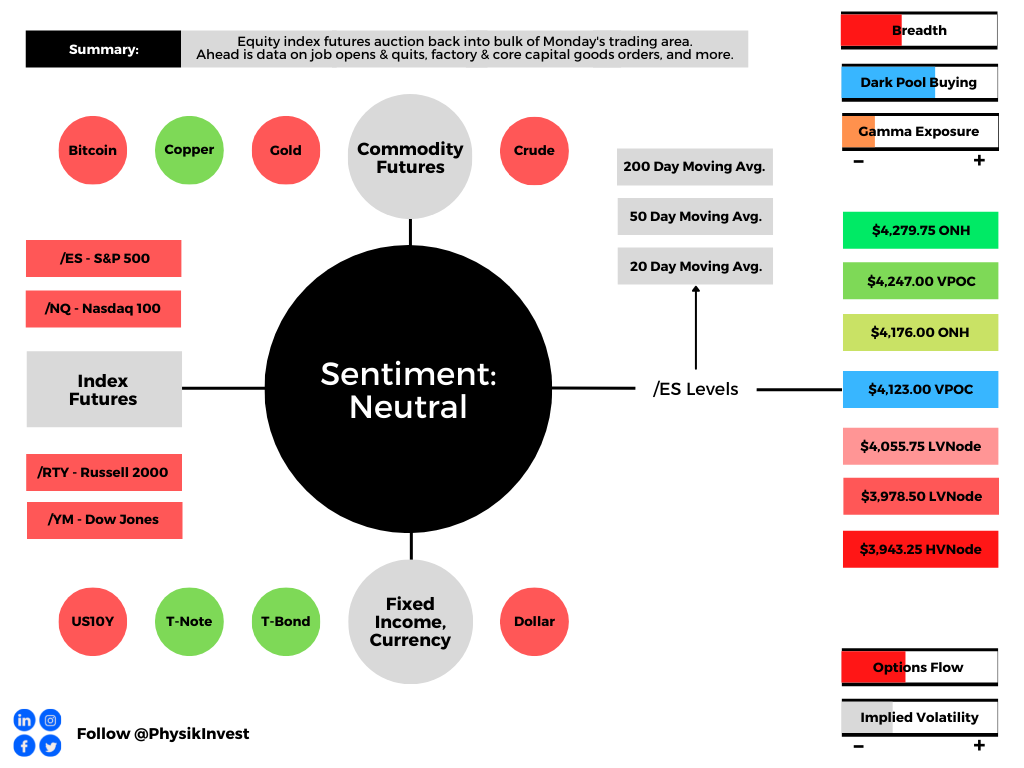
Graphic updated 6:45 AM ET. Sentiment Neutral if expected /ES open is inside of the prior day’s range. /ES levels are derived from the profile graphic at the bottom of the following section. Levels may have changed since initially quoted; click here for the latest levels. SqueezeMetrics Dark Pool Index (DIX) and Gamma (GEX) calculations are based on where the prior day’s reading falls with respect to the MAX and MIN of all occurrences available. A higher DIX is bullish. At the same time, the lower the GEX, the more (expected) volatility. Learn the implications of volatility, direction, and moneyness. SHIFT data used for S&P 500 (INDEX: SPX) options activity. Note that options flow is sorted by the call premium spent; if more positive, then more was spent on call options. Breadth reflects a reading of the prior day’s NYSE Advance/Decline indicator. VIX reflects a current reading of the CBOE Volatility Index (INDEX: VIX) from 0-100.
What To Expect
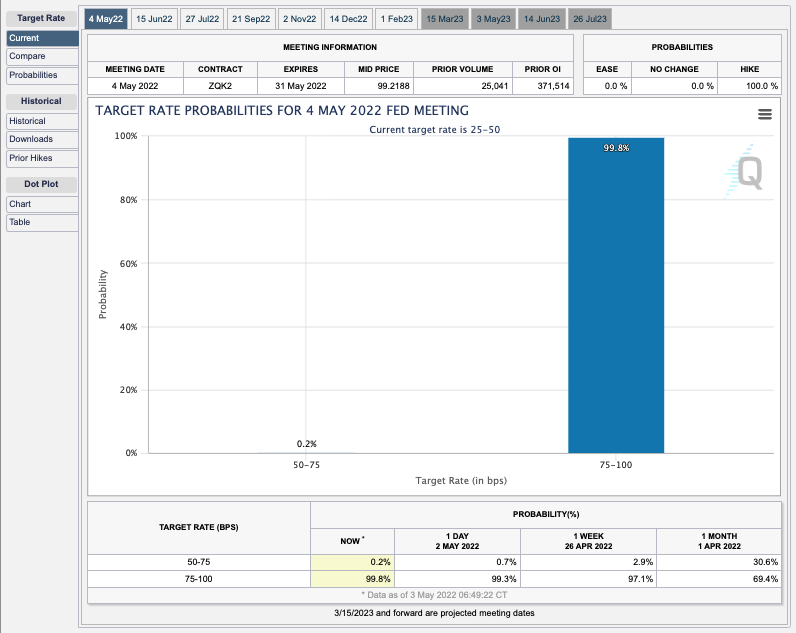
Fundamental: The Federal Reserve (Fed) is expected to raise its target overnight rate by about 50 basis points and provide updates on quantitative tightening (QT).
Graphic: Via CME Group Inc’s (NASDAQ: CME) FedWatch Tool. Market participants expect a near-100% chance the fed moves its target rate to 75 or 100 basis points.
The expectations of the aforementioned have played into a tightening of financial conditions which, as Columbia Threadneedle’s Gene Tannuzzo explains, “reduces demand and ultimately slows inflation.”
Graphic: Via Bloomberg. “Tighter financial conditions are the mechanism that reduces demand and ultimately slows inflation,” said Tannuzzo, the firm’s global head of fixed income. “If financial conditions don’t tighten and inflation remains high, in their eyes, they need to hike more.”
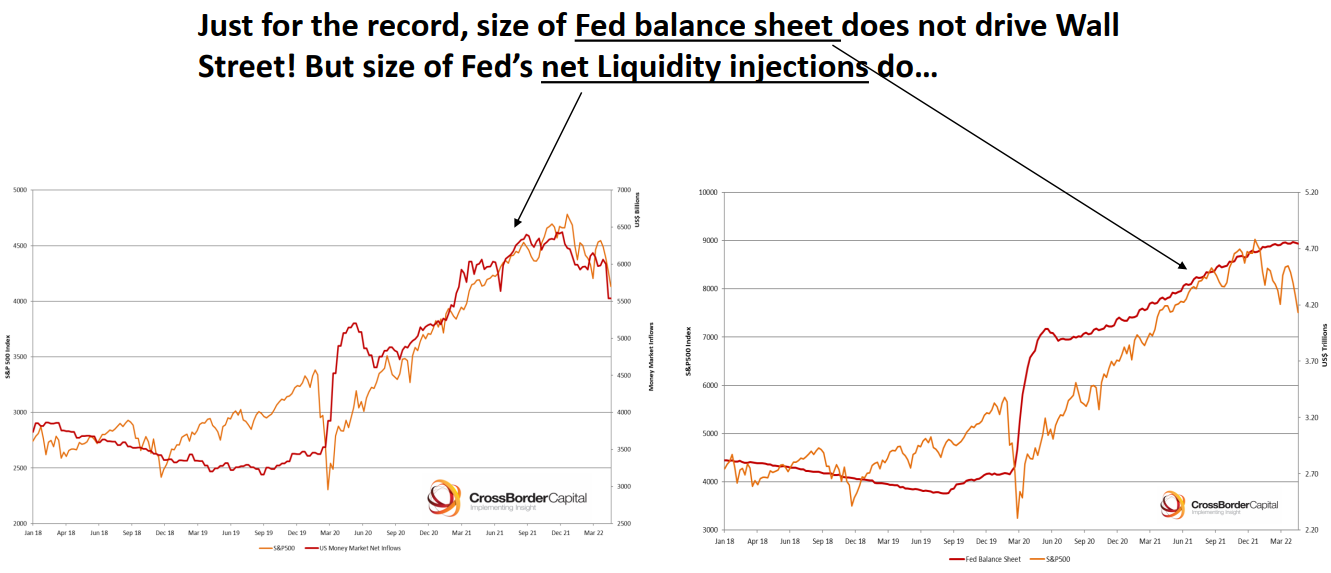
The key is the update on QT. As Bloomberg’s John Authers puts it well, “what the Fed does with its balance sheet at the margin [] matters for asset prices, and there is little or no lag.”
Graphic: Via Crossborder Capital Ltd. Taken from Bloomberg.
The Fed’s liquidity reductions, thus far, have played into the market’s troubles since the start of the year. This is as QT has an impact on the “ability to roll over or refinance investments.”
Graphic: Taken from The Market Ear. “46% of non-earnings driven market cap changes were explained by Fed balance sheet expansion since GFC.”
Perspective: JPMorgan Chase & Co (NYSE: JPM) strategists note that investors’ fears are unwarranted. The U.S.’s economic expansion has not been derailed.
“Worries about China’s growth outlook, a negative take on the Q1 earnings reporting season, concerns about higher bond yields and further tightening of financial conditions from a strong dollar, all appear to have soured equity and credit investors’ sentiment,” the strategists said.
“We find these fears overblown.”
Positioning: Comments from yesterday’s morning letter remain valid, today.
Participants’ bets on the direction are concentrated in negative delta (long puts, short calls). The exposure is short-dated and extremely sensitive to changes in implied volatility and direction.
Graphic: Via Goldman Sachs Group Inc (NYSE: GS). Taken from The Market Ear. “Retail Investors buyers of 0-1 DTE (days-to-expiry) puts are largest on record.”
Those options carry a lot of gamma and are exposed to the potential for asymmetric or convex payouts. This is not good for those who are on the other side.
In hedging a short put, for instance, a positive delta and negative gamma trade, counterparties sell underlying if there is weakness or jumps in implied volatility. If the underlying trades higher, or dips in volatility, the counterparty will buy the underlying, all else equal.
Taken together, in such an environment, the counterparty leans toward taking liquidity and this exacerbates underlying movement if there’s a thinning liquidity environment, SpotGamma says.
Graphic: Via Goldman Sachs Group Inc (NYSE: GS). Taken from SpotGamma.
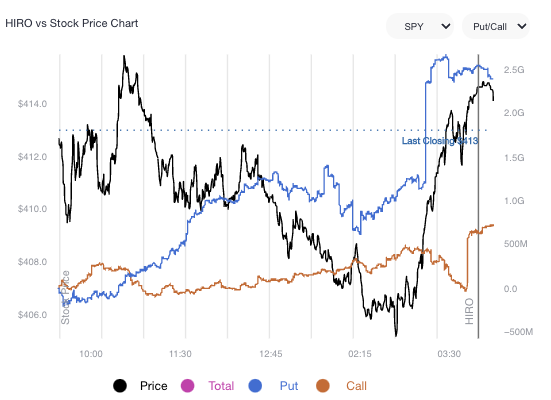
In other words, hedging matters more in such an environment. This was clear during Monday’s trade when a bout of put selling and light call buying appeared in both the SPDR S&P 500 ETF Trust (NYSE: SPY) and Invesco QQQ Trust Series 1 (NASDAQ: QQQ).
This, ultimately, too, fed into the compression of volatility at the short-end of the term structure, yesterday. To re-hedge, counterparts likely bought into the market’s weakness and bolstered the near-vertical reversal, and close higher.
Graphic: SpotGamma’s Hedging Impact of Real-Time Options (HIRO) indicator for SPY. A rising blue and orange denote put selling and call buying, respectively.
The odds of follow-through, to the upside, come back to the fundamental situation and Fed announcements this week. Should fears with respect to monetary policy be assuaged, then volatility can compress and that, alone, will spur a buy-back of those underlying short hedges.
If participants start to concentrate their bets at higher prices, further out in time, that confirms the odds of sustained follow-through. If not, it’s likely that prices, after a short-term relief, will succumb to fundamental weaknesses.
Technical: As of 6:45 AM ET, Tuesday’s regular session (9:30 AM – 4:00 PM ET), in the S&P 500, will likely open in the middle part of a balanced overnight inventory, inside of prior-range and -value, suggesting a limited potential for immediate directional opportunity.
In the best case, the S&P 500 trades higher; activity above the $4,123.00 untested point of control (VPOC) puts in play the $4,176.00 overnight high (ONH). Initiative trade beyond the ONH could reach as high as the $4,247.00 VPOC and $4,279.75 ONH, or higher.
In the worst case, the S&P 500 trades lower; activity below the $4,123.00 VPOC puts in play the $4,055.75 low volume area (LVNode). Initiative trade beyond the LVNode could reach as low as the $3,978.50 LVNode and $3,943.25 high volume area (HVNode), or lower.
Click here to load today’s key levels into the web-based TradingView charting platform. Note that all levels are derived using the 65-minute timeframe. New links are produced, daily.
Graphic: 65-minute profile chart of the Micro E-mini S&P 500 Futures.
Considerations: Most interesting was Monday’s response at a key technical level ($4,055.75) outlined in the morning letter.
Specifically, the E-mini S&P 500 probed $4,056.00 before staging a sharp reversal and closing higher. This is noteworthy as it tells us a lot about who has (or is gaining) the upper hand.
Push-and-pull, as well as responsiveness near key-technical areas (discernable visually on a chart), suggests technically-driven traders with shorter time horizons are (becoming) active.
Such traders often lack the wherewithal to defend retests and, additionally, this type of trade may suggest other time frame participants are waiting for more information to initiate trades.
Adding, the Federal Reserve’s meeting this week concludes with statements to be shared on Wednesday. For weeks heading into this event, (larger) participants (that move by committee) have de-grossed and hedged. For that reason, the reliability of our technical levels took a hit.
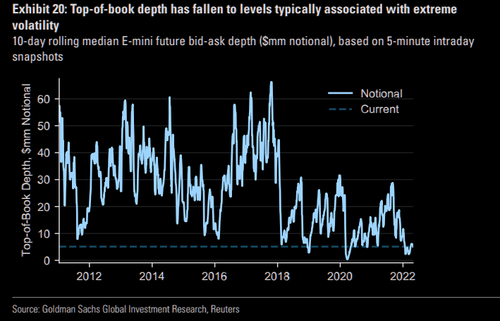
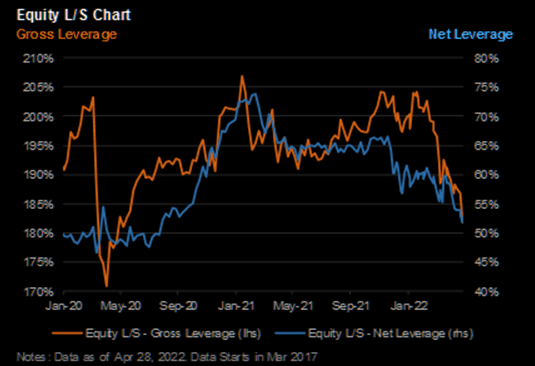
Graphic: Via JPMorgan Chase & Co (NYSE: JPM). Taken from The Market Ear. Per Bloomberg, “Hedge funds tracked by Morgan Stanley have also cut their net leverage — a measure of risk appetite that takes into account long versus short positions — to a two-year low.”
In the very near term, until more fundamental information is revealed, these technical-driven traders may play a larger role in the volatility. These traders, given capital constraints and tolerances, often trigger sharp moves in their entry and exit on news. Caution on whipsaw.
How I’m Playing: Presently, the market is stretched to the downside and participants are leaning, heavily, one way.
Graphic: Via SpotGamma, “Put vs Call gamma suggests stretched positioning.”
Pursuant to that remark, as SpotGamma says, “traders are underpricing right-tail risk,” and that opens the window for unique ways to play a returns distribution that is skewed positive (albeit with large negative outliers).
Consider zero- or low-cost bets that deliver asymmetric payouts in case of reversals.
This letter’s writer presently is structured positive delta and gamma in the Nasdaq 100 (INDEX: NDX) via ratios spread (1×2) and butterfly (1x2x1) structures.
The concern with these strategies is the width and time to expiry. Should either of those be wrong, then spreads initially positive gamma turn negative, meaning losses are amplified.
For instance, in the Nasdaq 100, to put in short, 500-1000 points wide ratio spreads (buy the closer leg, sell two of the farther legs) expiring in ten to fifteen days work well.
For those spreads that are not zero cost, debits can be offset with credit sales (on the put side) in products that have shown relative strength like the S&P 500 (INDEX: SPX). This, inherently, carries more risk. Read more about these strategies, here.
Please note that the above is NOT a trade recommendation or advice.
Graphic: Via Banco Santander SA (NYSE: SAN) research, the return profile, at expiry, of a classic 1×2 (long 1, short 2 further away) ratio spread.
Definitions
Overnight Rally Highs (Lows): Typically, there is a low historical probability associated with overnight rally-highs (lows) ending the upside (downside) discovery process.
Volume Areas: A structurally sound market will build on areas of high volume (HVNodes). Should the market trend for long periods of time, it will lack sound structure, identified as low volume areas (LVNodes). LVNodes denote directional conviction and ought to offer support on any test.
If participants were to auction and find acceptance into areas of prior low volume (LVNodes), then future discovery ought to be volatile and quick as participants look to HVNodes for favorable entry or exit.
POCs: POCs are valuable as they denote areas where two-sided trade was most prevalent in a prior day session. Participants will respond to future tests of value as they offer favorable entry and exit.
Volume-Weighted Average Prices (VWAPs): A metric highly regarded by chief investment officers, among other participants, for quality of trade. Additionally, liquidity algorithms are benchmarked and programmed to buy and sell around VWAPs.
About
After years of self-education, strategy development, mentorship, and trial-and-error, Renato Leonard Capelj began trading full-time and founded Physik Invest to detail his methods, research, and performance in the markets.
Capelj also develops insights around impactful options market dynamics at SpotGamma and is a Benzinga reporter.
In no way should the materials herein be construed as advice. Derivatives carry a substantial risk of loss. All content is for informational purposes only.