Categories
Commentary

Daily Brief For November 5, 2021

Abstract

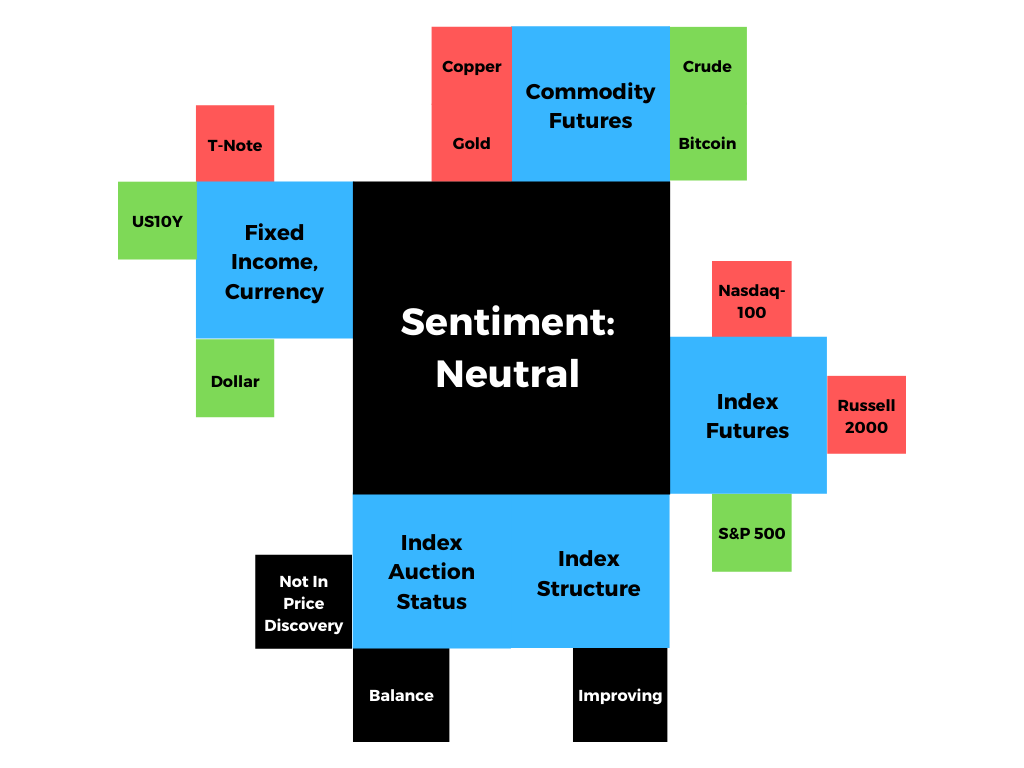
Equity index futures higher. Commodities were higher. Bonds mixed. Volatility compressed.

Ahead is a heavier day of economic releases, in the face of fundamental narratives and positioning metrics that may support intraday price stability.

What Happened

Overnight, equity index futures were marked up ahead of the House’s plan to vote on President Joe Biden’s economic package and infrastructure, as well as October jobs data.

Also, in the news, there were narratives surrounding China’s dollar surplus, a pandemic resurgence in Europe, Pfizer Inc’s (NYSE: PFE) development of a pill for COVID-19.

Ahead is data on payrolls, unemployment, and average hourly earnings (8:30 AM ET), as well as consumer credit (3:00 PM ET). I apologize as this is what I listed yesterday, mistakenly.

Graphic updated 6:30 AM ET. Sentiment Risk-On if expected /ES open is above the prior day’s range. /ES levels are derived from the profile graphic at the bottom of the following section. Levels may have changed since initially quoted; click here for the latest levels. SqueezeMetrics Dark Pool Index (DIX) and Gamma (GEX) calculations are based on where the prior day’s reading falls with respect to the MAX and MIN of all occurrences available. A higher DIX is bullish. At the same time, the lower the GEX, the more (expected) volatility. Learn the implications of volatility, direction, and moneyness. SHIFT data used for S&P 500 (INDEX: SPX) options activity. Note that options flow is sorted by the call premium spent; if more positive then more was spent on call options. Breadth reflects a reading of the prior day’s NYSE Advance/Decline indicator. VIX reflects a current reading of the CBOE Volatility Index (INDEX: VIX) from 0-100.

What To Expect

On weak intraday breadth and lackluster market liquidity metrics, the best case outcome occurred, evidenced by balanced trade at newly discovered S&P 500 prices.

As also evidenced by the separation of value, overnight, the gap out of yesterday’s range marks a potential willingness to continue the uptrend.

To note, poor structure left behind prior initiative trade adds to technical instability, a dynamic mentioned in prior commentaries. Participants will likely look to check old value (i.e., revisit, repair, and strengthen) pockets of low-volume, feverishly, on any breakdown of trend.

Graphic: Flat delta (i.e., non-committed buying/selling as measured by volume delta or buying and selling power as calculated by the difference in volume traded at the bid and offer) in SPDR S&P 500 ETF Trust (NYSE: SPY), via Bookmap. The readings are supportive of responsive trade (i.e., rotational trade that suggests current prices offered favorable entry and exit).

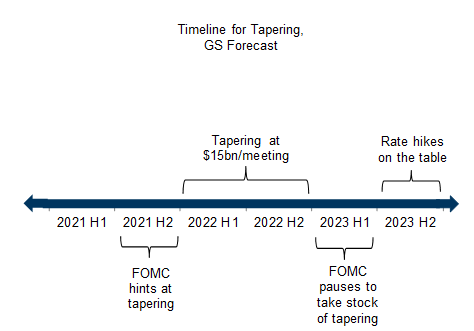
Context: The aforementioned trade is happening in the context of a slowdown in economic growth, increased clarity on the Federal Reserve’s (Fed) intent to moderate stimulus, as well as the prospects of renewed fiscal support.

The implications of these narratives on price are contradictory.

To elaborate, supply chain disruptions slowed the pace of economic growth, while participants saw both the Fed’s decision to taper and keep rates unchanged, as well as the potential passage of President Biden’s economic plan, today, as near-term positives.

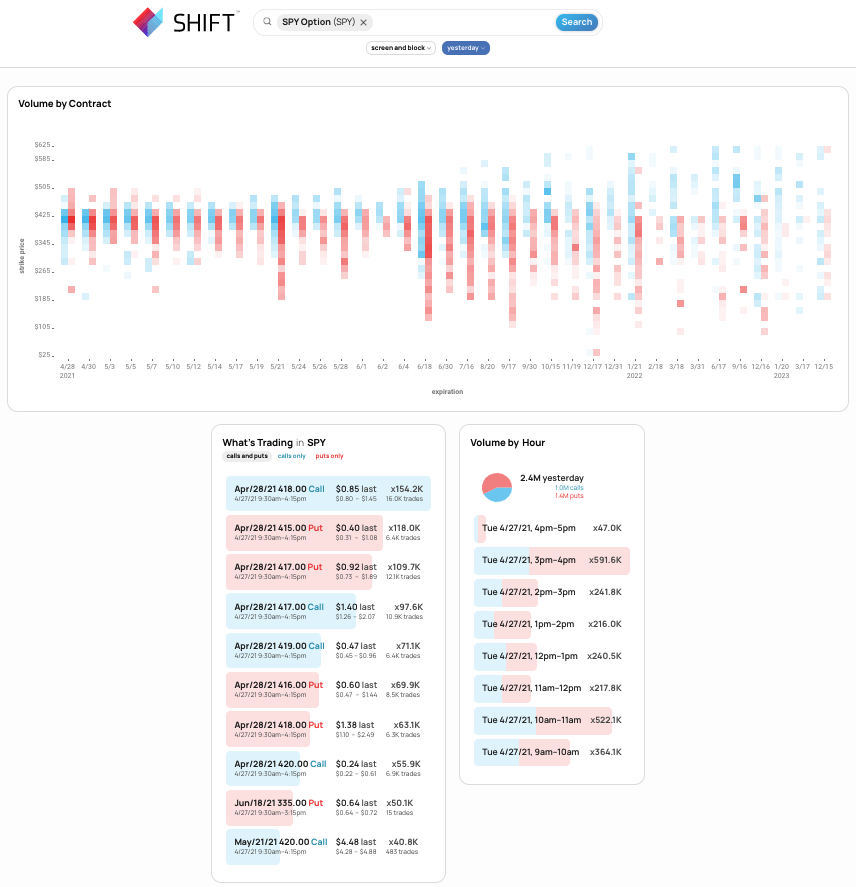
In terms of positioning, the CBOE Volatility Index (INDEX: VIX) was lower, while supply came in across the VIX futures term structure. That, alongside the long-gamma environment and increased demand for options above current prices (i.e., bets on the upside), points to increased odds of near-term equity market stability.

To quote options analysis and data provider SpotGamma, “​​the term structure of IV (this is how high the IV is for longer-dated options) remains elevated. That suggests near term options could have more ‘bleed’ which could keep the SPX market price tailwind intact.”

Expectations: As of 6:30 AM ET, Friday’s regular session (9:30 AM – 4:00 PM ET), in the S&P 500, will likely open in the upper part of a positively skewed overnight inventory, outside of prior-range and -value, suggesting a potential for immediate directional opportunity.

Gap Scenarios: Gaps ought to fill quickly. Should they not, that’s a signal of strength; do not fade. Leaving value behind on a gap-fill or failing to fill a gap (i.e., remaining outside of the prior session’s range) is a go-with indicator.

Auctioning and spending at least 1-hour of trade back in the prior range suggests a lack of conviction; in such a case, do not follow the direction of the most recent initiative activity.

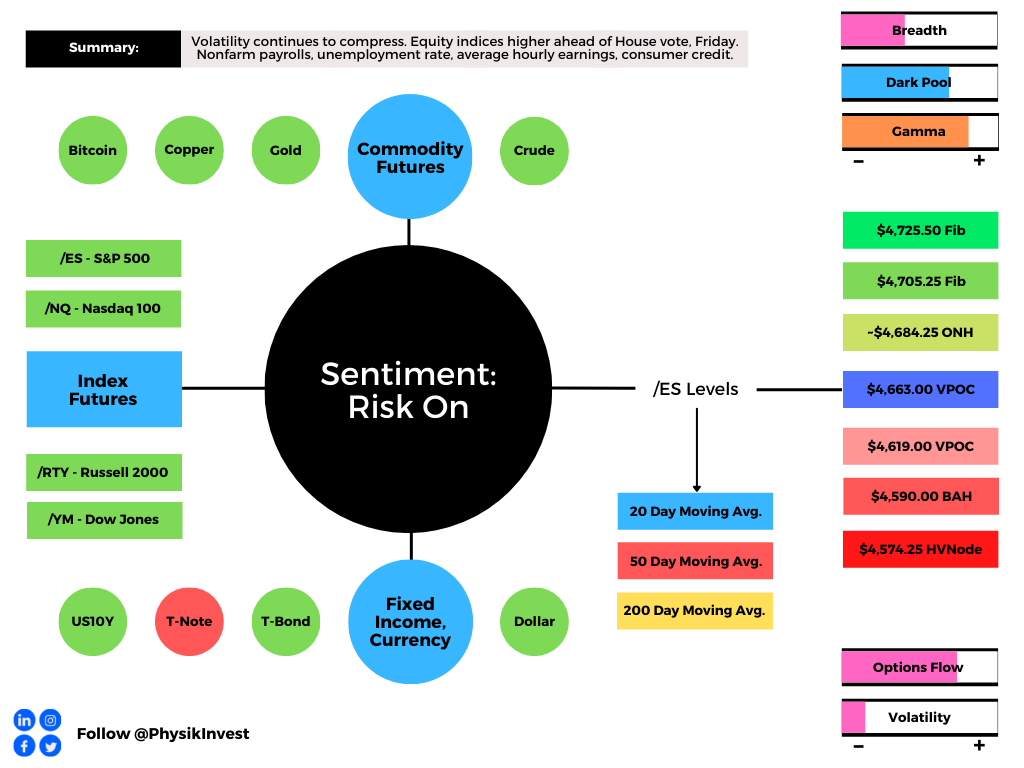
In the best case, the S&P 500 trades sideways or higher; activity above the $4,663.00 untested point of control (VPOC) puts in play the $4,684.25 overnight high (ONH). Initiative trade beyond the ONH could reach as high as the $4,705.25 and $4,725.50 Fibonacci, or higher.

In the worst case, the S&P 500 trades lower; activity below the $4,663.00 VPOC puts in play the $4,619.00 VPOC. Initiative trade beyond the VPOC could reach as low as the $4,590.00 balance boundary and $4,574.25 high volume area (HVNode), or lower.

Click here to load today’s updated key levels into the web-based TradingView charting platform. Note that all levels are derived using the 65-minute timeframe. New links are produced, daily.
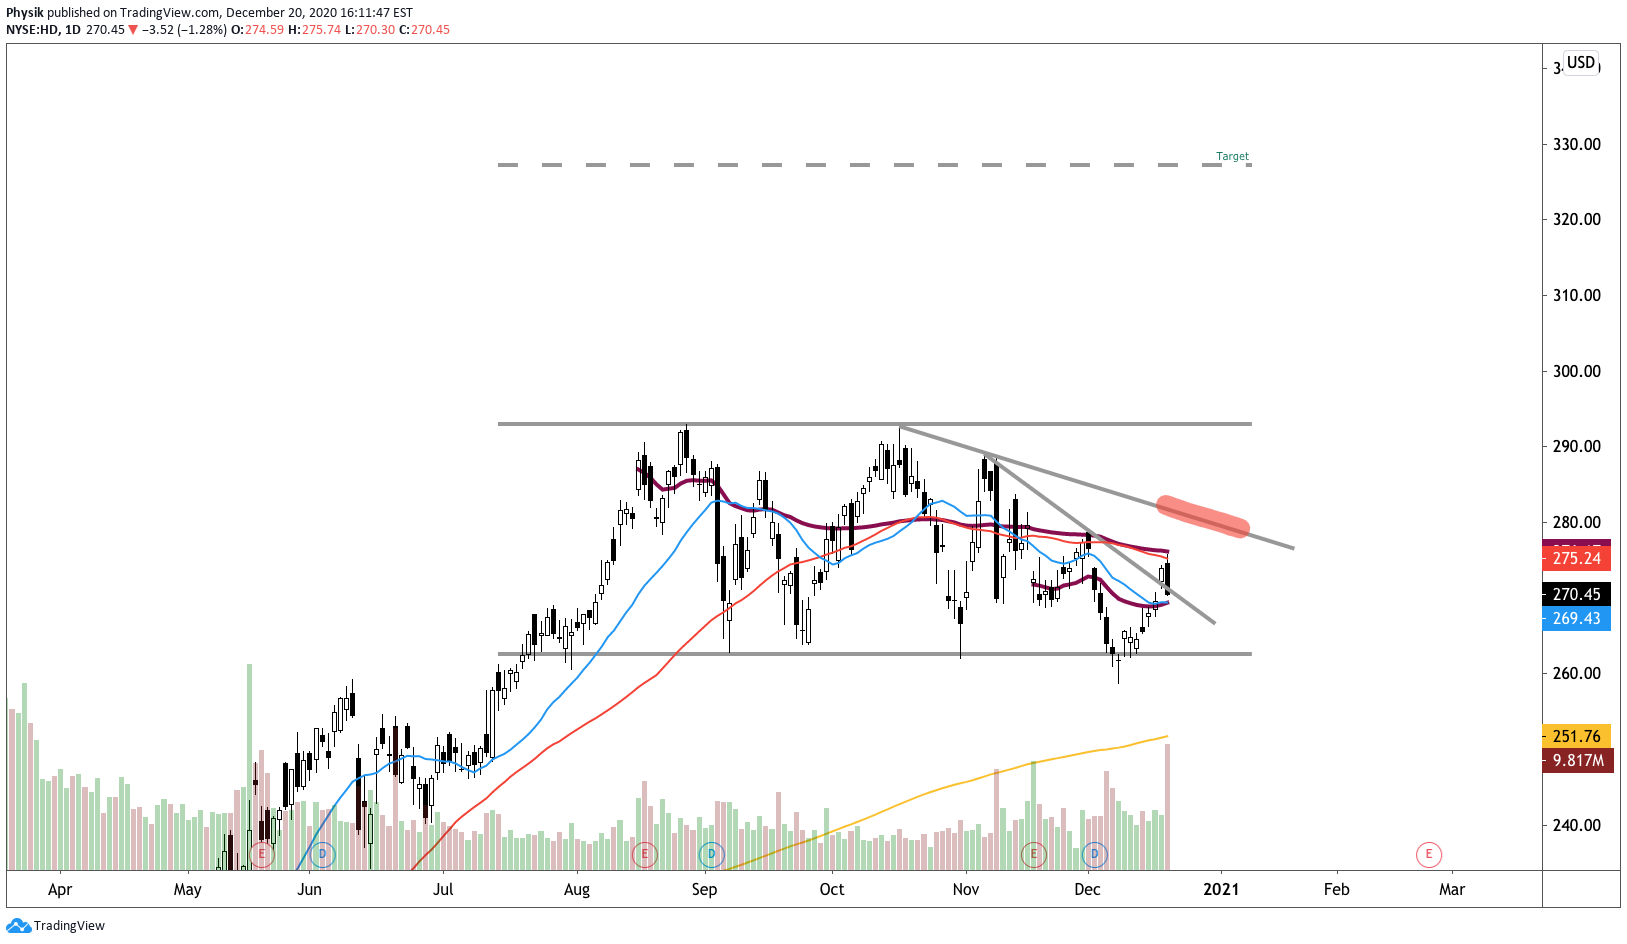
Graphic: 65-minute profile chart of the Micro E-mini S&P 500 Futures. Learn about the profile.

Charts To Watch

Graphic: (NASDAQ: AMZN). (S~3403, R~3580). S is for support. R is for resistance. I am seeking to initiate short-duration call structures against the 3580 gap fill and prior all-time high. Will initiate for credit or finance with put structures.
Graphic: (NASDAQ: FB). (S~326.45, R~336.90). S is for support. R is for resistance. If the stock was to maintain prices above 336.90, there is a potential change in tone. In such a case, I’m targeting Fibonacci retracements with call structures financed with credits on the put side.
Graphic: (NASDAQ: GOOGL). (S~2900, R~3113). S is for support. R is for resistance. I’m targeting prices between 3000 and 3100 with call structures for low cost or credit.
Graphic: (NYSE: SHOP). (S~1482, R~1650). S is for support. R is for resistance. Potential break of trend, move to an all-time high.
Graphic: (NYSE: IWM). (S~234.53, R~241.96, 251.41). S is for support. R is for resistance. Russell 2000 breaks out of balance. In my opinion, upon acceptance, there are potential opportunities for long trades.

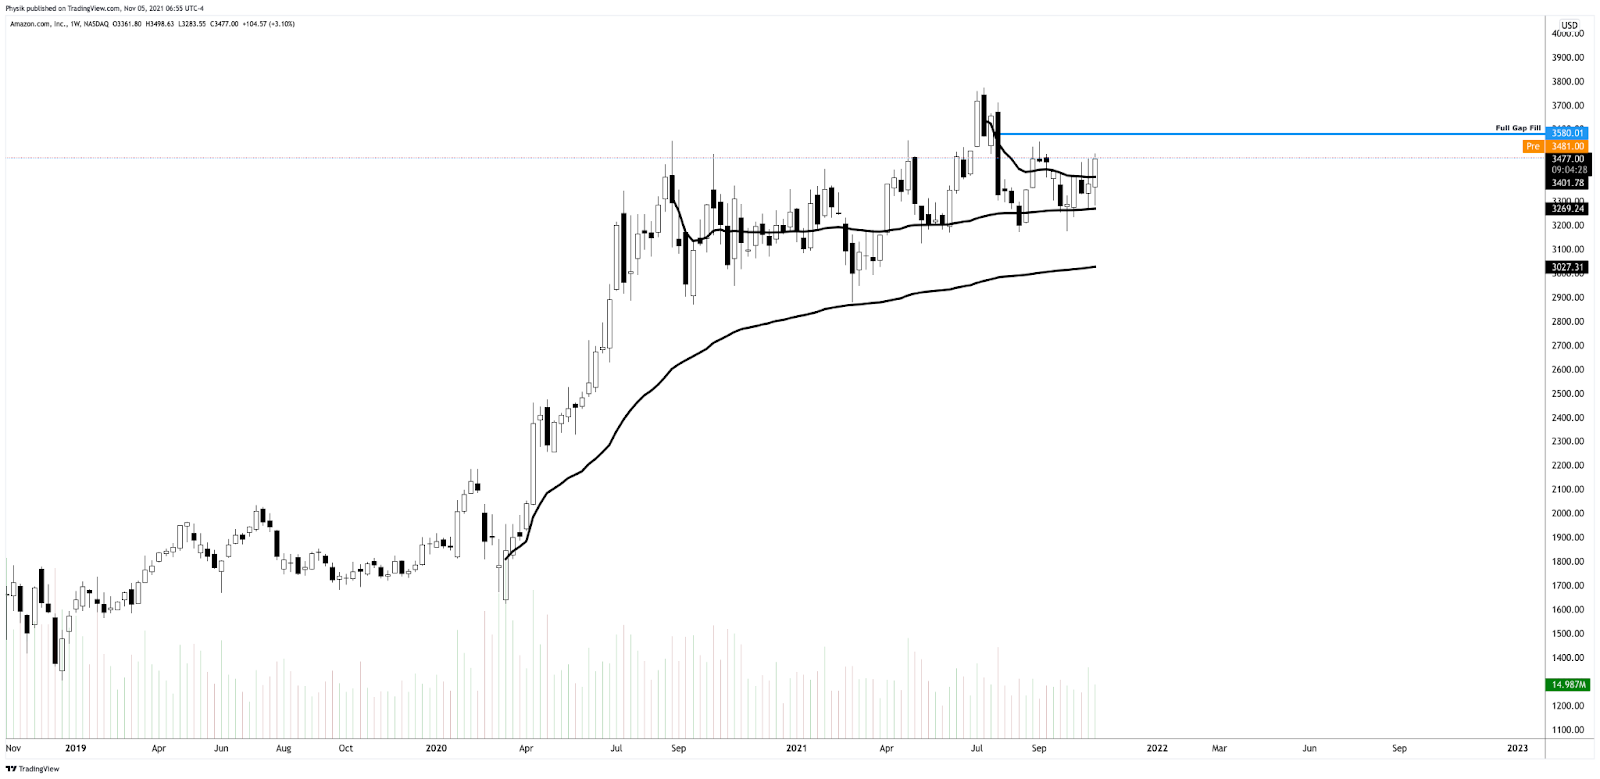
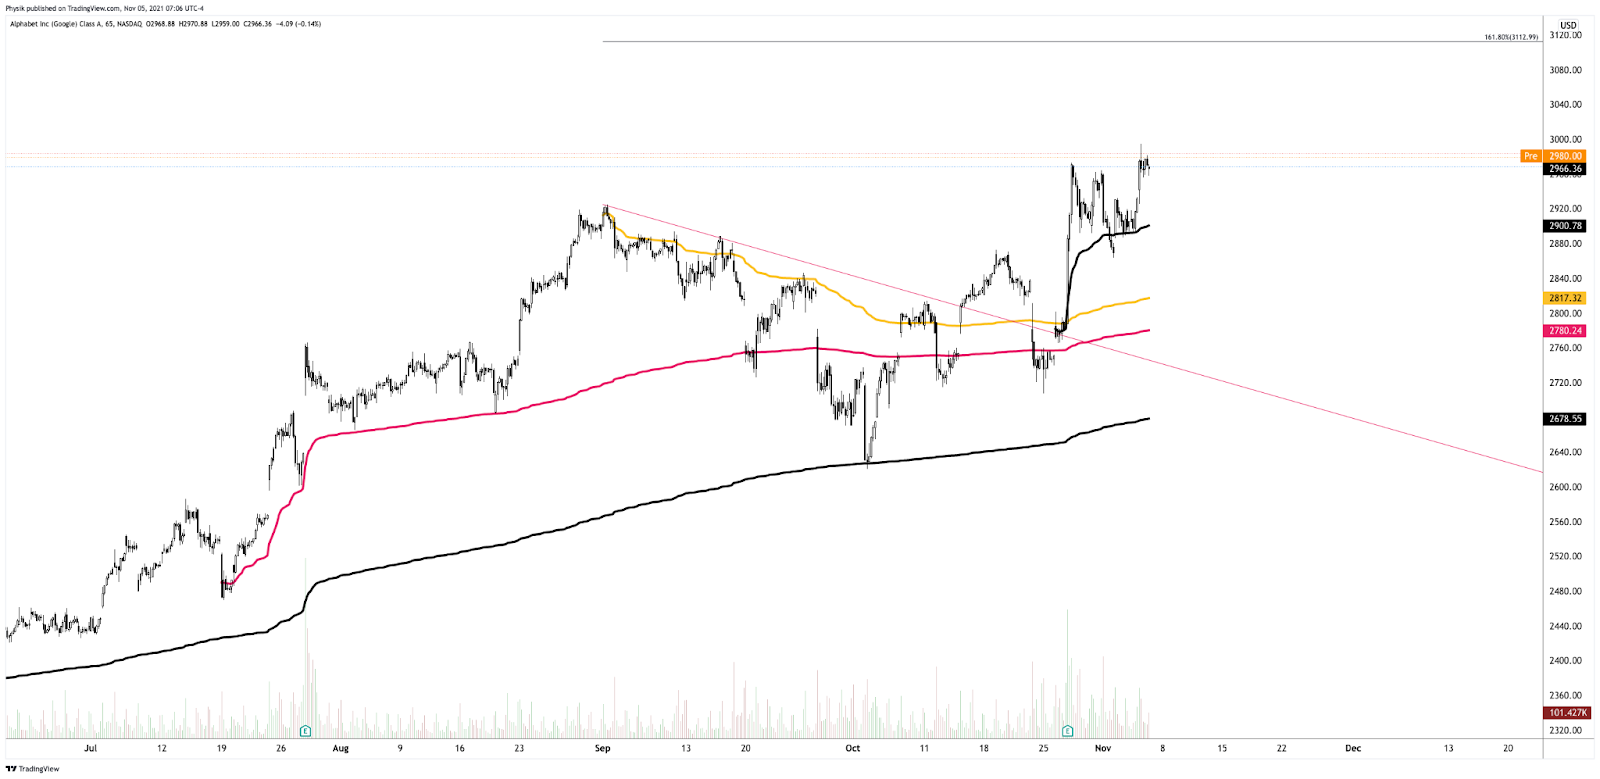
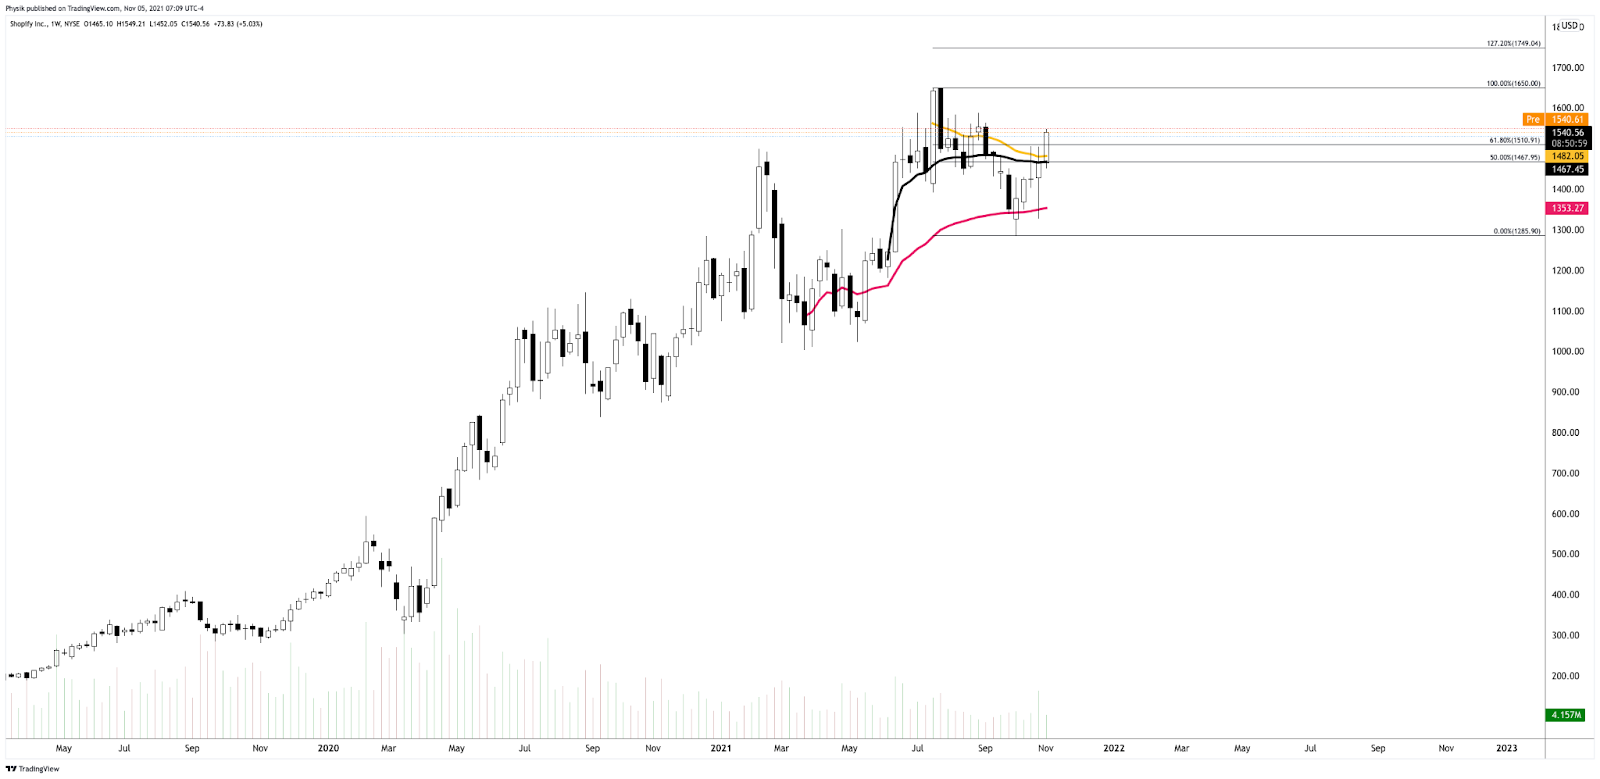
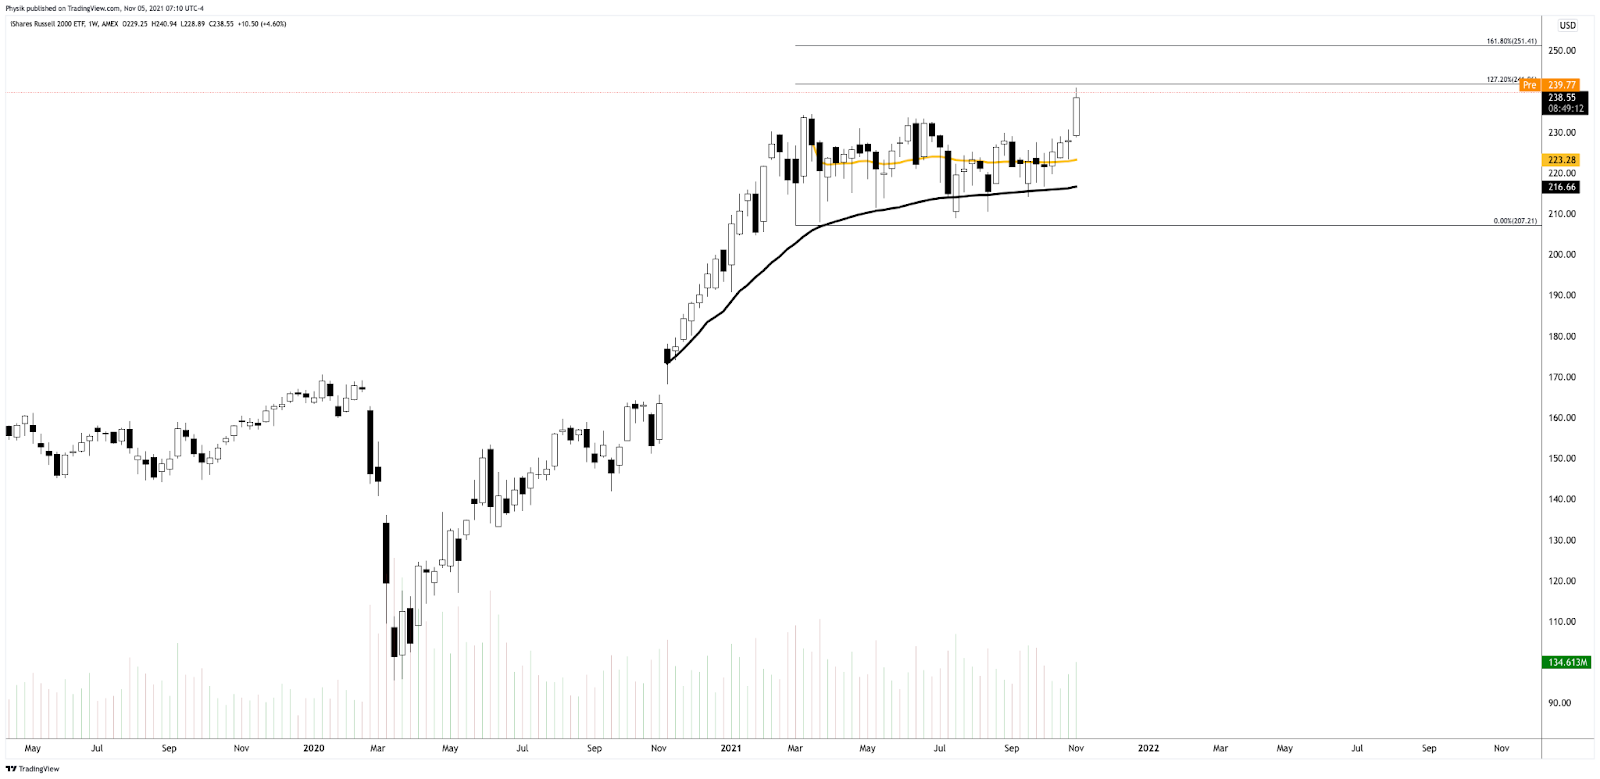
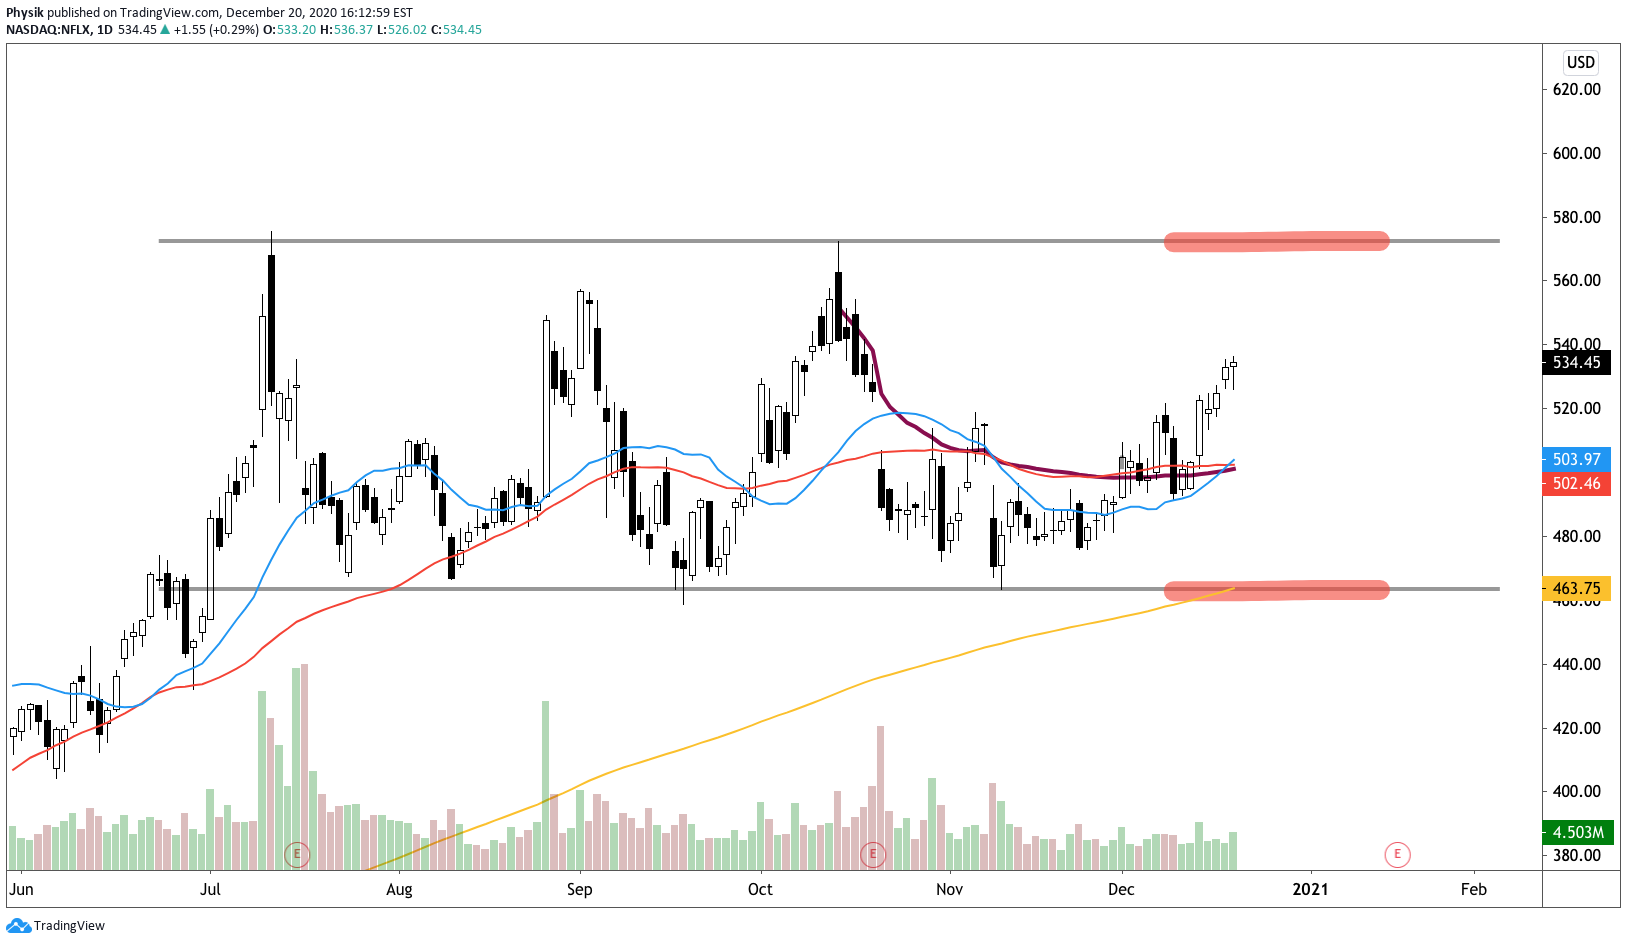
Other charts I’m watching include BABA (S~155.29), ZM (S~245.92), ARKK (S~120.15), PINS (S~42.06), Z (S~58.15), BBY (S~123.65), GOOS (S~40.91), CTSH (R~82.00), LYFT (S~44.41), TMUS (S~118.00), WDC (51.47). S is for support. R is for resistance. 

What People Are Saying

Definitions

Cave-Fill Process: Widened the area deemed favorable to transact at by an increased share of participants. This is a good development.

Overnight Rally Highs (Lows): Typically, there is a low historical probability associated with overnight rally-highs (lows) ending the upside (downside) discovery process.

Volume Areas: A structurally sound market will build on areas of high volume (HVNodes). Should the market trend for long periods of time, it will lack sound structure, identified as low volume areas (LVNodes). LVNodes denote directional conviction and ought to offer support on any test. 

If participants were to auction and find acceptance into areas of prior low volume (LVNodes), then future discovery ought to be volatile and quick as participants look to HVNodes for favorable entry or exit.

Gamma: Gamma is the sensitivity of an option to changes in the underlying price. Dealers that take the other side of options trades hedge their exposure to risk by buying and selling the underlying. When dealers are short-gamma, they hedge by buying into strength and selling into weakness. When dealers are long-gamma, they hedge by selling into strength and buying into weakness. The former exacerbates volatility. The latter calms volatility.

POCs: POCs are valuable as they denote areas where two-sided trade was most prevalent in a prior day session. Participants will respond to future tests of value as they offer favorable entry and exit.

Balance (Two-Timeframe Or Bracket): Rotational trade that denotes current prices offer favorable entry and exit. Balance-areas make it easy to spot a change in the market (i.e., the transition from two-time frame trade, or balance, to one-time frame trade, or trend). 

Modus operandi is responsive trade (i.e., fade the edges), rather than initiative trade (i.e., play the break).

Value-Area Placement: Perception of value unchanged if value overlapping (i.e., inside day). Perception of value has changed if value not overlapping (i.e., outside day). Delay trade in the former case.

About

After years of self-education, strategy development, and trial-and-error, Renato Leonard Capelj began trading full-time and founded Physik Invest to detail his methods, research, and performance in the markets.

Additionally, Capelj is a Benzinga finance and technology reporter interviewing the likes of Shark Tank’s Kevin O’Leary, JC2 Ventures’ John Chambers, and ARK Invest’s Catherine Wood, as well as a SpotGamma contributor, developing insights around impactful options market dynamics.

Disclaimer

At this time, Physik Invest does not manage outside capital and is not licensed. In no way should the materials herein be construed as advice. Derivatives carry a substantial risk of loss. All content is for informational purposes only.

Categories
Commentary

Daily Brief For April 28, 2021

Market Commentary

Index futures balance, trade sideways.

  • Traders honed in on a Fed taper.
  • A heavy day of earnings, FOMC.
  • Expect chop or responsive trade. 

What Happened: Ahead of key economic developments, U.S. stock index futures auctioned sideways-to-lower overnight. Yields and the dollar rose.

This activity comes alongside reports of strong earnings from heavily weighted index constituents. Alphabet Inc (NASDAQ: GOOGL), Microsoft Corporation (NASDAQ: MSFT), and Pinterest (NYSE: PINS) were some of the most anticipated reports.

Today, Joe Biden will unveil his “American Families Plan” in an address to Congress, the Federal Reserve will provide clarity on its monetary easing plan, and Apple Inc (NASDAQ: AAPL), among others, will report their earnings.

Graphic updated at 8:20 AM EST.

What To Expect: Wednesday’s regular session (9:30 AM – 4:00 PM EST) will likely open inside of prior-range and -value, suggesting a limited potential for immediate directional opportunity. 

Adding, over the past few sessions, volumes have dwindled and responsive trade has been the course of action. This is in anticipation of impactful fundamental developments, like the FOMC meeting, today.

Responsive Buying (Selling): Buying (selling) in response to prices below (above) area of recent price acceptance.

Goldman Sachs Group Inc (NYSE: GS) expects the Fed to keep rate hikes off the table until mid-2023. Given that labor slack remains high, the odds of tapering are rather slim.
Graphic: Goldman Sachs’ timeline for Federal Reserve tapering, via ForexLive.

That said, today’s trade will likely be volatile and participants can trade from the following frameworks. 

In the best case, the S&P 500 trades sideways or higher; activity above the $4,186.75 ledge targets the $4,191.75 overnight high (ONH). Initiative trade beyond the ONH may introduce excess and could reach as high as the Fibonacci-derived price targets, $4,197.25-$4,263.00. 

Ledges: Flattened area on the profile which suggests responsive participants are in control, or initiative participants lack the confidence to continue the discovery process. The ledge will either hold and force participants to liquidate (cover) their positions, or crack and offer support (resistance).

Overnight Rally Highs (Lows): Typically, there is a low historical probability associated with overnight rally-highs (lows) ending the upside (downside) discovery process.

Excess: A proper end to price discovery; the market travels too far while advertising prices. Responsive, other-timeframe (OTF) participants aggressively enter the market, leaving tails or gaps which denote unfair prices.

In the worst case, the S&P 500 trades lower; activity below $4,166.75 regular-trade low (RTH Low) targets the $4,164.25 high-volume area (HVNode). Thereafter, if lower, participants can look for responses at the $4,163.25, $4,137.25, and $4,122.75 HVNodes.

Volume Areas: A structurally sound market will build on past areas of high volume. Should the market trend for long periods of time, it will lack sound structure (identified as a low-volume area which denotes directional conviction and ought to offer support on any test). 

If participants were to auction and find acceptance into areas of prior low-volume, then future discovery ought to be volatile and quick as participants look to areas of high volume for favorable entry or exit.

As long as prices remain within the prior day’s range, responsive trade is the course of action. Participants should approach today’s session with extra caution, given the potential for headline-driven initiative activity. Big picture, though, the bullish narrative remains intact unless the S&P 500 is able to auction and spend time below the $4,110.50 minimal excess low (also the balance-area low). 

Initiative Buying (Selling): Buying (selling) within or above (below) the previous day’s value area.

Balance (Two-Timeframe Or Bracket): Rotational trade that denotes current prices offer favorable entry and exit. Balance-areas make it easy to spot change in the market (i.e., the transition from two-time frame trade, or balance, to one-time frame trade, or trend).
Graphic: 4-hour profile chart of the Micro E-mini S&P 500 Futures.
Graphic: SHIFT search maps out the trade of call and put options in the SPDR S&P 500 ETF Trust (NYSE: SPY), for April 27. Activity in the options market was primarily concentrated in short-dated tenors, in strikes near current prices. Data suggests participants, in insignificant amounts, added call-side exposure into the beginning of May. Sentiment flips into the end of May, beginning of June. 

News And Analysis

Economy | Biden unveils a massive family aid plan funded by taxing the rich. (BBG)

Economy | Fed to stay patient as U.S. outlook improves: decision-day guide. (BBG)

Commodities | Goldman sees commodities rallying over the next six months. (FP)

Markets | Tesla accused by EPA of auto-coating emissions reporting failure. (BBG)

Markets | Airbus unit has pleaded guilty to corruption over Saudi contracts. (BBG)

Commodities | OPEC+ is sticking to plan to ease oil output cuts from May 1. (REU)

Markets | Local banks, like their giant rivals, are finding loan growth elusive. (BBG)

Markets | Turning tide signals ebbing of liquidity ocean, analysis suggests. (REU)

What People Are Saying

Innovation And Emerging Trends

Markets | Chatting with Cathie Wood, the CEO, and CIO at ARK Invest. (MM)

FinTech | Trader-inspired brokerage Edge Clear launches new platform. (BZ)

FinTech | Barclays taps amount over end-to-end digital banking solutions. (BZ)

Financing | IRR in emerging tech hubs starting to overtake Silicon Valley. (TC)

FinTech | ICE introduces ultra-low-latency wireless services in Europe. (MM)

About

Renato founded Physik Invest after going through years of self-education, strategy development, and trial-and-error. His work reporting in the finance and technology space, interviewing leaders such as John Chambers, founder, and CEO, JC2 Ventures, Kevin O’Leary, Canadian businessman and Shark Tank host, Catherine Wood, CEO and CIO, ARK Invest, among others, afforded him the perspective and know-how very few come by.

Having worked in engineering and majored in economics, Renato is very detailed and analytical. His approach to the markets isn’t built on hope or guessing. Instead, he leverages the unique dynamics of time and volatility to efficiently act on opportunity.

Disclaimer

At this time, Physik Invest does not manage outside capital and is not licensed. In no way should the materials herein be construed as advice. Derivatives carry a substantial risk of loss. All content is for informational purposes only.

Categories
Commentary

‘Rising Tide Lifts All Boats’: Market Commentary For The Week Ahead

Key Takeaways:

What Happened: U.S. index futures auctioned to new all-time highs before weakening into Friday’s derivative expiry.

What Does It Mean: After participants established a rally-high in the December 9 overnight session, the S&P 500 liquidated down to the balance-area boundary near $3,625.00.

After the December 14 gap open on COVID-19 coronavirus vaccine and stimulus progress, for the remainder of the week, indices negated prior selling, establishing a new all-time high. Friday’s trade managed to repair some structural deficiencies left in the aforementioned advance.

Pictured: Profile overlays on a 65-minute candlestick chart of the Micro E-mini S&P 500 Futures

What To Expect: Friday’s session found responsive buyers surface at the low-volume node (LVNode) near $3,680.00. Low-volume areas denote directional conviction and ought to resist future auction rotations. Auctioning through the LVNode would foreshadow further rotation and trade as low as the balance-area low.

Given that the higher-time frame breakout remains intact and selling appears non-committal, participants will come into Monday’s session knowing the following:

  1. Both sentiment and positioning are historically stretched, while the recovery remains uneven
  2. Inflation remains cool due to the profound influence of disruptive innovation.
  3. U.S. Congress reaches deal on COVID-19 aid package, plans votes for Monday. 
  4. The decline in realized correlation due to factor and sector rotation, as well as the return of systematic option selling strategies will push the long-gamma narrative in which volatility is suppressed and the market pins or slowly rises in a range-bound fashion.
  5. The S&P 500’s higher-time frame breakout remains intact (see chart below); JPMorgan Chase & Co. (NYSE: JPM) confirms equities will rally short-term with the S&P 500 auctioning as high as $4,000.
  6. Despite high CAPE ratios, stock-market valuations aren’t that absurd.

Therefore, the following frameworks for next week’s trade apply.

In the best case, buyers maintain conviction and hold the index above the $3,680.00 LVNode. Auctioning below said reference denotes a change in conviction. Participants would then look for a response near the $3,667.75 HVNode. Failure to remain above the HVNode would portend rotation, further balancing. 

In the worst case, participants initiate below the $3,625.00 balance-area low, jeopardizing the higher-time frame breakout.

Conclusion: As BlackRock Inc (NYSE: BLK) said, “a rising tide lifts all boats”; though financial markets have largely priced in positive news surrounding vaccines and stimulus, the rally remains intact, bolstered by a drive for yield — technical factors as a result of systemic and hedge fund strategies, among other things.

Pictured: Retest of the upside breakpoint on a daily candlestick chart of the cash S&P 500 Index

Levels Of Interest: $3,740.75 and $3773.75 price extensions, $3,724.25 all-time rally high, the micro-composite HVNode at $3,707.75, $3,691.00, and $3,667.75, as well as the $3,680 LVNode and poor structure near the $3,625.00 balance-area low.

Bonus: Here is a look at some of the opportunities unfolding.

Photo by Fede Roveda from Pexels.