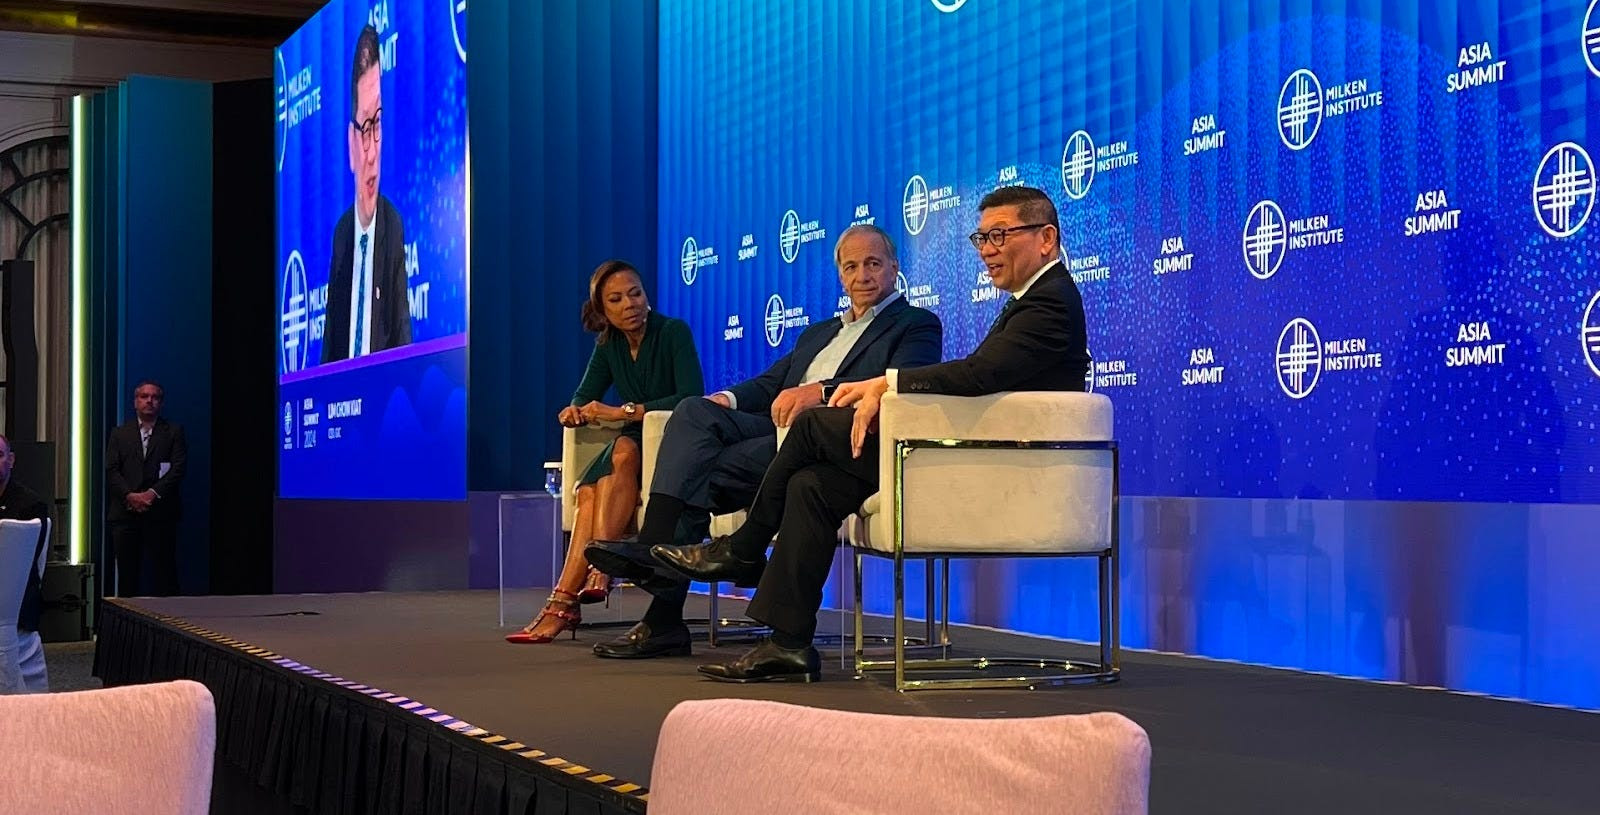
Last month, we had the privilege of attending the Milken Institute’s Asia Summit in Singapore, often seen as the West’s gateway to Asia. Prominent figures, including Bridgewater Associates Founder and CIO mentor Ray Dalio, shared insights on navigating a rapidly transforming, multipolar world. Dalio focused on the major forces shaping global conditions—such as debt cycles, political instability, great power conflicts, climate change, and technology—and highlighted where investment opportunities lie. While the U.S. market may be priced to perfection, Dalio pointed to regions like China and other parts of Asia as offering greater potential.
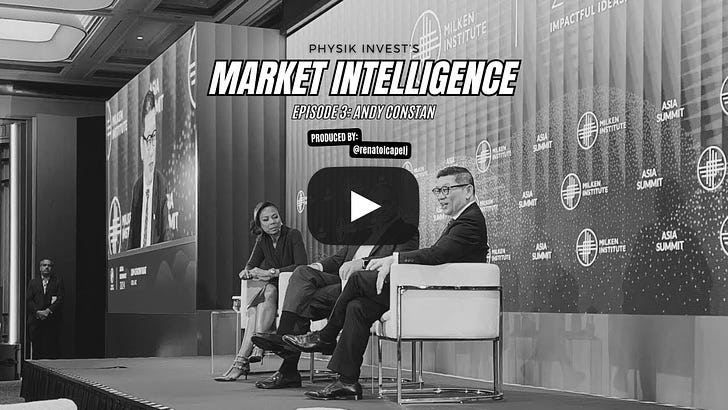
Fresh from Singapore, we sat down with Andy Constan, Founder, CEO, and CIO of Damped Spring Advisors, whom you may recognize from his appearances on CNBC or Twitter/X. Constan’s background is rooted in extracting value through “relative value” trades, but since the Global Financial Crisis and his time at Bridgewater Associates working alongside Ray Dalio, he’s shifted his focus to macroeconomic factors. In this discussion, we explore his experience building Bridgewater’s volatility pillar, the vulnerability of traditional alpha strategies during macro crises, the bull market for metals, stock market expectations, and more.
As you may have noticed, there’s a progression in our podcast episodes. In the first, Mat Cashman, a former market maker, broke down what options are and how they’re traded. In the second, Vuk Vukovic, founder of an upstart hedge fund, discussed idea generation and using options as tools to express those ideas. Now, in our third episode, Constan dives into how options fit into a balanced portfolio. The key takeaway? While options can enhance portfolios, most investors don’t need leveraged exposure to markets. A balanced portfolio in 2025 can remain straightforward, and here’s an expert telling you just that.
The video can be accessed at this link and below. An edited transcript follows.
I recently attended the Milken Institute event in Singapore, where Ray Dalio was a keynote speaker. Since you worked alongside Ray at Bridgewater, I thought it would be interesting to hear your perspective. Some key themes he discussed included multipolarity, deglobalization, internal disorder, elections, and the fact that a few companies drive much of the S&P 500 Index’s performance. Could you start by sharing a bit about your time at Bridgewater? What was your role, and how may those themes and what you learned there shape your portfolio today?
Before joining Bridgewater Associates as a senior research team member, I ran a hedge fund, focusing heavily on equity relative value, volatility, capital structure arbitrage, risk arbitrage, long-short strategies, and statistical arbitrage. Through my hedge fund experience, I looked at volatility across different asset classes—rates, equity, currency, and commodities. By the time I joined Bridgewater, I had accumulated 23 years of experience, including 18 years at Salomon Brothers, where I was involved in market-making and prop trading, and five years running my hedge fund.
When I joined in 2010, the idea was to see if I could contribute to Bridgewater’s investment process in areas they hadn’t previously explored. I created the volatility pillar within their idea generation team, working closely with Ray Dalio, Greg Jensen, Bob Prince, who were the three CIOs at the time, and several talented young individuals, including Karen Karniol-Tambour, now the Co-CIO, and Bob Elliott, now a well-known figure on Twitter/X who was always excellent at asking probing questions.
This role exposed me to macro factors I hadn’t previously focused on. I noticed that traditional alpha strategies often blew up during macroeconomic crises, convincing me that many of them—like long-short equity, leveraged derivatives, and convertible bond arbitrage—were vulnerable to the same risks. The Global Financial Crisis clearly illustrated how macro factors, along with central bank actions like quantitative easing and tightening or lowering and raising interest rates, influence monetary conditions and the availability of leverage; when financial conditions tighten, seemingly uncorrelated alpha strategies unravel.
Bridgewater’s focus is on directionally trading the most liquid assets globally. Before my time there, they primarily traded futures and cash securities, with little exposure to options or derivatives. So, my role was to explore whether the volatility market could offer insights to enhance their directional trading or even serve as a new asset class responding to their existing macro indicators.
Does Bridgewater still have this volatility pillar?
While my connections at Bridgewater remain strong, we don’t discuss business. Like most hedge funds, their work happens behind closed doors. In any case, I don’t believe they’re involved in those markets, as they’re typically too small for their size; instead, it is more likely they use some of the strategies I helped develop—focused on volatility, credit markets, and other convex assets—to refine their directional views on traditional, highly liquid macro assets.
Were there any trades—or even just ones you were eager to pursue—that Bridgewater decided not to go after?
Three days after I joined, the Flash Crash occurred. The market was already on edge, particularly with European turmoil. Earlier that spring, the Greek debt market had been rocked by significantly higher deficit expectations, sparking the European debt crisis just ahead of the Flash Crash. When the crash happened, it cemented for many investors that a more volatile post-GFC regime would persist for years.

Why does this matter?
A persistent demand for long-term equity volatility has run over many funds and investors throughout my career. This demand primarily comes from insurance companies, which can’t sell traditional investment management products but want to, as their clients are the same retail investors who may purchase money management services for their 401(k)s or pensions. Essentially, the clients have savings they want to invest, and the insurance companies have life insurance policies—like Term Life—that historically acted as fixed-income securities. You get a guaranteed death benefit, and your policy accrues value based on interest rates.
With interest rates incredibly low then, insurance companies in the mid-1990s began creating securities that offered guaranteed death benefits with upside exposure to equities. They bought equity portfolios, added interest rate swaps, and purchased puts on the S&P 500, creating a bond with a call option on equities. This enabled clients to receive a guaranteed death benefit with potential equity performance upside. Accordingly, the aggressive demand for these products pushed up long-term volatility, as these were 10- to 20-year death benefit products, and long-term call options became highly sought. This affected the dividend market—dealers who sold these calls became exposed to dividends.
Initially, Swiss banks like UBS O’Connor and First Boston and some French banks supplied the calls. However, by the mid-to-late ’90s, the demand overwhelmed them as markets grew more volatile, mainly due to the increasing tech concentration in the index. Long-Term Capital Management (LTCM) stepped in, selling global index volatility for five years. This did not end well, and after LTCM was unwound, long-term volatility remained well-bid as insurance companies continued buying these structures and selling them to clients. Warren Buffett eventually stepped in during the GFC, selling $9 billion notional in five- to ten-year S&P puts. He saw it as a good bet, figuring that buying stocks at $700 in ten years after collecting premiums was favorable. Uniquely, he wasn’t required to post any collateral—a situation unlikely ever to repeat. However, Buffett eventually unwound this position as the market rallied following the GFC lows around the Flash Crash.
With Buffett out of the game, no willing sellers of long-term volatility existed. The banks and LTCM had been burned, and even though Buffett avoided getting burned, his exposure to Vega (i.e., the impact of volatility on an option’s price) still cost him.
At one point, we saw 10-year implied volatility reach 38%. I spent weeks crafting a case for Bridgewater, supported by data, evaluating the size and forward demand of the insurance market and potential players who could self-insure. We analyzed whether selling 38 implied volatility was a good trade and gathered historical data from every stock market, from 1780s UK to post-Soviet Russia, to assess risk. As it turns out, selling a 38 implied volatility would have been profitable in most cases. The only exceptions were Germany, Italy, and Japan, where WWII drove realized volatility above 38. Never before in the US, UK, or elsewhere had there been sustained realized 38 volatility.
Confident in my findings, I presented this trade idea to Bridgewater, but we ultimately didn’t execute it. The following year, realized volatility dropped below 20, and implied volatility fell by 12-13 points. Had Bridgewater made the trade, it could have likely netted $1 billion in the first year and over $20 billion over the decade.
Did that, in terms of how they made decisions and portfolios guide how you think about making decisions today?
Yes. Bob Prince pulled me aside during the process and said, “We like what you’ve done, but we need you to think differently.”
At Bridgewater, the way they want you to think makes perfect sense. If you’re serious about having a long-term investment process, you need something you can use consistently, day in and day out. You’re not just looking to trade—you want an alpha stream that endures. That’s the real asset. Once a trade is done, if it can’t be repeated, all the effort is wasted. Bridgewater’s focus—and anyone involved in systematic trading should—was discovering long-term alpha streams.
The biggest constraint, both at Bridgewater and everywhere, is time. You have to be selective about where you invest it. For CIOs, learning to trade options proficiently would have been a massive time drain and likely hurt their performance in building a sustainable, long-term alpha-generating engine, which already demanded their full attention.
So that’s the key—what is your time worth? I believe they made the right decision. Investment researchers should focus on creating lasting alpha, not short-term trades.
What did your early work at Solomon Brothers—being on the Brady Commission following the 1987 stock market crash—teach you about the interplay between participants and how this affects liquidity and market outcomes?
At 23, I was fortunate to be assigned to the Brady Commission. What set me apart was a relatively ordinary skill for my generation: I was particularly good at working with spreadsheets. This put me at the table with five senior investment professionals from Morgan Stanley, Goldman Sachs, Lehman Brothers, JPMorgan, and the head of research at Tudor, who had made a fortune during the crash. I analyzed actual trades with the names of brokers and end clients—tracking who bought and sold during the crash across multiple markets, including S&P 500 futures, S&P 500 baskets, and rates.
This experience shaped my understanding of markets. Ever since, I’ve been focused on answering who owns what and why. Today, we call this flow and positioning, but knowing who held what and the pressures they faced was invaluable back then. Were they in a drawdown? Were they doing well? Did they see inflows or outflows? Were they levered or not? Understanding these dynamics—and who the players and their end investors were—has been the foundation of my life’s work.
Is that understanding of flow and positioning what guided your career following Solomon Brothers, even when you had the chance to work with firms like Long-Term Capital Management (LTCM)?
When many of my friends at Solomon’s prop desk went off to start LTCM, I had the worst year of my career in 1995. My convertible bond strategy and most hedge funds collapsed due to the Fed tightening. I asked those guys for a job multiple times. Thank God I didn’t get it, but they were the most brilliant people I knew back then. At the time, Solomon had just gotten past the treasury bond auction scandal, which John Meriwether, at least in part, oversaw, and that led to his departure to start LTCM. By then, Solomon was the worst-performing stock in the S&P 500 for the first ten years of my career—bar none. So, when LTCM launched, Solomon wasn’t a great place to be. I thought it through carefully—and even acted on it—but they didn’t want me.
Following LTCM, is that when things started clicking for you from a macro perspective regarding the relationship between macro crises and relative value trades failing? Moving into the future, what are some of the big macro themes you think may affect market outcomes significantly over the next few years?
Honestly, back in 1995, I had no idea what macroeconomics meant or how it worked, and I didn’t fully appreciate its significance. By 1998, it started becoming more apparent with the LTCM unwind. It wasn’t just LTCM; many firms, including Citibank, where I worked, were involved in government bond arbitrage. LTCM was simply the poster child, so attention gravitated there. By 2004, when I started my hedge fund, people were beginning to consider the possibility of hedge funds deleveraging as a cause of widespread contagion. Still, it wasn’t until 2007 and 2008 that I truly grasped the scale of that risk.
In any case, I prefer to operate on a one-year horizon. What’s clear now is that the Fed, more so than other central banks, has concluded that inflation is no longer a concern—it’s not going to re-accelerate. Because of that, they can lower interest rates relatively quickly, even if the job market doesn’t weaken enough to force their hand. You could call it a normalization. Since mid-December of last year, when the Fed started emphasizing the importance of real short-term interest rates, we’ve been on this path toward normalization. The idea is that real short-term rates dictate both inflation and economic strength, and the Fed is fully committed to returning to a normal interest rate—quickly.
The critical question is, are they right? That’s what markets are wrestling with now. Are they correct in saying that financial conditions are tight and that lowering short-term rates will ease those conditions, which flow through to stimulate the economy? Typically, the Fed doesn’t try to steer the economy directly; instead, it responds to and offsets economic pressures. When inflation rises, they hike—and do it aggressively, though often a bit late until they’re confident. They keep hiking until they’re optimistic inflation is rolling over. Conversely, when they cut rates, they should, in my view, be leaning against a trend and responding to a slowing economy that’s disinflationary and underperforming on growth and jobs.
We’re in a strange situation now. The Fed doesn’t need to combat inflation, and they certainly don’t believe they need to. Instead, they think that by acting too cautiously, they risk over-correcting. So they’re normalizing rates. But what does “normal” even mean now? Is the current path of normalization too aggressive? At the heart of it, this revolves around the pace and destination of rate cuts. That’s what we need to watch moving forward.
There’s also an election coming in early November, which could impact the economy. Politically, I believe it doesn’t matter much which party is in power—they both tend to increase the pie by accumulating more debt and engaging in deficit spending. The difference lies in who and how they distribute that pie. It matters for specific sectors and individual stocks. One might think that oil would do very well under Harris and very poorly under Trump, but one might think that oil companies are going to do very well under Trump and very poorly under Harris. It’s complicated but consequential.
Post-election, I’ll be watching to see if there’s any sign of austerity from either party, though I expect none. We’ll likely continue running budget deficits, though they won’t grow as fast. COVID drove a rapid spike in spending, but we’ve since returned to a more constant deficit. The change in expenditures, rather than the percentage of GDP, influences the economy. If spending remains steady, it acts as a drag. If it grows, it stimulates the economy. How that unfolds depends on the balance of power between the House, Senate, and the Oval Office.
Looking ahead, the Fed will cut rates to around 3%, leading to a soft landing—no significant increase in unemployment and inflation hitting their target. I find that scenario unlikely. It’s like a skipper on a battleship trying to dock perfectly by pulling an antiquated lever. The Fed doesn’t have that much control by tweaking the short-term interest rate; financial conditions matter most to me: the availability and cost of financing for consumers and companies, accumulated wealth, and the health of the dominant financial institutions. Right now, all indicators suggest consumption and investment conditions are favorable. At the corporate and individual levels, income is strong, and corporate profits are expected to remain robust. There’s no need to dissave or leverage up, but they can if they want to consume.
Given these conditions, I’ve remained bullish on the economy since April 2020 and still don’t foresee a recession. This leads me to question why the Fed is normalizing rates and why they believe this won’t stimulate consumption and investment. I think the 3% rate target is too low. If I’m right, inflation will stay sticky or rise slightly relative to their target—not dramatically, as there’s no supply shock, but the demand and monetary sides are still stimulative. Why would major corporations start cutting jobs when they’re reporting record earnings and the economy sees record GDP? I don’t expect a significant weakening in the job market, especially as the government continues deficit spending. In my view, the direction the central bank is taking—normalizing rates—is misaligned with the economy’s current strength.
Is this preemptive action by the Fed a mistake?
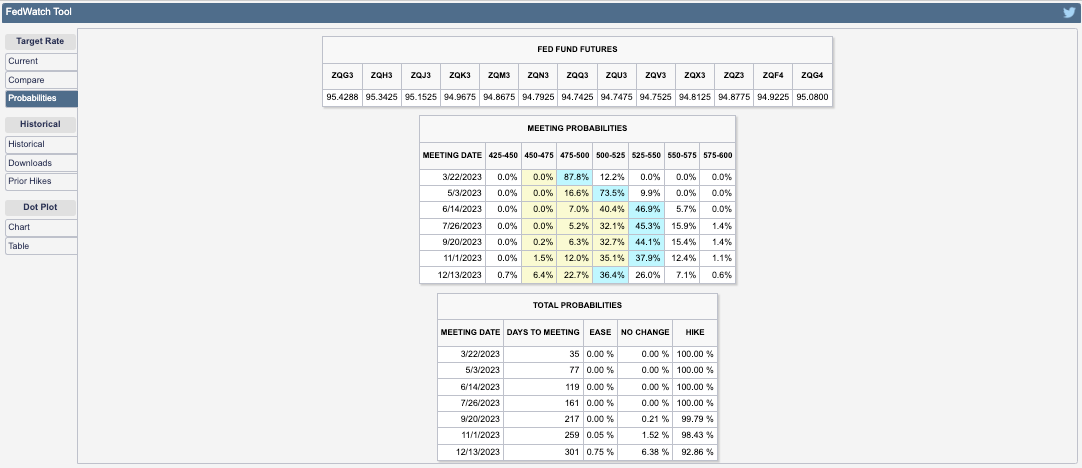
I don’t know. We’ll have to see what Jerome Powell does. He cut rates by 50 basis points, and now (September 25), the markets are pricing in about a 17% chance that the two 25 basis point cuts projected for the next two meetings will happen. There’s an 83% chance we’ll see two 50 basis point cuts or one 50 and one 25. The trough interest rate they’re targeting is now around 2.87%, the lowest we’ve seen, except for a brief moment on August 5 when people called for emergency cuts of 75 basis points. So, that’s a significant drop. Christopher Waller and other Fed officials have indicated that rates will likely come down over the next 6 to 12 months, and there’s plenty of room for further cuts. The Fed’s ‘dots’ representing the minimum projected path for interest rates validate this. Meanwhile, inflation expectations have risen daily since the Fed meeting, with gold at all-time highs, bitcoin rallying, stocks not so much, and long-term bonds selling off. Only very short-term bonds are rallying.
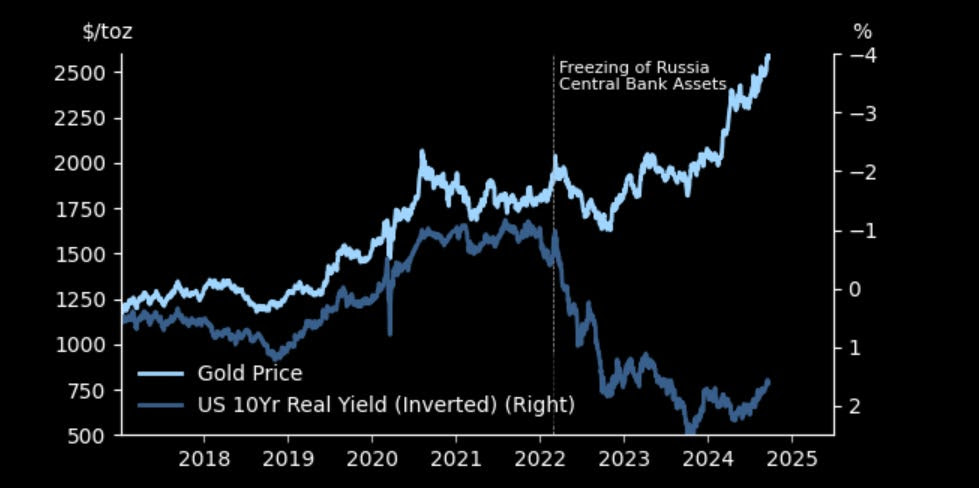
Gold is inversely correlated with rates, correct? So, you have other factors, like buying from central banks, that may help buoy it in recent years, correct?
Yes. Many central banks have been increasing their gold holdings — the obvious ones are China and Saudi Arabia. Switzerland is another, and some of the buying may involve private citizens in some cases. There’s been a broader trend among countries that don’t want to hold U.S. assets, particularly adversaries, turning to alternatives like gold. But this flow is unpredictable. Prices slow it down; people don’t buy gold at any price. It’s fairly inelastic — they’ll buy at most prices but not at every price.
In my framework, I’ve always been bullish on gold since leaving Bridgewater, where I was indoctrinated to understand the value of non-fiat currencies. I haven’t yet bought into Bitcoin because its price is still too correlated with the Nasdaq for me to consider it a true monetary equivalent, though it may become one someday.
Moreover, there are a few ways inflation arises. Demand-side inflation happens when people decide to spend more, which can vary with societal changes and human behavior. Supply-side inflation can come from labor shortages and rising costs in services and manufacturing. However, the latter can’t be hedged with gold because its value doesn’t depend on these forces. The key to gold is its relationship to currency. The more currency that gets printed, the less valuable it becomes relative to gold. Gold is a hedge against monetary inflation. That said, I’m cautious about gold prices in the short term because we’ve diverged from the following three core factors I look at.
First, I see gold as a real currency with a zero coupon. Real rates have fallen but recently stabilized. Despite this, the drop in real rates has driven up gold prices considerably, making gold seem overvalued relative to real rates.
Second, I consider the credibility of central banks. Are they becoming more or less credible? You could debate that all day. You hold gold if you believe there’s less confidence in central banks. I think they’ve done a decent job tackling inflation, at least in perception, which should be bearish for gold since the Fed’s “mission accomplished” suggests stronger credibility.
Lastly, I look at monetary inflation. The U.S. has pretty much wrapped up its money-printing experiment. Sure, we still run a deficit, but that’s different from the aggressive balance sheet expansion we saw before. The balance sheet is still too large, but the impulse has subsided. Meanwhile, China has signaled a willingness to ease credit conditions, lower rates, and encourage banks to buy equities, though they haven’t engaged in fiscal stimulus yet. If they do, China could be where the U.S. was in 2021, which would be bullish for gold. I suspect part of the reason for increased Chinese gold buying is the expectation of significant monetary stimulus. We’ll have to wait and see if that happens, but it would be very bullish for gold if it does.
All things considered, I think gold is overpriced, so I’m trimming my gold positions in my beta portfolio. I’ve even placed a small speculative short position in my alpha portfolio. It’s still a bull market for gold, but bull markets do correct, and I’ll probably be buying the dip when it happens.
In the context of inflation staying sticky, could you foresee a period when, even if markets rise in nominal terms, in real terms, they don’t go anywhere or go down?
The ideal scenario for a broad portfolio to meaningfully outperform cash is if the central bank eases more than expected and inflation doesn’t respond. If that happens, every asset will outperform cash. Is it possible? Of course—it’s happened. Assets have done very well relative to cash this year despite a brief drop in August. But the question remains: can this continue indefinitely? There’s a natural limit to asset growth. Still, for now, the central bank seems more dovish each day despite no supporting data. It raises the question of whether they have an agenda. I don’t believe they know more than anyone else, but their actions suggest a strong confidence that inflation won’t rise. If they’re right, assets should hold up. Will they perform exceptionally next year? Probably not. But with cash yielding less than 4% on a one-year bill, that’s becoming less attractive too.
Leading to the volatility during August, we saw some rotation beneath the surface of the index, with movement into small caps and some softening in names like Nvidia. One could say that foreshadowed further weakness. Still, did you ever anticipate the unsettling volatility we saw and the subsequent quick recovery?
I wrote a fairly extensive piece on the dispersion trade and was bearish on the idea, expecting it to unwind. I was mindful of the yen’s strengthening and role in deleveraging, especially after seeing the wild moves in July following the CPI report. There was some instability, which I anticipated. But, in hindsight, the only real opportunity was to go all-in long at the bottom in August. I covered some positions and bought a bit more, but I didn’t cover enough, and I’m surprised by how strong the reversal was. Looking back, it’s clear the markets were already convinced the Fed would ease aggressively, and that’s where we stand now.
I saw a lot of commentary about how some of that risky positioning could have been doubling down following the August drop. Do you get concerned that this foreshadows something bigger happening in the future?
Everyone currently in the market is where they want to be. Their risk managers are comfortable, they’re comfortable, and they’re not over-leveraged. There’s no one delaying a margin call right now. These speculative unwinds happen fast unless they’re systemic and start feeding on each other. But we didn’t see that. More importantly, there was no sign of any banking institution struggling. The bigger story is consistent (i.e., passive) investment driven by strong incomes, robust job markets, steady 401(k) contributions, insurance plans, and government spending. In addition, reinvesting income from existing investments continues to fuel this trend. From what I see, it’s fairly leveraged, but only a significant drawdown would cause that to reverse.
And when you say meaningful drawdown, what does that look like?
10% corrections would probably mean a dip is less likely to be bought. You know, a 5% correction is just getting bought.
Could you ever foresee, though we have things in place to prevent such a thing from occurring again, a 1987-type crash unwinding some of this risky positioning in a big way? How would that look?
The odds of a stock market crash are low. A slower correction is more likely than a crash.
We had this rapid move down, and we’ve come back up. With markets now near all-time highs, how do you think about portfolio structuring? You talked a bit about positioning in gold, equities, etc. How do you think about structuring a portfolio, and do you look at things like volatility or skew levels as an input or guide?
When constructing a portfolio, the first step is to clarify your goals. For most people, the aim should be building a balanced portfolio that’s diversified across growth and inflation risks. It’s important not to focus on timing markets or picking specific asset classes. Instead, set it and forget it, with a long-term horizon of 10-20 years. Of course, some money will be needed sooner, so you must manage that more conservatively. Depending on your age and job prospects, you might adjust your risk tolerance—the better your prospects, the more risk you can afford.
My advice? Don’t spend time betting on markets. Focus on building a “set it and forget it” beta portfolio of long assets and keep adding to it. Spend your energy earning money outside the market instead. Speculating on markets is tough. It’s a zero-sum game—your gain is someone else’s loss, and that person is likely smart and motivated. It’s “Fight Night,” not passive investing. Thinking you’ll get lucky? These are sharks out there who will devour you. Competing against them far exceeds the costs of gambling in a casino. It’s like playing poker, not blackjack or craps. If you enter the game, you better be confident in your strategy because the competition is fierce.
If I’m not sleeping, I’m working to maintain whatever edge I might have, and I’m still unsure if I even have one. So, how do I build portfolios? Cautiously, with low confidence, sticking to what I know. I balance risk management, never going all in and grinding through it, just like Joey Knish, John Turturro’s character in Rounders. That’s the guy I want to be.
In terms of Damped Spring’s story, what do you want to do there? You’ve been running that for a few years, starting with a very small followership, and then you scaled that up. You’ve gotten to this point? What’s next?
I have a life I enjoy. I maintain relationships with a few hundred institutional clients, and over 15 of the largest firms value my insights. I provide them with my research, and I’ve also built deep connections with professionals—many of whom prefer to remain anonymous—who want to be members of Damped Spring. These members ask me questions like yours, and I give them data-driven answers. My goal is to meet them wherever they are on their learning curve and help them progress in a very hands-on way. Every day, I work with clients, answering their questions thoughtfully or being upfront if I don’t have the answer. I find that incredibly rewarding.
The financial side is a small part; it’s not about the money for me. Institutions pay because they value the service, and I charge individuals mainly to ensure they’re serious and to avoid wasting time with internet trolls. But people care—they want to be part of this community and learn from each other, which is wonderful. I’ll keep doing it for as long as I can add value and people want to hear what I say.
I’ve also started “2 Gray Beards” with Nick Givanovic. It’s a different approach—we offer low-touch, 20-minute videos once a week explaining what’s happening worldwide and what it means for long-only portfolios. People interested in 2 Gray Beards often don’t have much time to consider their investments. Many rely on their financial advisor or money manager, who might charge 80 basis points a year—say $40,000 for someone with decent wealth—and often, they don’t fully understand what the advisor says.
We aim to reach these end clients directly and say, “Here’s what’s happening. Watch these videos for 20 minutes a week for a few months, maybe half a year, and I guarantee you’ll be able to have a more meaningful conversation with your financial advisor. If we’re successful, you might understand your portfolio better than your advisor.” Nick and I see this as valuable and love doing it.
What’s the biggest lesson you’ve learned in the last four years? It could be good or bad.
Underestimating how far momentum could take the market, whether up or down. I was bullish from April 2020 to February 2022, and I thought a 5 or 10% correction in 2022 would be the extent of it—but I stayed long for too long. Likewise, as markets bounced, I held onto my short positions for too long. What’s interesting to me is the role of momentum. It seems to be a more dominant factor than my models have suggested, and while I’m addressing it, it’s still somewhat unclear whether this is driven by momentum strategies or just passive money flows. I’m still learning, but that’s what I’m focused on most right now.
Well, that ties it up. I appreciate your time. It is an honor. Is there something else you’d like to add?
Recognize that beta is the way to go—it’s not difficult, and anyone can guide you through it. However, be cautious not to get too caught up in short-term trading.
Disclaimer
By viewing our content, you agree to be bound by the terms and conditions outlined in this disclaimer. Consume our content only if you agree to the terms and conditions below.
Physik Invest is not registered with the US Securities and Exchange Commission or any other securities regulatory authority. Our content is for informational purposes only and should not be considered investment advice or a recommendation to buy or sell any security or other investment. The information provided is not tailored to your financial situation or investment objectives.
We do not guarantee the accuracy, completeness, or timeliness of any information. Please do not rely solely on our content to make investment decisions or undertake any investment strategy. Trading is risky, and investors can lose all or more than their initial investment. Hypothetical performance results have limitations and may not reflect actual trading results. Other factors related to the markets and specific trading programs can adversely affect actual trading results. We recommend seeking independent financial advice from a licensed professional before making investment decisions.
We don’t make any claims, representations, or warranties about the accuracy, completeness, timeliness, or reliability of any information we provide. We are not liable for any loss or damage caused by reliance on any information we provide. We are not liable for direct, indirect, incidental, consequential, or damages from the information provided. We do not have a professional relationship with you and are not your financial advisor. We do not provide personalized investment advice.
Our content is provided without warranties, is the property of our company, and is protected by copyright and other intellectual property laws. You may not be able to reproduce, distribute, or use any content provided through our services without our prior written consent. Please email renato@physikinvest for consent.
We reserve the right to modify these terms and conditions at any time. Following any such modification, your continued consumption of our content means you accept the modified terms. This disclaimer is governed by the laws of the jurisdiction in which our company is located.