This edition shouts out Public.com, a multi-asset investing platform built for those who take investing seriously. Public recently launched Alpha, an AI investment exploration tool, in the app store. We’re excited to host co-founder and co-CEO Jannick Malling on the next podcast to discuss the market and how AI levels the playing field. Stay tuned!
When market expectations drift too far from underlying fundamentals, they eventually become unsustainable. This sometimes leads to corrections that can trigger cascading effects across the broader market.
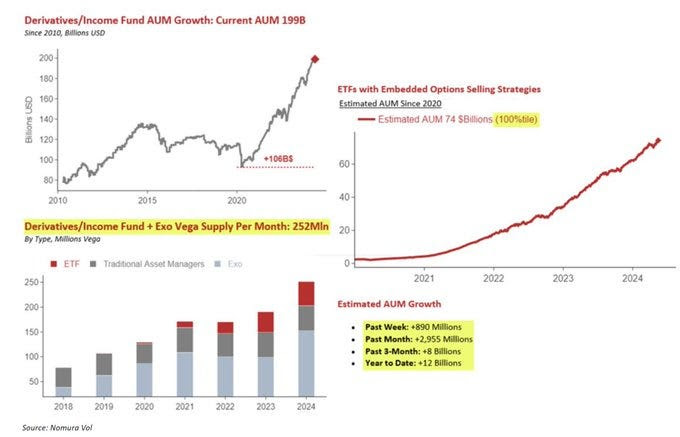
It is prevailing investment practices that partly fuel such a dynamic. While concepts like diversification and efficient markets appear sound, they often fail to account for the pressures investors face in practice. For instance, sophisticated retail investors have no mandate and typically have the space to make deliberate, calculated decisions. On the other hand, institutional-type investors, driven by the need to deliver consistent short-term profits, may feel compelled to chase returns. This pressure can lead to riskier behaviors, such as betting on low volatility by selling options. While this may produce steady returns in calm markets, it exposes investors to sudden shocks, volatility repricings, and forced unwinds when markets turn unexpectedly. Investors are often unprepared for such volatility, seldom owning options outright due to the rarity of shocks. This creates a market landscape skewed toward a “winner-takes-all” outcome, where only a few are positioned to benefit from such rare moments.
The following sections explore this realm of increasingly frequent, dramatic, and unpredictable outcomes. Let’s dive in.
In our excruciatingly detailed ‘Reality is Path-Dependent’ newsletter, we explored how markets are shaped by reflexivity (feedback loops) and path dependency (how past events influence the present), setting the stage for August 2024’s turbulence and recovery.
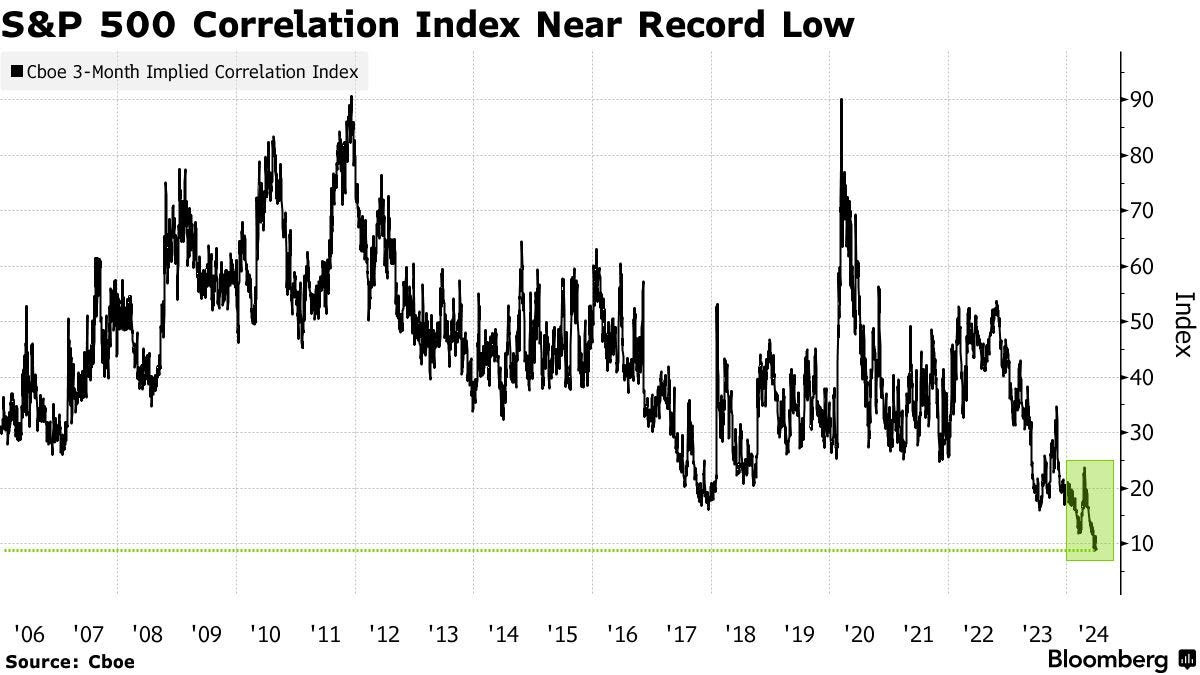
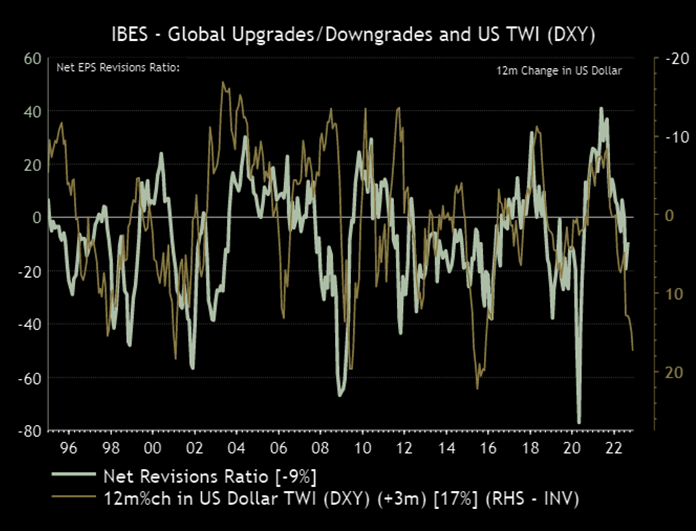
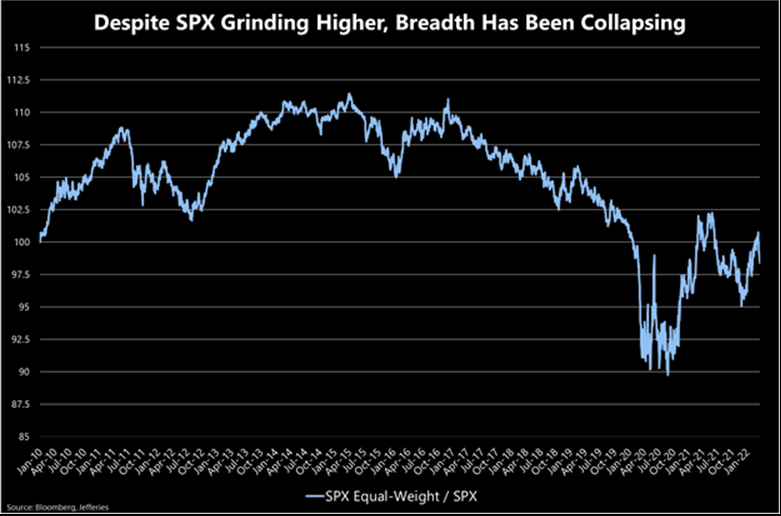
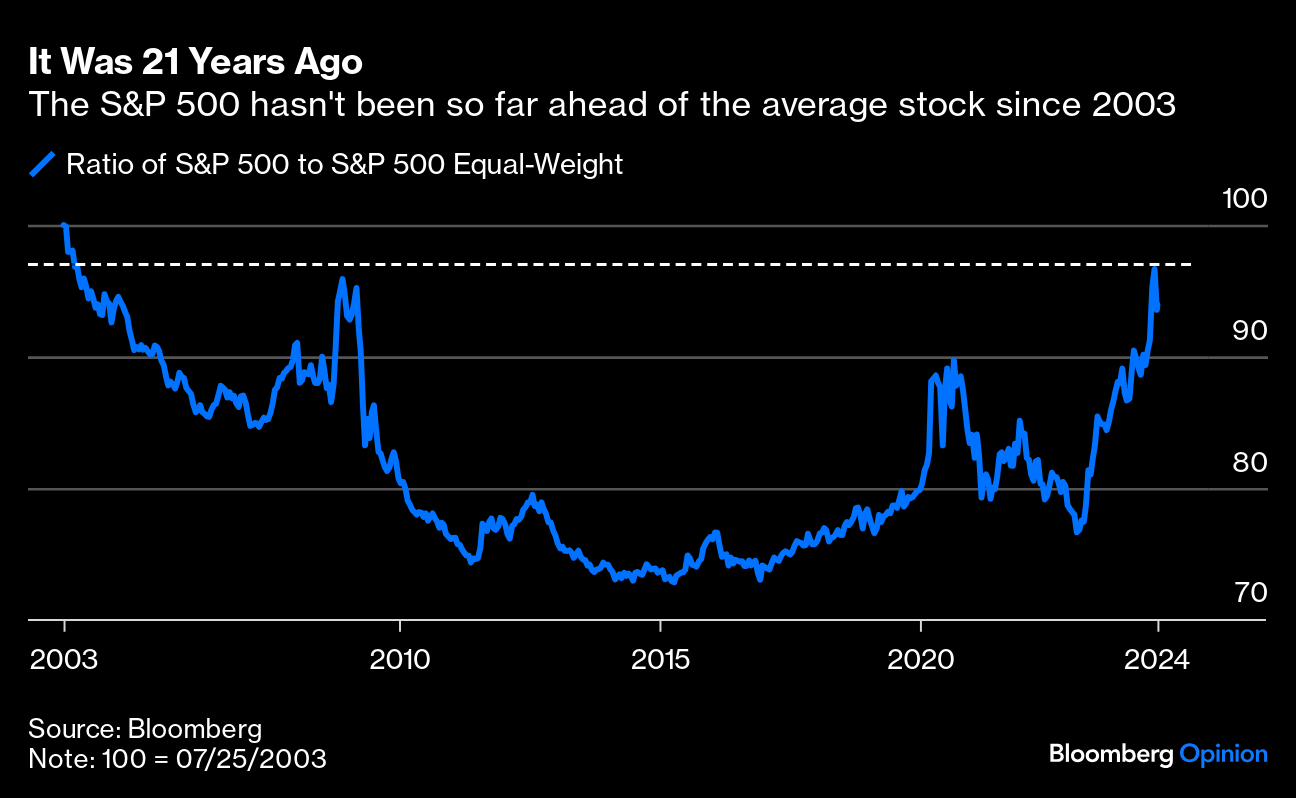
To recap, we noticed that while individual stocks experienced big price swings, the broader indexes, like the S&P 500—representing those stocks—showed restraint. Remarkably, the S&P 500 went over 350 sessions without a single 2% or more significant move lower, reflecting this calm. This happened because of a mix of factors, including many investors focusing on broader market calm, often expressed by selling options and, in some cases, using their profits to double down on directional bets in high-flying stocks. This helped create a gap between the calmer movements in the indexes and wilder swings in individual stock components, leading to falling correlations; beneath the surface, big tech, AI, and Mag-7 stocks gained ground, while smaller stocks in the index struggled, as shown by fewer stocks driving the market higher (weaker breadth).
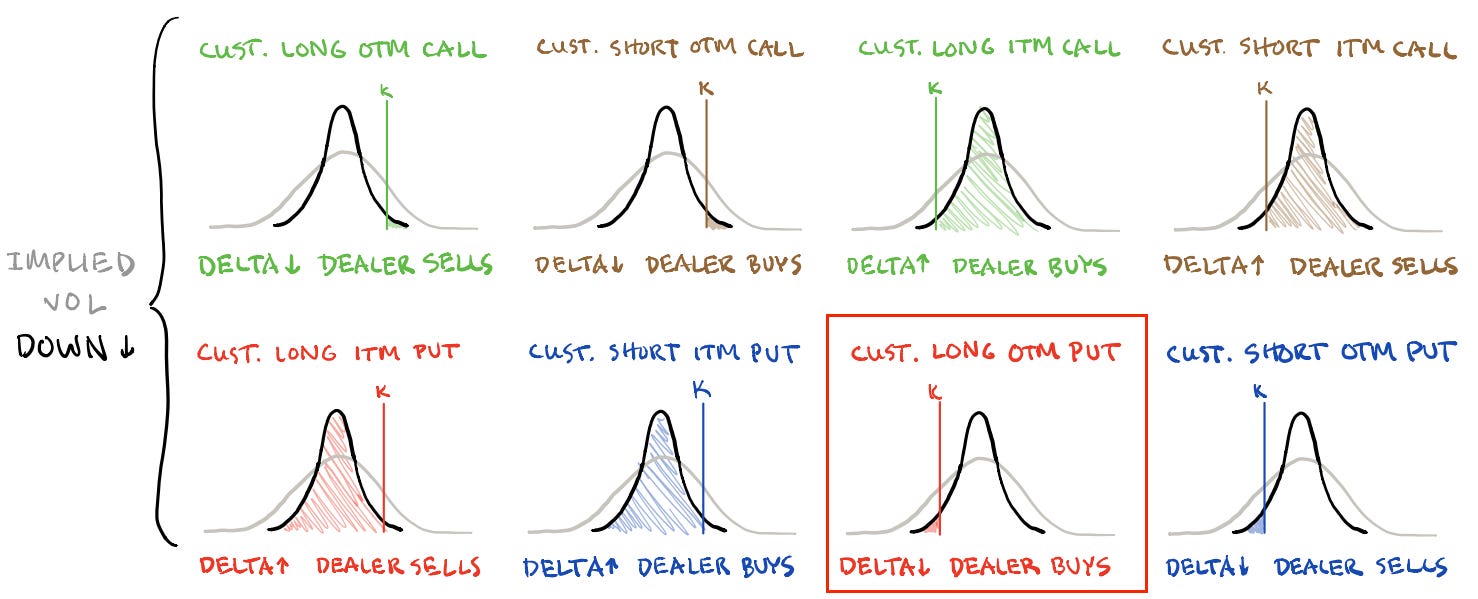
By arbitrage constraints, declining correlation is the reconciliation. When investors sell options on an index, the firms on the other side of the trade—like dealers or market makers—dynamically hedge their risk. They may do this by buying the index as its price drops and selling it when it rises, which can help keep the index within a narrower range and reduce actual realized volatility. However, this doesn’t apply as much to individual stocks, where we observed more options buying. For these stocks, hedging works differently: dealers may buy when prices rise and sell when prices fall, reinforcing trends and extending price moves. This creates a situation where the index stays relatively calm, but its components can swing more wildly.
Anyway, we noticed that as the connection between the index and its stocks was weakening, traders who bet on these differences (called dispersion) profited. As more participated in this and other volatility-suppressing trades, it became more successful. This shows how feedback loops (reflexivity) and past events (path dependency) influence future market behavior. Overall, this trade helped sustain the market rally and added stability as lesser-weighted stocks stepped up to offset the slowdown in leaders in July.
However, we speculated about the risks of a broader “sell-everything” market. Waning enthusiasm for big tech stocks and broader market selling on the news could manifest demand for protection (such as buying longer-dated put options). During the quieter, less liquid summer months, this could trigger increased volatility and lead to a sharp sell-off (as dealers or market makers hedge in the same direction the market’s moving, amplifying moves). Although low and stable volatility gave an optimistic market outlook, we considered advanced structures to hedge against potential pullbacks at low cost, including ultra-wide, broken-wing NDX put butterflies, ratio spreads, and low-cost VIX calls and call spreads (which, by way of the VIX being an indirect measure of volatility or volatility squared, offer amplified protection in a crash). In the event of market weakness, these structures would be closed/monetized, with the proceeds/profits used to lower the cost of upside participating trades through year-end. Again, further details can be found in the ‘Reality is Path-Dependent’ newsletter.
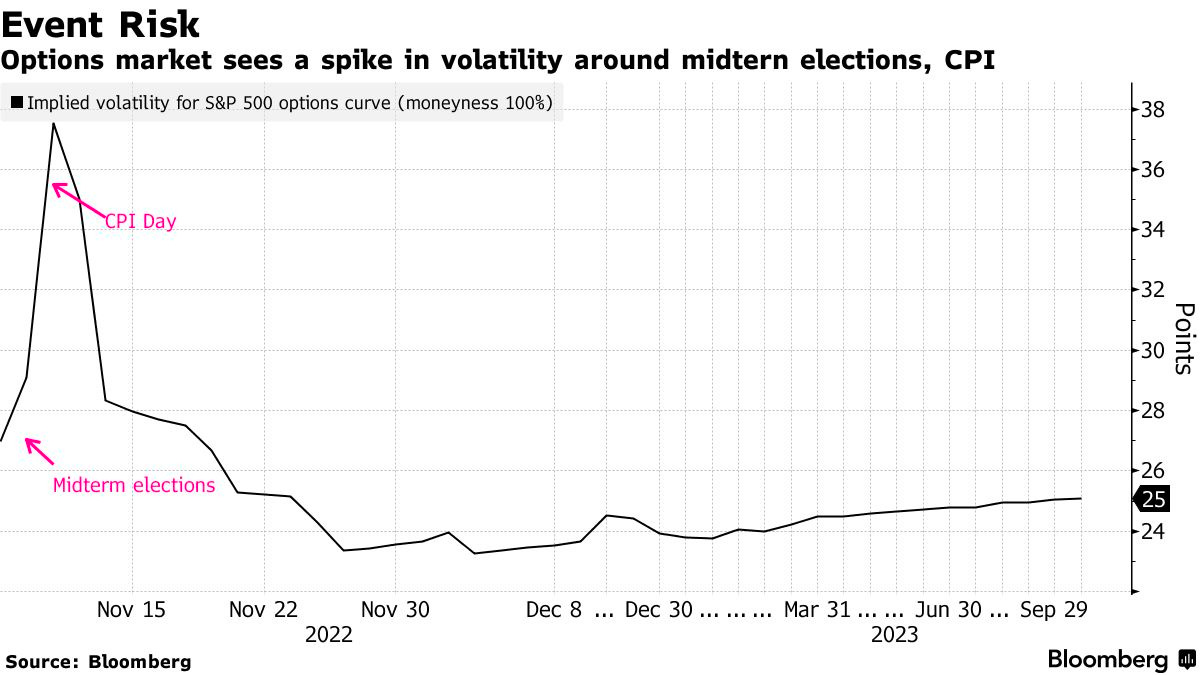
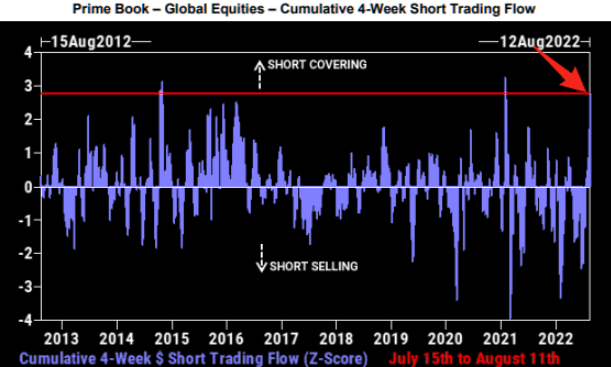
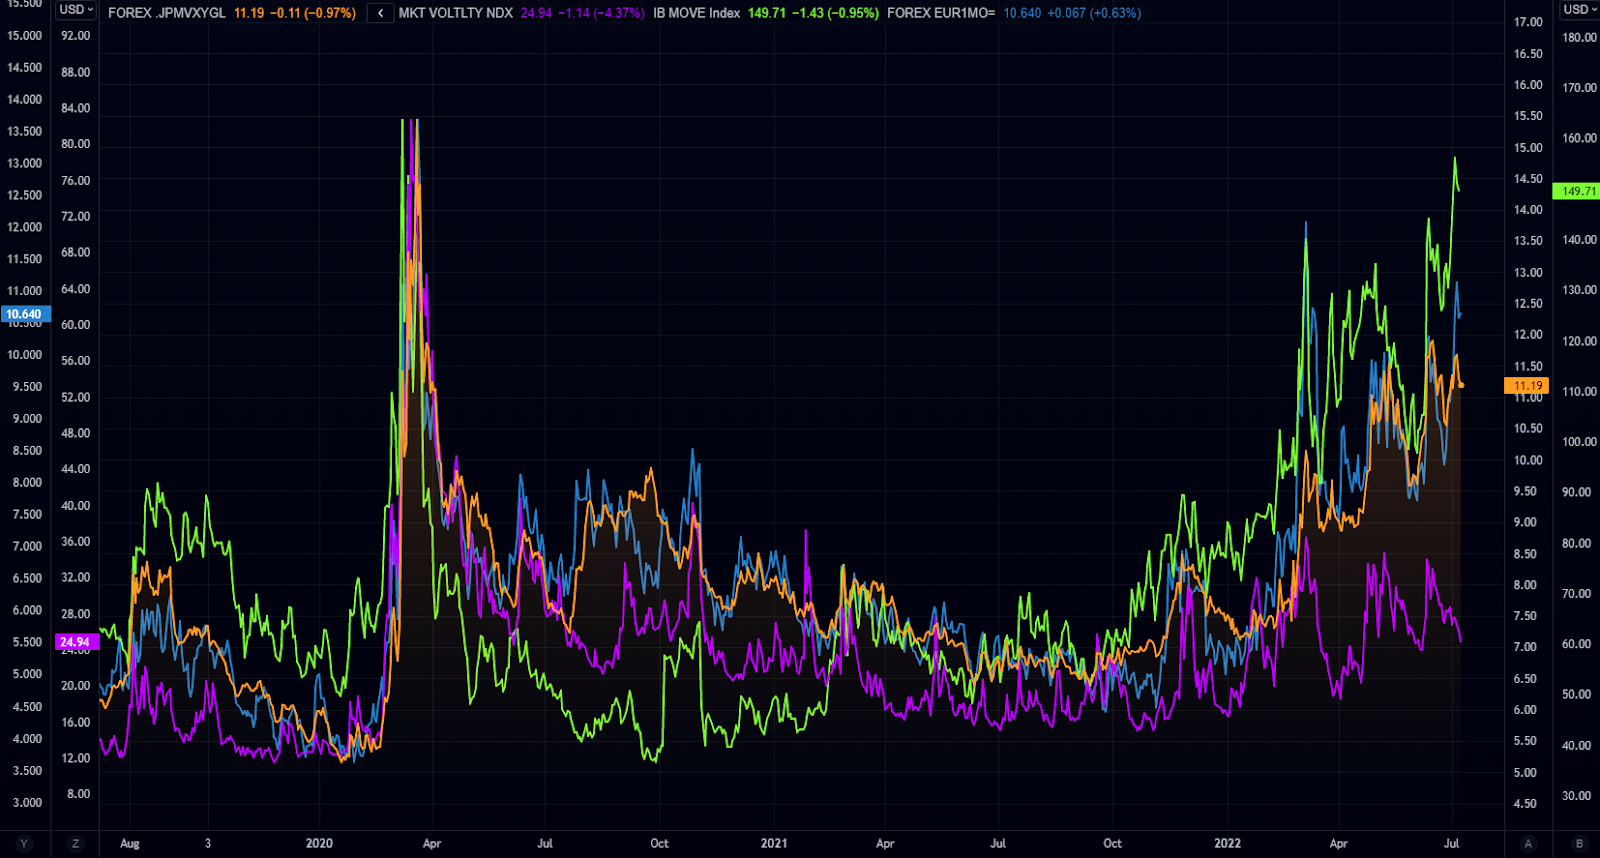
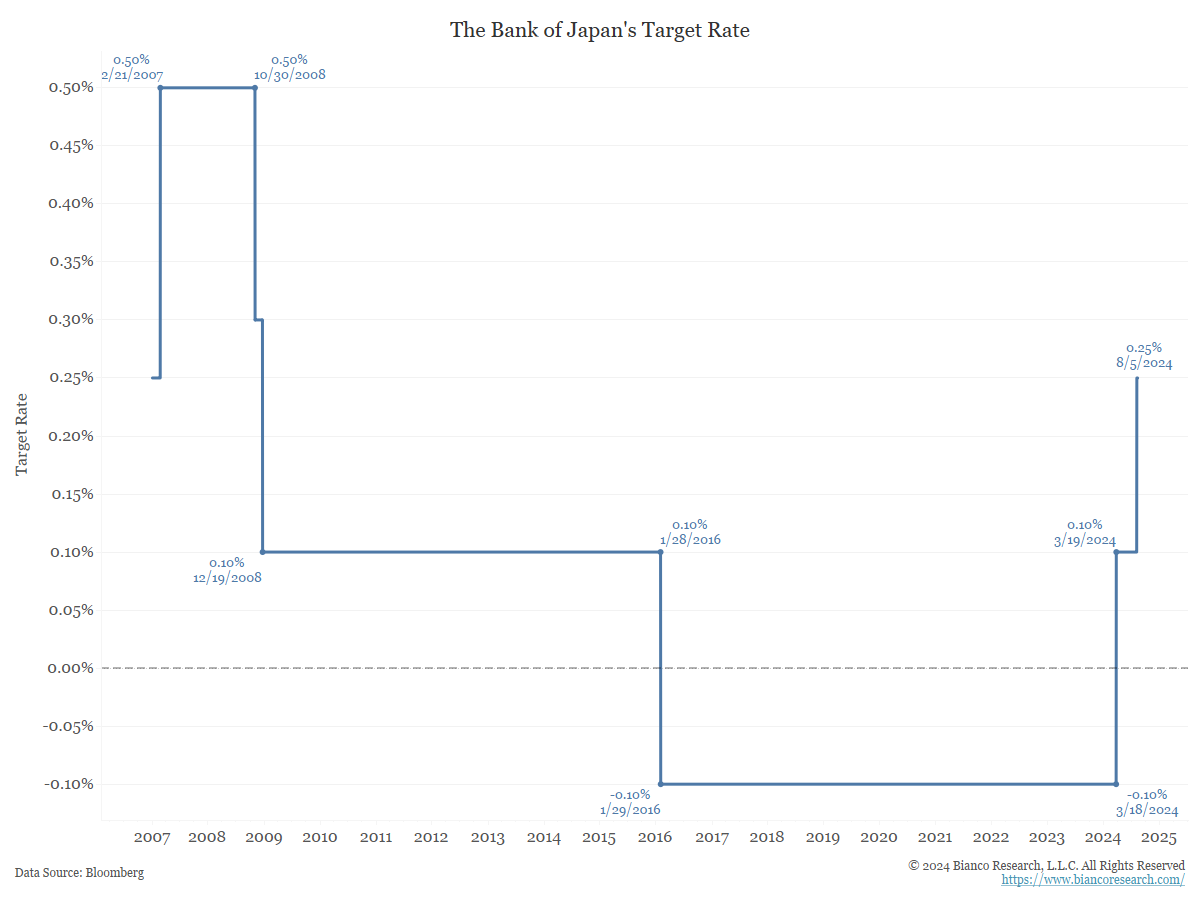
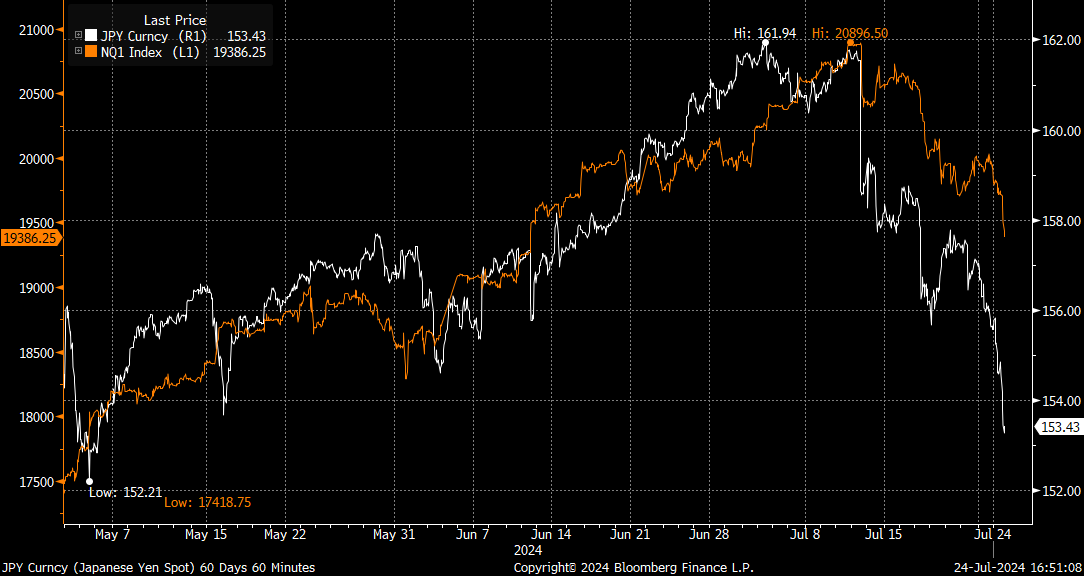
Our warnings about the risks of extreme momentum crowding and positioning leading to violent unwinds were borne out in August 2024. Markets reeled as recession probabilities were repriced, quarterly earnings disappointed, and central bank policies diverged. The Federal Reserve’s dovish stance starkly contrasted with an unanticipated rate hike by the Bank of Japan. This fueled considerable volatility across assets, particularly higher-beta equities and cryptocurrencies, which are more heavily influenced by traditional risk and monetary policy factors. The episode highlighted the vulnerabilities of a market reliant on leveraged trading and concentrated investments; the situation was about more than just a fundamental shock.
The unraveling was marked by spikes in stock market volatility measures like the VIX, a liquidity vacuum, and forced deleveraging by trend-following and volatility-sensitive strategies. Despite this clearing some froth, key equity and volatility positioning and valuation vulnerabilities remained, leaving markets fragile and uncertain whether growth will stabilize or deteriorate.
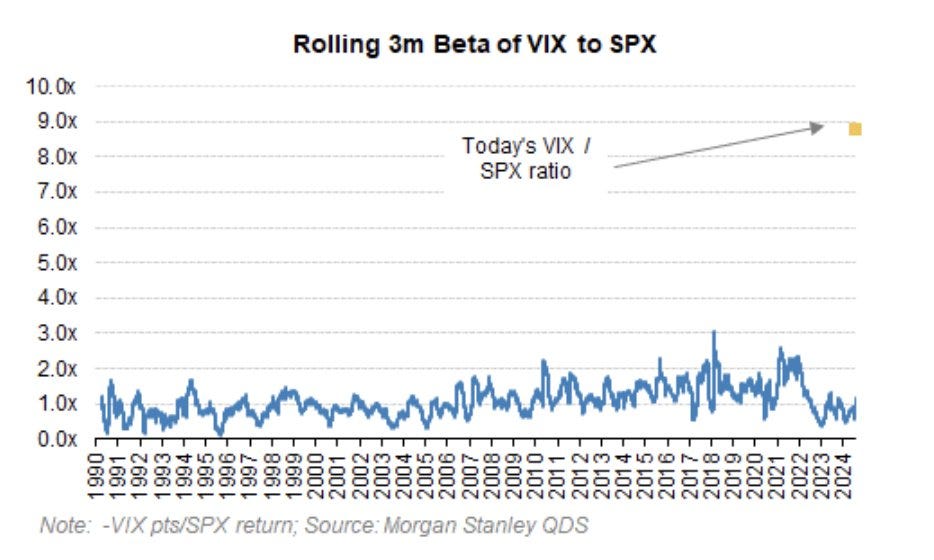
Some accounts compared the selling to the 1987 stock market crash. Volatility broke its calm streak, with spot-vol beta—the relationship between market movements and expected/implied volatility changes—rising and correlations increasing.
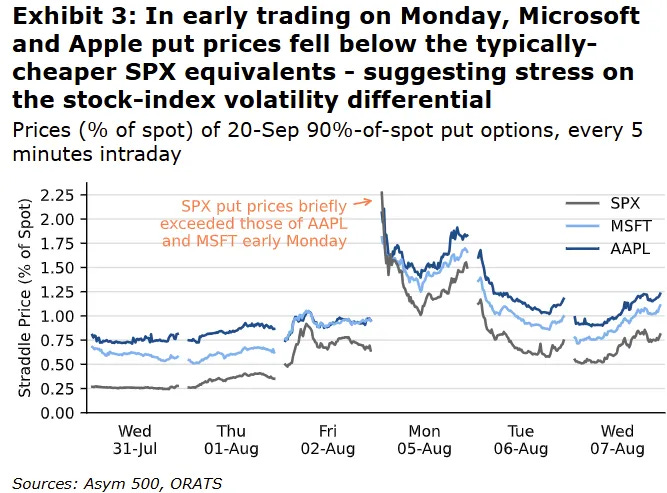
Early warning signs of precariousness emerged as prices for far out-of-the-money SPX and VIX options—key indicators and drivers of potential crashes when heavily traded—soared hundreds of percent the week before crash day, Monday, August 5. These tail-risk hedges, often viewed as insurance against steep market drops, carried well, becoming significantly more expensive as demand surged. Just as insurers raise premiums on homes in disaster-prone areas to account for higher risk, the soaring cost of these options reflected the market’s growing fear of extreme outcomes. This repricing fed into broader quantitative measures, triggering a wave of deleveraging and prompting investors to offload hundreds of billions in stock bets, amplifying the sell-off.
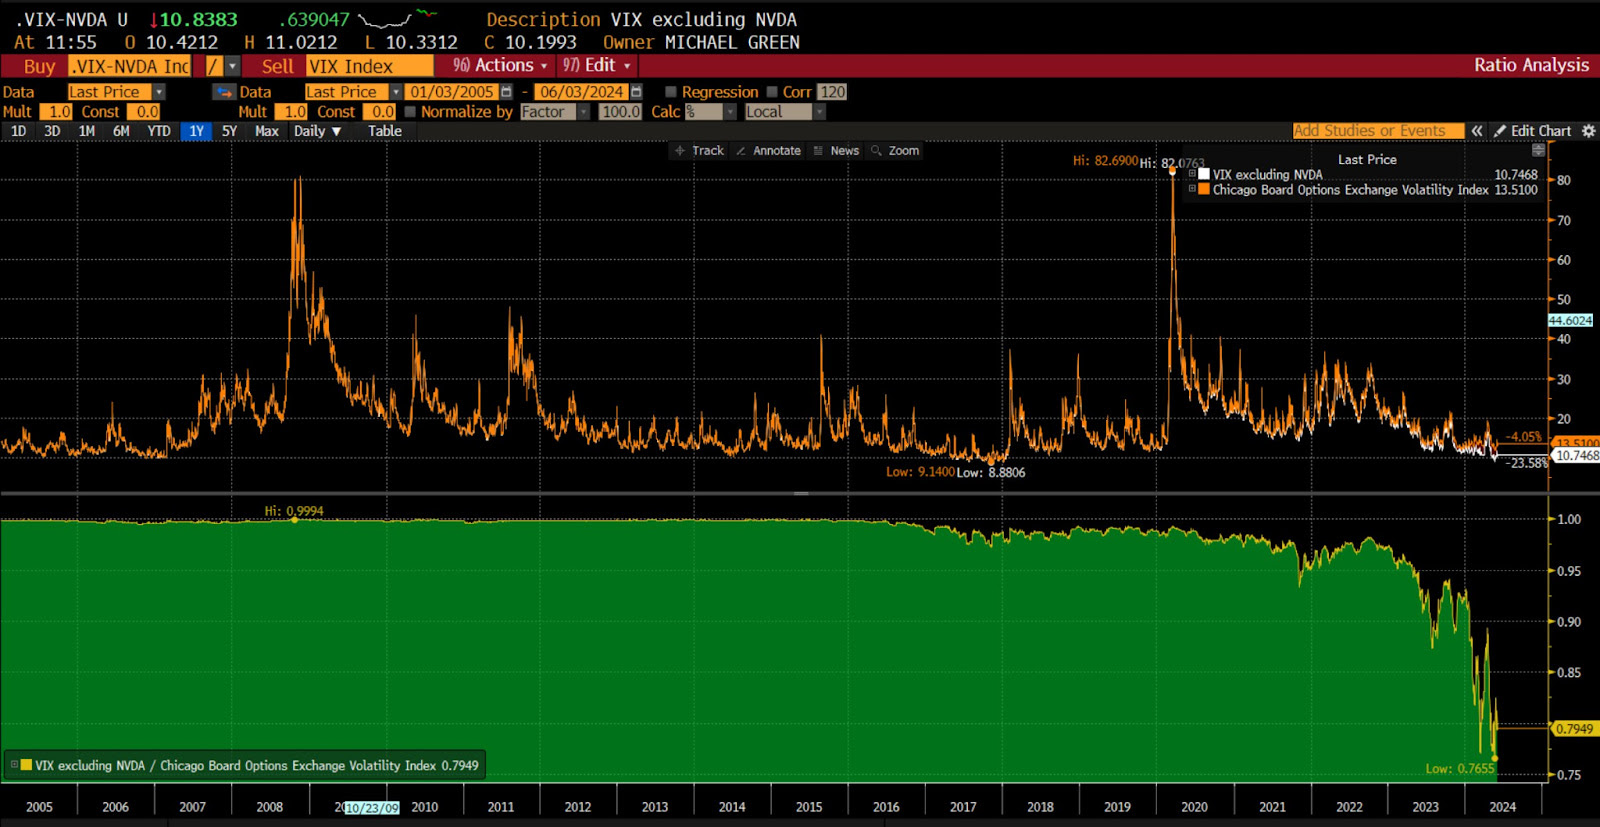
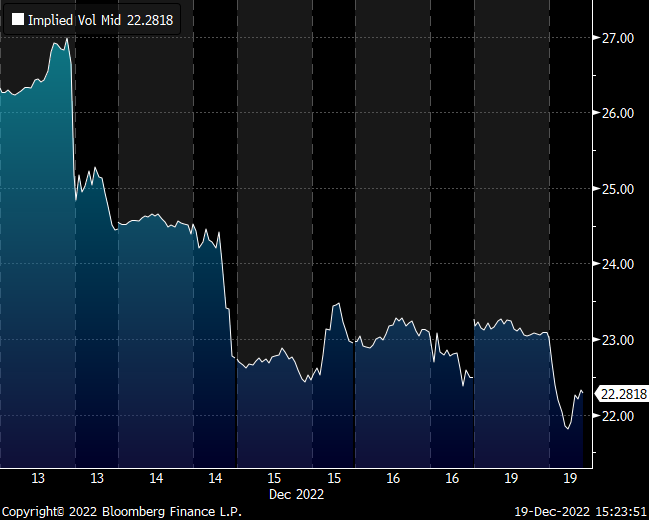
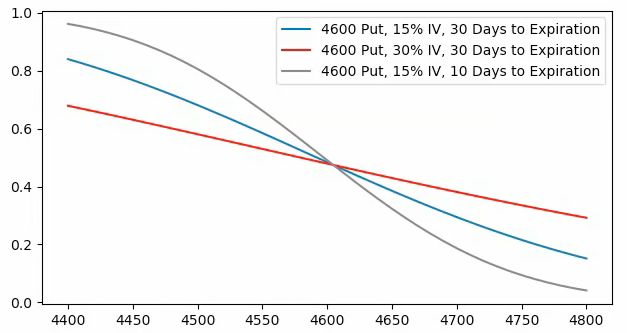
At one point, the VIX breached 65, its highest level since 2020. A lack of liquidity during pre-market hours and the shift from short-term to longer-term hedges contributed to this sharp rise. The VIX is calculated based on a selection of S&P 500 options about 30 days out, chosen by an algorithm that looks at the middle point between the prices people are willing to buy and sell those options. When there’s not a lot of trading activity and markets get volatile, the difference between the buying (bid) and selling (ask) prices widens, lending to the VIX being higher than it should be.
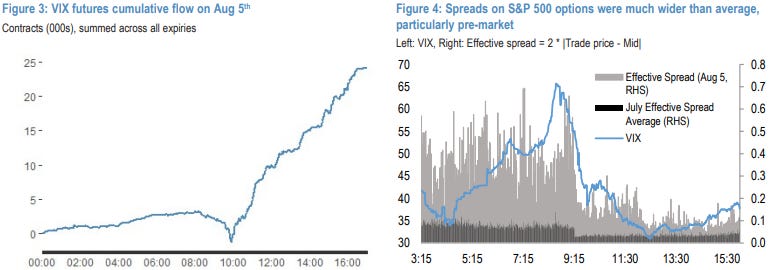
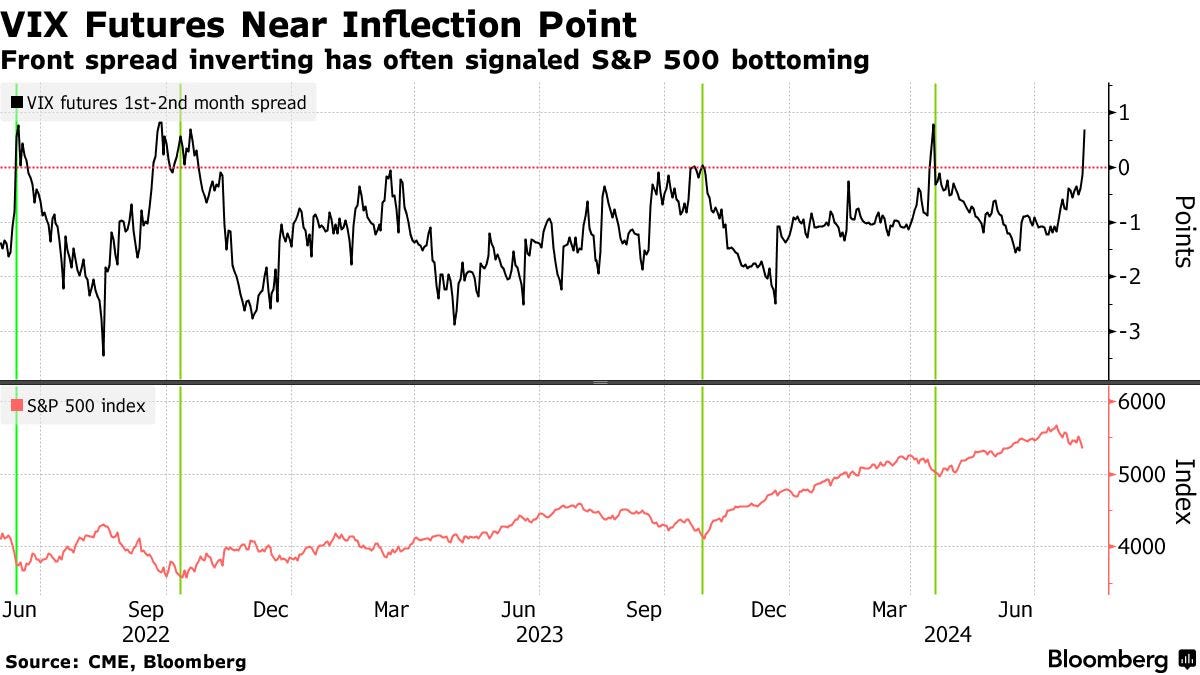
Comparatively, VIX futures—perhaps a better measure of hedging demands outside regular market hours—lagged. JPMorgan claims the fast narrowing in the VIX spot and futures indicates the VIX spot overstated fear and hedging demand.
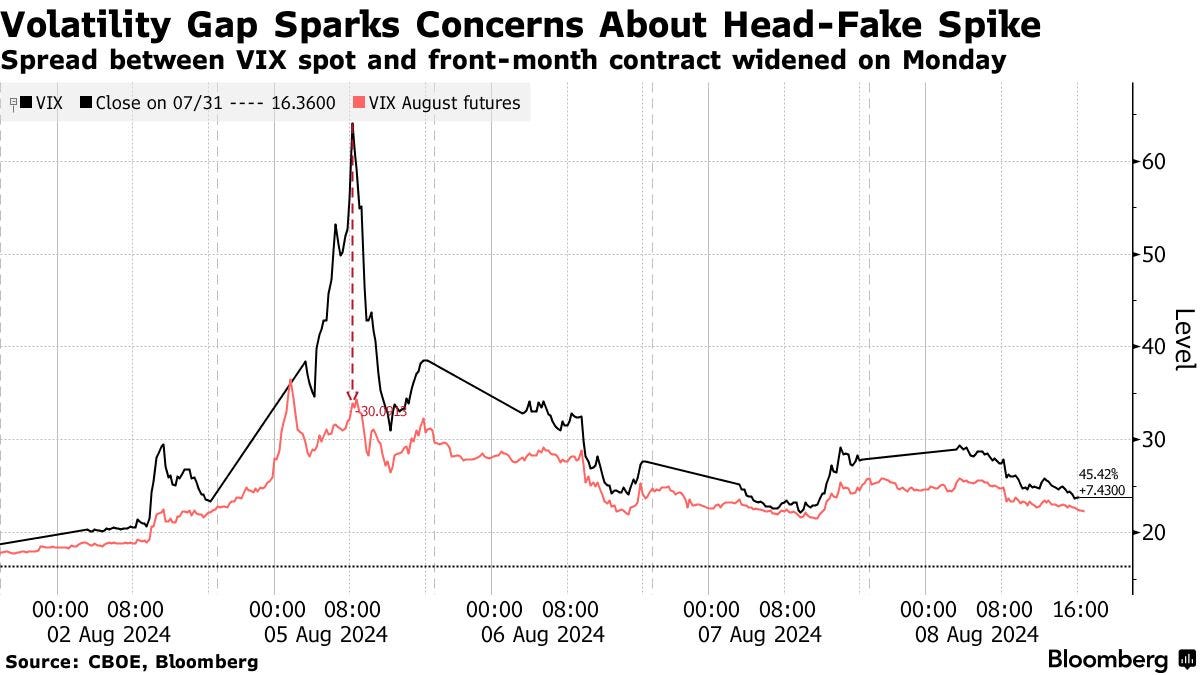
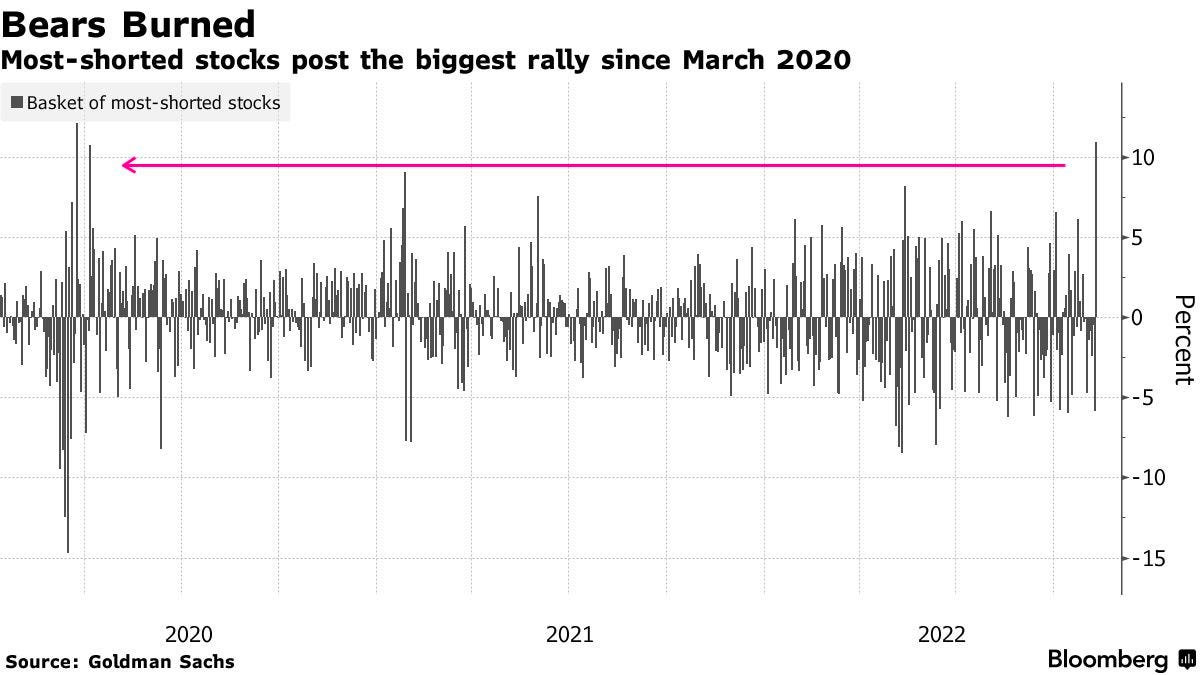
Moreover, a technical issue at the Cboe options exchange delayed trading, and by the time the problem was resolved, the VIX had already dropped sharply. This coincided with traders doubling down on short-volatility positions and buying stocks, confident in the S&P 500’s historical tendency to rebound in the months following similar volatility spikes.
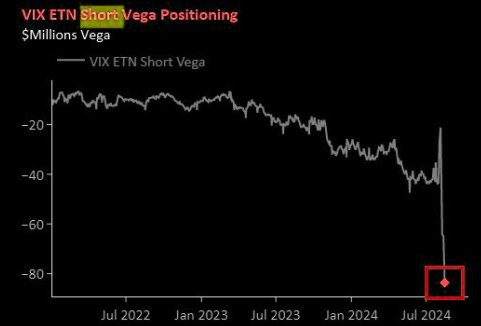
Rocky Fishman, founder of Asym 500, explains that the dislocations above were compounded by dispersion traders who likely experienced mark-to-market losses on their short index positions while single-stock markets remained closed. This forced some to cover their short index volatility positions, resulting in a pre-market surge in index volatility. Once trading resumed, many began selling single-stock options, triggering a broader decline in volatility levels—particularly in single-stock options.
So, the rapid decrease in the VIX was driven more by positioning dynamics and the calculation mechanics of the VIX itself rather than a complete unwinding of risky trades. Additionally, the S&P 500’s movement into lower-volatility segments of the SPX options curve, which the VIX relies on, further intensified this decline. Kris Sidial of The Ambrus Group adds, “It’s quite evident that many have doubled down on [short volatility]. But you don’t need to trust our data. Barring any additional volatility shocks in the next few weeks, I expect some of these firms to deliver stellar numbers by the end of Q3 due to their inclination to take on more risk.”
The market’s recovery in the fall was mainly driven by the Mag-7 giants, whose robust performance overshadowed the struggles of smaller stocks. The August decline created an opportunity to acquire beaten-down stocks at discounts, with investors indeed seeing the panic as a buy signal; outside of significant crises unable to topple the economy (like the bank failures in 2023), back-tests suggest that when the VIX exceeds 35, the S&P 500 has historically risen upwards of 15% over the next six months.
The recovery was not without risks, with the divide between market leaders and laggards highlighting continued fragility. In any case, supportive flows into mega-caps and dealer hedging activities helped stabilize broader indexes through November.
The growing gap between the stable performance of the S&P 500 and the larger fluctuations in its components created profits for those dispersion traders we discussed. However, as valuations for mega-cap stocks climb, the market becomes more vulnerable to shifts in sentiment or capital flows. Events like the yen carry trade—where borrowing in Japan funded investments in U.S. Treasuries and equities—unwind exposed concentration risks and positioning imbalances, which could amplify future shocks.
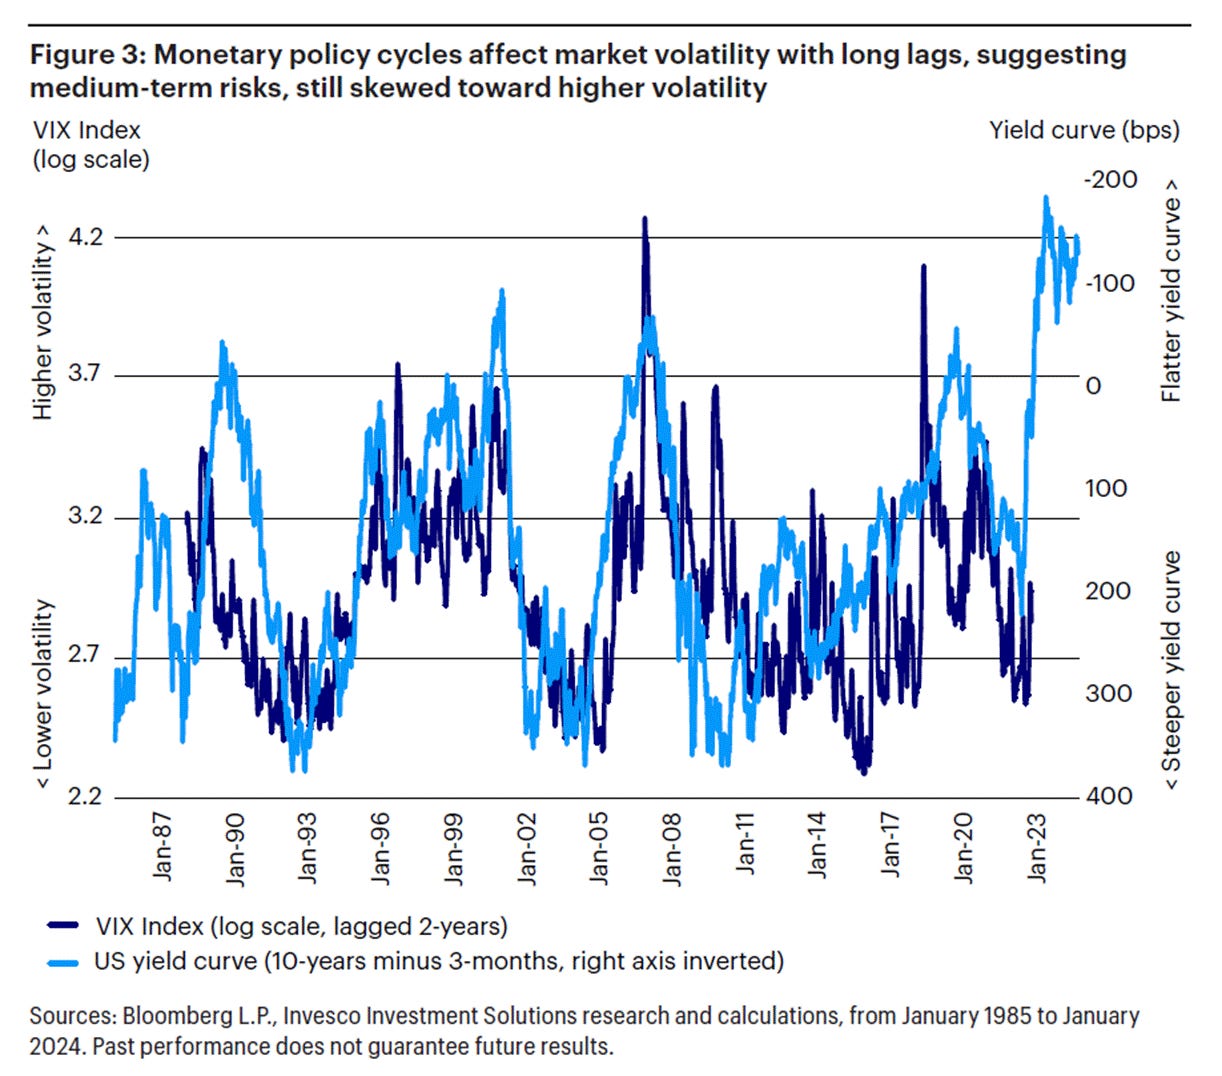
As for potential triggers and shocks going forward, rising inequality and populism are creating deep divisions within and among major powers, while protectionist policies strain potential global cooperation. According to Cem Karsan of Kai Volatility, these dynamics drive economic battles and indirect conflicts, with Eastern nations working to reduce Western influence. This shift coincides with a new era of high inflation, widening wealth gaps, and changing power dynamics. Millennials, now a dominant force in the workforce and politics, are challenging decades of policies that primarily benefited corporations and the wealthy, reversing globalization and redistributing wealth—though this comes at the cost of heightened inflation.
These structural changes disrupt traditional investment strategies like the 60/40 portfolio. A major geopolitical event, such as China moving on Taiwan, could severely impact supply chains, critical industries, and the global economy, with significant repercussions for stocks like Nvidia and broader indices like the S&P 500. If market bets against panic (like short volatility) unravel, it could trigger more swings like August’s. The same reflexivity that has stabilized markets since then could amplify volatility during future shocks, turning successive disruptions into severe crises if market positioning is misaligned.
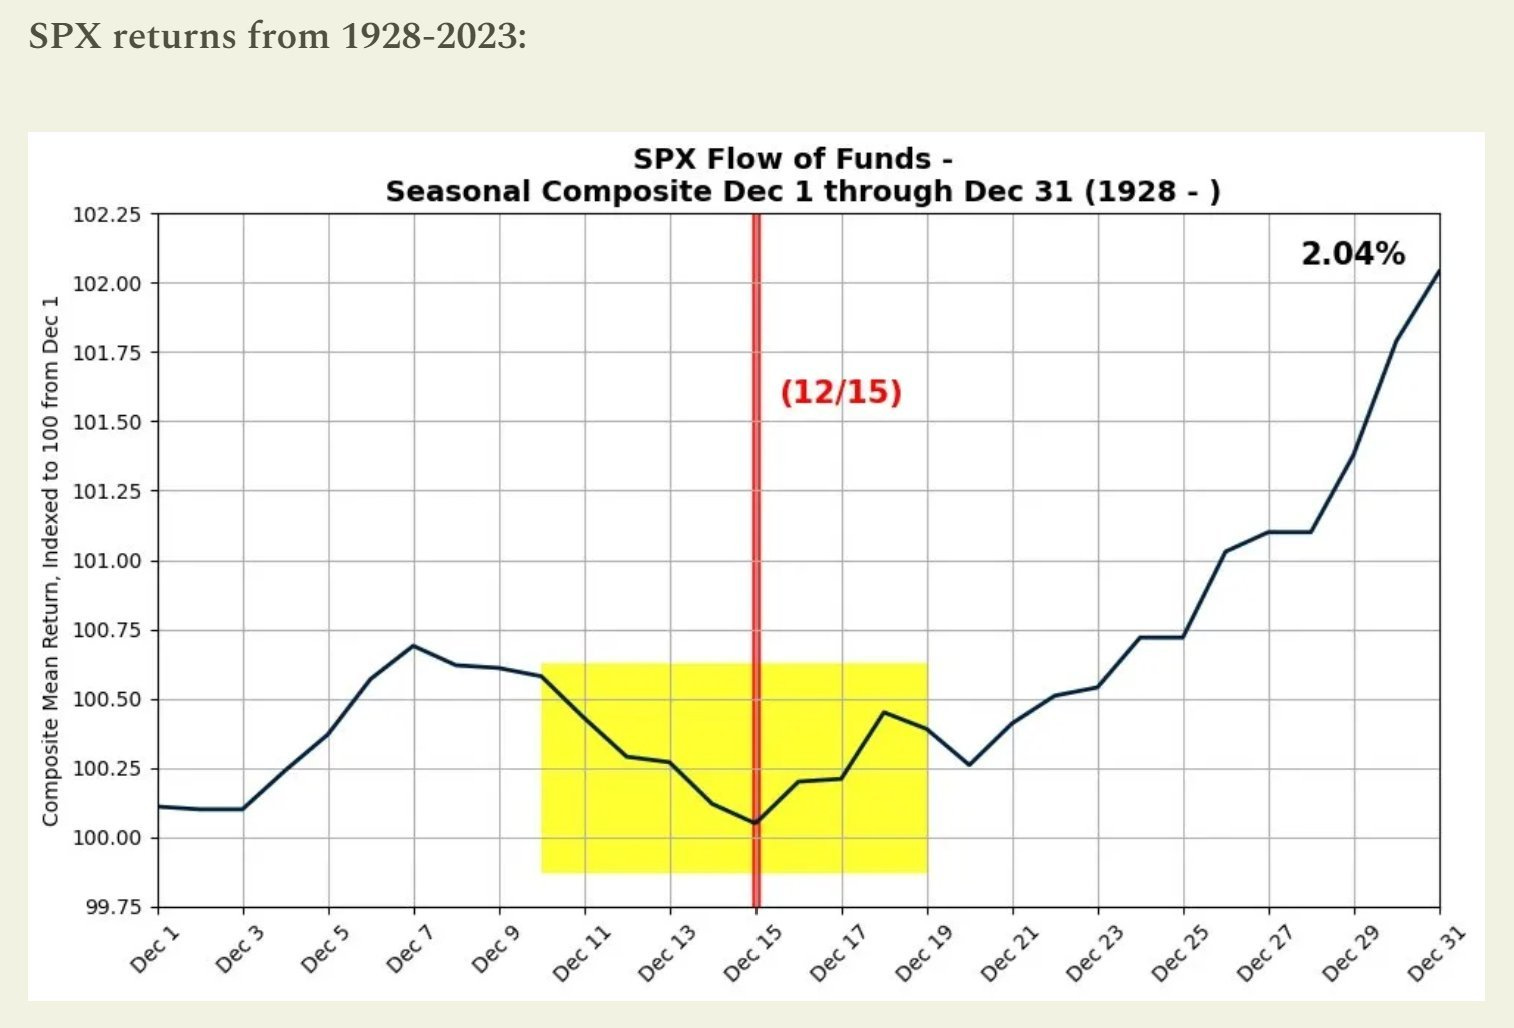
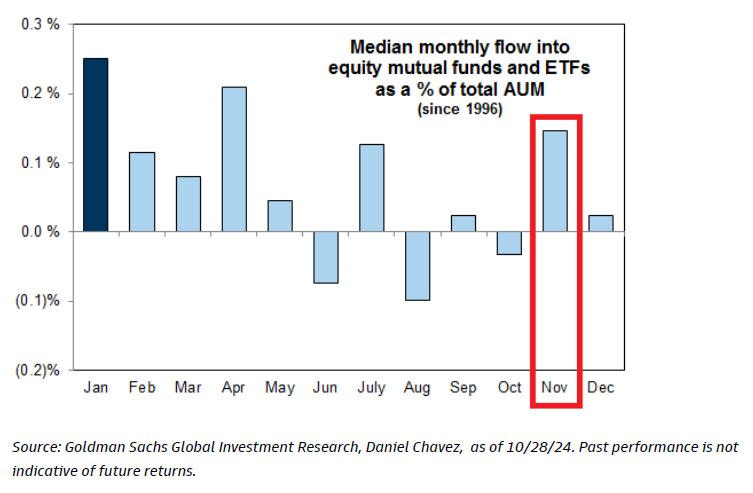
Despite this challenging backdrop, short-term market behavior operates independently, dictated by supply and demand dynamics. Seasonal flows, particularly during year-end, created a bullish bias; reduced holiday trading volumes, combined with reinvestment effects and significant options expirations, contributed to structural upward pressure on markets. These flows and a historical tendency for election years to drive positive performance suggested a right-skewed distribution for near-term outcomes.
The prospect and fulfillment of a “red sweep,” characterized by follow-on deregulation, a business-friendly environment, and more animal spirits, boosted markets. However, caution was spotted in certain areas, like bonds, where expectations for inflation rose.

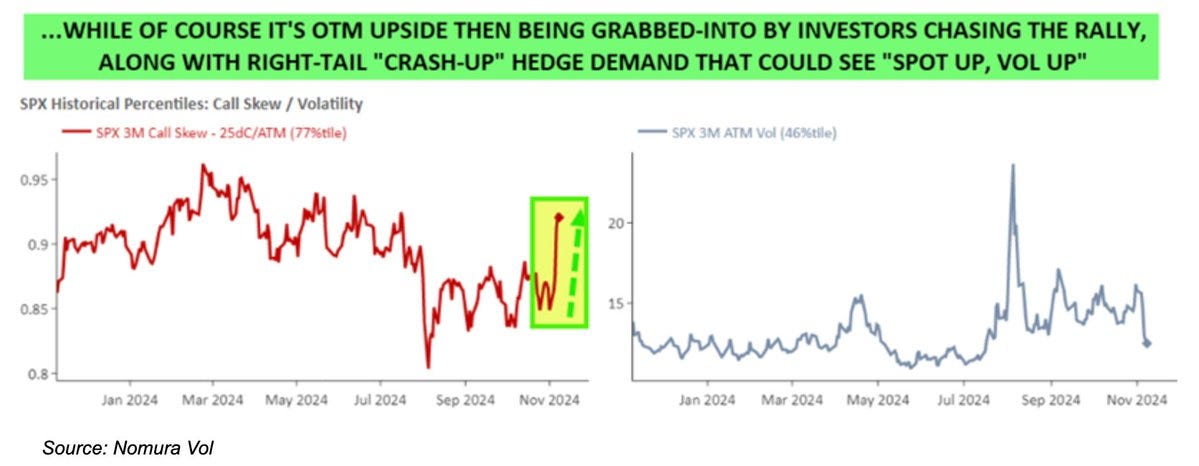
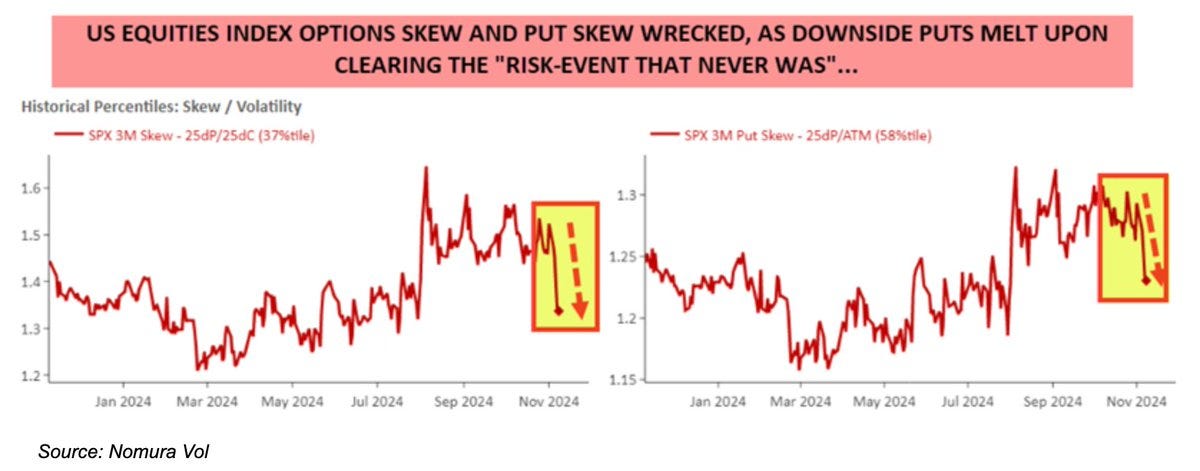
Ultimately, the market overextended, highlighting the risk of a peak as it caught down to weak breath on the Federal Reserve’s surprising hawkish shift in December. This change led to volatility in equities, interest rates, and currencies, reminiscent of the spike in August when the VIX jumped and surpassed the S&P 500’s decline. Such persistent divergences validate a clear shift into a new market regime characterized by volatility that consistently outpaces market sell-offs.

In a report, Cboe said that equity spot/vol beta surged to -3.3, meaning for every 1% drop in the S&P 500, the VIX gained 3.3 points—exceeding even August’s extreme levels. SPX options priced greater downside risk, with skew steepening. Notwithstanding, correlations settled near historic lows, signaling investor focus on sector rotation and stock dispersion.

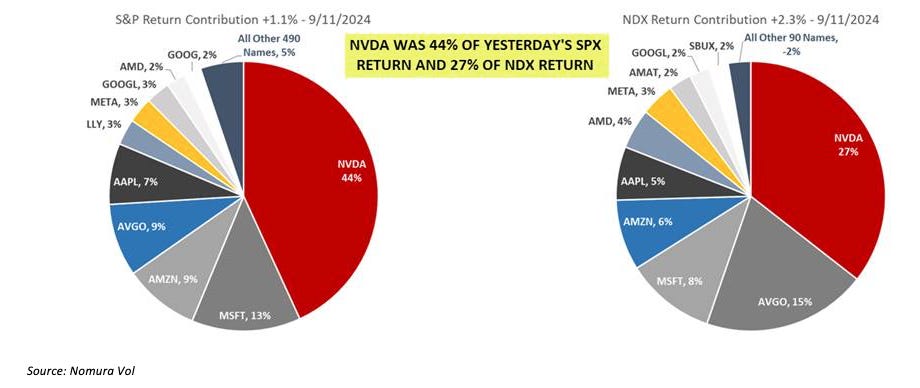
Early warning signals appeared when volatility and equities increased simultaneously, highlighting a “spot up, vol up” pattern that frequently foreshadows market peaks. For instance, at one moment, upside calls on major stocks like Nvidia and the S&P 500 were well-priced and poised to perform strongly in a rally. This occurs because, during rallies, implied volatility of call options generally decreases as investors tend to sell calls tied to their stock holdings rather than liquidating them entirely. When investors chase synthetic upside exposure through call options, indices like the VIX could stabilize or increase as the market rises. Since counterparties typically adjust their exposure by buying the underlying asset, it propels the rally and magnifies market fluctuations.
Beyond the chase, the post-election rally got an extra boost from unwinding protective puts. Significant events like elections typically boost demand for puts as hedges against adverse outcomes, with counterparties hedging these positions by selling underlying stocks or futures, among other things. As markets rise, time passes, or uncertainty fades, these puts lose value, leading counterparties to unwind hedges by buying stocks and futures. This is a structural support that pushes markets higher.
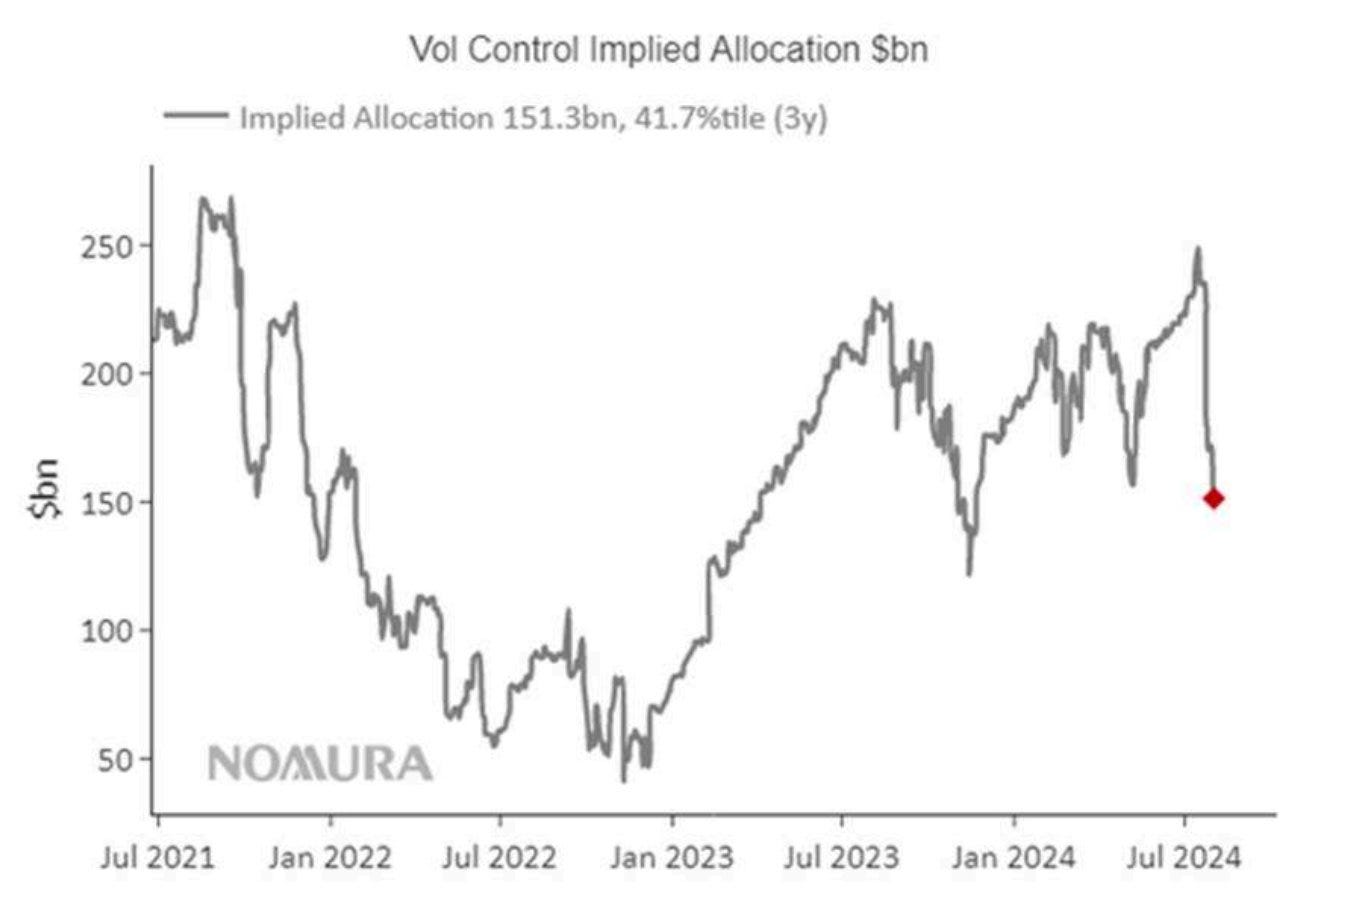
Corporate buybacks and stabilizing volatility levels encouraged funds to increase their exposure. Nomura estimated that assuming stable markets, up to $145 billion in additional volatility-sensitive buying could occur over three months. Although 30-day implied volatility traded a bit above realized volatility, this signaled uncertainty rather than distress. Seasonal factors mentioned in the previous section—like low holiday liquidity and limited selling pressure—added to the upward trend.
Then came the FOMC meeting, followed by December’s massive options expiration (OPEX), disrupting the supportive dynamics that had fueled the rally. While a rate cut was expected, uncertainty around forward guidance introduced volatility just as the market faced a substantial unwinding of stabilizing exposure. Those who hedged customer-owned call options by buying stock during rallies and hedged customer-owned puts by selling stock during declines were forced to re-hedge as markets turned lower following the FOMC meeting. This involved selling stocks and futures, adding downside pressure.
Macro factors triggered the initial downside, with positioning amplifying equity volatility.
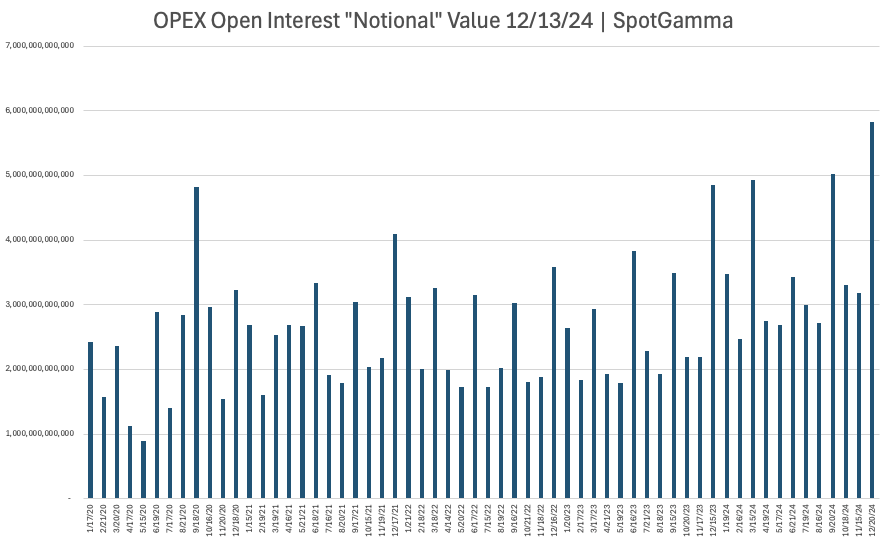
Ultimately, volatility levels signaled oversold conditions ahead of a massive put-clearing OPEX, setting the stage for a year-end lift. The volatility spikes in August and December remained contained, as they were largely event-driven and mitigated by existing hedges and a market structure anchored by year-end flows. The subsequent unwinding of significant options positions in December eased the pressure, while reinvestment and re-leveraging effects into January supported against weak breadth; as the earlier-mentioned Cem Karsan explains best, the substantial gains over the year increased collateral for leveraged investors, enabling them to reinvest profits or take on more leverage, which has given markets a lease on life through today.
2025 might see increased volatility, not driven by typical inflation or recession fears but by the positioning dynamics herein that can magnify market swings during downturns. The so-called “red sweep” introduces optimism and the likelihood of greater risk-taking, which could result in one-sided positioning and heightened volatility. Factors like populism, protectionism, and rising interest rates are additional pressures on stocks and bonds. Gold and Bitcoin are identified as potential stores of value, but Bitcoin remains prone to speculation, liquidity challenges, and regulatory obstacles.
The following newsletters will identify structures to lean into fundamental catalysts and underlying volatility contexts. Notably, the structures discussed earlier (such as ultra-wide, broken-wing NDX put butterflies, ratio spreads, and low-cost VIX calls and call spreads) may continue to perform as effective hedges.
See you soon for a detailed part two.
Disclaimer
By viewing our content, you agree to be bound by the terms and conditions outlined in this disclaimer. Consume our content only if you agree to the terms and conditions below.
Physik Invest is not registered with the US Securities and Exchange Commission or any other securities regulatory authority. Our content is for informational purposes only and should not be considered investment advice or a recommendation to buy or sell any security or other investment. The information provided is not tailored to your financial situation or investment objectives.
We do not guarantee the accuracy, completeness, or timeliness of any information. Please do not rely solely on our content to make investment decisions or undertake any investment strategy. Trading is risky, and investors can lose all or more than their initial investment. Hypothetical performance results have limitations and may not reflect actual trading results. Other factors related to the markets and specific trading programs can adversely affect actual trading results. We recommend seeking independent financial advice from a licensed professional before making investment decisions.
We don’t make any claims, representations, or warranties about the accuracy, completeness, timeliness, or reliability of any information we provide. We are not liable for any loss or damage caused by reliance on any information we provide. We are not liable for direct, indirect, incidental, consequential, or damages from the information provided. We do not have a professional relationship with you and are not your financial advisor. We do not provide personalized investment advice.
Our content is provided without warranties, is the property of our company, and is protected by copyright and other intellectual property laws. You may not be able to reproduce, distribute, or use any content provided through our services without our prior written consent. Please email renato@physikinvest for consent.
We reserve the right to modify these terms and conditions at any time. Following any such modification, your continued consumption of our content means you accept the modified terms. This disclaimer is governed by the laws of the jurisdiction in which our company is located.