Categories
Commentary

Daily Brief For December 2, 2022

Physik Invest’s Daily Brief is read by thousands of subscribers. You, too, can join this community to learn about the fundamental and technical drivers of markets.

Graphic updated 7:45 AM ET. Sentiment Neutral if expected /ES open is inside of the prior day’s range. /ES levels are derived from the profile graphic at the bottom of this letter. Levels may have changed since initially quoted; click here for the latest levels. SqueezeMetrics Dark Pool Index (DIX) and Gamma (GEX) with the latter calculated based on where the prior day’s reading falls with respect to the MAX and MIN of all occurrences available. A higher DIX is bullish. At the same time, the lower the GEX, the more (expected) volatility. Click to learn the implications of volatility, direction, and moneyness. Breadth reflects a reading of the prior day’s NYSE Advance/Decline indicator. VIX reflects a current reading of the CBOE Volatility Index (INDEX: VIX) from 0-100.

Administrative

We will issue a content calendar revealing the dates letters are likely to be published and the content that may be covered.

Separately, due to the writer’s travel commitments, from 12/6 to 12/16 there will likely be little to no commentary. If any queries, or if you are local to New York City or Paris, ping renato@physikinvest.com or Renato Capelj#8625 on Discord.

Please check out the Daily Brief for November 29 and 30, as well as December 1.

On 11/29, we unpacked the context for a trade to take. On 11/30, we took that trade. On 12/1 we dissected the performance of that trade.

Given a time crunch, today’s letter will be lighter – really sorry!

Fundamental

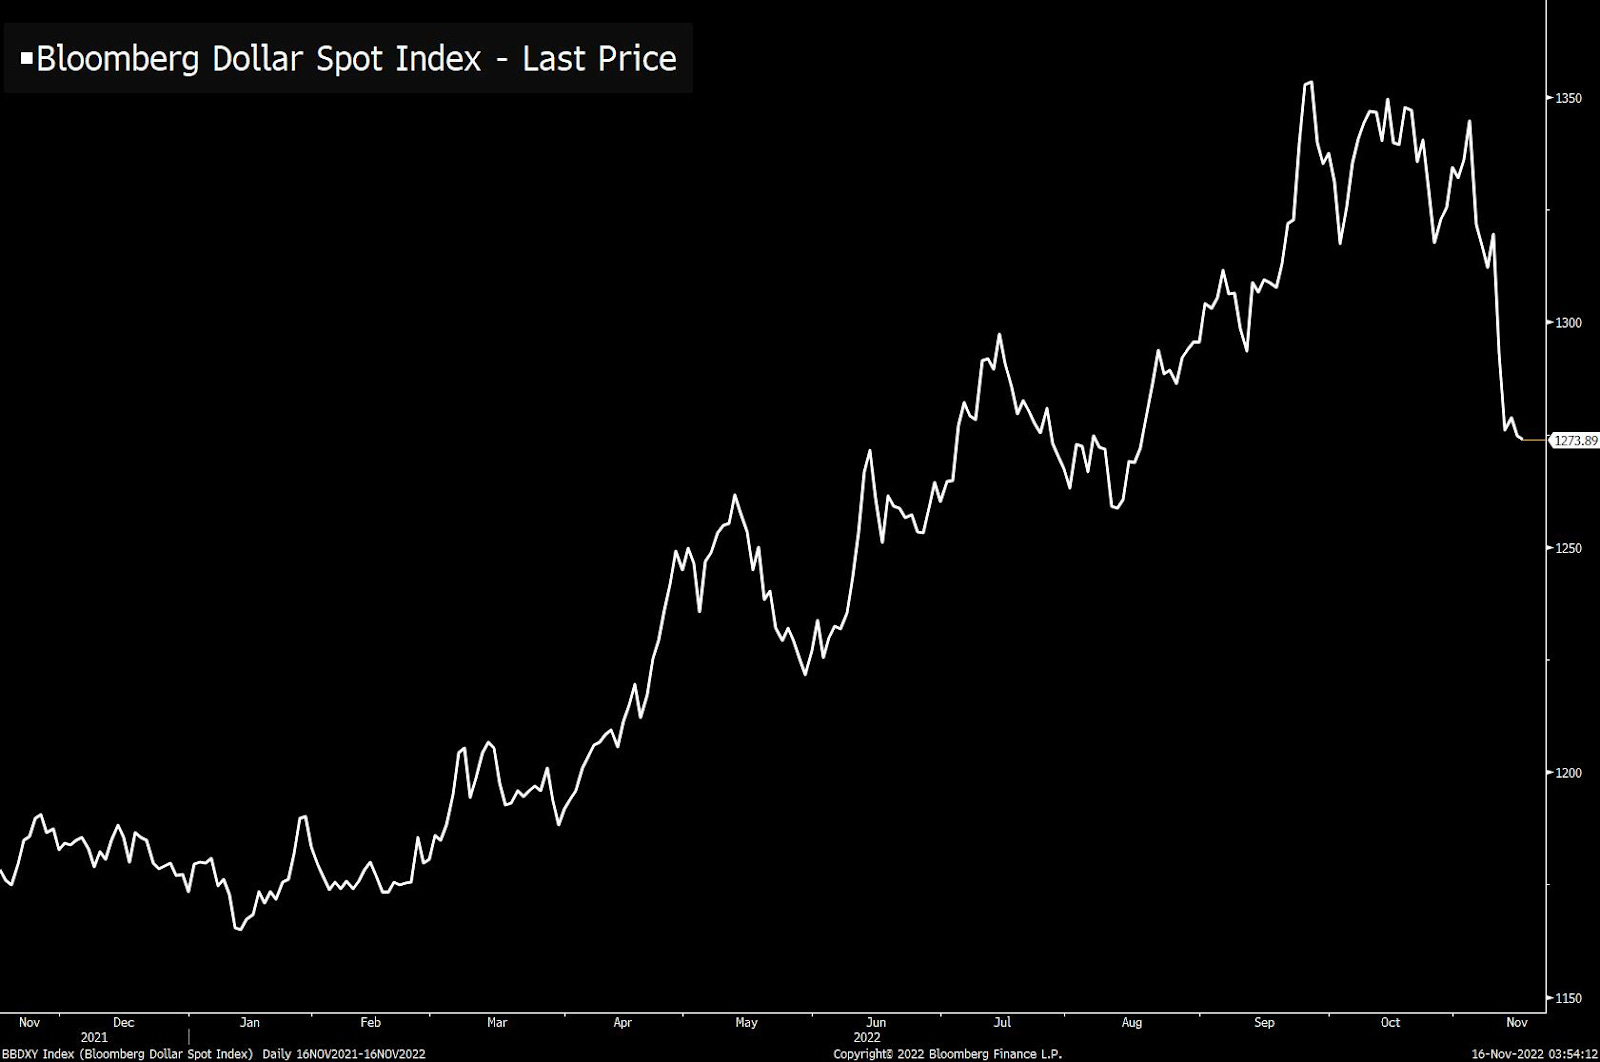
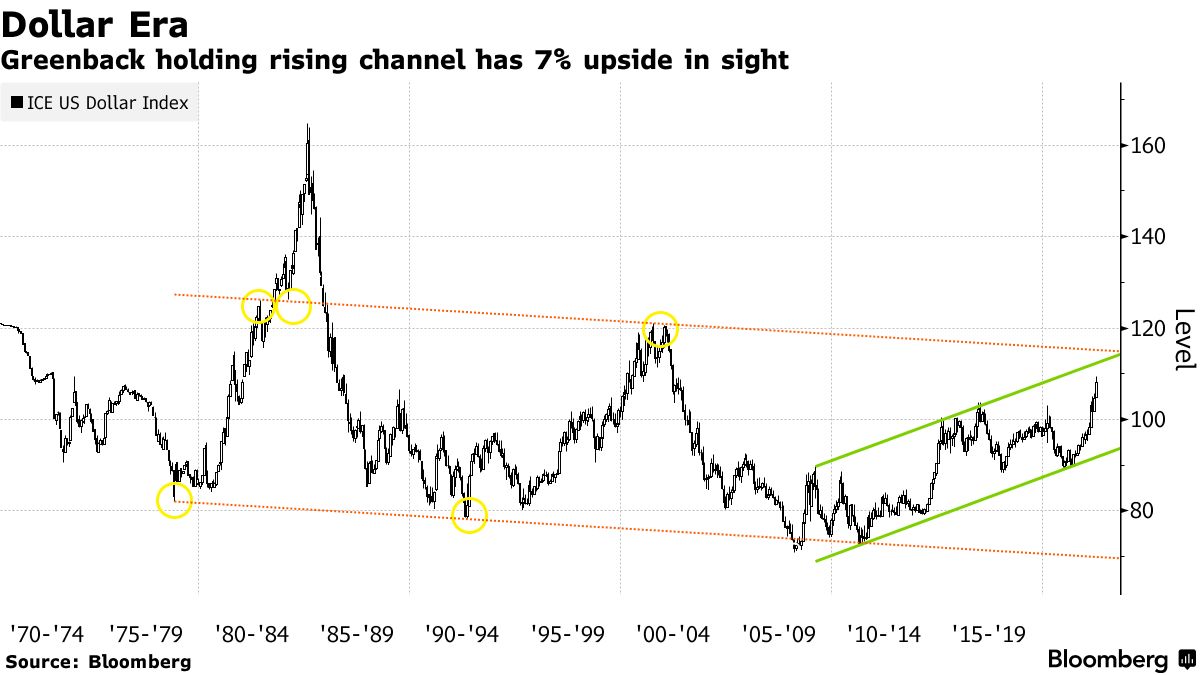
Many headlines and increased alertness surround employment gauges, housing, and currency markets (e.g., yen sensitivity to U.S. Treasury yields; yen up and the dollar down after the Federal Reserve’s Jerome Powell suggested an easing in the pace of tightening). If interested, read Physik Invest’s letters on the yen and carry trades.

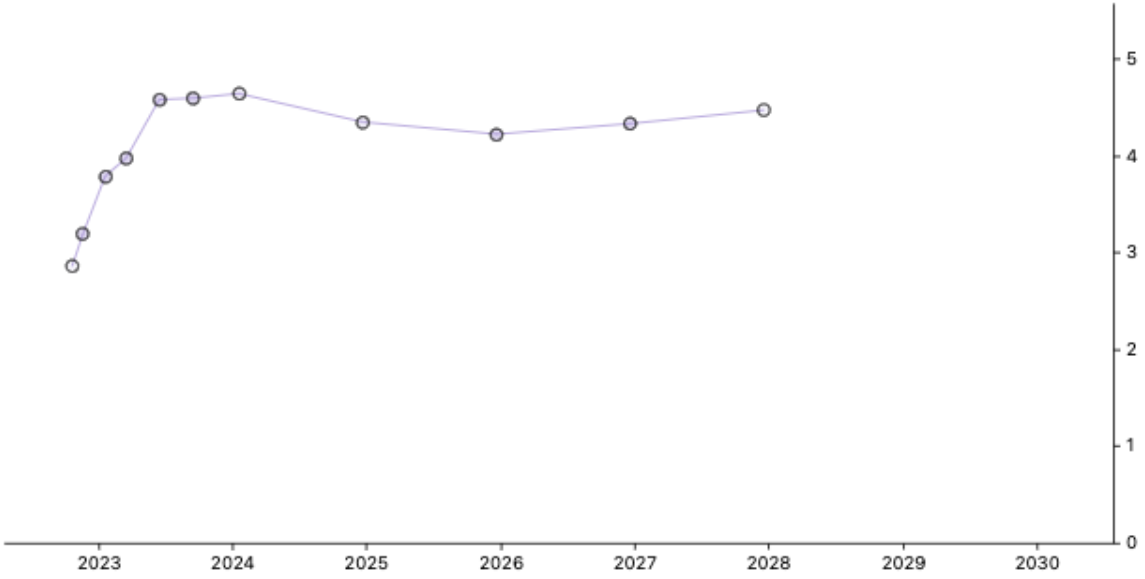
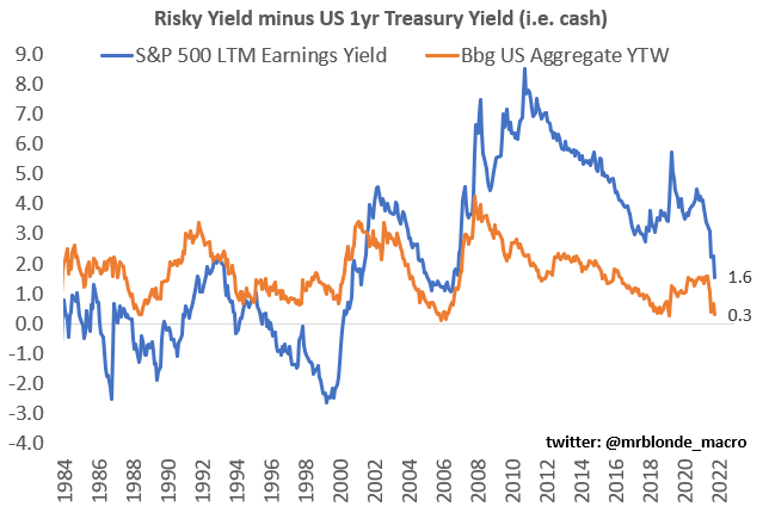
As an aside, an interesting quote comes from BlackRock Inc’s (NYSE: BLK) Gargi Chaudhuri, if yields were to hit “6.5% or 7%,” investors’ “fixed income will do so much of the hard work … that they don’t actually need as much of the equity exposure.” To add, however, the terminal rate sits around 5.2%.

Graphic: Updated December 1, 2022. Via Charles Schwab Corporation’s (NYSE: SCHW) TD Ameritrade thinkorswim. Observed is the Eurodollar, the interest offered on U.S. dollar-denominated deposits held at banks outside of the U.S. (i.e., participants’ outlook on interest rates).

Positioning

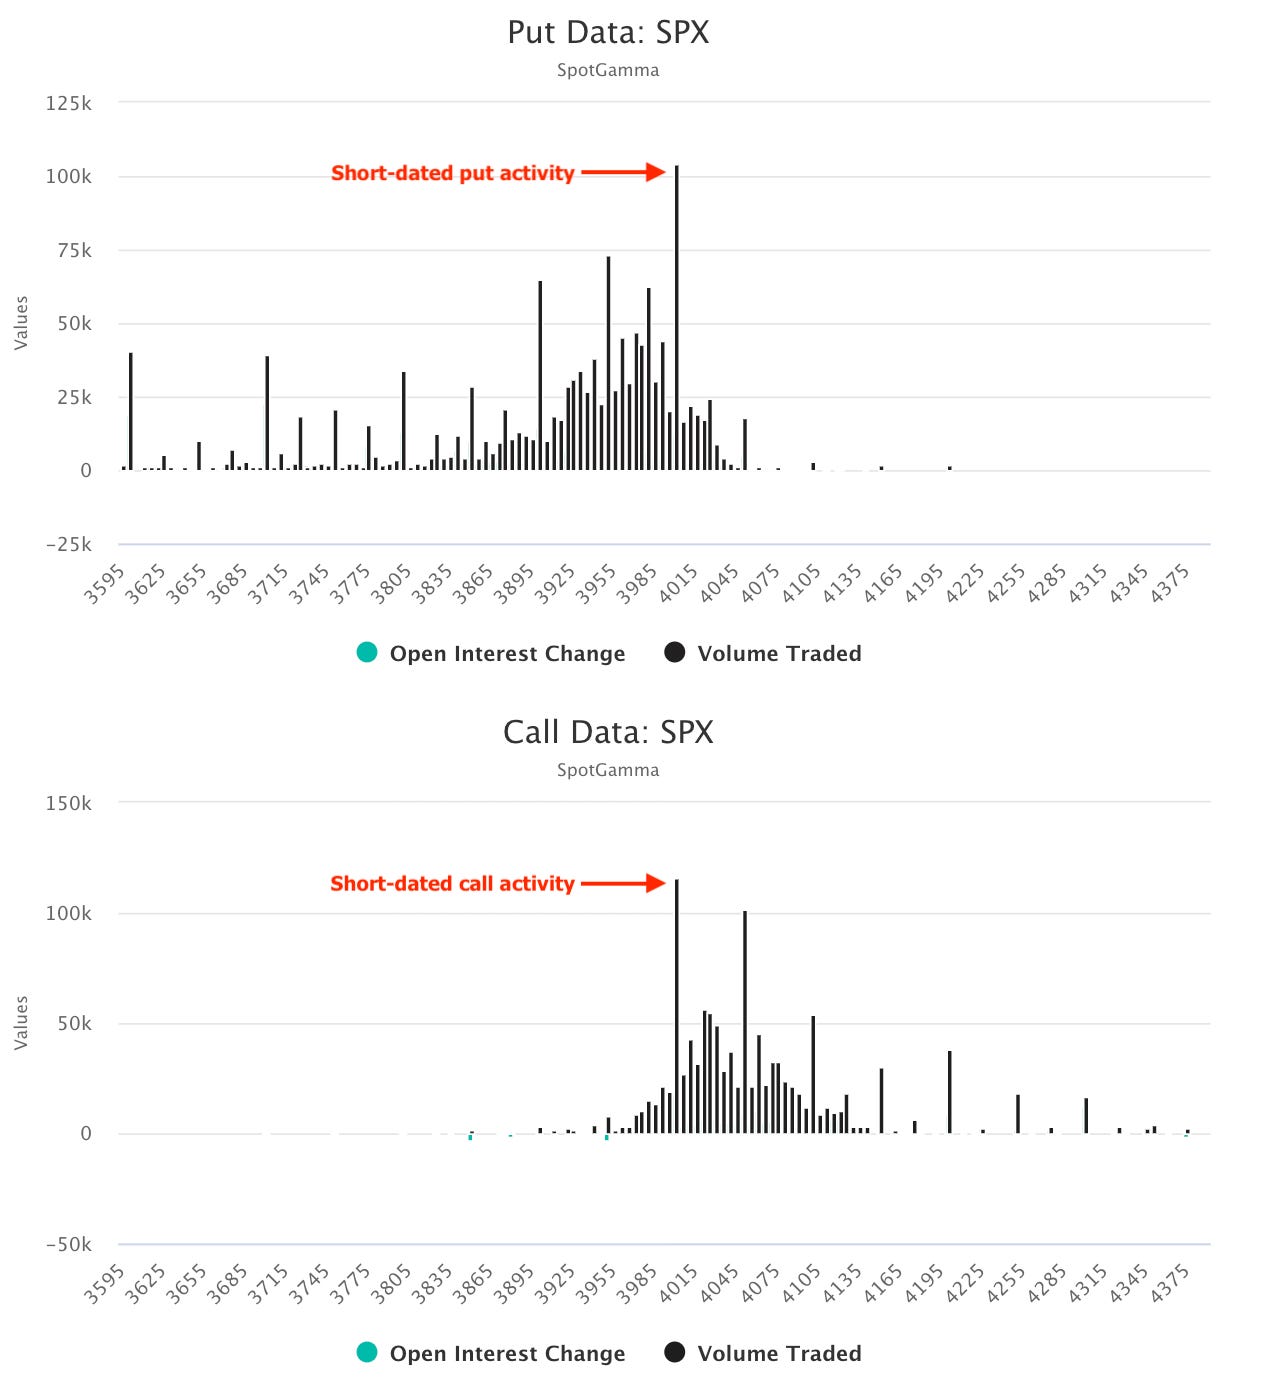
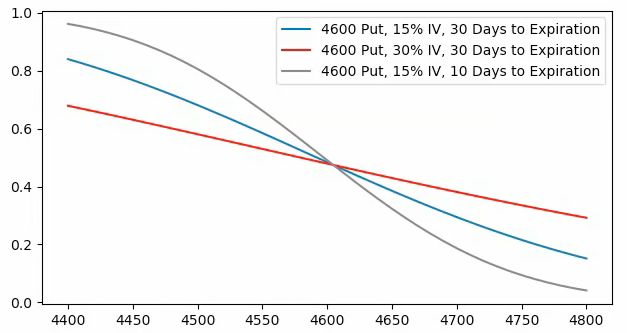
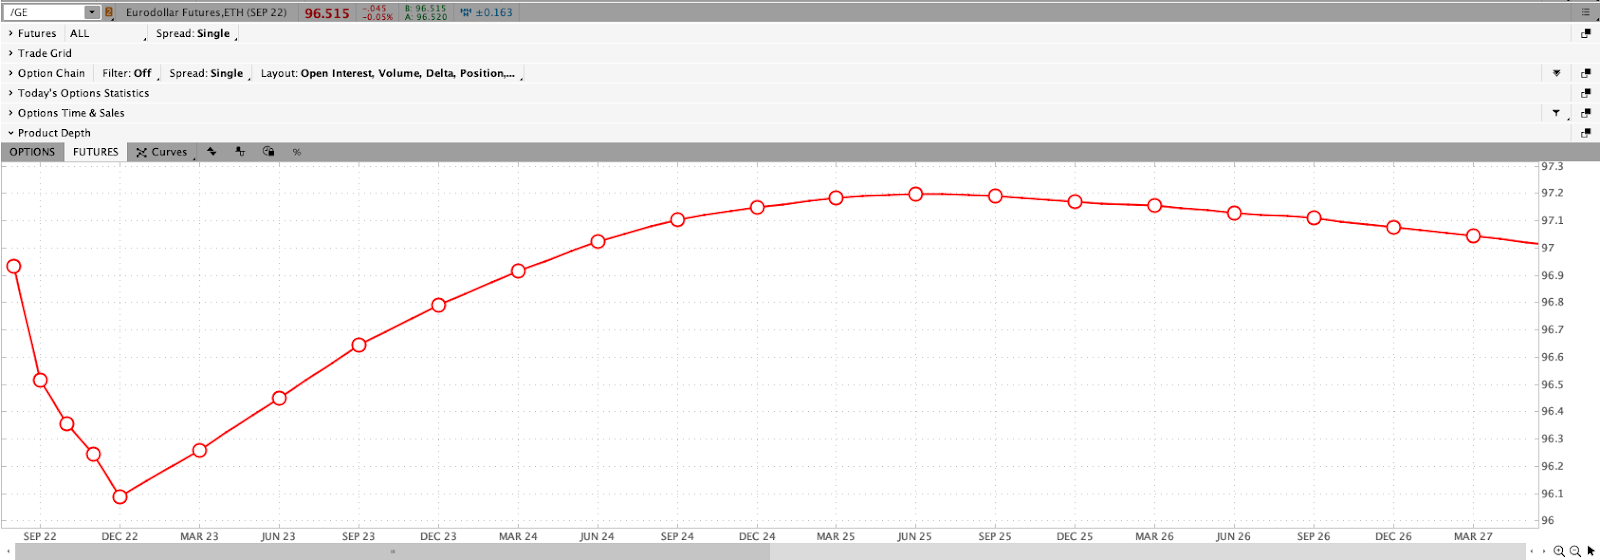
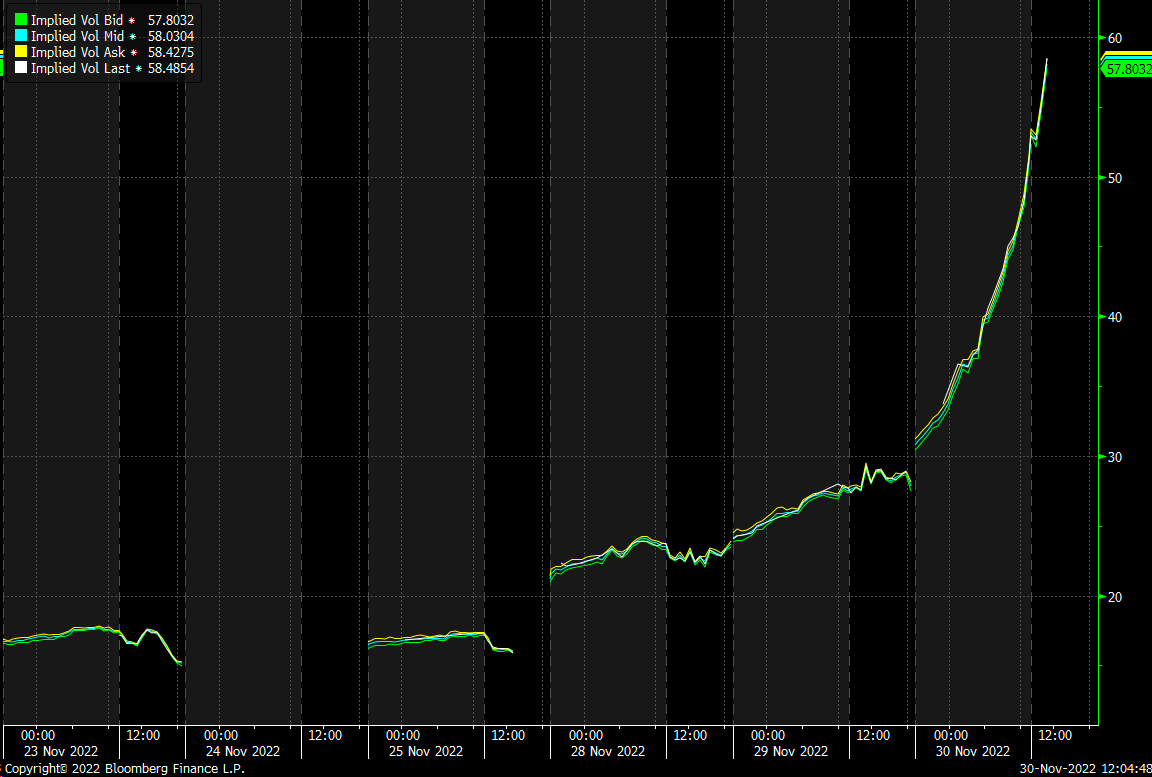
Per SpotGamma, recent action has been “dominated by very short-dated options”; on November 30, implied volatility (IVOL) measures for the same day’s expiry rose, pointing to demand for protection across options with the least time to expiry.

These options are highly sensitive and, if traded in a large enough size, can impact markets markedly (e.g., provide a big boost to bullish-type macro repositioning when the IVOL of soon-to-expire options finally compresses).

Graphic: Retrieved from Bloomberg via Michael J. Kramer.

That said, a trend is intact.

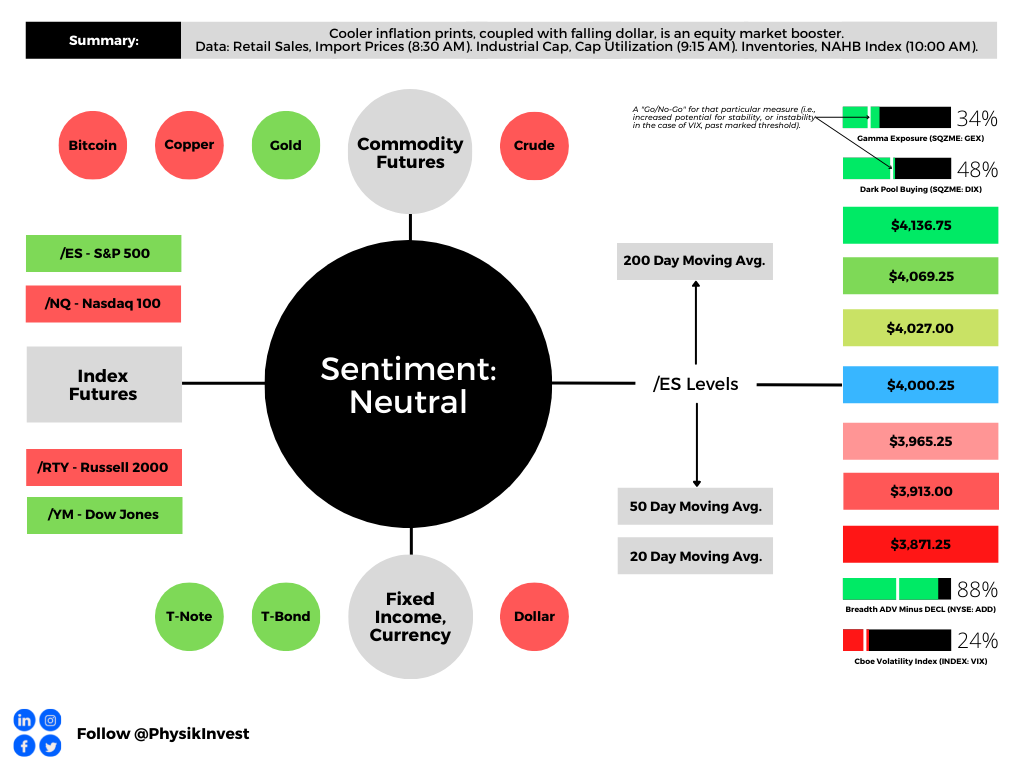
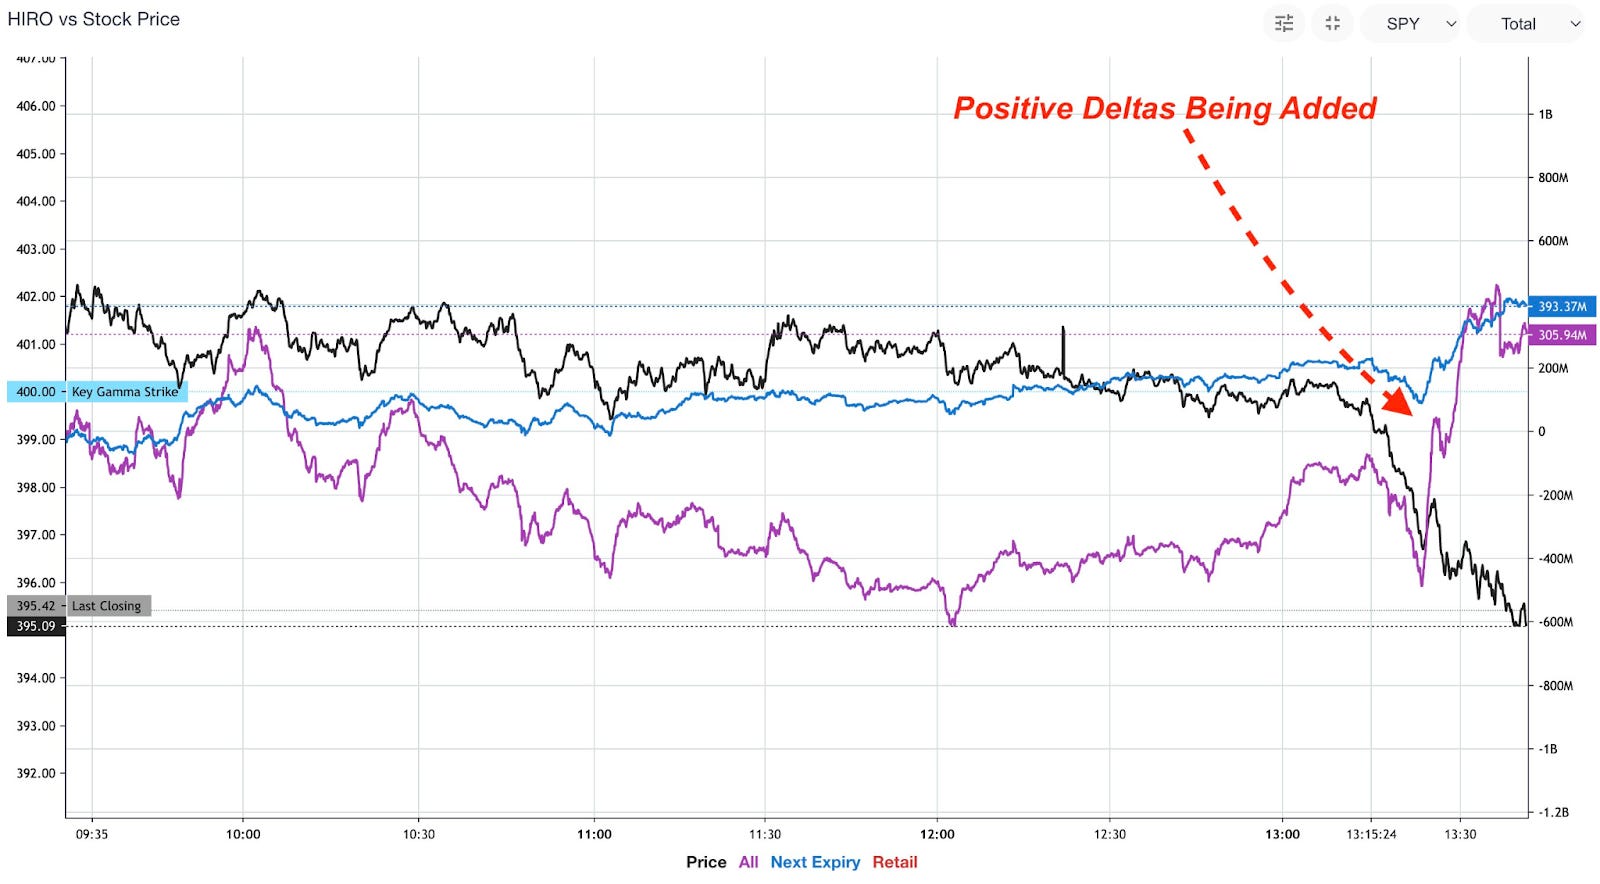
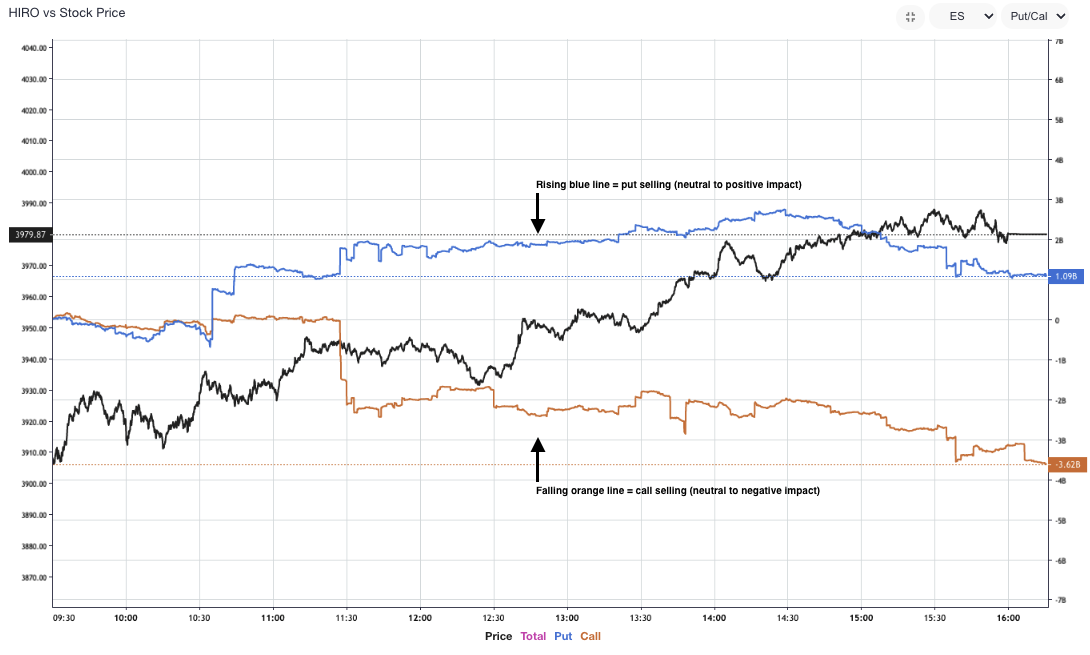
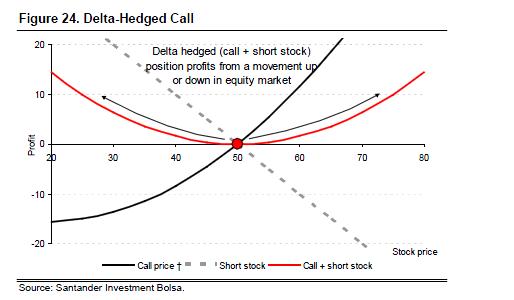
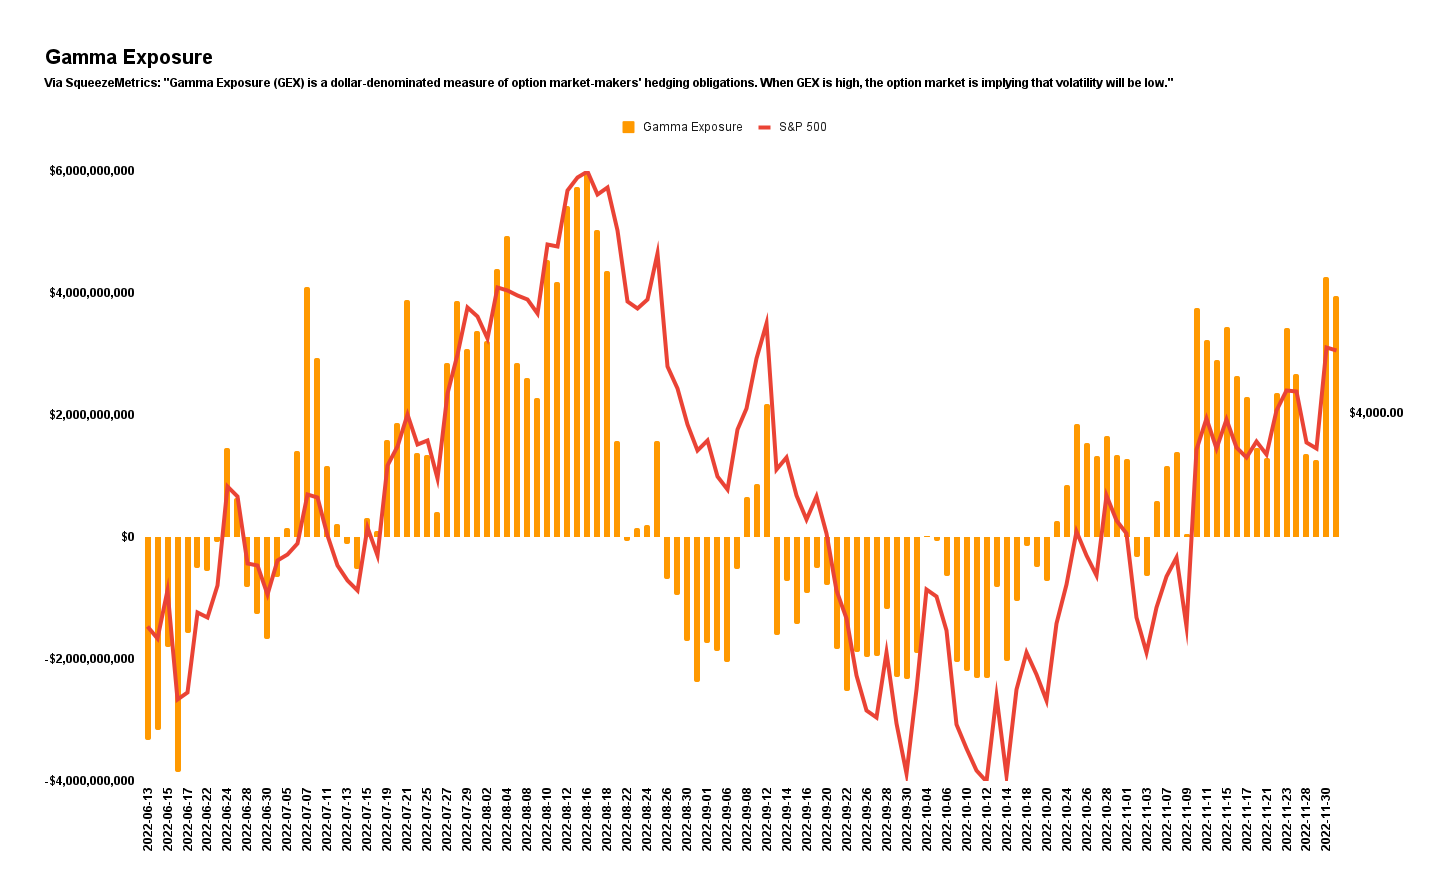
Traders’ fears continue to be assuaged, as evidenced by a general “supply of call options,” per SpotGamma, and further “implied volatility compression”; investors’ counterparts (i.e., liquidity providers) are recipient to increased positive exposure to movement (i.e., +Gamma), as evidenced by the below graphic. If movement is beneficial, and the counterparty is not interested in realizing that benefit, it may hedge in a manner that can eat away at realized volatility (RVOL), resulting in tighter ranges. SpotGamma adds that “barring big changes in positioning into 12/14 FOMC and 12/16 OPEX,” expected is more of the same (i.e., sideways to higher).

Graphic: Retrieved from Physik Invest.

Technical

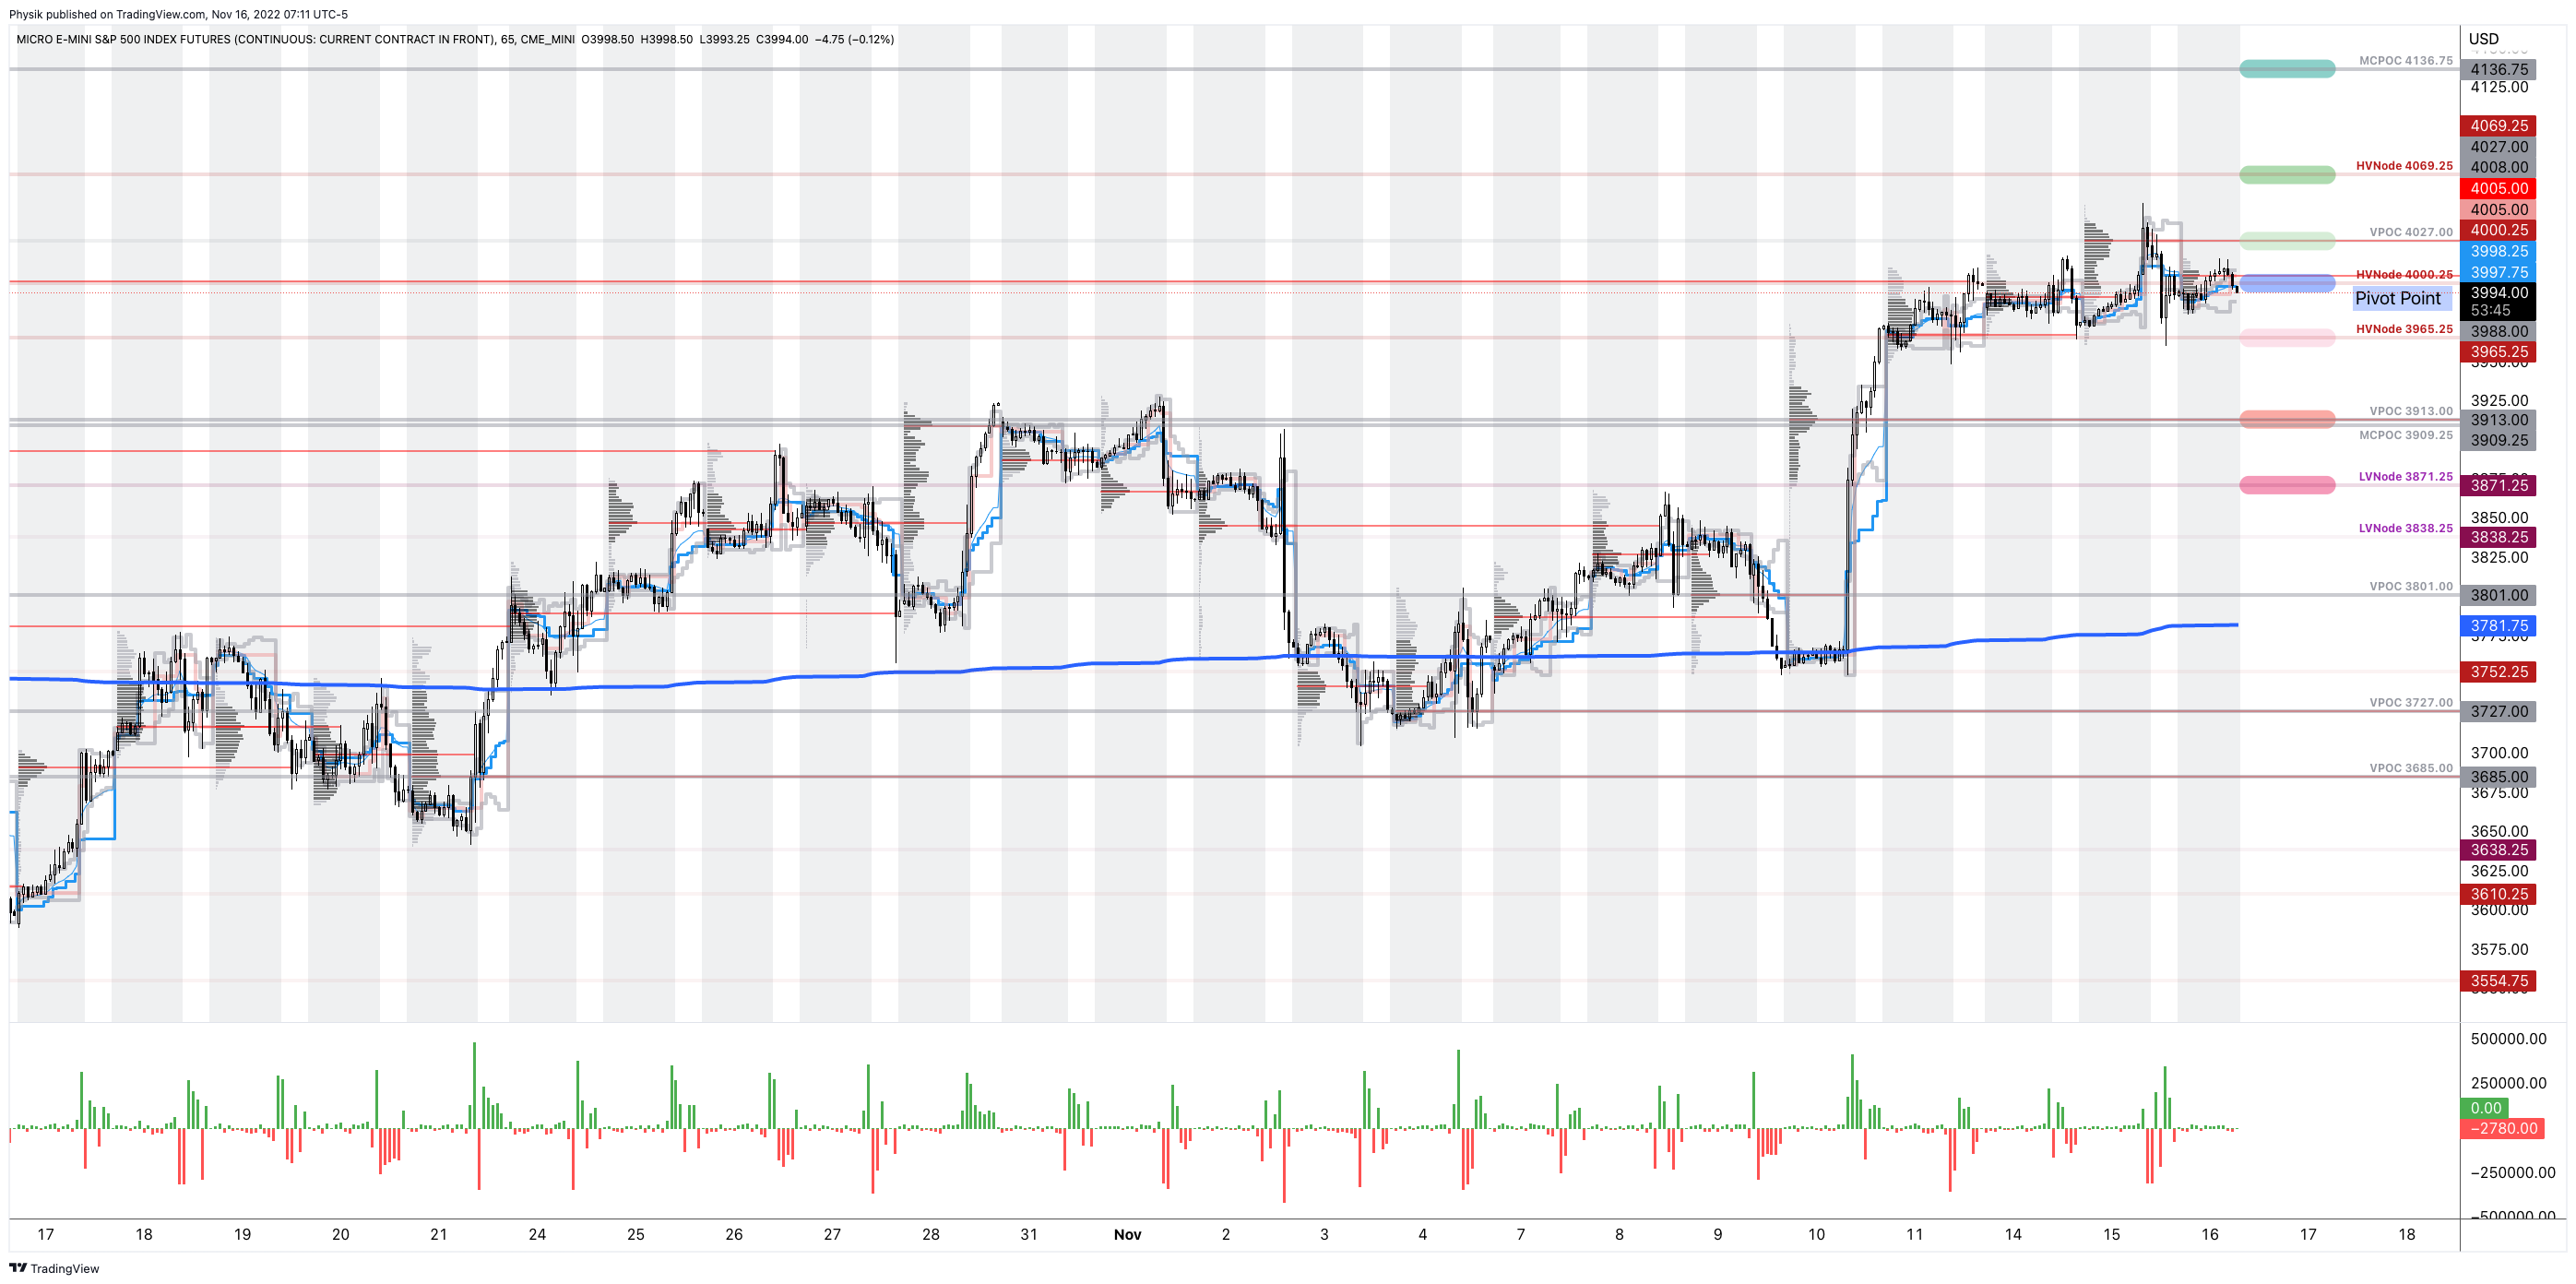
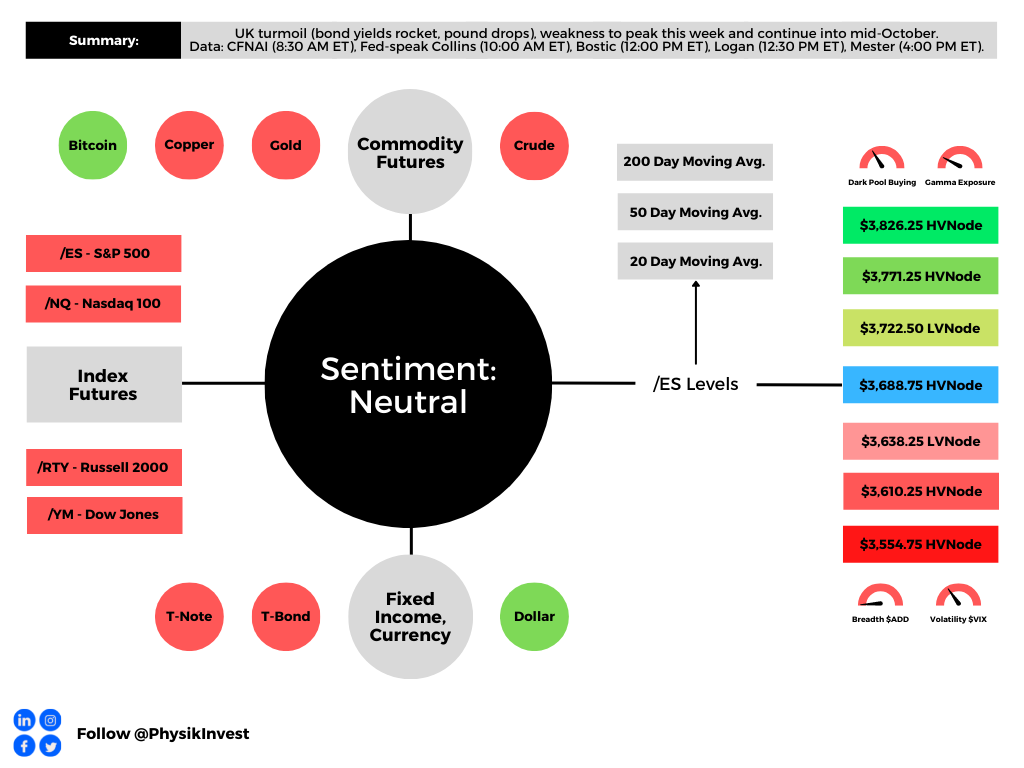
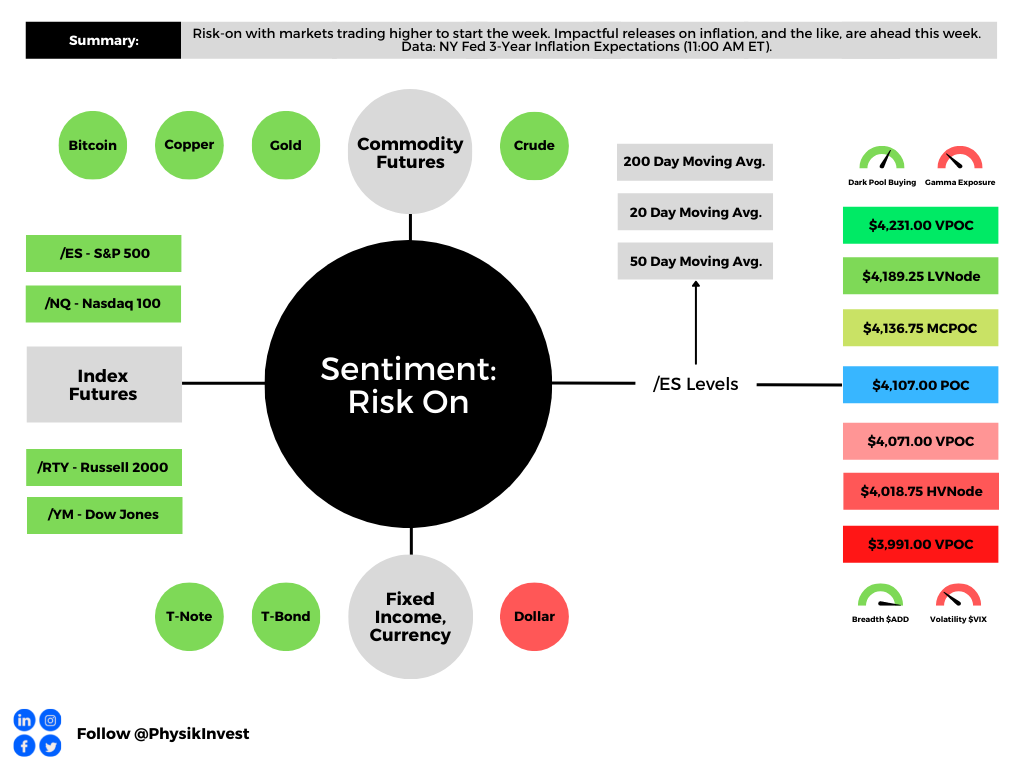
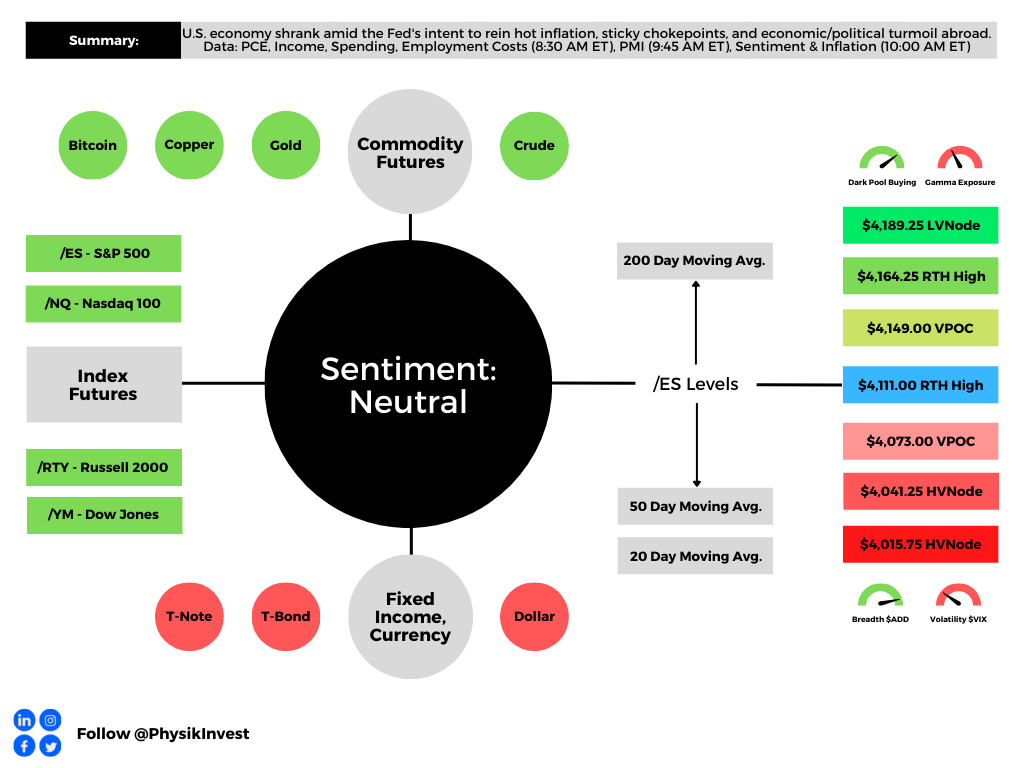
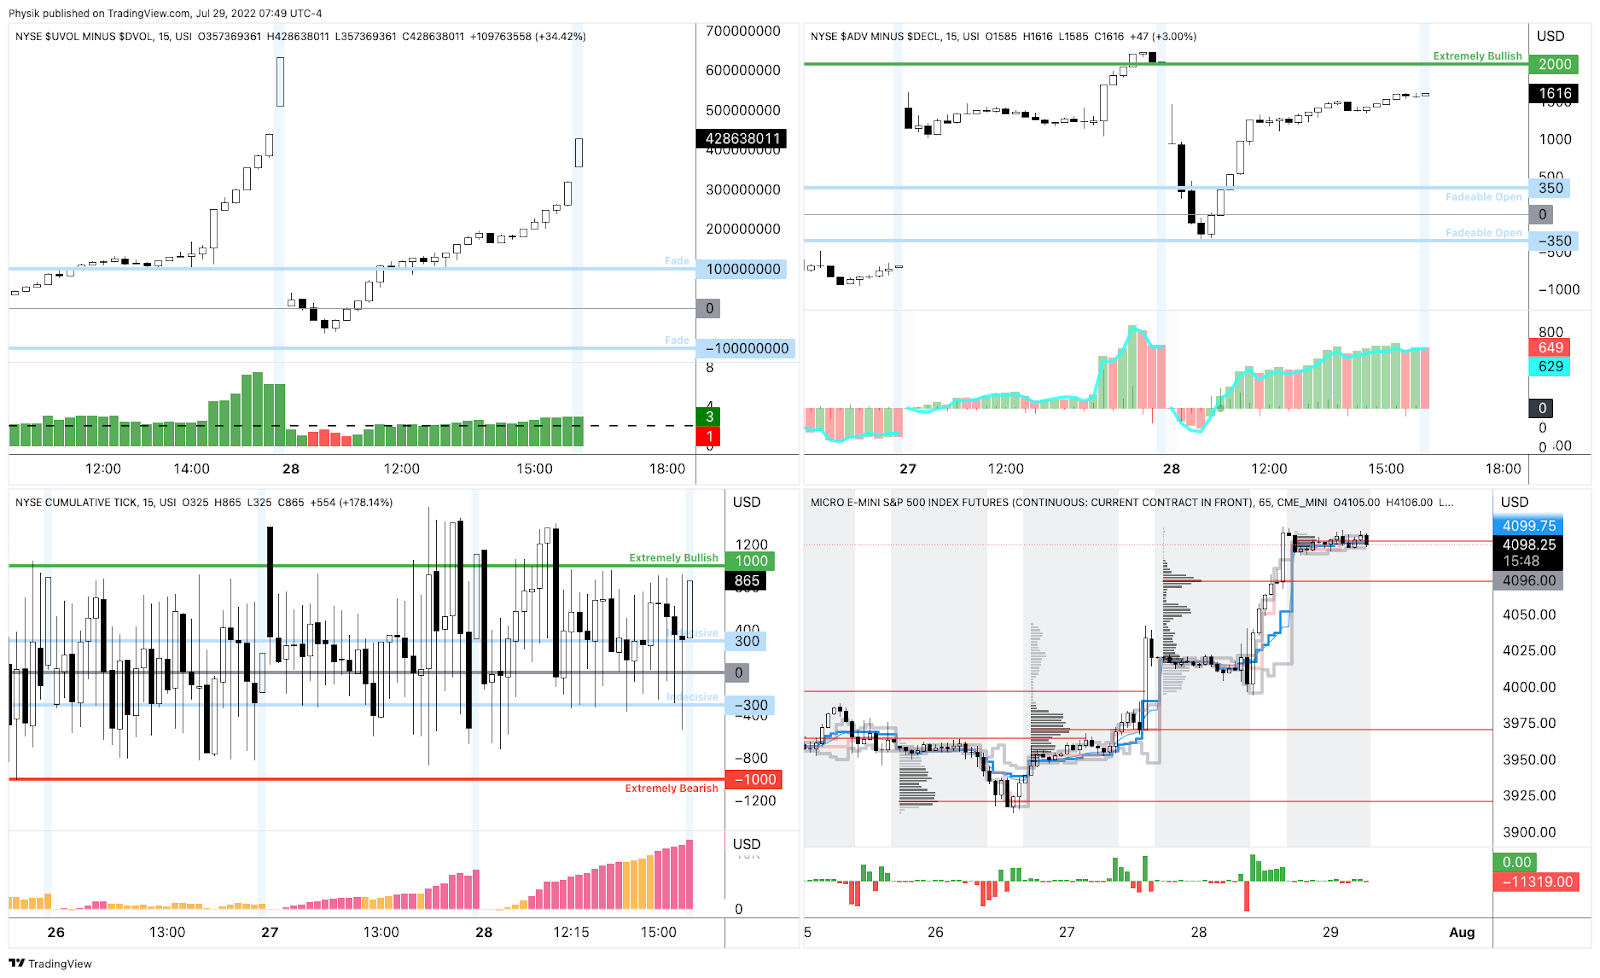
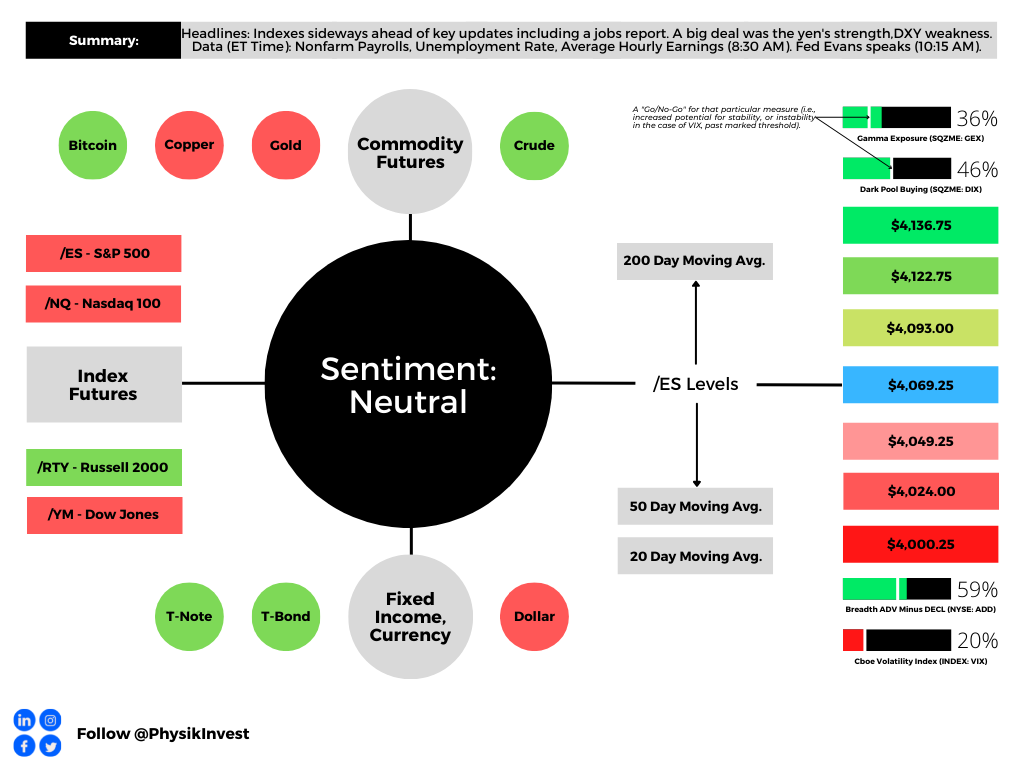
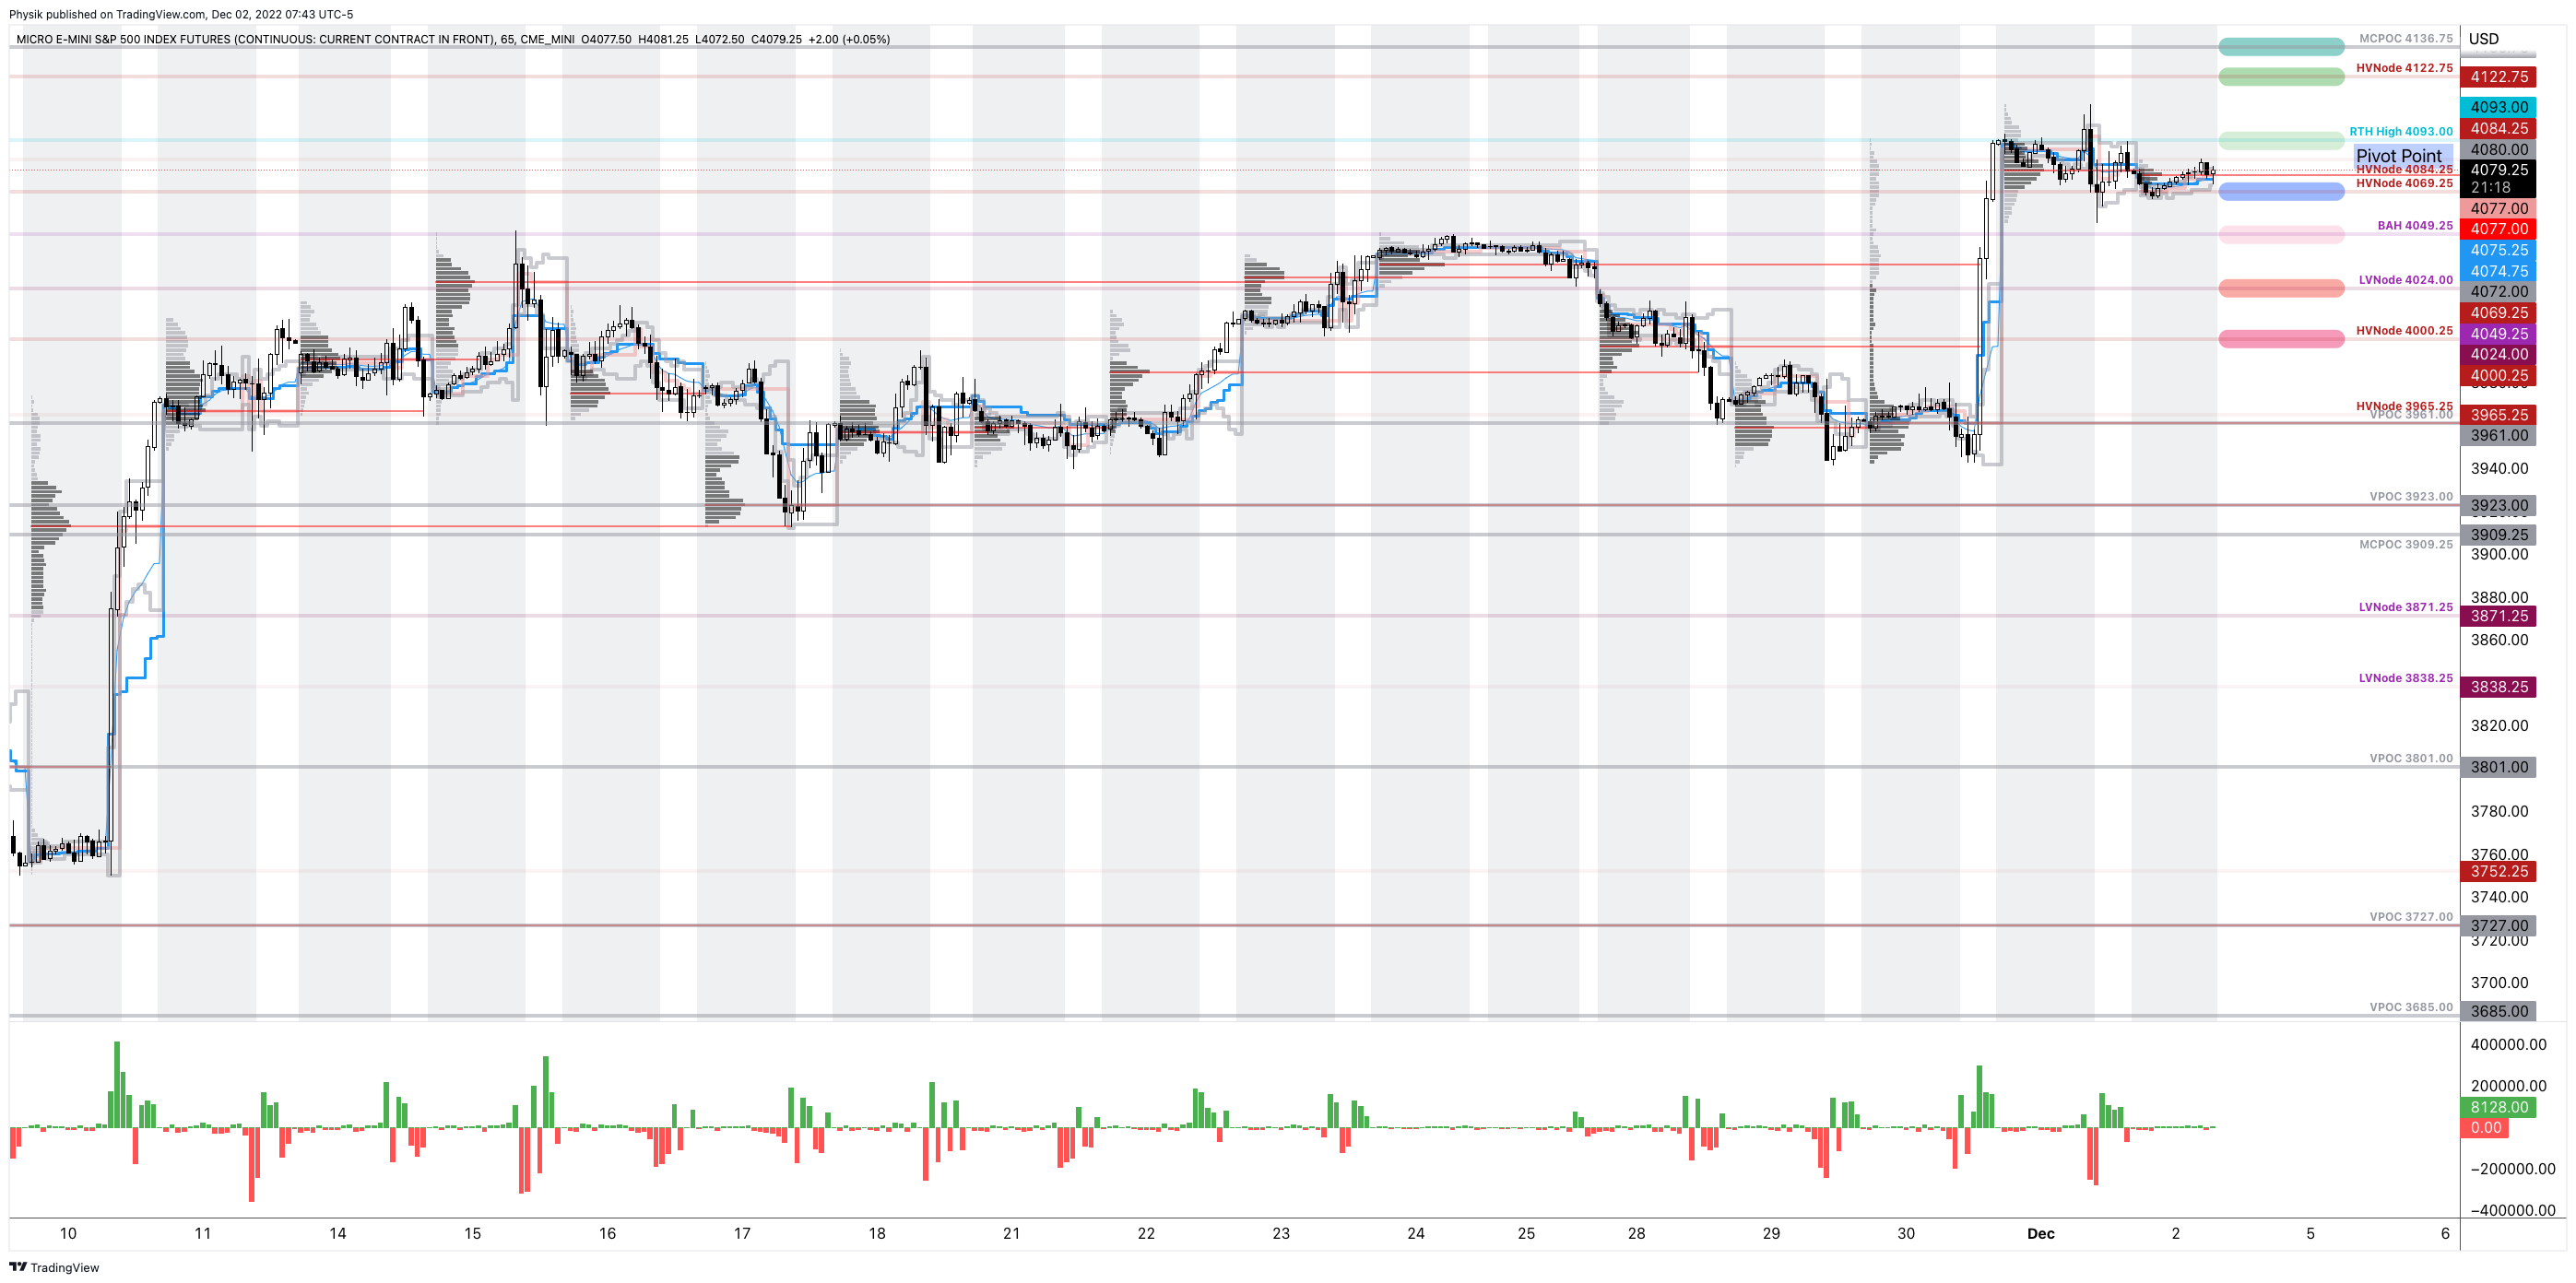
As of 7:45 AM ET, Friday’s regular session (9:30 AM – 4:00 PM ET), in the S&P 500, is likely to open in the middle part of a balanced overnight inventory, inside of prior-range and -value, suggesting a limited potential for immediate directional opportunity.

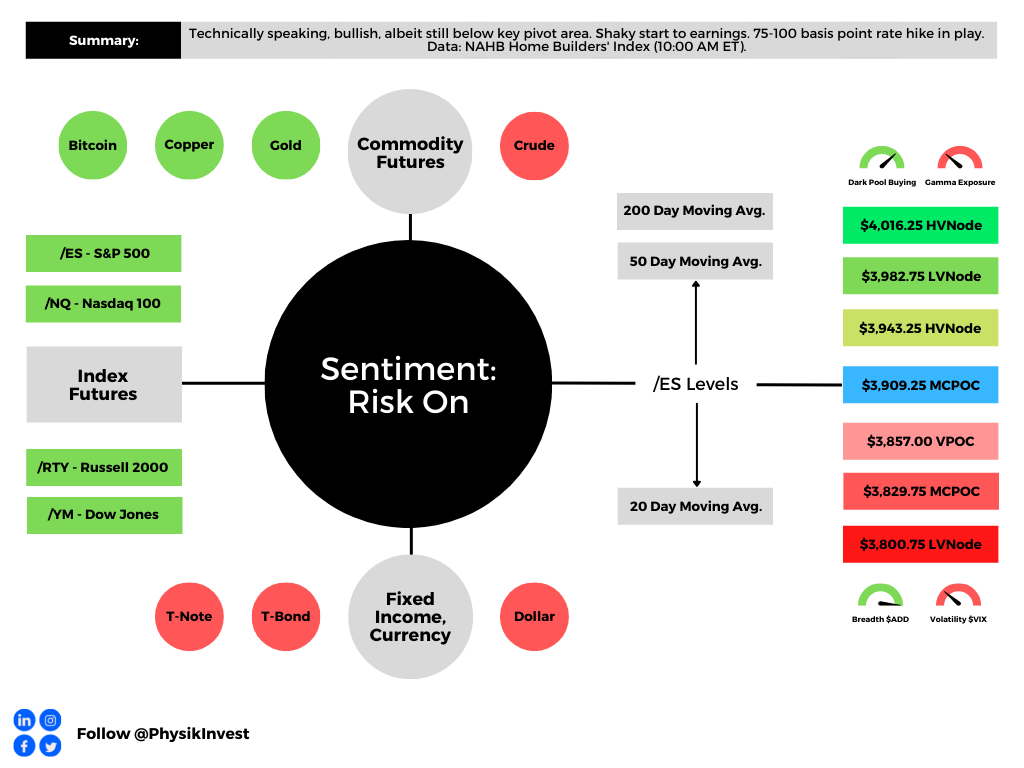
Our S&P 500 pivot for today is $4,069.25.

Key levels to the upside include $4,093.00, $4,122.75, and $4,136.75.

Key levels to the downside include $4,049.25, $4,024.00, and $4,000.25.

Click here to load today’s key levels into the web-based TradingView platform. All levels are derived using the 65-minute timeframe. New links are produced, daily.

Graphic: 65-minute profile chart of the Micro E-mini S&P 500 Futures.

Definitions

Volume Areas: Markets will build on areas of high-volume (HVNodes). Should the market trend for long periods of time, it will be identified by low-volume areas (LVNodes). LVNodes denote directional conviction and ought to offer support on any test.

If participants auction and find acceptance in an area of a prior LVNode, then future discovery ought to be volatile and quick as participants look to HVNodes for favorable entry or exit.

POCs: Denote areas where two-sided trade was most prevalent in a prior day session. Participants will respond to future tests of value as they offer favorable entry and exit.

MCPOCs: Denote areas where two-sided trade was most prevalent over numerous sessions. Participants will respond to future tests of value as they offer favorable entry and exit.

Volume-Weighted Average Prices (VWAPs): A metric highly regarded by chief investment officers, among other participants, for quality of trade. Additionally, liquidity algorithms are benchmarked and programmed to buy and sell around VWAPs.


About

In short, an economics graduate working in finance and journalism.

Capelj spends most of his time as the founder of Physik Invest through which he invests and publishes daily analyses to subscribers, some of whom represent well-known institutions.

Separately, Capelj is an equity options analyst at SpotGamma and an accredited journalist interviewing global leaders in business, government, and finance.

Past works include conversations with investor Kevin O’Leary, ARK Invest’s Catherine Wood, FTX’s Sam Bankman-Fried, Lithuania’s Minister of Economy and Innovation Aušrinė Armonaitė, former Cisco chairman and CEO John Chambers, and persons at the Clinton Global Initiative.

Contact

Direct queries to renato@physikinvest.com or Renato Capelj#8625 on Discord.

Disclaimer

Do not construe this newsletter as advice. All content is for informational purposes.

Categories
Commentary

Daily Brief For November 16, 2022

Physik Invest’s Daily Brief is read by over 1,200 people. To join this community and learn about the fundamental and technical drivers of markets, subscribe below.

Graphic updated 7:15 AM ET. Sentiment Neutral if expected /ES open is inside of the prior day’s range. /ES levels are derived from the profile graphic at the bottom of this letter. Levels may have changed since initially quoted; click here for the latest levels. SqueezeMetrics Dark Pool Index (DIX) and Gamma (GEX) with the latter calculated based on where the prior day’s reading falls with respect to the MAX and MIN of all occurrences available. A higher DIX is bullish. At the same time, the lower the GEX, the more (expected) volatility. Click to learn the implications of volatility, direction, and moneyness. Breadth reflects a reading of the prior day’s NYSE Advance/Decline indicator. VIX reflects a current reading of the CBOE Volatility Index (INDEX: VIX) from 0-100.

Administrative

There will be no Daily Brief published on Thursday, November 17, 2022.

Positioning

Given where realized (RVOL) and implied (IVOL) volatility measures are, as well as skew, it is beneficial to enter into such trades including protective collars (i.e., sell call, buy put), as stated in yesterday’s letter and explicitly discussed by the likes of Nomura Holdings Inc’s (NYSE: NMR) Charlie McElligott. 

To quote McElligott: The “legacy ‘short skew’ trade that’s been the key US equities vol theme of 2022 is now at risk of its own ‘regime change’ reversal, too. This is, then, especially interesting when considering that ongoing VIX call [or] call spread buying … generally some pretty ‘tail-y’ stuff that is beginning to get loaded into.”

Graphic: Retrieved from The Ambrus Group’s Kris Sidial. This is “gutter low vol.”

Entering trades that change non-linearly with respect to changes in implied volatility (IVOL) and direction (Delta) exposes participants to convexity (Gamma).

A simple way to think about this is if the market was to shock lower by one, all else equal, the derivative’s value would change in excess of that. On the other hand, if one was short static (not dynamic) Delta, meaning they profit from that movement lower, profits realized would be one for one with the change in the underlying.

Graphic: Retrieved from Banco Santander SA (NYSE: SAN).

So, given the flat skew we mentioned earlier, it is attractive in price to hedge against the downside. Whether that downside materializes, is another story.

Graphic: Retrieved from Goldman Sachs Group Inc (NYSE: GS). Equity skew is so depressed in the US that one could buy a multiple of the calls they sold in the S&P 500, elsewhere.

Food For Thought:

This is amidst the responsiveness near key technical areas provided in past letters. It suggests traders with short time horizons are very active and anchoring to key areas, such as $4,000.00 in the S&P 500. These same participants will often lack the wherewithal to defend retests, and big participants (some of whom move by committee) seldom respond to those technical inflections. 

Graphic: Retrieved from SpotGamma.

According to SpotGamma, a provider of data and written analyses on the options market, data shows the “$4,000.00 strike continu[ing] to dominate both in terms of position sizing” with calls, at that level most likely “being sold, which has helped maintain $4,000.00 resistance.”

The sale of IVOL leaves counterparties with long (+Delta) exposure to be hedged through sales (-Delta) of the underlying. As the market trades higher, these options, which are very close to current market prices, have a lot of Gamma, meaning they are very sensitive to changes in the price of the underlying (or convex and non-linear to direction). That means these options can go from having little value to a lot of value, quickly.

Graphic: Taken from Exotic Options and Hybrids: A Guide to Structuring, Pricing and Trading. 

If the market is below $4,000.00 and trading higher, while at $4,000.00 there is a lot of this trade going on, then the counterparty will sell the underlying to offset gains in their options while the reverse happens if the market is trading down, as SpotGamma data showed, yesterday. When the market traded lower, positive Delta was firing off, which is supportive, hence the mean-reversion back to $4,000.00 into the close.

Graphic: SPY HIRO. Retrieved from SpotGamma’s Twitter. Posted 11/15/2022 at 1:42 PM ET.

A quick check of how sticky these areas may be, look at the level of positive Gamma.

As traders bet against the market movement, counterparties take on more exposure to positive Gamma. In hedging this positive Gamma, the counterparty does more to reduce market movement.

Couple this mean-reversion-type activity with the structural Delta buyback linked to the passage of time (Charm) and compression of volatility (Vanna), these conditions do more to bolster continued relief, as put forth by Goldman Sachs Group Inc.

Another consequence, as picked up by individuals online including Darrin John, the S&P 500’s realized volatility (RVOL) “is so high” with “a basket of 500 of the ‘best’ stocks in the US [wildly] swing[ing] +5% in a single day,” while the S&P 500 is relatively mute, as your letter writer sees it.

In general, something has to give. If there are forces that are pinning the S&P 500, all the while there are arbitrage constraints connecting the components and all, then correlation must break and dispersion must increase. In short, this is a trader’s market; data shows managers tend to “outperform the worst by more during periods of lower correlation,” as does “higher dispersion.”

Should traders continue to hone in on key areas, and add to the interest and volume near those areas, then the market is likely prone to more of the same. Expect pinning and sideways to up. If there were to be a decrease in positive Gamma exposures, that likely opens the door to more movement. Likewise, if traders’ bets are concentrated elsewhere (higher or lower), that can open the door to relief. A catalyst for that may be something fundamental.

The Key Takeaway:

Recent happenings mimic that of the Global Financial Crisis when, according to The Ambrus Group’s Kris Sidial, “vol slowly [ground] until the eventual October 2008 move (i.e., Lehman).” 

“The markets were understanding that there was a change going on, especially in credit. But that risk was discounted until it was forced into realization.”

Simple trades to protect (or capitalize on this) include collars, as stated earlier, as well as calendars. If you expect RVOL on the index level, at least, to be mute, then sell short-dated exposure and use those proceeds to purchase farther-dated exposure (e.g., sell weekly put to buy monthly put).

Why? 

When you think there is to be an outsized move in the underlying, relative to what is priced, you buy options (+Gamma). When you think there is to be an outsized move in the implied volatility, relative to what is priced, you buy options (+Volga). If there’s a large change in direction (RVOL) or IVOL repricing, you may make money. 

Ultimately, “liquidity providers’ response to demand for protection (en masse) would, then, likely exacerbate the move and aid in the repricing of IVOL to levels where there would be more stored energy to catalyze a rally,” as we saw after elections and CPI … 

Graphic: Commentary published by Kai Volatility.

… alongside the Dollar’s (INDEX: DXY) weakness which is easing the burden on margins and global funding.

Per Morgan Stanley (NYSE: MS), “simple math on S&P 500 earnings from currency is that for every percentage point increase on a YoY basis, it’s [] a 0.5 hit to EPS growth.”

Graphic: Retrieved from Bloomberg.

Technical

As of 7:15 AM ET, Wednesday’s regular session (9:30 AM – 4:00 PM ET), in the S&P 500, is likely to open in the middle part of a balanced overnight inventory, inside of prior-range and -value, suggesting a limited potential for immediate directional opportunity.

Our S&P 500 pivot for today is $4,000.25. 

Key levels to the upside include $4,027.00, $4,069.25, and $4,136.75. 

Key levels to the downside include $3,965.25, $3,913.00, and $3,871.25.

Click here to load today’s key levels into the web-based TradingView platform. All levels are derived using the 65-minute timeframe. New links are produced, daily.

Graphic: 65-minute profile chart of the Micro E-mini S&P 500 Futures.

Definitions

Volume Areas: A structurally sound market will build on areas of high volume (HVNodes). Should the market trend for long periods of time, it will lack sound structure, identified as low volume areas (LVNodes). LVNodes denote directional conviction and ought to offer support on any test. 

If participants were to auction and find acceptance into areas of prior low volume (LVNodes), then future discovery ought to be volatile and quick as participants look to HVNodes for favorable entry or exit.

POCs: POCs are valuable as they denote areas where two-sided trade was most prevalent in a prior day session. Participants will respond to future tests of value as they offer favorable entry and exit.

MCPOCs: POCs are valuable as they denote areas where two-sided trade was most prevalent over numerous day sessions. Participants will respond to future tests of value as they offer favorable entry and exit.

About

After years of self-education, strategy development, mentorship, and trial-and-error, Renato Leonard Capelj began trading full-time and founded Physik Invest to detail his methods, research, and performance in the markets. 

Capelj also writes options market analyses at SpotGamma and is a Benzinga journalist. 

His past works include private discussions with ARK Invest’s Catherine Wood, investors Kevin O’Leary and John Chambers, the infamous Sam Bankman-Fried of FTX, former Bridgewater Associate Andy Constan, Kai Volatility’s Cem Karsan, The Ambrus Group’s Kris Sidial, the Lithuanian Delegation’s Aušrinė Armonaitė, among many others.

Contact

Direct queries to renato@physikinvest.com or Renato Capelj#8625 on Discord.

Disclaimer

Do not construe this newsletter as advice. All content is for informational purposes.

Categories
Commentary

Daily Brief For September 27, 2022

The daily brief is a free glimpse into the prevailing fundamental and technical drivers of U.S. equity market products. Join the 950+ that read this report daily, below!

Graphic updated 6:45 AM ET. Sentiment Neutral if expected /ES open is inside of the prior day’s range. /ES levels are derived from the profile graphic at the bottom of the following section. Levels may have changed since initially quoted; click here for the latest levels. SqueezeMetrics Dark Pool Index (DIX) and Gamma (GEX) calculations are based on where the prior day’s reading falls with respect to the MAX and MIN of all occurrences available. A higher DIX is bullish. At the same time, the lower the GEX, the more (expected) volatility. Learn the implications of volatility, direction, and moneyness. Breadth reflects a reading of the prior day’s NYSE Advance/Decline indicator. VIX reflects a current reading of the CBOE Volatility Index (INDEX: VIX) from 0-100.

Fundamental

Top of mind, yesterday, was the drop in Britain’s currency (GBP) and a surge in bond yields on the back of new fiscal plans and pledged tax cuts, alongside a more easy pace of interest rate hikes by the Bank of England (BoE). See the Daily Brief for September 26, 2022, for context.

Graphic: Retrieved from Bloomberg.

Knowing that the fiscal stimulus and an easy-moving BoE would add to inflation that is already high and sticky, traders began pricing emergency rate hikes, all the while conversation around the impacts of the UK’s rising rates on mortgage lending and the “dollar doom loop” surfaced.

In response, the BoE’s Governor Andrew Bailey said they were “monitoring developments in financial markets,” and at the “next scheduled meeting of the impact on demand and inflation from the Government’s announcement, and the fall in sterling, … [t]he MPC [won’t] hesitate to change interest rates by as much as needed to return inflation to the 2% target.”

Per Citigroup Inc (NYSE: C), however, “[m]onetary policy will struggle to save FX when fiscal policy is the culprit.”

Lawrence Henry Summers, a former US Secretary of the Treasury, also commented that he “would not be amazed if British short rates more than triple in the next two years and reach levels above 7 percent.”

That’s “because US rates are now projected to approach 5 percent and Britain, [which] has much more serious inflation, is pursuing more aggressive fiscal expansion and has larger financing challenges.”

Graphic: Retrieved from Bloomberg.

On the topic of rising yields and lenders’ disinterest to issue mortgages, among other things, it is the case that bond buying, via tools such as quantitative easing (QE), left room for confidence to eventually run out and the bond market to revolt.

Read our monetary policy explainers published on September 19 and 20.

Per statements authored by Bloomberg’s John Authers, the “UK appears to be the first case of a true disorderly bond selloff, where the moves are so swift that they affect the functioning of the financial system. It’s been triggered by a combination of inflation and rash fiscal policy.”

Accordingly, the actions by policymakers abroad serve to reinforce the earlier discussed “dollar doom loop”; the rising USD, though reducing the impact of inflation in the US, ultimately hurts most dollar-denominated debt servicing (see Latin America in the 1980s).

Graphic: Retrieved from Bloomberg.

Positioning

Seasonally speaking, the week after September options expiry (OPEX) is one of the worst on record. The weakness often persists into October.

To quote Kai Volatility’s Cem Karsan:

So, “less support from Vanna and Charm, less support through QT, and less buyback,” presents a “fragile moment” with the next week representing the most “dangerous period” on record.

Graphic: Retrieved from SpotGamma. “SPX prices X-axis. Option delta Y-axis. When the factors of implied volatility (Vanna) and time change (Charm), hedging ratios change. The graphic is for illustrational purposes, only.”

For context, it is the impacts of quantitative tightening (QT) which is manifesting itself as “$4.5 billion less in demand for assets per day,” as well as the blackout period for buybacks (which were consistently “supporting the market”) and options repositioning bolstering the weakness.

Graphic: Via Physik Invest. Data compiled by @jkonopas623. Fed Balance Sheet data, here. Treasury General Account Data, here. Reverse Repo data, here. NL = BS – TGA – RRP.

Separately, a hot topic concerns the money that is piling into money funds where “the vast bulk now earns upwards of 2%, with pockets paying 3%, 4% or more.”

Graphic: Retrieved from Bloomberg. “Money funds, banks, and others are so flush with cash these days that they’re shoveling record amounts into the Fed’s overnight reverse repurchase agreement facility, a short-term instrument that, following the central bank’s 75 basis point hike last week, now pays a rate of 3.05%.”

The theory is as follows: if “cash is yielding 4%, why not just sit in cash while the macro environment clarifies a little bit?”

With traditional 60/40 upended, and the gap “between what banks are paying on deposits and what money-market funds are offering” widening, “money funds are likely to attract more inflows going forward as a result, pushing [the] usage of the RRP facility even higher.” 

Graphic: Retrieved from Goldman Sachs Group Inc (NYSE: GS).

This is all, however, money that is waiting to be deployed, “should market sentiment improve, or asset prices tumble to levels too attractive to pass up.”

Should you, too, desire to pursue guaranteed rates of return, last week Box Spreads were put forth as a solution. These trades “allow market participants to create a loan structure similar to a Treasury bill.” Upon maturity, the Box Spread earns a competitive interest rate.

Price some trades at boxtrades.com.

Graphic: Retrieved from boxtrades.com.

Technical

As of 6:30 AM ET, Tuesday’s regular session (9:30 AM – 4:00 PM ET), in the S&P 500, is likely to open in the middle part of a positively skewed overnight inventory, inside of prior-range and -value, suggesting a limited potential for immediate directional opportunity.

In the best case, the S&P 500 trades higher.

Any activity above the $3,688.75 HVNode puts into play the $3,722.50 LVNode. Initiative trade beyond the LVNode could reach as high as the $3,771.25 and $3,826.25 HVNode, or higher.

In the worst case, the S&P 500 trades lower.

Any activity below the $3,688.75 HVNode puts into play the $3,638.25 LVNode. Initiative trade beyond the LVNode could reach as low as the $3,610.75 and $3,554.75 HVNode, or lower.

Click here to load today’s key levels into the web-based TradingView charting platform. Note that all levels are derived using the 65-minute timeframe. New links are produced, daily.
Graphic: 65-minute profile chart of the Micro E-mini S&P 500 Futures.

Definitions

Volume Areas: A structurally sound market will build on areas of high volume (HVNodes). Should the market trend for long periods of time, it will lack sound structure, identified as low volume areas (LVNodes). LVNodes denote directional conviction and ought to offer support on any test. 

If participants were to auction and find acceptance into areas of prior low volume (LVNodes), then future discovery ought to be volatile and quick as participants look to HVNodes for favorable entry or exit.

Vanna: The rate at which the delta of an option changes with respect to volatility.

Charm: The rate at which the delta of an option changes with respect to time.

About

After years of self-education, strategy development, mentorship, and trial-and-error, Renato Leonard Capelj began trading full-time and founded Physik Invest to detail his methods, research, and performance in the markets.

Capelj also develops insights around impactful options market dynamics at SpotGamma and is a Benzinga reporter.

Some of his works include conversations with ARK Invest’s Catherine Wood, investors Kevin O’Leary and John Chambers, FTX’s Sam Bankman-Fried, ex-Bridgewater Associate Andy Constan, Kai Volatility’s Cem Karsan, The Ambrus Group’s Kris Sidial, among many others.

Disclaimer

In no way should the materials herein be construed as advice. Derivatives carry a substantial risk of loss. All content is for informational purposes only.

Categories
Commentary

Daily Brief For September 26, 2022

The daily brief is a free glimpse into the prevailing fundamental and technical drivers of U.S. equity market products. Join the 950+ that read this report daily, below!

Graphic updated 8:30 AM ET. Sentiment Neutral if expected /ES open is inside of the prior day’s range. /ES levels are derived from the profile graphic at the bottom of the following section. Levels may have changed since initially quoted; click here for the latest levels. SqueezeMetrics Dark Pool Index (DIX) and Gamma (GEX) calculations are based on where the prior day’s reading falls with respect to the MAX and MIN of all occurrences available. A higher DIX is bullish. At the same time, the lower the GEX, the more (expected) volatility. Learn the implications of volatility, direction, and moneyness. Breadth reflects a reading of the prior day’s NYSE Advance/Decline indicator. VIX reflects a current reading of the CBOE Volatility Index (INDEX: VIX) from 0-100.

Fundamental

Overnight news was focused on the drop in Britain’s currency and a surge in bond yields. Per Bloomberg, the UK government’s talk about new fiscal plans and pledged tax cuts, alongside moderate interest rate hikes by the Bank of England (BoE), is the source of the weakness.

That’s because fiscal stimulus, which is part of a strategy to stoke “all-out” growth now, would add to the inflation already high and sticky from supply chokepoints and an easy-moving BoE.

Graphic: Retrieved from Reuters’ John Kemp. This action increases the UK’s competitiveness. It also increases the cost of important items in the UK, like gas for your car and electricity.

“An emergency rate hike would be a damning indictment of the government’s strategy, but it will become increasingly likely if markets fail to stabilize,” said Bloomberg economist Dan Hanson. 

Adding, traders are pricing increased odds of rate increases (~1.75%) by the BoE’s next policy meeting in November. Looking back, in the wake of previous tax giveaways, interest rates rose by a lot to stem the inflationary shock.

Graphic: Retrieved from Bloomberg. “A combination of sharply rising bond yields and a sharply falling currency is very unusual outside emerging markets, and implies doubts over the government’s ability to service its debt.”

The weekend news, has us looking back to our letters on a “self-reinforcing ‘dollar doom loop,’” as Jon Turek of JST Advisors once put forth. It’s the case that the dominant currency for carry, due to easy monetary policies, was the dollar.

However, “the stronger the dollar gets in comparison, the less tenable it becomes as a global reserve,” and this puts pressure on the longer-term trajectory of the currency. 

Knowing that US market liquidity, as well as the dollar’s strong role as a reserve, put the S&P 500 at the center of global carry regimes, an unwinding of carry may compound a market fall affecting nearly all risk assets.

Graphic: Retrieved from Ian Harnett of Absolute Strategy Research. Via The Market Ear.

Accordingly, as put forth in Mr. Blonde’s letter, “[e]ven if you are optimistic about growth and the ability of [the] global economy to digest significant financial conditions tightening, you no longer need to be 100% invested in risky, less liquid, assets when you get a competitive return from risk-free cash.”

Graphic: Retrieved from Mr. Blonde.

Positioning

Following the September options expiration (OPEX), markets tend to have their worst week.

From thereon, the weak seasonality tends to persist for about a month, into mid-October. Given this, Kai Volatility’s Cem Karsan explained, “you need to keep selling the rallies, … [as the] war between the structural negative effects, macro flows, and positioning,” is likely to continue.

Graphic: Retrieved from Mr. Blonde.

Dollar strength should feed into margin compression just now “filtering through” and impacting “international dollar-denominated debt.”

That compounds the impact of quantitative tightening (QT) which is manifesting itself as “$4.5 billion less in demand for assets per day,” as well as the blackout period for buybacks (which were consistently “supporting the market”) and options repositioning.

Read our monetary policy explainers published on September 19 and 20.
Graphic: Via Physik Invest. Data compiled by @jkonopas623. Fed Balance Sheet data, here. Treasury General Account Data, here. Reverse Repo data, here. NL = BS – TGA – RRP.

At the beginning of the 5-week expiration cycle, Karsan explained, Vanna and Charm flows are reduced; there is “significantly less buyback” of counterparty short stock and futures hedges to “the decay of options which sit at the October monthly expiration.”

So, “less support from Vanna and Charm, less support through QT, and less buyback,” presents a “fragile moment” with the next week representing the most “dangerous period” on record.

Graphic: Retrieved from SpotGamma. “SPX prices X-axis. Option Delta Y-axis. When the factors of implied volatility and time change, hedging ratios change. For instance, if SPX is at $4,700.00 and IV jumps 15% (all else equal), the dealer may sell an additional 0.2 Deltas to hedge their exposure to the addition of a positive 0.2 Delta. The graphic is for illustrational purposes, only.”

Ultimately, “December’s quarterly [OPEX] is now coming into the picture, … [where] volatility is generally highly demanded. When you get a lot of volatility supply in that area, you begin to see people who are short getting back the volatility they were short.”

In other words, equities down, implied volatility down is likely to persist for a little while longer as the risks for a “tail” build; “there’s a window that is opening for long volatility to perform probably starting in about a month or two,” through to “January and March.”

Technical

As of 8:30 AM ET, Monday’s regular session (9:30 AM – 4:00 PM ET), in the S&P 500, is likely to open in the lower part of a negatively-skewed overnight inventory, inside of prior-range and -value, suggesting a limited potential for immediate directional opportunity.

In the best case, the S&P 500 trades higher.

Any activity above the $3,688.75 HVNode puts into play the $3,722.50 LVNode. Initiative trade beyond the LVNode could reach as high as the $3,771.25 and $3,826.25 HVNode, or higher.

In the worst case, the S&P 500 trades lower.

Any activity below the $3,688.75 HVNode puts into play the $3,638.25 LVNode. Initiative trade beyond the LVNode could reach as low as the $3,610.75 and $3,554.75 HVNode, or lower.

Click here to load today’s key levels into the web-based TradingView charting platform. Note that all levels are derived using the 65-minute timeframe. New links are produced, daily.
Graphic: 65-minute profile chart of the Micro E-mini S&P 500 Futures.

Definitions

Volume Areas: A structurally sound market will build on areas of high volume (HVNodes). Should the market trend for long periods of time, it will lack sound structure, identified as low volume areas (LVNodes). LVNodes denote directional conviction and ought to offer support on any test. 

If participants were to auction and find acceptance into areas of prior low volume (LVNodes), then future discovery ought to be volatile and quick as participants look to HVNodes for favorable entry or exit.

About

After years of self-education, strategy development, mentorship, and trial-and-error, Renato Leonard Capelj began trading full-time and founded Physik Invest to detail his methods, research, and performance in the markets.

Capelj also develops insights around impactful options market dynamics at SpotGamma and is a Benzinga reporter.

Some of his works include conversations with ARK Invest’s Catherine Wood, investors Kevin O’Leary and John Chambers, FTX’s Sam Bankman-Fried, ex-Bridgewater Associate Andy Constan, Kai Volatility’s Cem Karsan, The Ambrus Group’s Kris Sidial, among many others.

Disclaimer

In no way should the materials herein be construed as advice. Derivatives carry a substantial risk of loss. All content is for informational purposes only.

Categories
Commentary

Daily Brief For September 12, 2022

The daily brief is a free glimpse into the prevailing fundamental and technical drivers of U.S. equity market products. Join the 900+ that read this report daily, below!

Graphic updated 7:30 AM ET. Sentiment Risk-On if expected /ES open is above the prior day’s range. /ES levels are derived from the profile graphic at the bottom of the following section. Levels may have changed since initially quoted; click here for the latest levels. SqueezeMetrics Dark Pool Index (DIX) and Gamma (GEX) calculations are based on where the prior day’s reading falls with respect to the MAX and MIN of all occurrences available. A higher DIX is bullish. At the same time, the lower the GEX, the more (expected) volatility. Learn the implications of volatility, direction, and moneyness. Breadth reflects a reading of the prior day’s NYSE Advance/Decline indicator. VIX reflects a current reading of the CBOE Volatility Index (INDEX: VIX) from 0-100.

Administrative

Hey team, before we get started, let’s address the mismatch some observed last week with this letter’s levels and S&P quotes, versus what they saw at home. 

It is basically the case that our charting platform rolled over to the December S&P 500 Index futures contract on September 9, 2022. This was about 1-week ahead of the expiry of the old contract on September 16, 2022.

Going forward, unless otherwise noted, 6-days prior to the expiration of a quoted contract, the levels and prices in this letter may reflect that of the new, father-dated contract.

As an aside, based on CME Group Inc’s (NASDAQ: CME) Equity Quarterly Roll Analyzer Tool, the pace of the E-mini S&P 500 (FUTURE: /ES) roll is far off of what it has historically been at this stage of the roll period. 

This roll, too, caught your letter’s writer by surprise. Sorry!

Graphic: Retrieved from CME Group Inc (NASDAQ: CME).

Moving on, coverage this week may be sporadic due to some uncertain travel commitments. It is seeming very likely that there may not be a letter published on September 13 and 14, 2022.

Fundamental

Let’s get into it.

At its core, there’s a lot of stuff happening on the monetary and fiscal front. Guiding some of this action, on those fronts, are (geo)political happenings, the rising tide of populism, and beyond.

On the political fronts, Ukrainians “broke through weakened Russian lines, seizing the strategic railway hub of Kupiansk and the key staging area of Izyum,” Noah Smith explained in his letter.

Recent happenings illustrate “some important principles about the broader conflict unfolding across our world between liberalism and illiberalism,” as well as what a “successful defense of Ukraine” would do to hurt “the dawn of a new age of imperial expansionism,” something we’ve talked a lot about in past letters, alongside the growing deglobalization pulse.

The go-to on the implications of these conflicts, as well as the “burgeoning monetary order,” dubbed Bretton Woods III, has been Credit Suisse Group AG’s (NYSE: CS) Zoltan Pozsar who thinks the dollar “is entering a new and rockier phase” and what “matters more than access to dollars is access to commodities and actual things.”

From hereon, Pozsar thinks “commodity prices can go much higher, … and a dollar can get devalued in terms of commodities.”

In the face of geopolitical and supply chokepoints (further bolstered by such things as railroad strikes), as well as the fragmentation of “the physical world,” it’s no “longer appropriate to think about the world as a unified whole,” Pozsar explains.

Potentially at hand is a “self-reinforcing ‘dollar doom loop,’” Jon Turek of JST Advisors adds in the earlier quoted article. That’s big since, as we once explained, the dollar is the dominant currency for carry due to the easy monetary policies that removed the risk of a strong dollar. 

“Non-US entities make dollar-based loans and transactions … because it’s considered more trustworthy than native fiat,” Bankless explained. “When there’s a disruption in global cash flows, there’s effectively a short squeeze on the dollar.” 

Therefore, while efforts to stem inflation bolstered by supply chokepoints continue, “the stronger the dollar gets in comparison, the less tenable it becomes as a global reserve.”

That is pressure on the long-term trajectory of the dollar.

Ultimately, through the earlier mentioned developments, “breaking the dollar’s dominance could arguably help some countries avoid a tightening of financial conditions,” Bloomberg explains.

Accordingly, with “the dollar’s peak [] already in the rearview mirror,” concerns are amped in regard to how this impacts U.S. markets. It’s the case that U.S. market liquidity, as well as the dollar’s strong role as a reserve, put the S&P 500 at the center of the global carry regime. 

Thus, an unwinding of carry may compound a market drop affecting nearly all risk assets, even housing, and prompting recession, something we shall unpack further in coming letters.

Graphic: Retrieved from The Market Ear. Via Morgan Stanley (NYSE: MS). “MS Research thinks the lows for this bear market will likely arrive in the fourth quarter with 3,400 the minimum downside and 3,000 the low if a recession arrives.”

To round out this section, a bull case is likely characterized by less outsized interest rate hikes here, in the US, with quantitative tightening (QT) ramping “to its maximal caps” with no increase in “vol or yields,” said JPMorgan Chase & Co (NYSE: JPM) market intelligence.

Graphic: Retrieved from Bloomberg.

However, if inflation remains hot – 8% and 9% – and supply disruptions remain sticky, the Fed may continue on its path of higher for longer. That means an “outsized rate hike cadence in Nov/Dec, bringing Fed Funds above 4.0% … and QT put[ting] upward pressure on yields.”

Graphic: Retrieved from Callum Thomas. Via Bank of America Corporation (NYSE: BAC). Market bottoms often appear when the Federal Reserve (Fed) begins cutting interest rates.

Positioning

Demand for protection and re-entry into shorts was the context for selling that culminated in an S&P 500 (INDEX: SPX) low at $3,900.00 last week. 

It’s at this level, “where the demand for put options was concentrated,” analysis providers like SpotGamma saw “support” and, “absent an exogenous catalyst,” S&P 500 stability.

From thereon, into the end of the week, SpotGamma adds that “positive delta hedging flows” bolstered a “market move away from the $3,900.00 support.” Tools like SpotGamma’s HIRO showed volatility selling and this validated a SpotGamma call for “follow-on bullishness.”

Graphic: Retrieved from SpotGamma. Updated September 7, 2022.

Nonetheless, in light of the above fundamental and positioning contexts, after derivatives expiries this month, the stage is likely set for larger two-way ranges.

Technical

As of 7:20 AM ET, Monday’s regular session (9:30 AM – 4:00 PM ET), in the S&P 500, is likely to open in the upper part of a balanced overnight inventory, outside of prior-range and -value, suggesting a potential for immediate directional opportunity.

In the best case, the S&P 500 trades higher.

Any activity above the $4,107.00 POC puts into play the $4,136.75 MCPOC. Initiative trade beyond the MCPOC could reach as high as the $4,189.25 LVNode and $4,231.00 VPOC, or higher.

In the worst case, the S&P 500 trades lower.

Any activity below the $4,107.00 POC puts into play the $4,071.00 VPOC. Initiative trade beyond the VPOC could reach as low as the $4,018.75 HVNode and $3,991.00 VPOC, or lower.

Click here to load today’s key levels into the web-based TradingView charting platform. Note that all levels are derived using the 65-minute timeframe. New links are produced, daily.
Graphic: 65-minute profile chart of the Micro E-mini S&P 500 Futures.

Definitions

Volume Areas: A structurally sound market will build on areas of high volume (HVNodes). Should the market trend for long periods of time, it will lack sound structure, identified as low volume areas (LVNodes). LVNodes denote directional conviction and ought to offer support on any test. 

If participants were to auction and find acceptance into areas of prior low volume (LVNodes), then future discovery ought to be volatile and quick as participants look to HVNodes for favorable entry or exit.

POCs: POCs are valuable as they denote areas where two-sided trade was most prevalent in a prior day session. Participants will respond to future tests of value as they offer favorable entry and exit.

MCPOCs: POCs are valuable as they denote areas where two-sided trade was most prevalent over numerous day sessions. Participants will respond to future tests of value as they offer favorable entry and exit.

About

After years of self-education, strategy development, mentorship, and trial-and-error, Renato Leonard Capelj began trading full-time and founded Physik Invest to detail his methods, research, and performance in the markets.

Capelj also develops insights around impactful options market dynamics at SpotGamma and is a Benzinga reporter.

Some of his works include conversations with ARK Invest’s Catherine Wood, investors Kevin O’Leary and John Chambers, FTX’s Sam Bankman-Fried, ex-Bridgewater Associate Andy Constan, Kai Volatility’s Cem Karsan, The Ambrus Group’s Kris Sidial, among many others.

Disclaimer

In no way should the materials herein be construed as advice. Derivatives carry a substantial risk of loss. All content is for informational purposes only.

Categories
Commentary

Daily Brief For July 29, 2022

The daily brief is a free glimpse into the prevailing fundamental and technical drivers of U.S. equity market products. Join the 600+ that read this report daily, below!

Graphic updated 6:30 AM ET. Sentiment Neutral if expected /ES open is inside of the prior day’s range. /ES levels are derived from the profile graphic at the bottom of the following section. Levels may have changed since initially quoted; click here for the latest levels. SqueezeMetrics Dark Pool Index (DIX) and Gamma (GEX) calculations are based on where the prior day’s reading falls with respect to the MAX and MIN of all occurrences available. A higher DIX is bullish. At the same time, the lower the GEX, the more (expected) volatility. Learn the implications of volatility, direction, and moneyness. Breadth reflects a reading of the prior day’s NYSE Advance/Decline indicator. VIX reflects a current reading of the CBOE Volatility Index (INDEX: VIX) from 0-100.
Updates: Hey, team! I’m offering some updates on the letter and gauging your thoughts, if any.

Been incredibly busy juggling what is, basically, 3 jobs. Here’s a bit about me, if interested. That said, my attention has been elsewhere, to put it simply, so the letters have taken a bit of a hit. Sorry!

The few options I’ve been faced with include (1) lowering the frequency of letters to improve quality and/or (2) continuing pace but increasing simplicity for some time.

I’m aware that many rely on the key levels I provide, daily, as well as some of the narratives and trade ideas often included in the positioning section. Therefore, I’m soliciting feedback and will follow through with the consensus, if any. Have a great weekend!

Fundamental

The Fed’s preferred inflation measure – the personal consumption expenditure deflator (PCE) – is set to update. Per Bloomberg, this measure grew an annualized 7.1% for the second quarter. 

This is on the heels of the Federal Reserve’s (Fed) interest rate hike aimed at reining inflation, as well as data that suggests the “drumbeat of recession” growing louder.

Graphic: Retrieved from Bloomberg. “GDP fell at a 0.9% annualized rate after a 1.6% decline in the first three months of the year []. Personal consumption, the biggest part of the economy, rose at a 1% pace, a deceleration from the prior period.”

Yelena Shulyatyeva and Eliza Winger, economists cited by Bloomberg, comment that the fall in GDP growth “raises the risk that the economy will fall into recession by year-end.”

However, based on the research and expert commentary set forth in past letters, the case is the economy may already be in recession.

Notwithstanding, what’s the impact on equity markets (i.e., now earnings compression)?

It’s the consensus that equity markets endured one of the sharpest de-rates in three decades as participants priced the compression in multiples on the rise in interest rates and flow of capital to capital markets – the quantitative tightening (QT) – component.

For context, beyond raising costs to borrow and innovate, higher interest rates may mean future discounted valuations are lower. Additionally, yield-hungry investors may seek less risky assets, now, given that their yields are more attractive.

Recall that in engaging in practices such as quantitative easing (QE), central banking authorities purchase assets from private sector entities through the creation of central bank reserves. The unwind of this through the QT exercise removes reserves from balance sheets either through asset sales or non-reinvestment of the principal sum of maturing securities.

In less complex terms, the Fed’s purchase of assets depressed their yields forcing investors into risk. Liquidity withdrawal ought to have the opposite effect, amplifying the impact of rate hikes.

Adding, per Joseph Wang, who we’ve quoted in the past, with bank deposits expected to drain ~1T by year-end, the competition for cash forces investors to continue “lower[ing] their selling prices to compete for the cash they want.”

Accordingly, the “Fed will continue to hike interest rates until something breaks,” as explained by Andreas Steno Larsen. In ending forward guidance, “the Fed will rely even more on lagging indicators such as the unemployment rate and the monthly CPI report.”

Graphic: Retrieved from Andreas Steno Larsen. “Most leading indicators for inflation point (seriously) down, while early unemployment indicators are ticking up, but the Fed will not admit to it until risk assets have taken another beating.”

“Once unemployment starts increasing alongside weakening momentum in the inflation reports, it will likely be at least 3-6 months too late to pivot.”

The Eurodollar – which reflects the interest offered on U.S. dollar-denominated deposits at banks outside of the U.S. (i.e., participants’ outlook on interest rates) – curve is inverted and implies rate cuts ahead, “6-7 months from now.”

Given the above, portfolios can “stay away from highly speculative assets, own USD cash, and start allocating towards 5-10y+ government bonds,” as Alfonso Peccatiello explained well.

Context: A stronger dollar, on the tightening of liquidity and credit, as well as increased demand and competition for money, does more to pressure risk and, is an equity headwind. 

Additionally, per Morgan Stanley (NYSE: MS) research, "The simple math on S&P 500 earnings from currency is that for every percentage point increase on a year-on-year basis it’s [] a 0.5 hit to EPS growth.”

Positioning

For the past few sessions, we did much to unpack and understand some of the implications of participants’ market positioning.

In summation, own volatility where the market is likely to not expire. Sell it where the market is likely to expire. Just because implied (IVOL) volatility is at a high starting point does not mean it should be sold, blindly, particularly on the put side, below the market.

Read: Explanations and Applications – Moontower on Gamma.

Technical

As of 6:30 AM ET, Friday’s regular session (9:30 AM – 4:00 PM ET), in the S&P 500, is likely to open in the middle part of a balanced overnight inventory, inside of prior-range and -value, suggesting a limited potential for immediate directional opportunity.

In the best case, the S&P 500 trades higher.

Any activity above the $4,111.00 RTH High puts into play the $4,149.00 VPOC. Initiative trade beyond the $4,149.00 VPOC could reach as high as the $4,164.25 RTH High and $4,189.25 LVNode, or higher.

In the worst case, the S&P 500 trades lower.

Any activity below the $4,111.00 RTH High puts into play the $4,073.00 VPOC. Initiative trade beyond the VPOC could reach as low as the $4,041.25 and $4,015.75 HVNode, or lower.

Click here to load today’s key levels into the web-based TradingView charting platform. Note that all levels are derived using the 65-minute timeframe. New links are produced, daily.
Graphic: 65-minute profile chart of the Micro E-mini S&P 500 Futures.

Considerations: This week’s advance was strong, based on market internals. Given this information, the rally is to not be sold, blindly.

Graphic: Market Internals (Advance/Decline, Up-Volume/Down-Volume, Tick) as Peter Reznicek at ShadowTrader teaches. Though positive, readings were weak and supportive of responsive trade, similar to what market liquidity (via Bookmap) was showing.

Definitions

Volume Areas: A structurally sound market will build on areas of high volume (HVNodes). Should the market trend for long periods of time, it will lack sound structure, identified as low volume areas (LVNodes). LVNodes denote directional conviction and ought to offer support on any test. 

If participants were to auction and find acceptance into areas of prior low volume (LVNodes), then future discovery ought to be volatile and quick as participants look to HVNodes for favorable entry or exit.

POCs: POCs are valuable as they denote areas where two-sided trade was most prevalent in a prior day session. Participants will respond to future tests of value as they offer favorable entry and exit.

MCPOCs: POCs are valuable as they denote areas where two-sided trade was most prevalent over numerous day sessions. Participants will respond to future tests of value as they offer favorable entry and exit.

Volume-Weighted Average Prices (VWAPs): A metric highly regarded by chief investment officers, among other participants, for quality of trade. Additionally, liquidity algorithms are benchmarked and programmed to buy and sell around VWAPs.

About

After years of self-education, strategy development, mentorship, and trial-and-error, Renato Leonard Capelj began trading full-time and founded Physik Invest to detail his methods, research, and performance in the markets.

Capelj also develops insights around impactful options market dynamics at SpotGamma and is a Benzinga reporter.

Some of his works include conversations with ARK Invest’s Catherine Wood, investors Kevin O’Leary and John Chambers, FTX’s Sam Bankman-Fried, ex-Bridgewater Associate Andy Constan, Kai Volatility’s Cem Karsan, The Ambrus Group’s Kris Sidial, among many others. 

Disclaimer

In no way should the materials herein be construed as advice. Derivatives carry a substantial risk of loss. All content is for informational purposes only.

Categories
Commentary

Daily Brief For July 28, 2022

The daily brief is a free glimpse into the prevailing fundamental and technical drivers of U.S. equity market products. Join the 600+ that read this report daily, below!

Graphic updated 7:00 AM ET. Sentiment Neutral if expected /ES open is inside of the prior day’s range. /ES levels are derived from the profile graphic at the bottom of the following section. Levels may have changed since initially quoted; click here for the latest levels. SqueezeMetrics Dark Pool Index (DIX) and Gamma (GEX) calculations are based on where the prior day’s reading falls with respect to the MAX and MIN of all occurrences available. A higher DIX is bullish. At the same time, the lower the GEX, the more (expected) volatility. Learn the implications of volatility, direction, and moneyness. Breadth reflects a reading of the prior day’s NYSE Advance/Decline indicator. VIX reflects a current reading of the CBOE Volatility Index (INDEX: VIX) from 0-100.

Fundamental

Key, yesterday, was the Federal Reserve’s (Fed) move to rein inflation with another 75 basis point interest rate hike. This lifted the target for the federal funds rate to 2.25-2.5%.

Accordingly, with inflation (which is to be dampened) a negative for stocks, a primary driver behind this year’s de-rate, already, equity markets closed sharply higher.

Graphic: Via Schroders plc (OTC: SHNWF). Taken from the Weekly S&P 500 ChartStorm.

Despite room for higher rates, the Fed explained future decisions would “depend on the data,” and that, per Bloomberg, the economy is likely “to withstand rapid monetary tightening.”

Graphic: Retrieved from Bloomberg. Tighter liquidity and credit bolster demand for money as well as the deflation of risk assets. “There used to be too little demand. Now there’s too little supply. And in a world of too little supply, the country doing the most to generate demand, which is the US, is exporting its problem—its problem being inflation,” per Harvard’s Jason Furman.

Adding, participants are, now, pricing in the potential for a federal funds rate peak in the range of 3.25-3.50% early-to-mid 2023, down from 4.00-4.75% after the last rate hike took place.

Graphic: Via CME Group Inc’s (NASDAQ: CME) FedWatch Tool.

Strategists at the likes of Bank of America Corporation (NYSE: BAC) put forth that it is likely, given an economic slowing, that the Fed, indeed, cuts rates next year and ends quantitative tightening (QT).

“The Fed is likely to stop QT with rate cuts due to the contradictory signal it sends on monetary policy and to simplify policy communications; the Fed will likely not want to be easing with rate cuts but tightening with QT,” the bank’s strategists explained. 

An end to QT would cut the supply that the “Treasury needs to issue to cover Fed redemptions. It also means the Fed may conduct secondary purchases, further limiting the amount of supply the market needs to absorb.”

This is in comparison to the narrative we discussed earlier this week, put forth by Damped Spring Advisors’ Andy Constan.

With “most of [the Fed] balance sheet reduction to be run-off” – non-reinvestment of “proceeds from maturing assets they own” – coupled with the Treasury halving “coupon issuance that the market must absorb,” Constan explained, instead, that the “Fed is done for the summer.”

This is likely to “result in less surprise and falling asset volatility” as investors realize “they are now under-risked,” which may drive a “risk premium contraction” and demand for risk assets.

Positioning

As of 6:50 AM ET, Thursday’s expected volatility, via the Cboe Volatility Index (INDEX: VIX), sits at ~1.22%. Net gamma exposures increasing may promote tighter ranges.

It is often, just after an event, that market movement is the result of inventory rebalances. Per Kai Volatility’s Cem Karsan, the subsequent move is to be “tied to the incremental effects on liquidity (QE/QT).” 

Graphic: Retrieved from MarketWatch.

Rising rates and the withdrawal of liquidity, coupled with the impact of inflation and an economic slowing, could prompt continued pressure on equity markets.

Given the macro risk, and the poor performance of implied volatility (IVOL), relative to that which markets have realized (RVOL), per The Ambrus Group’s Kris Sidial, “if you wanted to go out and hedge, the opportunity is still there in the equity space.”

Graphic: Retrieved from Goldman Sachs Group Inc (NYSE: GS).

Should investors “ditch their [old] hedges in frustration as sentiment improves, because they didn’t work properly in a falling market,” this may set up “the potential for a second-leg-down event,” in the next year, as well explained in the Systemic Individual Investor.

“During the next sell-off, panic put-buying can cause a much more violent downward spiral, because options dealers are forced to sell an increasing amount of S&P futures into an accelerating down move.”

So, what to do? 

With call options outperforming “their delta to the upside,” it continues to make much sense to replace static equity long exposure with that which is dynamic, Karsan explained.

Technical

As of 6:50 AM ET, Thursday’s regular session (9:30 AM – 4:00 PM ET), in the S&P 500, is likely to open in the middle part of a negatively skewed overnight inventory, inside of prior-range and -value, suggesting a limited potential for immediate directional opportunity.

In the best case, the S&P 500 trades higher.

Any activity above the $4,015.75 HVNode puts into play the $4,041.25 HVNode. Initiative trade beyond the $4,041.25 HVNode could reach as high as the $4,071.50 BAL and $4,095.00 VPOC, or higher.

In the worst case, the S&P 500 trades lower.

Any activity below the $4,015.75 HVNode puts into play the $3,971.00 VPOC. Initiative trade beyond the VPOC could reach as low as the $3,943.25 HVNode and $3,921.00 VPOC, or lower.

Click here to load today’s key levels into the web-based TradingView charting platform. Note that all levels are derived using the 65-minute timeframe. New links are produced, daily.
Graphic: 65-minute profile chart of the Micro E-mini S&P 500 Futures.

Definitions

Volume Areas: A structurally sound market will build on areas of high volume (HVNodes). Should the market trend for long periods of time, it will lack sound structure, identified as low volume areas (LVNodes). LVNodes denote directional conviction and ought to offer support on any test. 

If participants were to auction and find acceptance into areas of prior low volume (LVNodes), then future discovery ought to be volatile and quick as participants look to HVNodes for favorable entry or exit.

POCs: POCs are valuable as they denote areas where two-sided trade was most prevalent in a prior day session. Participants will respond to future tests of value as they offer favorable entry and exit.

MCPOCs: POCs are valuable as they denote areas where two-sided trade was most prevalent over numerous day sessions. Participants will respond to future tests of value as they offer favorable entry and exit.

Volume-Weighted Average Prices (VWAPs): A metric highly regarded by chief investment officers, among other participants, for quality of trade. Additionally, liquidity algorithms are benchmarked and programmed to buy and sell around VWAPs.

About

After years of self-education, strategy development, mentorship, and trial-and-error, Renato Leonard Capelj began trading full-time and founded Physik Invest to detail his methods, research, and performance in the markets.

Capelj also develops insights around impactful options market dynamics at SpotGamma and is a Benzinga reporter.

Some of his works include conversations with ARK Invest’s Catherine Wood, investors Kevin O’Leary and John Chambers, FTX’s Sam Bankman-Fried, ex-Bridgewater Associate Andy Constan, Kai Volatility’s Cem Karsan, The Ambrus Group’s Kris Sidial, among many others.

Disclaimer

In no way should the materials herein be construed as advice. Derivatives carry a substantial risk of loss. All content is for informational purposes only.

Categories
Commentary

Daily Brief For July 20, 2022

The daily brief is a free glimpse into the prevailing fundamental and technical drivers of U.S. equity market products. Join the 300+ that read this report daily, below!

Graphic updated 7:00 AM ET. Sentiment Neutral if expected /ES open is inside of the prior day’s range. /ES levels are derived from the profile graphic at the bottom of the following section. Levels may have changed since initially quoted; click here for the latest levels. SqueezeMetrics Dark Pool Index (DIX) and Gamma (GEX) calculations are based on where the prior day’s reading falls with respect to the MAX and MIN of all occurrences available. A higher DIX is bullish. At the same time, the lower the GEX, the more (expected) volatility. Learn the implications of volatility, direction, and moneyness. Breadth reflects a reading of the prior day’s NYSE Advance/Decline indicator. VIX reflects a current reading of the CBOE Volatility Index (INDEX: VIX) from 0-100.

Fundamental

Thanks to all the subscribers who have signed up in the past few days. Not sure how you got here so thank you! Also, thanks to whoever may have shared the letter to make that happen!

From here, you can expect in-depth commentaries on aspects like fundamentals, technicals, and positioning. Insights are actionable as they help me protect and grow my own capital!

Without further delay, below is what you need to know for today!

In the news was Netflix Inc’s (NASDAQ: NFLX) post-earnings jump on better-than-expected subscriber loss numbers, the Russians and Europeans agreeing on gas pipelines, mortgage boycotts spreading across China, tight food supplies, gas prices falling to some of the lowest levels in months, and China warning against a Taiwan visit by the U.S.

View: Earnings calendar.

Further, after our July 19 remark on incredibly strong pessimism likely to serve as a contrarian signal, the equity indexes pushed higher, following through key multi-week resistance.

Key levels quoted held nearly to the tick. Now, both the Nasdaq 100 (INDEX: NDX) and S&P 500 (INDEX: SPX) are above their 20- and 50-day moving averages. The Russell 2000, a laggard, made it above the 200-day moving average.

Graphic: Retrieved from Bloomberg.

The speed and ferociousness of the rally have more to do with how participants were positioned – in light of what seemed to be a worsening fundamental situation – into the break of some very visual resistances, discussed in prior letters. Read the next section for more on the positioning.

Graphic: Retrieved from Bloomberg.

Cryptocurrencies, which were recipients of the same risk-on flows equities saw, too, went higher yesterday. Per CoinMetrics data, Bitcoin’s (CRYPTO: BTC) correlation to equities is positive.

Graphic: Retrieved from Bloomberg.

For context, asset volatility had fallen on participants’ extension of moneyness to nonmonetary assets, given easy monetary policies and an environment of ample debt and leverage. These policies made it easier to borrow and make longer-duration bets on ideas with lots of promise.

This had consequences on the real economy and asset prices, accordingly, which rose and kept deflationary pressures at bay. The distinction between economies and financial markets blurred.

When the reverse happens – tighter liquidity and credit – and volatility eventually rises, demand (and competition) for money (or cash) deflates assets (e.g., equities, crypto, and the like).

Graphic: Via Schroders plc (OTC: SHNWF). Taken from the Weekly S&P 500 ChartStorm.

With U.S. market liquidity, as well as the dollar’s role as a global reserve currency, putting U.S. markets and the S&P 500 at the center of the global carry regime, a U.S. stock market drop is a recession and the direct reflection of the unwinds of carry.

It is the manifestation of a deflationary shock, and today’s sentiment reflects this.

Graphic: Retrieved from Layoffs.fyi Tracker.

Ultimately, a deflationary pulse manifesting disinflation in consumer prices may prompt the Fed (Federal Reserve) to reverse on rates and quantitative tightening (QT), the (out)flow of capital from capital markets.

Graphic: Graphic: Via Bank of America Corporation (NYSE: BAC). Retrieved from Bloomberg. “The previous low on this measure came five months before the final market low, but again this could be taken as evidence that the market has already taken enough evasive action.”

Positioning

The continued sale of volatility (as long volatility trades have not panned out), particularly across shorter time horizons, left those, on the other side, warehousing long volatility (a sort-of naive thing to say bluntly as we’re discounting customer trades being paired off with each other).

Graphic: Retrieved from Goldman Sachs Group Inc (NYSE: GS).

Nonetheless, these liquidity providers’ positions, all else equal, will maintain or increase in value if underlying(s) realize volatility (especially that far in excess of implied). To (re)hedge, those on the other side will do less to add realized (RVOL) volatility and more to suppress implied (IVOL).

Graphic: Via Banco Santander SA (NYSE: SAN). Into strength (weakness), counterparties’ long call exposures will increase (decrease) in value. To re-hedge, counterparties will buy (sell) weakness (strength).

Moreover, with RVOL creeping (and exceeding, at times) the IVOL, short volatility structures, particularly if unhedged and across short time horizons, are not doing good. The unwinding of these structures can add fuel to the directional resolve (e.g., if the customer buys back a short call, the liquidity provider sells their long call and buys back their short equity to re-hedge).

Hence, options structures that we said may be good to take advantage of the “smiley” skew (e.g., zero- or low-cost call ratio spreads) are performing much better.

Graphic: Updated 7/18/2022. Via Charles Schwab Corporation-owned (NYSE: SCHW) TD Ameritrade’s Thinkorswim. Skew resembles more of a smile, rather than a smirk.

Technical

As of 6:45 AM ET, Wednesday’s regular session (9:30 AM – 4:00 PM ET), in the S&P 500, is likely to open in the middle part of a balanced overnight inventory, inside of prior-range and -value, suggesting a limited potential for immediate directional opportunity.

In the best case, the S&P 500 trades higher.

Any activity above the $3,943.25 HVNode puts into play the $3,982.75 LVNode. Initiative trade beyond the LVNode could reach as high as the $4,016.25 HVNode and $4,055.25 LVNode, or higher.

In the worst case, the S&P 500 trades lower.

Any activity below the $3,943.25 HVNode puts into play the $3,909.25 MCPOC. Initiative trade beyond the MCPOC could reach as low as the $3,867.25 LVNode and $3,829.75 MCPOC, or lower.

Click here to load today’s key levels into the web-based TradingView charting platform. Note that all levels are derived using the 65-minute timeframe. New links are produced, daily.
Graphic: 65-minute profile chart of the Micro E-mini S&P 500 Futures.

Considerations: Responsiveness near key-technical areas (that are discernable visually on a chart), suggests technically-driven traders with short time horizons are very active. 

Such traders often lack the wherewithal to defend retests and, additionally, the type of trade may be indicative of the other time frame participants waiting for more information to initiate trades.

Definitions

Volume Areas: A structurally sound market will build on areas of high volume (HVNodes). Should the market trend for long periods of time, it will lack sound structure, identified as low volume areas (LVNodes). LVNodes denote directional conviction and ought to offer support on any test. 

If participants were to auction and find acceptance into areas of prior low volume (LVNodes), then future discovery ought to be volatile and quick as participants look to HVNodes for favorable entry or exit.

POCs: POCs are valuable as they denote areas where two-sided trade was most prevalent in a prior day session. Participants will respond to future tests of value as they offer favorable entry and exit.

MCPOCs: POCs are valuable as they denote areas where two-sided trade was most prevalent over numerous day sessions. Participants will respond to future tests of value as they offer favorable entry and exit.

Volume-Weighted Average Prices (VWAPs): A metric highly regarded by chief investment officers, among other participants, for quality of trade. Additionally, liquidity algorithms are benchmarked and programmed to buy and sell around VWAPs.

About

After years of self-education, strategy development, mentorship, and trial-and-error, Renato Leonard Capelj began trading full-time and founded Physik Invest to detail his methods, research, and performance in the markets.

Capelj also develops insights around impactful options market dynamics at SpotGamma and is a Benzinga reporter.

Some of his works include conversations with ARK Invest’s Catherine Wood, investors Kevin O’Leary and John Chambers, FTX’s Sam Bankman-Fried, former Bridgewater Associate Andy Constan, Kai Volatility’s Cem Karsan, The Ambrus Group’s Kris Sidial, among many others.

Disclaimer

In no way should the materials herein be construed as advice. Derivatives carry a substantial risk of loss. All content is for informational purposes only.

Categories
Commentary

Daily Brief For July 18, 2022

The daily brief is a free glimpse into the prevailing fundamental and technical drivers of U.S. equity market products. Join the 300+ that read this report daily, below!

Graphic updated 6:30 AM ET. Sentiment Risk-On if expected /ES open is above the prior day’s range. /ES levels are derived from the profile graphic at the bottom of the following section. Levels may have changed since initially quoted; click here for the latest levels. SqueezeMetrics Dark Pool Index (DIX) and Gamma (GEX) calculations are based on where the prior day’s reading falls with respect to the MAX and MIN of all occurrences available. A higher DIX is bullish. At the same time, the lower the GEX, the more (expected) volatility. Learn the implications of volatility, direction, and moneyness. Breadth reflects a reading of the prior day’s NYSE Advance/Decline indicator. VIX reflects a current reading of the CBOE Volatility Index (INDEX: VIX) from 0-100.

Fundamental

Positivity across most products we monitor in this letter. This is alongside participants’ paring of bets on more aggressive Federal Reserve (Fed) action. It was just last week, right after the CPI dump, that participants were pricing a near-50% chance of a 100 basis point rate hike in July.

That is no longer the case. The odds are 60-40 in favor of a 50 to 75 basis point hike.

Graphic: Via CME Group Inc’s (NASDAQ: CME) FedWatch Tool.

A quick check of the Eurodollar (FUTURE: /GE) curve, a reflection of participants’ outlook on interest rates, we see a peak of the Fed-rate-hike cycle – the terminal rate – near DEC 2022.

Below, we see the overnight rate expected to peak near 3.915% by late 2022.

Graphic: Via Charles Schwab Corporation-owned (NYSE: SCHW) TD Ameritrade’s Thinkorswim.

For context, the price of /GE reflects the interest offered on U.S. dollar-denominated deposits at banks outside of the U.S. With that, they’re “expressed numerically using 100 minus the implied 3-month U.S. dollar LIBOR interest rate,” per Investopedia. This means that at current DEC 2022 prices (96.085), this reflects an implied interest rate settlement rate of 3.915%.

Read: The shift from the Eurodollar to SOFR is accelerating as “SOFR adoption cracked 50%.”

The U.S. Dollar (INDEX: DXY), though it is generally far stronger on pressures (e.g., recession, geopolitics) elsewhere, eased.

Read: Why the U.S. Dollar is booming and creating a possible doom loop and Sunak takes the lead in the voting for U.K. Prime Minister, as well as China weighs mortgage grace period to appease angry home buyers and the ECB case for a half-point rate hike just won’t go away.
Graphic: Via Bloomberg.

Further, it is policy adjustments that are inflicting damage on some inflated areas of the market like crypto and private equity.

Recall that prevailing monetary policies made it easier to borrow and make longer-duration bets on ideas with a lot of promise in the future. Central banks, too, underwrote losses of this regime and encouraged continued growth. This had consequences on the real economy and asset prices which rose and kept deflationary pressures at bay.

As well put forth in our May 18, 2022 commentary, the recent market rout is a recession and the direct reflection of the unwind of carry. Capital was “misallocated” and the Fed’s move to control price stability is “completely unreasonable” as they’re not in a position to do it “without bringing down the markets,” per Kai Volatility’s Cem Karsan.

Read: Kris Abdelmessih’s Moontower #148 on prevailing macroeconomic perspectives.

A prospective hit in demand is in the context of improvement among supply chains, as Citigroup Inc (NYSE: C) economists explain

Graphic: Via Bloomberg.

“The bad news is that this looks to be occurring on the back of a slowing in the global consumer’s demand for goods, especially discretionary goods, and thus may also signal rising recession risks.”

Graphic: Via Bloomberg. “Carmakers registered the fewest new vehicles in the European Union since 1996 as persistent supply chain snarls and record inflation afflict the industry. New-car sales in the EU and four other states tracked by the European Automobile Manufacturers’ Association fell 17% to 1.07 million last month, according to a statement. Volkswagen AG was the hardest-hit major carmaker, with registrations dropping 24% from a year ago.”

It is the case that as the “Fed is pursuing demand destruction through negative wealth effects,” it will, ultimately, pivot because “central banks can only deal with nominal [and] not real chokepoints,” according to Credit Suisse Group AG’s (NYSE: CS) Zoltan Pozsar.

Read: Despite stronger than expected retail sales, inflation adjustments point to a leveling-off.

The “risk of recession, whether it is real or merely implied by an inversion of the yield curve, won’t deter the Fed from hiking rates higher faster or from injecting more volatility to build up negative wealth effects.” 

“Rallies could beget more forceful pushback from the Fed – the new game.”

Watch: Quantitative Tightening is the direct flow of capital to capital markets.

Positioning

Please check out the Daily Brief for July 15, 2022. There we summarized, well, the implication of the macro landscape and options positioning.

The summary was that with commodities not offering protection, one has to be concerned if “the flock move[s],” per The Ambrus Group’s Kris Sidial and, ultimately, “if you wanted to go out and hedge, the opportunity is still there in the equity space.”

This is as markets are in a window of “non-strength,” says Karsan in the video below.

Technical

As of 6:30 AM ET, Monday’s regular session (9:30 AM – 4:00 PM ET), in the S&P 500, is likely to open in the upper part of a positively skewed overnight inventory, outside of prior-range and -value, suggesting a potential for immediate directional opportunity.

In the best case, the S&P 500 trades higher.

Any activity above the $3,909.25 MCPOC puts into play the $3,943.25 HVNode. Initiative trade beyond the HVNode could reach as high as the $3,982.75 LVNode and $4,016.25 HVNode, or higher.

In the worst case, the S&P 500 trades lower.

Any activity below the $3,909.25 MCPOC puts into play the $3,857.00 VPOC. Initiative trade beyond the VPOC could reach as low as the $3,829.75 MCPOC and $3,800.75 LVNode, or lower.

Click here to load today’s key levels into the web-based TradingView charting platform. Note that all levels are derived using the 65-minute timeframe. New links are produced, daily.
Graphic: 65-minute profile chart of the Micro E-mini S&P 500 Futures.

Considerations: Responsiveness near key-technical areas (that are discernable visually on a chart), suggests technically-driven traders with short time horizons are very active. 

Such traders often lack the wherewithal to defend retests and, additionally, the type of trade may be indicative of the other time frame participants waiting for more information to initiate trades.

Definitions

Volume Areas: A structurally sound market will build on areas of high volume (HVNodes). Should the market trend for long periods of time, it will lack sound structure, identified as low volume areas (LVNodes). LVNodes denote directional conviction and ought to offer support on any test. 

If participants were to auction and find acceptance into areas of prior low volume (LVNodes), then future discovery ought to be volatile and quick as participants look to HVNodes for favorable entry or exit.

POCs: POCs are valuable as they denote areas where two-sided trade was most prevalent in a prior day session. Participants will respond to future tests of value as they offer favorable entry and exit.

MCPOCs: POCs are valuable as they denote areas where two-sided trade was most prevalent over numerous day sessions. Participants will respond to future tests of value as they offer favorable entry and exit.

Volume-Weighted Average Prices (VWAPs): A metric highly regarded by chief investment officers, among other participants, for quality of trade. Additionally, liquidity algorithms are benchmarked and programmed to buy and sell around VWAPs.

About

After years of self-education, strategy development, mentorship, and trial-and-error, Renato Leonard Capelj began trading full-time and founded Physik Invest to detail his methods, research, and performance in the markets.

Capelj also develops insights around impactful options market dynamics at SpotGamma and is a Benzinga reporter.

Some of his works include conversations with ARK Invest’s Catherine Wood, investors Kevin O’Leary and John Chambers, FTX’s Sam Bankman-Fried, former Bridgewater Associate Andy Constan, Kai Volatility’s Cem Karsan, The Ambrus Group’s Kris Sidial, among many others.

Disclaimer

In no way should the materials herein be construed as advice. Derivatives carry a substantial risk of loss. All content is for informational purposes only.

Categories
Commentary

Daily Brief For July 14, 2022

The daily brief is a free glimpse into the prevailing fundamental and technical drivers of U.S. equity market products. Join the 300+ that read this report daily, below!

Graphic updated 6:50 AM ET. Sentiment Risk-Off if expected /ES open is below the prior day’s range. /ES levels are derived from the profile graphic at the bottom of the following section. Levels may have changed since initially quoted; click here for the latest levels. SqueezeMetrics Dark Pool Index (DIX) and Gamma (GEX) calculations are based on where the prior day’s reading falls with respect to the MAX and MIN of all occurrences available. A higher DIX is bullish. At the same time, the lower the GEX, the more (expected) volatility. Learn the implications of volatility, direction, and moneyness. Breadth reflects a reading of the prior day’s NYSE Advance/Decline indicator. VIX reflects a current reading of the CBOE Volatility Index (INDEX: VIX) from 0-100.

Fundamental

Adding fuel to the fire – dollar strength, crypto bankruptcies, China contagion fears – was a hot consumer price index (CPI) report released Wednesday.

Expected was an 8.8% rise year-over-year (YoY) and 1.1% month-over-month (MoM). Core CPI (which excludes food and energy) was to rise by 5.7% YoY and 0.5% MoM, respectively.

Officially, the headline number rose to 9.1%. The core CPI rose 5.9% YoY and 0.7% MoM, meaning a peak was established in March (6.5% YoY, then).

“Though CPI’s spike is led by energy and food prices, which are largely global problems, prices continue to mount for domestic goods and services, from shelter to autos to apparel,” says Robert Frick of the Navy Federal Credit Union. 

Graphic: Via Bloomberg.

Accordingly, expectations regarding the Federal Reserve’s (Fed) response to hot inflation prints have changed. Participants now are pricing an increased potential for a 100 basis point hike in interest rates, something the Bank of Canada implemented, yesterday.

Graphic: Via Bloomberg

This is a negative for stocks, at the surface. High inflation, and the response to it, tends to hurt multiples (which has been the principal driver of this year’s de-rate, already).

Graphic: Via Schroders plc (OTC: SHNWF). Taken from the Weekly S&P 500 ChartStorm.

The market expects a Fed Funds peak below 4%, followed by aggressive easing. This is as the Fed’s Beige Book showed signs that inflation is (or soon will be) peaking, amid slowing demand and recession worries.

Graphic: Via Bloomberg.

Positioning

Little change in the dynamics talked about in past letters. Therefore, we continue rolling forward our positioning narratives.

Post-CPI, the market moved lower, first, and higher, later. This was, in part, the result of dealer inventory rebalancing, as Kai Volatility’s Cem Karsan has explained well many times before.

The subsequent move is likely to be “tied to the incremental effects on liquidity (QE/QT).”

Rising inflation probably bolsters the Fed’s backing of a 75 to 100 basis point rate hike. So, don’t fight the Fed. Rising rates and the withdrawal of liquidity, coupled with the impact of inflation and an economic slowing, may prompt continued pressure on equity markets.

Check out The Ambrus Group’s Kris Sidial speak on implied volatility (IVOL) suppression and the implications of a dash for cash (investor exit) and reach for protection.

Technical

As of 6:45 AM ET, Thursday’s regular session (9:30 AM – 4:00 PM ET), in the S&P 500, is likely to open in the lower part of a negatively skewed overnight inventory, just beyond prior-range and -value, suggesting a potential for immediate directional opportunity.

In the best case, the S&P 500 trades higher.

Any activity above the $3,755.00 VPOC puts into play the $3,774.75 HVNode. Initiative trade beyond the HVNode could reach as high as the $3,807.00 VPOC and $3,830.75 MCPOC, or higher.

In the worst case, the S&P 500 trades lower.

Any activity below the $3,755.00 VPOC puts into play the $3,715.75 LVNode. Initiative trade beyond the LVNode could reach as low as the $3,688.75 HVNode and $3,639.00 RTH Low, or lower.

Click here to load today’s key levels into the web-based TradingView charting platform. Note that all levels are derived using the 65-minute timeframe. New links are produced, daily.
Graphic: 65-minute profile chart of the Micro E-mini S&P 500 Futures.

Considerations: Responsiveness near key-technical areas (that are discernable visually on a chart), suggests technically-driven traders with short time horizons are very active. 

Such traders often lack the wherewithal to defend retests and, additionally, the type of trade may be indicative of the other time frame participants waiting for more information to initiate trades.

Definitions

Volume Areas: A structurally sound market will build on areas of high volume (HVNodes). Should the market trend for long periods of time, it will lack sound structure, identified as low volume areas (LVNodes). LVNodes denote directional conviction and ought to offer support on any test. 

If participants were to auction and find acceptance into areas of prior low volume (LVNodes), then future discovery ought to be volatile and quick as participants look to HVNodes for favorable entry or exit.

POCs: POCs are valuable as they denote areas where two-sided trade was most prevalent in a prior day session. Participants will respond to future tests of value as they offer favorable entry and exit.

MCPOCs: POCs are valuable as they denote areas where two-sided trade was most prevalent over numerous day sessions. Participants will respond to future tests of value as they offer favorable entry and exit.

Volume-Weighted Average Prices (VWAPs): A metric highly regarded by chief investment officers, among other participants, for quality of trade. Additionally, liquidity algorithms are benchmarked and programmed to buy and sell around VWAPs.

About

After years of self-education, strategy development, mentorship, and trial-and-error, Renato Leonard Capelj began trading full-time and founded Physik Invest to detail his methods, research, and performance in the markets.

Capelj also develops insights around impactful options market dynamics at SpotGamma and is a Benzinga reporter.

Some of his works include conversations with ARK Invest’s Catherine Wood, investors Kevin O’Leary and John Chambers, FTX’s Sam Bankman-Fried, former Bridgewater Associate Andy Constan, Kai Volatility’s Cem Karsan, The Ambrus Group’s Kris Sidial, among many others.

Disclaimer

In no way should the materials herein be construed as advice. Derivatives carry a substantial risk of loss. All content is for informational purposes only.