
The daily brief is a free glimpse into the prevailing fundamental and technical drivers of U.S. equity market products. Join the 300+ that read this report daily, below!
Fundamental
A light few letters after what it seems were like weeks of heavy content to discuss.
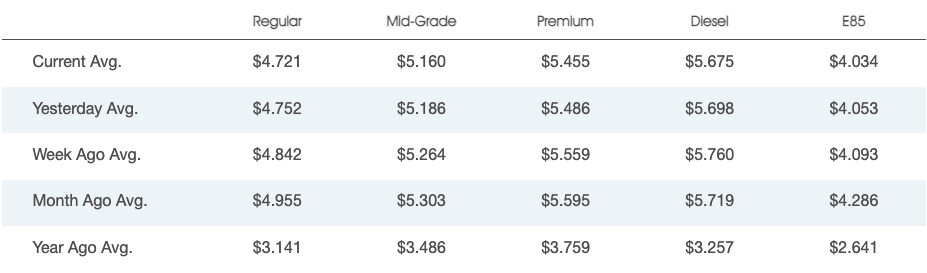
Further, prices at the pump are falling on an “unseasonal” drop in consumption, all the while the biggest bulls have tempered their outlooks on the market citing inflation and the implications of geopolitical tensions.
An overseas slowdown affecting China likely solicits stimulus. Reported was China’s Ministry of Finance considering the sale of special bonds with proceeds used to pay for infrastructure and boost a slowed economy increasingly in the clear from Covid.
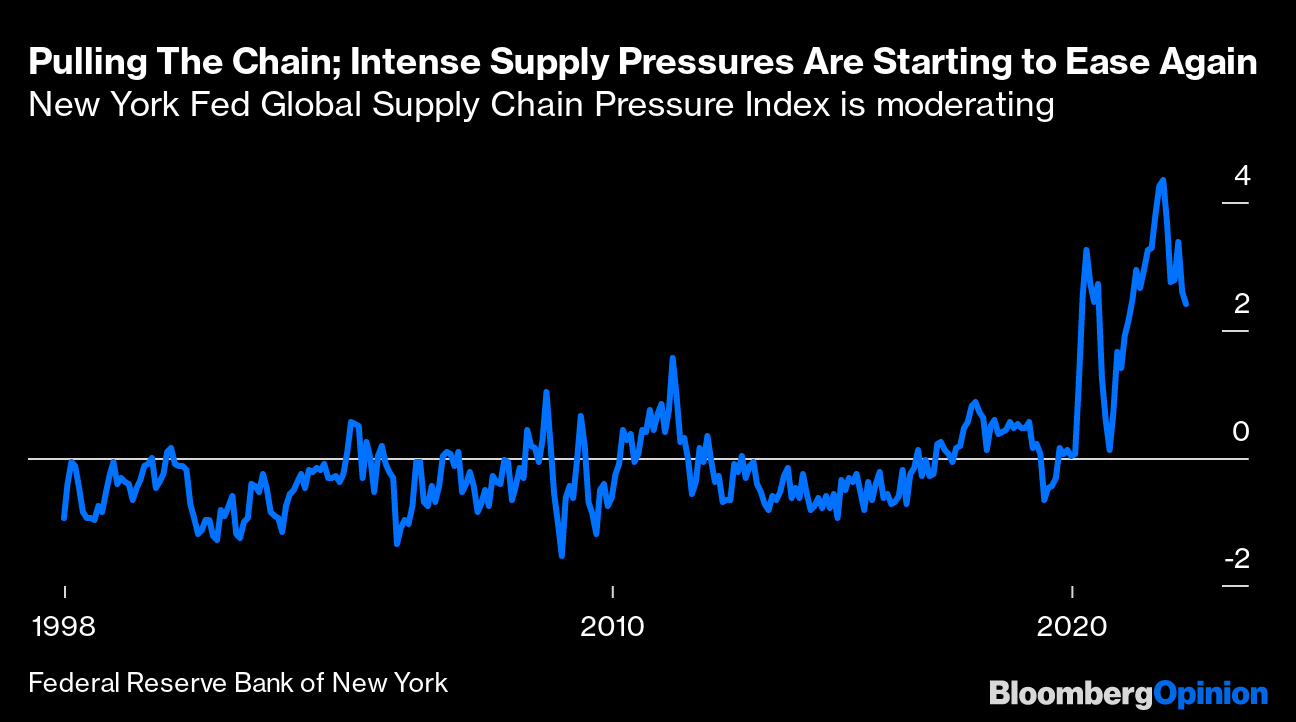
Moreover, as talked about yesterday, inflation may have peaked. Inventories are pointing to a looming supply gut.
Accordingly, the Federal Reserve (Fed), just as it was slow to end stimulus late last year and early this year, maybe slow in moderating its efforts to de-stimulate.
Minutes from the last Federal Open Market Committee (FOMC) meeting revealed a rate hike up to 75 basis points in July would be appropriate, per Moody’s Corporation (NYSE: MCO).
A strong jobs report would likely prompt the Fed “to raise rates even more aggressively as they pursue their goal to raise the unemployment rate,” explains Bryce Doty of Sit Fixed Income.
“As [the Fed] seek[s] to destroy demand, they are also destroying supply. As a result, inflation will persist longer and the economy will be even worse.”
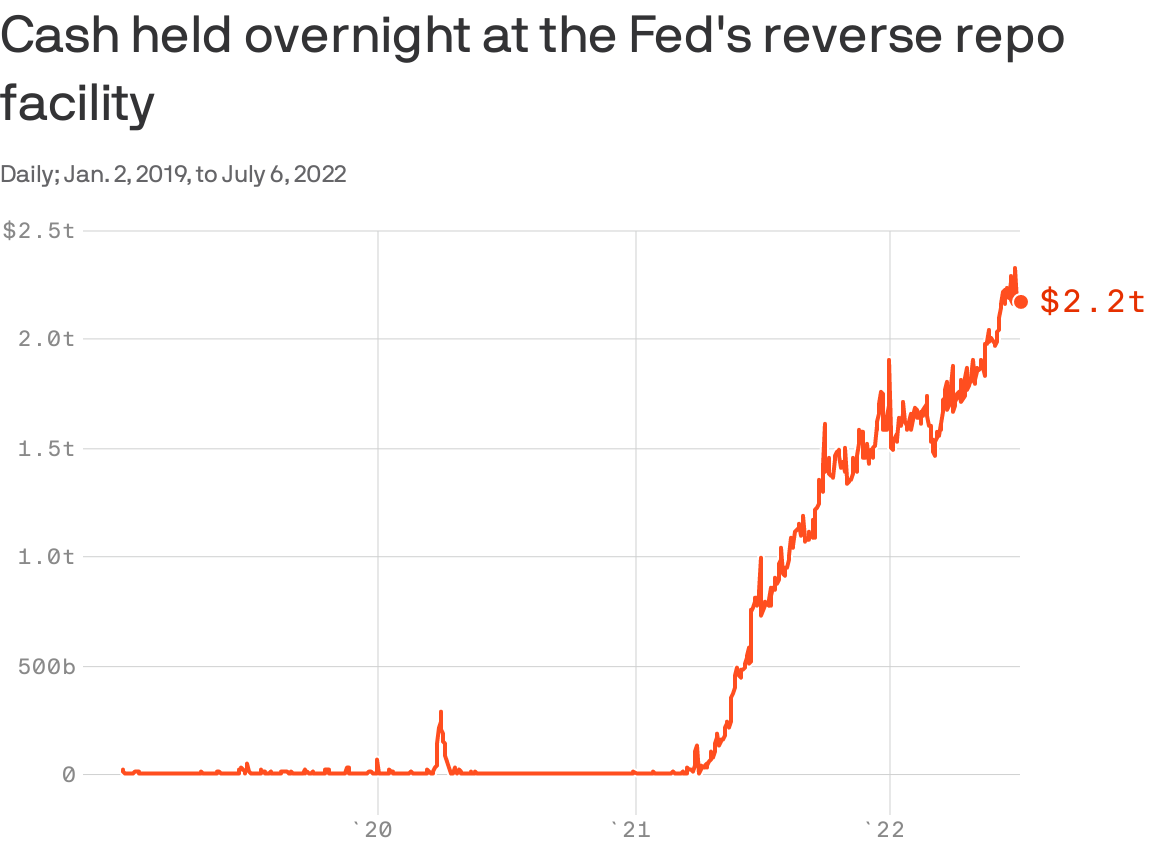
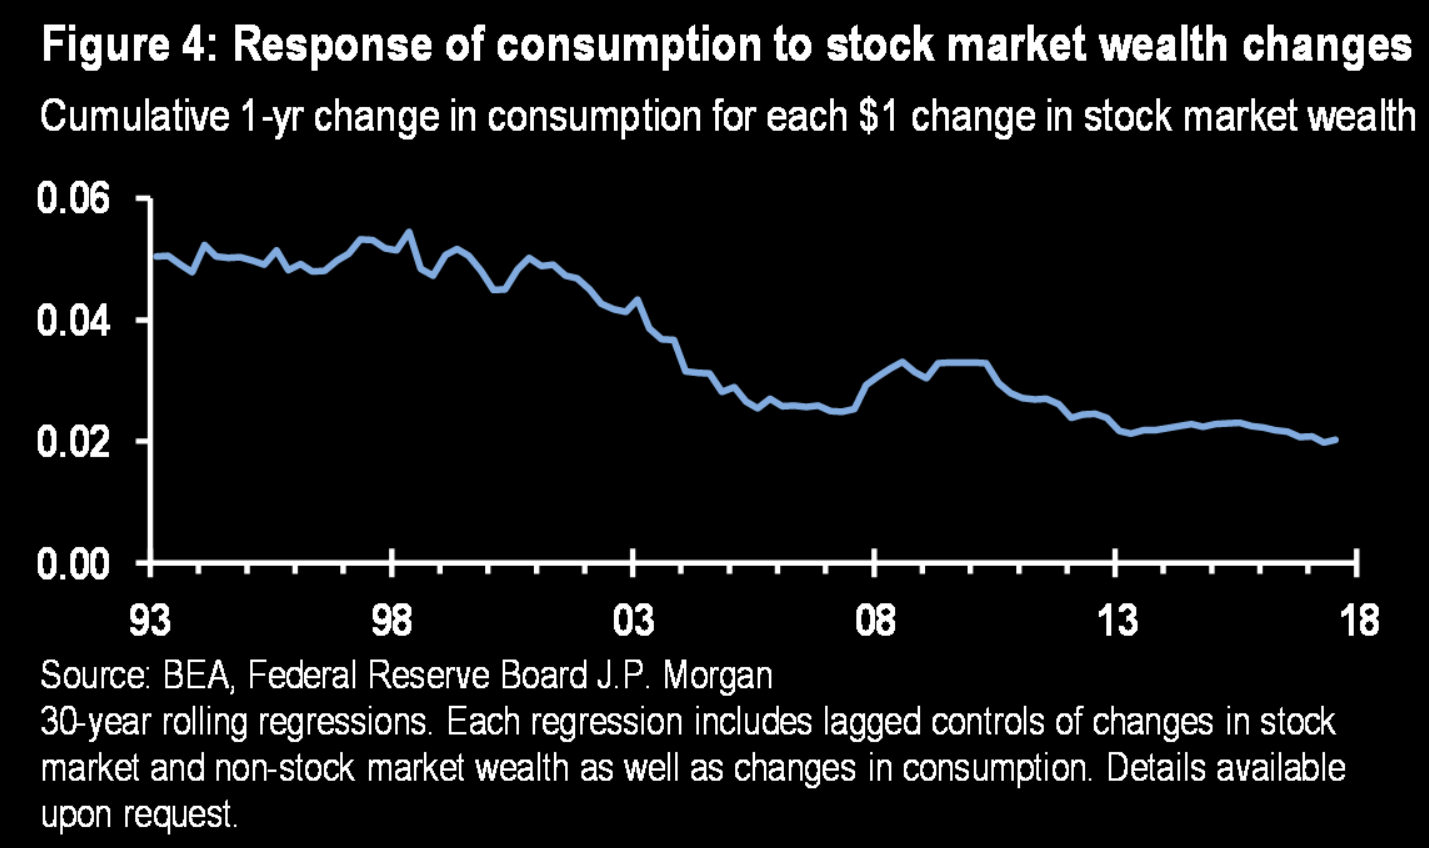
This is pursuant to calls by the Credit Suisse Group AG’s (NYSE: CS) Zoltan Pozsar who put forth, earlier this year, that the “Fed is pursuing demand destruction through negative wealth effects,” as the “central banks can only deal with nominal [and] not real chokepoints.”
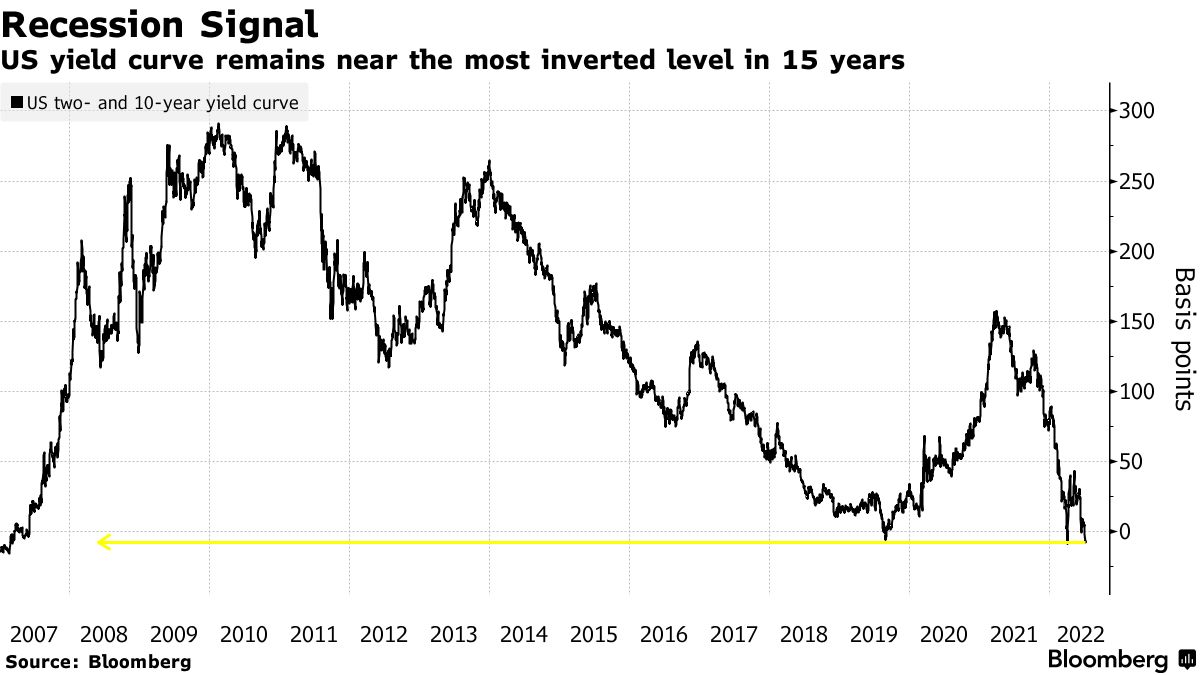
Ultimately, the “risk of recession, whether it is real or merely implied by an inversion of the yield curve, won’t deter the Fed from hiking rates higher faster or from injecting more volatility to build up negative wealth effects.”
“Rallies could beget more forceful pushback from the Fed – the new game.”
Positioning
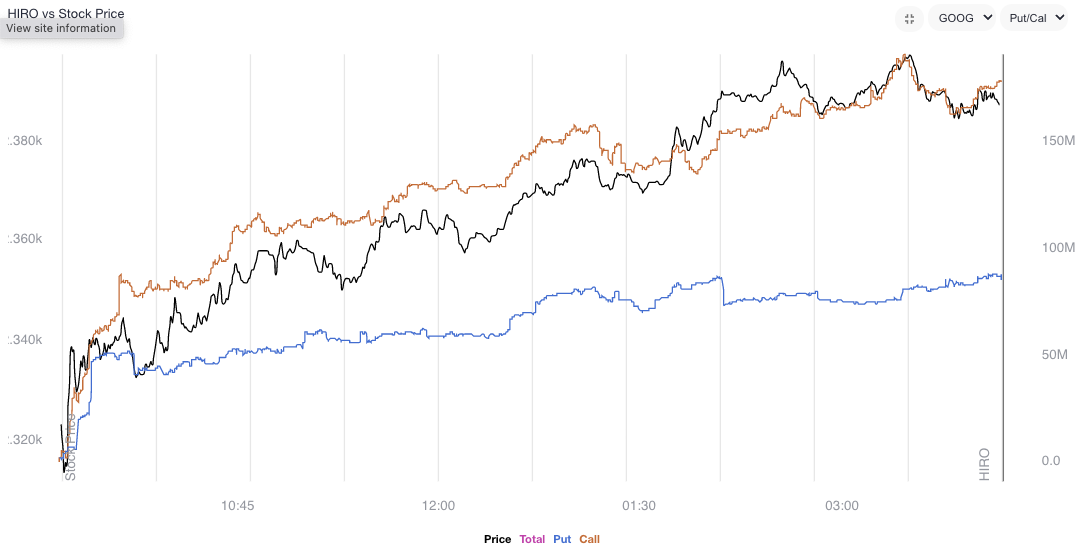
Data shows net gamma exposure increasing which may increasingly feed into smaller ranges and a positive drift amid shorter-dated volatility sales and a pick up in call demand, particularly in some of the larger index weights.
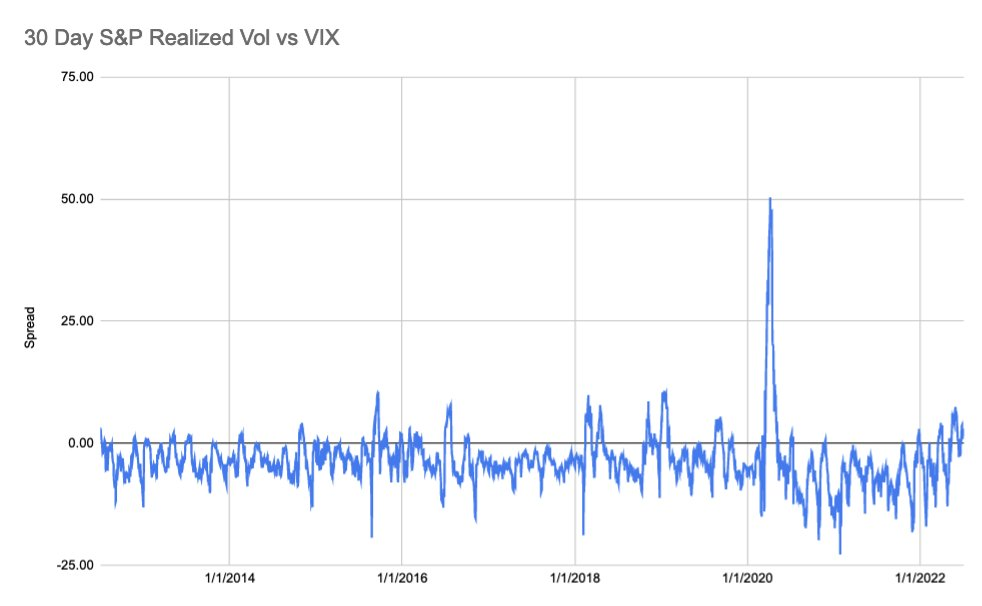
The creep in volatility realized (RVOL), versus that which is implied (IVOL), coupled with “a flattening in the downside fixed strike skew, while the upside wings [are] more smiley,” per JPMorgan Chase & Co (NYSE: JPM), makes it so we can put on more complex structures.
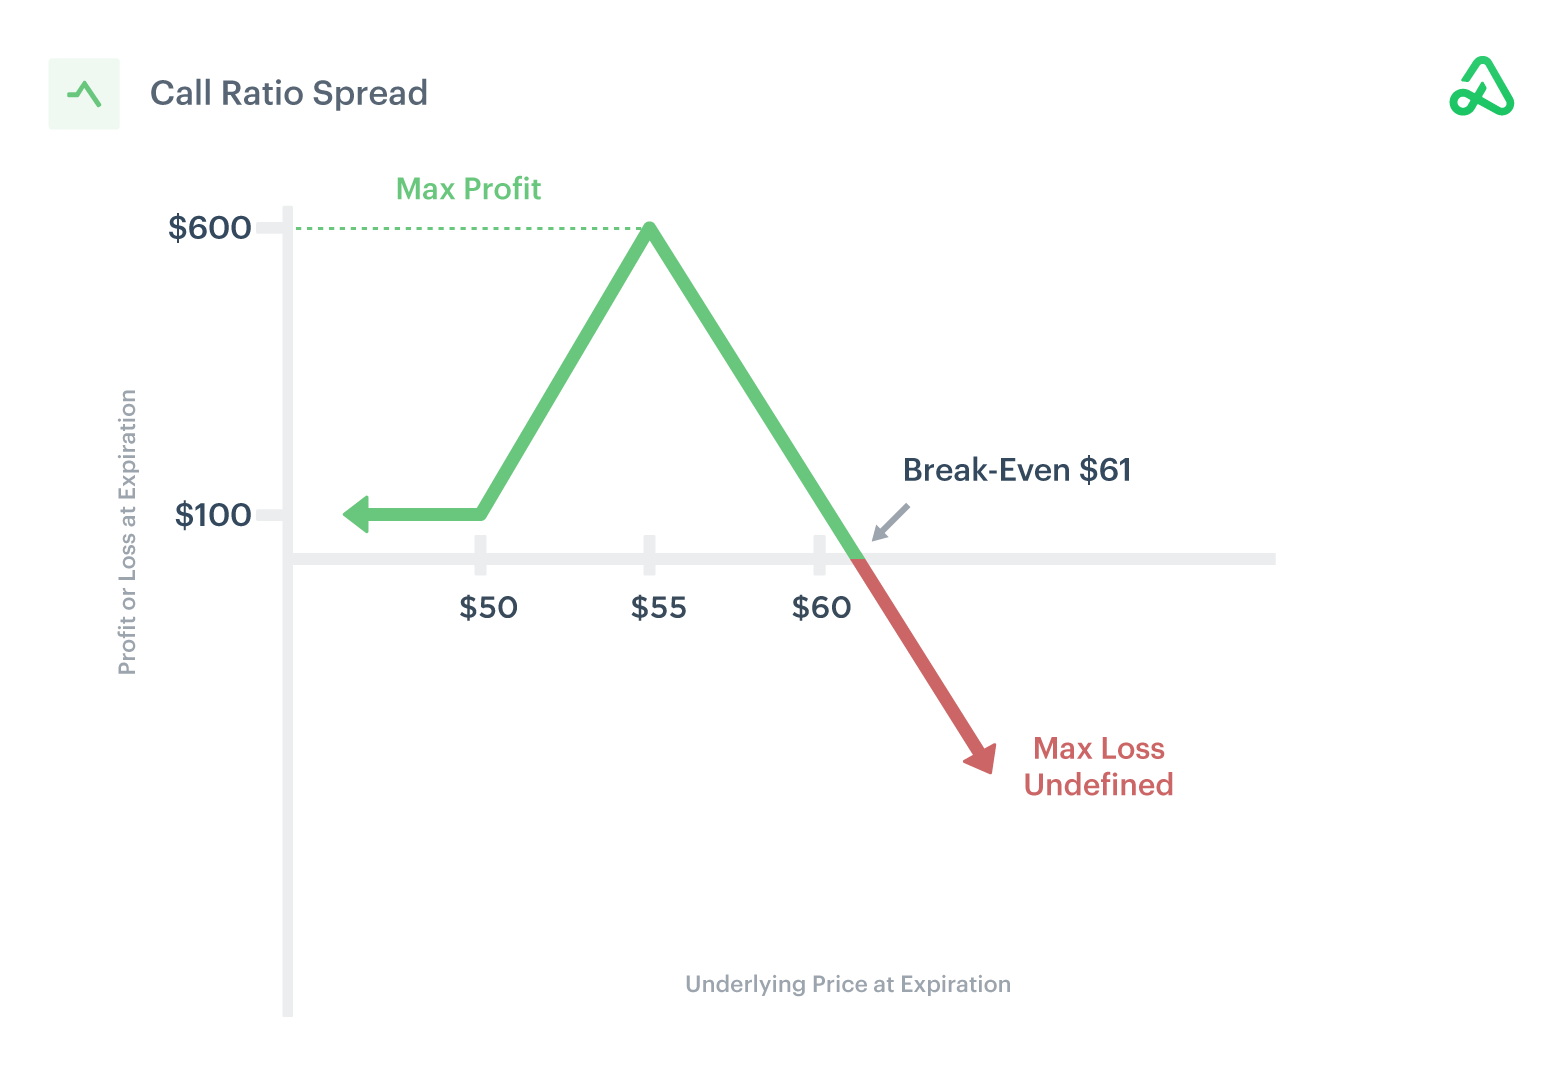
For instance, ratio spreads continue to work well for low- or no-cost exposure to the upside.
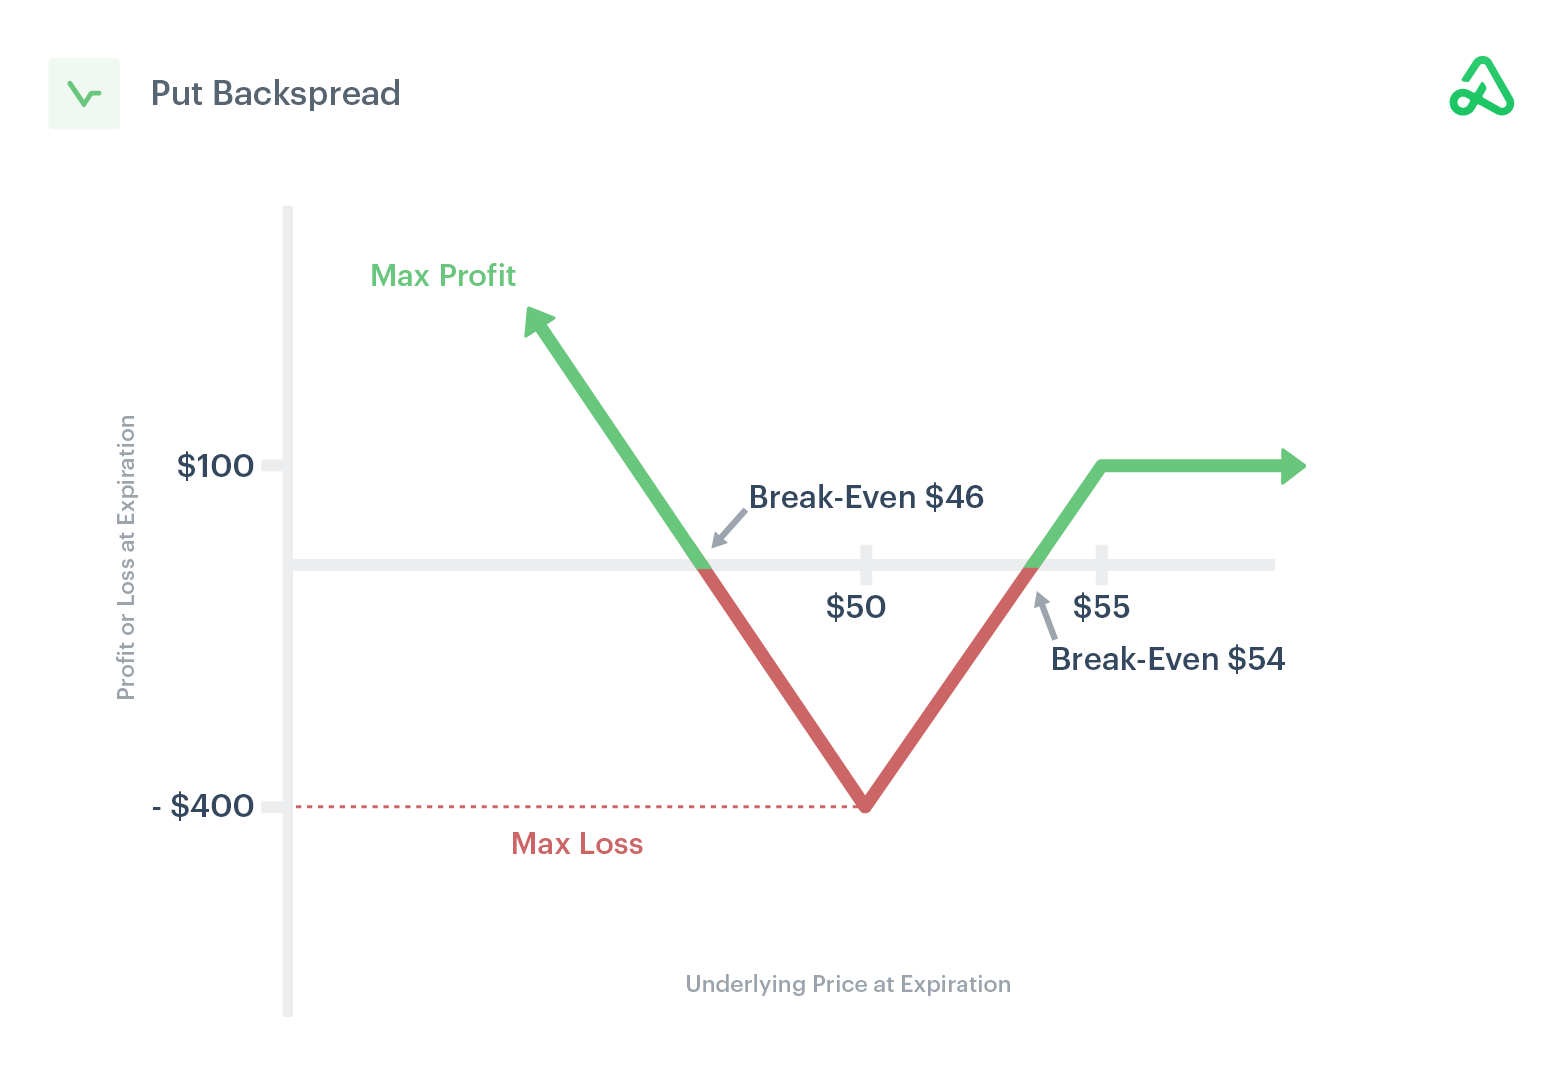
Likewise, if one thought volatility, though at a high starting point particularly at the money (ATM), was due for a repricing, they would look for exposure to the downside via something such as an inverse ratio (or backspread).
This is as the ATMs, unlike those further out of the money (OTM), are less convex in vega.
Technical
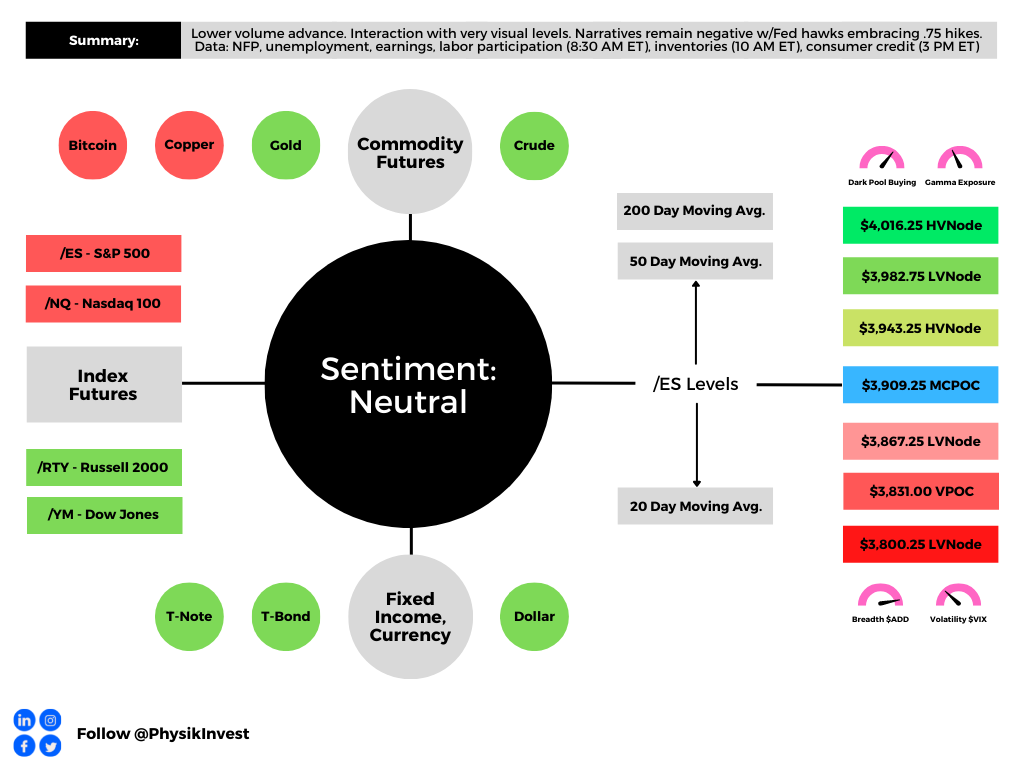
As of 6:30 AM ET, Friday’s regular session (9:30 AM – 4:00 PM ET), in the S&P 500, is likely to open in the upper part of a negatively skewed overnight inventory, inside of prior-range and -value, suggesting a limited potential for immediate directional opportunity.
In the best case, the S&P 500 trades higher.
Any activity above the $3,909.25 MCPOC puts into play the $3,943.25 HVNode. Initiative trade beyond the HVNode could reach as high as the $3,982.75 LVNode and $4,016.25 HVNode, or higher.
In the worst case, the S&P 500 trades lower.
Any activity below the $3,909.25 MCPOC puts into play the $3,867.25 LVNode. Initiative trade beyond the LVNode could reach as low as the $3,831.00 VPOC and $3,800.25 LVNode, or lower.
Click here to load today’s key levels into the web-based TradingView charting platform. Note that all levels are derived using the 65-minute timeframe. New links are produced, daily.

Considerations: Responsiveness near key-technical areas (that are discernable visually on a chart), suggests technically-driven traders with short time horizons are very active.
Such traders often lack the wherewithal to defend retests and, additionally, the type of trade may be indicative of the other time frame participants waiting for more information to initiate trades.
Definitions
Volume Areas: A structurally sound market will build on areas of high volume (HVNodes). Should the market trend for long periods of time, it will lack sound structure, identified as low volume areas (LVNodes). LVNodes denote directional conviction and ought to offer support on any test.
If participants were to auction and find acceptance into areas of prior low volume (LVNodes), then future discovery ought to be volatile and quick as participants look to HVNodes for favorable entry or exit.
POCs: POCs are valuable as they denote areas where two-sided trade was most prevalent in a prior day session. Participants will respond to future tests of value as they offer favorable entry and exit.
MCPOCs: POCs are valuable as they denote areas where two-sided trade was most prevalent over numerous day sessions. Participants will respond to future tests of value as they offer favorable entry and exit.
Volume-Weighted Average Prices (VWAPs): A metric highly regarded by chief investment officers, among other participants, for quality of trade. Additionally, liquidity algorithms are benchmarked and programmed to buy and sell around VWAPs.
About
After years of self-education, strategy development, mentorship, and trial-and-error, Renato Leonard Capelj began trading full-time and founded Physik Invest to detail his methods, research, and performance in the markets.
Capelj also develops insights around impactful options market dynamics at SpotGamma and is a Benzinga reporter.
Some of his works include conversations with ARK Invest’s Catherine Wood, investors Kevin O’Leary and John Chambers, FTX’s Sam Bankman-Fried, former Bridgewater Associate Andy Constan, Kai Volatility’s Cem Karsan, The Ambrus Group’s Kris Sidial, among many others.
Disclaimer
In no way should the materials herein be construed as advice. Derivatives carry a substantial risk of loss. All content is for informational purposes only.


