Leading up to the recent decline, market breadth (measuring how many stocks participate in a market move) had weakened. While a handful of dominant stocks masked the weakness, the underlying market was thinning out. Such dispersion [1] [2] [3], where some stocks surge while others lag, can create an illusion of stability in some market environments.
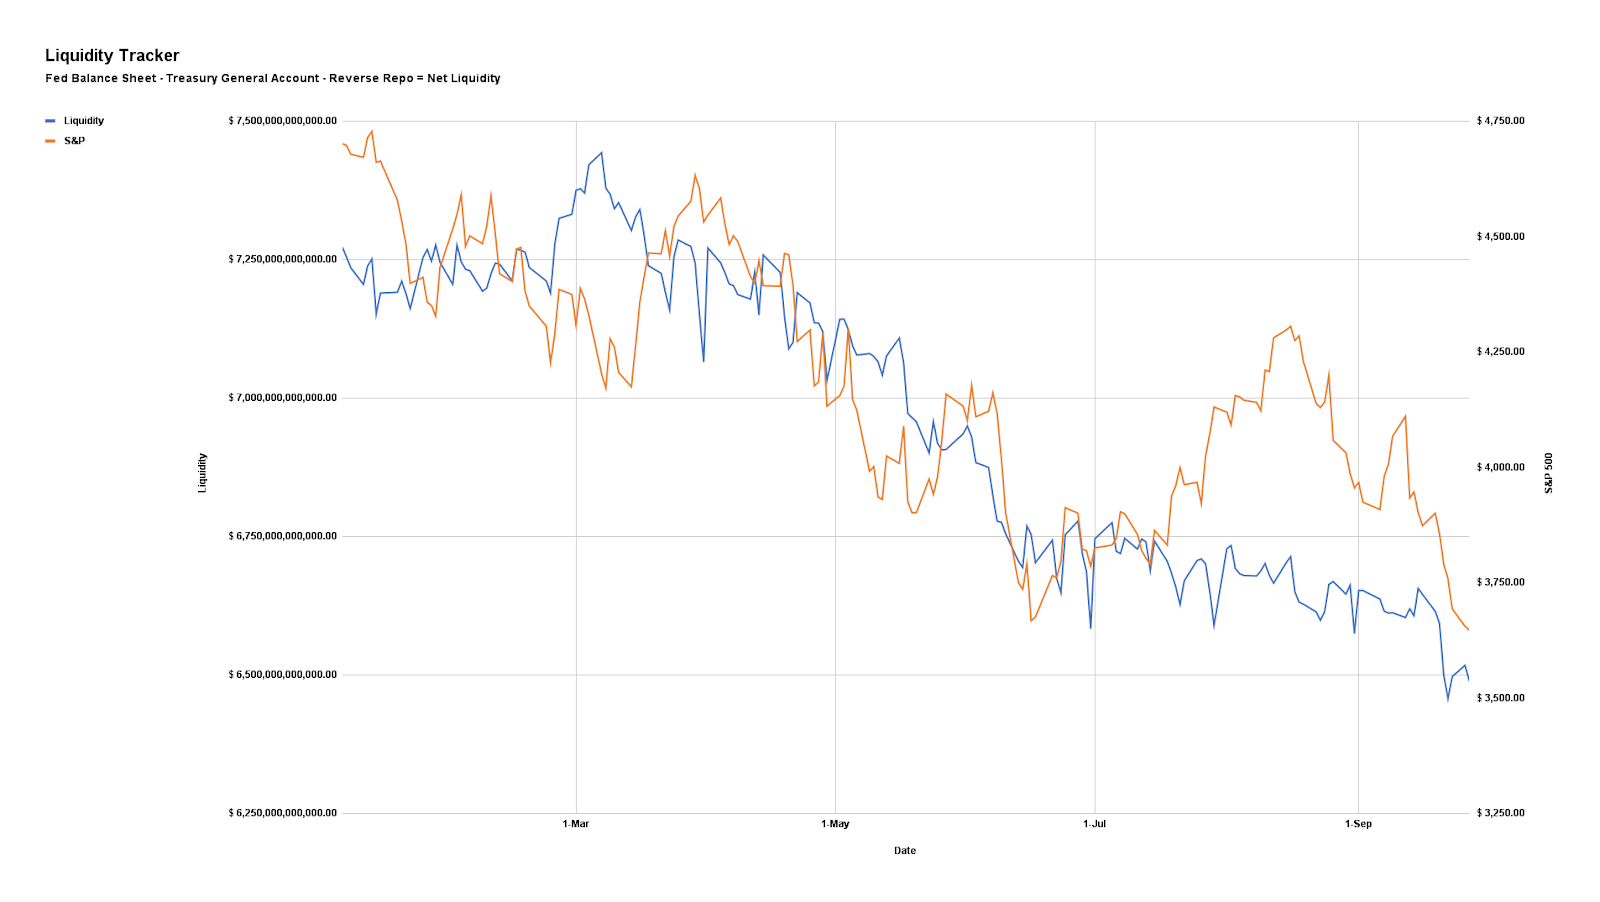
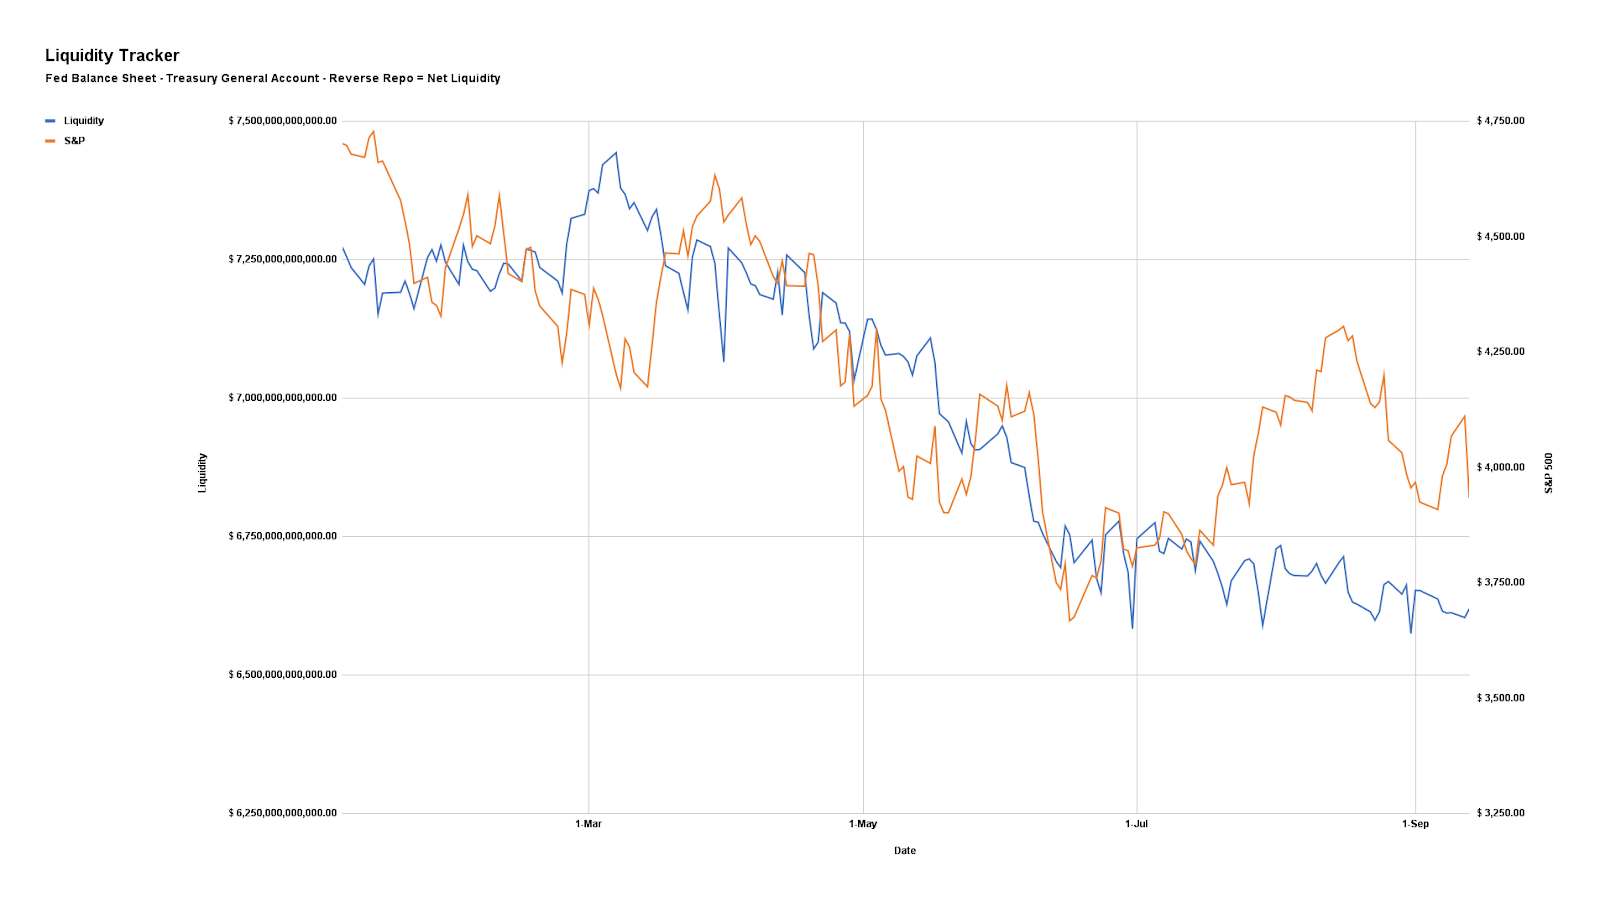
At the same time, liquidity—cash and credit availability—steadily drained from the system. Mechanisms like the reverse repo facility (where banks park excess cash with the Federal Reserve), the Treasury General Account (the government’s cash balance), and money market flows help offset [1] shortfalls. However, this time, they offered little cushion.
New policies—such as tariffs and trade restrictions—reinforce market trends and drive investors toward safer assets like bonds. There is a growing preference for lower bond yields over short-term stock market gains.
While the Federal Reserve controls short-term interest rates, long-term rates are more influenced by broader factors such as inflation expectations, economic growth, and investor sentiment.
Although lower long-term rates can support risk assets, their more immediate and significant impact is on the broader economy. Lowering them reduces borrowing costs for homeowners and businesses, encouraging investment and consumption. Additionally, lowering these yields helps with servicing government debt burdens and improving fiscal stability.
The shifts are intentional. Policymakers are transitioning the economy from dependence on government stimulus, but this adjustment comes with growing pains. Policy narratives and actions may weaken markets and slow economic activity in the short term. One reason receiving attention is the wealth effect—wealthier households, who drive a significant share of consumer spending, tend to spend more when stocks rise. Conversely, market drops can curb this effect and feed an economic slowdown.
Graphic: Retrieved from Bloomberg via @amitisinvesting.
Positioning Context: Setting Up For A Rip
History doesn’t repeat, but it often rhymes. Today’s setup echoes late summer 2024, albeit without the sharp volatility repricing. The difference? This time, investors were prepared, with hedges to act as insurance against market turmoil. The selling has been orderly, creating an illusion of stability and sustaining optimism.
Graphic: Retrieved from JPMorgan Chase via @Marlin_Capital.
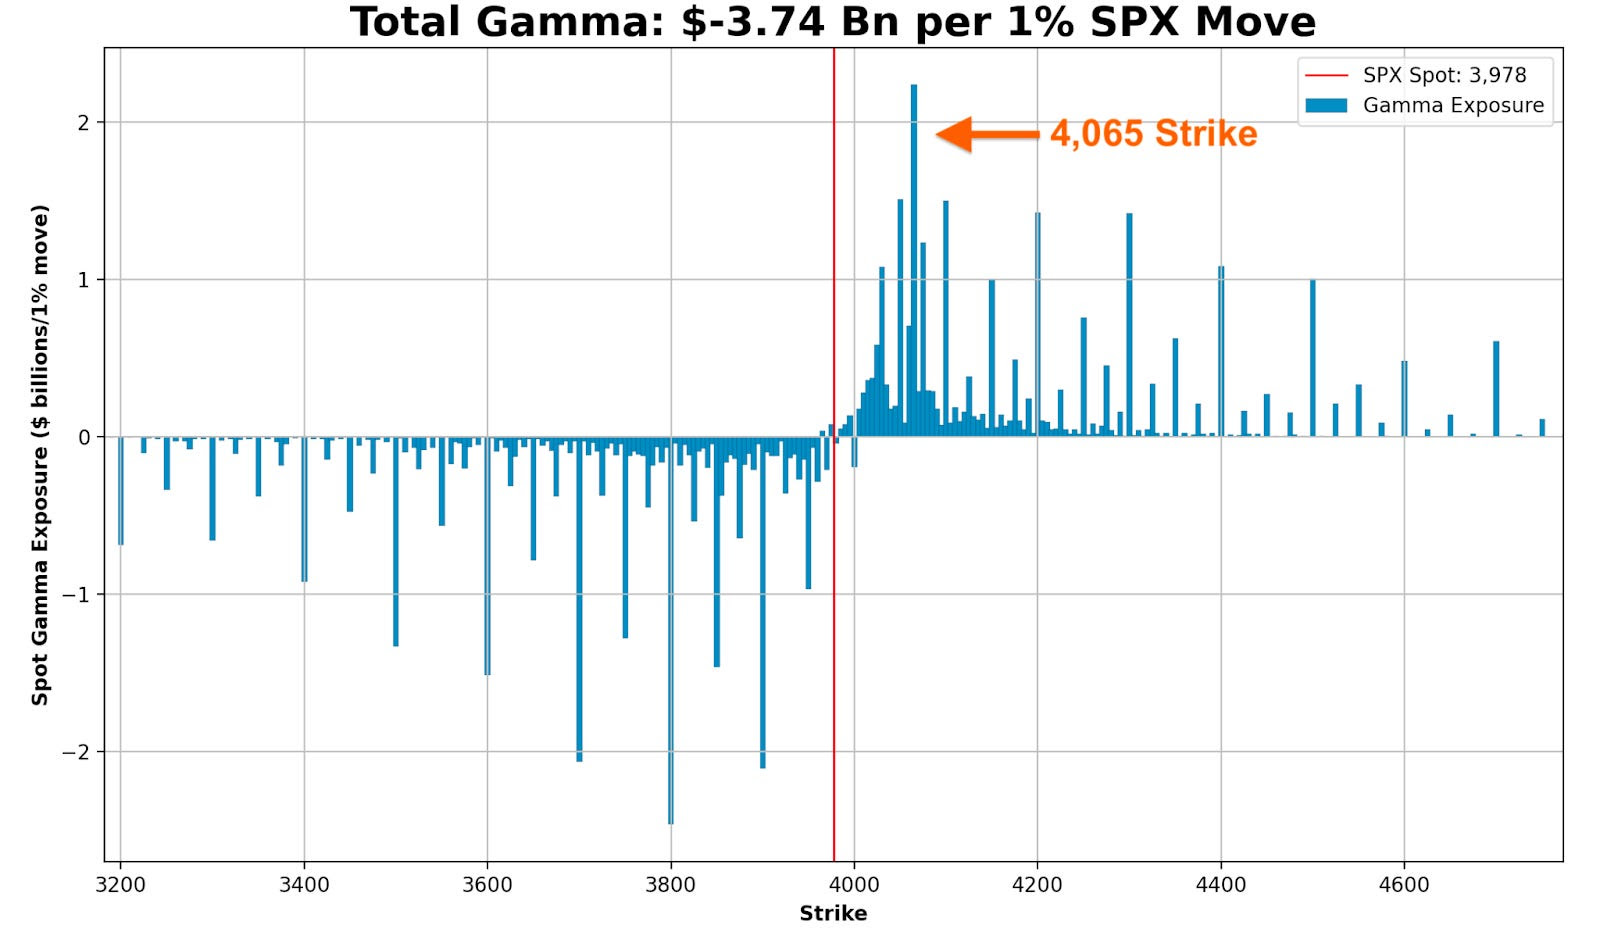
This ongoing decline began in mid-February, coinciding with the unwinding of significant amounts of call options—contracts to buy stocks at a set price. This added indirect pressure on the market through hedging-related flows.
SpotGamma expresses this view, highlighting that the February expiration was “call-weighted” due to strong stock performance leading up to it. This increased the likelihood of a pullback, as call sellers unwound their long stock hedges—a simplified explanation, as other offsetting positions may also be in play.
Graphic: Retrieved from SpotGamma.
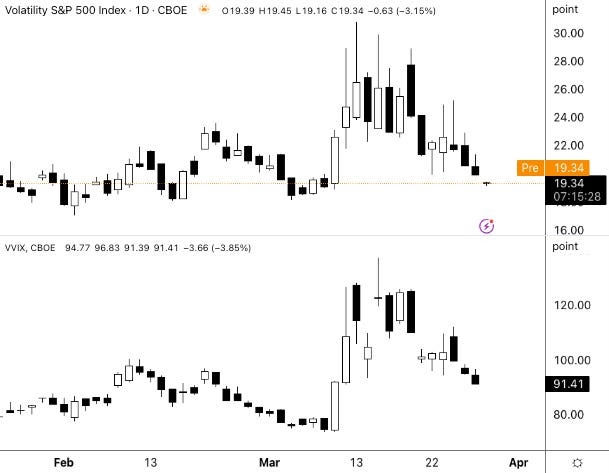
At the same time, after market shocks in August and December 2024, investors focused more on guarding against sudden volatility spikes rather than hedging against a broader market downturn. This pattern is familiar—the S&P 500 and the Cboe Volatility Index (VIX), which measures expected market volatility, sometimes rise together ahead of market peaks.
Meanwhile, within market supply dynamics, this activity has effectively set a floor under VIX pricing, as reflected in the VVIX trending higher since the volatility of late last summer.
Graphic: Retrieved from TradingView.
The result? Despite preparations for increased volatility, it hasn’t materialized, frustrating hedge holders and making it harder to identify a market bottom typically marked by extreme volatility spikes. Even with a backwardated implied volatility term structure (where short-term volatility is priced higher than longer-term volatility), anxiety and market movements remain out of sync.
Graphic: Retrieved from TradingView. 1-month VIX less 3-month VIX.
Over time, some traders might shift to longer-dated options, while others might drop their hedges altogether, which could amplify volatility-selling behavior. Ironically, this could create the conditions for shocks they were trying to hedge against.
Given this environment, 2022’s playbook becomes relevant. Back then, investors—rattled by the COVID crash—were prepared, monetizing hedges into declines and keeping a lid on volatility. We may see parallels now. After last week’s economic data, hedgers have been supplying volatility back to the market, offering brief relief as we potentially enter a seasonally stronger period.
Graphic: Retrieved from SpotGamma.
The main takeaway? Current positioning dynamics indicate that investors have effectively managed and responded to the downside. While markets will be volatile, significant shocks may be delayed or avoided.
Graphic: Retrieved from SpotGamma and for illustrative purposes only. SPX prices X-axis. Option delta Y-axis. When the factors of implied volatility (Vanna) and time change (Charm), hedging ratios change. If investors hedge by selling stock to offset long put options, falling implied volatility (as seen in the skew chart above) leads them to buy back the stock, which can support markets.
Context Applied: Trade Structuring
We adapted previously shared structuring guides. Given volatility’s failure to perform, we opted for downside ratios and flies. This worked, and we plan on developing some case studies.
A potential cyclical rebound within a broader period of weakness could be expressed via low-cost positive-delta (bullish) structures, including buying calls while proportionately hedging with stocks or futures, where potential gains from the calls can outweigh hedge-related losses. Additionally, as we prefer, one can deploy verticals and flies, buying options closer to the current market prices while selling more options further out (with an extra far-out option bought to reduce margin requirements if needed).
We and others agree that the Nasdaq 100 (NDX) and higher beta stocks are appealing. For one, relative strength pockets emerge in the NDX versus the SPX, potentially attributable to tariffs disproportionately impacting non-tech sectors. Checking options skews, and NDX options farther away in price may be underpriced for the eventually realized volatility.
Graphic: Retrieved from Bloomberg via Nicholas Smith.
For more on structuring across different products, be they gold or Bitcoin, see our Mar-a-LagoAccords letter published last month.
Disclaimer
By viewing our content, you agree to be bound by the terms and conditions outlined in this disclaimer. Consume our content only if you agree to the terms and conditions below.
Physik Invest is not registered with the US Securities and Exchange Commission or any other securities regulatory authority. Our content is for informational purposes only and should not be considered investment advice or a recommendation to buy or sell any security or other investment. The information provided is not tailored to your financial situation or investment objectives.
We do not guarantee the accuracy, completeness, or timeliness of any information. Please do not rely solely on our content to make investment decisions or undertake any investment strategy. Trading is risky, and investors can lose all or more than their initial investment. Hypothetical performance results have limitations and may not reflect actual trading results. Other factors related to the markets and specific trading programs can adversely affect actual trading results. We recommend seeking independent financial advice from a licensed professional before making investment decisions.
We don’t make any claims, representations, or warranties about the accuracy, completeness, timeliness, or reliability of any information we provide. We are not liable for any loss or damage caused by reliance on any information we provide. We are not liable for direct, indirect, incidental, consequential, or damages from the information provided. We do not have a professional relationship with you and are not your financial advisor. We do not provide personalized investment advice.
Our content is provided without warranties, is the property of our company, and is protected by copyright and other intellectual property laws. You may not be able to reproduce, distribute, or use any content provided through our services without our prior written consent. Please email renato@physikinvest for consent.
We reserve the right to modify these terms and conditions at any time. Following any such modification, your continued consumption of our content means you accept the modified terms. This disclaimer is governed by the laws of the jurisdiction in which our company is located.
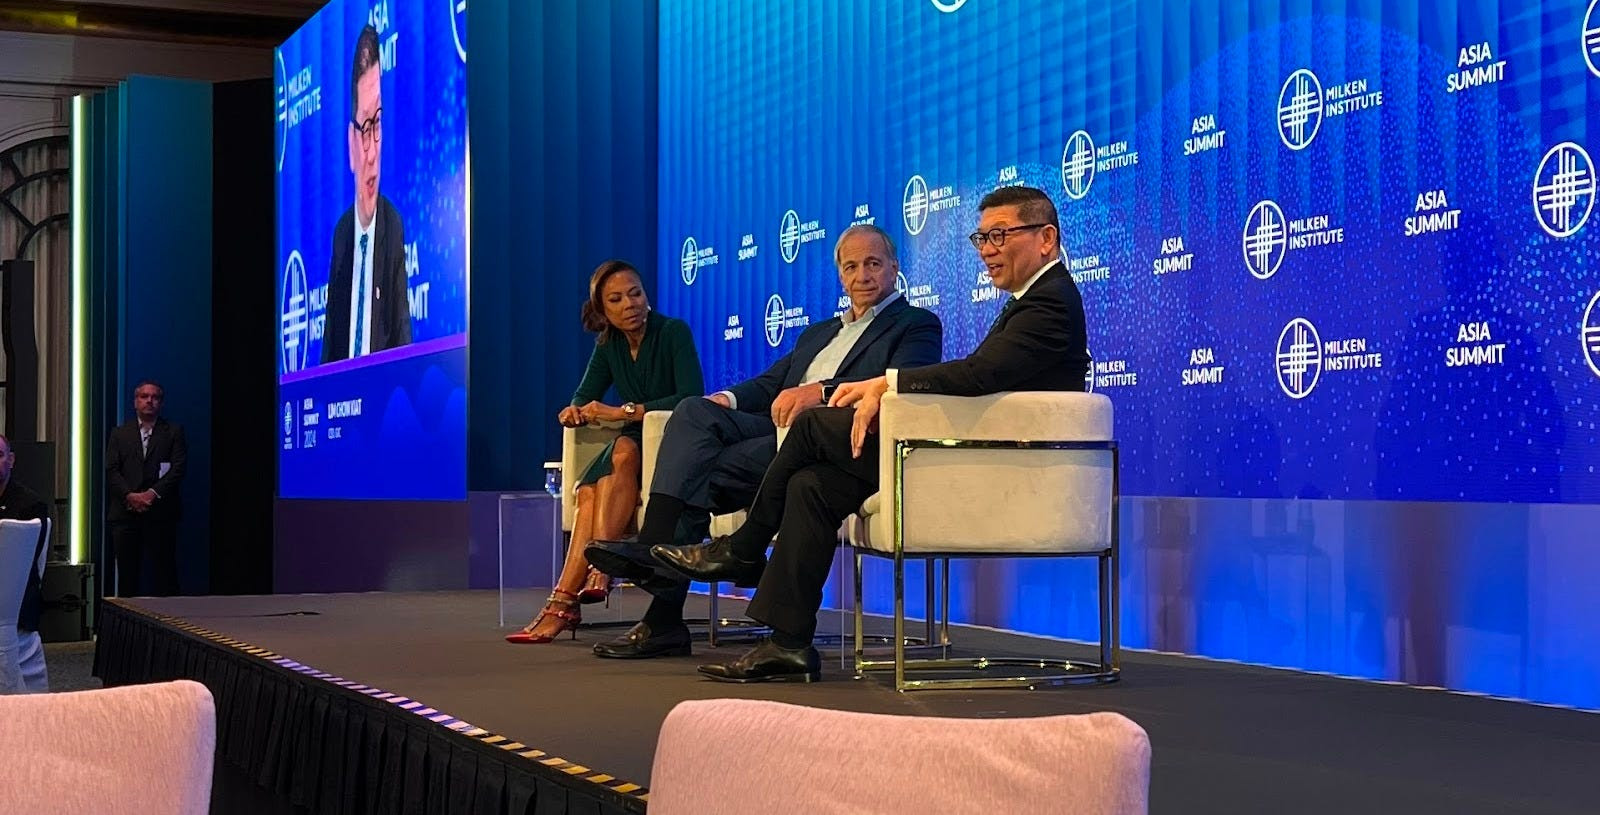
Last month, we had the privilege of attending the Milken Institute’s Asia Summit in Singapore, often seen as the West’s gateway to Asia. Prominent figures, including Bridgewater Associates Founder and CIO mentor Ray Dalio, shared insights on navigating a rapidly transforming, multipolar world. Dalio focused on the major forces shaping global conditions—such as debt cycles, political instability, great power conflicts, climate change, and technology—and highlighted where investment opportunities lie. While the U.S. market may be priced to perfection, Dalio pointed to regions like China and other parts of Asia as offering greater potential.
Fresh from Singapore, we sat down with Andy Constan, Founder, CEO, and CIO of Damped Spring Advisors, whom you may recognize from his appearances on CNBC or Twitter/X. Constan’s background is rooted in extracting value through “relative value” trades, but since the Global Financial Crisis and his time at Bridgewater Associates working alongside Ray Dalio, he’s shifted his focus to macroeconomic factors. In this discussion, we explore his experience building Bridgewater’s volatility pillar, the vulnerability of traditional alpha strategies during macro crises, the bull market for metals, stock market expectations, and more.
As you may have noticed, there’s a progression in our podcast episodes. In the first, Mat Cashman, a former market maker, broke down what options are and how they’re traded. In the second, Vuk Vukovic, founder of an upstart hedge fund, discussed idea generation and using options as tools to express those ideas. Now, in our third episode, Constan dives into how options fit into a balanced portfolio. The key takeaway? While options can enhance portfolios, most investors don’t need leveraged exposure to markets. A balanced portfolio in 2025 can remain straightforward, and here’s an expert telling you just that.
The video can be accessed at this link and below. An edited transcript follows.
I recently attended the Milken Institute event in Singapore, where Ray Dalio was a keynote speaker. Since you worked alongside Ray at Bridgewater, I thought it would be interesting to hear your perspective. Some key themes he discussed included multipolarity, deglobalization, internal disorder, elections, and the fact that a few companies drive much of the S&P 500 Index’s performance. Could you start by sharing a bit about your time at Bridgewater? What was your role, and how may those themes and what you learned there shape your portfolio today?
Before joining Bridgewater Associates as a senior research team member, I ran a hedge fund, focusing heavily on equity relative value, volatility, capital structure arbitrage, risk arbitrage, long-short strategies, and statistical arbitrage. Through my hedge fund experience, I looked at volatility across different asset classes—rates, equity, currency, and commodities. By the time I joined Bridgewater, I had accumulated 23 years of experience, including 18 years at Salomon Brothers, where I was involved in market-making and prop trading, and five years running my hedge fund.
When I joined in 2010, the idea was to see if I could contribute to Bridgewater’s investment process in areas they hadn’t previously explored. I created the volatility pillar within their idea generation team, working closely with Ray Dalio, Greg Jensen, Bob Prince, who were the three CIOs at the time, and several talented young individuals, including Karen Karniol-Tambour, now the Co-CIO, and Bob Elliott, now a well-known figure on Twitter/X who was always excellent at asking probing questions.
This role exposed me to macro factors I hadn’t previously focused on. I noticed that traditional alpha strategies often blew up during macroeconomic crises, convincing me that many of them—like long-short equity, leveraged derivatives, and convertible bond arbitrage—were vulnerable to the same risks. The Global Financial Crisis clearly illustrated how macro factors, along with central bank actions like quantitative easing and tightening or lowering and raising interest rates, influence monetary conditions and the availability of leverage; when financial conditions tighten, seemingly uncorrelated alpha strategies unravel.
Bridgewater’s focus is on directionally trading the most liquid assets globally. Before my time there, they primarily traded futures and cash securities, with little exposure to options or derivatives. So, my role was to explore whether the volatility market could offer insights to enhance their directional trading or even serve as a new asset class responding to their existing macro indicators.
Graphic: Retrieved from Renato Leonard Capelj, founder at Physik Invest.
Does Bridgewater still have this volatility pillar?
While my connections at Bridgewater remain strong, we don’t discuss business. Like most hedge funds, their work happens behind closed doors. In any case, I don’t believe they’re involved in those markets, as they’re typically too small for their size; instead, it is more likely they use some of the strategies I helped develop—focused on volatility, credit markets, and other convex assets—to refine their directional views on traditional, highly liquid macro assets.
Were there any trades—or even just ones you were eager to pursue—that Bridgewater decided not to go after?
Three days after I joined, the Flash Crash occurred. The market was already on edge, particularly with European turmoil. Earlier that spring, the Greek debt market had been rocked by significantly higher deficit expectations, sparking the European debt crisis just ahead of the Flash Crash. When the crash happened, it cemented for many investors that a more volatile post-GFC regime would persist for years.
A persistent demand for long-term equity volatility has run over many funds and investors throughout my career. This demand primarily comes from insurance companies, which can’t sell traditional investment management products but want to, as their clients are the same retail investors who may purchase money management services for their 401(k)s or pensions. Essentially, the clients have savings they want to invest, and the insurance companies have life insurance policies—like Term Life—that historically acted as fixed-income securities. You get a guaranteed death benefit, and your policy accrues value based on interest rates.
With interest rates incredibly low then, insurance companies in the mid-1990s began creating securities that offered guaranteed death benefits with upside exposure to equities. They bought equity portfolios, added interest rate swaps, and purchased puts on the S&P 500, creating a bond with a call option on equities. This enabled clients to receive a guaranteed death benefit with potential equity performance upside. Accordingly, the aggressive demand for these products pushed up long-term volatility, as these were 10- to 20-year death benefit products, and long-term call options became highly sought. This affected the dividend market—dealers who sold these calls became exposed to dividends.
Initially, Swiss banks like UBS O’Connor and First Boston and some French banks supplied the calls. However, by the mid-to-late ’90s, the demand overwhelmed them as markets grew more volatile, mainly due to the increasing tech concentration in the index. Long-Term Capital Management (LTCM) stepped in, selling global index volatility for five years. This did not end well, and after LTCM was unwound, long-term volatility remained well-bid as insurance companies continued buying these structures and selling them to clients. Warren Buffett eventually stepped in during the GFC, selling $9 billion notional in five- to ten-year S&P puts. He saw it as a good bet, figuring that buying stocks at $700 in ten years after collecting premiums was favorable. Uniquely, he wasn’t required to post any collateral—a situation unlikely ever to repeat. However, Buffett eventually unwound this position as the market rallied following the GFC lows around the Flash Crash.
With Buffett out of the game, no willing sellers of long-term volatility existed. The banks and LTCM had been burned, and even though Buffett avoided getting burned, his exposure to Vega (i.e., the impact of volatility on an option’s price) still cost him.
At one point, we saw 10-year implied volatility reach 38%. I spent weeks crafting a case for Bridgewater, supported by data, evaluating the size and forward demand of the insurance market and potential players who could self-insure. We analyzed whether selling 38 implied volatility was a good trade and gathered historical data from every stock market, from 1780s UK to post-Soviet Russia, to assess risk. As it turns out, selling a 38 implied volatility would have been profitable in most cases. The only exceptions were Germany, Italy, and Japan, where WWII drove realized volatility above 38. Never before in the US, UK, or elsewhere had there been sustained realized 38 volatility.
Confident in my findings, I presented this trade idea to Bridgewater, but we ultimately didn’t execute it. The following year, realized volatility dropped below 20, and implied volatility fell by 12-13 points. Had Bridgewater made the trade, it could have likely netted $1 billion in the first year and over $20 billion over the decade.
Did that, in terms of how they made decisions and portfolios guide how you think about making decisions today?
Yes. Bob Prince pulled me aside during the process and said, “We like what you’ve done, but we need you to think differently.”
At Bridgewater, the way they want you to think makes perfect sense. If you’re serious about having a long-term investment process, you need something you can use consistently, day in and day out. You’re not just looking to trade—you want an alpha stream that endures. That’s the real asset. Once a trade is done, if it can’t be repeated, all the effort is wasted. Bridgewater’s focus—and anyone involved in systematic trading should—was discovering long-term alpha streams.
The biggest constraint, both at Bridgewater and everywhere, is time. You have to be selective about where you invest it. For CIOs, learning to trade options proficiently would have been a massive time drain and likely hurt their performance in building a sustainable, long-term alpha-generating engine, which already demanded their full attention.
So that’s the key—what is your time worth? I believe they made the right decision. Investment researchers should focus on creating lasting alpha, not short-term trades.
What did your early work at Solomon Brothers—being on the Brady Commission following the 1987 stock market crash—teach you about the interplay between participants and how this affects liquidity and market outcomes?
At 23, I was fortunate to be assigned to the Brady Commission. What set me apart was a relatively ordinary skill for my generation: I was particularly good at working with spreadsheets. This put me at the table with five senior investment professionals from Morgan Stanley, Goldman Sachs, Lehman Brothers, JPMorgan, and the head of research at Tudor, who had made a fortune during the crash. I analyzed actual trades with the names of brokers and end clients—tracking who bought and sold during the crash across multiple markets, including S&P 500 futures, S&P 500 baskets, and rates.
This experience shaped my understanding of markets. Ever since, I’ve been focused on answering who owns what and why. Today, we call this flow and positioning, but knowing who held what and the pressures they faced was invaluable back then. Were they in a drawdown? Were they doing well? Did they see inflows or outflows? Were they levered or not? Understanding these dynamics—and who the players and their end investors were—has been the foundation of my life’s work.
Is that understanding of flow and positioning what guided your career following Solomon Brothers, even when you had the chance to work with firms like Long-Term Capital Management (LTCM)?
When many of my friends at Solomon’s prop desk went off to start LTCM, I had the worst year of my career in 1995. My convertible bond strategy and most hedge funds collapsed due to the Fed tightening. I asked those guys for a job multiple times. Thank God I didn’t get it, but they were the most brilliant people I knew back then. At the time, Solomon had just gotten past the treasury bond auction scandal, which John Meriwether, at least in part, oversaw, and that led to his departure to start LTCM. By then, Solomon was the worst-performing stock in the S&P 500 for the first ten years of my career—bar none. So, when LTCM launched, Solomon wasn’t a great place to be. I thought it through carefully—and even acted on it—but they didn’t want me.
Following LTCM, is that when things started clicking for you from a macro perspective regarding the relationship between macro crises and relative value trades failing? Moving into the future, what are some of the big macro themes you think may affect market outcomes significantly over the next few years?
Honestly, back in 1995, I had no idea what macroeconomics meant or how it worked, and I didn’t fully appreciate its significance. By 1998, it started becoming more apparent with the LTCM unwind. It wasn’t just LTCM; many firms, including Citibank, where I worked, were involved in government bond arbitrage. LTCM was simply the poster child, so attention gravitated there. By 2004, when I started my hedge fund, people were beginning to consider the possibility of hedge funds deleveraging as a cause of widespread contagion. Still, it wasn’t until 2007 and 2008 that I truly grasped the scale of that risk.
In any case, I prefer to operate on a one-year horizon. What’s clear now is that the Fed, more so than other central banks, has concluded that inflation is no longer a concern—it’s not going to re-accelerate. Because of that, they can lower interest rates relatively quickly, even if the job market doesn’t weaken enough to force their hand. You could call it a normalization. Since mid-December of last year, when the Fed started emphasizing the importance of real short-term interest rates, we’ve been on this path toward normalization. The idea is that real short-term rates dictate both inflation and economic strength, and the Fed is fully committed to returning to a normal interest rate—quickly.
The critical question is, are they right? That’s what markets are wrestling with now. Are they correct in saying that financial conditions are tight and that lowering short-term rates will ease those conditions, which flow through to stimulate the economy? Typically, the Fed doesn’t try to steer the economy directly; instead, it responds to and offsets economic pressures. When inflation rises, they hike—and do it aggressively, though often a bit late until they’re confident. They keep hiking until they’re optimistic inflation is rolling over. Conversely, when they cut rates, they should, in my view, be leaning against a trend and responding to a slowing economy that’s disinflationary and underperforming on growth and jobs.
We’re in a strange situation now. The Fed doesn’t need to combat inflation, and they certainly don’t believe they need to. Instead, they think that by acting too cautiously, they risk over-correcting. So they’re normalizing rates. But what does “normal” even mean now? Is the current path of normalization too aggressive? At the heart of it, this revolves around the pace and destination of rate cuts. That’s what we need to watch moving forward.
There’s also an election coming in early November, which could impact the economy. Politically, I believe it doesn’t matter much which party is in power—they both tend to increase the pie by accumulating more debt and engaging in deficit spending. The difference lies in who and how they distribute that pie. It matters for specific sectors and individual stocks. One might think that oil would do very well under Harris and very poorly under Trump, but one might think that oil companies are going to do very well under Trump and very poorly under Harris. It’s complicated but consequential.
Post-election, I’ll be watching to see if there’s any sign of austerity from either party, though I expect none. We’ll likely continue running budget deficits, though they won’t grow as fast. COVID drove a rapid spike in spending, but we’ve since returned to a more constant deficit. The change in expenditures, rather than the percentage of GDP, influences the economy. If spending remains steady, it acts as a drag. If it grows, it stimulates the economy. How that unfolds depends on the balance of power between the House, Senate, and the Oval Office.
Looking ahead, the Fed will cut rates to around 3%, leading to a soft landing—no significant increase in unemployment and inflation hitting their target. I find that scenario unlikely. It’s like a skipper on a battleship trying to dock perfectly by pulling an antiquated lever. The Fed doesn’t have that much control by tweaking the short-term interest rate; financial conditions matter most to me: the availability and cost of financing for consumers and companies, accumulated wealth, and the health of the dominant financial institutions. Right now, all indicators suggest consumption and investment conditions are favorable. At the corporate and individual levels, income is strong, and corporate profits are expected to remain robust. There’s no need to dissave or leverage up, but they can if they want to consume.
Given these conditions, I’ve remained bullish on the economy since April 2020 and still don’t foresee a recession. This leads me to question why the Fed is normalizing rates and why they believe this won’t stimulate consumption and investment. I think the 3% rate target is too low. If I’m right, inflation will stay sticky or rise slightly relative to their target—not dramatically, as there’s no supply shock, but the demand and monetary sides are still stimulative. Why would major corporations start cutting jobs when they’re reporting record earnings and the economy sees record GDP? I don’t expect a significant weakening in the job market, especially as the government continues deficit spending. In my view, the direction the central bank is taking—normalizing rates—is misaligned with the economy’s current strength.
Is this preemptive action by the Fed a mistake?
I don’t know. We’ll have to see what Jerome Powell does. He cut rates by 50 basis points, and now (September 25), the markets are pricing in about a 17% chance that the two 25 basis point cuts projected for the next two meetings will happen. There’s an 83% chance we’ll see two 50 basis point cuts or one 50 and one 25. The trough interest rate they’re targeting is now around 2.87%, the lowest we’ve seen, except for a brief moment on August 5 when people called for emergency cuts of 75 basis points. So, that’s a significant drop. Christopher Waller and other Fed officials have indicated that rates will likely come down over the next 6 to 12 months, and there’s plenty of room for further cuts. The Fed’s ‘dots’ representing the minimum projected path for interest rates validate this. Meanwhile, inflation expectations have risen daily since the Fed meeting, with gold at all-time highs, bitcoin rallying, stocks not so much, and long-term bonds selling off. Only very short-term bonds are rallying.
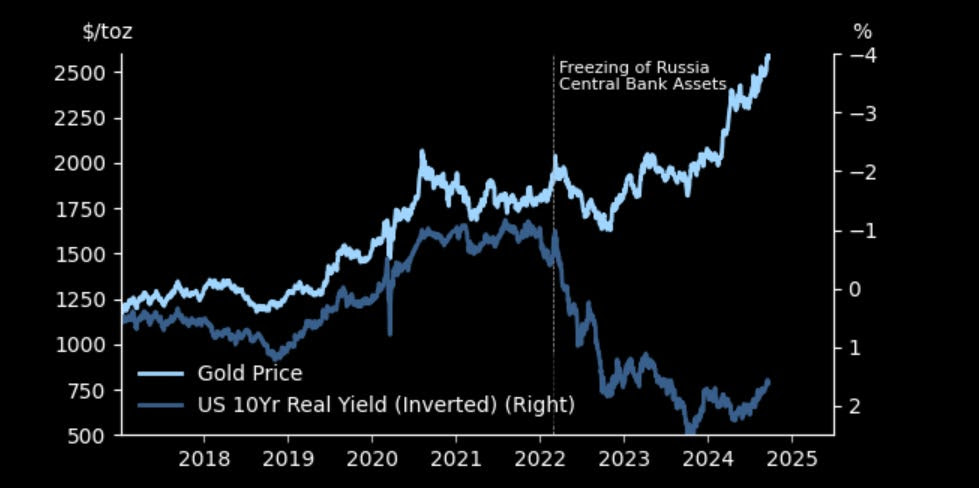
Gold is inversely correlated with rates, correct? So, you have other factors, like buying from central banks, that may help buoy it in recent years, correct?
Yes. Many central banks have been increasing their gold holdings — the obvious ones are China and Saudi Arabia. Switzerland is another, and some of the buying may involve private citizens in some cases. There’s been a broader trend among countries that don’t want to hold U.S. assets, particularly adversaries, turning to alternatives like gold. But this flow is unpredictable. Prices slow it down; people don’t buy gold at any price. It’s fairly inelastic — they’ll buy at most prices but not at every price.
In my framework, I’ve always been bullish on gold since leaving Bridgewater, where I was indoctrinated to understand the value of non-fiat currencies. I haven’t yet bought into Bitcoin because its price is still too correlated with the Nasdaq for me to consider it a true monetary equivalent, though it may become one someday.
Moreover, there are a few ways inflation arises. Demand-side inflation happens when people decide to spend more, which can vary with societal changes and human behavior. Supply-side inflation can come from labor shortages and rising costs in services and manufacturing. However, the latter can’t be hedged with gold because its value doesn’t depend on these forces. The key to gold is its relationship to currency. The more currency that gets printed, the less valuable it becomes relative to gold. Gold is a hedge against monetary inflation. That said, I’m cautious about gold prices in the short term because we’ve diverged from the following three core factors I look at.
First, I see gold as a real currency with a zero coupon. Real rates have fallen but recently stabilized. Despite this, the drop in real rates has driven up gold prices considerably, making gold seem overvalued relative to real rates.
Second, I consider the credibility of central banks. Are they becoming more or less credible? You could debate that all day. You hold gold if you believe there’s less confidence in central banks. I think they’ve done a decent job tackling inflation, at least in perception, which should be bearish for gold since the Fed’s “mission accomplished” suggests stronger credibility.
Lastly, I look at monetary inflation. The U.S. has pretty much wrapped up its money-printing experiment. Sure, we still run a deficit, but that’s different from the aggressive balance sheet expansion we saw before. The balance sheet is still too large, but the impulse has subsided. Meanwhile, China has signaled a willingness to ease credit conditions, lower rates, and encourage banks to buy equities, though they haven’t engaged in fiscal stimulus yet. If they do, China could be where the U.S. was in 2021, which would be bullish for gold. I suspect part of the reason for increased Chinese gold buying is the expectation of significant monetary stimulus. We’ll have to wait and see if that happens, but it would be very bullish for gold if it does.
All things considered, I think gold is overpriced, so I’m trimming my gold positions in my beta portfolio. I’ve even placed a small speculative short position in my alpha portfolio. It’s still a bull market for gold, but bull markets do correct, and I’ll probably be buying the dip when it happens.
Graphic: Retrieved from Goldman Sachs Group Inc (NYSE: GS) via The Market Ear.
In the context of inflation staying sticky, could you foresee a period when, even if markets rise in nominal terms, in real terms, they don’t go anywhere or go down?
The ideal scenario for a broad portfolio to meaningfully outperform cash is if the central bank eases more than expected and inflation doesn’t respond. If that happens, every asset will outperform cash. Is it possible? Of course—it’s happened. Assets have done very well relative to cash this year despite a brief drop in August. But the question remains: can this continue indefinitely? There’s a natural limit to asset growth. Still, for now, the central bank seems more dovish each day despite no supporting data. It raises the question of whether they have an agenda. I don’t believe they know more than anyone else, but their actions suggest a strong confidence that inflation won’t rise. If they’re right, assets should hold up. Will they perform exceptionally next year? Probably not. But with cash yielding less than 4% on a one-year bill, that’s becoming less attractive too.
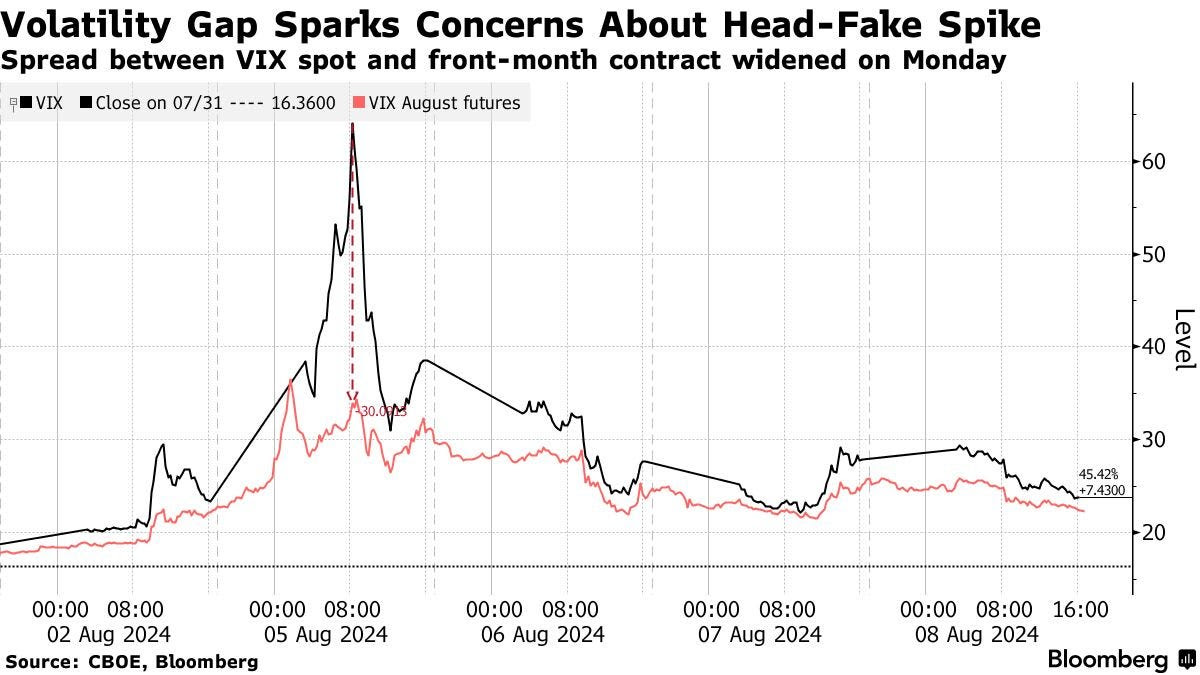
Leading to the volatility during August, we saw some rotation beneath the surface of the index, with movement into small caps and some softening in names like Nvidia. One could say that foreshadowed further weakness. Still, did you ever anticipate the unsettling volatility we saw and the subsequent quick recovery?
I wrote a fairly extensive piece on the dispersion trade and was bearish on the idea, expecting it to unwind. I was mindful of the yen’s strengthening and role in deleveraging, especially after seeing the wild moves in July following the CPI report. There was some instability, which I anticipated. But, in hindsight, the only real opportunity was to go all-in long at the bottom in August. I covered some positions and bought a bit more, but I didn’t cover enough, and I’m surprised by how strong the reversal was. Looking back, it’s clear the markets were already convinced the Fed would ease aggressively, and that’s where we stand now.
I saw a lot of commentary about how some of that risky positioning could have been doubling down following the August drop. Do you get concerned that this foreshadows something bigger happening in the future?
Everyone currently in the market is where they want to be. Their risk managers are comfortable, they’re comfortable, and they’re not over-leveraged. There’s no one delaying a margin call right now. These speculative unwinds happen fast unless they’re systemic and start feeding on each other. But we didn’t see that. More importantly, there was no sign of any banking institution struggling. The bigger story is consistent (i.e., passive) investment driven by strong incomes, robust job markets, steady 401(k) contributions, insurance plans, and government spending. In addition, reinvesting income from existing investments continues to fuel this trend. From what I see, it’s fairly leveraged, but only a significant drawdown would cause that to reverse.
And when you say meaningful drawdown, what does that look like?
10% corrections would probably mean a dip is less likely to be bought. You know, a 5% correction is just getting bought.
Could you ever foresee, though we have things in place to prevent such a thing from occurring again, a 1987-type crash unwinding some of this risky positioning in a big way? How would that look?
The odds of a stock market crash are low. A slower correction is more likely than a crash.
We had this rapid move down, and we’ve come back up. With markets now near all-time highs, how do you think about portfolio structuring? You talked a bit about positioning in gold, equities, etc. How do you think about structuring a portfolio, and do you look at things like volatility or skew levels as an input or guide?
When constructing a portfolio, the first step is to clarify your goals. For most people, the aim should be building a balanced portfolio that’s diversified across growth and inflation risks. It’s important not to focus on timing markets or picking specific asset classes. Instead, set it and forget it, with a long-term horizon of 10-20 years. Of course, some money will be needed sooner, so you must manage that more conservatively. Depending on your age and job prospects, you might adjust your risk tolerance—the better your prospects, the more risk you can afford.
My advice? Don’t spend time betting on markets. Focus on building a “set it and forget it” beta portfolio of long assets and keep adding to it. Spend your energy earning money outside the market instead. Speculating on markets is tough. It’s a zero-sum game—your gain is someone else’s loss, and that person is likely smart and motivated. It’s “Fight Night,” not passive investing. Thinking you’ll get lucky? These are sharks out there who will devour you. Competing against them far exceeds the costs of gambling in a casino. It’s like playing poker, not blackjack or craps. If you enter the game, you better be confident in your strategy because the competition is fierce.
If I’m not sleeping, I’m working to maintain whatever edge I might have, and I’m still unsure if I even have one. So, how do I build portfolios? Cautiously, with low confidence, sticking to what I know. I balance risk management, never going all in and grinding through it, just like Joey Knish, John Turturro’s character in Rounders. That’s the guy I want to be.
In terms of Damped Spring’s story, what do you want to do there? You’ve been running that for a few years, starting with a very small followership, and then you scaled that up. You’ve gotten to this point? What’s next?
I have a life I enjoy. I maintain relationships with a few hundred institutional clients, and over 15 of the largest firms value my insights. I provide them with my research, and I’ve also built deep connections with professionals—many of whom prefer to remain anonymous—who want to be members of Damped Spring. These members ask me questions like yours, and I give them data-driven answers. My goal is to meet them wherever they are on their learning curve and help them progress in a very hands-on way. Every day, I work with clients, answering their questions thoughtfully or being upfront if I don’t have the answer. I find that incredibly rewarding.
The financial side is a small part; it’s not about the money for me. Institutions pay because they value the service, and I charge individuals mainly to ensure they’re serious and to avoid wasting time with internet trolls. But people care—they want to be part of this community and learn from each other, which is wonderful. I’ll keep doing it for as long as I can add value and people want to hear what I say.
I’ve also started “2 Gray Beards” with Nick Givanovic. It’s a different approach—we offer low-touch, 20-minute videos once a week explaining what’s happening worldwide and what it means for long-only portfolios. People interested in 2 Gray Beards often don’t have much time to consider their investments. Many rely on their financial advisor or money manager, who might charge 80 basis points a year—say $40,000 for someone with decent wealth—and often, they don’t fully understand what the advisor says.
We aim to reach these end clients directly and say, “Here’s what’s happening. Watch these videos for 20 minutes a week for a few months, maybe half a year, and I guarantee you’ll be able to have a more meaningful conversation with your financial advisor. If we’re successful, you might understand your portfolio better than your advisor.” Nick and I see this as valuable and love doing it.
What’s the biggest lesson you’ve learned in the last four years? It could be good or bad.
Underestimating how far momentum could take the market, whether up or down. I was bullish from April 2020 to February 2022, and I thought a 5 or 10% correction in 2022 would be the extent of it—but I stayed long for too long. Likewise, as markets bounced, I held onto my short positions for too long. What’s interesting to me is the role of momentum. It seems to be a more dominant factor than my models have suggested, and while I’m addressing it, it’s still somewhat unclear whether this is driven by momentum strategies or just passive money flows. I’m still learning, but that’s what I’m focused on most right now.
Well, that ties it up. I appreciate your time. It is an honor. Is there something else you’d like to add?
Recognize that beta is the way to go—it’s not difficult, and anyone can guide you through it. However, be cautious not to get too caught up in short-term trading.
Disclaimer
By viewing our content, you agree to be bound by the terms and conditions outlined in this disclaimer. Consume our content only if you agree to the terms and conditions below.
Physik Invest is not registered with the US Securities and Exchange Commission or any other securities regulatory authority. Our content is for informational purposes only and should not be considered investment advice or a recommendation to buy or sell any security or other investment. The information provided is not tailored to your financial situation or investment objectives.
We do not guarantee the accuracy, completeness, or timeliness of any information. Please do not rely solely on our content to make investment decisions or undertake any investment strategy. Trading is risky, and investors can lose all or more than their initial investment. Hypothetical performance results have limitations and may not reflect actual trading results. Other factors related to the markets and specific trading programs can adversely affect actual trading results. We recommend seeking independent financial advice from a licensed professional before making investment decisions.
We don’t make any claims, representations, or warranties about the accuracy, completeness, timeliness, or reliability of any information we provide. We are not liable for any loss or damage caused by reliance on any information we provide. We are not liable for direct, indirect, incidental, consequential, or damages from the information provided. We do not have a professional relationship with you and are not your financial advisor. We do not provide personalized investment advice.
Our content is provided without warranties, is the property of our company, and is protected by copyright and other intellectual property laws. You may not be able to reproduce, distribute, or use any content provided through our services without our prior written consent. Please email renato@physikinvest for consent.
We reserve the right to modify these terms and conditions at any time. Following any such modification, your continued consumption of our content means you accept the modified terms. This disclaimer is governed by the laws of the jurisdiction in which our company is located.
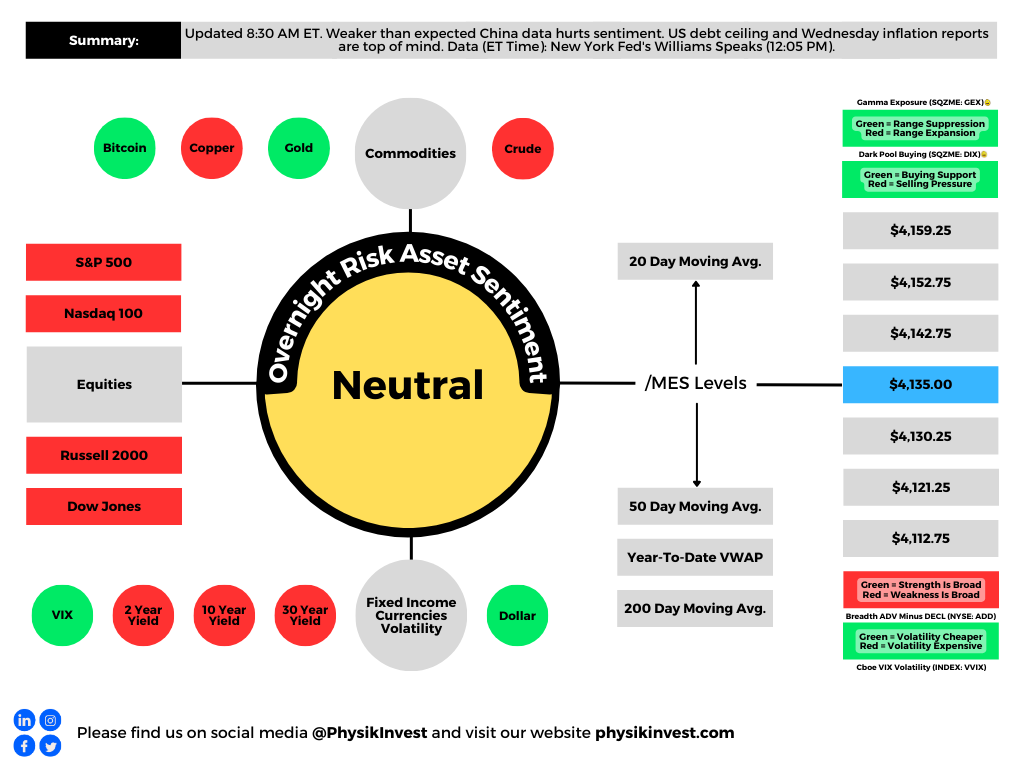
Sentiment calmer on the heels of some weaker-than-expected data from China. Generally speaking, markets are holding well, led by technology and innovation.
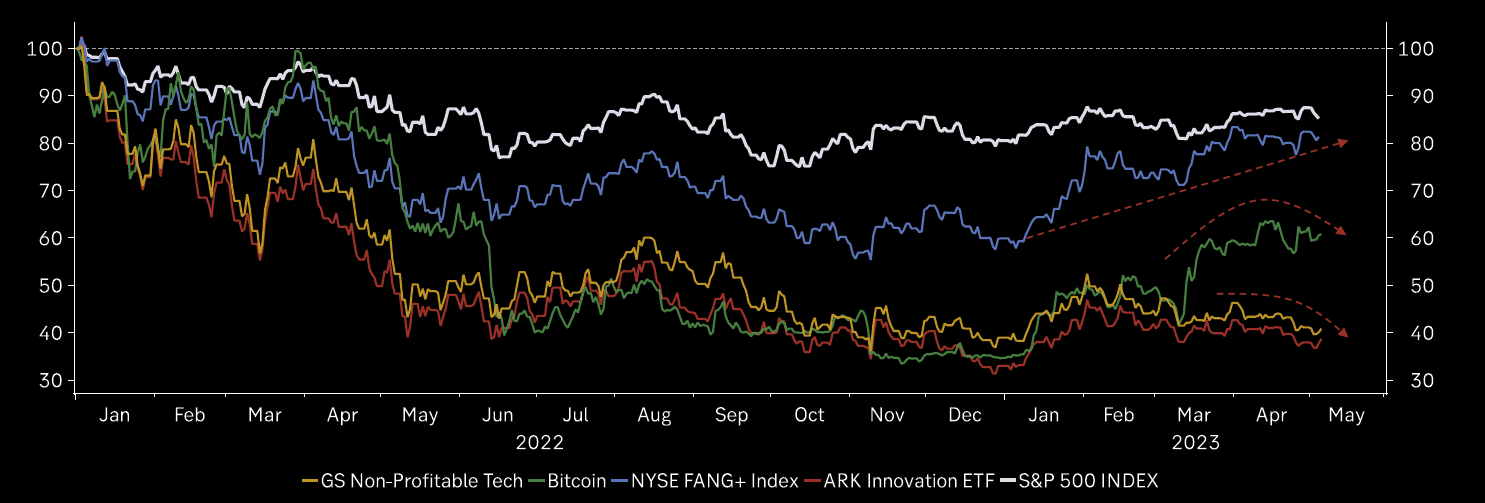
Graphic: Retrieved from Goldman Sachs Group Inc (NYSE: GS) via The Market Ear.
Price doesn’t tell the whole story, however. Breadth is softening while market boosters are slowly being picked off. Tier1Alpha says that “1-month realized volatility rose nearly 13%, [and] … if volatility continues to rise, it will have an outsized effect on the 1-month vol, as the sample is now largely filled by the smaller returns we experienced in April.” Altogether, this “could result in larger [selling] flows being triggered from systematic strategies that use volatility scaling as a means for risk control.”
Graphic: Retrieved from Bespoke Investment Group via The Market Ear.
“With that vol premium getting squeezed out, there is little room for error,” SpotGamma adds; uncertainties that may manifest pressure and compound weaknesses under the hood include inflation reports and the debt ceiling issue.
“The next big moment comes Tuesday, when President Joe Biden is scheduled to meet House Speaker Kevin McCarthy and other congressional leaders,” Bloomberg explains. “The meeting is high stakes. Republican leaders want promises of future spending cuts before they approve a higher ceiling, while Biden is insisting on a ‘clean’ increase.”
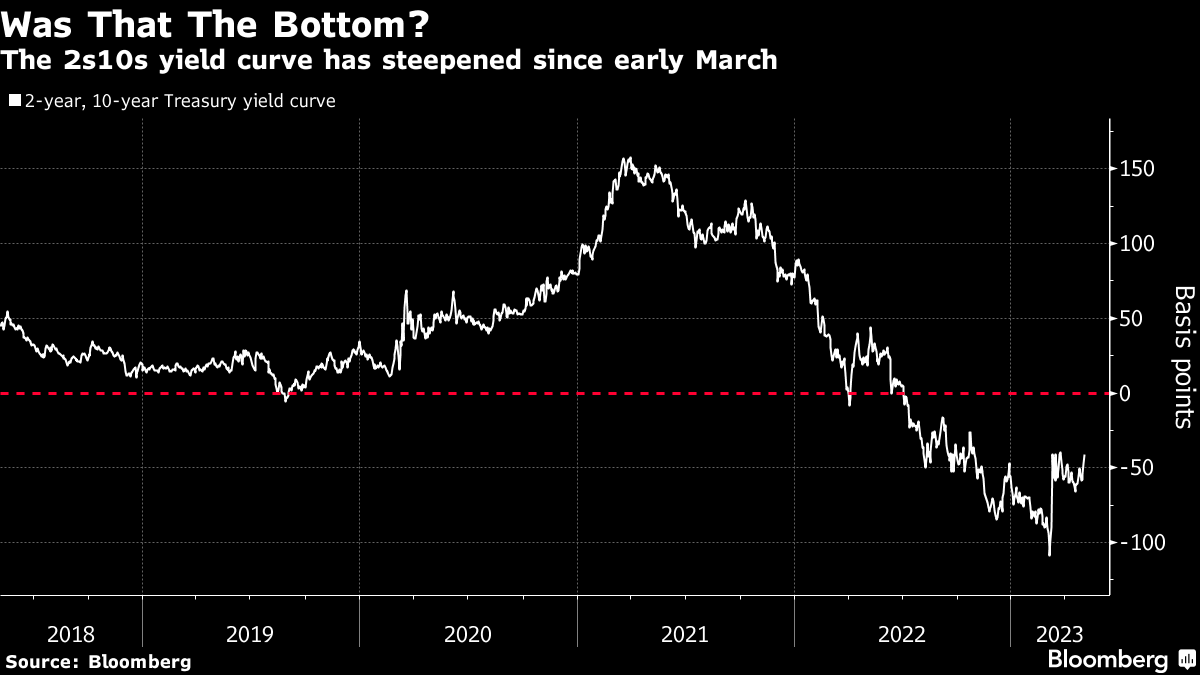
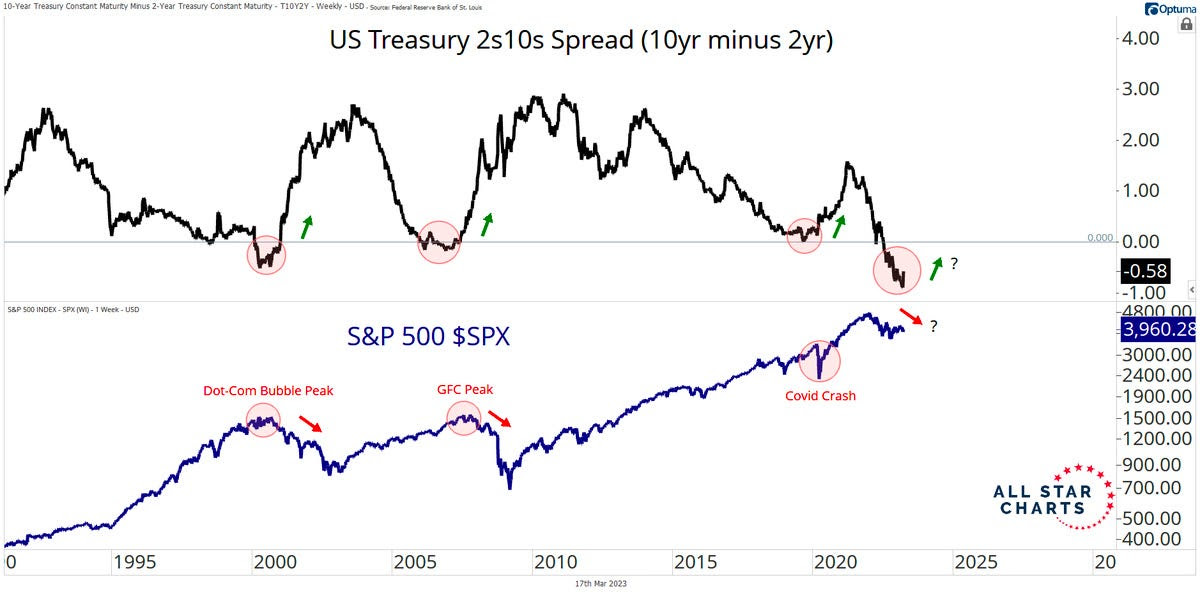
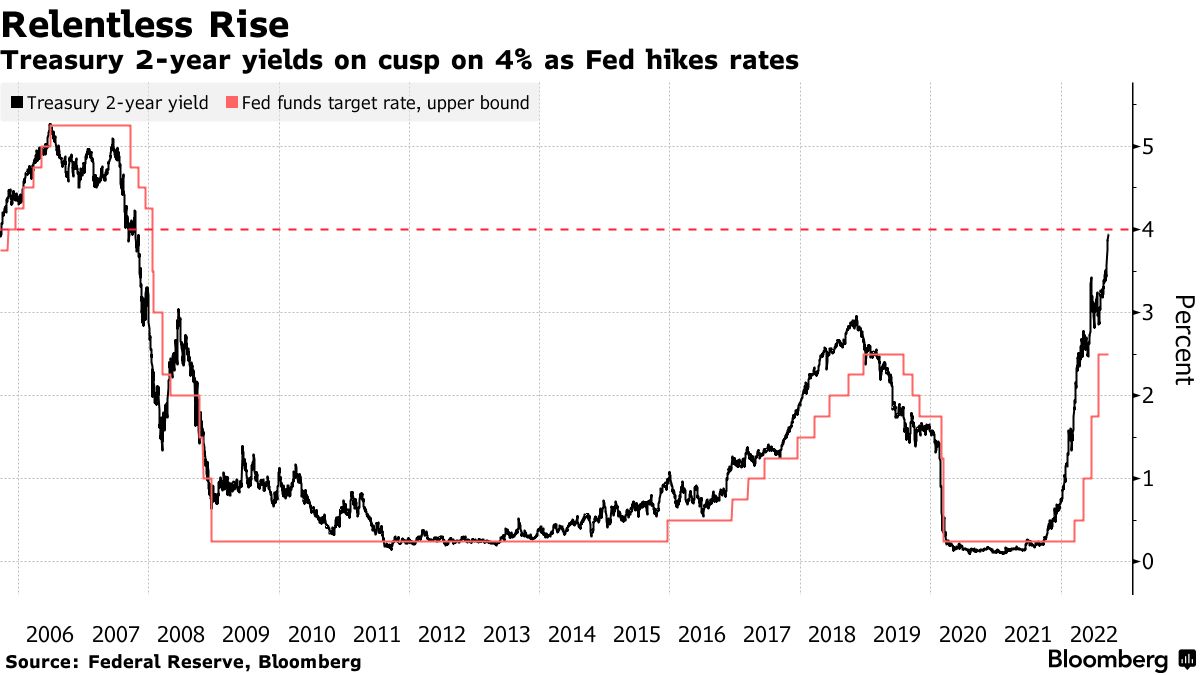
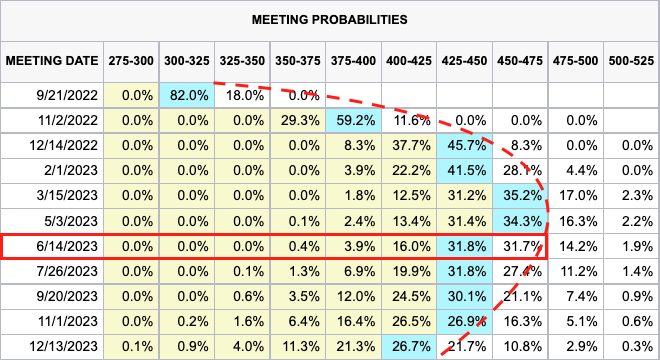
Further, traders expect increased chances of rate cuts. This may not be outlandish; “Looking at the past 17 hiking episodes, the two-year, 10-year Treasury yield curve bottoms out 108 trading days before the first rate cut.”
“Using that guide, the 2s10s curve reached negative 111 basis points on March 8 and has since steepened to about negative 41 basis points. Assuming that marked the trough, 108 trading days lands in mid-August — sandwiched between the Fed’s July 26 and September 20 rate decisions.”
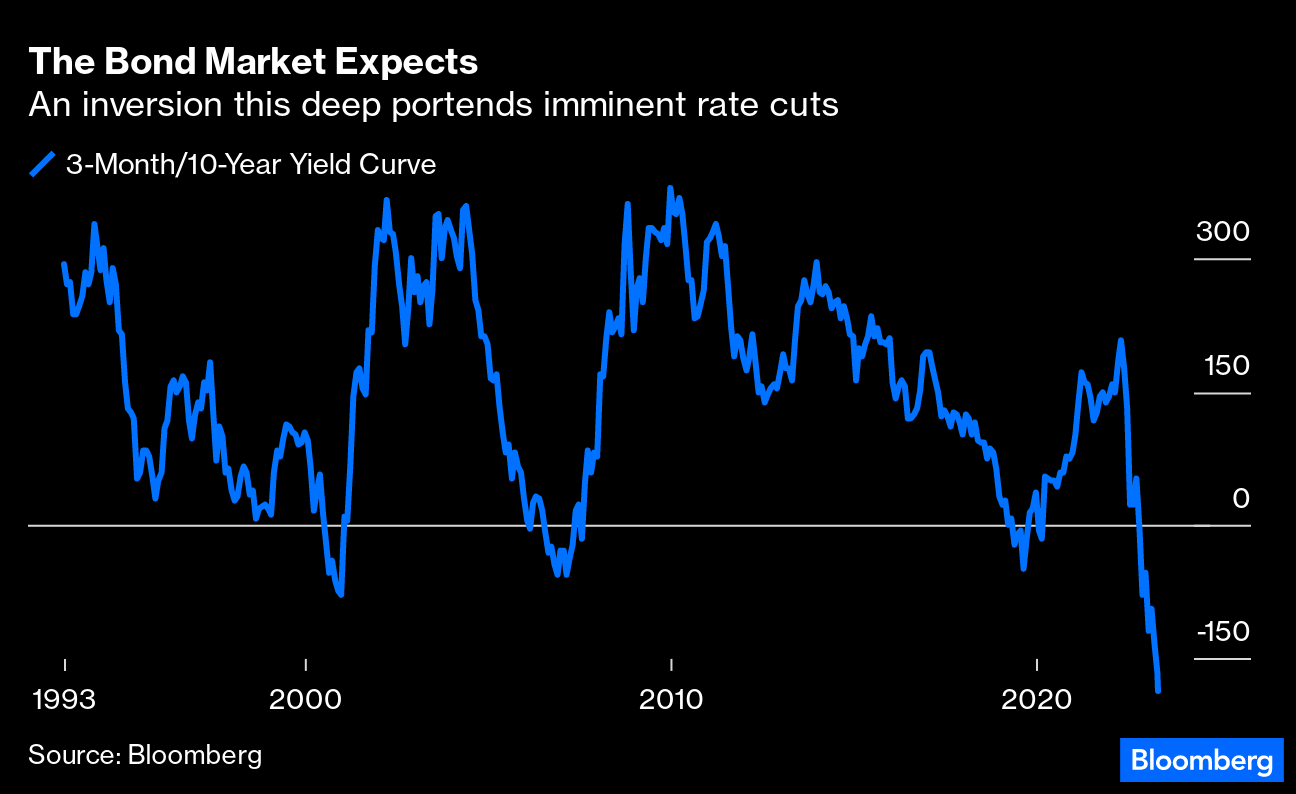
Graphic: Retrieved from Bloomberg. “Look at the gap between the three-month and the 10-year yields, generally regarded as a surefire recession indicator. It’s also a great indicator of imminent rate cuts. An inversion is also a timing signal because it makes little or no sense unless you’re confident that rate cuts will be starting soon. And over the last 30 years, the curve has never been as inverted as it is now.”
For better hedging participation in market upside, check out Physik Invest’s recently published trade structuring report.
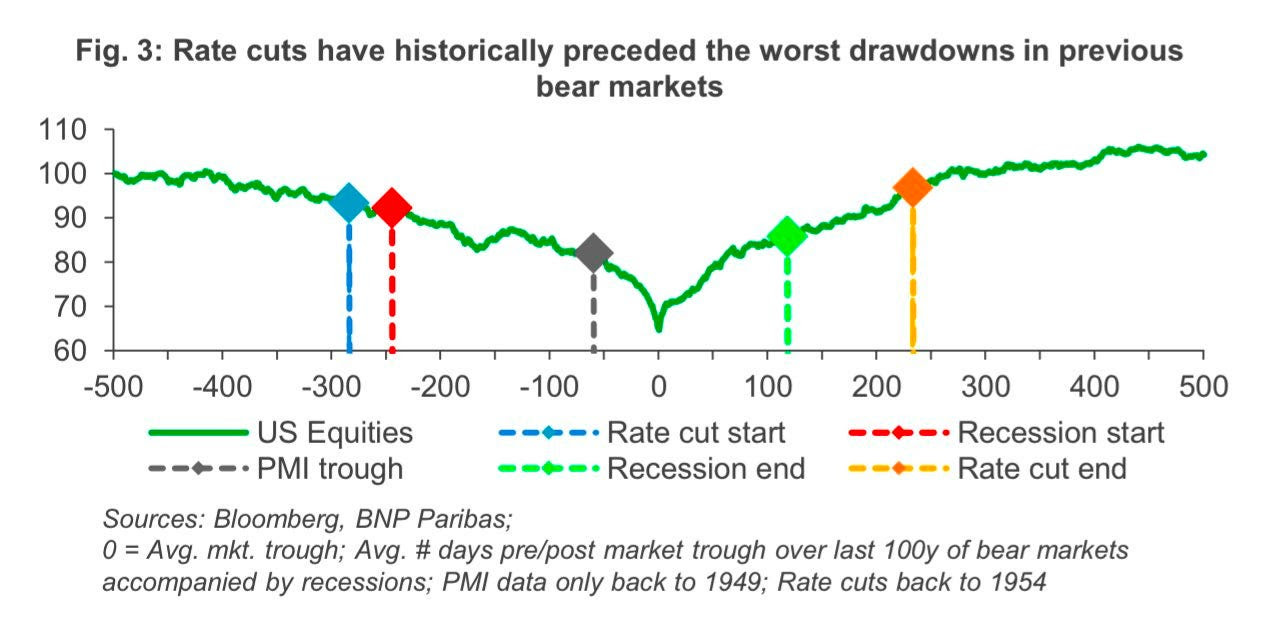
Graphic: Retrieved from BNP Paribas (OTC: BNPQY) via Bloomberg. JPMorgan Chase & Co (NYSE: JPM) strategists say that “the first quarter will likely be the high point for stocks this year, … adding that equities won’t reach lows until the Fed has pivoted to rate cuts.”
About
Welcome to the Daily Brief by Physik Invest, a soon-to-launch research, consulting, trading, and asset management solutions provider. Learn about our origin story here, and consider subscribing for daily updates on the critical contexts that could lend to future market movement.
Separately, please don’t use this free letter as advice; all content is for informational purposes, and derivatives carry a substantial risk of loss. At this time, Capelj and Physik Invest, non-professional advisors, will never solicit others for capital or collect fees and disbursements. Separately, you may view this letter’s content calendar at this link.
Physik Invest’s Daily Brief is a free newsletter sent to thousands of subscribers daily. Intrigued about what moves markets and how that can impact your financial wellness? Subscribe below.
Graphic updated 7:00 AM ET. Sentiment Risk-On if expected /MES open is above the prior day’s range. Click here for the latest levels. /MES levels are derived from the profile graphic at the bottom of this letter. SqueezeMetrics Dark Pool Index (DIX) and Gamma (GEX) with the latter calculated based on where the prior day’s reading falls with respect to the MAX and MIN of all occurrences available. A higher DIX is bullish. The lower the GEX, the more (expected) volatility. Click to learn the implications of volatility, direction, and moneyness. Breadth reflects a reading of the prior day’s NYSE Advance/Decline indicator. The CBOE VIX Volatility Index (INDEX: VVIX) reflects the attractiveness of owning volatility. UMBS prices via MND. Click here for the economic calendar.
Administrative
The newsletter format needs to evolve a bit. Feedback is welcomed! If you are looking for the link to the daily chart, see the caption below the graphic above. Take care!
Positioning
Fear of contagion prompted demands for protection. Measures of implied volatility or IVOL rose, and consequently, these demands for protection pressured markets.
Previously, this letter explained for protection to keep its value, there would have to be a shift higher in realized volatility or RVOL. Well, RVOL did not come back in a big way at the index level, as many expected.
Thus, the positive effects of the bank-related stimulation and traders’ pulling forward their timeline for easing were compounded by the unwinding of hedging strategies.
Graphic: Retrieved from Bloomberg via SpotGamma. “This drop in 5-day realized vol (orange) is pretty sharp, given it occurred from such a low relative level. ‘Can’t short it, don’t want to buy it.’ This vol decline comes as SPX put open interest was cleared with March OPEX, and big VIX call interest expired last week.”
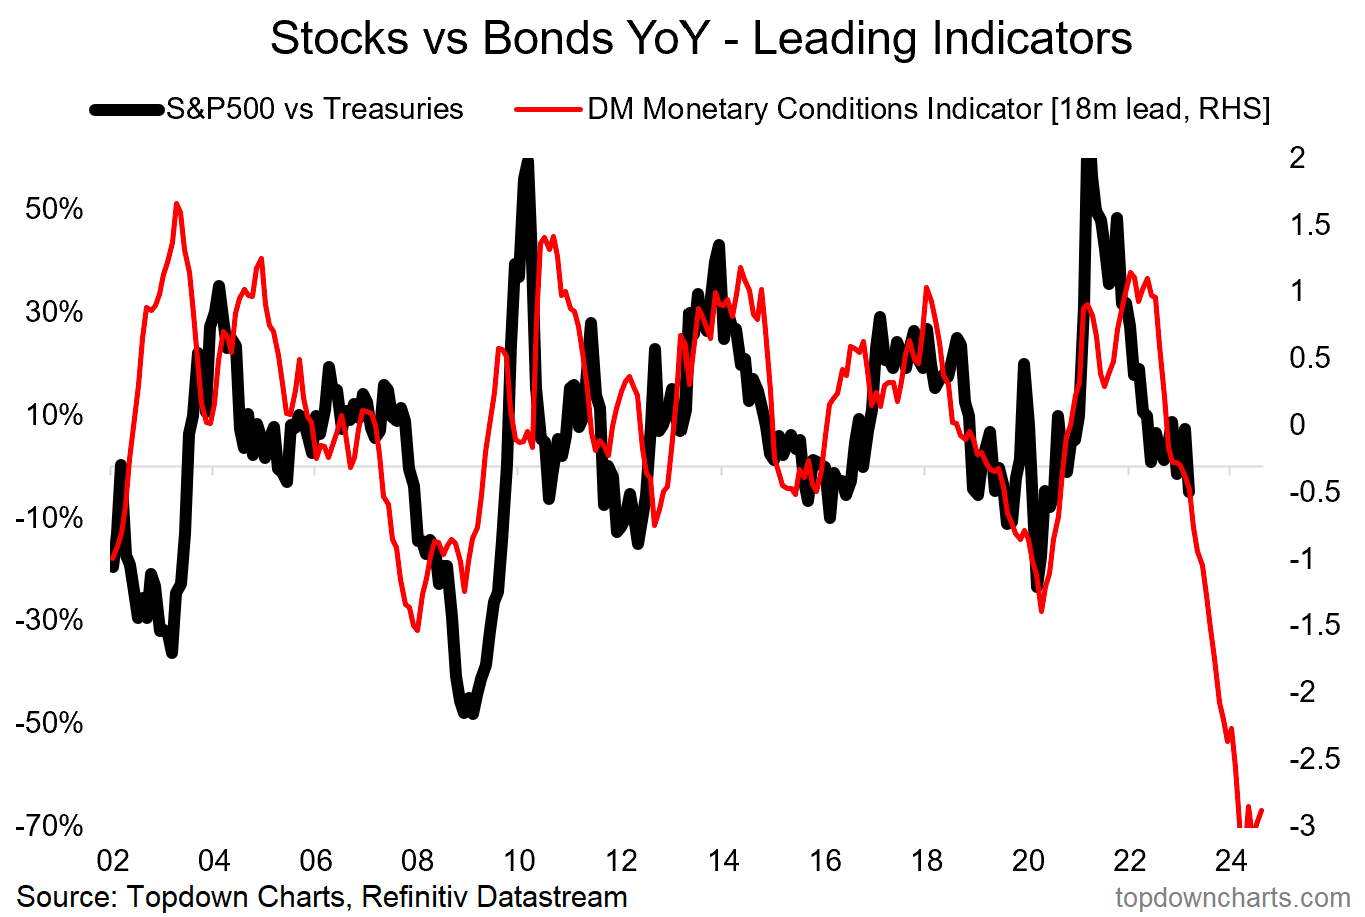
Previously depressed products like the Nasdaq 100 or NDX, which are generally very sensitive to monetary tightening, have performed well.
Graphic: Retrieved from Callum Thomas’ Topdown Charts.
As we near month-end, there is a quarterly derivatives expiry. Above current S&P 500 or SPX levels is a significant concentration of soon-to-roll-off open interest held short by investors. This means the counterparties are dynamically hedging a call they own; they’re selling strength and buying weakness, albeit in a less and less meaningful way, as those options near this expiration and their probability of paying out (i.e., delta or exposure to direction) falls.
Some would allege that volatility compression and time decay would have solicited a more meaningful response from options counterparties at those strike prices above; the absence of downside follow-through had traders supplying previously demanded downside put protection and catalyzing a rally. However, there are not many things for the market to rally on, and so much time has passed that the charm effects (i.e., the impact of time passing on an options delta) have lessened dramatically, some explain.
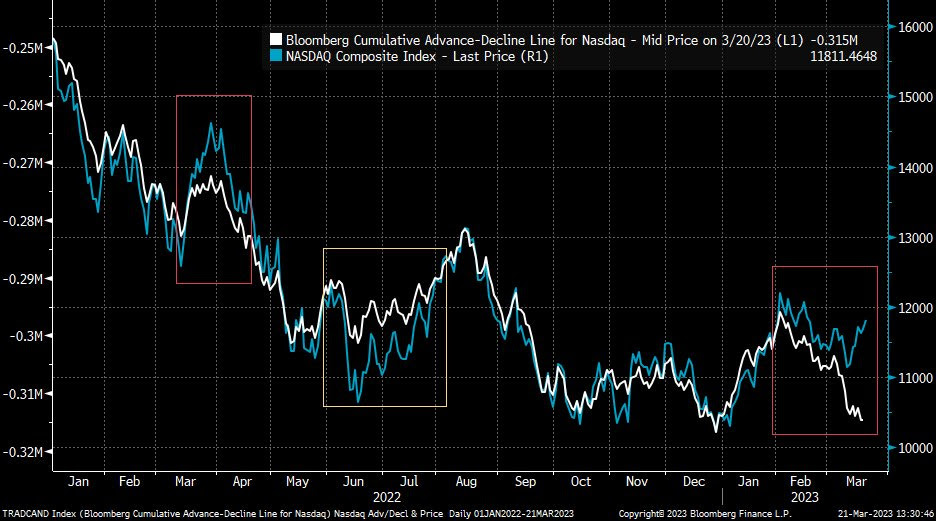
Graphic: Retrieved from Bloomberg via Liz Young. “The Nasdaq’s Cumulative Advance-Decline line has parted ways with index direction in recent days. In other words, the index has rallied despite weak breadth (more stocks falling than rising), the two lines are likely to find their way back together somehow…”
Therefore, it’s probably likely that the market remains contained through month-end. After, movement may increase. This letter acknowledged RVOL might come back in a big way, particularly with the bank intervention doing more to thwart credit creation.
The caveat is that markets can trade spiritedly for far longer. There is a potential for the markets to move into a far “more combustible” position. With call skews far up meaningfully steep, still-present low- and zero-cost call structures this letter has talked about in the past remain attractive.
Graphic: Retrieved from Charles Schwab Corporation-owned (NYSE: SCHW) thinkorswim.
If the market falls apart, your costs are low, and losses are minimal. If markets move higher into that “more combustible” position, wherein “volatility is sticky into a rally,” you may monetize your call structures and roll some of those profits into bear put spreads (i.e., buy put and sell another at a lower strike).
The signs of a “more combustible situation” would likely show when “volatility is sticky into a rally,” explains Kai Volatility’s Cem Karsan. To gauge combustibility, look to the options market.
Remember, calls trade at a lower IVOL than puts. As the market trades higher, it slides to a lower IVOL, reflected by broad IVOL measures. If broad IVOL measures are sticky/bid, “that’s an easy way to say that fixed-strike volatility is coming up and, if that can happen for days, that can unpin volatility and create a situation where dealers themselves are no longer [own] a ton of volatility; they start thinning out on volatility themselves, and that creates a more combustible situation.”
To explain the “thinning out” part of the last paragraph, recall participants often opt to own equity and downside (put) protection financed, in part, with sales of upside (call) protection. More demand for calls will result in counterparties taking on more exposure against movement (i.e., negative gamma) hedged via purchases of the underlying. Once that exposure expires and/or decays, that dealer-based support will be withdrawn. If the assumption is that equity markets are expensive now, then, after another rally, there may be more room to fall, all else equal (a simplistic way to look at this), hence the increased precariousness and combustibility.
Graphic: Retrieved from Callum Thomas’ Topdown charts.
About
The author, Renato Leonard Capelj, spends the bulk of his time at Physik Invest, an entity through which he invests and publishes free daily analyses to thousands of subscribers. The analyses offer him and his subscribers a way to stay on the right side of the market.
You may view this letter’s content calendar at this link.
Disclaimer
Do not construe this newsletter as advice; all content is for informational purposes. Capelj and Physik Invest are non-professional advisors managing their own capital. They will never openly solicit others for capital or manage others’ capital to collect fees and disbursements.
Physik Invest’s Daily Brief is read free by thousands of subscribers. Join this community to learn about the fundamental and technical drivers of markets.
Graphic updated 7:00 AM ET. Sentiment Risk-On if expected /MES open is above the prior day’s range. /MES levels are derived from the profile graphic at the bottom of this letter. Click here for the latest levels. SqueezeMetrics Dark Pool Index (DIX) and Gamma (GEX) with the latter calculated based on where the prior day’s reading falls with respect to the MAX and MIN of all occurrences available. A higher DIX is bullish. The lower the GEX, the more (expected) volatility. Click to learn the implications of volatility, direction, and moneyness. Breadth reflects a reading of the prior day’s NYSE Advance/Decline indicator. The CBOE VIX Volatility Index (INDEX: VVIX) reflects the attractiveness of owning volatility. UMBS prices via MND. Click here for the economic calendar.
Administrative
Not all doom and gloom. Make sure to read to the end!
Fundamental
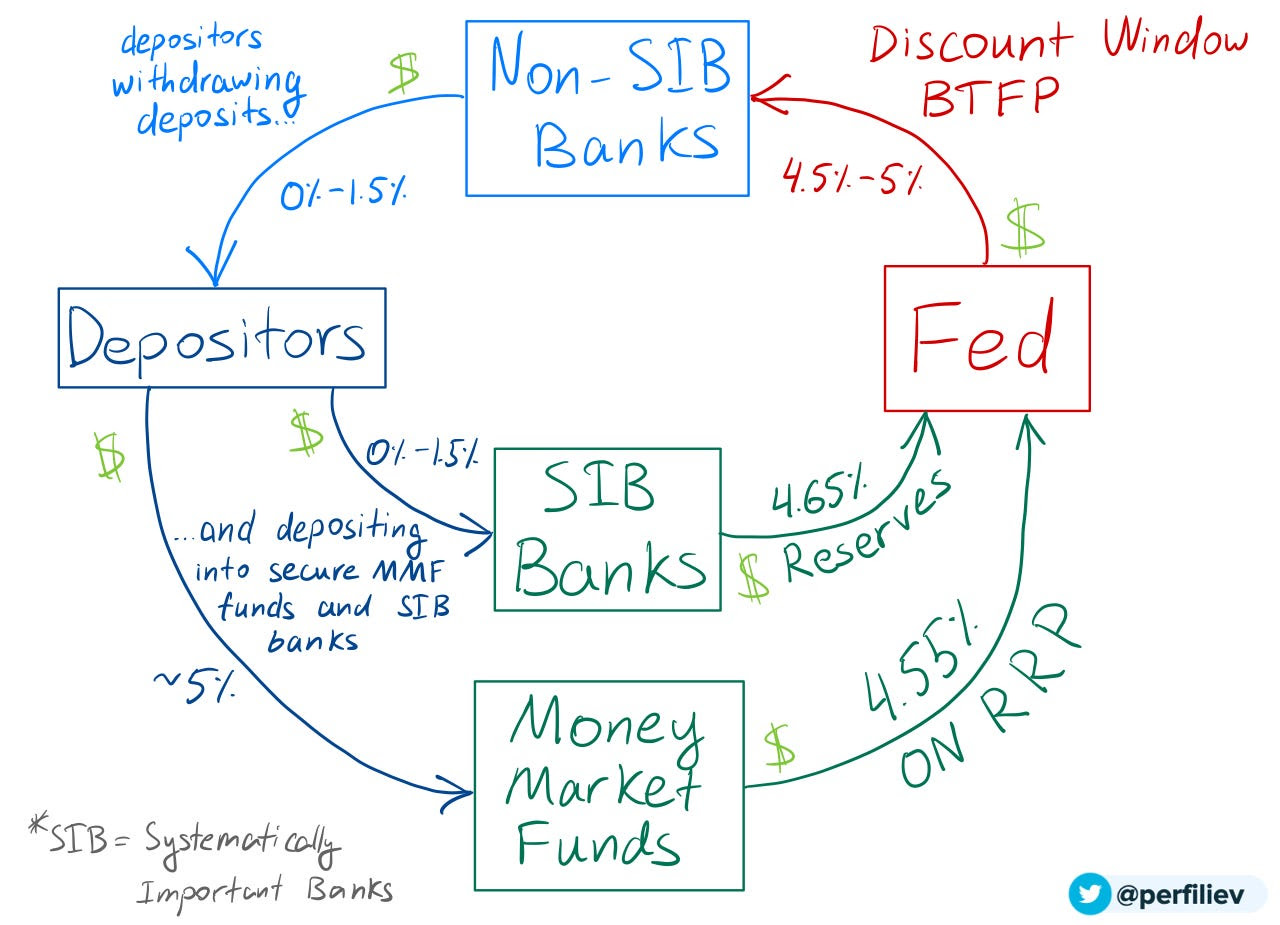
In the Daily Brief for 3/20, we summarized the financial industry and policymaker responses that would turn asset fire sales into managed, orderly asset sales.
The net result of the intervention would be a reduction in credit creation, a tightening of financial conditions, as well as a slowing of the economy and inflation while, potentially, setting “a dangerous precedent that simply encourage[s] future irresponsible behavior” (e.g., risky lending/borrowing), the House Freedom Caucus put eloquently. Basically, the fear is in policymakers underwriting the losses of prevailing carry-type strategies and setting the stage for an even bigger unwind or so-called “Minsky moment,” the “sudden crash of markets and economies that are hooked on debt,” Bloomberg reports.
"Regional banks relied on a business model that relied on uninsured deposits," says @Lazard's @porszag. "The government needs to make explicit what a lot of people are assuming: that for the foreseeable future, uninsured deposits don't exist. Everything is insured." pic.twitter.com/GgZ9ZF2f7r
A systemic credit event is among strategists’ biggest fear, indeed. A Bank of America Corporation (NYSE: BAC) survey shows a credit event happening on the heels of a US shadow banking, corporate debt, and developed-market real-estate collapse. Recall this letter writer’s conversation with Simplify Asset Management’s Michael Green who said he sees “cracks in bubbles like commercial real estate” already appearing, too.
Bloomberg adds that JPMorgan Chase & Co (NYSE: JPM) strategists think the inverted yield curve signals recession and the stocks are likely nearing their high point.
Graphic: Retrieved from Callum Thomas’ Weekly S&P 500 ChartStorm.
JPM adds that market lows won’t occur until interest rate cuts ensue.
Graphic: Retrieved from BNP Paribas ADR (OTC: BNPQY).
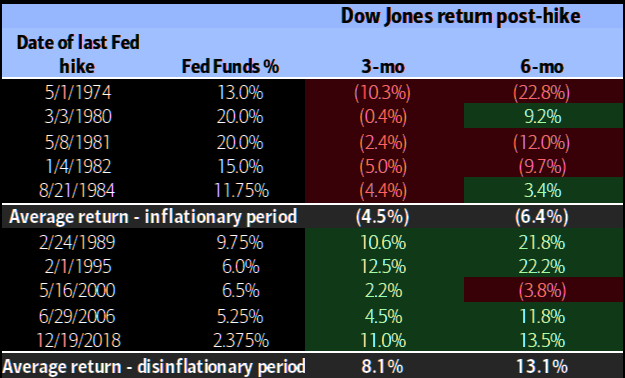
Recall 3/20’s letter citing BAC research that finds selling markets on the last Fed rate hike is a good strategy. The “Minsky moment” comment/fear has others at JPM adding that investors should sell into relief bounces.
Graphic: Retrieved from Bank of American Corporation (NYSE: BAC) via The Market Ear.
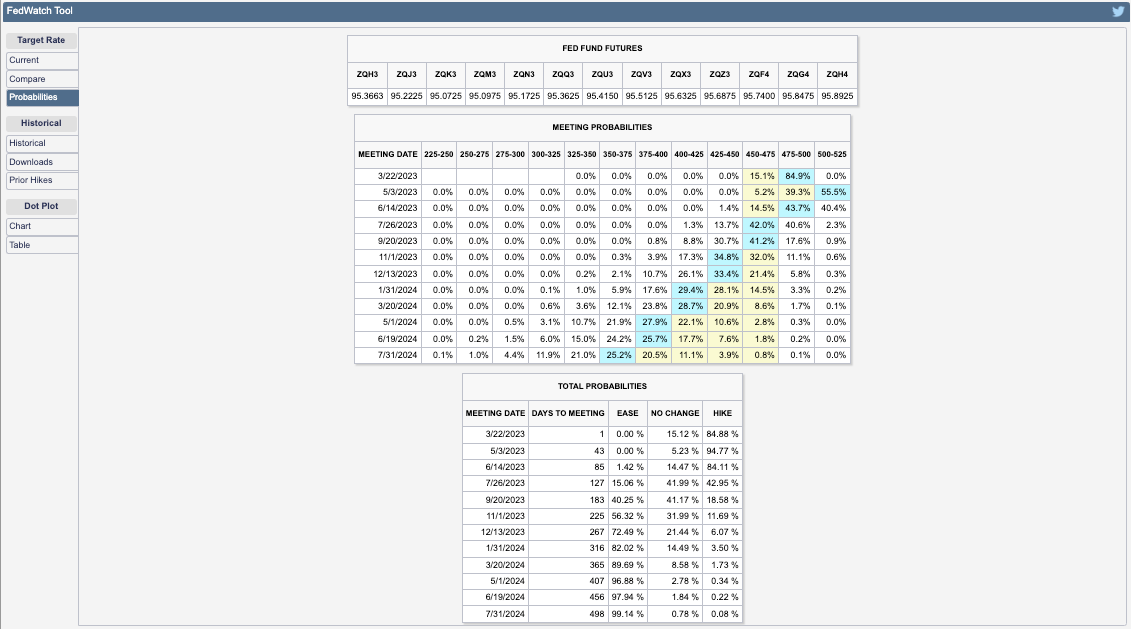
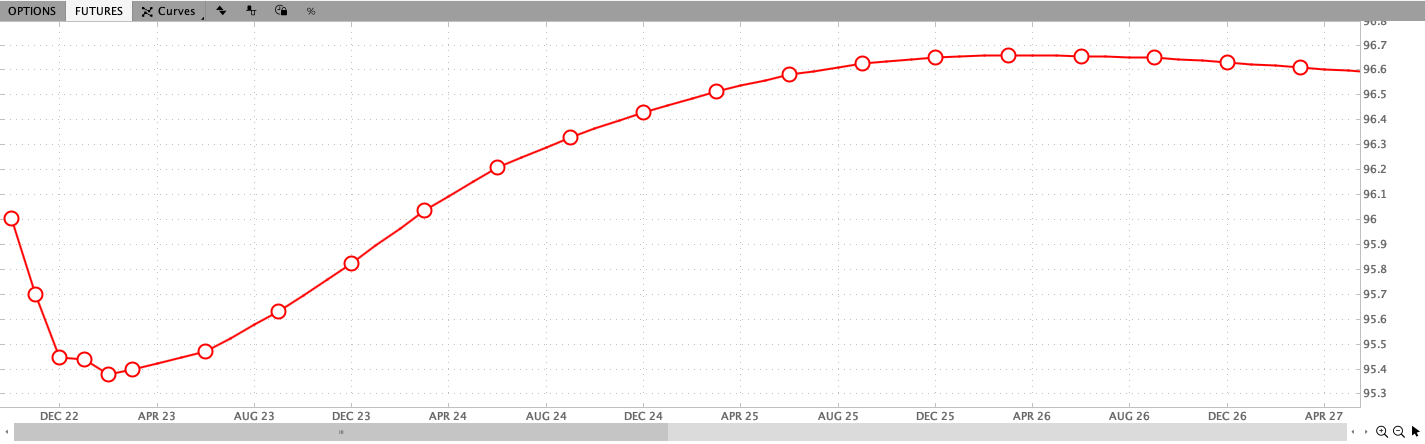
Most participants foresee rates continuing to rise by at least 25 basis points, per the CME Group Inc’s (NASDAQ: CME) FedWatch Tool. Following Wednesday’s (expected) hike, the path forward appears uncertain. Yesterday, the terminal/peak rate was at 4.75-5.00%. Today, the peak has shifted higher to 5.00-5.25%.
Graphic: Retrieved from CME Group Inc (NASDAQ: CME).
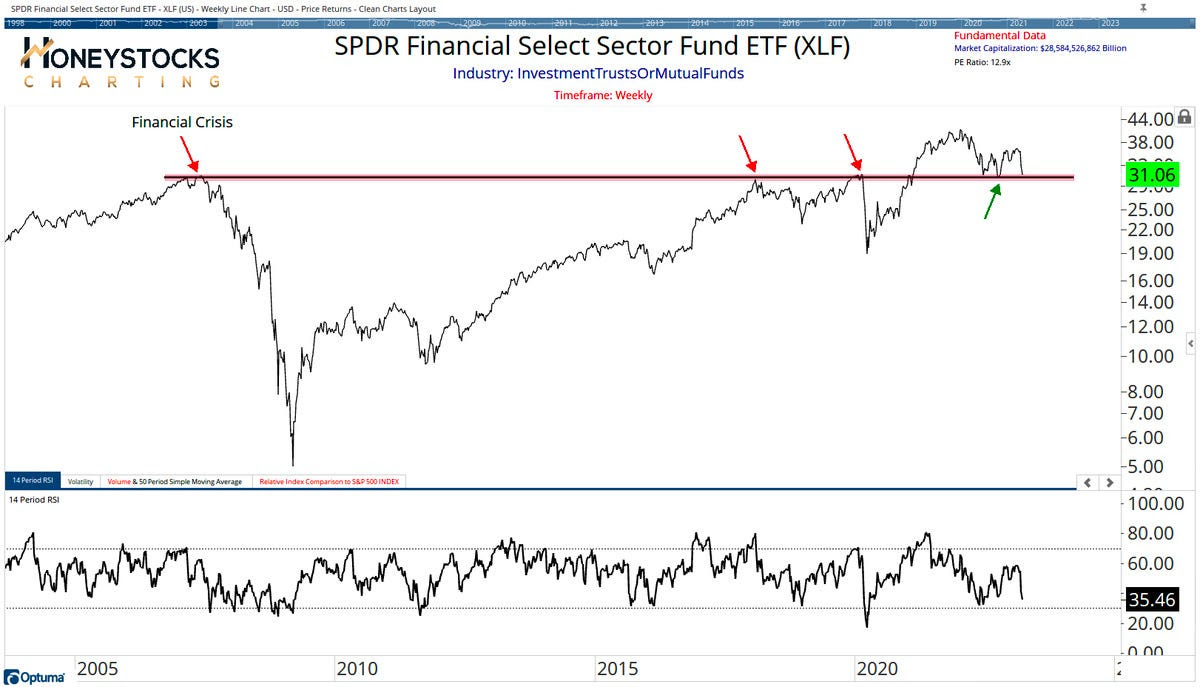
Financials look ready to fall off a cliff, to add. If they do, the whole market likely goes.
Graphic: Retrieved from Callum Thomas’ Weekly S&P 500 ChartStorm.
Positioning
We keep referring back to our Daily Briefs published last week (e.g., 3/13 and 3/14). In those letters, we talked about the growing concern about markets enduring some exogenous shocks.
We opted to take the less extreme side since policymakers’ response was likely to stem (or push into the future) turmoil. Additionally, with participants easing up on their long-equity exposure, equity markets were likely to stay contained, relative to bond markets where the lack of liquidity is an issue, some believe. Anyways, following important events including inflation updates (i.e., CPI) and derivatives expiries, short bursts of strength (particularly in some of the previously depressed products such as the Nasdaq 100 or NDX, as explained 3/17) were likely to ensue heading into the end of this month and next month. Additionally, certain rates trades via options we set forth on 3/14 were ripe for monetization, too.
Rotating into a money market or T-bill fund or box spreads, while allocating some remaining cash to leverage potential by way of some call options structures, appeared attractive. While the T-bill or box spread exposures did not budge much, call options structures as proposed on 3/14 worked (and are likely to continue to work) rather well. The monetization of the rate structures discussed on 3/14 was timely, also.
The potential for coming events including the Federal Reserve’s (Fed) interest rate decision on Wednesday 3/22 to assuage participants’ fears of slowing may, accordingly, prompt fears of missing out on the upside, Bloomberg reports. A response may be FOMO-type demand for call options exposures, coupled with CTAs further “raising their equity exposure” on trend signals and lower volatility, boosting markets into a “more combustible” state as explained on 2/17. This fear of missing out is visible in options volatility skew; traders are hedging those tail outcomes.
Technical
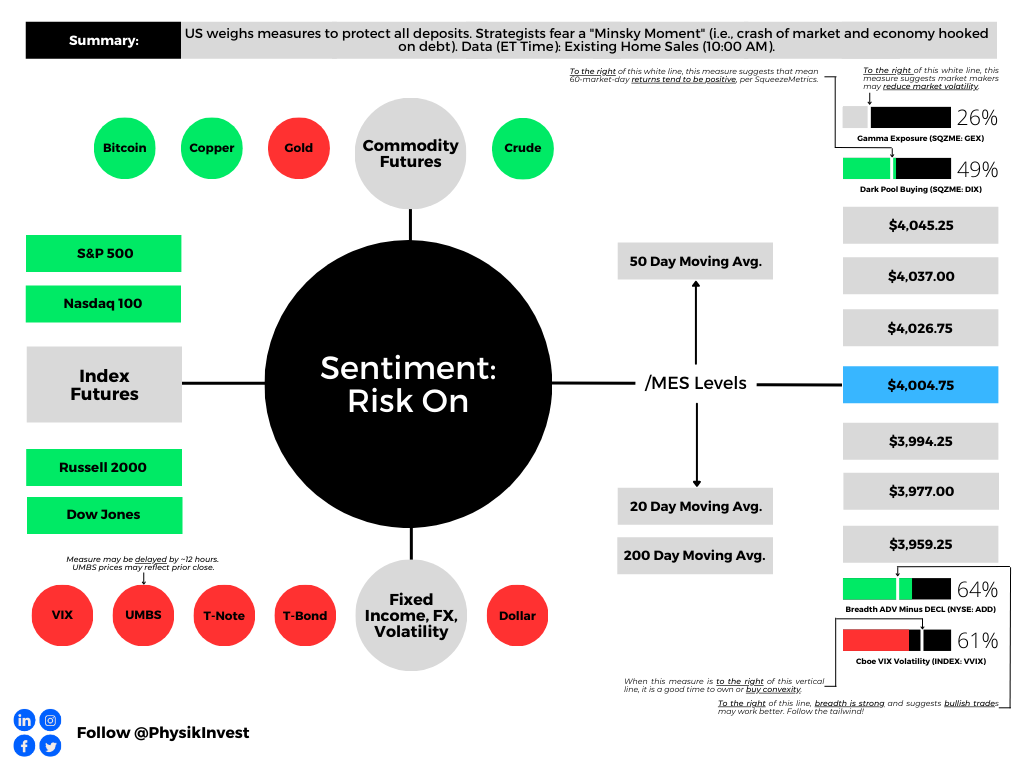
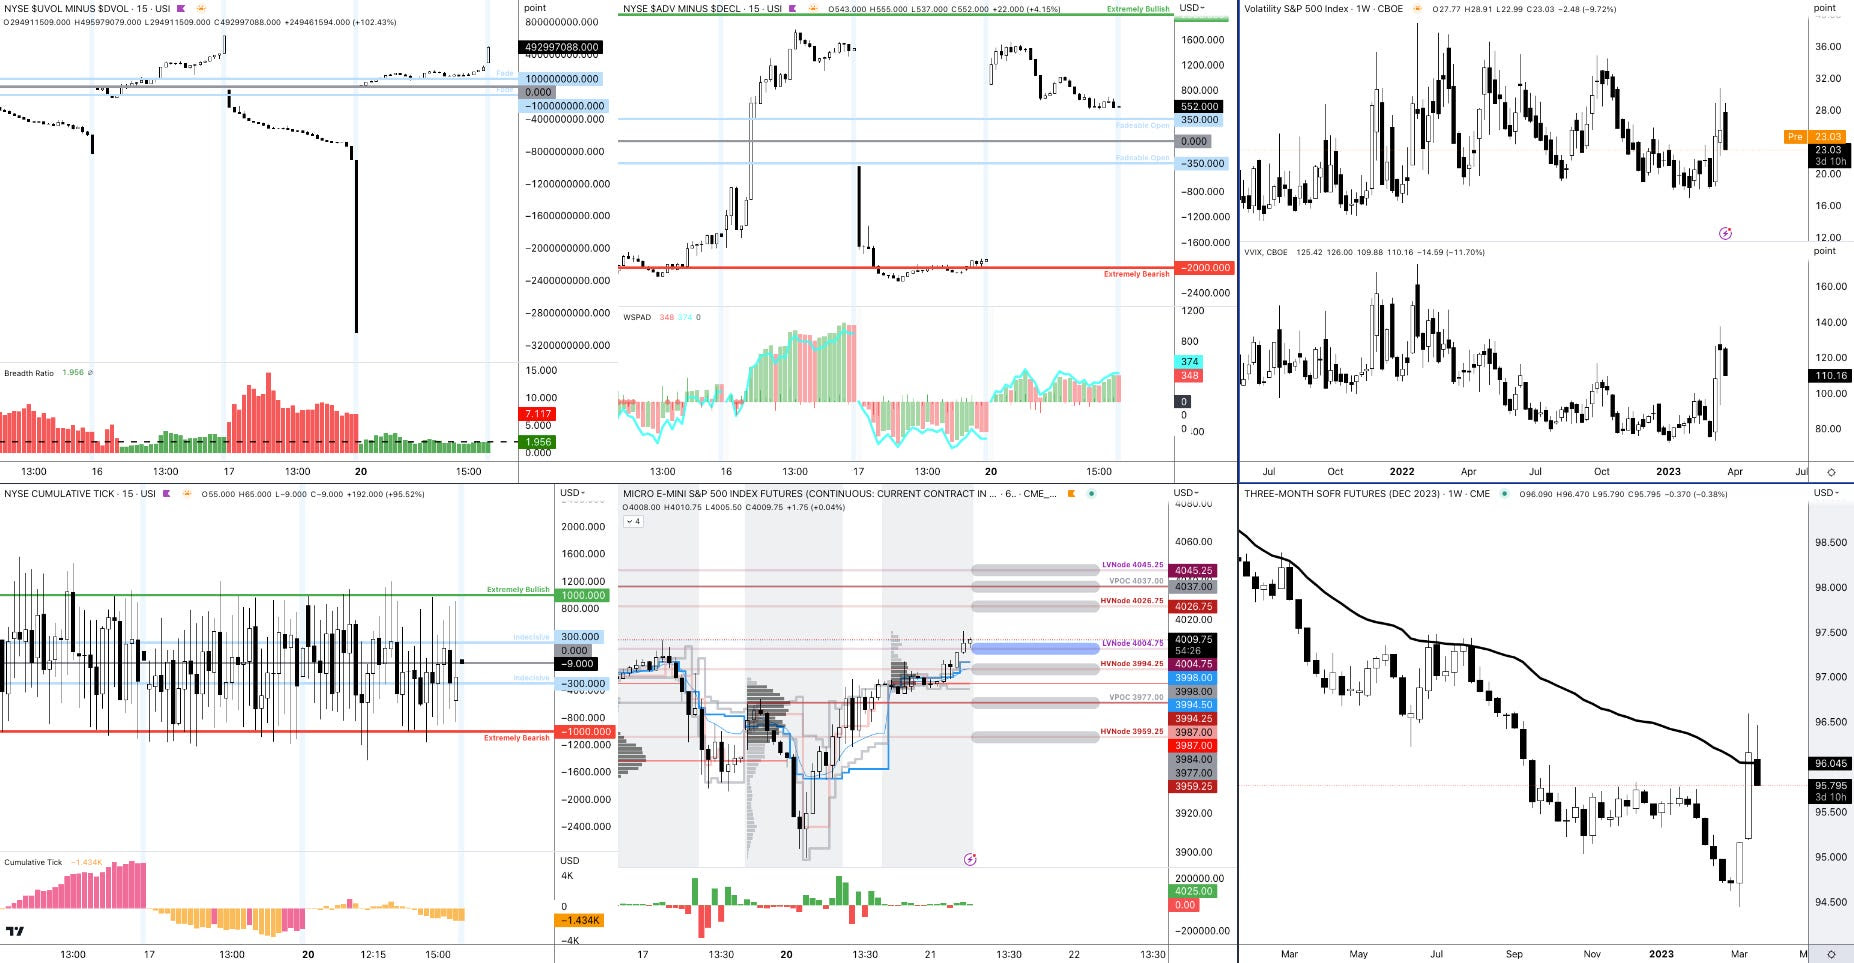
As of 7:00 AM ET, Tuesday’s regular session (9:30 AM – 4:00 PM ET), in the S&P 500, is likely to open in the upper part of a positively skewed overnight inventory, outside of the prior day’s range, suggesting a potential for immediate directional opportunity.
The S&P 500 pivot for today is $4,004.75.
Key levels to the upside include $4,026.75, $4,037.00, and $4,045.25.
Key levels to the downside include $3,994.25, $3,977.00, and $3,959.25.
Disclaimer: Click here to load the updated key levels via the web-based TradingView platform. New links are produced daily. Quoted levels likely hold barring an exogenous development.
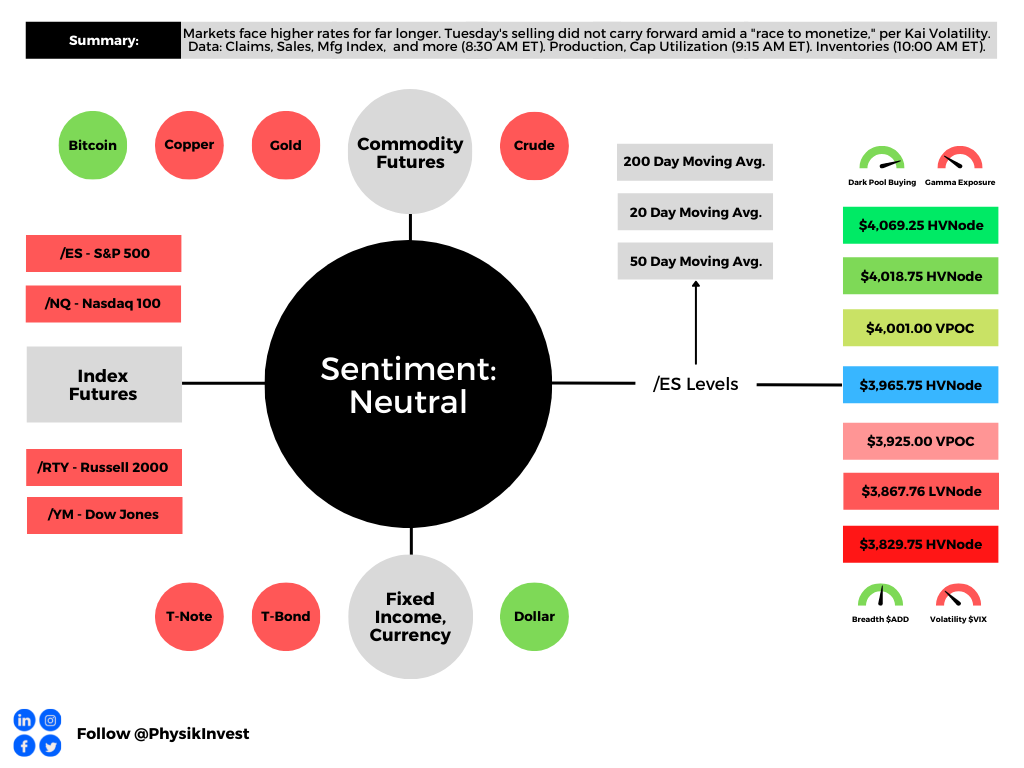
Graphic: 65-minute profile chart of the Micro E-mini S&P 500 Futures.
Definitions
Volume Areas: Markets will build on areas of high-volume (HVNodes). Should the market trend for a period of time, this will be identified by a low-volume area (LVNodes). The LVNodes denote directional conviction and ought to offer support on any test.
If participants auction and find acceptance in an area of a prior LVNode, then future discovery ought to be volatile and quick as participants look to the nearest HVNodes for more favorable entry or exit.
POCs: Areas where two-sided trade was most prevalent in a prior day session. Participants will respond to future tests of value as they offer favorable entry and exit.
Options Expiration (OPEX): Reduction in dealer Gamma exposure. There may be an increase in volatility after the removal of large options positions and associated hedging.
Volume-Weighted Average Prices (VWAPs): A metric highly regarded by chief investment officers, among other participants, for quality of trade. Additionally, liquidity algorithms are benchmarked and programmed to buy and sell around VWAPs.
About
The author, Renato Leonard Capelj, spends the bulk of his time at Physik Invest, an entity through which he invests and publishes free daily analyses to thousands of subscribers. The analyses offer him and his subscribers a way to stay on the right side of the market.
You may view this letter’s content calendar at this link.
Disclaimer
Do not construe this newsletter as advice. All content is for informational purposes. Capelj and Physik Invest manage their own capital and will not solicit others for it.
Physik Invest’s Daily Brief is read free by thousands of subscribers. Join this community to learn about the fundamental and technical drivers of markets.
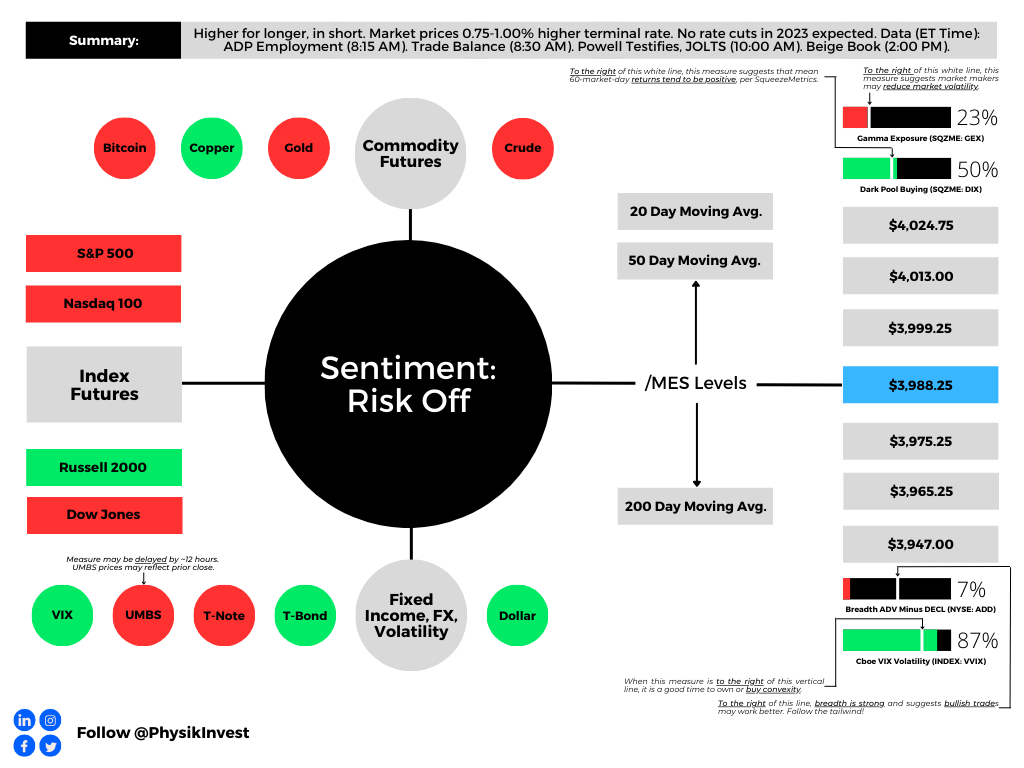
Graphic updated 8:00 AM ET. Sentiment Risk-Off if expected /MES open is below the prior day’s range. /MES levels are derived from the profile graphic at the bottom of this letter. Click here for the latest levels. SqueezeMetrics Dark Pool Index (DIX) and Gamma (GEX) with the latter calculated based on where the prior day’s reading falls with respect to the MAX and MIN of all occurrences available. A higher DIX is bullish. The lower the GEX, the more (expected) volatility. Click to learn the implications of volatility, direction, and moneyness. Breadth reflects a reading of the prior day’s NYSE Advance/Decline indicator. The CBOE VIX Volatility Index (INDEX: VVIX) reflects the attractiveness of owning volatility. UMBS prices via MND. Click here for the economic calendar.
Fundamental
Note: The write-up on the conversation with Simplify’s Mike Green and your letter writer coming soon. Your letter writer is juggling Physik Invest, Benzinga, and two weeks of jury duty! Oh, my.
Following Federal Reserve (Fed) Chair Jerome Powell’s testimony yesterday, traders shifted their outlook on the path of interest rates. The terminal rate now sits between 5.50% and 5.75%, and there are no cuts priced in 2023. Traders are also anticipating a 0.50% hike at the March meeting, up from 0.25%.
Graphic: Retrieved from CME Group Inc’s (NASDAQ: CME) FedWatch Tool. Updated 3/8/2023.
The likes of Ken Griffin, who is the founder of Citadel and Citadel Securities, said the Fed’s updates have confused investors. He advised Powell to talk less about inflation.
“Every time they take the foot off the brake, or the market perceives they’re taking their foot off the brake, and the job’s not done, they make their work even harder,” he explained. TS Lombard’s Steven Blitz added the downshifts in hikes were a mistake and the testimony was a “tacit admission.”
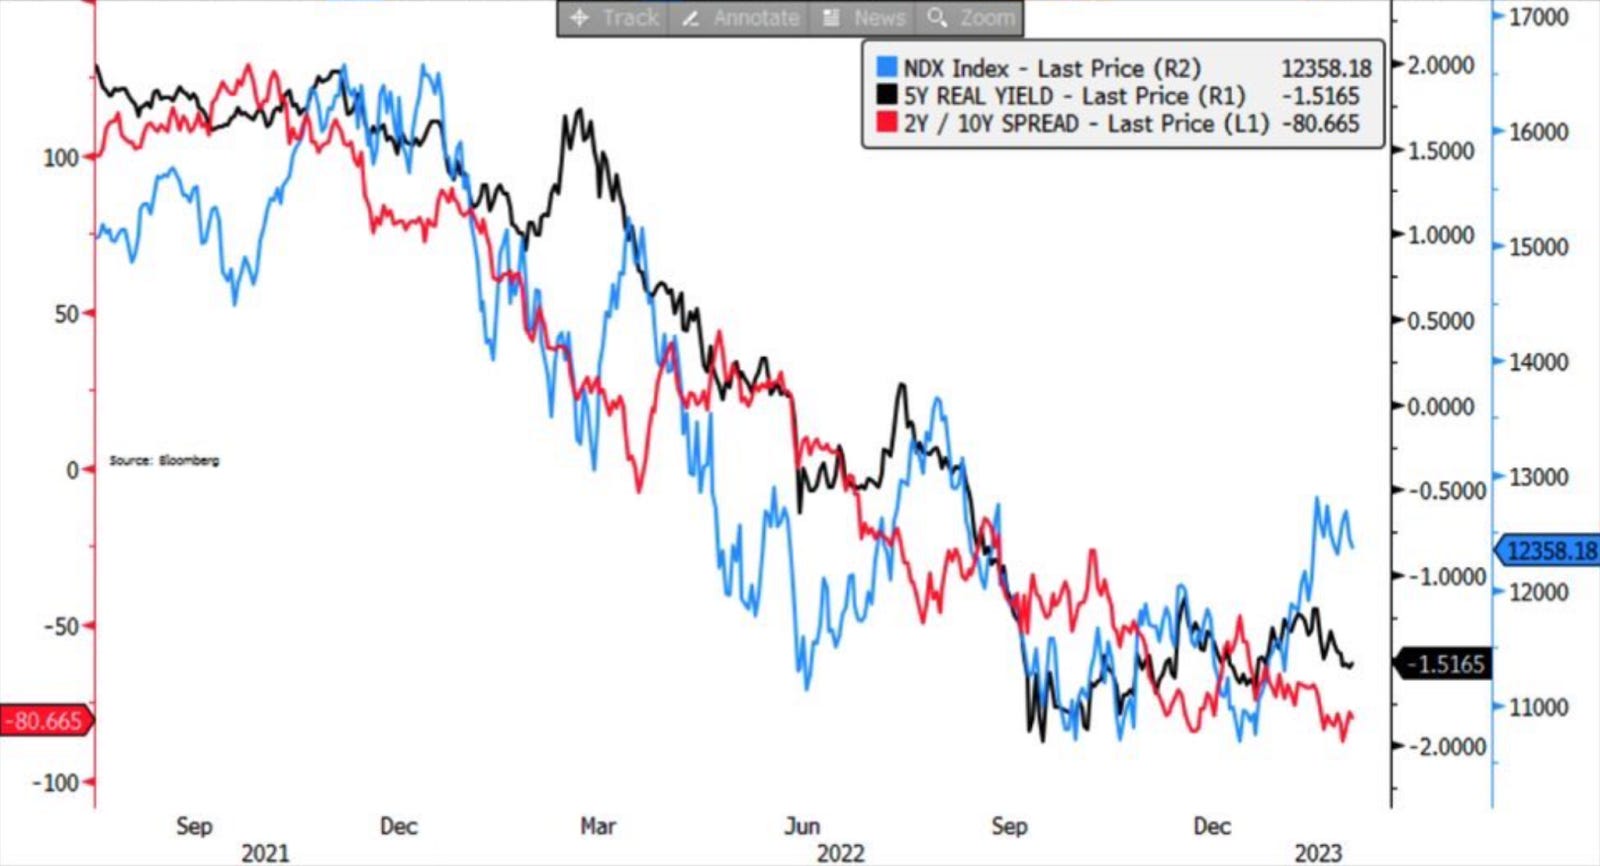
Anyways, the 2- and 10-year Treasury yield spread is at levels when the Fed’s Volcker tightened up the economy to tackle double-digit inflation. Bespoke Investment notes that after that particular spread inverted in October of 1979, the economy peaked at the end of January 1980 but the stock market remained strong.
“The next year, the S&P 500 rallied 22.9%, the Nasdaq was up 36.0%, and the Russell 2000 was up over 40.0%.”
Graphic: Retrieved from Bloomberg.
However, Bespoke adds that “back then, the S&P 500 was trading for just 7.3 times trailing earnings. Today, the S&P 500 trades at a multiple that’s two-and-a-half times that level.” Per last week’s letters, investors’ salvation may be found in less traditional portfolio constructions. That’s what Simplify Asset Management portfolio manager and strategist Mike Green said to your letter writer last week in an interview as well.
Given the unreliability of data, Green explains, and the positioning, investors can get through a lot of the uncertainty by buying a one-year bond and stepping out.
“A real decrease in the purchasing power of the dollar means stock prices should go up because they are something you’re purchasing like everything else. The problem is that would, then, require significant multiple compression as you move forward. So, corporations would be making more money, but that money would be valued less richly because of the inflation.” Conversely, we see multiple expansions, Green said in casting doubt on recent market strength. “Earnings are actually going down.”
With the S&P 500 trading upwards of 20% above the last decade’s average forward price-to-earnings, traditional rules imply the P/E likely falls, and that is supportive of Green’s doubt and support of alternative portfolio constructions layering bond and volatility (i.e., options) exposure to target a full return of principal at the least.
“Using options allows you to introduce a degree of convexity in portfolios where [you] can take risks with a limited downside because [you’ve] either protected [your] downside or simply expended a degree of premium on it.”
With deterioration in some markets “offset by a lack of inventory” and/or hesitancy to sell, the marginal impact of “one person being in distress” may eventually “set a new clearing price … chang[ing] valuations for everybody.” That’s a good place to be as the owner of options protection.
Technical
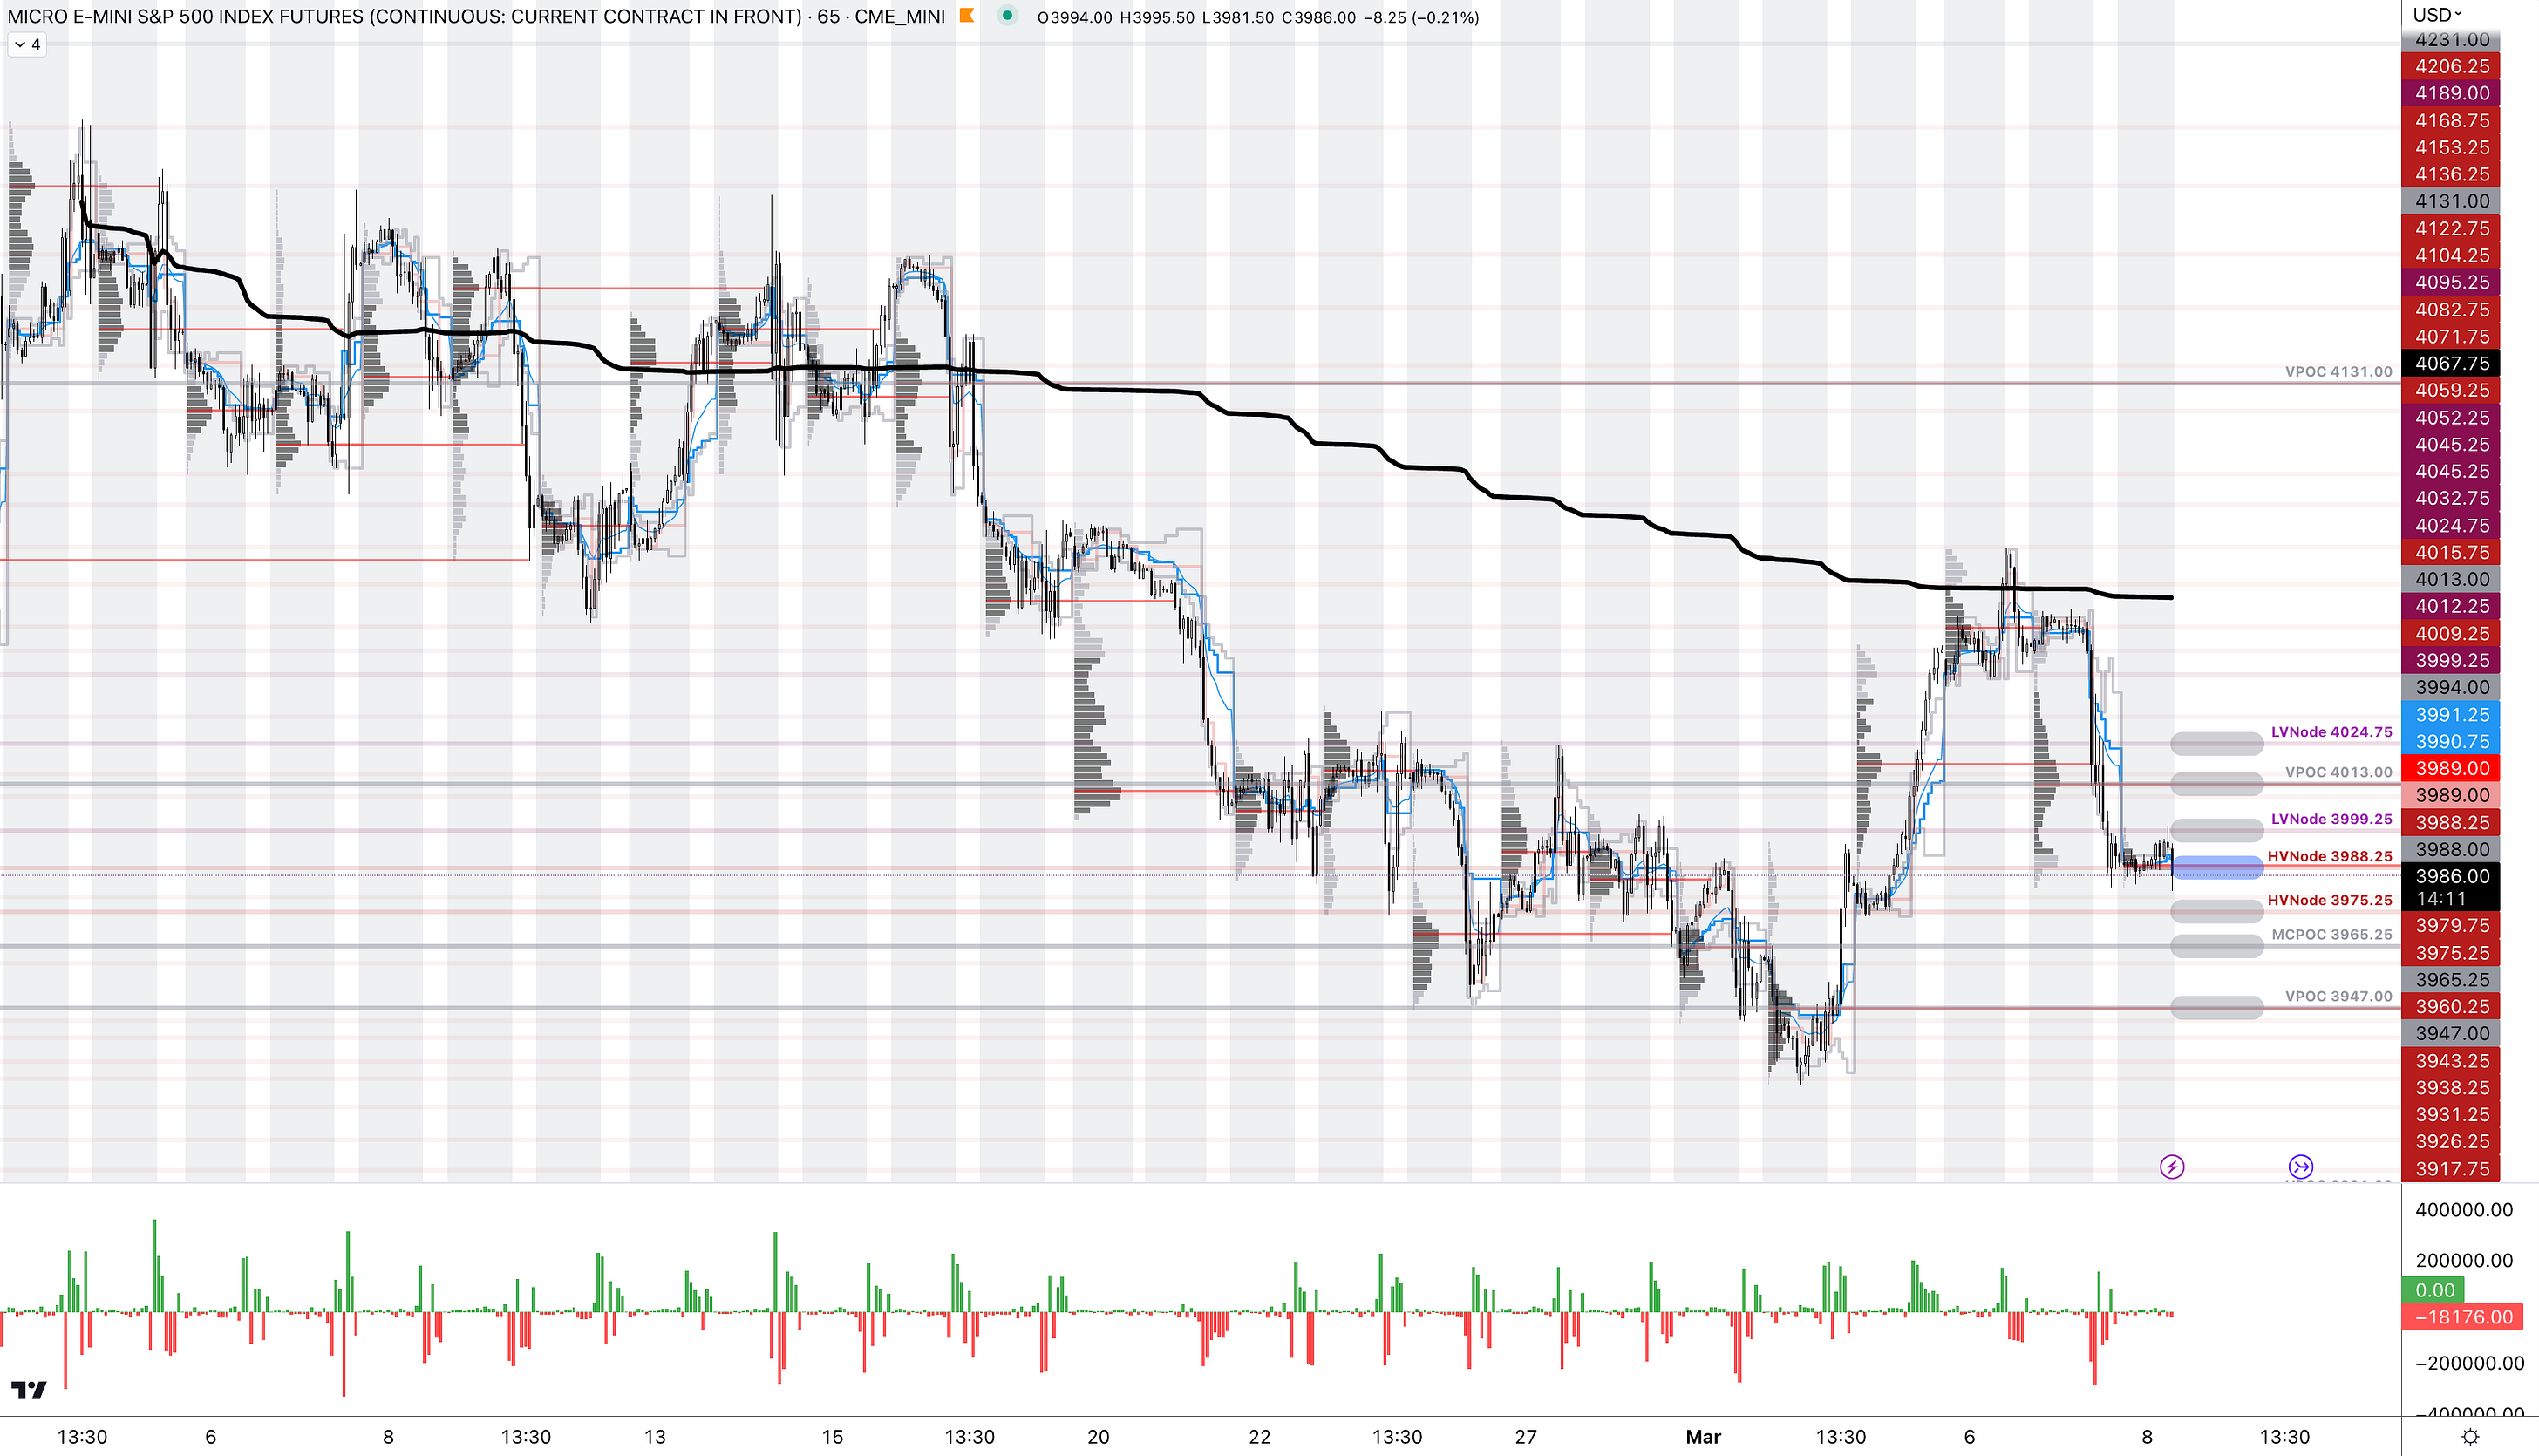
As of 7:50 AM ET, Wednesday’s regular session (9:30 AM – 4:00 PM ET), in the S&P 500, is likely to open in the lower part of a balanced overnight inventory, outside of the prior day’s range, suggesting a potential for immediate directional opportunity.
The S&P 500 pivot for today is $3,988.25.
Key levels to the upside include $3,999.25, $4,013.00, and $4,024.75.
Key levels to the downside include $3,975.25, $3,965.25, and $3,947.00.
Disclaimer: Click here to load the updated key levels via the web-based TradingView platform. New links are produced daily. Quoted levels likely hold barring an exogenous development.
Graphic: 65-minute profile chart of the Micro E-mini S&P 500 Futures.
Definitions
Volume Areas: Markets will build on areas of high-volume (HVNodes). Should the market trend for a period of time, this will be identified by a low-volume area (LVNodes). The LVNodes denote directional conviction and ought to offer support on any test.
If participants auction and find acceptance in an area of a prior LVNode, then future discovery ought to be volatile and quick as participants look to the nearest HVNodes for more favorable entry or exit.
POCs: Areas where two-sided trade was most prevalent in a prior day session. Participants will respond to future tests of value as they offer favorable entry and exit.
MCPOCs: Denote areas where two-sided trade was most prevalent over numerous sessions. Participants will respond to future tests of value as they offer favorable entry and exit.
About
The author, Renato Leonard Capelj, spends the bulk of his time at Physik Invest, an entity through which he invests and publishes free daily analyses to thousands of subscribers. The analyses offer him and his subscribers a way to stay on the right side of the market.
You may view this letter’s content calendar at this link.
Disclaimer
Do not construe this newsletter as advice. All content is for informational purposes. Capelj and Physik Invest manage their own capital and will not solicit others for it.
Physik Invest’s Daily Brief is read free by thousands of subscribers. Join this community to learn about the fundamental and technical drivers of markets.
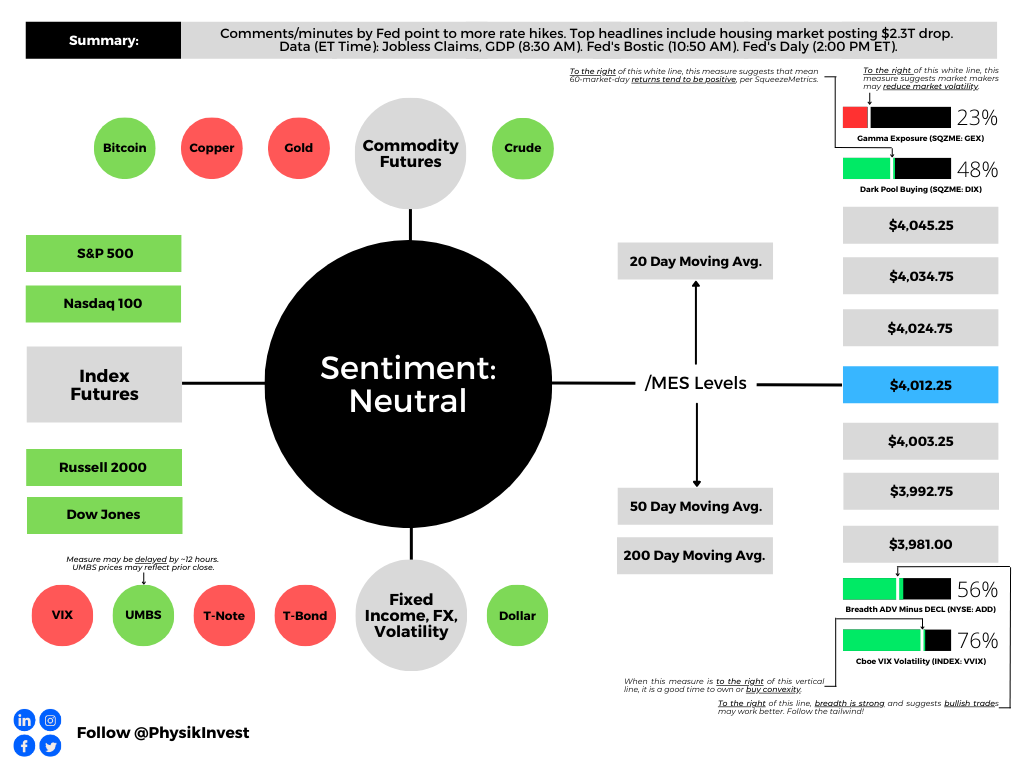
Graphic updated 6:30 AM ET. Sentiment Neutral if expected /MES open is inside of the prior day’s range. /MES levels are derived from the profile graphic at the bottom of this letter. Click here for the latest levels. SqueezeMetrics Dark Pool Index (DIX) and Gamma (GEX) with the latter calculated based on where the prior day’s reading falls with respect to the MAX and MIN of all occurrences available. A higher DIX is bullish. The lower the GEX, the more (expected) volatility. Click to learn the implications of volatility, direction, and moneyness. Breadth reflects a reading of the prior day’s NYSE Advance/Decline indicator. The CBOE VIX Volatility Index (INDEX: VVIX) reflects the attractiveness of owning volatility. UMBS prices via MND. Click here for the economic calendar.
Fundamental
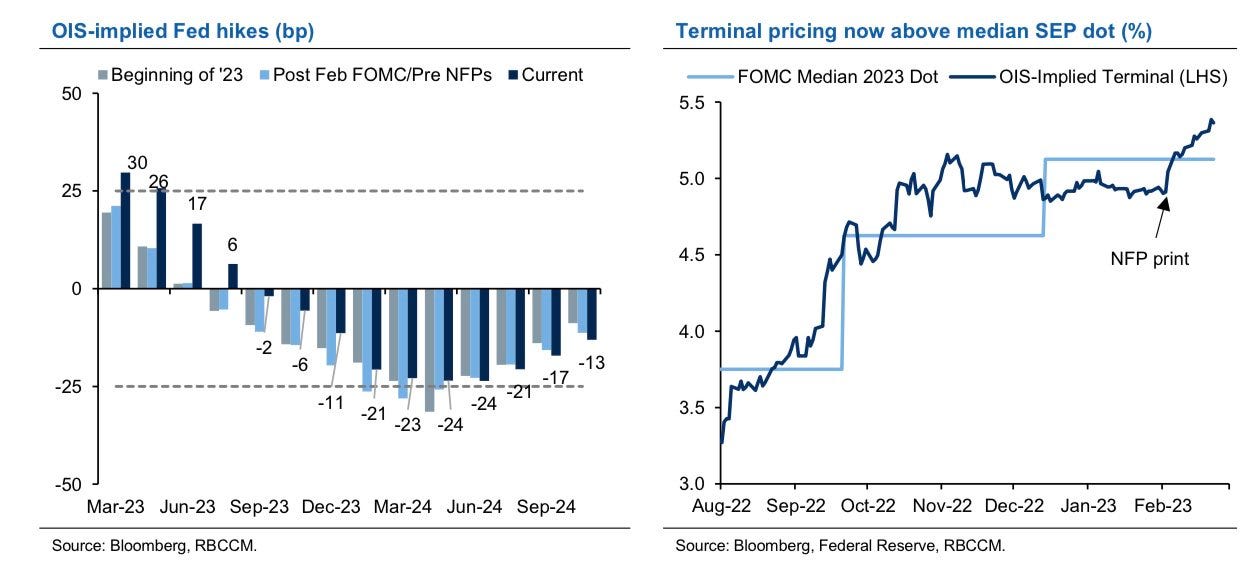
Bloomberg’s John Authers summarized well the release of the Federal Open Market Committee (FOMC) meeting minutes. He said that almost all officials “supported a step down in the pace of tightening by 25 basis points, while a ‘few’ favored or could have supported a bigger 50 basis-point hike. Nobody wanted to stop straightaway.”
“Participants observed that a restrictive policy stance would need to be maintained until the incoming data provided confidence that inflation was on a sustained downward path to 2%, which was likely to take some time,” the minutes said.
Graphic: Retrieved from Royal Bank of Canada (NYSE: RY).
Notwithstanding hits to markets like housing, which news has concentrated on, the S&P 500 (INDEX: SPX) is trading about 18x forward price-to-earnings, Bank of America Corporation (NYSE: BAC) said, the highest since March 2022 and 20% above the last decade’s average P/E.
Graphic: Retrieved from Bloomberg.
Per Savita Subramanian, “the traditional Rule of 20 … holds that the multiple should be whatever number results by subtracting the inflation rate from 20 — which with inflation at 6.4% would imply that the P/E needs to fall to 13.6.”
Graphic: Retrieved from Bank of America Corporation (NYSE: BAC) via Bloomberg.
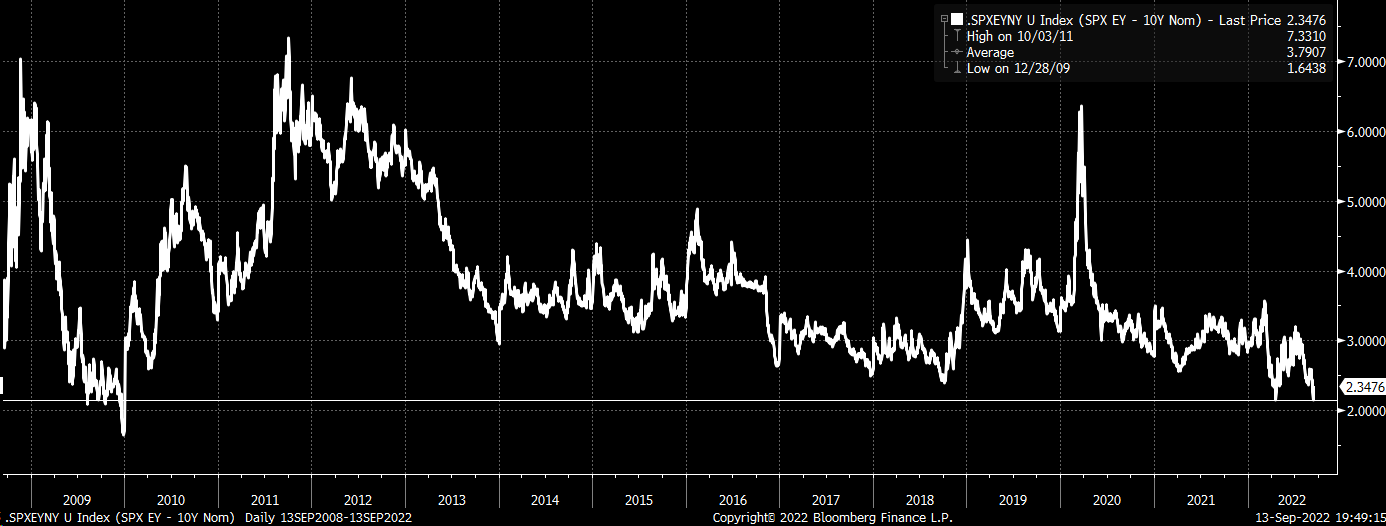
Recall yesterday’s letter discussing the “risk-reward of holding bonds [looking] betterthan equity (earnings yield).”
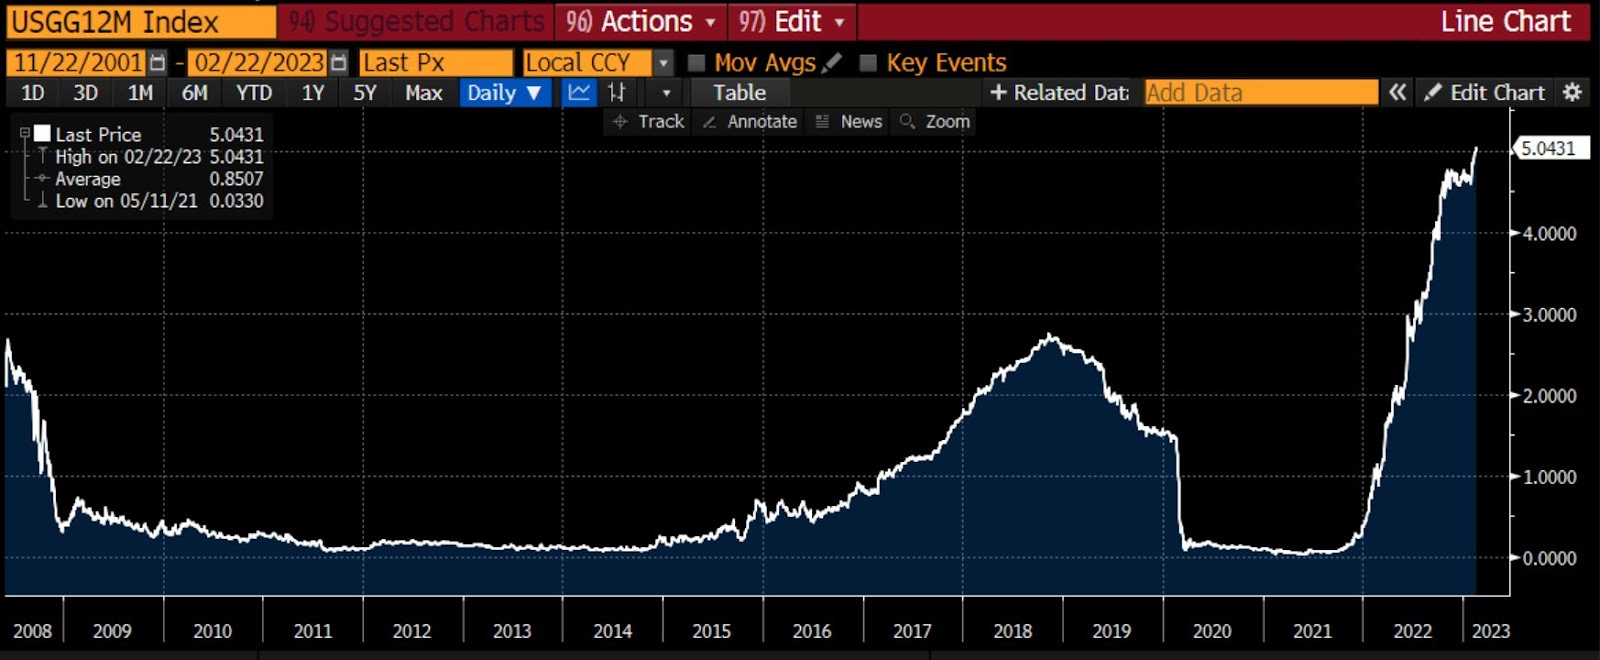
Graphic: Retrieved from Bloomberg’s Lisa Abramowicz. “Yields on 12-month T-bills have risen to their highest since 2001. Most of this has to do with Fed rate hike expectations.”
Positioning
The SPX’s decline is orderly and contained.
However, the break below $4,000.00 SPX did open the door to a “liquidity hole,” SpotGamma explained. New information has traders anticipating more equity market downside; traders are “reset[ing] to lower equity valuations” on the higher-for-longer rate narrative all the while “vanna and gamma hedging serve to pull markets lower.”
The contexts for a far-reaching rally are weak. A change in the context is likely to coincide with charged options values (i.e., wound implied volatility or big put delta).
Technical
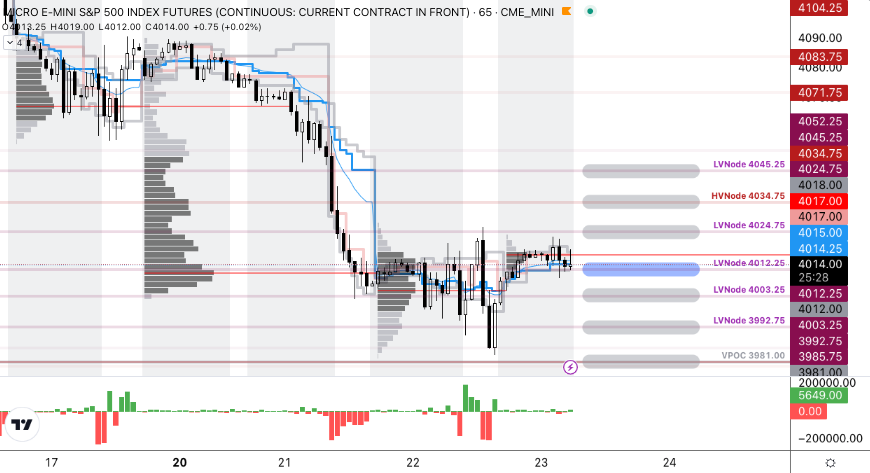
As of 6:30 AM ET, Thursday’s regular session (9:30 AM – 4:00 PM ET), in the S&P 500, is likely to open in the middle part of a positively skewed overnight inventory, inside of the prior day’s range, suggesting a limited potential for immediate directional opportunity.
The S&P 500 (FUTURE: /MES) pivot for today is $4,012.25.
Key levels to the upside include $4,024.75, $4,034.75, and $4,045.25.
Key levels to the downside include $4,003.25, $3,992.75, and $3,981.00.
Disclaimer: Click here to load the updated key levels via the web-based TradingView platform. New links are produced daily. Quoted levels likely hold barring an exogenous development.
Graphic: 65-minute profile chart of the Micro E-mini S&P 500 Futures.
Definitions
Volume Areas: Markets will build on areas of high-volume (HVNodes). Should the market trend for a period of time, this will be identified by a low-volume area (LVNodes). The LVNodes denote directional conviction and ought to offer support on any test.
If participants auction and find acceptance in an area of a prior LVNode, then future discovery ought to be volatile and quick as participants look to the nearest HVNodes for more favorable entry or exit.
Delta: An option’s exposure to the direction or underlying asset movement.
Gamma: The sensitivity of an option’s delta to changes in the underlying asset’s price.
Vanna: The rate at which the delta of an option changes with respect to implied volatility.
POCs: Areas where two-sided trade was most prevalent in a prior day session. Participants will respond to future tests of value as they offer favorable entry and exit.
About
The author, Renato Leonard Capelj, works in finance and journalism.
Capelj spends the bulk of his time at Physik Invest, an entity through which he invests and publishes free daily analyses to thousands of subscribers. The analyses offer him and his subscribers a way to stay on the right side of the market. Separately, Capelj is an options analyst at SpotGamma and an accredited journalist.
You may view this letter’s content calendar at this link.
Disclaimer
Do not construe this newsletter as advice. All content is for informational purposes. Capelj and Physik Invest manage their own capital and will not solicit others for it.
The daily brief is a free glimpse into the prevailing fundamental and technical drivers of U.S. equity market products. Join the 980+ that read this report daily, below!
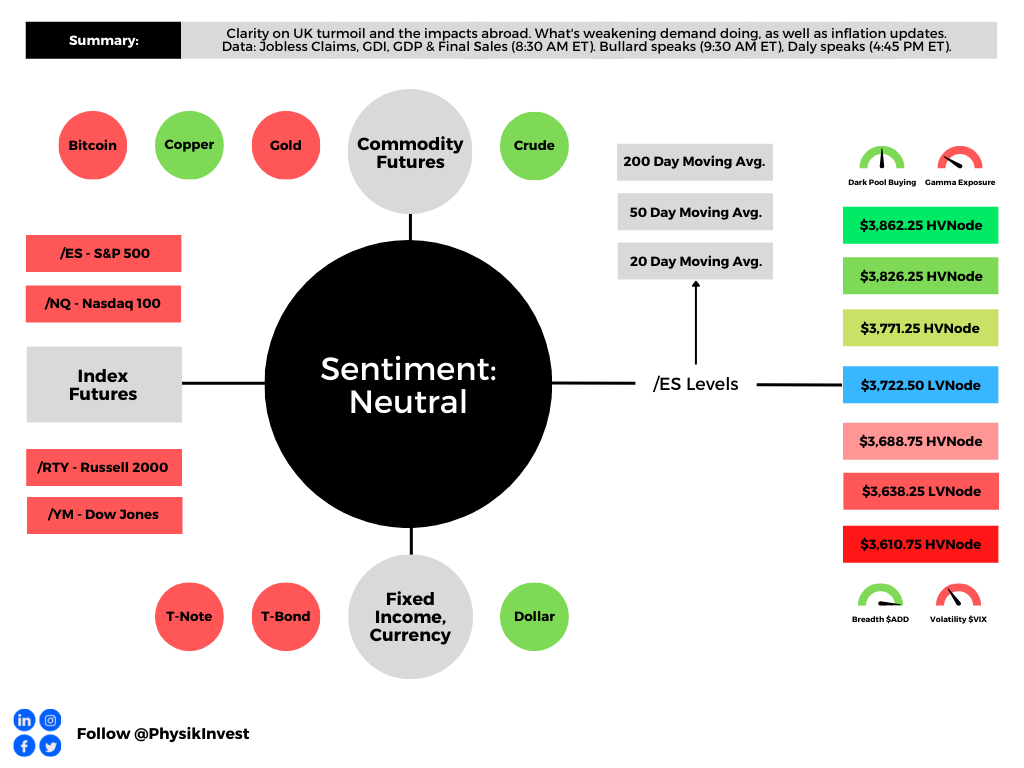
Graphic updated 8:40 AM ET. Sentiment Neutral if expected /ES open is inside of the prior day’s range. /ES levels are derived from the profile graphic at the bottom of the following section. Levels may have changed since initially quoted; click here for the latest levels. SqueezeMetrics Dark Pool Index (DIX) and Gamma (GEX) calculations are based on where the prior day’s reading falls with respect to the MAX and MIN of all occurrences available. A higher DIX is bullish. At the same time, the lower the GEX, the more (expected) volatility. Learn the implications of volatility, direction, and moneyness. Breadth reflects a reading of the prior day’s NYSE Advance/Decline indicator. VIX reflects a current reading of the CBOE Volatility Index (INDEX: VIX) from 0-100.
Fundamental
More clarity surfaces on the turmoil overseas. After announcements regarding new fiscal policy that would feature steep tax cuts, the prices of longer-dated British bonds fell, prior to the Bank of England (BoE) announcing the purchase of longer-dated bonds to restore stability.
Here’s why the BoE did what it did:
In short, market volatility prompted reflexive feedback responses.
British pensions are required to match assets to liabilities “to ensure that promises to pensioners could be honored,” Bloomberg explained. This prompted purchases of long-dated bonds in size. Essentially, pensions would “enter into swap contracts, using [long-dated bonds] as collateral.”
That’s because “swaps give[] the pension scheme far more capital to assign to those more interesting asset classes with high potential returns rather than having it tied up in boring gilts.”
“If the bet turned out wrong, [pensions would] have to pay something to the counterparty. And, if the collateral suddenly and unprecedentedly took a massive fall, the counterparty would face a margin call.”
In size, these “margin calls had turned into a cascade,” forcing pensions to sell into weakness.
Talk of fund insolvencies and the effects of that on the economy, executives running day-to-day operations, not the BoE’s Monetary Policy Committee (MPC), implemented quantitative easing (QE), essentially, buying bonds and pushing their yields lower to ease market volatility.
In stories that followed, a London-based banker discussed his worry that the situation came close to looking like “a Lehman moment.” Cardano Investment executive Kerrin Rosenberg also said “if there was no intervention [], yields could have gone up to 7-8% from 4.5% [] and, in that situation, around 90 per cent of UK pension funds would have run out of collateral.”
In light of the “madness,” the UK’s Simon Hoare said that actions must be taken at the Treasury and government levels.
Adding, though volatility eased everywhere (e.g., mortgage rates), including in the US markets, the damages are not contained, some explain.
UK investors will often “buy overseas assets and hedge away the currency risk,” Jim Leaviss of Bond Vigilantes explained. Amid all the volatility, “if you had bought a dollar bond and hedged it, the dollars that you have effectively sold ‘short’ against sterling as the hedge have rallied, and the counterparty to the FX hedge will call for a collateral payment.”
“Whilst most funds will hold some cash and extremely liquid government bonds against such moves, the size of the recent turmoil probably means that many investors will be having to liquidate credit and other less liquid assets in order to meet these collateral calls.”
Therefore, the aforementioned technical factors have a bearing on the direction of bonds and yields “over coming months.”
Elsewhere, in China, in alignment with a request for state banks to stock up for FX intervention, the “PBOC hit CNH in illiquid hours to have maximum impact,” as “the trouble the PBOC faces is similar to that of Japan – when domestic conditions call for easy policy (vs. US).”
Bob Elliot of Unlimited Funds adds “the moves are likely to be paired with more announcements of macroprudential strategies to slow depreciation. While they will make headlines, most have proven to be reactive and modest in their impact.”
Therefore, “[g]iven weak domestic conditions, the PBOC is very unlikely to prioritize FX over domestic easing – the diff[erence] to the US will only get worse.”
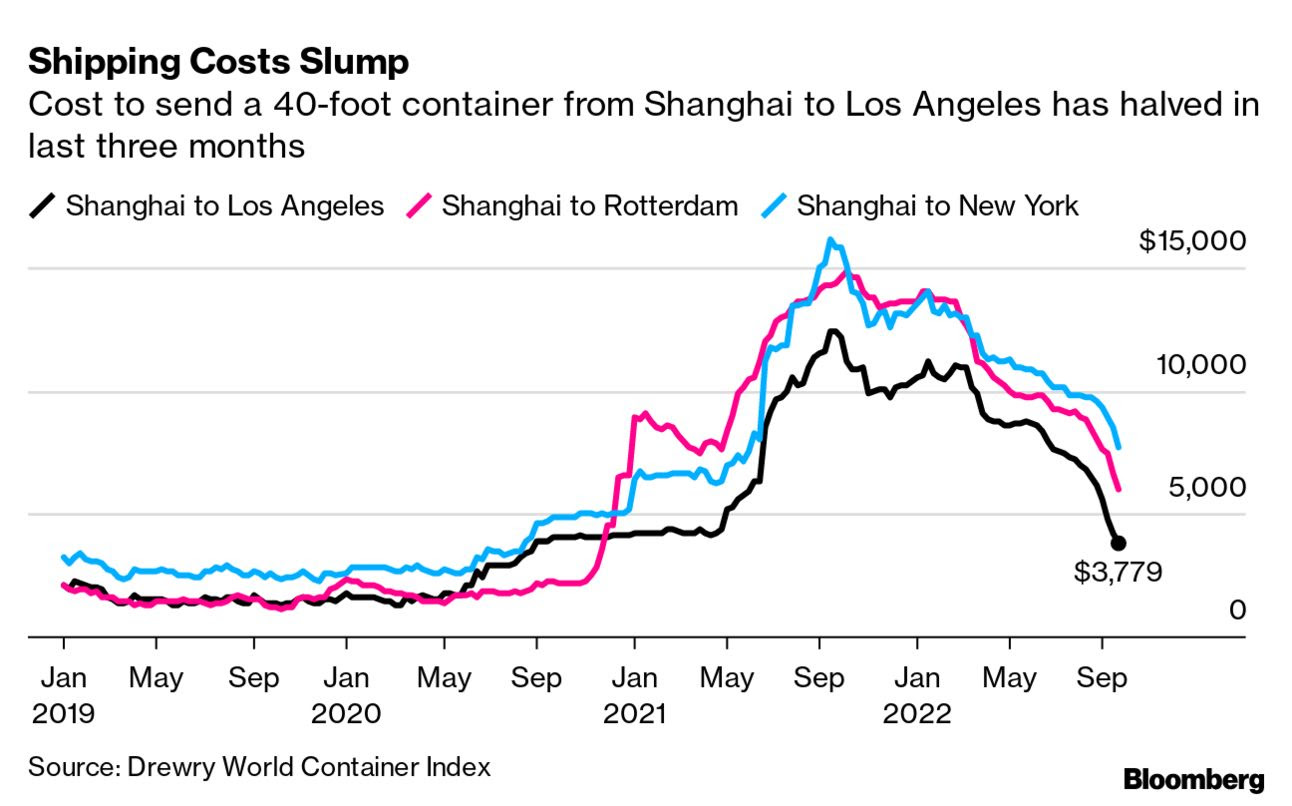
Graphic: Retrieved from Bloomberg. “Overseas demand for goods from China is weakening as the global economy slows … [and] soaring inflation [among] other headwinds elsewhere suppress global demand.” Accordingly, the “cost of shipping goods from China has slumped to the lowest level in more than two years as the world economy stumbles,” just as the US seeks to build more “resilient supply chains” elsewhere.
Positioning
Measures of implied volatility (IVOL) recorded decreases, yesterday, as traders supplied to the market protection, largely, at the front-end where “options are far more sensitive to changes in IVOL and direction,” as SpotGamma put.
“As IVOL declines and the S&P rises, the probability of those options paying out falls. This is reflected by their exposure to direction (or Delta) dropping, also. To re-hedge decreased exposure to Delta, liquidity providers may provide the market with a boost.”
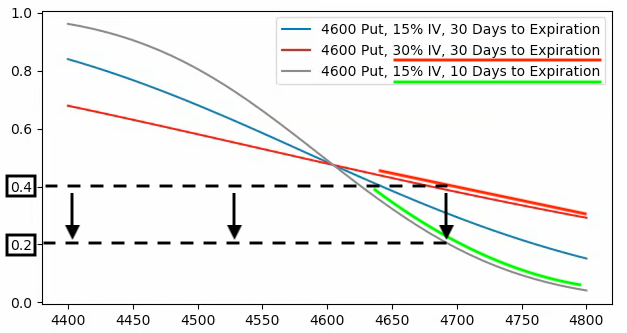
Graphic: Retrieved from SpotGamma. SPX prices X-axis. Option delta Y-axis. When the factors of implied volatility (Vanna) and time change (Charm), hedging ratios change. The graphic is for illustrational purposes, only.
As stated yesterday, in the very near term, the risks are skewed to the upside.
“For pumped-up options far from the money to retain their value, there essentially needs to be an adverse move (in price and volatility). Should nothing bad happen, the probability of these options paying out will fade, as will their exposure to direction (or Delta).”
Over a longer-term, however, weakness may persist into October amid impacts of quantitative tightening (QT) which is manifesting itself as “$4.5 billion less in demand for assets per day,” as well as the blackout period for buybacks (which were consistently “supporting the market”) and options repositioning bolstering the weakness.
Graphic: Via Physik Invest. Data compiled by @jkonopas623. Fed Balance Sheet data, here. Treasury General Account Data, here. Reverse Repo data, here. NL = BS – TGA – RRP.
Technical
As of 8:30 AM ET, Thursday’s regular session (9:30 AM – 4:00 PM ET), in the S&P 500, is likely to open in the lower part of a negatively skewed overnight inventory, inside of prior-range and -value, suggesting a limited potential for immediate directional opportunity.
In the best case, the S&P 500 trades higher.
Any activity above the $3,722.50 LVNode puts into play the $3,771.25 HVNode. Initiative trade beyond the $3,771.25 could reach as high as the $3,826.25 and $3,862.25 HVNode, or higher.
In the worst case, the S&P 500 trades lower.
Any activity below the $3,722.50 LVNode puts into play the $3,688.75 HVNode. Initiative trade beyond the HVNode could reach as low as the $3,638.25 LVNode and $3,610.75 HVnode, or lower.
Click here to load today’s key levels into the web-based TradingView charting platform. Note that all levels are derived using the 65-minute timeframe. New links are produced, daily.
Graphic: 65-minute profile chart of the Micro E-mini S&P 500 Futures.
Definitions
Volume Areas: A structurally sound market will build on areas of high volume (HVNodes). Should the market trend for long periods of time, it will lack sound structure, identified as low volume areas (LVNodes). LVNodes denote directional conviction and ought to offer support on any test.
If participants were to auction and find acceptance into areas of prior low volume (LVNodes), then future discovery ought to be volatile and quick as participants look to HVNodes for favorable entry or exit.
About
After years of self-education, strategy development, mentorship, and trial-and-error, Renato Leonard Capelj began trading full-time and founded Physik Invest to detail his methods, research, and performance in the markets.
Capelj also develops insights around impactful options market dynamics at SpotGamma and is a Benzinga reporter.
In no way should the materials herein be construed as advice. Derivatives carry a substantial risk of loss. All content is for informational purposes only.
The daily brief is a free glimpse into the prevailing fundamental and technical drivers of U.S. equity market products. Join the 900+ that read this report daily, below!
Graphic updated 6:20 AM ET. Sentiment Neutral if expected /ES open is inside of the prior day’s range. /ES levels are derived from the profile graphic at the bottom of the following section. Levels may have changed since initially quoted; click here for the latest levels. SqueezeMetrics Dark Pool Index (DIX) and Gamma (GEX) calculations are based on where the prior day’s reading falls with respect to the MAX and MIN of all occurrences available. A higher DIX is bullish. At the same time, the lower the GEX, the more (expected) volatility. Learn the implications of volatility, direction, and moneyness. Breadth reflects a reading of the prior day’s NYSE Advance/Decline indicator. VIX reflects a current reading of the CBOE Volatility Index (INDEX: VIX) from 0-100.
Fundamental
A hot topic over the past sessions is speculation on the Federal Reserve’s (Fed) next steps and the impact those steps may have.
Further, in the news, last night, aside from the prospects of another big hike, was “the biggest annual increase since 1994” in two-year Treasury yields. That’s in part due to recent upside surprises in inflation talked about yesterday and last week.
Graphic: Retrieved from Bloomberg. US Government Bonds 2 YR Yield and Fed Funds.
Per the CME Group Inc’s (NASDAQ: CME) FedWatch Tool, there’s a near-80% chance of a 50 to 75 basis point bump to the target rate, as the Fed looks to stem inflation.
Graphic: Retrieved from CME Group Inc (NASDAQ: CME).
This is all the while the Fed will let their Treasuries mature and, “instead of using the proceeds to buy another Treasury,” they will “buy nothing and reduce their balance sheet,” explained the Damped Spring’s Andy Constan.
Accordingly, “to pay that bond off, the US Treasury has to issue a bond,” and this bond will need to be “bought by the private sector” which has “to sell something to buy the bond, and that starts at the riskiest asset,” like crypto, watches, and cars, for instance.
Let’s unpack this further, below.
The transmission mechanism of quantitative easing (QE) and tightening (QT) is very weak “to economic activity but very strong to financial markets.”
In a detailed explainer, initially quoted in the September 16 letter, we learned “QE creates new reserves on bank balance sheets. The added cushion gives banks … more room to lend or to finance trading activity by hedge funds, … further enhancing market liquidity.”
Therefore, QE (QT) will mildly inflate (deflate) the economy as asset owners are pushed further out (in) on the risk curve. In practice, with QE, owners get pushed from Treasury to corporate bonds, bonds to equities, equities to crypto, and, finally, homes, watches, cars, and beyond.
With QT, as put forth, earlier, the reverse happens.
As Joseph Wang, author of Central Banking 101, said, in short, with QT “consumers have less wealth to spend” and this means that drops in financial markets and the tightening of “financial conditions impact the real economy,” negatively, albeit not as harshly as a rise in interest rates.
Unpacking further, with the Treasury set to increase issuance, thus boosting the government’s checking account, or Treasury General Account (TGA), “the level of reserves in the banking system declines, or the level of RRP could also decline,” Wang added.
This is as all of the above are liabilities to the Fed. Therefore, money comes out of the economy, via a fall in reserves, and this is put into the government’s checking account (TGA boost).
The linked reduction in bank deposits and reserves bolsters “repurchase agreement rates and borrowing benchmarks linked to them,” per Bloomberg. This, then, may play into “an additional tightening of overall financial conditions,” as mentioned, earlier.
Graphic: Via Physik Invest. Data compiled by @jkonopas623. Fed Balance Sheet data, here. Treasury General Account Data, here. Reverse Repo data, here. NL = BS – TGA – RRP.
Here’s a provision.
It’s the case that the Fed believes it needs a certain level of reserves for the proper functioning of the financial system (~$2 trillion). Wang explained that in 2019, banks dumped a lot of their reserves into repo to earn some extra return.
When QT was about to end, there was less money in their reserves which preceded a spike in rates and a blow-up among those who needed the money the most, as explained here.
“The Fed saw the system breaking at around 8% GDP and thinks that is where the limit is,” he added. “This suggests, going forward, the Fed is going to have to do something to top up the reserves in the banking system, and they have tools to do that.”
What’s the result, then?
These tools include capping the RRP, “forcing money out into the banking system,” as well as modifying the supplementary leverage ratio (SLR), making it “cheaper for banks to maintain a large balance sheet.”
Together, this, ultimately, may increase “the capacity of banks to make loans [and] create credit, so that is financial easing.”
As Wang said in another work best: These “easing effects may even overwhelm the tightening impact of a marginally longer QT.”
So, what can we expect?
In terms of timelines, Wang puts forth that economic data will likely prompt a mid-2023 cut in rates, which is in line with what the futures market is pricing.
Graphic: Retrieved from CME Group Inc (NASDAQ: CME).
Before then, traders are pricing nearly 225 to 250 basis points of rate increases. Based on where rates are at, now, some argue the market may still be too expensive.
Graphic: Retrieved from Bloomberg via Michael J. Kramer. “What is amazing is how expensive this market is relative to rates. The spread between the S&P 500 Earnings yield and the 10-Yr nominal rate is at multi-year lows.”
Positioning
We’ve talked about this before but what is expected, after Wednesday’s Fed update, is a move that is “structural,” as Kai Volatility’s Cem Karsan has put it before, and “a function of inevitable rebalancing of dealer inventory post-event.”
“The second move and final resolution, if you wait for it, is usually tied to the incremental effects on liquidity (QE/QT).”
Should participants’ fears with respect to the pace of tightening, for one, be assuaged, then it is likely that the protection demanded heading into the meeting, that’s bidding measures of implied volatility (IVOL), is supplied. This likely provides a boost.
From thereon, markets are more at the whims of macro-type positioning on rising rates and the withdrawal of liquidity.
Technical
As of 6:20 AM ET, Tuesday’s regular session (9:30 AM – 4:00 PM ET), in the S&P 500, is likely to open in the lower part of a negatively skewed overnight inventory, inside of prior-range and -value, suggesting a limited potential for immediate directional opportunity.
In the best case, the S&P 500 trades higher.
Any activity above the $3,909.25 MCPOC puts into play the $3,936.25 ONH. Initiative trade beyond the ONH could reach as high as the $3,964.75 HVNode and $4,001.00 VPOC, or higher.
In the worst case, the S&P 500 trades lower.
Any activity below the $3,909.25 MCPOC puts into play the $3,885.00 VPOC. Initiative trade beyond the VPOC could reach as low as the $3,857.25 and $3,826.25 HVNode, or lower.
Click here to load today’s key levels into the web-based TradingView charting platform. Note that all levels are derived using the 65-minute timeframe. New links are produced, daily.
Graphic: 65-minute profile chart of the Micro E-mini S&P 500 Futures.
Definitions
Volume Areas: A structurally sound market will build on areas of high volume (HVNodes). Should the market trend for long periods of time, it will lack sound structure, identified as low volume areas (LVNodes). LVNodes denote directional conviction and ought to offer support on any test.
If participants were to auction and find acceptance into areas of prior low volume (LVNodes), then future discovery ought to be volatile and quick as participants look to HVNodes for favorable entry or exit.
POCs: POCs are valuable as they denote areas where two-sided trade was most prevalent in a prior day session. Participants will respond to future tests of value as they offer favorable entry and exit.
MCPOCs: POCs are valuable as they denote areas where two-sided trade was most prevalent over numerous day sessions. Participants will respond to future tests of value as they offer favorable entry and exit.
About
After years of self-education, strategy development, mentorship, and trial-and-error, Renato Leonard Capelj began trading full-time and founded Physik Invest to detail his methods, research, and performance in the markets.
Capelj also develops insights around impactful options market dynamics at SpotGamma and is a Benzinga reporter.
In no way should the materials herein be construed as advice. Derivatives carry a substantial risk of loss. All content is for informational purposes only.
The daily brief is a free glimpse into the prevailing fundamental and technical drivers of U.S. equity market products. Join the 900+ that read this report daily, below!
Graphic updated 7:45 AM ET. Sentiment Neutral if expected /ES open is inside of the prior day’s range. /ES levels are derived from the profile graphic at the bottom of the following section. Levels may have changed since initially quoted; click here for the latest levels. SqueezeMetrics Dark Pool Index (DIX) and Gamma (GEX) calculations are based on where the prior day’s reading falls with respect to the MAX and MIN of all occurrences available. A higher DIX is bullish. At the same time, the lower the GEX, the more (expected) volatility. Learn the implications of volatility, direction, and moneyness. Breadth reflects a reading of the prior day’s NYSE Advance/Decline indicator. VIX reflects a current reading of the CBOE Volatility Index (INDEX: VIX) from 0-100.
Administrative
Apologies – yesterday the above graphic was not properly updated. The sentiment reading was incorrect, as were a couple of other figures. Separately, a lighter note, today, followed by more in-depth stuff currently being worked on in the coming sessions. Thanks!
Fundamental
First – going to refer everyone to yesterday’s letter, a conversation between Joseph Wang and Andy Constan, as well as some updates Cem Karsan of Kai Volatility made. That is, in part, a primer for what we will be talking more about, soon.
Next – we have futures markets pricing rate a peak in the overnight rate at ~4.6% in February of 2023. From thereon, rate cuts are implied.
Graphic: Via Charles Schwab Corporation’s (NYSE: SCHW) TD Ameritrade thinkorswim. Observed is the Eurodollar, the interest offered on U.S. dollar-denominated deposits held at banks outside of the U.S. (i.e., participants’ outlook on interest rates).
It’s becoming the consensus that “[f]or hikes to reduce inflation, they need to hurt growth,” Jean Boivin and Alex Brazier of BlackRock Inc (NYSE: BLK) explained.
“There is no way around this,” they add. “We estimate it would require a deep recession in the U.S., with around as much as 2% hit to growth in the U.S., and 3 million more unemployed, and an even deeper recession in Europe.”
It’s the impact of rising rates and quantitative tightening (the latter which will compound the impacts of the former) that are part of the toolkit used to cool the sticky inflation.
Graphic: Via Physik Invest. Data compiled by @jkonopas623. Fed Balance Sheet data, here. Treasury General Account Data, here. Reverse Repo data, here. NL = BS – TGA – RRP.
Ray Dalio, of Bridgewater Associates LP, said that rates rising “toward the higher end of the 4.5% to 6% range … will bring private sector credit growth down, which will bring private sector spending and, hence, the economy down with it.”
Accordingly, equity prices could plunge upwards of 20%, as a result.
Graphic: Retrieved from Bloomberg via Michael J. Kramer. “What is amazing is how expensive this market is relative to rates. The spread between the S&P 500 Earnings yield and the 10-Yr nominal rate is at multi-year lows.”
Further, per Bloomberg’s John Authers, it’s the case that “[a]ll major global synchronized crises ended with moderate inflation and low growth; that hasn’t been reached yet.” Separately, a peak in inflation “doesn’t come close to guaranteeing equity gains.”
The pivot will come when there’s a “sustainable path to 2% (not 3 or 4%) inflation” and a “fed funds that is greater than CPI for a few quarters,” explained Alfonso Peccatiello of The Macro Compass.
“The timing mostly depends [on] the MoM CPI ahead,” he added, pointing to a graphic that suggests “there is no ‘pivot’ earlier than mid-2023, and it could well be later. Looking at the SOFR curve, that’s also what’s roughly priced in.”
Graphic: Retrieved from Bespoke Investment Group via Alfonso Peccatiello.
Positioning
Ahead of a multi-derivative expiry, markets are trading sideways to lower. Demands to protect equity downside (with puts), compounded macro-type selling earlier this week.
Now, with traders well hedged, Kai Volatility’s Cem Karsan put forth that there is a “race to monetize,” which is lending to “relatively flat” trade and “lack of follow-through.”
Graphic: Retrieved from Pat Hennessy. “Every large down move in SPX this year (quantified by <= -2 Zscore) has been followed by a relatively flat day/lack of follow through. Any ideas as to why this is?”
From hereon, as we said, a lot of the exposure demanded is short-dated. Should that exposure not be rolled forward in time, and allowed to expire, “SPX/ES dealers [who] are well hedged,” will unwind their hedges which may drive bullishness “through OpEx,” added Karsan.
Notwithstanding, this “has [the] potential to drive a tail post” OpEx. In [the] tech/meme market melt-up of 2020-2021, positioning was [the] exact opposite.”
Technical
As of 7:45 AM ET, Thursday’s regular session (9:30 AM – 4:00 PM ET), in the S&P 500, is likely to open in the middle part of a balanced overnight inventory, inside of prior-range and -value, suggesting a limited potential for immediate directional opportunity.
In the best case, the S&P 500 trades higher.
Any activity above the $3,965.75 HVNode puts into play the $4,001.00 VPOC. Initiative trade beyond the VPOC could reach as high as the $4,018.75 and $4,069.25 HVNodes, or higher.
In the worst case, the S&P 500 trades lower.
Any activity below the $3,965.75 HVNode puts into play the $3,925.00 VPOC. Initiative trade beyond the VPOC could reach as low as the $3,867.75 LVNode and $3,829.75 HVNode, or lower.
Click here to load today’s key levels into the web-based TradingView charting platform. Note that all levels are derived using the 65-minute timeframe. New links are produced, daily.
Graphic: 65-minute profile chart of the Micro E-mini S&P 500 Futures.
Definitions
Volume Areas: A structurally sound market will build on areas of high volume (HVNodes). Should the market trend for long periods of time, it will lack sound structure, identified as low volume areas (LVNodes). LVNodes denote directional conviction and ought to offer support on any test.
If participants were to auction and find acceptance into areas of prior low volume (LVNodes), then future discovery ought to be volatile and quick as participants look to HVNodes for favorable entry or exit.
POCs: POCs are valuable as they denote areas where two-sided trade was most prevalent in a prior day session. Participants will respond to future tests of value as they offer favorable entry and exit.
MCPOCs: POCs are valuable as they denote areas where two-sided trade was most prevalent over numerous day sessions. Participants will respond to future tests of value as they offer favorable entry and exit.
About
After years of self-education, strategy development, mentorship, and trial-and-error, Renato Leonard Capelj began trading full-time and founded Physik Invest to detail his methods, research, and performance in the markets.
Capelj also develops insights around impactful options market dynamics at SpotGamma and is a Benzinga reporter.
In no way should the materials herein be construed as advice. Derivatives carry a substantial risk of loss. All content is for informational purposes only.