Physik Invest’s Daily Brief is read free by thousands of subscribers. Join this community to learn about the fundamental and technical drivers of markets.
Administrative
Lots of content today but a bit rushed at the desk. If anything is unclear, we will clarify it in the coming sessions. Have a great weekend! – Renato
Fundamental
Physik Invest’s Daily Brief for March 2 talked about balancing the implications of still-hot inflation and an economy on solid footing. Basically, the probability the economy is in a recession is lower than it was at the end of ‘22. For the probabilities to change markedly, there would have to be a big increase in unemployment, for one.
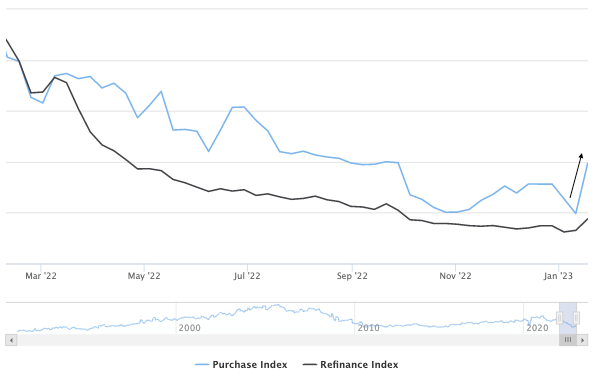
According to a blog by Unlimited’s Bruce McNevin, if the unemployment rate rises by about 1%, recession odds go up by 29%. If the non-farm payroll employment falls by about 2% or 3 million jobs, recession odds increase by about 74%. After a year or so of tightening, unemployment measures are finally beginning to pick up.
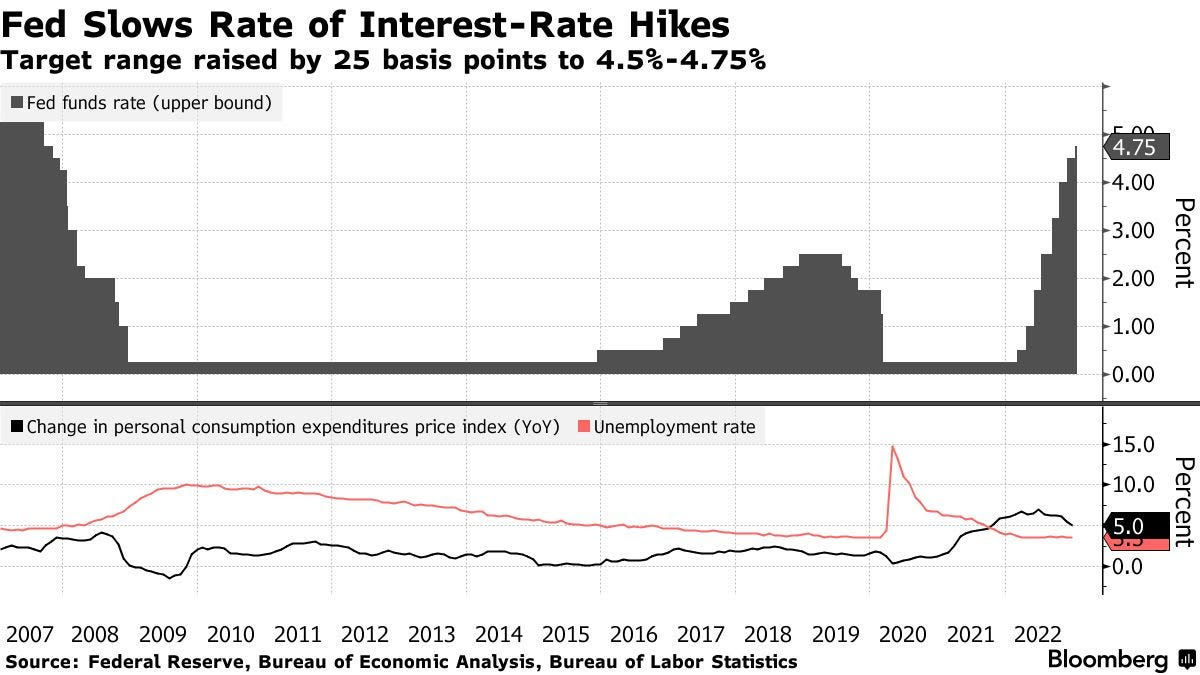
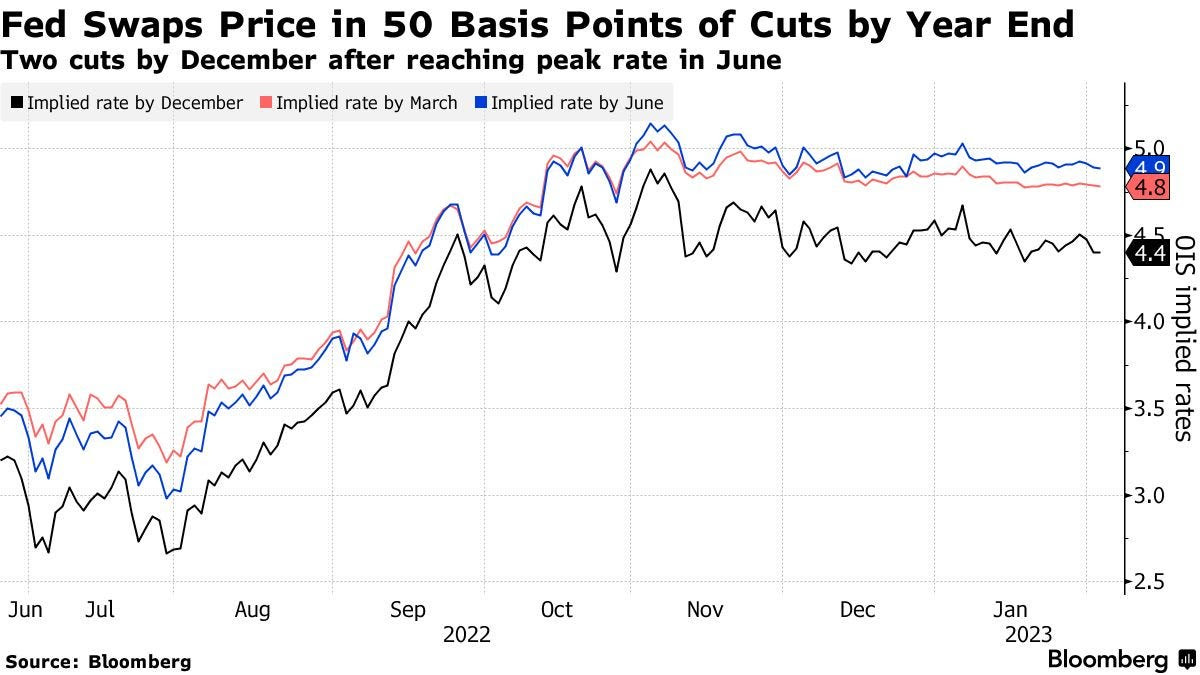
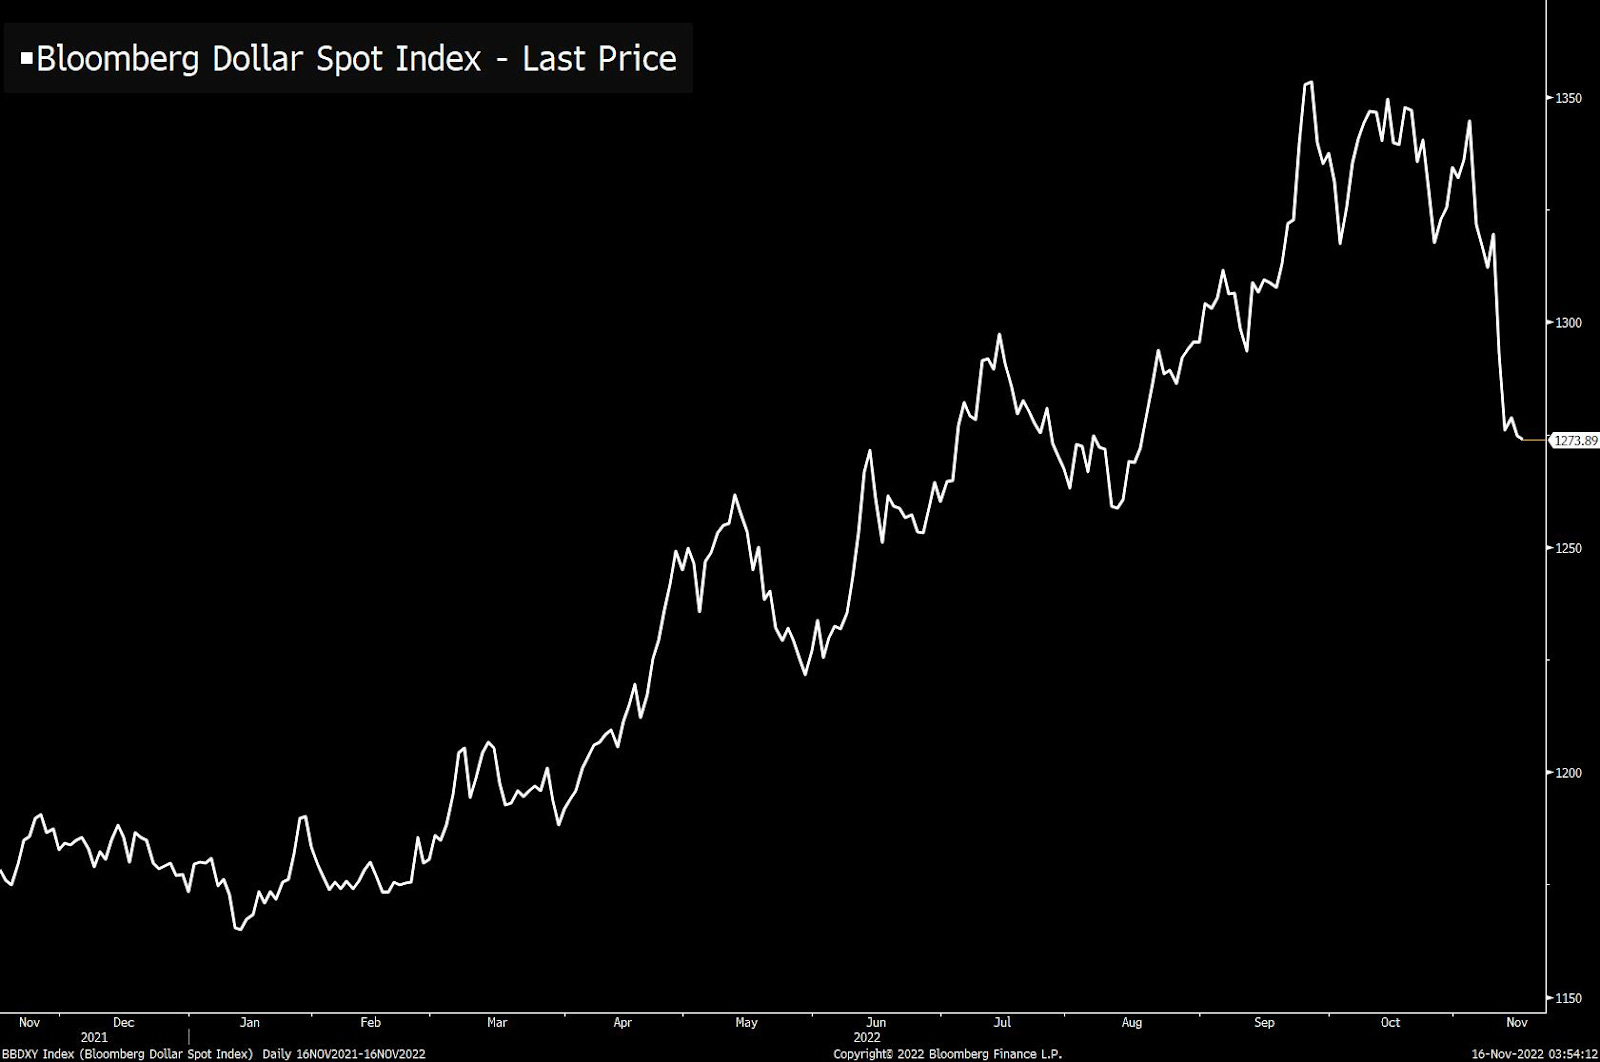
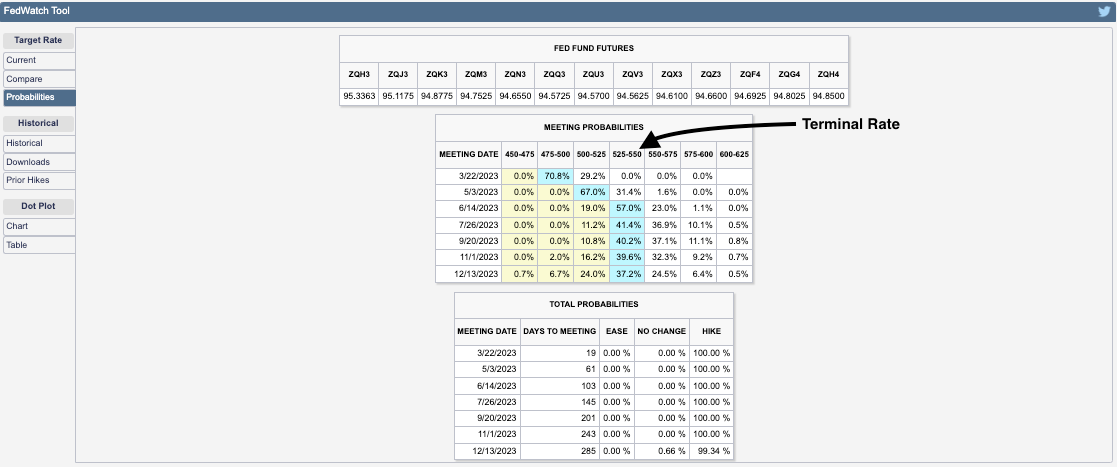
Policymakers, per recent remarks, maintain that more needs to be done, however. For instance, the Federal Reserve’s (Fed) Raphael Bostic, who generally carries an easier stance on monetary policy, mulled whether the Fed should raise interest rates beyond the 5.00-5.25% terminal rate consensus he previously endorsed. This commentary, coupled with newly released economic data, has sent yields surging at the front end.
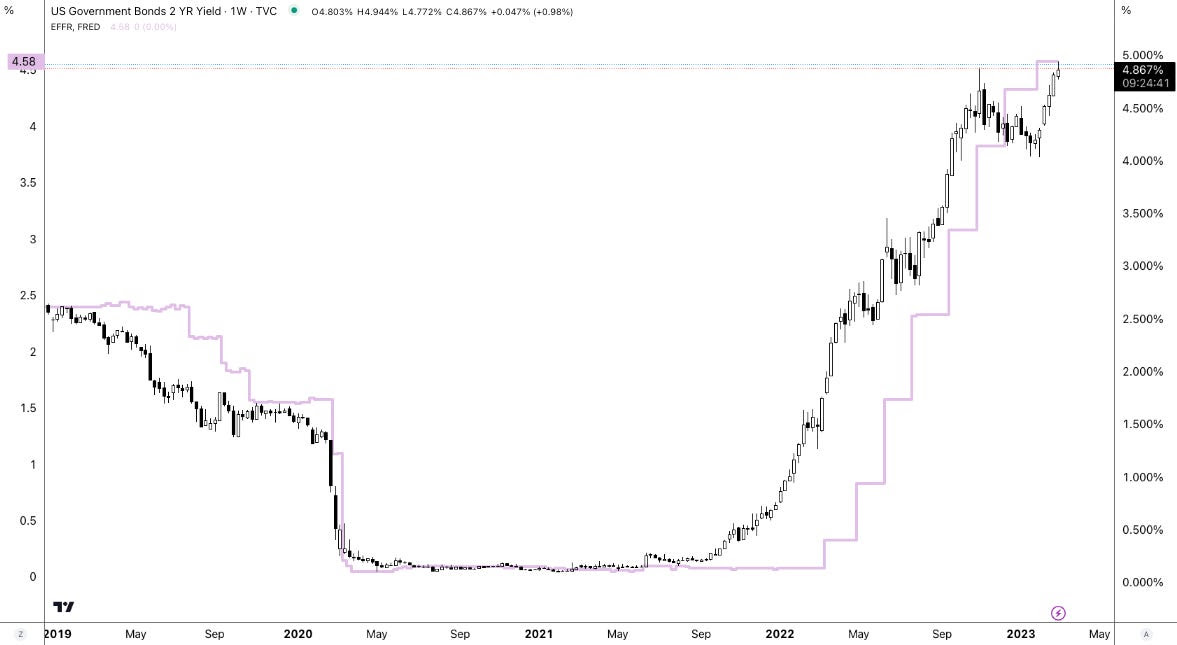
Traders are wildly repricing their terminal rate expectations this week. The terminal rate over the past few days has gone up from 5.25-5.50% to 5.50-5.75%, and back down to 5.25-5.50%.
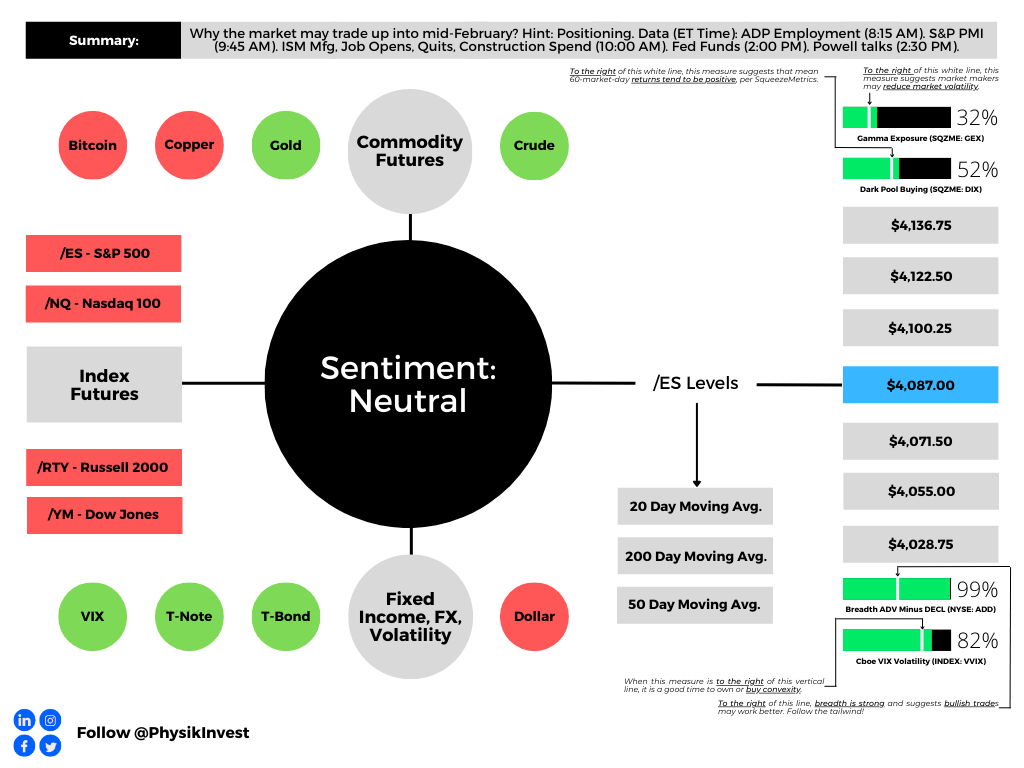
Positioning
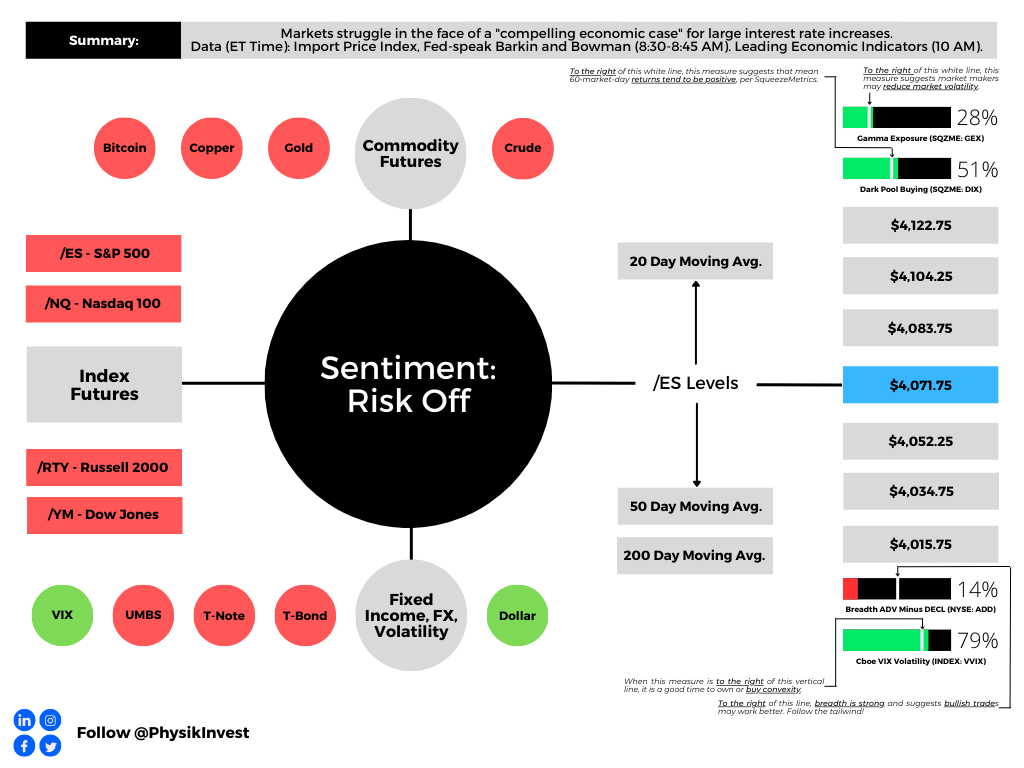
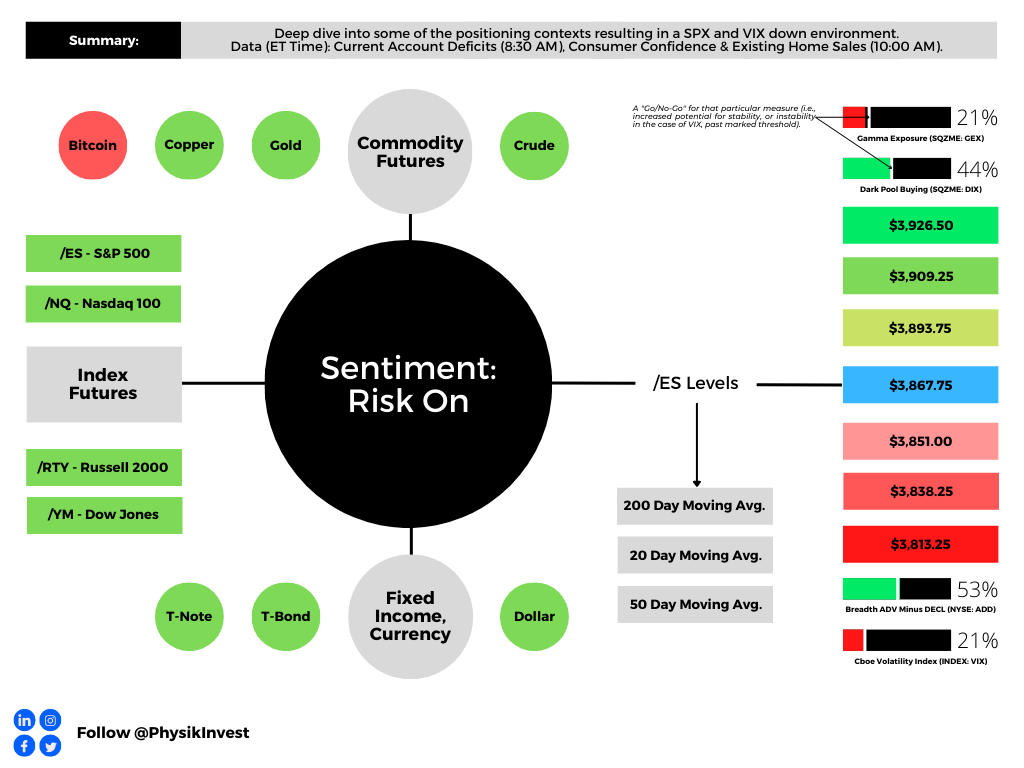
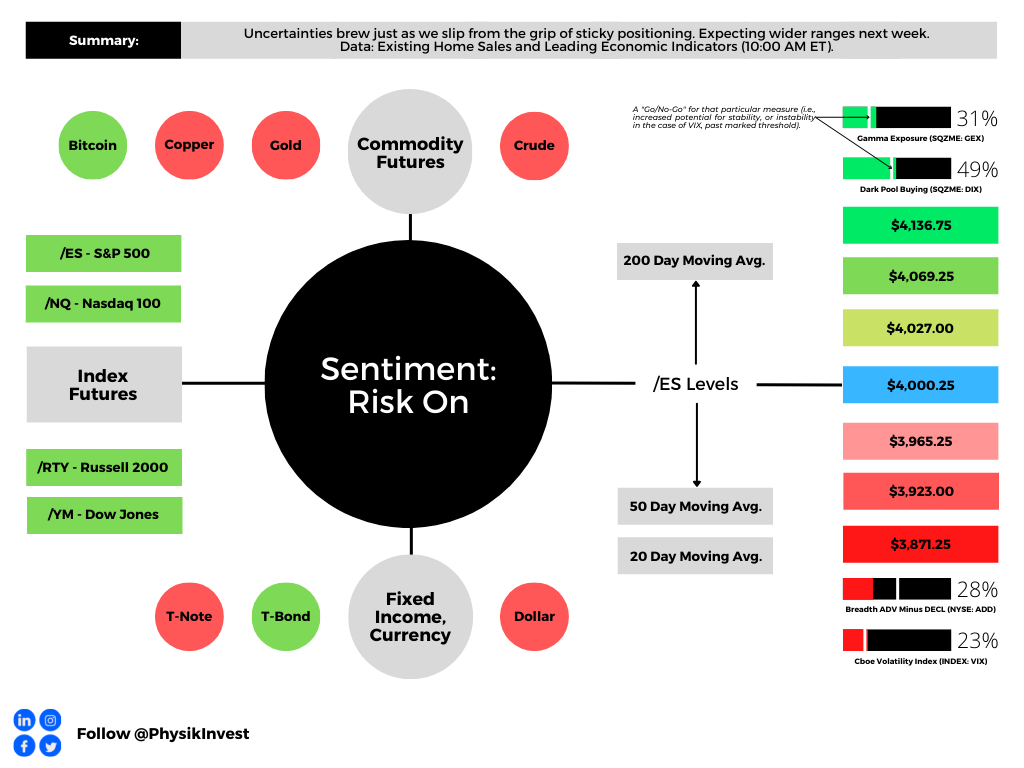
Stocks and bonds performed poorly. Commodity hedges are uninspiring also in that they do not hedge against (rising odds of) recession, per the Daily Brief for March 1.
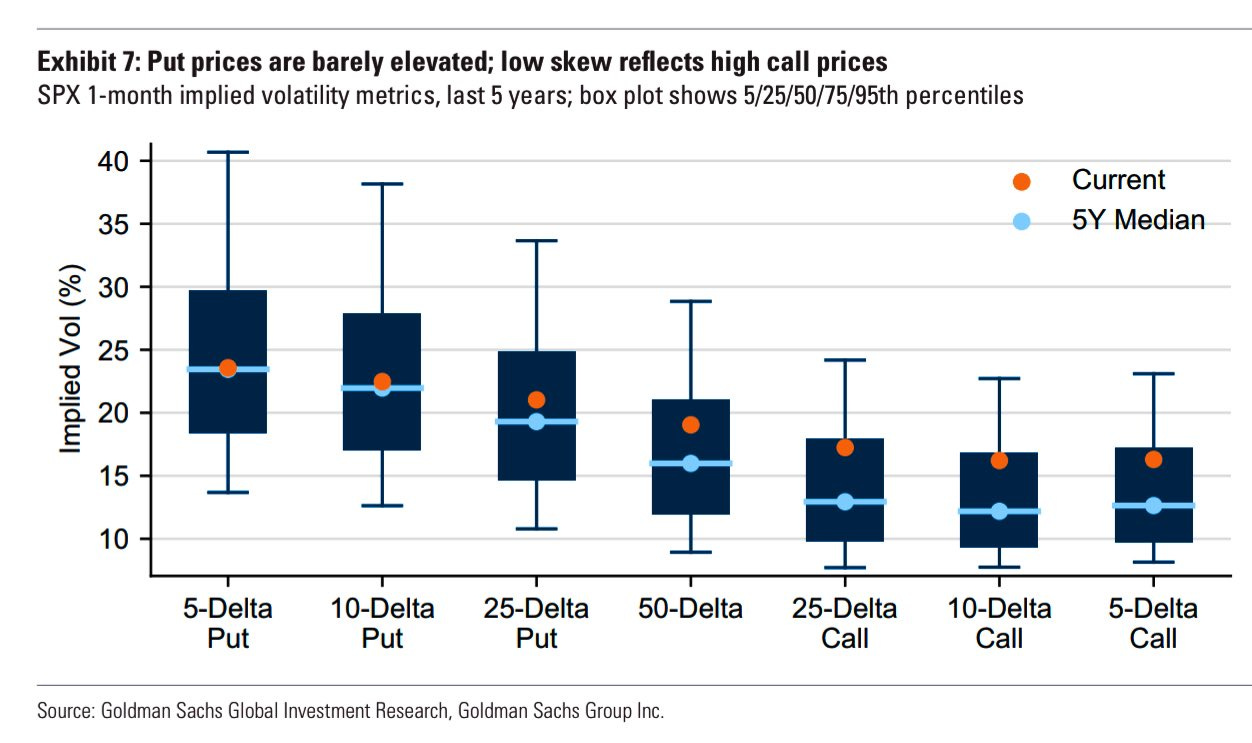
In navigating this precarious environment, this letter has put forward a few trade ideas including the sale of call options structures to finance put options structures, after the mid-February monthly options expiration (OpEx). Though measures suggest “we can [still] get cheap exposure to convexity while a lot of people are worried,” the location for similar (short call, long put) trades is not optimal. Rather, trades including building your own structured note, now catching the attention of some traders online, appear attractive now with T-bill rates surging.

Such trades reduce portfolio volatility and downside while providing upside exposure comparable to poorly performing traditional portfolio constructions like 60/40.
As an example, per IPS Strategic Capital’s Pat Hennessy, with $1,000,000 to invest and rates at ~5% (i.e., $50,000 is 5% of $1,000,000), one could buy 1000 USTs or S&P 500 (INDEX: SPX) Box Spreads which will have a value of $1 million at maturity for the price of $950,000.
With $50,000 left in cash, one can use options for leveraged exposure to an asset of their choosing, Hennessy explained. Should these options expire worthless, the $50,000 gain from USTs, at maturity, provides “a full return of principal.”
For traders who are focused on short(er)-term movements, one could allocate the cash remaining toward structures that buy and sell call options over very short time horizons (e.g., 0 DTE).
Knowing that the absence of range expansion to the downside, positioning flows may build a platform for the market to rally, one could lean into structures like fixed-width call option butterflies.
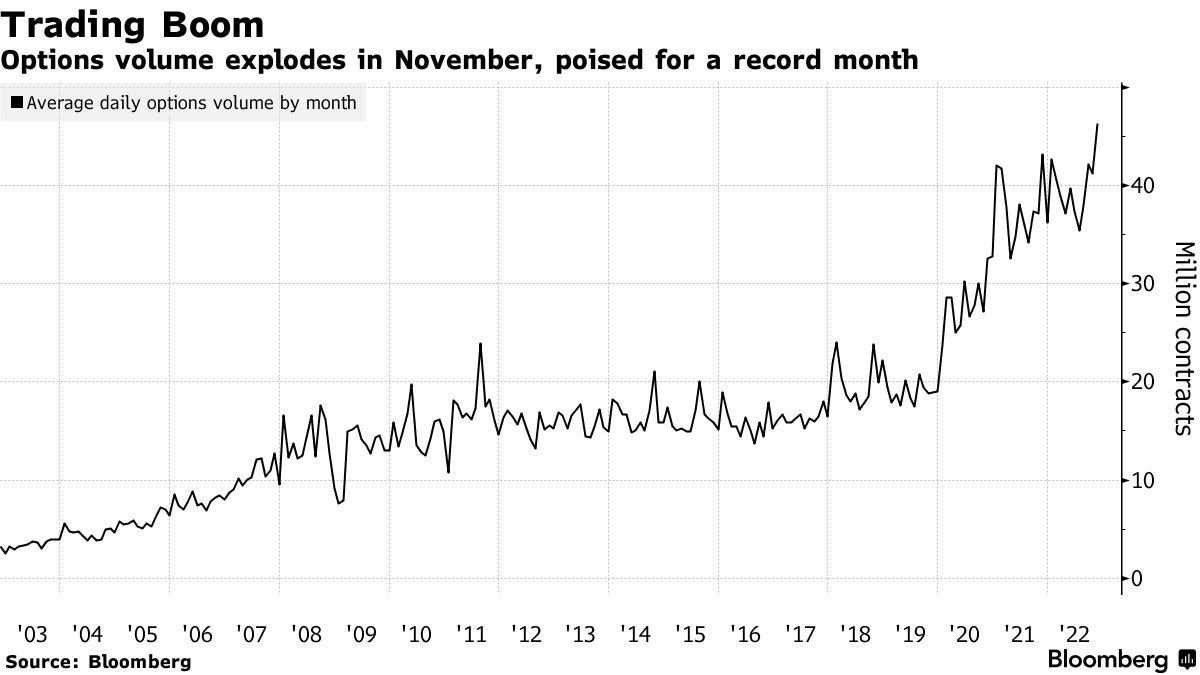
For instance, yesterday, Nasdaq 100 (INDEX: NDX) call option butterflies expanded in value ~10 times (i.e., $5 → $50). An example 0 DTE trade is the BUTTERFLY NDX 100 (Weeklys) 2 MAR 23 12000/12100/12200 CALL. Such trade could have been bought near ~$5.00 in debit and, later, sold for much bigger credits (e.g., ~$40.00).
Such trade fits and plays on the narrative described in Physik Invest’s Daily Brief for February 24. That particular letter detailed Bank of America Corporation’s (NYSE: BAC) finding that “volume is uniquely skewed towards the ask early in the day but towards the bid later in the day” for these highly traded ultra-short-dated options.
Even options insight and data provider SqueezeMetrics agrees: “Buy 0 DTE call.” The typical “day doesn’t end above straddle b/e, but call makes money,” SqueezeMetrics explained. “Dealer and call-buyer both profit. Gap down, repeat.”
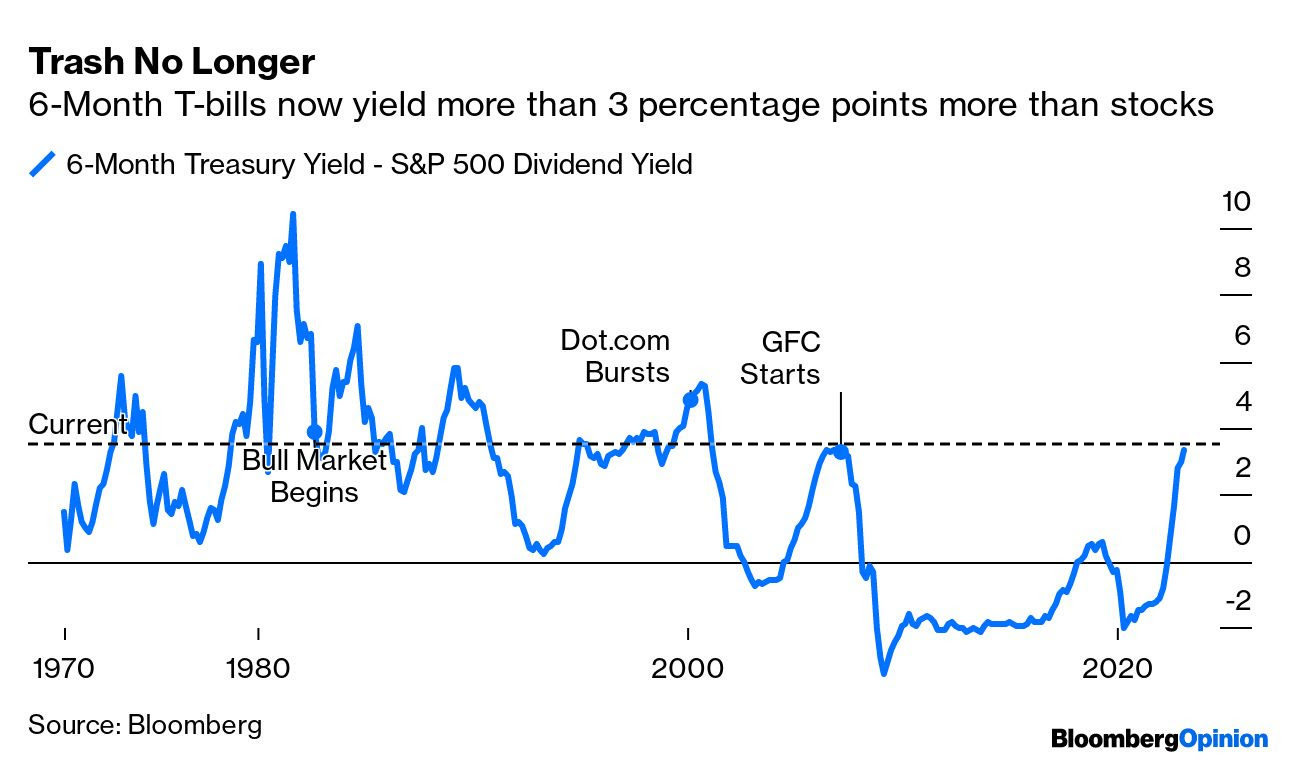
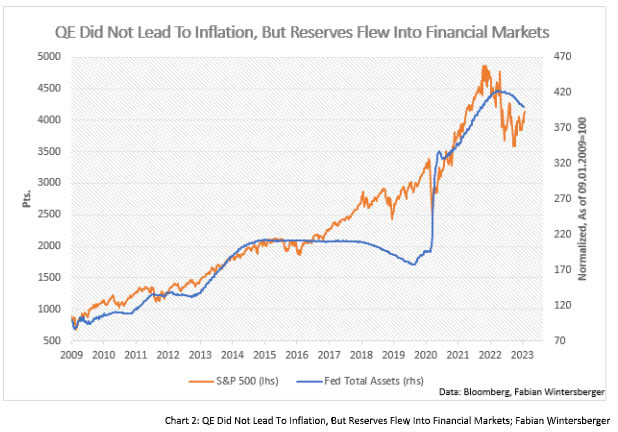
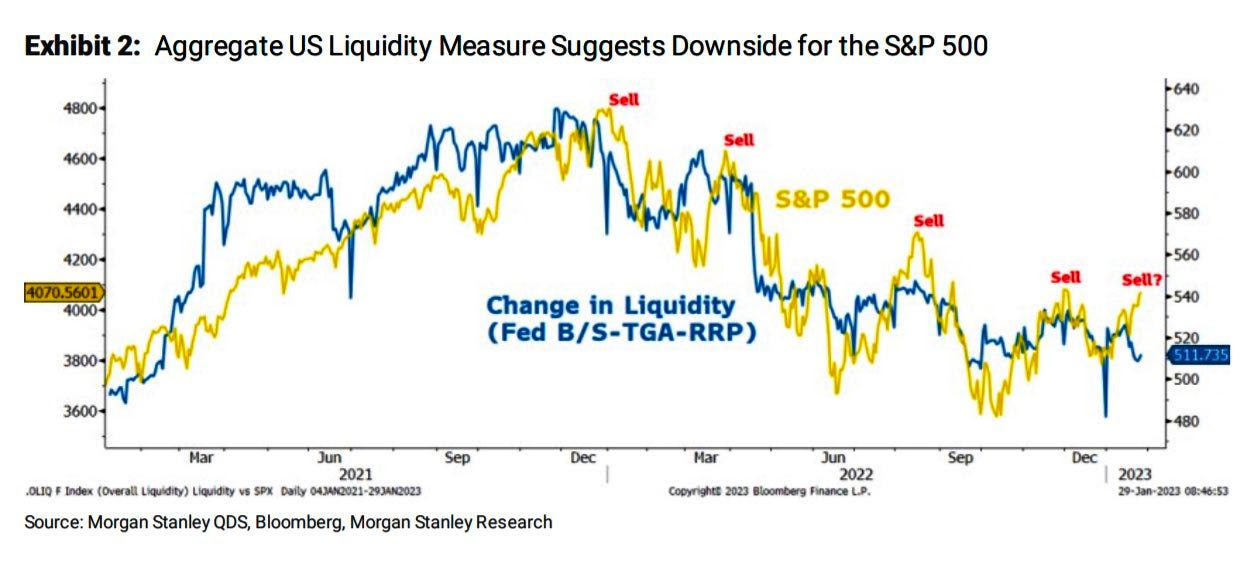
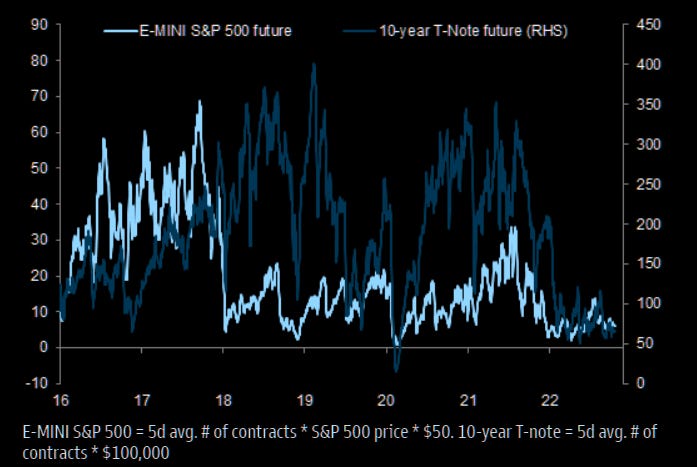
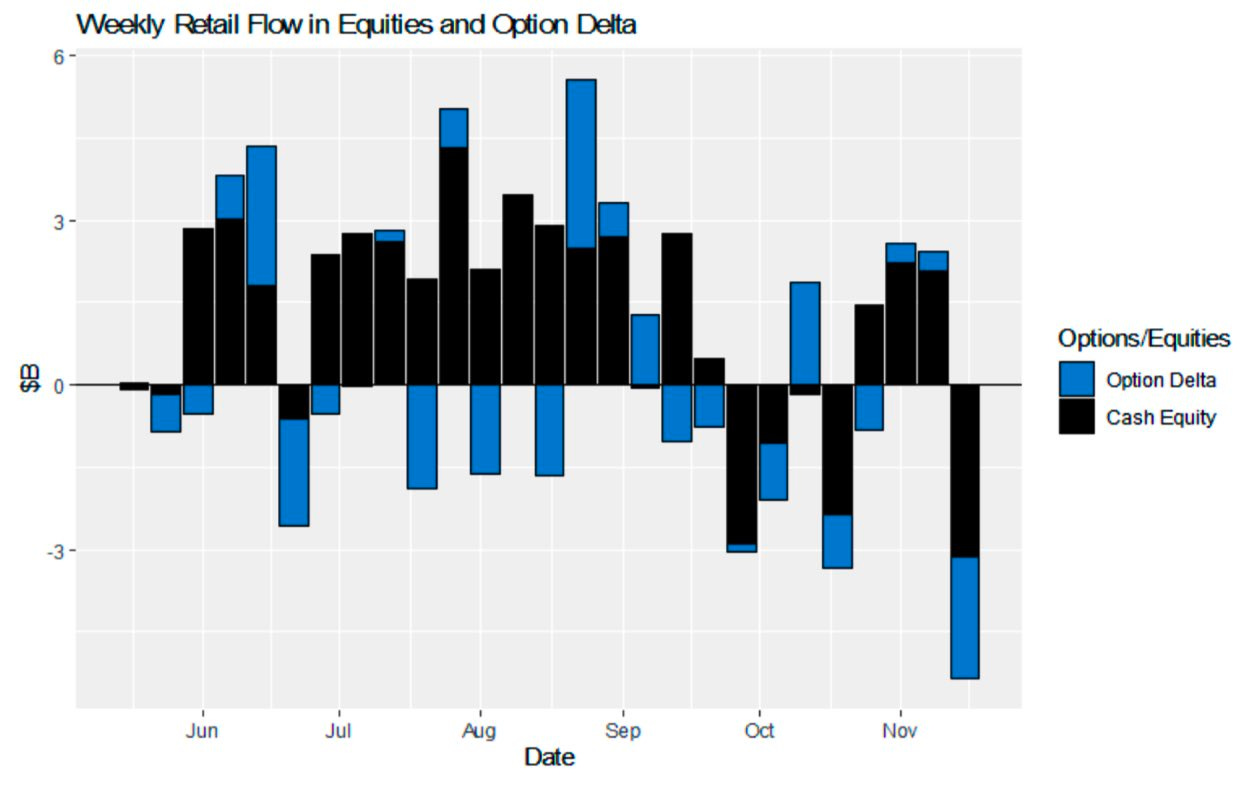
Anyways, back to the bigger trends impacted by liquidity coming off the table and increased competition between equities and fixed income.
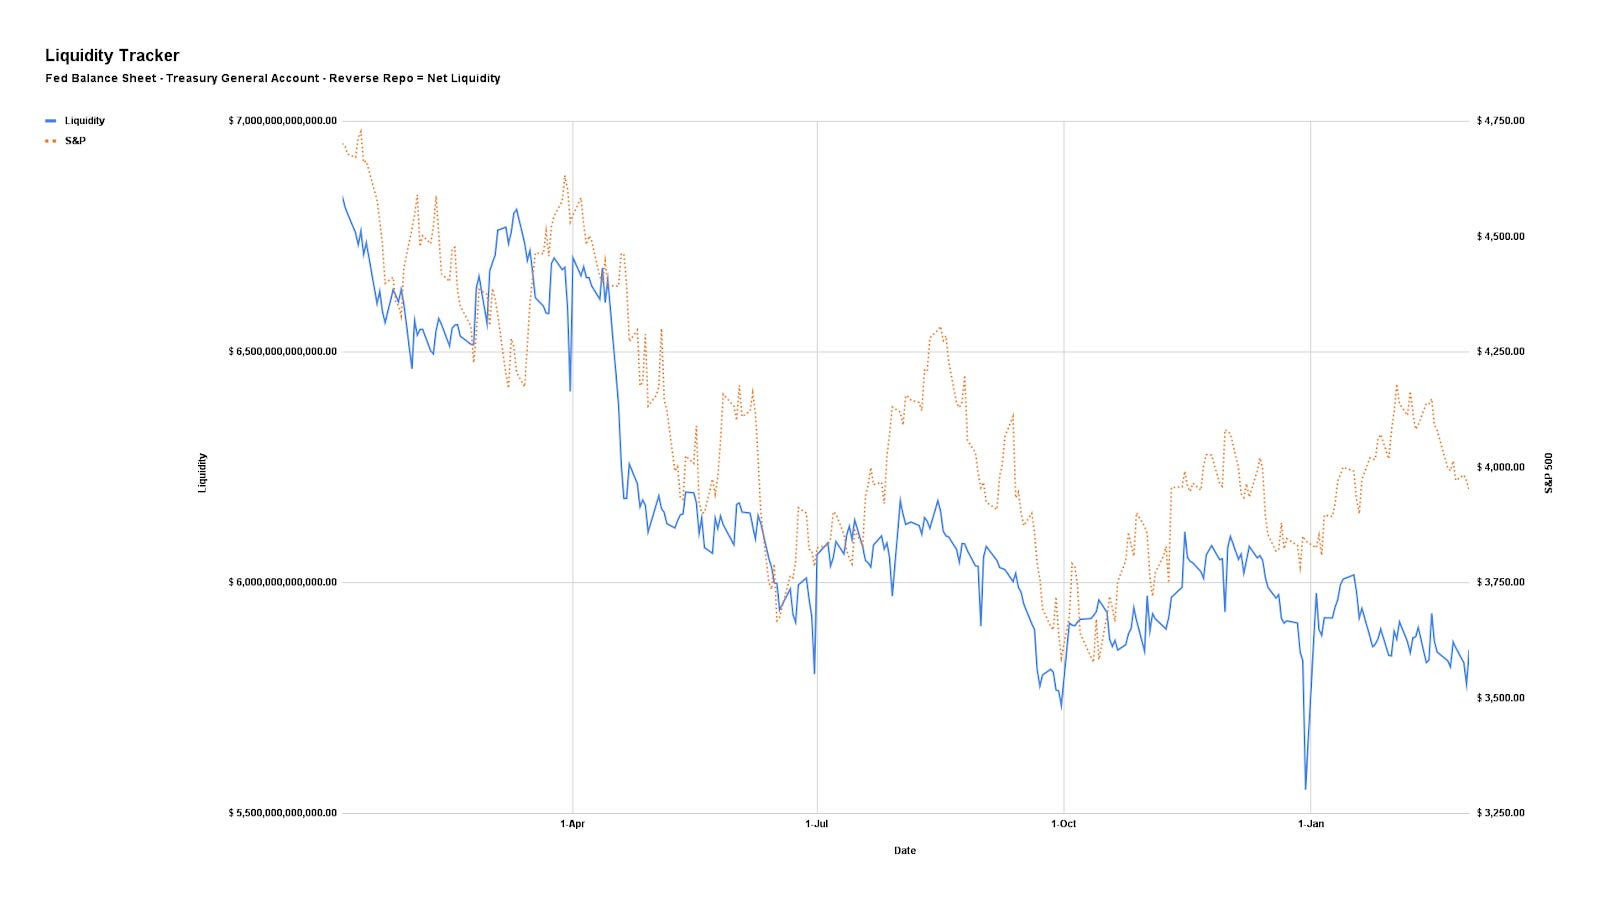
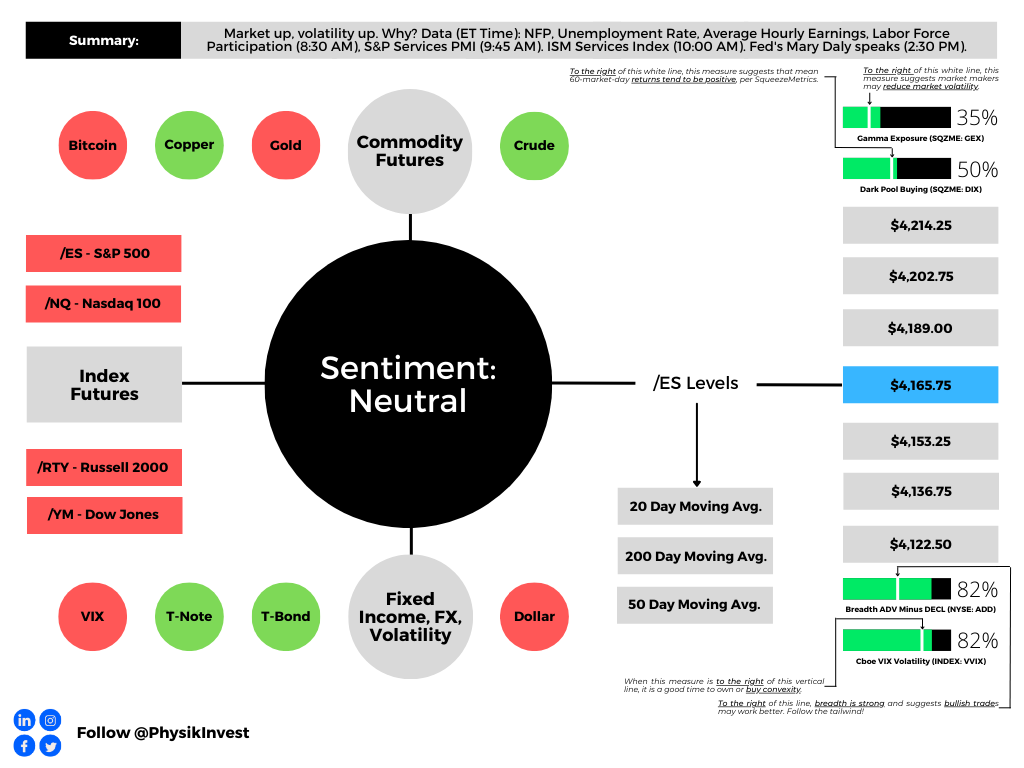
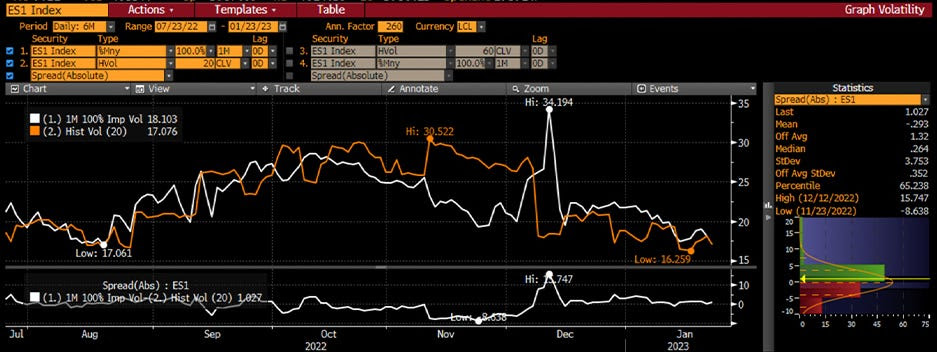
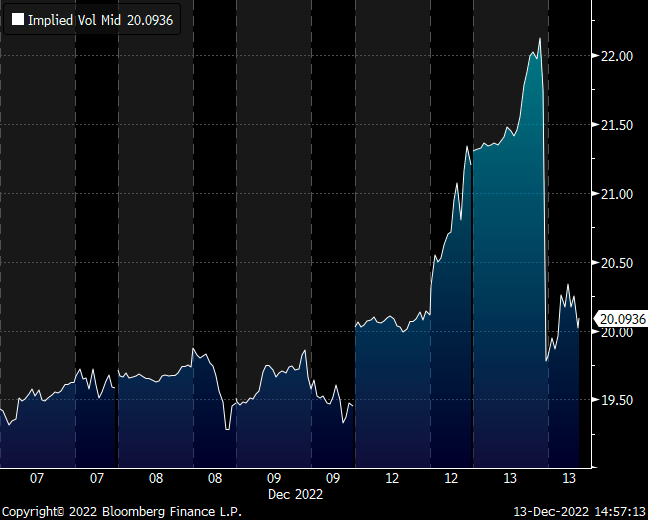
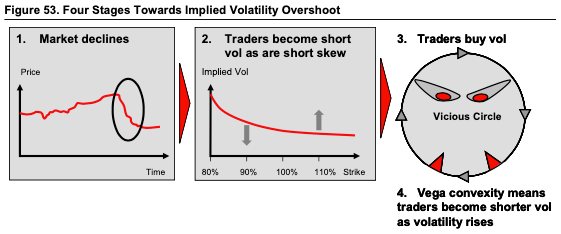
As this letter put forth in the past, if the “market consolidates and doesn’t break,” as we see, the delta buy-back with respect to dropping implied volatility (IVOL) or vanna and buy-back with respect to the passage of time or charm could build a platform for a FOMO-driven call buying rally that ends in a blow-off.

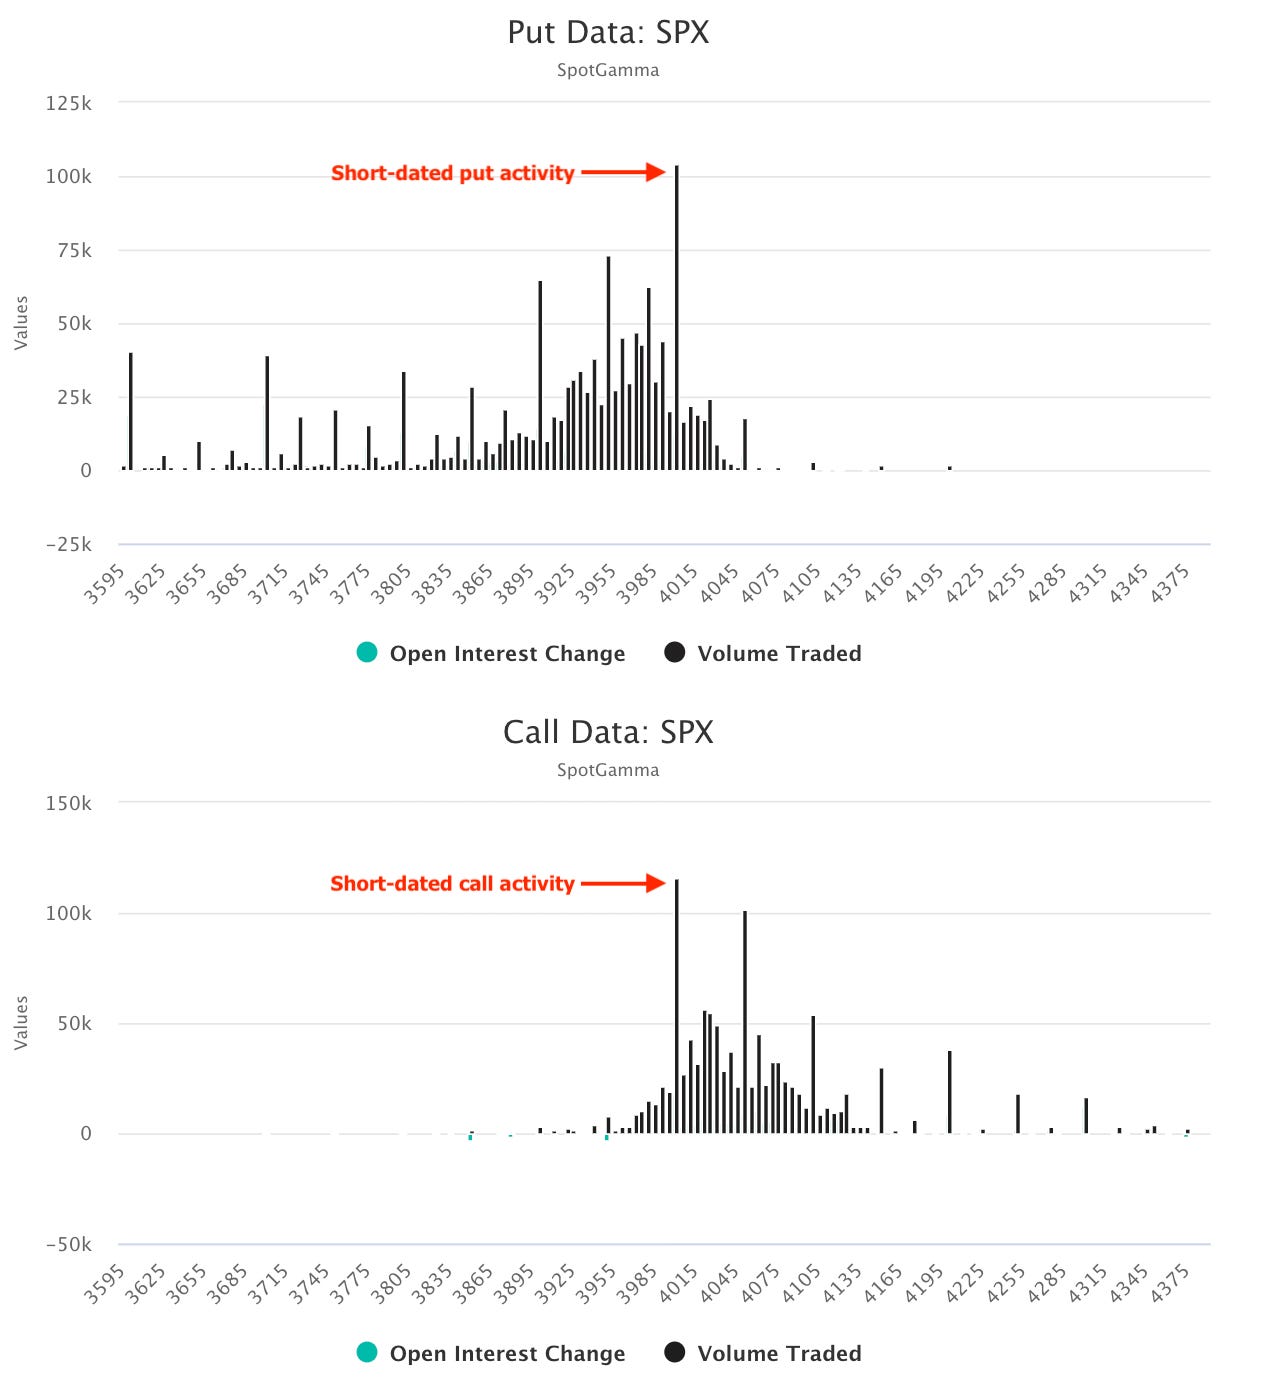
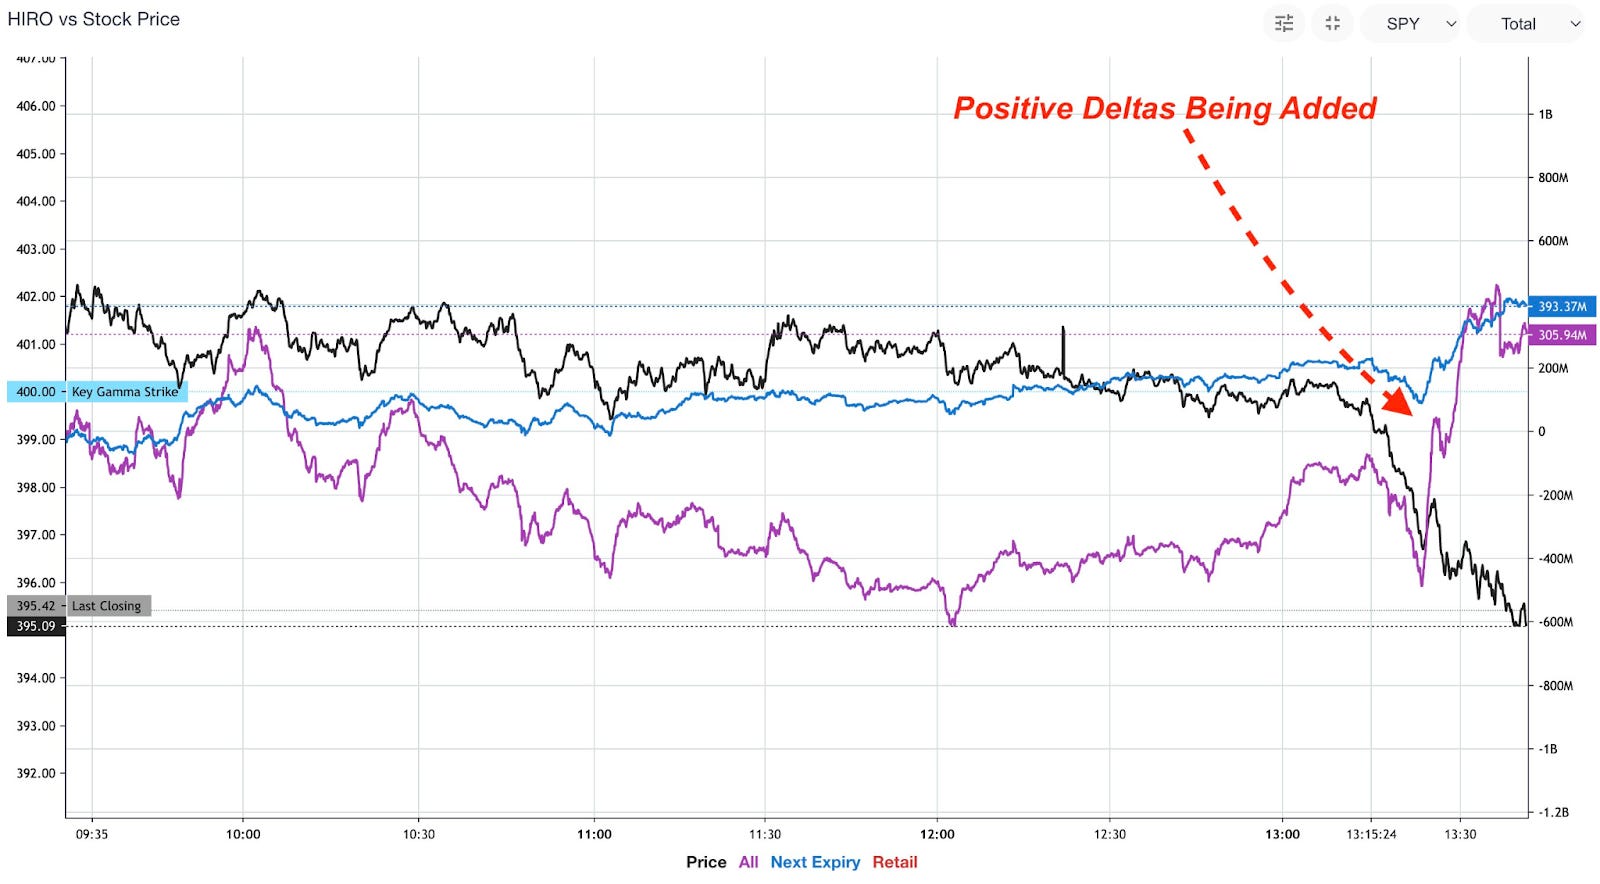
Per data by SpotGamma, another options insight and data provider your letter writer used to write for and highly recommends checking out, call buying, particularly over short time horizons, was often tied to market rallies.
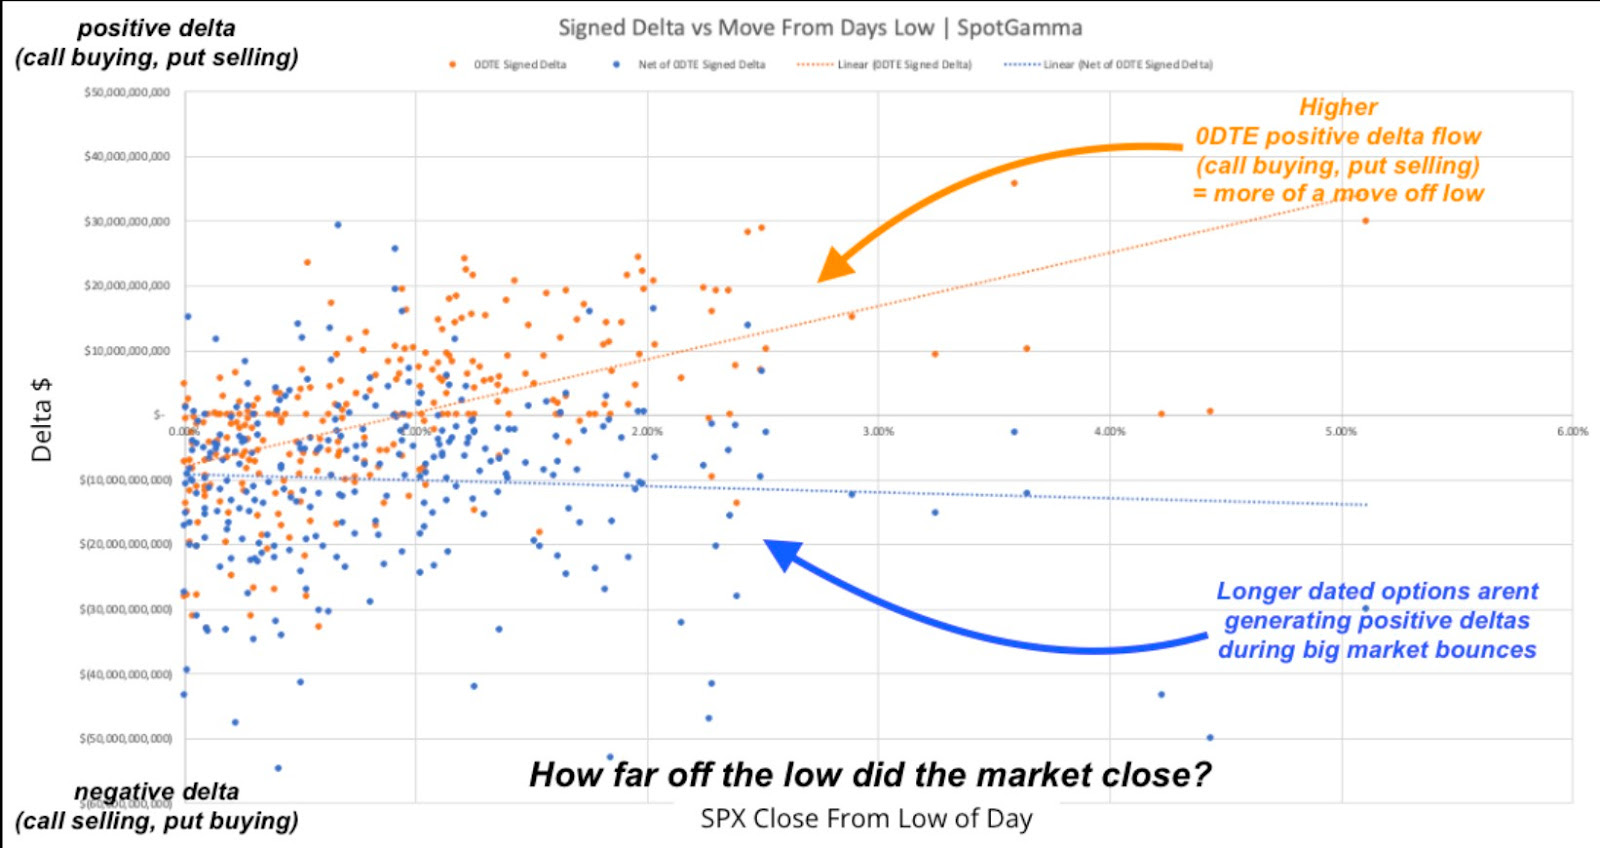
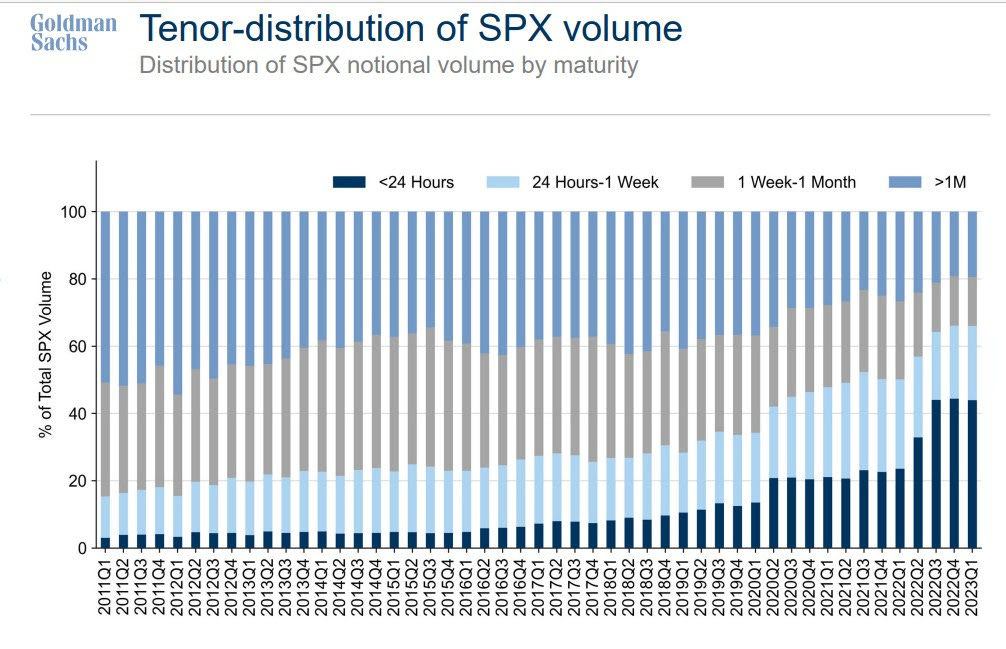
“0DTE does not seem to be associated with betting on a large downside movement. Large downside market volatility appears to be driven by larger, longer-dated S&P volume,” SpotGamma founder Brent Kochuba said in the Bloomberg article. “Where 0DTE is currently most impactful is where it seems 0DTE calls are being used to ‘buy the dips’ after large declines. In a way this suppresses volatility.”
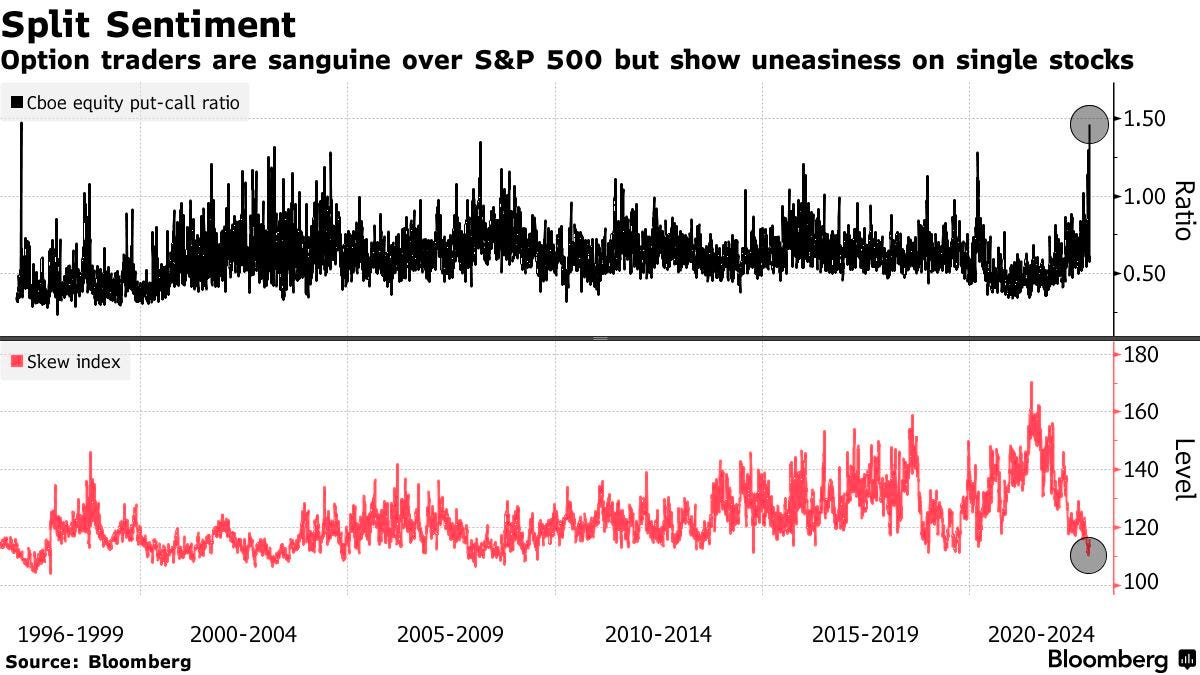
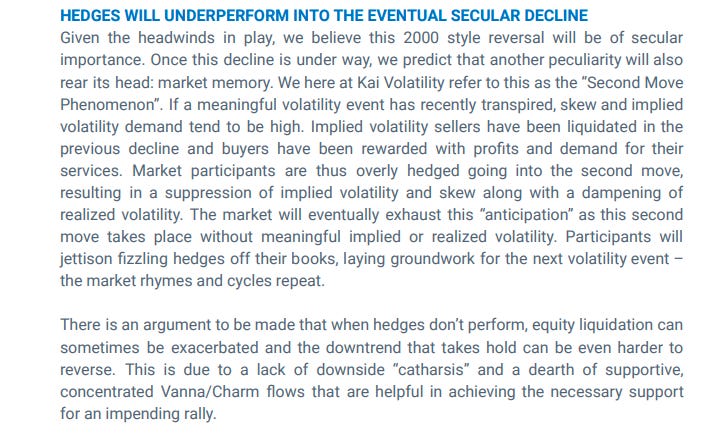
Anyways, the signs of a “more combustible situation” would likely show when “volatility is sticky into a rally,” explained Kai Volatiity’s Cem Karsan. To gauge combustibility, look to the Daily Brief for February 17.
Technical
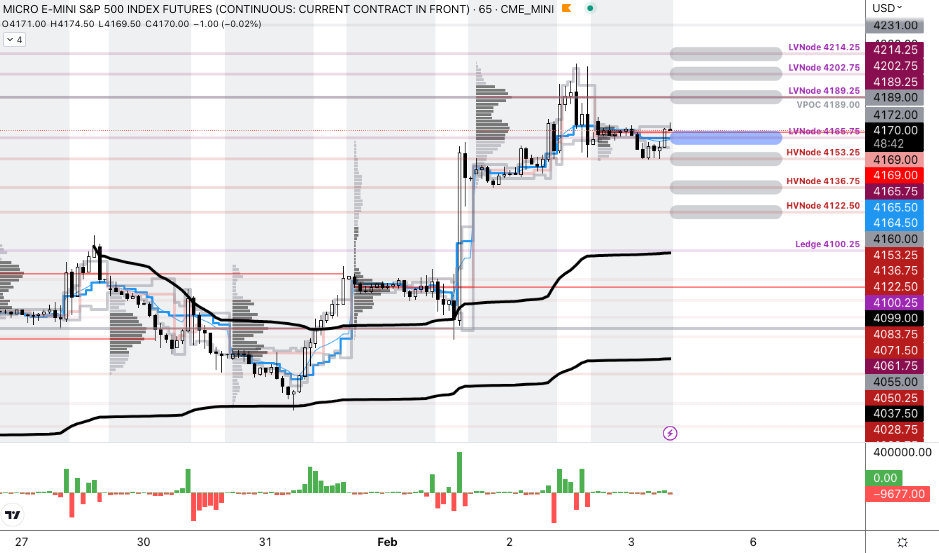
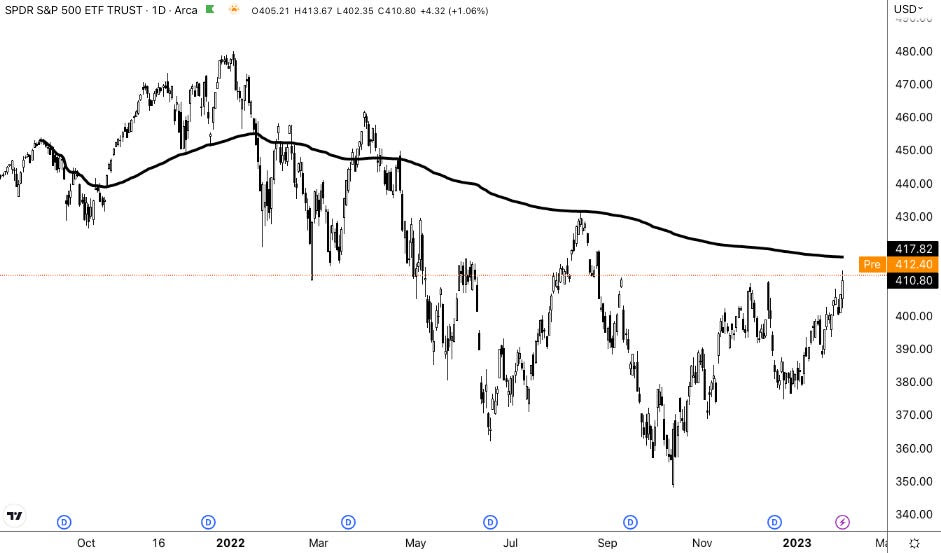
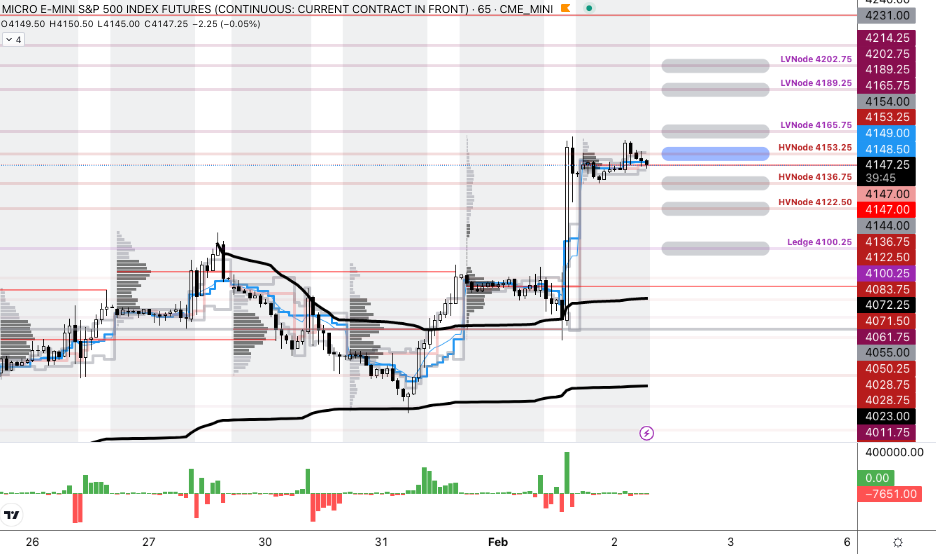
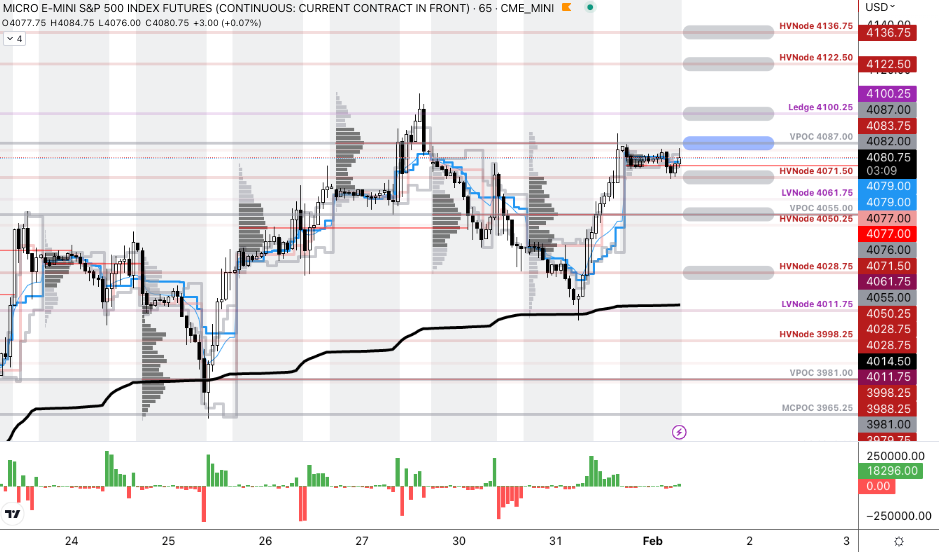
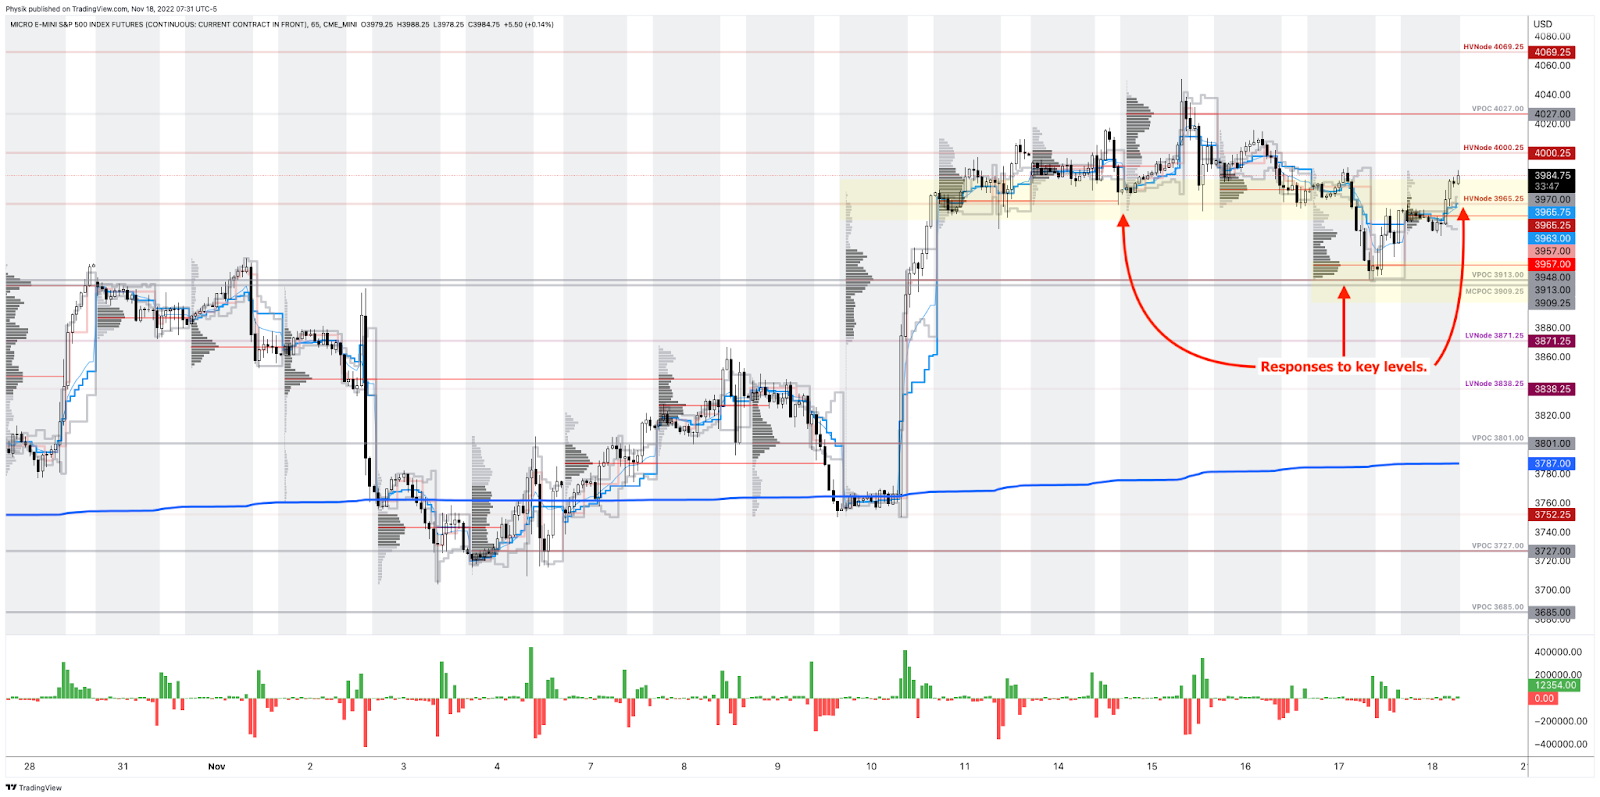
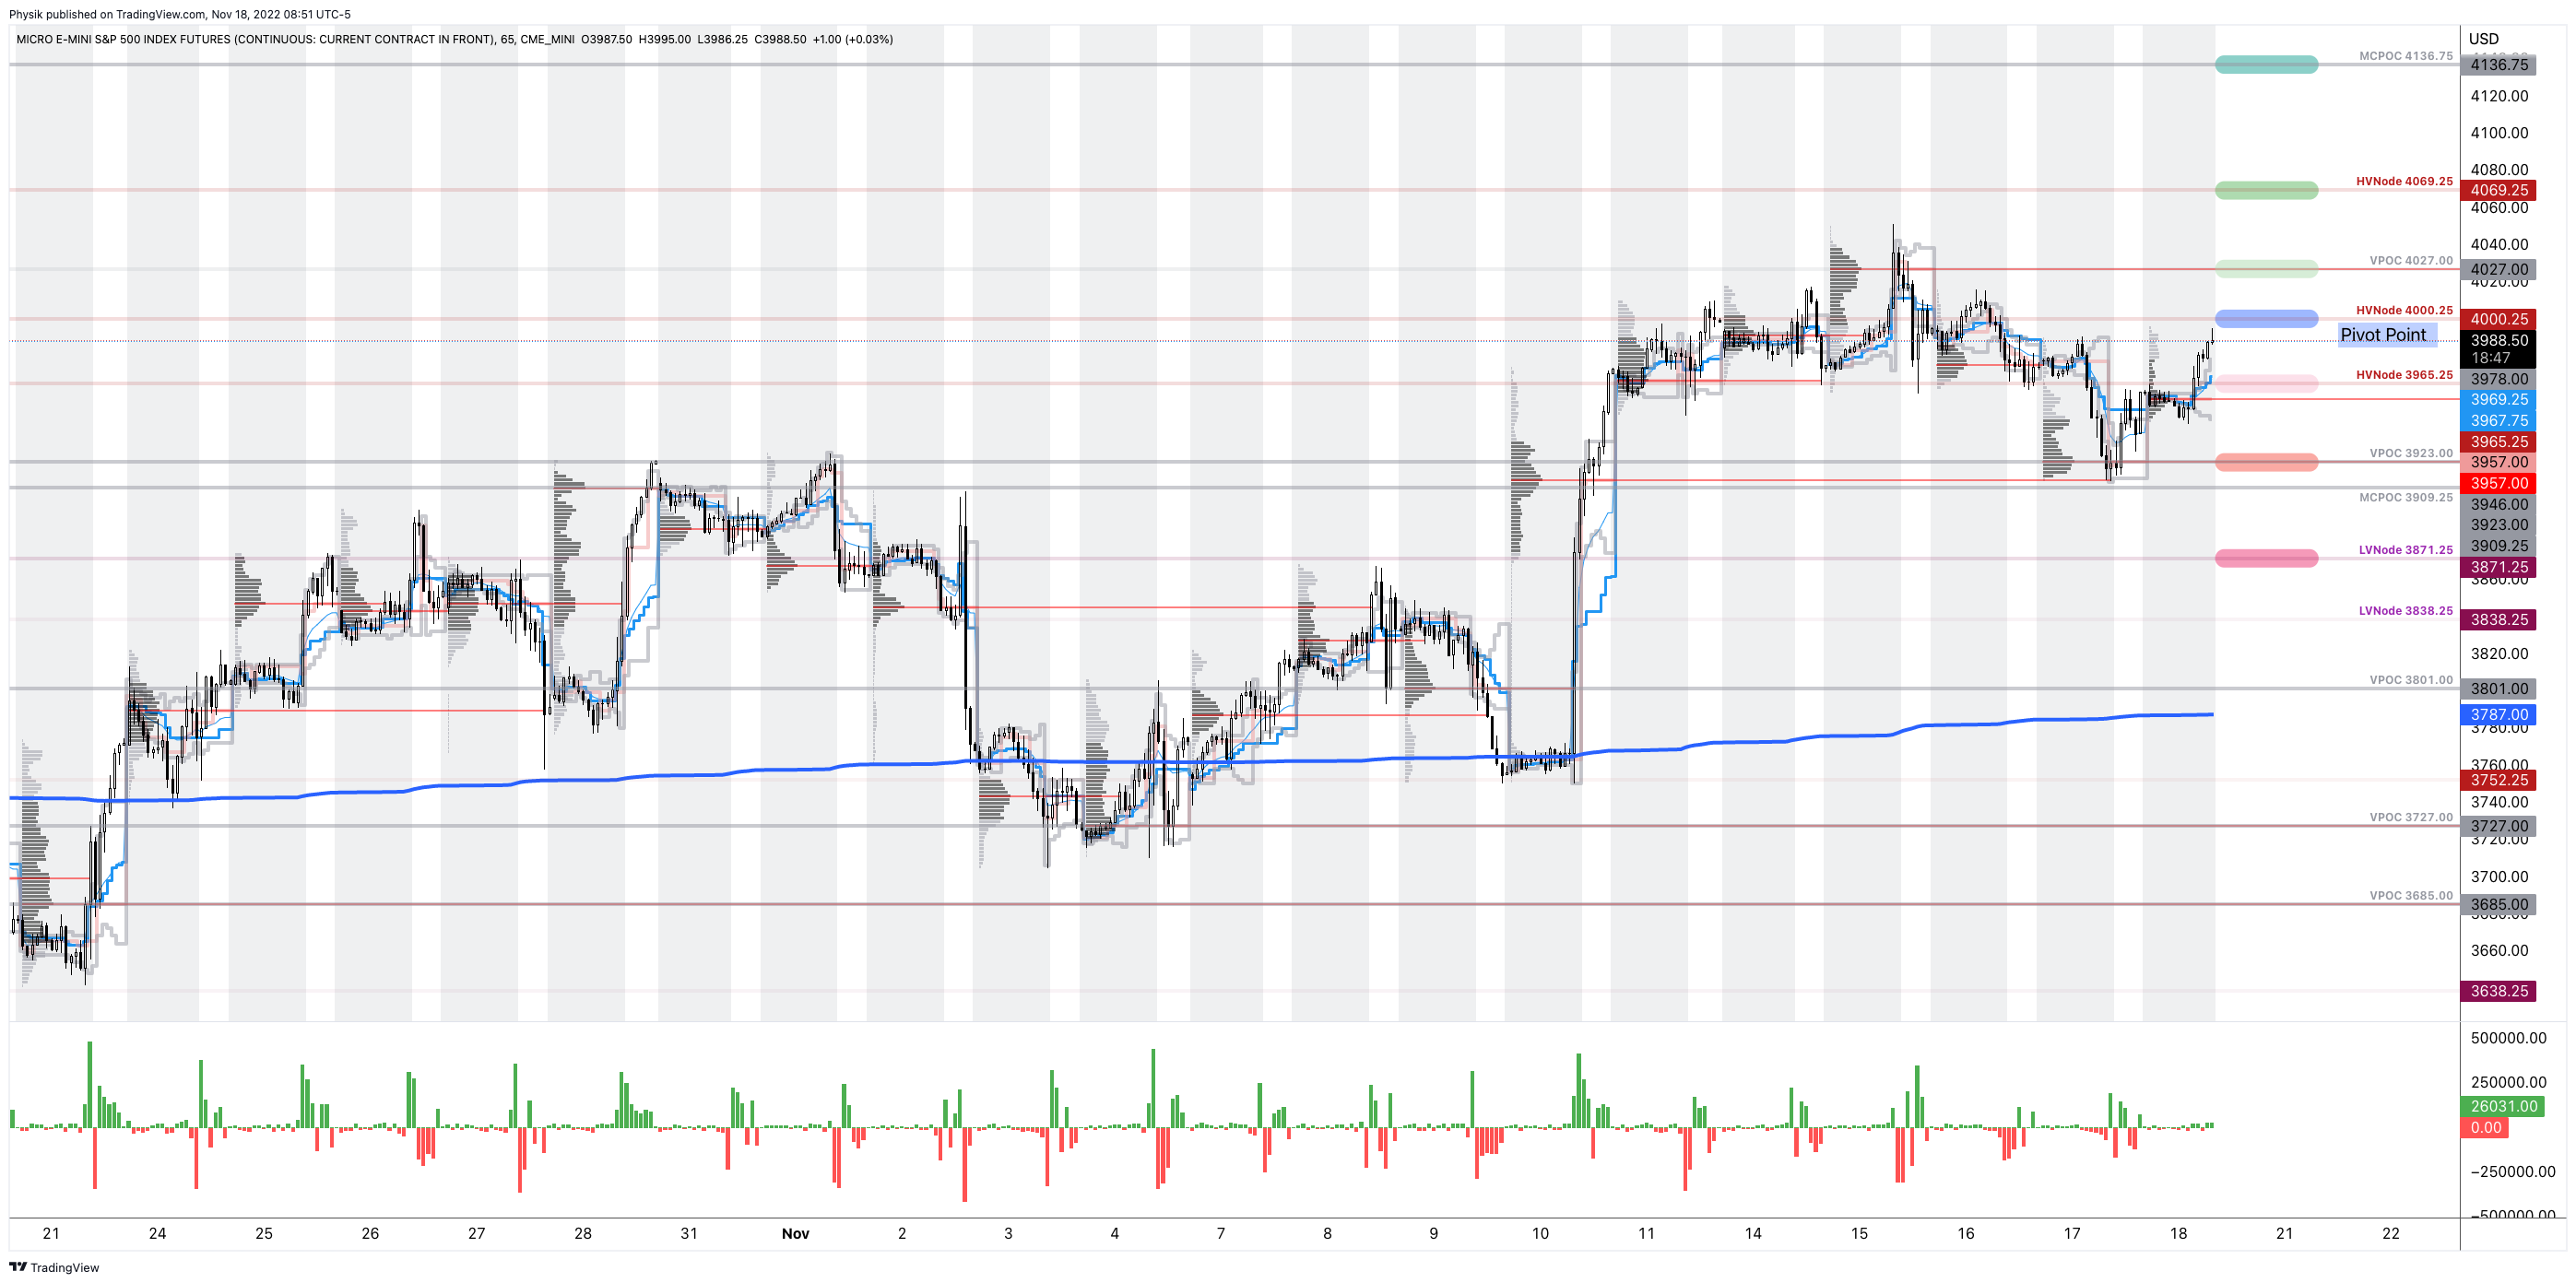
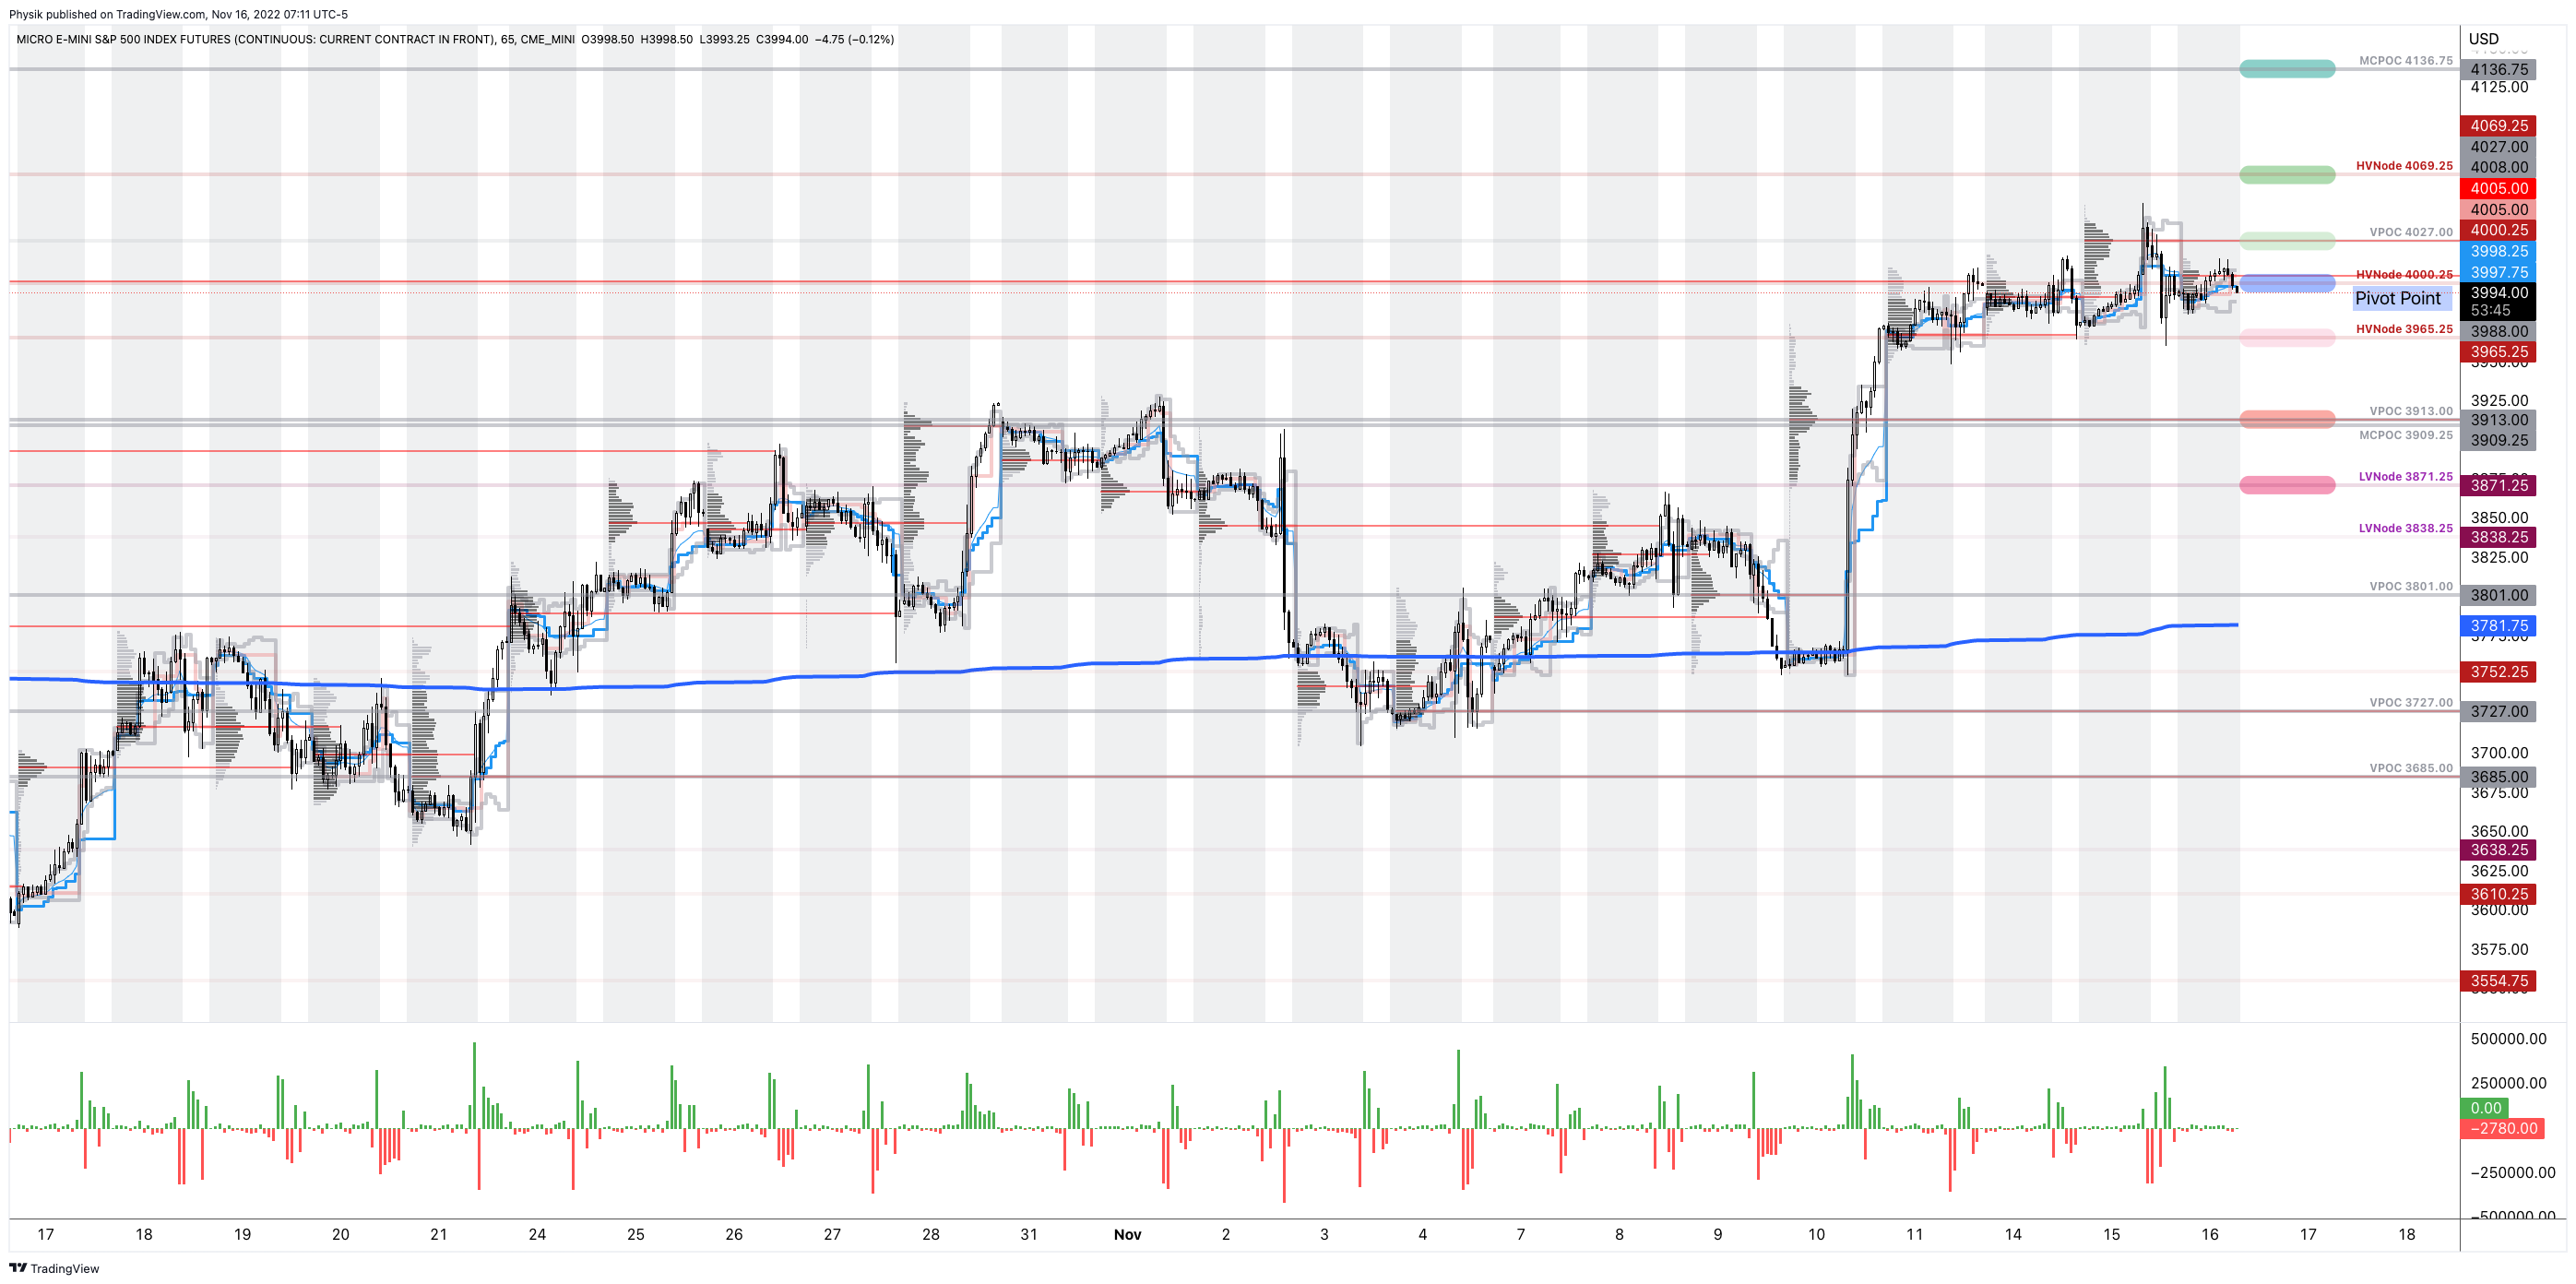
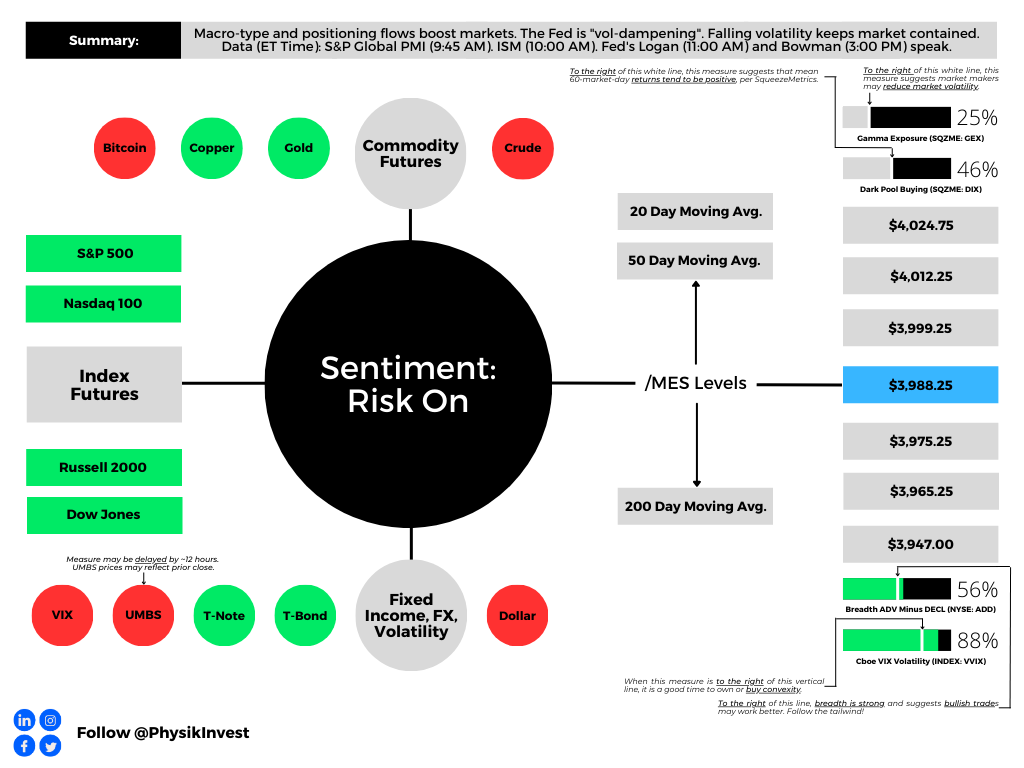
As of 6:50 AM ET, Friday’s regular session (9:30 AM – 4:00 PM ET), in the S&P 500, is likely to open in the upper part of a positively skewed overnight inventory, outside of the prior day’s range, suggesting a potential for immediate directional opportunity.
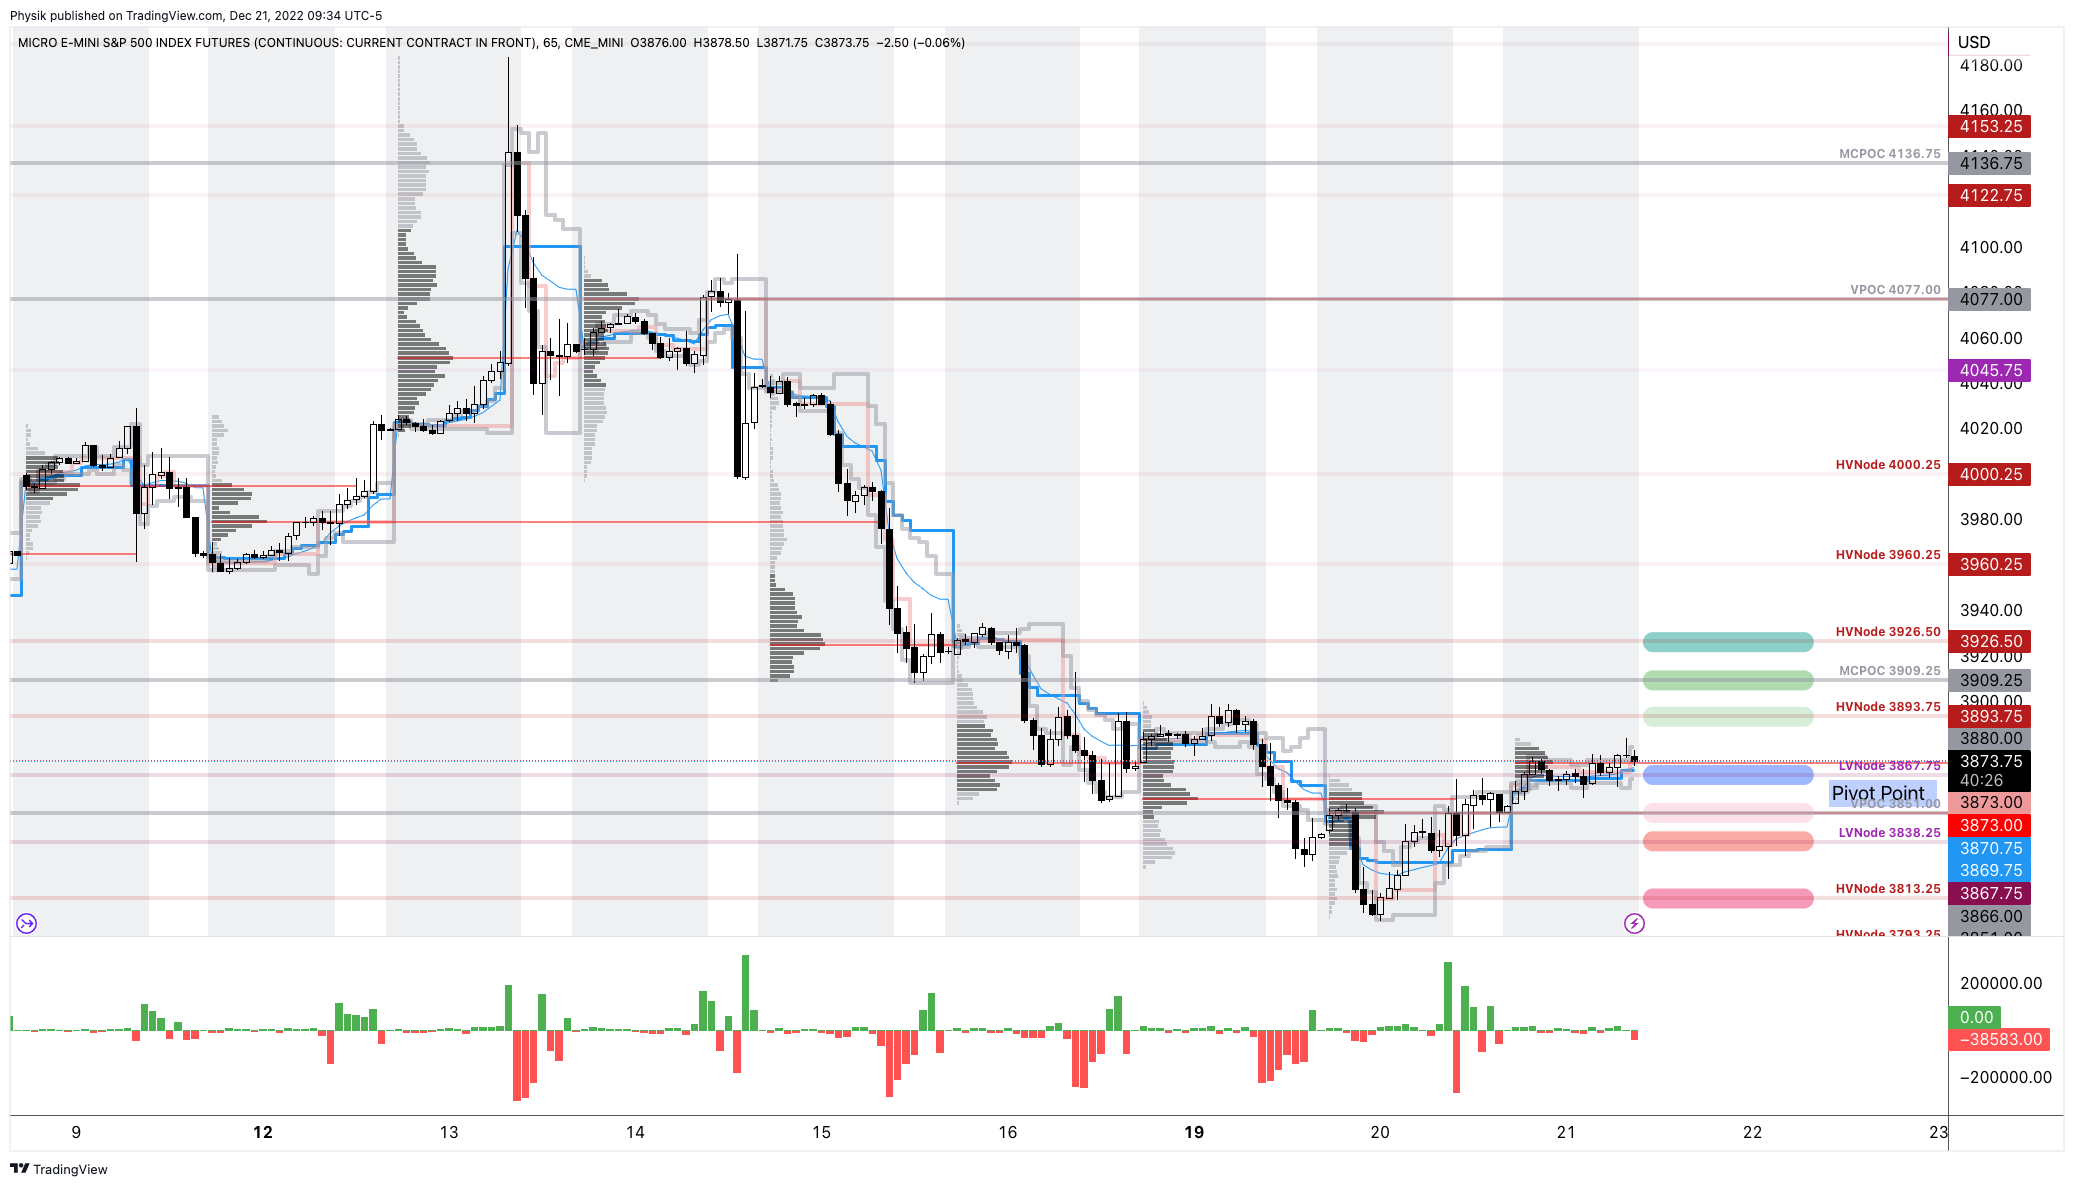
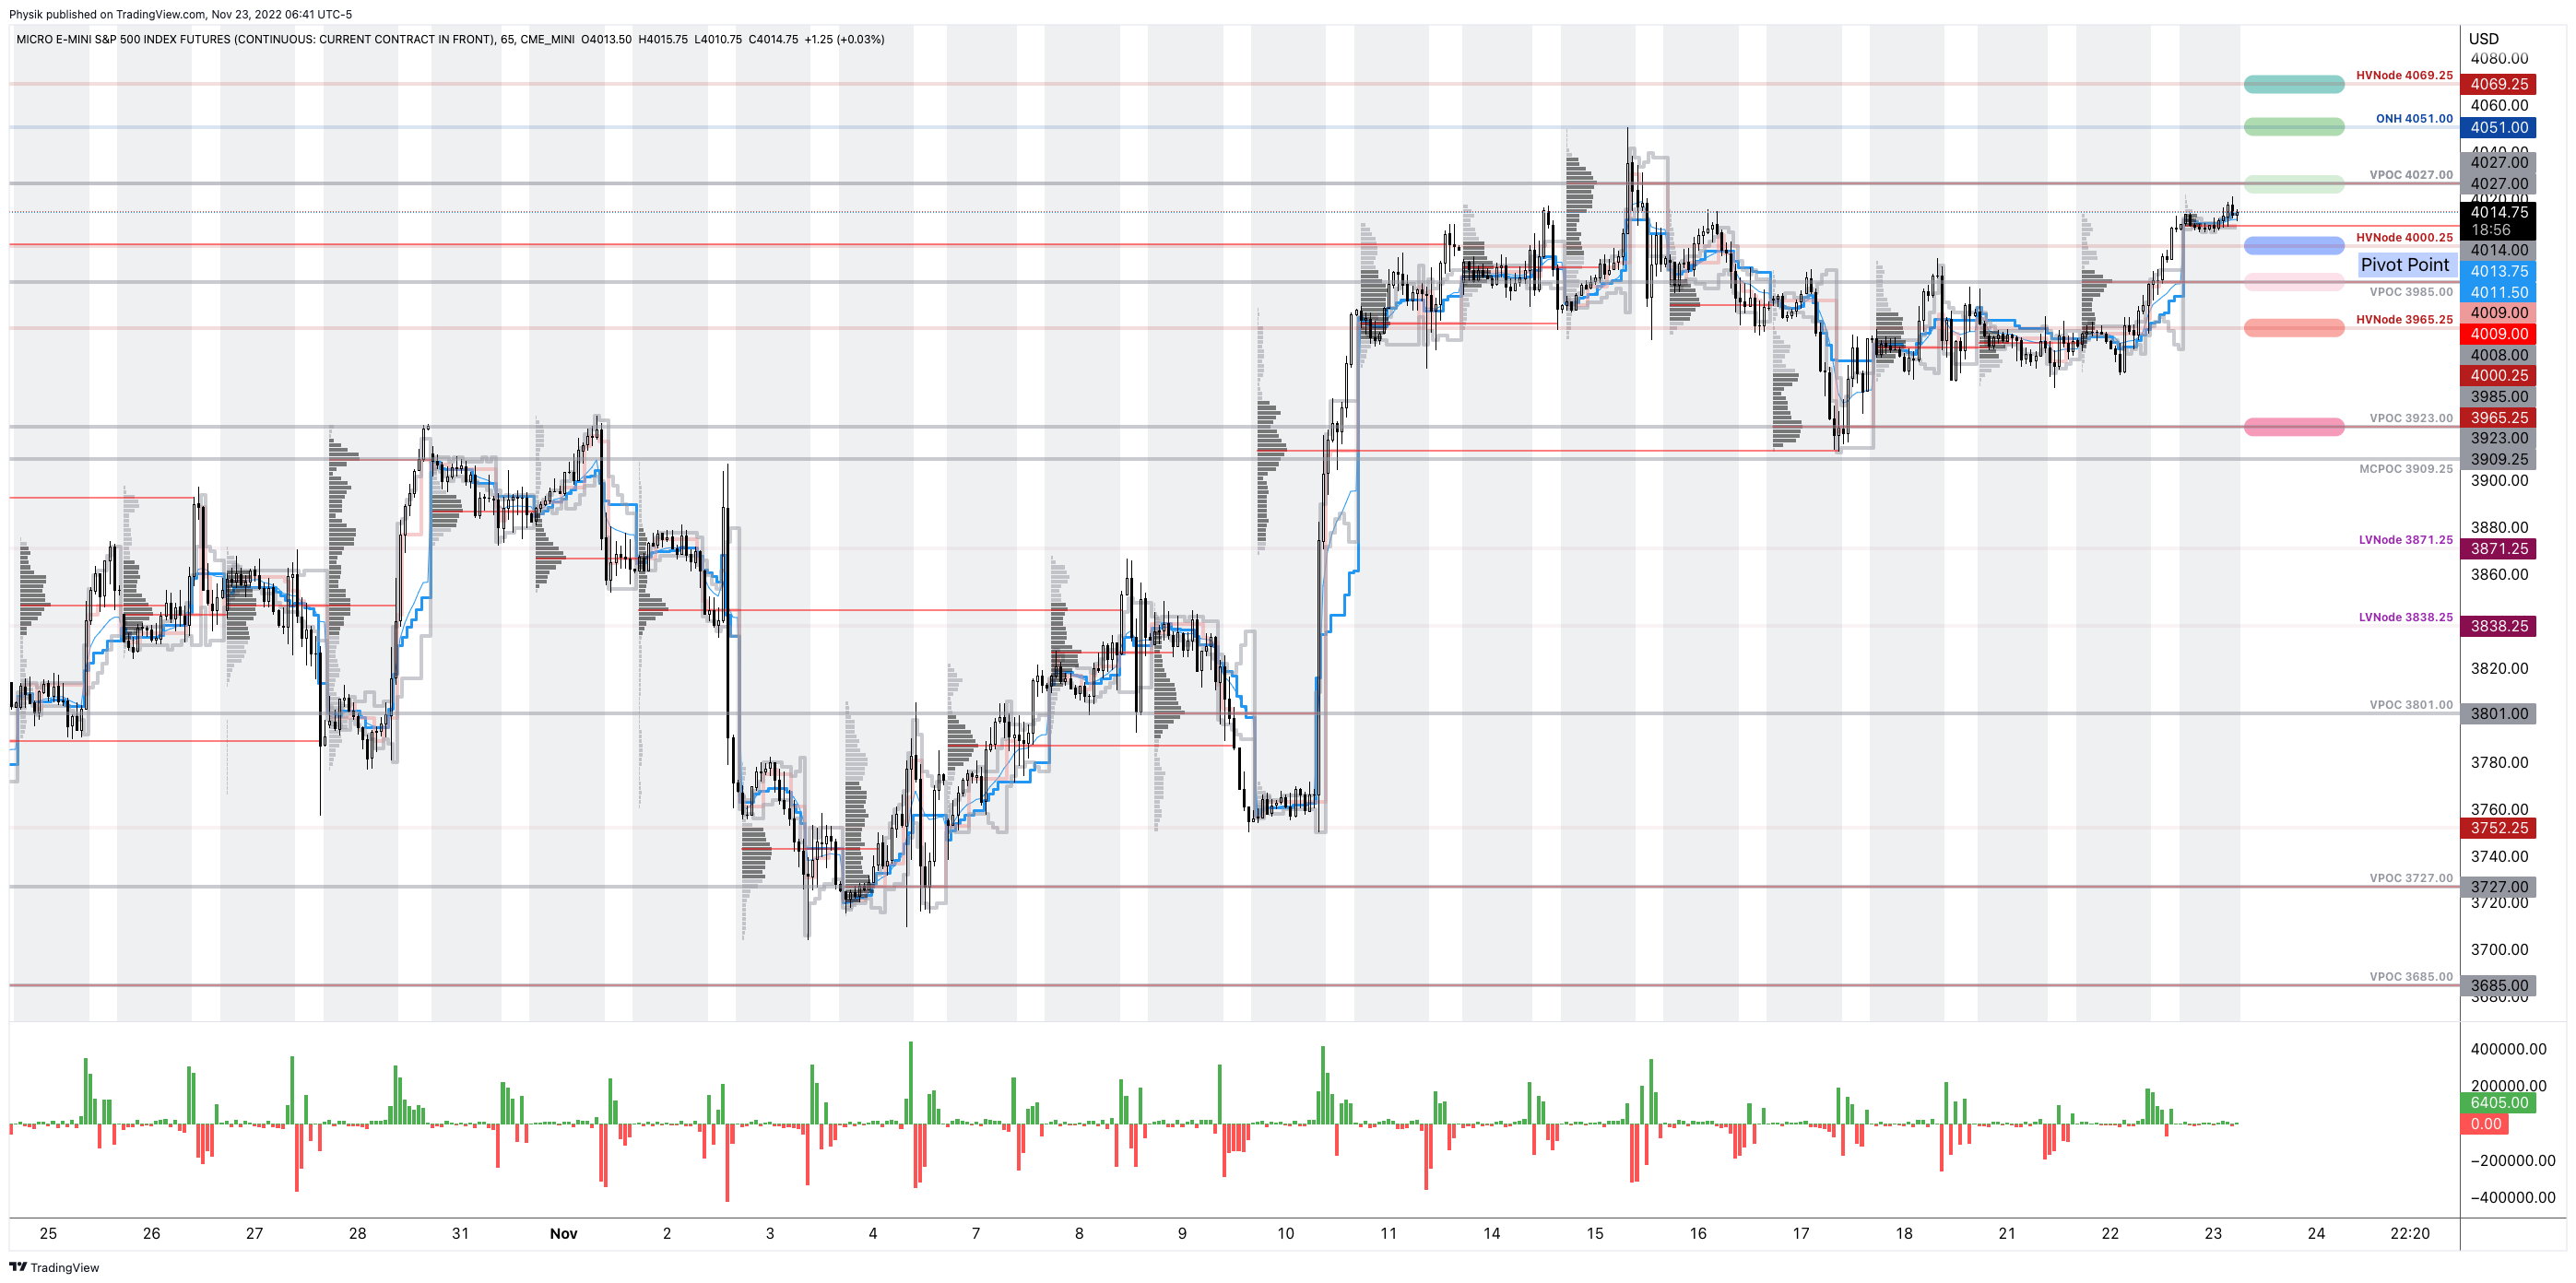
The S&P 500 pivot for today is $3,988.25.
Key levels to the upside include $3,999.25, $4,012.25, and $4,024.75.
Key levels to the downside include $3,975.25, $3,965.25, and $3,947.00.
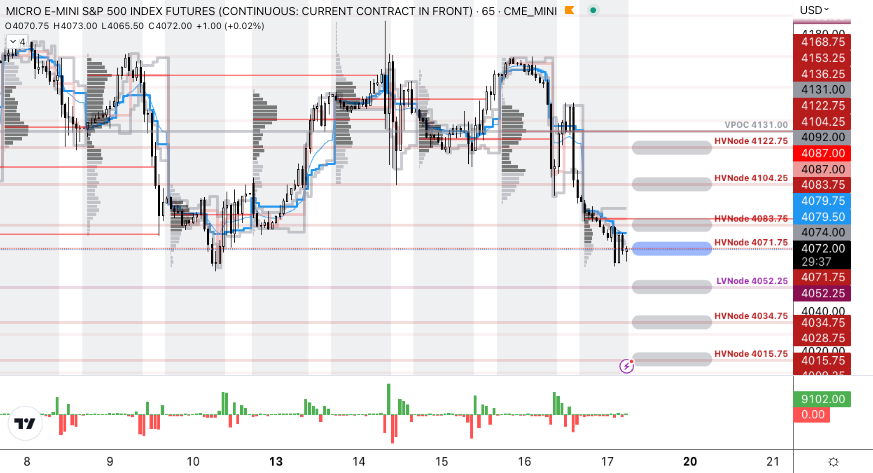
Disclaimer: Click here to load the updated key levels via the web-based TradingView platform. New links are produced daily. Quoted levels likely hold barring an exogenous development.

Definitions
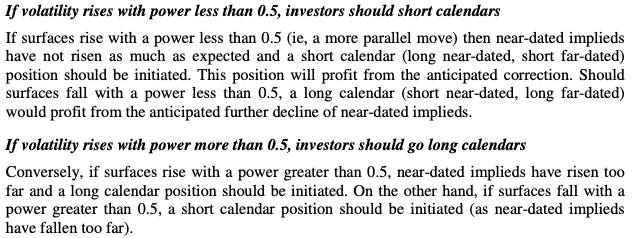
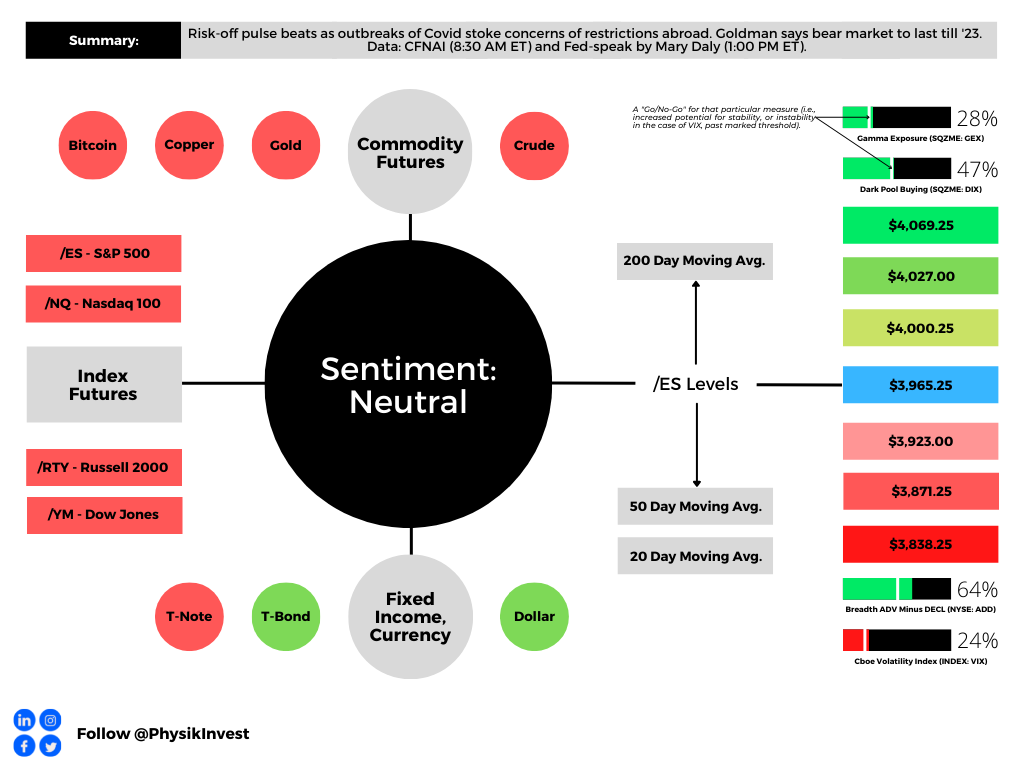
Volume Areas: Markets will build on areas of high-volume (HVNodes). Should the market trend for a period of time, this will be identified by a low-volume area (LVNodes). The LVNodes denote directional conviction and ought to offer support on any test.
If participants auction and find acceptance in an area of a prior LVNode, then future discovery ought to be volatile and quick as participants look to the nearest HVNodes for more favorable entry or exit.
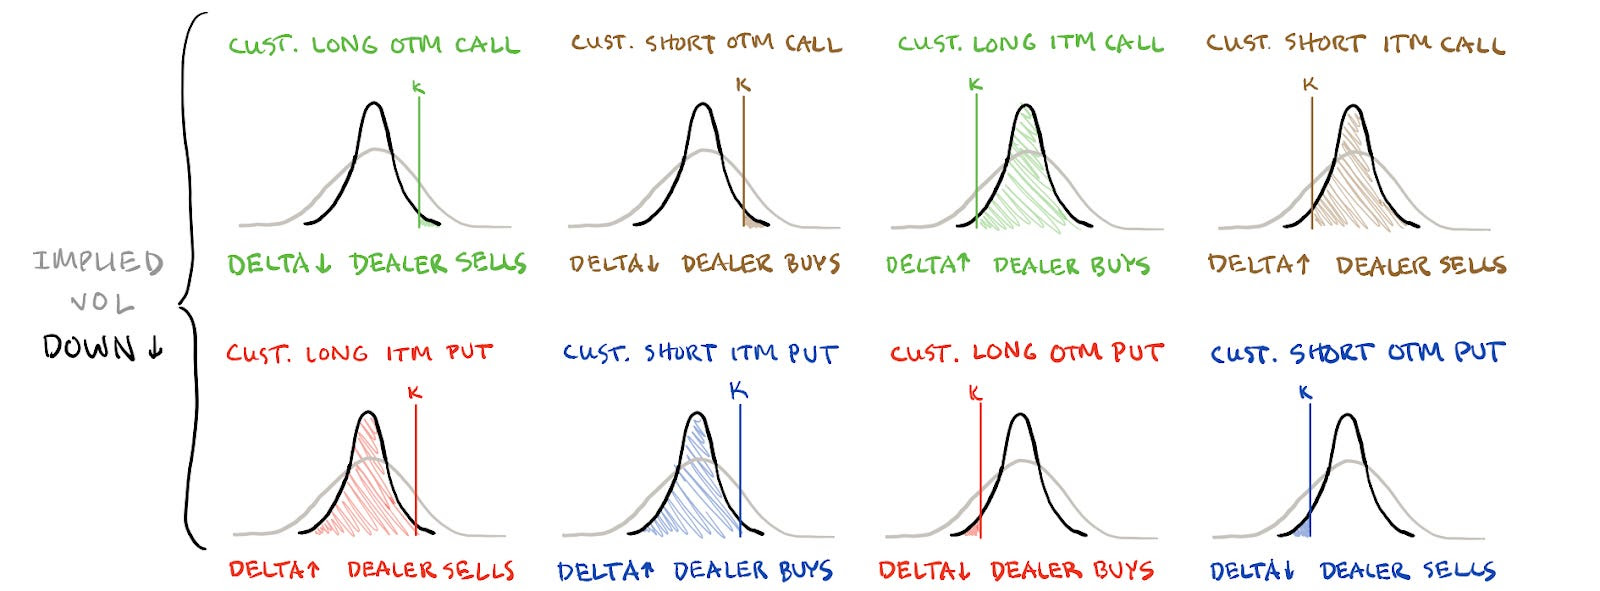
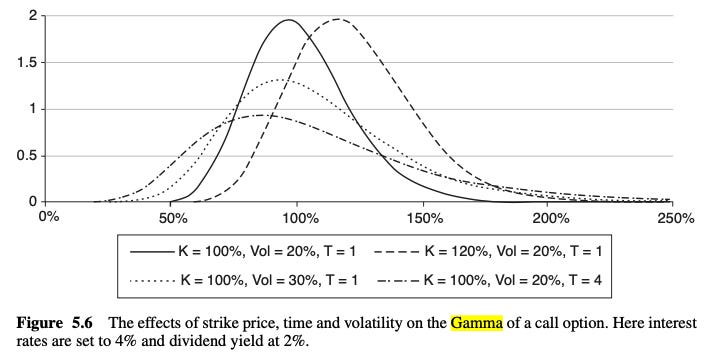
Vanna: The rate at which the Delta of an option changes with respect to implied volatility.
Charm: The rate at which the Delta of an option changes with respect to time.
POCs: Areas where two-sided trade was most prevalent in a prior day session. Participants will respond to future tests of value as they offer favorable entry and exit.
MCPOCs: Denote areas where two-sided trade was most prevalent over numerous sessions. Participants will respond to future tests of value as they offer favorable entry and exit.
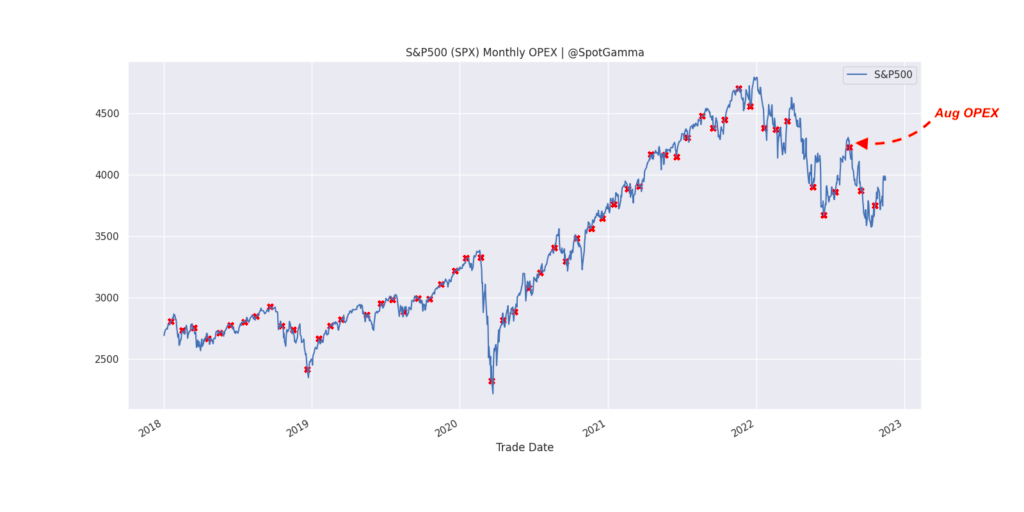
Options Expiration (OPEX): Reduction in dealer Gamma exposure. Often, there is an increase in volatility after the removal of large options positions and associated hedging.
Options: Options offer an efficient way to gain directional exposure.
If an option buyer was short (long) stock, he or she could buy a call (put) to hedge upside (downside) exposure. Additionally, one can spread, or buy (+) and sell (-) options together, strategically.
Commonly discussed spreads include credit, debit, ratio, back, and calendar.
- Credit: Sell -1 option closer to the money. Buy +1 option farther out of the money.
- Debit: Buy +1 option closer to the money. Sell -1 option farther out of the money.
- Ratio: Buy +1 option closer to the money. Sell -2 options farther out of the money.
- Back: Sell -1 option closer to the money. Buy +2 options farther out of the money.
- Calendar: Sell -1 option. Buy +1 option farther out in time, at the same strike.
Typically, if bullish (bearish), sell at-the-money put (call) credit spread and/or buy a call (put) debit/ratio spread structured around the target price. Alternatively, if the expected directional move is great (small), opt for a back spread (calendar spread). Also, if credit spread, capture 50-75% of the premium collected. If debit spread, capture 2-300% of the premium paid.
Be cognizant of risk exposure to the direction (Delta), movement (Gamma), time (Theta), and volatility (Vega).
- Negative (positive) Delta = synthetic short (long).
- Negative (positive) Gamma = movement hurts (helps).
- Negative (positive) Theta = time decay hurts (helps).
- Negative (positive) Vega = volatility hurts (helps).
About
The author, Renato Leonard Capelj, spends the bulk of his time at Physik Invest, an entity through which he invests and publishes free daily analyses to thousands of subscribers. The analyses offer him and his subscribers a way to stay on the right side of the market.
Separately, Capelj is an accredited journalist with past works including interviews with investor Kevin O’Leary, ARK Invest’s Catherine Wood, FTX’s Sam Bankman-Fried, North Dakota Governor Doug Burgum, Lithuania’s Minister of Economy and Innovation Aušrinė Armonaitė, former Cisco chairman and CEO John Chambers, and persons at the Clinton Global Initiative.
Connect
Direct queries to renato@physikinvest.com. Find Physik Invest on Twitter, LinkedIn, Facebook, and Instagram. Find Capelj on Twitter, LinkedIn, and Instagram. Only follow the verified profiles.
Calendar
You may view this letter’s content calendar at this link.
Disclaimer
Do not construe this newsletter as advice. All content is for informational purposes. Capelj and Physik Invest manage their own capital and will not solicit others for it.