Categories
Commentary

Turning Nickels Into Dollars: A Winning Strategy For Market Crashes

Good Morning! I hope you had a great weekend and enjoy today’s letter. I would be so honored if you could comment and/or share this post. Cheers!

Risk appetite in the last months was fueled by the emergence of a “goldilocks disinflation thesis,” describes Marko Kolanovic of JPMorgan Chase & Co. This thesis envisions a no-recession scenario where central banks cut rates early, especially in the lead-up to elections.

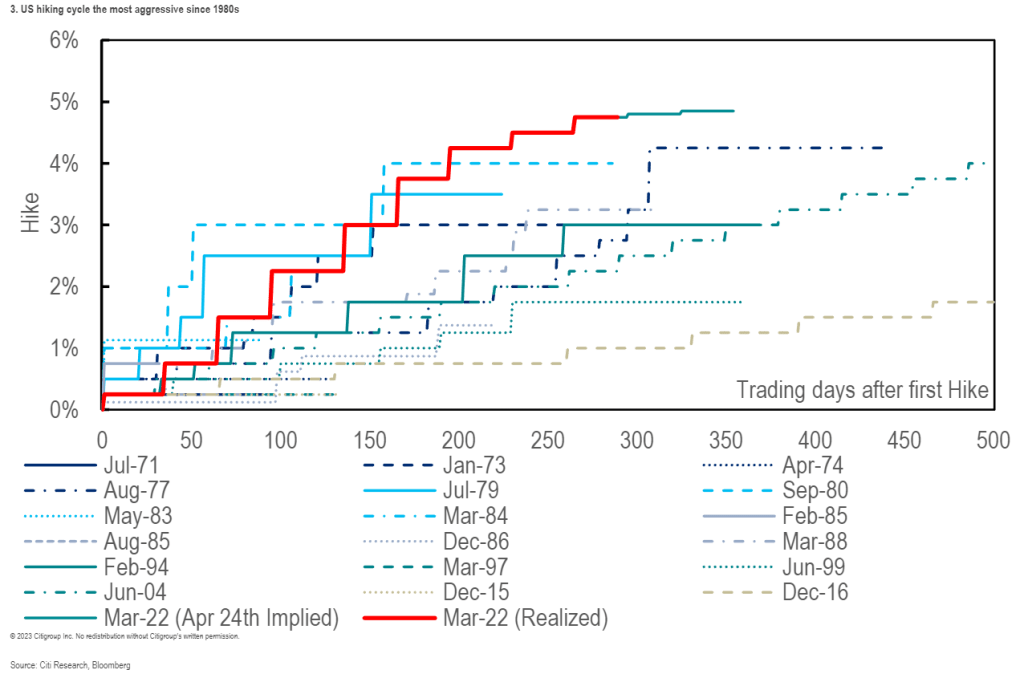
The market is banking on such anticipatory movement by the Federal Reserve, pricing five rate cuts and the target interest rate moving from 525-550 to 400-425 basis points by year-end. With the backdrop of easing liquidity conditions through 2025 and continuing economic growth, equity investors are positioning for a broader rally. This has led to churn and a loss of momentum.

Graphic: Retrieved from Carson Investment Research via Ryan Detrick.

Though historical trends encourage optimism, Kolanovic is concerned markets are overlooking geopolitical events, such as the Houthi shipping attacksexercises near the Suwałki Gap, and Russia’s testing of electronic warfare. Despite these potential disruptors, atypically low volatility skew and implied correlation indicate a lack of market responsiveness and positioning for less movement.

Recall skew reflects a scenario where increased market volatility disproportionately impacts farther away strike options due to losses from more frequent delta rebalancing in a moving market, leading option sellers to assign higher implied volatility to those strikes to compensate for increased risk. The relationship between index volatility and its components involves both individual volatilities and correlation, with implied correlation as a valuable indicator for pricing dynamics between index options and their components and trading volatility dispersion.

Appearing on The Market Huddle, Kai Volatility’s Cem Karsan emphasized the impact of more structured product issuance and investor volatility selling on index levels, describing how it pins the index and lowers correlation. When a dealer, bank, or market maker on the other side owns options, they need to buy the market when it goes down and sell when it goes up, keeping the index tight and realized volatility low. Much less of this, or even the opposite, is happening in single stocks, so they aren’t experiencing the same level of suppression.

Graphic: Retrieved from The Ambrus Group’s Kris Sidial. Higher short Vega exposure, growing derivative income fund and equity short vol hedge fund AUM, a larger auto-callable market, and record-high dispersion trading flow suppress index vol, posing significant risks.

“As dealers buy and sell index exposure, market makers will attempt to keep the index level and the underlying basket in line via arbitrage constraints,” Newfound Research well explained in their Liquidity Cascades paper. “If dealer hedging has suppressed index-level volatility, but underlying components are still exhibiting idiosyncratic volatility, then the only reconciliation is a decline in correlation.”

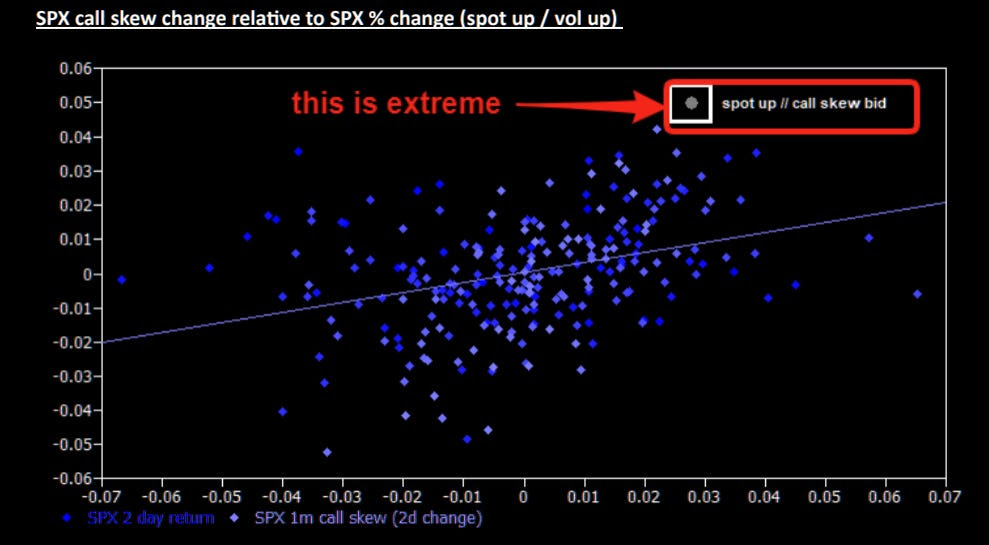
SpotGamma’s Brent Kochuba weighs in, noting low correlation typically aligns with interim stock market highs, presenting a potential cause for caution. Examining data since January 2018, Kochuba points out that the SPX’s average close-to-close change is 88 basis points, with the open-to-close average at 70 basis points. This analysis suggests the current SPX implied volatility (IV) is relatively low. While low IV levels can persist, the concern arises as current readings hint at overbought conditions.

“These low IVs can last for some time, but the general point here is that current readings are starting to suggest overbought conditions as index vols are priced for risk-less perfection, and single stock vols expand due to upside call chasing.”
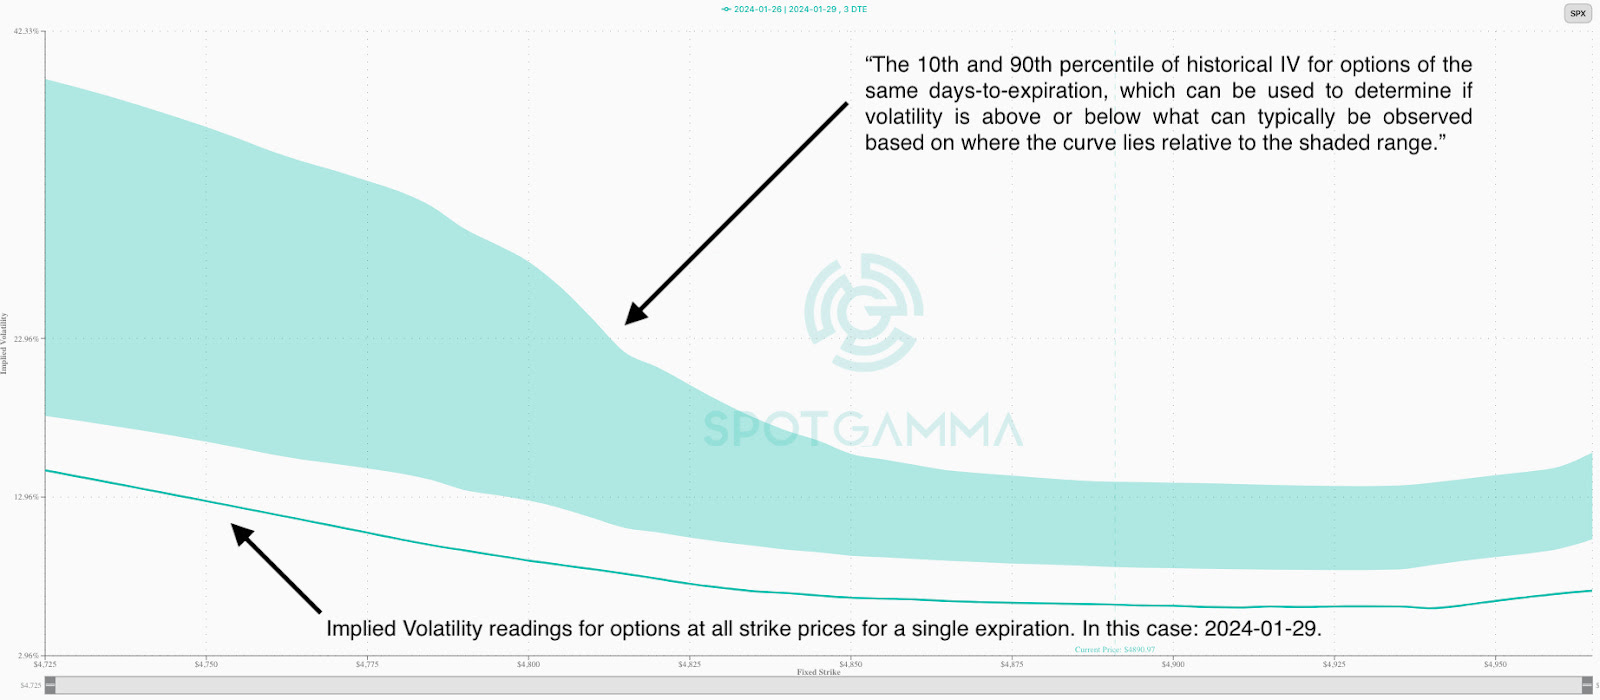
Graphic: Retrieved from SpotGamma. Short-dated S&P 500 implied volatility is compressed. Updated Sunday, January 28, 2024.

Nomura Cross-Asset Macro Strategist Charlie McElligott explains selling volatility, which continues to attract money as it’s been profitable, is a stabilizing trade in most cases. Kris Sidial, Co-Chief Investment Officer at The Ambrus Group, warns it may end spectacularly in his most recent appearances. The situation in China is a cautionary example, where stock volatility triggered a destructive selling cycle as market participants grappled with structured product risk management.
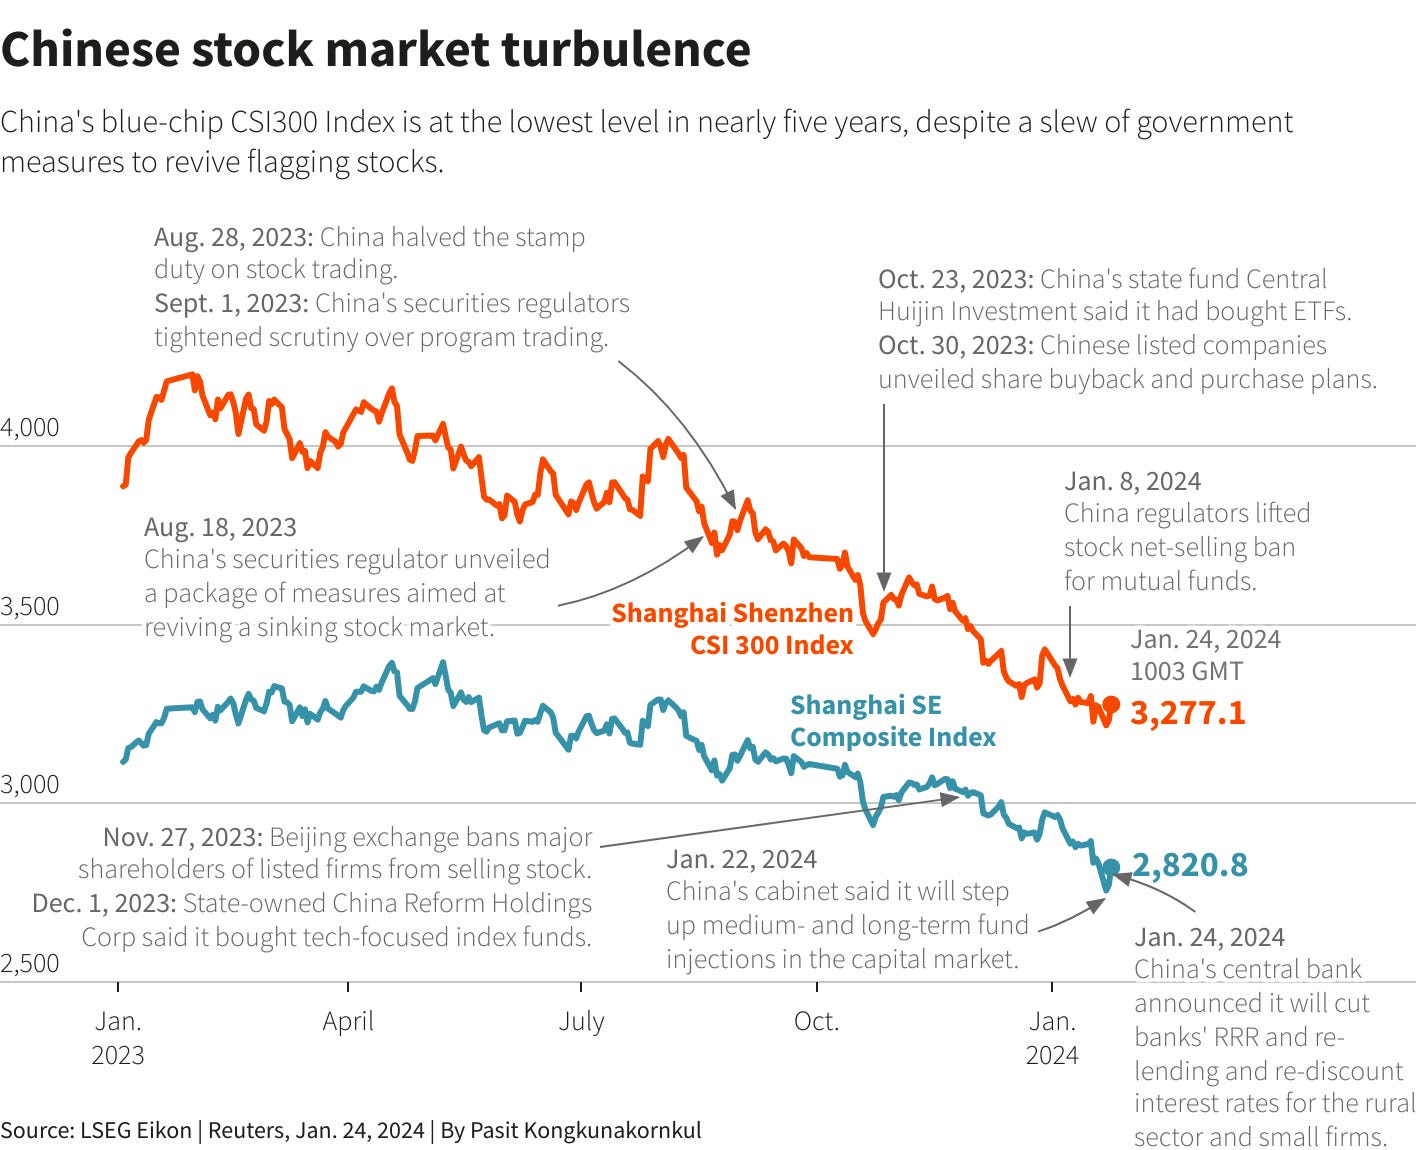
Graphic: Retrieved from Reuters.

Accordingly, for those who perceive a meaningful chance of movement, there is value in owning options, Goldman Sachs Group says, noting they expect more movement than is priced.

Graphic: Retrieved from Goldman Sachs Group via VolSignals.

Karsan, drawing parallels to the unwind of short volatility and dispersion trade from February to March of 2020, says the still-crowded trade can be compared to two sumo wrestlers or colossal plates on the Earth’s core exerting immense pressure against each other. While the trade may appear balanced and continue far longer, the accumulated pressures pose significant risks.
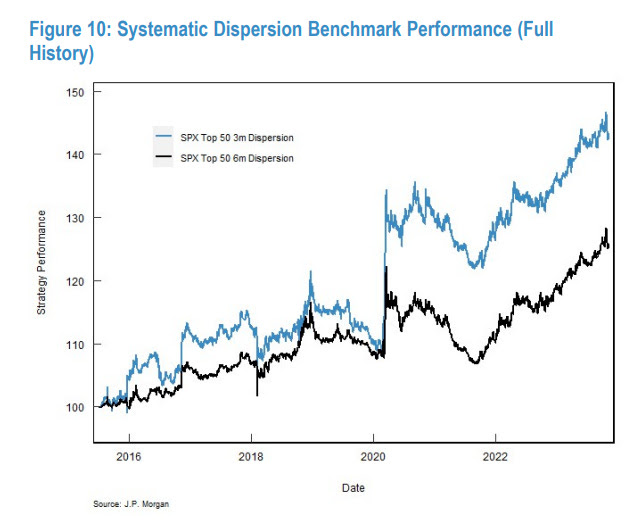
Graphic: Retrieved from JPMorgan Chase & Co via @jaredhstocks.

Major crashes happen when entities must trade volatility and options. Often, the trigger is the inability to cover the margin and meet regulatory requirements, causing a cascading effect.

Karsan, drawing on 25 years of experience, notes a precursor to a crash is a weakening supply of margin puts, particularly the highly convex and far out-of-the-money ones. These options play a significant role during stressful market periods, acting as indicators and drivers of impending crashes. The focus is on their convexity rather than whether they will be in the money, as the margin requirements become a determining factor in their impact on market dynamics. History shows a minor catalyst can lead to a dramatic unwind, turning one week to expiry $0.05 to $0.15 S&P 500 put options into $10.00 overnight.

“Prior to the XIV crash day, … going into the close the last hour, we saw nickel, ten, and five-cent options trade up to about $0.50 and $0.70. They really started to pop in the last hour. And then, the next day, we opened up and they were worth $10.00. You don’t see them go from a nickel to $0.50 very often. If you do, don’t sell them. Buy them, which is the next trade.”
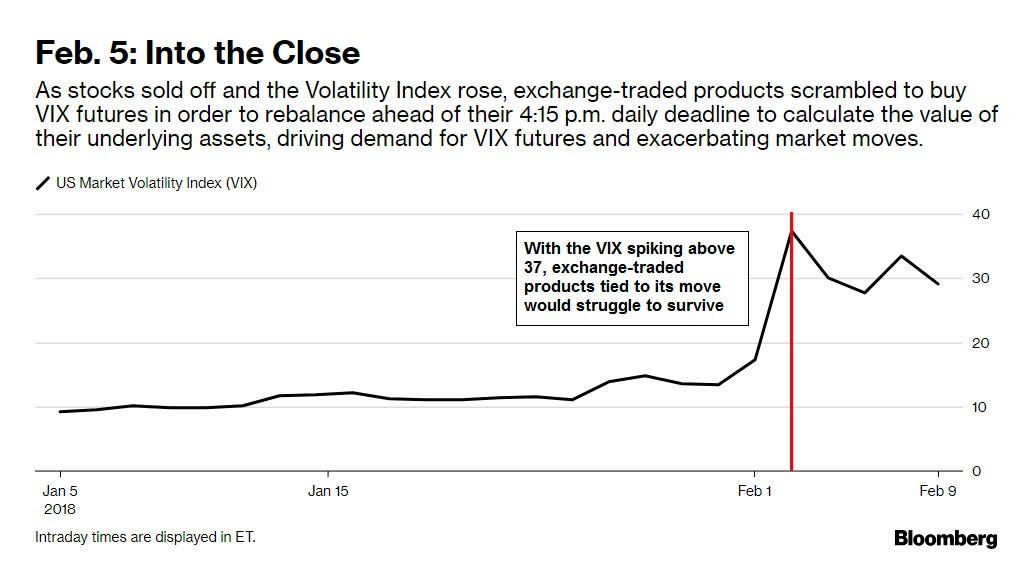
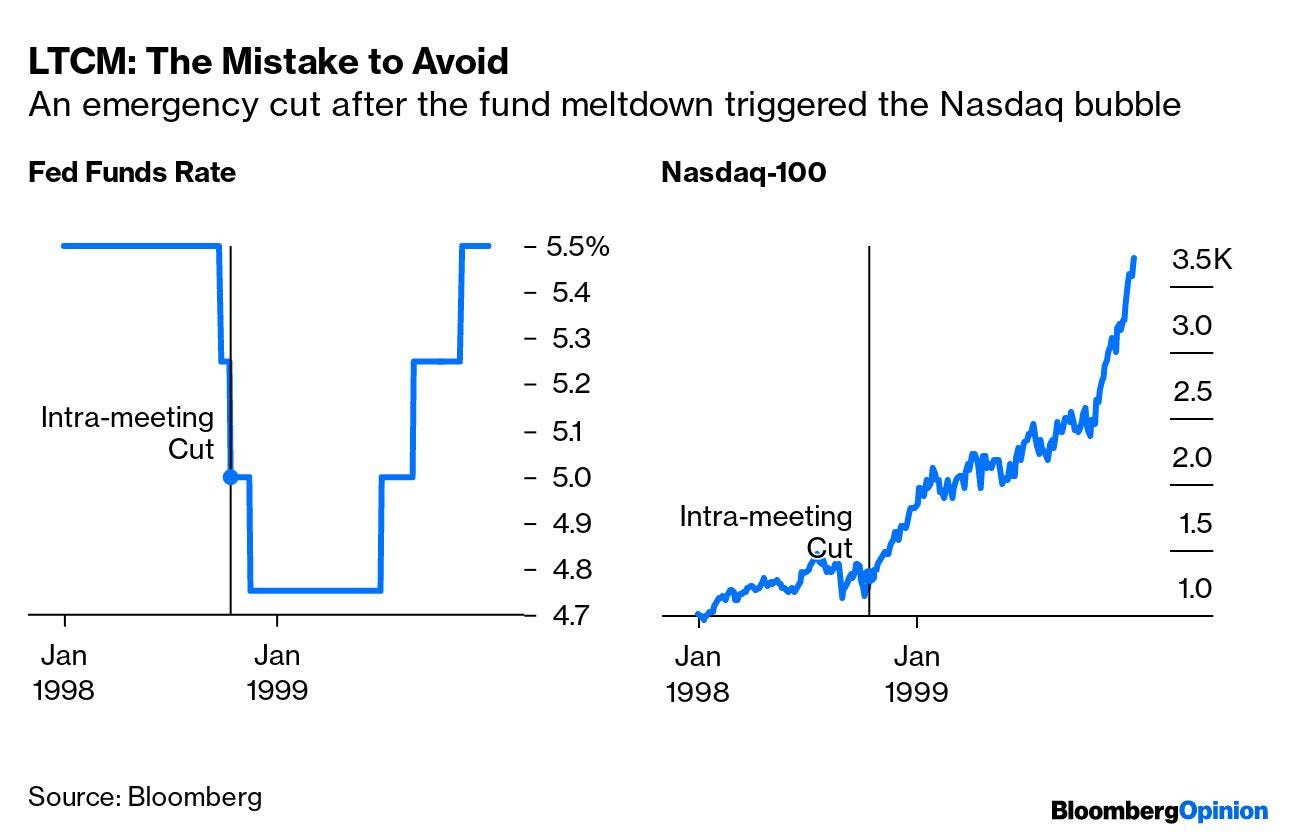
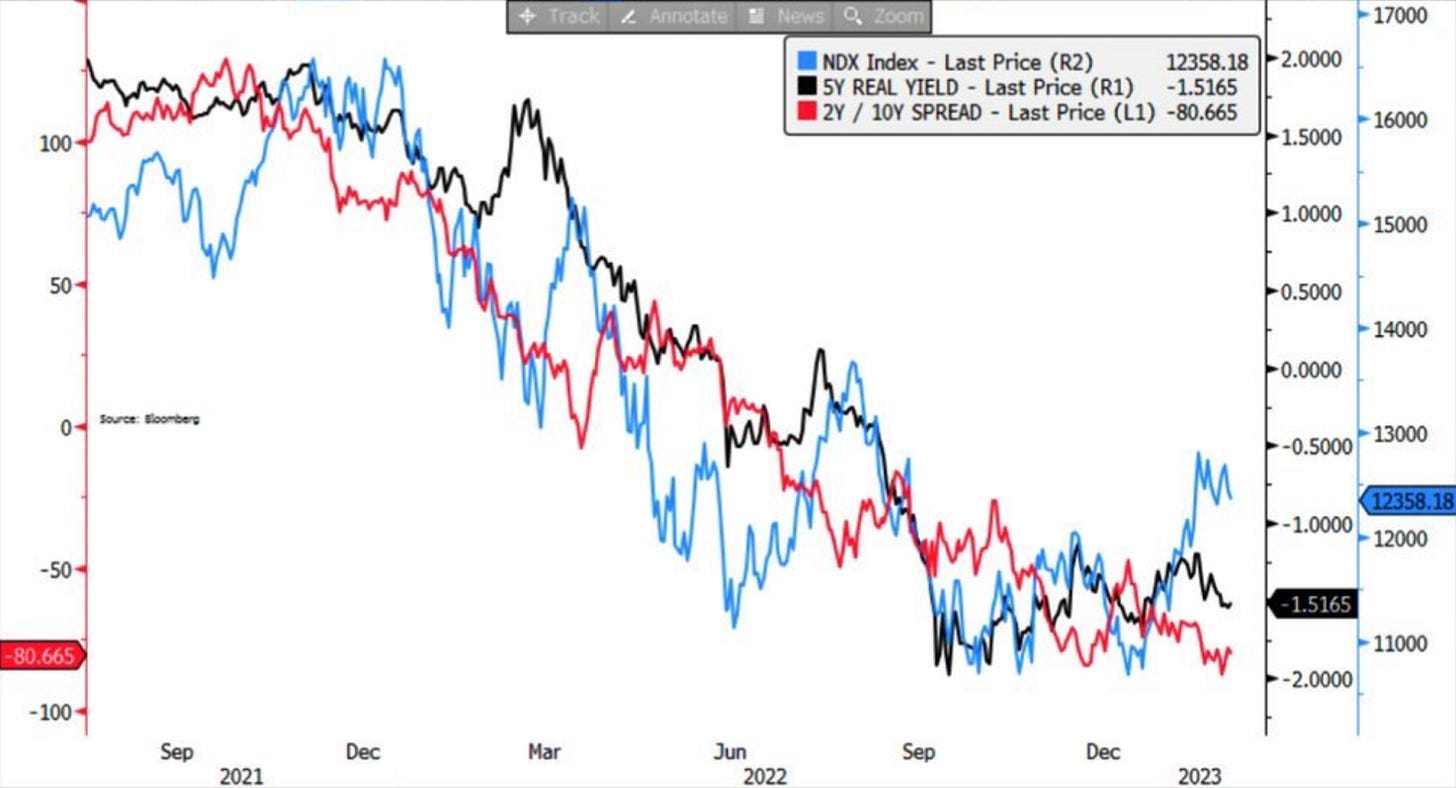
Graphic: Retrieved from Bloomberg.

Setting aside the pessimistic narrative, the current scenario favors continued ownership of risk assets. Cautious optimism surrounds this week’s Quarterly Refunding Announcement (QRA), “depending on how much bill issuance is scaled back and on the absolute funding needs,” CrossBorder Capital explained, coupled with Fed-speak and anticipation of cutting interest rates on falling inflation later this year. Still, according to Unlimited Funds ‘ Bob Elliott, predicting outcomes following this week’s releases lacks an advantage; instead, in this environment of churn, momentum loss, and indicators like low correlation and volatility, last week’s trades for managing potential downside stick out, particularly vis-à-vis volatility skew.

Graphic: Retrieved from SpotGamma. Updated Sunday, January 28, 2024.
Categories
Commentary

Daily Brief For May 2, 2023

LOAD LEVELS ON TRADINGVIEW BY CLICKING HERE.

First Republic Bank (NYSE: FRC) is in the news for its failure. FRC was known for handing out mortgages at rock-bottom rates. When interest rates rose, the bank’s book of mortgages was hurt and left it with not enough to suffice withdrawals. 

“FRC believed its business model of extraordinary customer service and product pricing would result in superior customer loyalty through all cycles,” wrote Timothy Coffey of Janney Montgomery Scott. “Instead, too many FRC customers showed their true loyalties were to their own fears.”

This “marks the second-biggest bank failure in U.S. history, behind the 2008 collapse of Washington Mutual Inc.,” reports WSJ; after the instability in March, the bank finally succumbed to the Federal Reserve’s (Fed) rate increases and depositor worry.

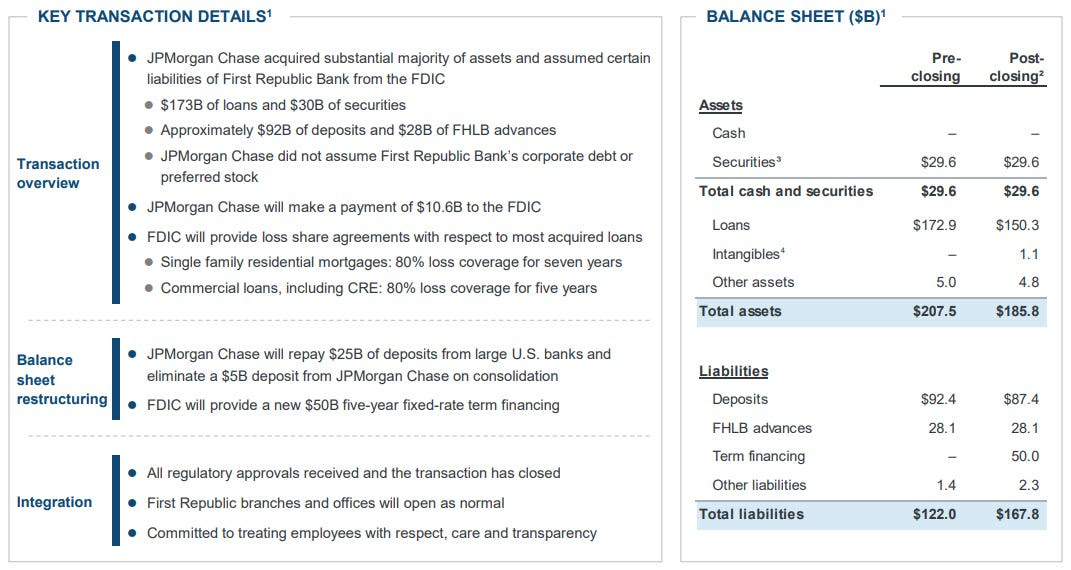
JPMorgan Chase & Co (NYSE: JPM) acquired the bulk of FRC’s operations.

Graphic: Retrieved from JPM. See a nice summary by @brandonjcarl.

Further, research shows money is getting tighter, a headwind for the economy, while inflation is sticky and the Fed’s bond holdings are preventing tightening from being effective; WSJ reports the Fed’s balance sheet loaded with bonds may be insulating stocks from interest rate policies. 

“Quantitative easing locked the Fed into a position that is difficult to unwind,” said Stephen Miran of Amberwave Partners. Quantitative easing, or QE, made stocks less sensitive to interest rates. “It’s made tightening both slower and less effective than it should have been.”

Graphic: Retrieved from Bloomberg. The Fed’s favorite measure of inflation, the core PCE index, has been consistently stuck around 4-5% since 2022. The employment cost index, which shows wage growth at around 4-5%, is inconsistent with a 2% inflation target.

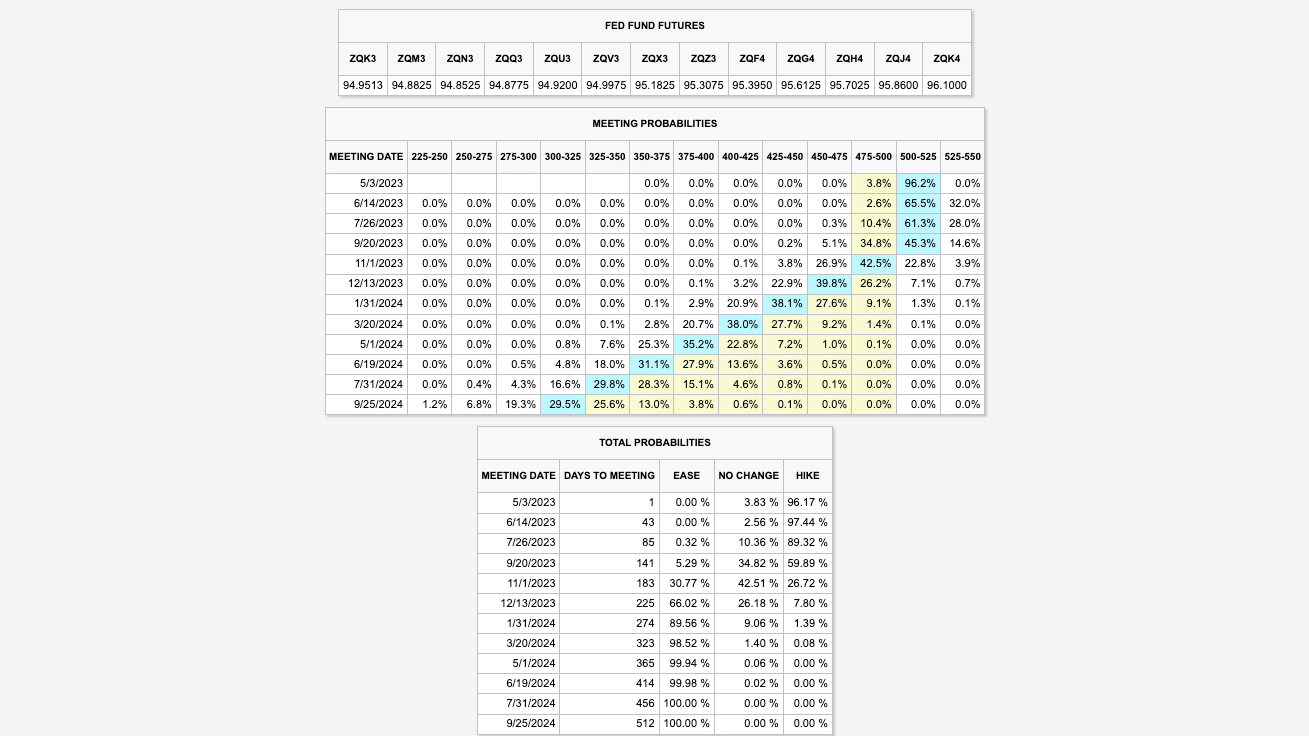
Not “adjusting balance-sheet policy,” but raising rates to 5.00-5.25% as expected, ‘is akin to “hitting the same nail with a hammer over and over again.’” Therefore, stocks, which are higher alongside surprising economic and earnings data, though risky, can do “ok” for longer, comments Andy Constan of Damped Spring Advisors.

Graphic: Retrieved from CME Group Inc’s (NASDAQ: CME) FedWatch Tool.

The sale of volatility bolsters the stability and emboldens upside bettors, adds JPM’s Marko Kolanovic, who finds “selling of options forces intraday reversion, leaving the market price virtually unchanged many days.”

Graphic: Retrieved from Goldman Sachs Group Inc (NYSE: GS).

“This, in turn, drives buying of stocks by funds that mechanically increase exposure when volatility declines (e.g., volatility targeting and risk parity funds),” he elaborates. “This market dynamic artificially suppresses perceptions of fundamental macro risks. The low hurdle rate and robust fundamentals bode well for 1Q earnings results, but we advise using any market strength on reporting to reduce exposure.”

At this juncture, yes, stocks can move sideways or higher for a bit longer as a function of “momentum, not value,” Simplify Asset Management’s Michael Green concludes. Traders can position for this and various levels of potential upset later with structures included in a report we published last week.


About

Welcome to the Daily Brief by Physik Invest, a soon-to-launch research, consulting, trading, and asset management solutions provider. Learn about our origin story here, and consider subscribing for daily updates on the critical contexts that could lend to future market movement.

Separately, please don’t use this free letter as advice; all content is for informational purposes, and derivatives carry a substantial risk of loss. At this time, Capelj and Physik Invest, non-professional advisors, will never solicit others for capital or collect fees and disbursements. Separately, you may view this letter’s content calendar at this link.

Categories
Commentary

Daily Brief For April 4, 2023

LOAD LEVELS ON TRADINGVIEW BY CLICKING HERE.

Administrative Bulletin

Welcome to the Daily Brief by Physik Invest, a soon-to-launch research, consulting, trading, and asset management solutions provider. Learn about our origin story here, and consider subscribing for daily updates on the critical contexts that could lend to future market movement.

JPMorgan Chase & Co’s (NYSE: JPM) Marko Kolanovic believes the equities rally will falter, with headwinds from bank turbulence, an oil shock, and slowing growth poised to send stocks back toward their 2022 lows over the coming months. Kolanovic says this is “the calm before the storm,” adding that the equity rally is masking weaknesses from recent bank collapses and a decline in corporate profits and growth.

Read: Black Knight Mortgage Monitor Report.

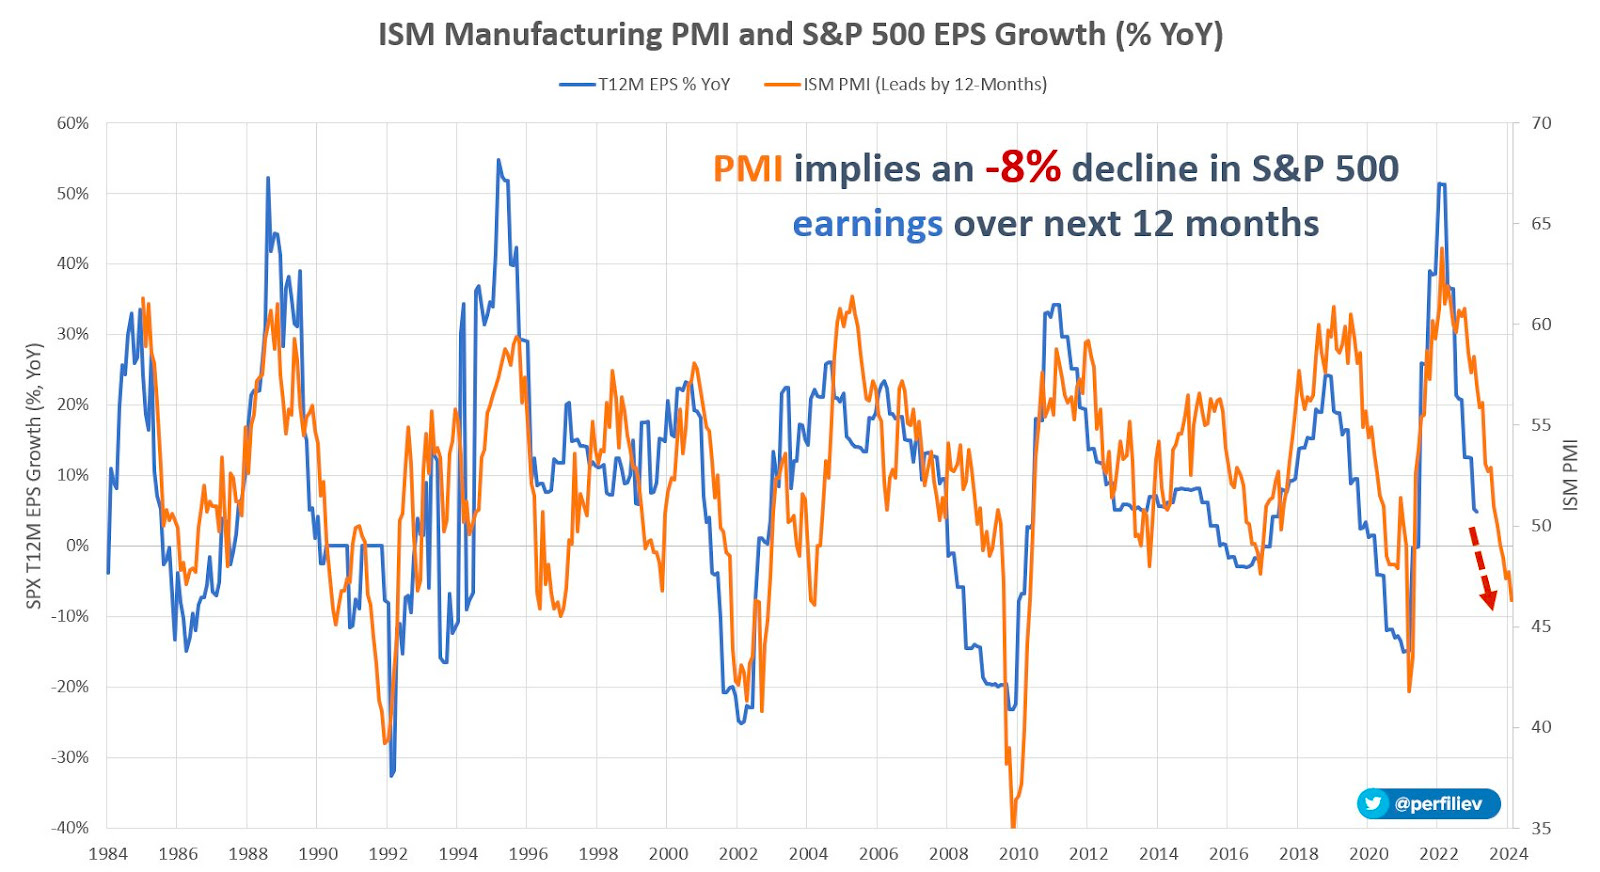
As a validation, we can look to ISM’s inventories exceeding that of new orders, and a dip in cost-push prices, Bloomberg’s John Authers explains. The overall ISM measure is recessionary; the upcoming earnings season may be unforgiving, and companies with weaker EPS are likely to be penalized more due to the prospects of a recession.

Graphic: Retrieved from Sergei Perfiliev. “Based on this relationship, today’s PMI reading of 46.3 implies an earnings contraction of about 8% over the next 12 months or an SPX EPS of 204. Using the current forward PE ratio of 18.7, this leads to an index level of about 3,815. A ‘recessionary’ PE ratio of 15 will see the index at ~3,060, assuming earnings don’t fall further.”

Tech’s outperformance, driven partly by a supply of previously demanded downside put protection, has become even more magnified recently as traders ramped up bets that banking system stresses prompt the Federal Reserve to hit the brakes.

Read: SOFR Futures And Options 1st Edition

Graphic: Retrieved from @countdraghula. “We aren’t seeing the same thing for out-of-the-money calls on front-end futures. BUYING A CALL on front-end futures is taking a bet on Fed rates collapsing, especially if it is considerably out of the money, as below. Pricing for these is still sky high, despite some calm.”

Over the past weeks, we anticipated the markets trading “spiritedly for far longer,” quoting the likes of Kai Volatility’s Cem Karsan, who said the signs of a combustible situation would emerge when options implied volatility is sticky in a market rally.

Typically, as the market trades higher, volatility levels for fixed-strike options should decrease. If broad implied volatility measures are bid and fixed-strike volatility increases, this may lead to a more combustible situation as options counterparties begin to thin out on volatility, resulting in less support.

We maintain that you can monetize the example call structures we provided and roll some profits into bear put spreads (i.e., buy put and sell another at a lower strike), though you may limit your expectations. Some think there is a greater likelihood of a “crash-less selloff, a grinding de-leveraging.”

Read: China’s Yuan Replaces Dollar As Most Traded Currency In Russia.

Disclaimer

Don’t use this free letter as advice; all content is for informational purposes, and derivatives carry a substantial risk of loss. At this time, Capelj and Physik Invest, non-professional advisors, will never solicit others for capital or collect fees and disbursements. Separately, you may view this letter’s content calendar at this link.

Categories
Commentary

Daily Brief For March 15, 2023

Physik Invest’s Daily Brief is read free by thousands of subscribers. Join this community to learn about the fundamental and technical drivers of markets.

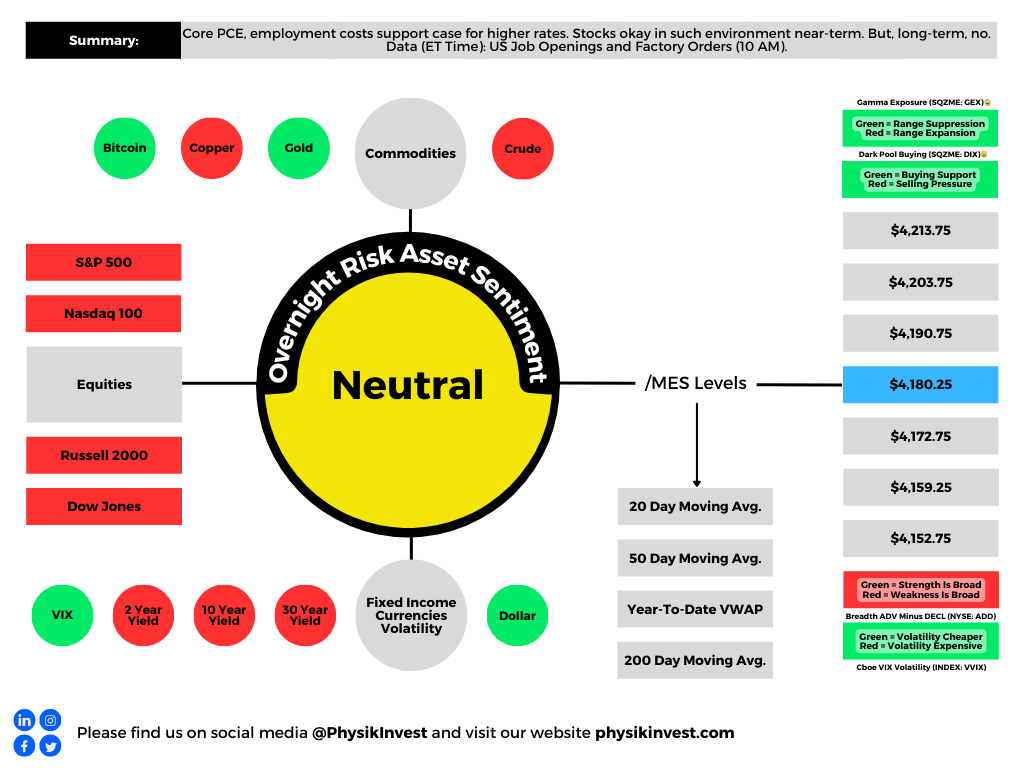
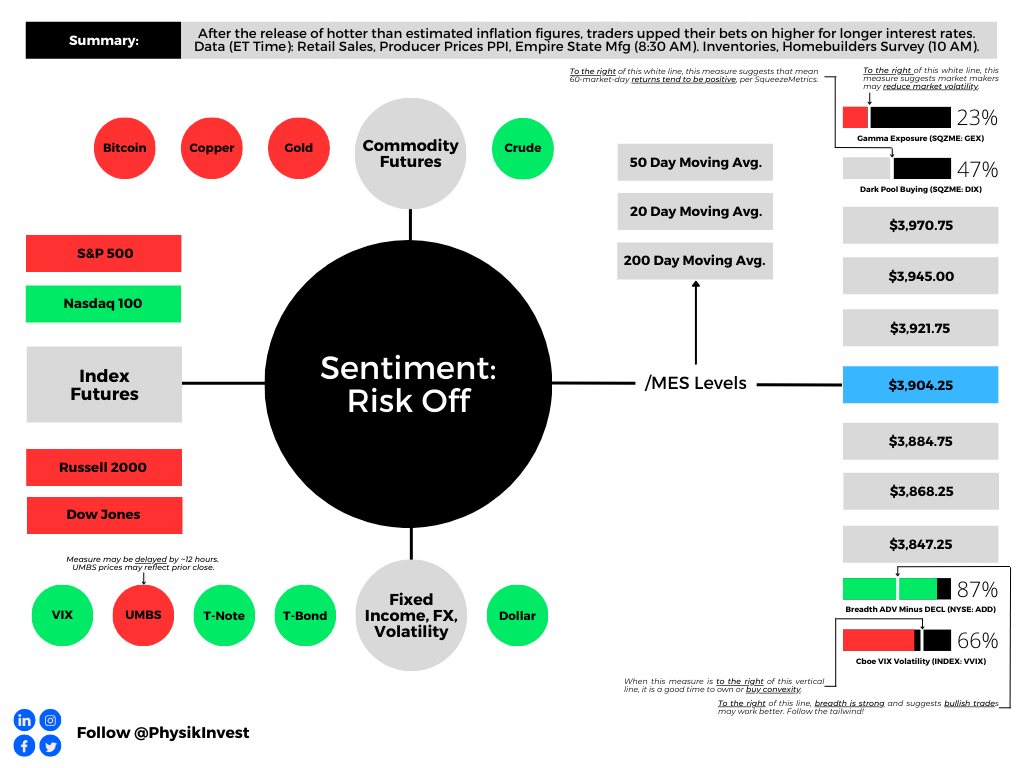
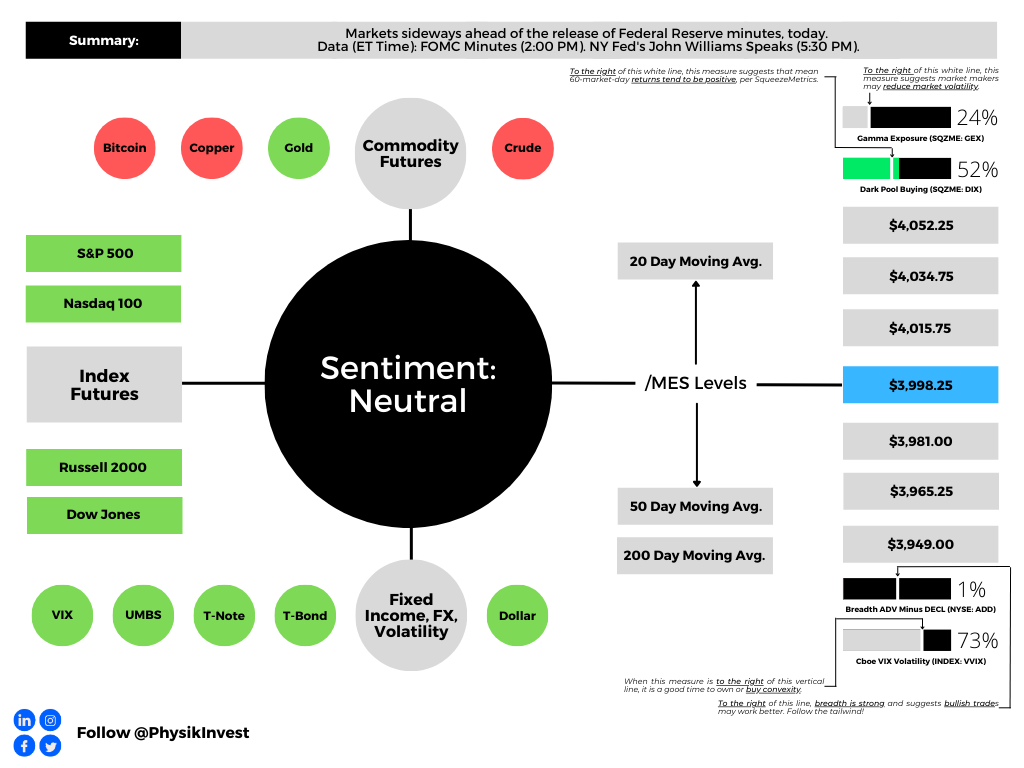
Graphic updated 6:15 AM ET. Sentiment Risk-Off if expected /MES open is below the prior day’s range. /MES levels are derived from the profile graphic at the bottom of this letter. Click here for the latest levels. SqueezeMetrics Dark Pool Index (DIX) and Gamma (GEX) with the latter calculated based on where the prior day’s reading falls with respect to the MAX and MIN of all occurrences available. A higher DIX is bullish. The lower the GEX, the more (expected) volatility. Click to learn the implications of volatility, direction, and moneyness. Breadth reflects a reading of the prior day’s NYSE Advance/Decline indicator. The CBOE VIX Volatility Index (INDEX: VVIX) reflects the attractiveness of owning volatility. UMBS prices via MNDClick here for the economic calendar.

Administrative

As indicated yesterday, through the end-of-this week, newsletters may be shorter due to the letter writer’s commitments. Therefore, please read the Daily Brief for March 14, if you haven’t already, for a big discussion on bond and equity market volatility, as well as the odds of the market falling apart or rising, and positioning contexts that support that movement. If there are any incomplete statements below, we shall complete them in the coming letters. We’re laying it all out for awareness. Take care!

Fundamental

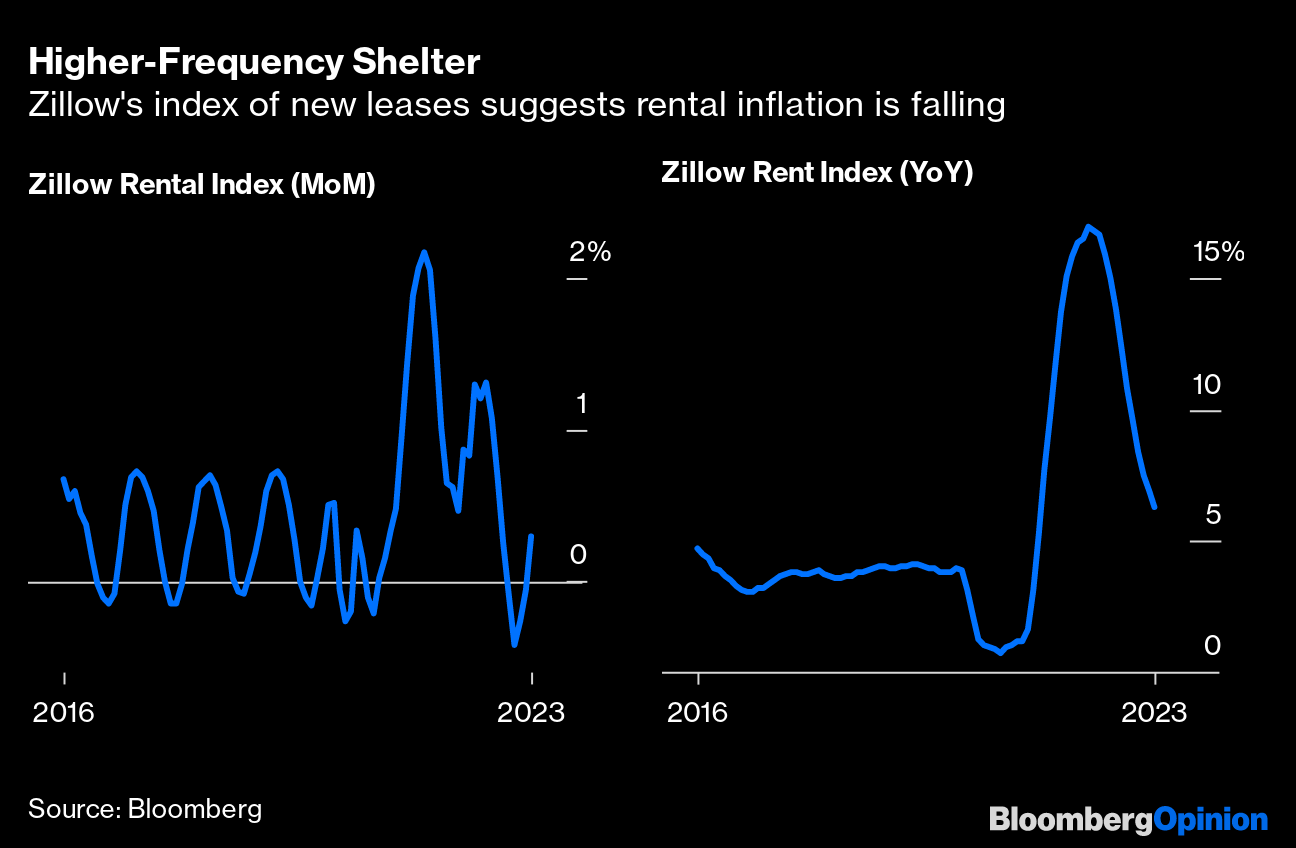
Headline inflation via CPI (Consumer Price Index) fell most on energy and core goods while shelter, food, and services inflation continues to be sticky. Core prices continue to be high, risking “inflationary psychology [] becoming ingrained,” Bloomberg’s John Authers explains.

Graphic: Retrieved from Bloomberg.

“There’s nothing in this report to suggest that inflation is defeated already,” explained Authers. “Not to raise the fed funds rate next week, with median inflation above 7%, would be a sign of panic,” and an acknowledgment of uncertainties with regard to the banking system, as talked about in the Daily Brief on March 14.

To note, however, contagion appears contained, despite Moody’s Corporation (NYSE: MCO) cutting its outlook for the banking system to negative from stable, and placing lenders including First Republic Bank (NYSE: FRC) on a downgrade review.
JPMorgan Chase & Co’s (NYSE: JPM) Marko Kolanovic did cut his equity allocation warning that not all carry trades, something this letter has talked about numerous times before (i.e., borrow at a low rate and invest in something that provides higher return), can be bailed out. Kolanovic appears worried about commercial real estate, which Simplify Asset Management’s Michael Green just told your letter writer is in a bubble that “we’re seeing crack,” finally.

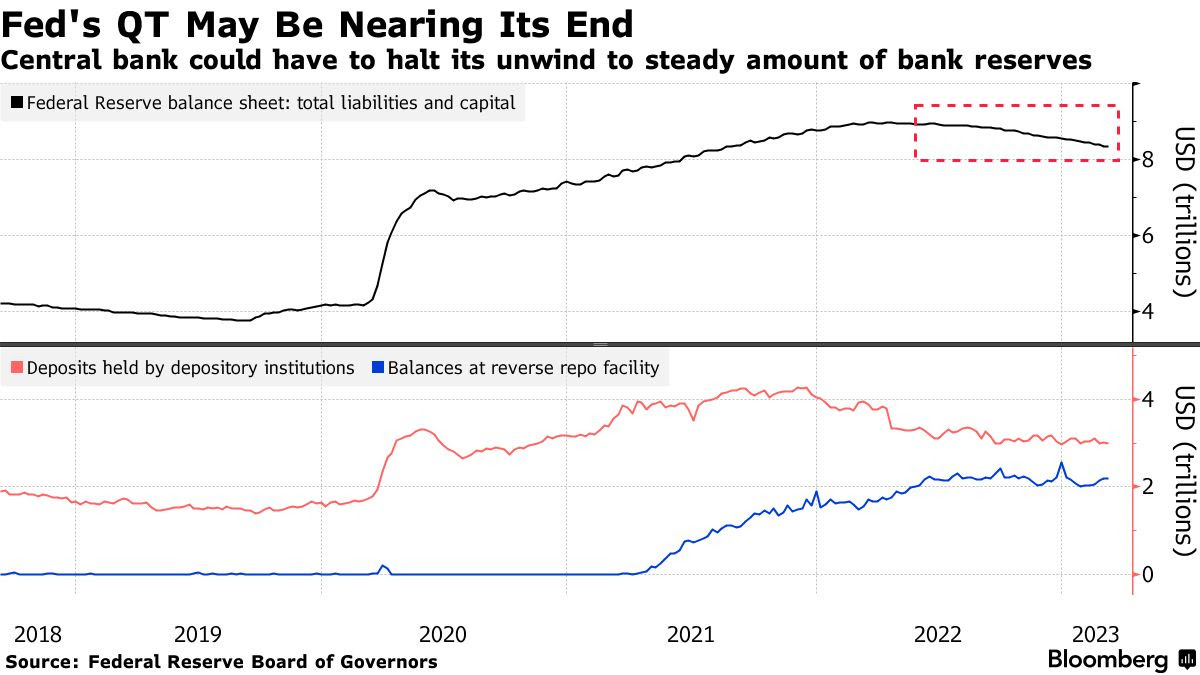
Graphic: Retrieved from Bloomberg. The Federal Reserve’s new Bank Term Funding Program or BTFP is “QE in another name – assets will grow on the Fed balance sheet which will increase reserves.” Recall that QE is the flow of capital into capital markets while QT is the opposite. Q is for quantitative while E is for easing and T is for tightening.

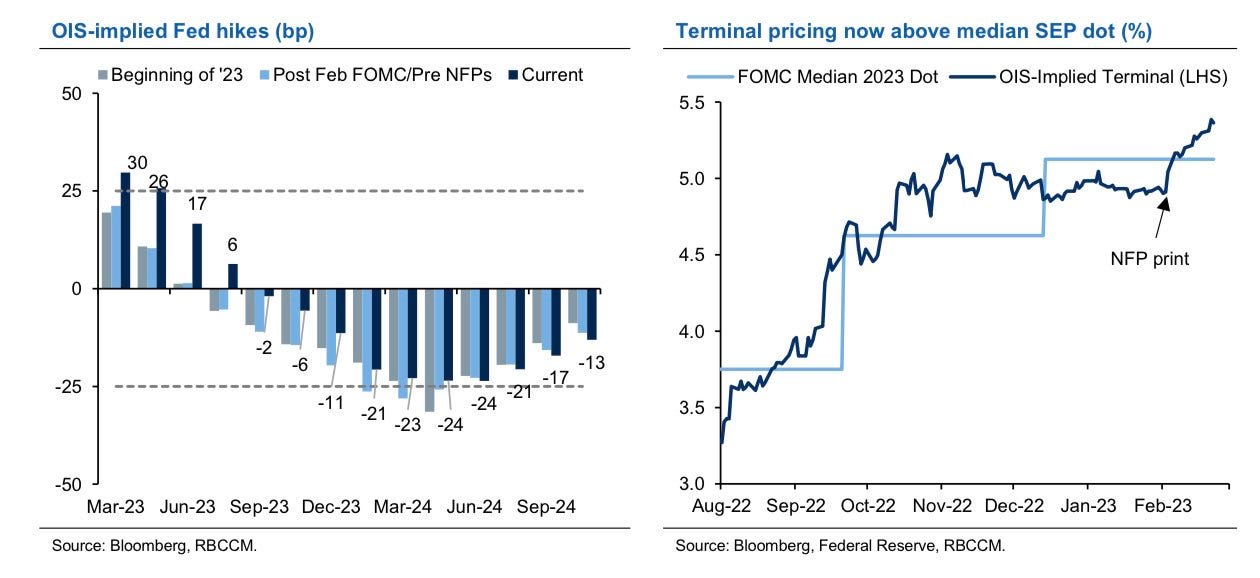
Anyways, following yesterday’s CPI, traders price higher odds of a 25 basis point hike which puts the terminal or peak fed funds rate at 4.75-5.00%. Following this spring, factoring potential inflation plateau and financial system uncertainties, traders foresee the Fed easing. By year-end, traders expect rates to fall down to 3.75-4.00%. Recall that at the beginning of last week, there were no expectations of easing in 2023. Also, traders thought the Fed would raise as high as 5.50-5.75%.

Mortgage rates, determined by changes in the price of mortgage-backed securities or MBSs, fell too.

Graphic: Retrieved from ZeroHedge. Adding: “US layoffs [are] far higher than suggested by initial jobless claims, JOLTS.”

ARK Invest’s Cathie Wood, who your letter writer had the honor of interviewing in person for Benzinga articles, thinks we’re on the cusp of the “roaring twenties” as inflation “is likely to surprise on the low side of expectations” with the banking crisis also leading to “bad deflation.”

“Today, five major innovation platforms are evolving at the same time – multiomics sequencing, robotics, energy storage, artificial intelligence, and blockchain technology, all of which are converging,” she elaborates.

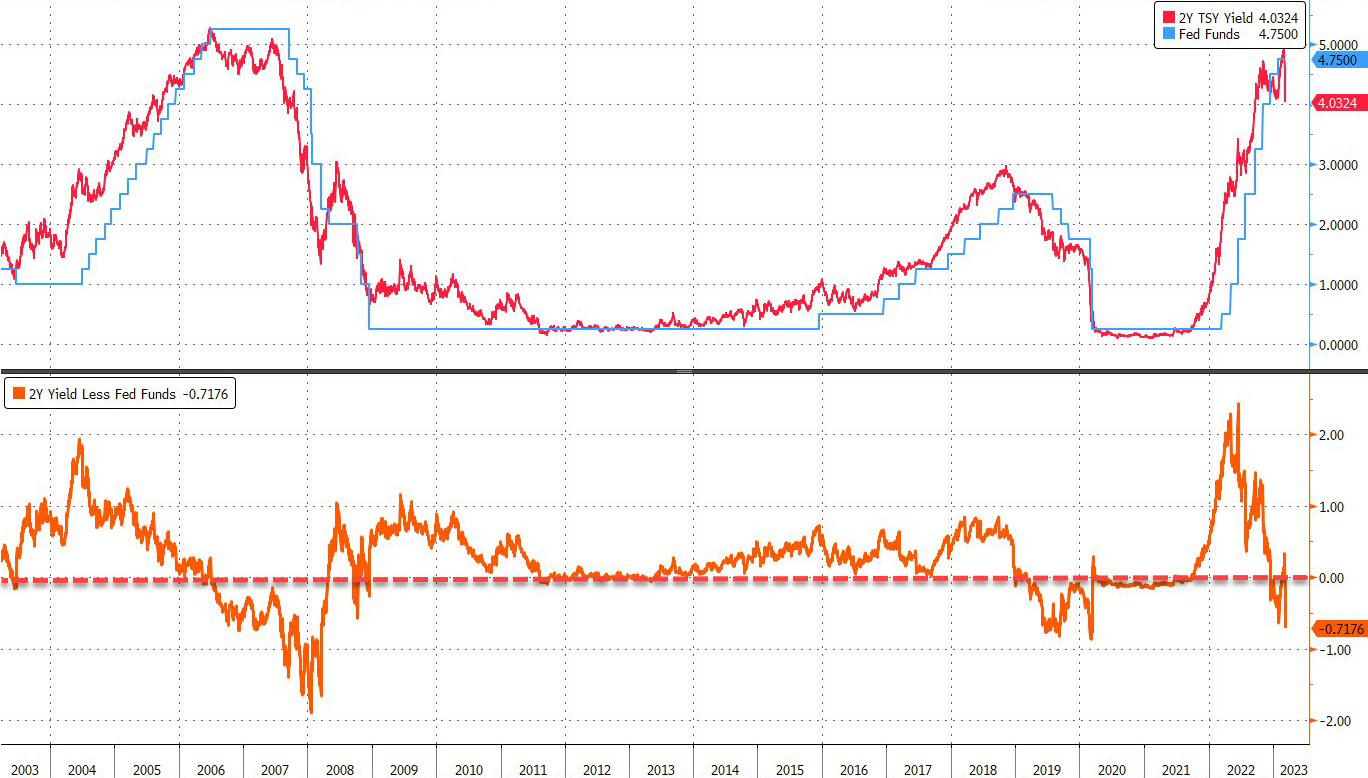
“Once the Fed stops looking backward at CPI inflation and starts addressing the deflationary banking crisis that a 19-fold increase in short rates and an inverted yield have caused, we would not be surprised to see a return to the Roaring Twenties.”

Graphic: Retrieved from Bloomberg.

On the backward-looking measures quote in the above paragraph, former Fed trader Joseph Wang notes that the Fed and central banks, in general, are aware segments of the market may break, but that won’t discourage them from tightening further.

“As the BOE saved the gilt market through purchases and kept tightening, so the Fed can save banks and keep tightening.”

Positioning

Tuesday’s letter said that following important events like CPI, the compression of wound implied volatility or IVOL, coupled with the nearing large options expirations (OpEx), sets the market up for potential short bursts of strength into the end of the month and next month.

That’s along the lines of what is happening. The S&P 500 rose mechanically after the release of CPI yesterday. Later, though the index succumbed, internally speaking the market remained strong through end-of-day, hence some short bursts boosted by some short-dated options activities, also.

As explained, yesterday, the recent re-grossing theme appears intact. Any further compression of wound IVOL and the passage of options expirations (OpEx) could support equities as month-end approaches. Though it may be too early to position for strength, one may consider it the way it was explained in the Daily Brief on March 14.

Technical

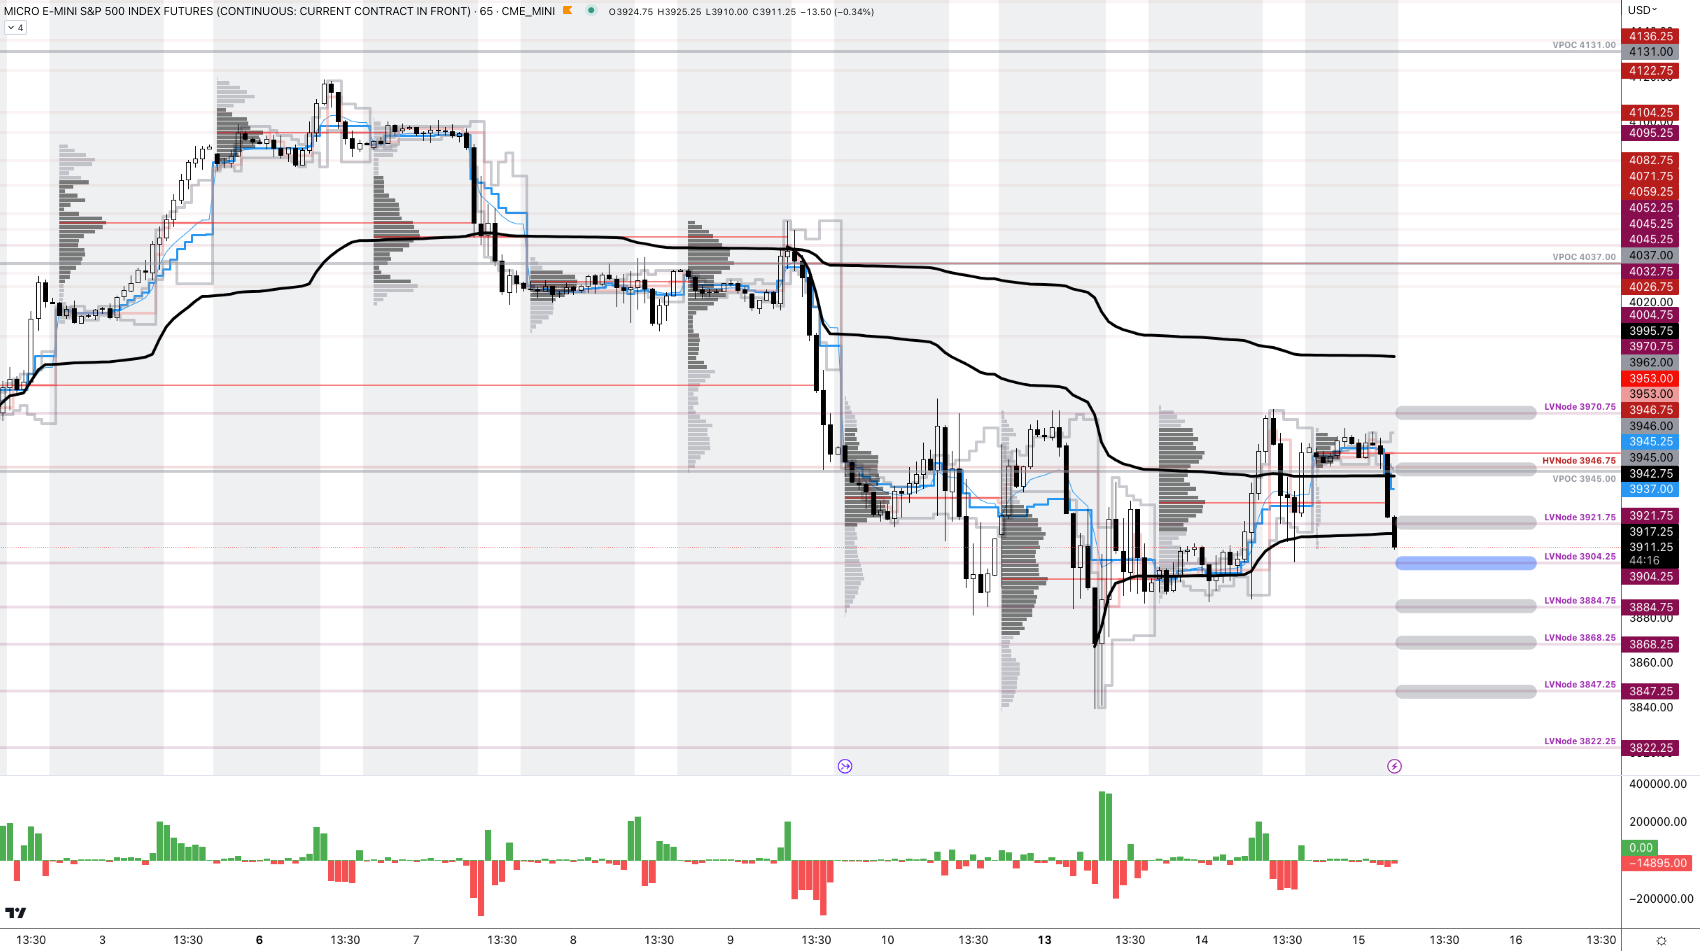
As of 6:15 AM ET, Wednesday’s regular session (9:30 AM – 4:00 PM ET), in the S&P 500, is likely to open in the middle part of a negatively skewed overnight inventory, inside of the prior day’s range, suggesting a limited potential for immediate directional opportunity.

The S&P 500 pivot for today is $3,904.25. 

Key levels to the upside include $3,921.75, $3,945.00, and $3,970.75.

Key levels to the downside include $3,884.75, $3,868.25, and $3,847.25.

Disclaimer: Click here to load the updated key levels via the web-based TradingView platform. New links are produced daily. Quoted levels likely hold barring an exogenous development.

Graphic: 65-minute profile chart of the Micro E-mini S&P 500 Futures.

Definitions

Volume Areas: Markets will build on areas of high-volume (HVNodes). Should the market trend for a period of time, this will be identified by a low-volume area (LVNodes). The LVNodes denote directional conviction and ought to offer support on any test.

If participants auction and find acceptance in an area of a prior LVNode, then future discovery ought to be volatile and quick as participants look to the nearest HVNodes for more favorable entry or exit.

POCs: Areas where two-sided trade was most prevalent in a prior day session. Participants will respond to future tests of value as they offer favorable entry and exit.

Volume-Weighted Average Prices (VWAPs): A metric highly regarded by chief investment officers, among other participants, for quality of trade. Additionally, liquidity algorithms are benchmarked and programmed to buy and sell around VWAPs.


About

The author, Renato Leonard Capelj, spends the bulk of his time at Physik Invest, an entity through which he invests and publishes free daily analyses to thousands of subscribers. The analyses offer him and his subscribers a way to stay on the right side of the market. 

Separately, Capelj is an accredited journalist with past works including interviews with investor Kevin O’Leary, ARK Invest’s Catherine Wood, FTX’s Sam Bankman-Fried, North Dakota Governor Doug Burgum, Lithuania’s Minister of Economy and Innovation Aušrinė Armonaitė, former Cisco chairman and CEO John Chambers, and persons at the Clinton Global Initiative.

Connect

Direct queries to renato@physikinvest.com. Find Physik Invest on TwitterLinkedInFacebook, and Instagram. Find Capelj on TwitterLinkedIn, and Instagram. Only follow the verified profiles.

Calendar

You may view this letter’s content calendar at this link.

Disclaimer

Do not construe this newsletter as advice. All content is for informational purposes. Capelj and Physik Invest manage their own capital and will not solicit others for it.

Categories
Commentary

Daily Brief For February 24, 2023

Physik Invest’s Daily Brief is read free by thousands of subscribers. Join this community to learn about the fundamental and technical drivers of markets.

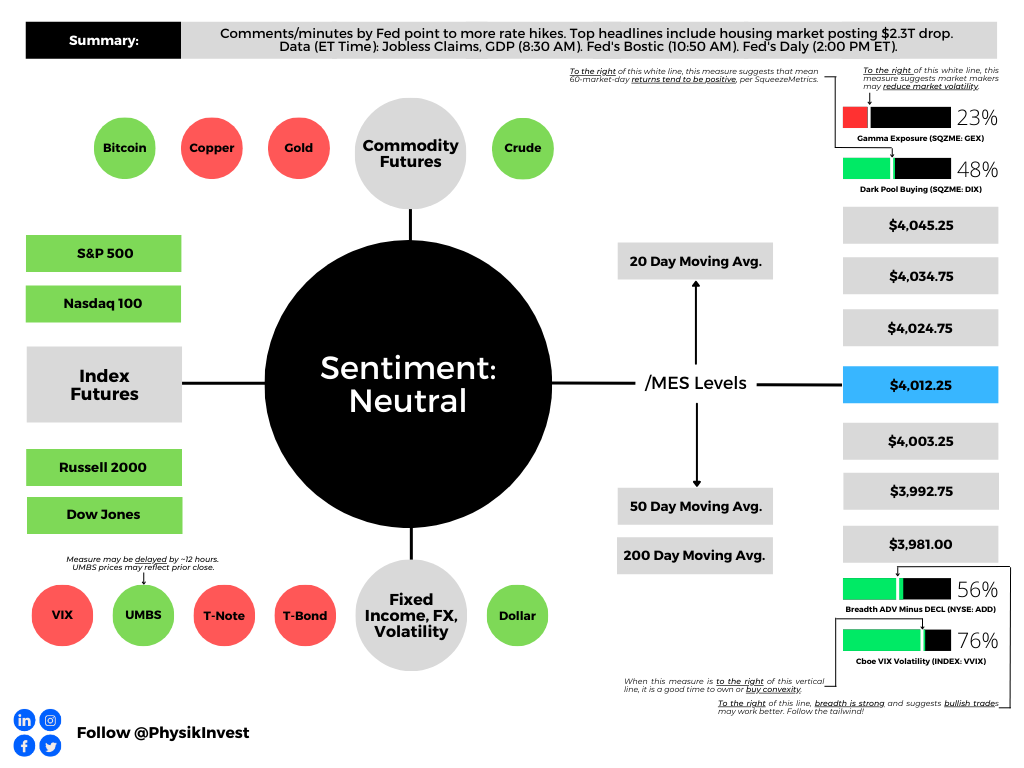
Graphic updated 8:25 AM ET. Sentiment Neutral if expected /MES open is inside of the prior day’s range. /MES levels are derived from the profile graphic at the bottom of this letter. Click here for the latest levels. SqueezeMetrics Dark Pool Index (DIX) and Gamma (GEX) with the latter calculated based on where the prior day’s reading falls with respect to the MAX and MIN of all occurrences available. A higher DIX is bullish. The lower the GEX, the more (expected) volatility. Click to learn the implications of volatility, direction, and moneyness. Breadth reflects a reading of the prior day’s NYSE Advance/Decline indicator. The CBOE VIX Volatility Index (INDEX: VVIX) reflects the attractiveness of owning volatility. UMBS prices via MNDClick here for the economic calendar.

Positioning

Traders continue to balance the risks of owning risk assets versus less-risky bonds, for instance. In what can be construed as a fear-of-missing-out (FOMO), some have sought upside equity exposure in a way that limits downside: call options.

Consequently, implied volatility (IVOL) on the call side, particularly in options with less time to expiration, continues to be elevated by upwards of 10.00% or more.

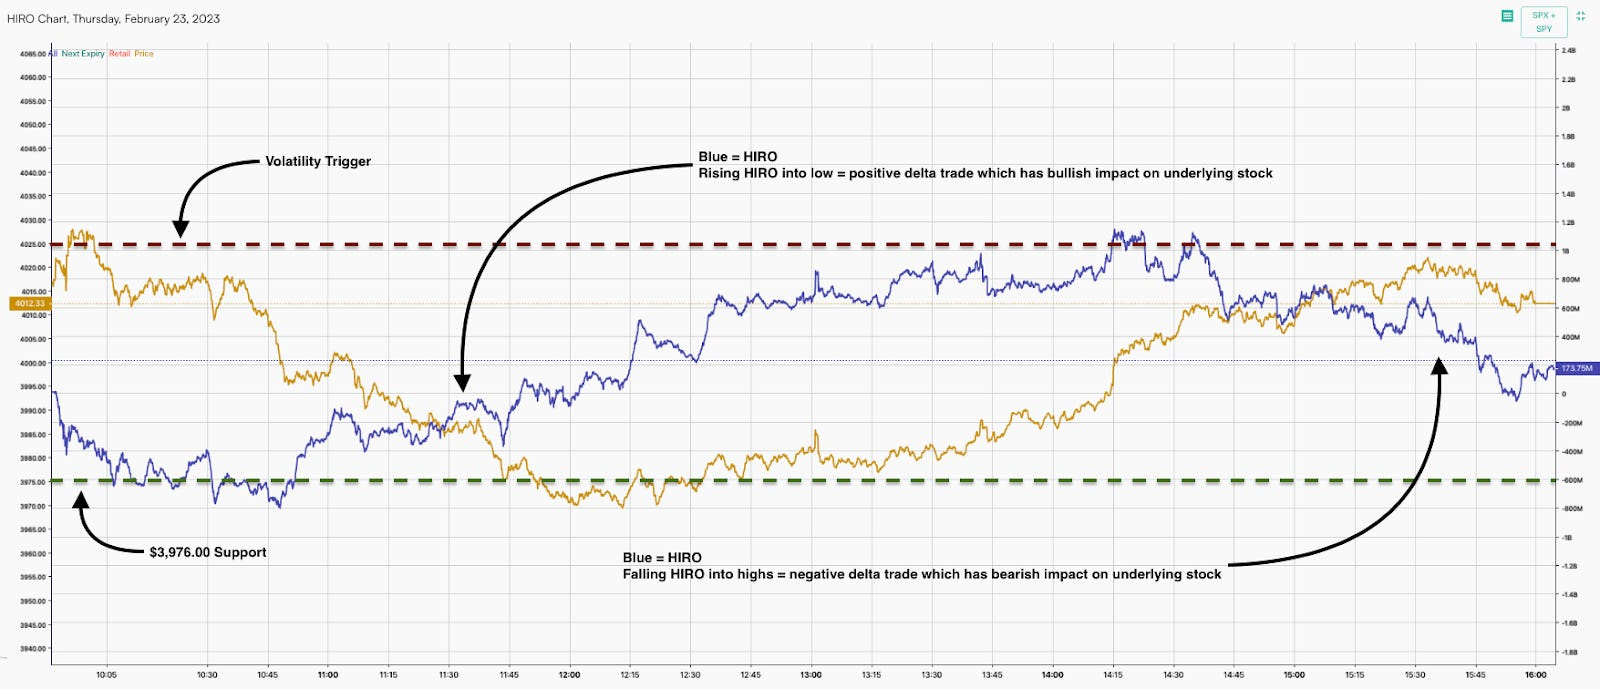
Further, this week’s trading has been dominated by the expected post-options expiry (OpEx) weakness, as well as short-term catalysts and trading. Take yesterday, for example, the market opened higher signaling a potential trend change on upbeat earnings reports, as I detailed in a SpotGamma note. Under the hood, however, there was little optimism. The S&P 500 (INDEX: SPX) succumbed to this weakness before reversing at a key support SpotGamma’s modeling established and rising toward a key resistance into session-end. Noteworthy was the options activity heading into the decline. We observe this activity with tools including SpotGamma’s HIRO indicator measuring the real-time hedging impact of traders’ options activities. 

As the SPX traded lower, ultra-short-dated call buyers and put sellers synthetically bought the market. The hedging of this ultra-sensitive exposure portended a turn at the low. As the SPX resolved higher, this activity traded out, so to speak, as evidenced by ultra-short-dated call selling and put buying, hence mean-reversion into the close.
Graphic: Retrieved from SpotGamma.

SpotGamma’s founder said these “head-fakes” were to be expected. “Traders are uncertain and still are not committed to demanding longer-dated protection,” hence lower longer-dated IVOL.

In a Bank of America Corporation (NYSE: BAC) response to JPMorgan Chase & Co’s (NYSE: JPM) note on an ultra-short-dated options trading catastrophe looming, we learn that mean-reversion is, in part, a result of “traders buying short-dated options at the beginning of the day and unwinding those same positions late in the day,” I put in a SpotGamma note.

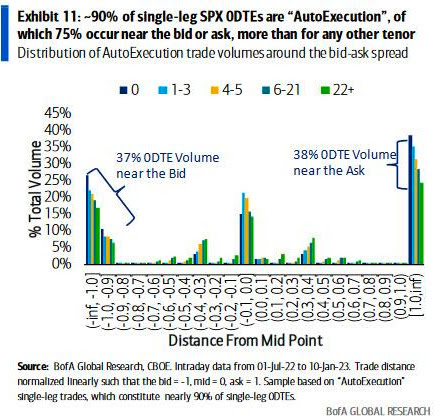
To quote BAC directly, half of all SPX ultra-short-dated options activity is “single-leg auto-execution.” Options IVOL is “at levels that are likely inconsistent with a market that has been overrun by option sellers,” contrary to JPM’s opinion, ZeroHedge said in one recap. “75% of trades occur near the bid or the ask – more than for any other tenor, and volume is uniquely skewed towards the ask early in the day but towards the bid later in the day.”

Consequently, a takeaway is that, as this letter has put forth in the past, ultra-short-dated options activity does not have a long-lasting impact. Rather, what is impactful is participants’ desire to carry exposure to options/protection that are farther-dated.

Graphic: Retrieved from Bank of America Corporation (NYSE: BAC) via SpotGamma.

As put in yesterday’s letter, the contexts for a far-reaching rally are weak. A change in the bearish context is likely to coincide with charged options values (i.e., wound IVOL or big put delta) or some fundamental, macro-type catalyst. In the latter, a caveat is that IVOL compression, alone, likely does little to inspire a far-reaching rally.

Technical

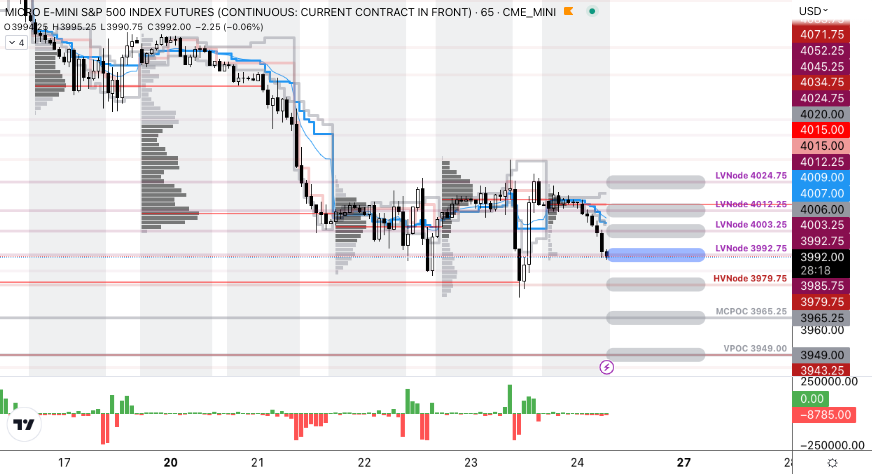
As of 7:30 AM ET, Friday’s regular session (9:30 AM – 4:00 PM ET), in the S&P 500, is likely to open in the lower part of a negatively skewed overnight inventory, inside of the prior day’s range, suggesting a limited potential for immediate directional opportunity.

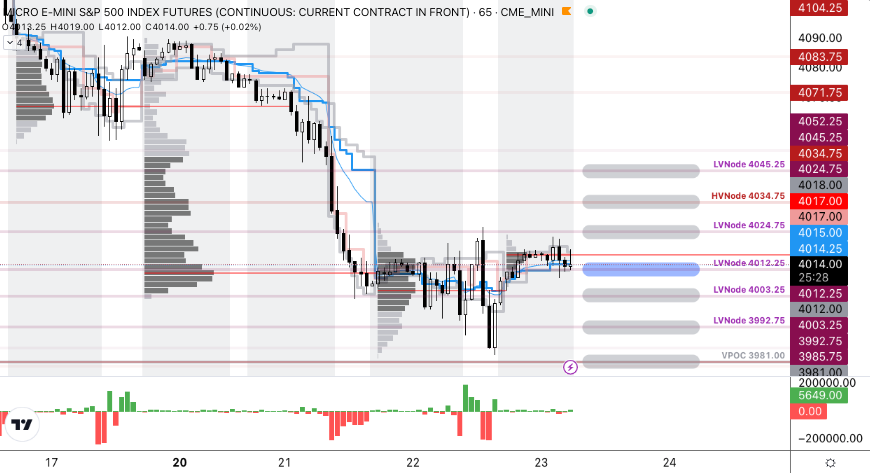
The S&P 500 pivot for today is $3,992.75. 

Key levels to the upside include $4,003.25, $4,012.25, and $4,024.75.

Key levels to the downside include $3,979.75, $3,965.25, and $3,949.00.

Disclaimer: Click here to load the updated key levels via the web-based TradingView platform. New links are produced daily. Quoted levels likely hold barring an exogenous development.

Graphic: 65-minute profile chart of the Micro E-mini S&P 500 Futures.

Definitions

Volume Areas: Markets will build on areas of high-volume (HVNodes). Should the market trend for a period of time, this will be identified by a low-volume area (LVNodes). The LVNodes denote directional conviction and ought to offer support on any test.

If participants auction and find acceptance in an area of a prior LVNode, then future discovery ought to be volatile and quick as participants look to the nearest HVNodes for more favorable entry or exit.

POCs: Areas where two-sided trade was most prevalent in a prior day session. Participants will respond to future tests of value as they offer favorable entry and exit.

MCPOCs: Denote areas where two-sided trade was most prevalent over numerous sessions. Participants will respond to future tests of value as they offer favorable entry and exit.


About

The author, Renato Leonard Capelj, works in finance and journalism.

Capelj spends the bulk of his time at Physik Invest, an entity through which he invests and publishes free daily analyses to thousands of subscribers. The analyses offer him and his subscribers a way to stay on the right side of the market. Separately, Capelj is an options analyst at SpotGamma and an accredited journalist.

Capelj’s past works include conversations with investor Kevin O’Leary, ARK Invest’s Catherine Wood, FTX’s Sam Bankman-Fried, North Dakota Governor Doug Burgum, Lithuania’s Minister of Economy and Innovation Aušrinė Armonaitė, former Cisco chairman and CEO John Chambers, and persons at the Clinton Global Initiative.

Connect

Direct queries to renato@physikinvest.com. Find Physik Invest on TwitterLinkedInFacebook, and Instagram. Find Capelj on TwitterLinkedIn, and Instagram. Only follow the verified profiles.

Calendar

You may view this letter’s content calendar at this link.

Disclaimer

Do not construe this newsletter as advice. All content is for informational purposes. Capelj and Physik Invest manage their own capital and will not solicit others for it.

Categories
Commentary

Daily Brief For February 23, 2023

Physik Invest’s Daily Brief is read free by thousands of subscribers. Join this community to learn about the fundamental and technical drivers of markets.

Graphic updated 6:30 AM ET. Sentiment Neutral if expected /MES open is inside of the prior day’s range. /MES levels are derived from the profile graphic at the bottom of this letter. Click here for the latest levels. SqueezeMetrics Dark Pool Index (DIX) and Gamma (GEX) with the latter calculated based on where the prior day’s reading falls with respect to the MAX and MIN of all occurrences available. A higher DIX is bullish. The lower the GEX, the more (expected) volatility. Click to learn the implications of volatility, direction, and moneyness. Breadth reflects a reading of the prior day’s NYSE Advance/Decline indicator. The CBOE VIX Volatility Index (INDEX: VVIX) reflects the attractiveness of owning volatility. UMBS prices via MNDClick here for the economic calendar.

Fundamental

Bloomberg’s John Authers summarized well the release of the Federal Open Market Committee (FOMC) meeting minutes. He said that almost all officials “supported a step down in the pace of tightening by 25 basis points, while a ‘few’ favored or could have supported a bigger 50 basis-point hike. Nobody wanted to stop straightaway.”

“Participants observed that a restrictive policy stance would need to be maintained until the incoming data provided confidence that inflation was on a sustained downward path to 2%, which was likely to take some time,” the minutes said.

Graphic: Retrieved from Royal Bank of Canada (NYSE: RY). 

Notwithstanding hits to markets like housing, which news has concentrated on, the S&P 500 (INDEX: SPX) is trading about 18x forward price-to-earnings, Bank of America Corporation (NYSE: BAC) said, the highest since March 2022 and 20% above the last decade’s average P/E

Graphic: Retrieved from Bloomberg.

Per Savita Subramanian, “the traditional Rule of 20 … holds that the multiple should be whatever number results by subtracting the inflation rate from 20 — which with inflation at 6.4% would imply that the P/E needs to fall to 13.6.”

Graphic: Retrieved from Bank of America Corporation (NYSE: BAC) via Bloomberg.

Recall yesterday’s letter discussing the “risk-reward of holding bonds [looking] better than equity (earnings yield).”

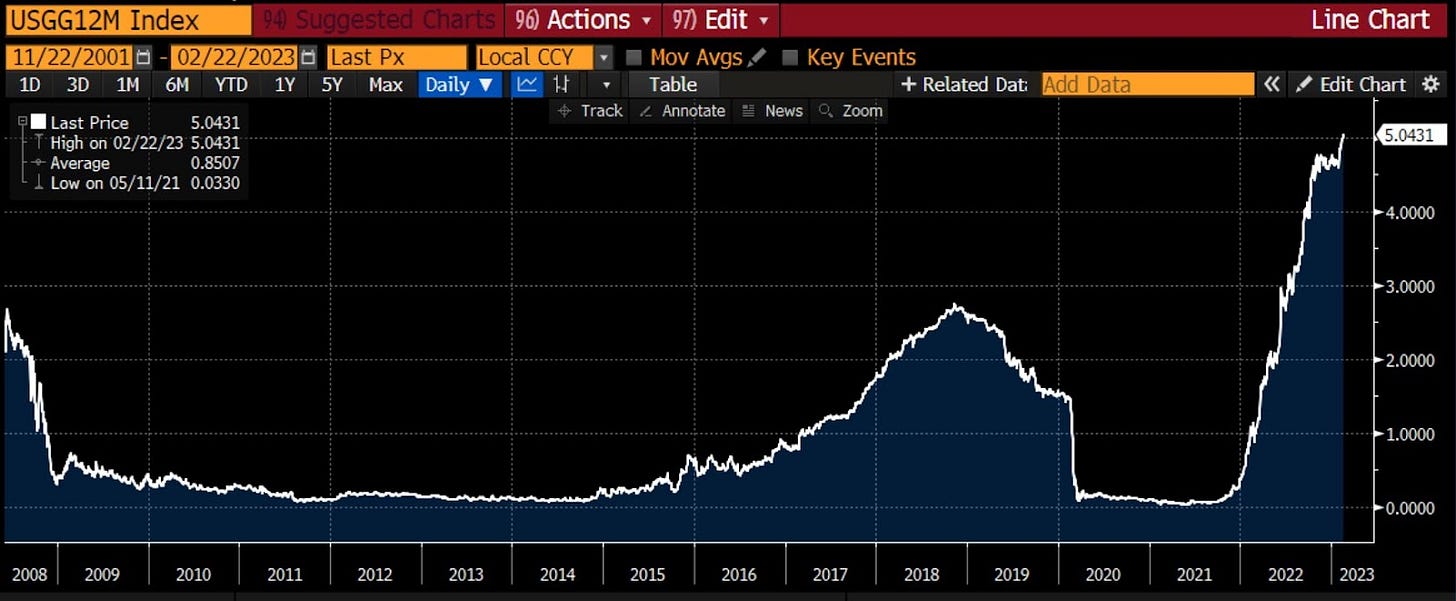
Graphic: Retrieved from Bloomberg’s Lisa Abramowicz. “Yields on 12-month T-bills have risen to their highest since 2001. Most of this has to do with Fed rate hike expectations.”

Positioning

The SPX’s decline is orderly and contained. 

However, the break below $4,000.00 SPX did open the door to a “liquidity hole,” SpotGamma explained. New information has traders anticipating more equity market downside; traders are “reset[ing] to lower equity valuations” on the higher-for-longer rate narrative all the while “vanna and gamma hedging serve to pull markets lower.”

The contexts for a far-reaching rally are weakA change in the context is likely to coincide with charged options values (i.e., wound implied volatility or big put delta).

Technical

As of 6:30 AM ET, Thursday’s regular session (9:30 AM – 4:00 PM ET), in the S&P 500, is likely to open in the middle part of a positively skewed overnight inventory, inside of the prior day’s range, suggesting a limited potential for immediate directional opportunity.

The S&P 500 (FUTURE: /MES) pivot for today is $4,012.25. 

Key levels to the upside include $4,024.75, $4,034.75, and $4,045.25.

Key levels to the downside include $4,003.25, $3,992.75, and $3,981.00.

Disclaimer: Click here to load the updated key levels via the web-based TradingView platform. New links are produced daily. Quoted levels likely hold barring an exogenous development.

Graphic: 65-minute profile chart of the Micro E-mini S&P 500 Futures.

Definitions

Volume Areas: Markets will build on areas of high-volume (HVNodes). Should the market trend for a period of time, this will be identified by a low-volume area (LVNodes). The LVNodes denote directional conviction and ought to offer support on any test.

If participants auction and find acceptance in an area of a prior LVNode, then future discovery ought to be volatile and quick as participants look to the nearest HVNodes for more favorable entry or exit.

Delta: An option’s exposure to the direction or underlying asset movement.

Gamma: The sensitivity of an option’s delta to changes in the underlying asset’s price.

Vanna: The rate at which the delta of an option changes with respect to implied volatility.

POCs: Areas where two-sided trade was most prevalent in a prior day session. Participants will respond to future tests of value as they offer favorable entry and exit.


About

The author, Renato Leonard Capelj, works in finance and journalism.

Capelj spends the bulk of his time at Physik Invest, an entity through which he invests and publishes free daily analyses to thousands of subscribers. The analyses offer him and his subscribers a way to stay on the right side of the market. Separately, Capelj is an options analyst at SpotGamma and an accredited journalist.

Capelj’s past works include conversations with investor Kevin O’Leary, ARK Invest’s Catherine Wood, FTX’s Sam Bankman-Fried, North Dakota Governor Doug Burgum, Lithuania’s Minister of Economy and Innovation Aušrinė Armonaitė, former Cisco chairman and CEO John Chambers, and persons at the Clinton Global Initiative.

Connect

Direct queries to renato@physikinvest.com. Find Physik Invest on TwitterLinkedInFacebook, and Instagram. Find Capelj on TwitterLinkedIn, and Instagram. Only follow the verified profiles.

Calendar

You may view this letter’s content calendar at this link.

Disclaimer

Do not construe this newsletter as advice. All content is for informational purposes. Capelj and Physik Invest manage their own capital and will not solicit others for it.

Categories
Commentary

Daily Brief For February 22, 2023

Physik Invest’s Daily Brief is read free by thousands of subscribers. Join this community to learn about the fundamental and technical drivers of markets.

Graphic updated 7:15 AM ET. Sentiment Neutral if expected /MES open is inside of the prior day’s range. /MES levels are derived from the profile graphic at the bottom of this letter. Click here for the latest levels. SqueezeMetrics Dark Pool Index (DIX) and Gamma (GEX) with the latter calculated based on where the prior day’s reading falls with respect to the MAX and MIN of all occurrences available. A higher DIX is bullish. The lower the GEX, the more (expected) volatility. Click to learn the implications of volatility, direction, and moneyness. Breadth reflects a reading of the prior day’s NYSE Advance/Decline indicator. The CBOE VIX Volatility Index (INDEX: VVIX) reflects the attractiveness of owning volatility. UMBS prices via MNDClick here for the economic calendar.

Fundamental

We look beyond all the doom-and-gloom narrative to the bond-equity divergence which JPMorgan Chase & Co’s (NYSE: JPM) Marko Kolanovic wrote about recently.

Essentially, regressions suggest the move in interest rates since the Federal Reserve’s (Fed) meeting earlier this month should have resulted in a 5-10% sell-off in the rate-sensitive Nasdaq. It didn’t. Per Kolanovic, “this divergence cannot go much further.”

Recall interest rates matter to discounted future cash flows. The higher rates are the, worse that is for equities, says Damped Spring’s Andy Constan well in an interview. 

Interest rates matter elsewhere as well. When interest rates increase, “a mortgage goes down in price by a greater amount than the bond because the expected maturity of the mortgage becomes longer. The magnitude of this unbalanced price volatility characteristic is measured by a financial statistic called ‘convexity.’” Managing this convexity can be problematic and force feedback loops, just as we talk about with options per the below. See here for more.

Graphic: The “Biggest tail risk to SPX isn’t any macro data/virus/war but its own options market.”

Kolanvoic ends: The “risk-reward of holding bonds at this level of short-term yields looks better than equity (earnings yield) than any time since the great financial crisis (i.e., the spread between 2y and equity earnings yield is at the lowest point since 2007).”

Graphic: Retrieved from JPMorgan Chase & Co (NYSE: JPM).

Positioning

This letter said there would be movement after last week’s options expirations (OpEx). 

To quote the February 15 letter, ignoring the “excellent” liquidity and traders buying S&P 500 (INDEX: SPX) “hand over fist,” OpEx would result in a decline in counterparty exposure to positive gamma (i.e., positive exposure to movement). Support from an options positioning perspective would decline, and counterparties would “do less to disrupt and more to bolster movement.”

That’s along the lines of what’s happening, though the movement appears orderly.

Per SpotGamma, “The selling appears contained, as evidenced by an upward trending [implied volatility or IVOL] term structure and light bid in topline measures of [IVOL] like the [Cboe Volatility Index (INDEX: VIX)].” Notwithstanding this light bid at the front of the term structure, there is no rush to protect, as would be evidenced by longer-dated IVOL shifting “materially higher as traders reset to lower equity valuations.”

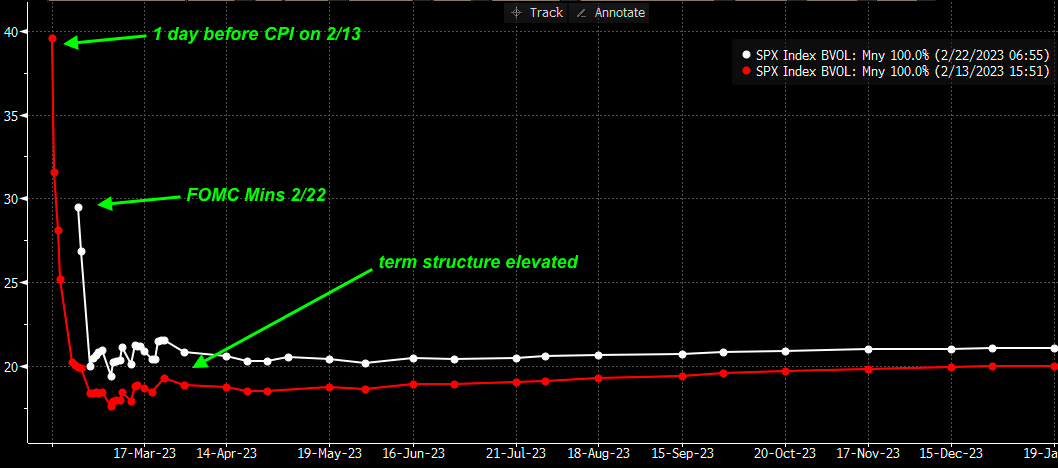
Graphic: Retrieved from SpotGamma. “SPX term structure today vs 2/13 (day prior to CPI). Traders had higher vol expectations for CPI vs today’s FOMC minutes, but [the] term structure is now more elevated. Makes sense as SPX [is] -3% lower. However, the loss of stabilizing OPEX positioning, elevated IV, & flat gamma may lead to higher relative vol today.”

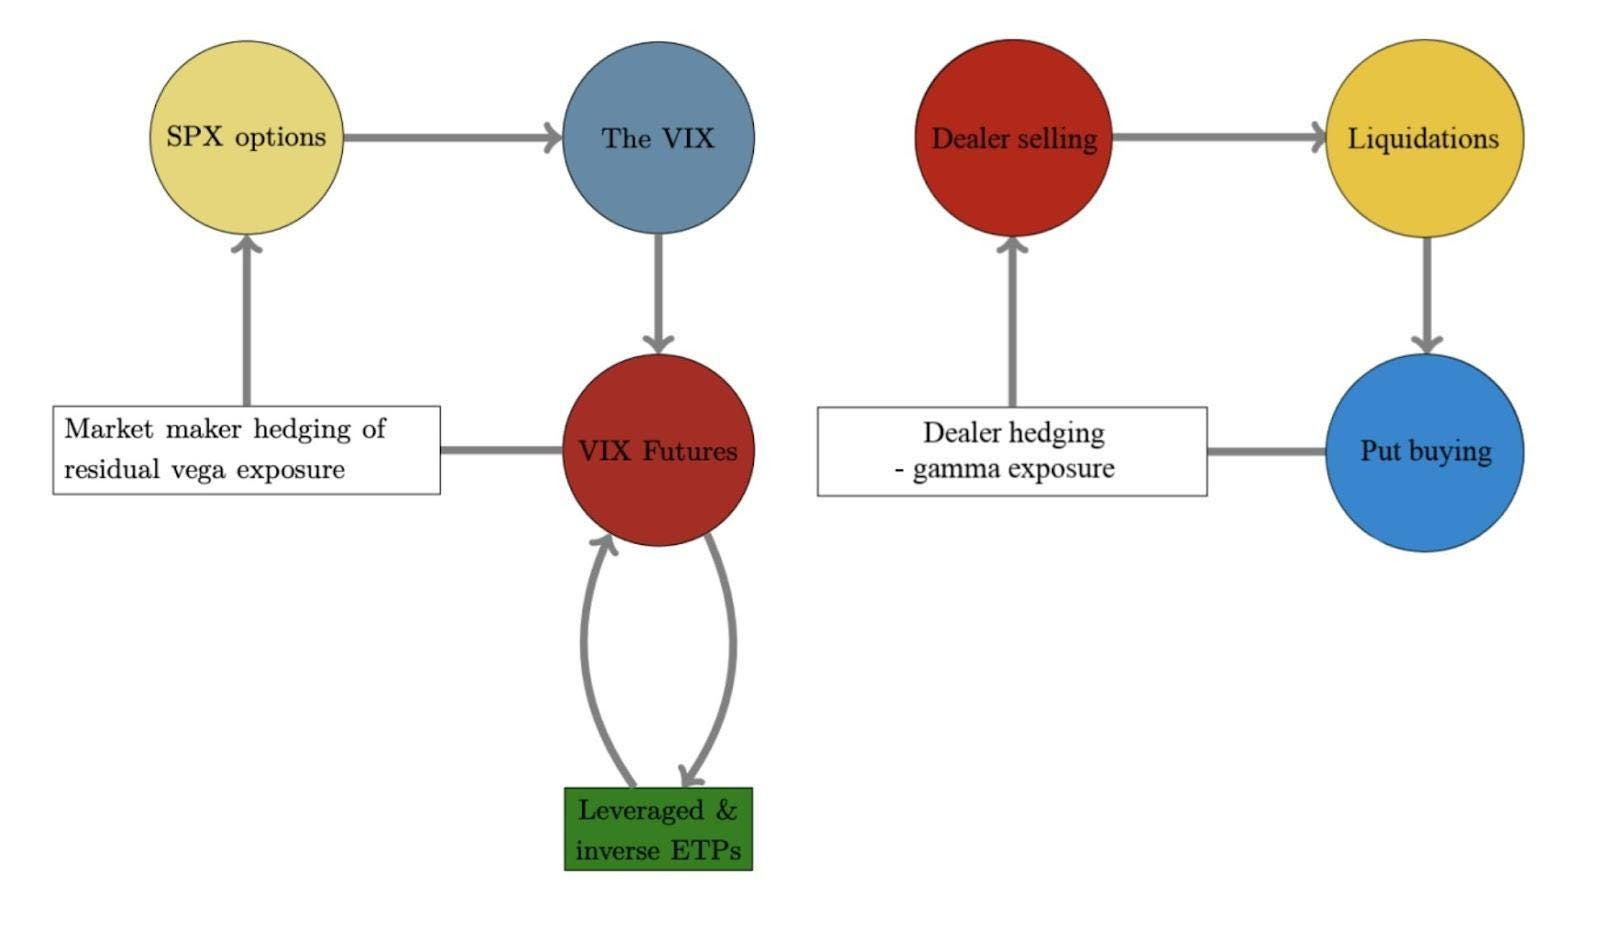
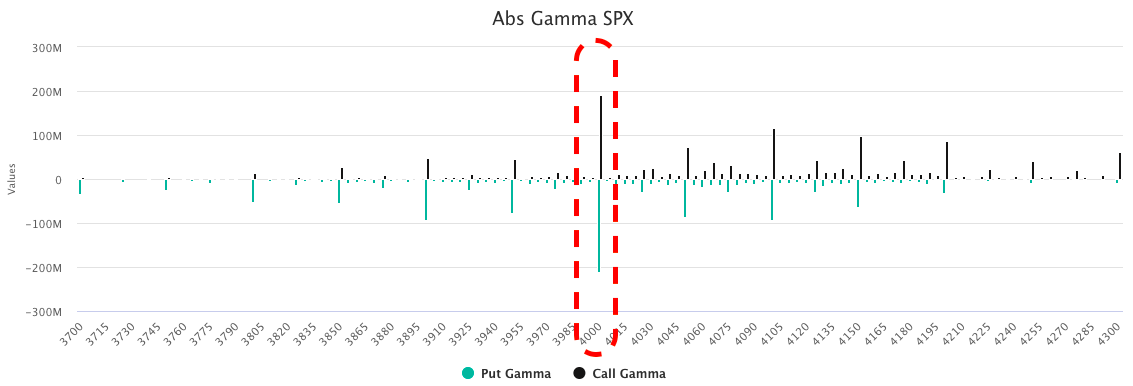
With there being many options positions concentrated near the $4,000.00 SPX area, markets may be at risk of accelerated selling. Below $4,000.00 traders desire to own predominantly puts, and this leaves counterparties “short puts and [] positive delta, as well as negative gamma and vega, meaning they lose money in an increasing way as the market trades lower and volatility increases.” To hedge, counterparties could sell futures or stocks into the decline. This accelerates selling.

Graphic: Retrieved from SpotGamma.

So, with a break of that big $4,000.00 level increasing risk that selling accelerates, the desire to protect will bid IVOL and the marginal impact of its expansion can do more damage than good that any marginal compression can do.

Graphic: Retrieved from SpotGamma. “IV has now compressed to levels associated with recent market tops. If realized vol (RV) declined, then IV could go lower. But, realized isn’t declining.”

In light of this, your letter writer leans negative delta, as well as positive gamma and vega. If the market trades lower, such a setup would make money in short.

Technical

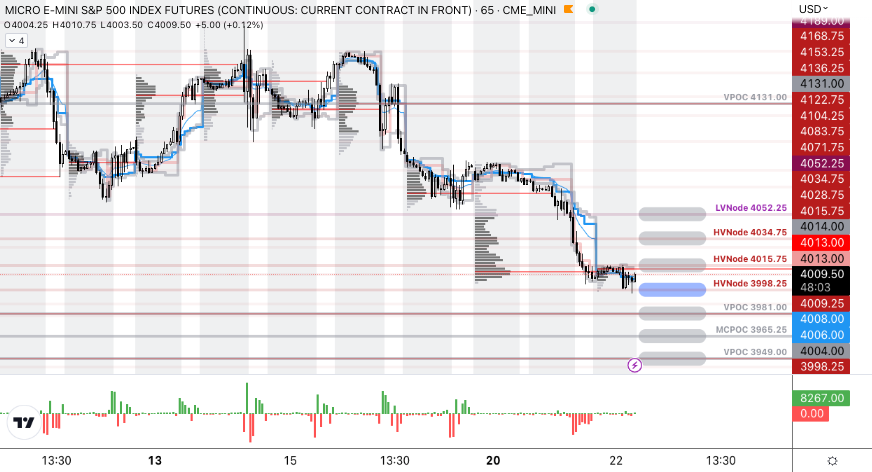
As of 7:15 AM ET, Wednesday’s regular session (9:30 AM – 4:00 PM ET), in the S&P 500, is likely to open in the middle part of a negatively skewed overnight inventory, inside of the prior day’s range, suggesting a limited potential for immediate directional opportunity.

The S&P 500 pivot for today is $3,998.25. 

Key levels to the upside include $4,015.75, $4,034.75, and $4,052.25.

Key levels to the downside include $3,981.00, $3,965.25, and $3,949.00.

Disclaimer: Click here to load the updated key levels via the web-based TradingView platform. New links are produced daily. Quoted levels likely hold barring an exogenous development.

Graphic: 65-minute profile chart of the Micro E-mini S&P 500 Futures.

Definitions

Volume Areas: Markets will build on areas of high-volume (HVNodes). Should the market trend for a period of time, this will be identified by a low-volume area (LVNodes). The LVNodes denote directional conviction and ought to offer support on any test.

If participants auction and find acceptance in an area of a prior LVNode, then future discovery ought to be volatile and quick as participants look to the nearest HVNodes for more favorable entry or exit.

Gamma: The sensitivity of an option’s Delta to changes in the underlying asset’s price.

CPOCs: Denote areas where two-sided trade was most prevalent over all sessions. Participants will respond to future tests of value as they offer favorable entry and exit.

POCs: Areas where two-sided trade was most prevalent in a prior day session. Participants will respond to future tests of value as they offer favorable entry and exit.

MCPOCs: Denote areas where two-sided trade was most prevalent over numerous sessions. Participants will respond to future tests of value as they offer favorable entry and exit.

Inversion Of VIX Futures Term Structure: Longer-dated VIX expiries are less expensive; is a warning of elevated near-term risks for equity market stability.


About

The author, Renato Leonard Capelj, works in finance and journalism.

Capelj spends the bulk of his time at Physik Invest, an entity through which he invests and publishes free daily analyses to thousands of subscribers. The analyses offer him and his subscribers a way to stay on the right side of the market. Separately, Capelj is an options analyst at SpotGamma and an accredited journalist.

Capelj’s past works include conversations with investor Kevin O’Leary, ARK Invest’s Catherine Wood, FTX’s Sam Bankman-Fried, North Dakota Governor Doug Burgum, Lithuania’s Minister of Economy and Innovation Aušrinė Armonaitė, former Cisco chairman and CEO John Chambers, and persons at the Clinton Global Initiative.

Connect

Direct queries to renato@physikinvest.com. Find Physik Invest on TwitterLinkedInFacebook, and Instagram. Find Capelj on TwitterLinkedIn, and Instagram. Only follow the verified profiles.

Calendar

You may view this letter’s content calendar at this link.

Disclaimer

Do not construe this newsletter as advice. All content is for informational purposes. Capelj and Physik Invest manage their own capital and will not solicit others for it.

Categories
Commentary

Daily Brief For October 4, 2022

The daily brief is a free glimpse into the prevailing fundamental and technical drivers of U.S. equity market products. Join the 990+ that read this report daily, below!

Graphic updated 9:20 AM ET. Sentiment Risk-On if expected /ES open is above the prior day’s range. /ES levels are derived from the profile graphic at the bottom of the following section. Levels may have changed since initially quoted; click here for the latest levels. SqueezeMetrics Dark Pool Index (DIX) and Gamma (GEX) calculations are based on where the prior day’s reading falls with respect to the MAX and MIN of all occurrences available. A higher DIX is bullish. At the same time, the lower the GEX, the more (expected) volatility. Learn the implications of volatility, direction, and moneyness. Breadth reflects a reading of the prior day’s NYSE Advance/Decline indicator. VIX reflects a current reading of the CBOE Volatility Index (INDEX: VIX) from 0-100.

Fundamental

Fresh and top of mind, still, is the Credit Suisse Group AG (NYSE: CS) debacle. However, despite the bank’s “critical moment,” as discussed in yesterday’s letter, credit default swap (CDS) levels, though still rising, are “far from distressed.”

Graphic: Retrieved from Reuters.

Adding, not reflected by the stock is a “strong capital base and liquidity position,” per CS.

Graphic: Retrieved from Credit Suisse Group AG (NYSE: CS).

A big topic speculated on was CS’ probability of default. At its core, CDS spreads relate to the probability of default in the following way, per Deutsche Bank AG (NYSE: DB) research

(CDS Spread) / (1 – Recovery Rate) = Implied Probability Of Default.

The recovery rate is basically the (estimated) amount of a loan that will be repaid in the case of a bankruptcy or default. Per European Central Bank research, “the standard recovery rate used by the industry in price calculations is 40%.”

Roughly speaking, below is a quick calculation:

250 basis points / (1 – 0.40) = 416.67 basis points = 4.17% Implied Probability Of Default

In CS’ case, if the spread is 250 basis points, assuming a 40% recovery, that’s a 4.17% default probability implied. If the spread was at 150 basis points, then, assuming a 40% recovery, that’s a 2.5% chance of default.

Graphic: Taken from @EffMktHype who retrieved from Bloomberg. “So many [Bloomberg] screenshots of CS CDS levels and talking about massive default prob numbers. Zero people actually using [the] same terminal to look at default risk screen.”

Taken together, in short, similar to as we put forth, yesterday, “[t]his is not 2008,” per Citigroup Inc’s (NYSE: C) Andrew Coombs. Bloomberg adds that Morgan Stanley (NYSE: MS) faced its own credit spread debacle during 2011 European debt exposure rumors; “it took months for the price of the default swaps to fall as the feared losses never materialized.”

Graphic: Retrieved from Reuters.

Ahead of an October 27 CS review covering topics including “a large-scale investment banking retreat, … [i]nvestors are worried about how much the bank will [have to] cover” a restructuring.

Bloomberg adds: “A sale of Credit Suisse’s structured-products group, which trades securitized debt, has attracted interest from potential buyers, … [amid] rising interest rates.”

Per UBS Group AG (NYSE: UBS) research, a sale of such businesses, which may be worth more than the market is currently implying, “could help to avoid a dilutive capital increase.”

Positioning

“Month-end portfolio rebalances and [the] expiration of quarterly option strategies [acted] in support of the market,” JPMorgan Chase & Co’s (NYSE: JPM) Marko Kolanovic stated in a September 30, 2022 commentary titled “Throwing rocks in glass houses.”

In that same commentary, Kolanovic eased support for his 2022 price targets on economic volatility led by central banks, the war in Europe, and beyond.

As stated last week, per Kai Volatility’s Cem Karsan, it’s the case that the removal of options strategies and potential supply of protection (as investors further come to the realization that options protection has done little to protect against downside) may provide markets a boost.

Graphic: Taken from @Alpha_Ex_LLC who retrieved from Bloomberg. S&P 500 (INDEX: SPX) October put option lower in price and volatility.

Ultimately, though, a final resolution would be “tied to the incremental effects on liquidity,” (e.g., QT manifesting itself as “$4.5 billion less in demand for assets per day,” and buyback blackout) while options repositioning may make the case for increased fragility, as traders’ falling demand for put protection opens the door to less supportive hedging flows with respect to time (Charm) and volatility (Vanna) changes.

Graphic: Retrieved from SqueezeMetrics.

Therefore, trades such as the Short Ratio Put Spread, particularly if narrower, may be far riskier to employ into the end of this year and the middle half of next year. For context, this was a trade to have on this year.

As participants continue to make the aforementioned realizations and supply to the market put (downside protection), tails may “continue to be cheap,” and discount “crash risk,” according to The Ambrus Group’s Kris Sidial.

A lot more to resolve this jumbled mess of a newsletter in the coming days.

Technical

As of 9:10 AM ET, Tuesday’s regular session (9:30 AM – 4:00 PM ET), in the S&P 500, is likely to open in the upper part of a positively skewed overnight inventory, outside of prior-range and -value, suggesting a potential for immediate directional opportunity.

In the best case, the S&P 500 trades higher.

Any activity above the $3,771.25 HVNode puts into play the $3,826.25 HVNode. Initiative trade beyond the last-mentioned could reach as high as the $3,862.25 HVNode and $3,893.00 VPOC, or higher.

In the worst case, the S&P 500 trades lower.

Any activity below the $3,771.25 HVNode puts into play the $3,722.50 LVNode. Initiative trade beyond the LVNode could reach as low as the $3,671.00 VPOC and $3,610.75 HVNode, or lower.

Click here to load today’s key levels into the web-based TradingView charting platform. Note that all levels are derived using the 65-minute timeframe. New links are produced, daily.
Graphic: 65-minute profile chart of the Micro E-mini S&P 500 Futures.

Definitions

Volume Areas: A structurally sound market will build on areas of high volume (HVNodes). Should the market trend for long periods of time, it will lack sound structure, identified as low volume areas (LVNodes). LVNodes denote directional conviction and ought to offer support on any test. 

If participants were to auction and find acceptance into areas of prior low volume (LVNodes), then future discovery ought to be volatile and quick as participants look to HVNodes for favorable entry or exit.

POCs: POCs are valuable as they denote areas where two-sided trade was most prevalent in a prior day session. Participants will respond to future tests of value as they offer favorable entry and exit.

Vanna: The rate at which the delta of an option changes with respect to volatility.

Charm: The rate at which the delta of an option changes with respect to time.

About

After years of self-education, strategy development, mentorship, and trial-and-error, Renato Leonard Capelj began trading full-time and founded Physik Invest to detail his methods, research, and performance in the markets.

Capelj also develops insights around impactful options market dynamics at SpotGamma and is a Benzinga reporter.

Some of his works include conversations with ARK Invest’s Catherine Wood, investors Kevin O’Leary and John Chambers, FTX’s Sam Bankman-Fried, ex-Bridgewater Associate Andy Constan, Kai Volatility’s Cem Karsan, The Ambrus Group’s Kris Sidial, among many others.

Disclaimer

In no way should the materials herein be construed as advice. Derivatives carry a substantial risk of loss. All content is for informational purposes only.

Categories
Commentary

Daily Brief For June 16, 2022

The daily brief is a free glimpse into the prevailing fundamental and technical drivers of U.S. equity market products. Join the 300+ that read this report daily, below!

What Happened

Overnight, equity index futures took back the post-Federal Open Market Committee (FOMC) bump. Bonds and most commodity products (less gold) followed suit. 

The Federal Reserve (Fed) admitted to run-away prices and committed to slaying inflation via tougher action. Accordingly, the central bank upped interest rates by 75 basis points. This was the largest increase since 1994 and, as the Fed commented, another 75 basis point hike may be in store at the next meeting in July.

In other news, the Celsius Network (CRYPTO: CEL), a crypto favorite that amassed in excess of $20 billion in assets, froze withdrawals to stop what some say was a potential bank run. Private equity is facing a so-called “crisis of value” given over inflated prices in that market. 

We shall unpack the latter, below, a bit.

Also, U.S. retail sales posted their first drop in five months, the Bank of England raised its rates along with the Swiss central bank which surprised with its first hike since 2007.

This is all the while Goldman Sachs Group Inc’s (NYSE: GS) buyback desk was flooded with volumes about 3 times last year’s daily average. This could be construed as companies viewing the latest selloff as an “opportunity to repurchase shares rather than retrenching.”

Ahead is data on jobless claims, building permits, housing starts, as well as the Philadelphia Fed’s manufacturing index (8:30 AM ET).

Graphic updated 6:30 AM ET. Sentiment Risk-Off if expected /ES open is below the prior day’s range. /ES levels are derived from the profile graphic at the bottom of the following section. Levels may have changed since initially quoted; click here for the latest levels. SqueezeMetrics Dark Pool Index (DIX) and Gamma (GEX) calculations are based on where the prior day’s reading falls with respect to the MAX and MIN of all occurrences available. A higher DIX is bullish. At the same time, the lower the GEX, the more (expected) volatility. Learn the implications of volatility, direction, and moneyness. SHIFT data used for S&P 500 (INDEX: SPX) options activity. Note that options flow is sorted by the call premium spent; if more positive, then more was spent on call options. Breadth reflects a reading of the prior day’s NYSE Advance/Decline indicator. VIX reflects a current reading of the CBOE Volatility Index (INDEX: VIX) from 0-100.

What To Expect

Fundamental: Fed funds rate upped 75 basis points. 

Now, it appears the rate will surpass 3% after the FOMC affirmed its commitment “to returning inflation to its 2% objective.” Participants reacted, pricing in the potential for a rate peak in the range of 4.00-4.75% early-to-mid 2023, after which the easing cycle is to likely take place.

Graphic: Via CME Group Inc’s (NASDAQ: CME) FedWatch Tool.

The overnight rate is expected to peak near 4.23% by mid-2023. This is a given via a quick check of the Eurodollar (FUTURE: /GE) futures curve, a reflection of participants’ outlook on interest rates. The peak of the Fed-rate-hike cycle – terminal rate – is around March 2023 (previously it was June).

For context, the price of /GE reflects the interest offered on U.S. dollar-denominated deposits at banks outside of the U.S. With that, they’re “expressed numerically using 100 minus the implied 3-month U.S. dollar LIBOR interest rate,” per Investopedia. This means that at current March 2023 prices (95.775), this reflects an implied interest rate settlement rate of 4.225%.

Read: The shift from the Eurodollar to SOFR is accelerating as “SOFR adoption cracked 50%.”

Moreover, the FOMC’s forecasts for inflation have moved all the while predictions for 2023 and 2024 have not. 

Graphic: Via FOMC. Taken from Bloomberg.

GDP growth estimates, too, have shifted but with the expectation there still will be growth.

Graphic: Via FOMC. Taken from Bloomberg.

As stated in this morning’s introduction (above), these policy adjustments are inflicting damage on some inflated areas of the market like crypto and private equity.

Recall that prevailing monetary policies made it easier to borrow and make longer-duration bets on ideas with a lot of promise in the future. Central banks, too, underwrote losses of this regime and encouraged continued growth. This had consequences on the real economy and asset prices which rose and kept deflationary pressures at bay.

As well put forth in our May 18, 2022 commentary, the recent market rout is a recession and the direct reflection of the unwind of carry. Capital was “misallocated” and the Fed’s move to control price stability is “completely unreasonable” as they’re not in a position to do it “without bringing down the markets,” per Kai Volatility’s Cem Karsan.

Read: Kris Abdelmessih’s Moontower #148 on prevailing macroeconomic perspectives.

As Lyn Alden of Lyn Alden Investment Strategy put forth, “unfortunately for the Fed, the U.S. economic growth rate is already decelerating” and, to cut inflation, it must reduce demand for goods. Indeed, this is recessionary and is already reflected by slowing retail sales.

Graphic: Via Bloomberg. “As price pressures become more entrenched in the economy, spending will likely ebb either due to higher prices, higher interest rates, or both.”

As Bloomberg explains, spending has shifted and is supported by consumers spending down their savings and leveraging credit cards. 

Read: Klarna’s debt costs rise as buy-now-pay-later sector suffers.

Graphic: Via Bloomberg. This “could be concerning if Americans fail to keep up on payments. That could ultimately mean a slowdown in the pace of inflation-adjusted consumption.”

“If this credit bubble ever pops, it’s going to be the most catastrophic market failure that anyone has ever read about — but let’s hope that doesn’t happen,” Mark Spitznagel, Miami-based Universa’s CIO, said in early June. “We’ve gotten ourselves into a tough spot.” 

Perspectives: “The move in markets prices in more than enough recession risk, and we believe a near-term recession will ultimately be avoided thanks to consumer strength, Covid reopening/recovery, and policy stimulus in China,” JPMorgan Chase & Co’s (NYSE: JPM) Marko Kolanovic and his team said

Positioning: Measures of implied volatility had come in, yesterday, and that was significant in that participants have a lot of exposure to put options.

Graphic: Via SpotGamma’s Hedging Impact of Real-Time Options (HIRO) indicator.

Further, (naively) we see it as liquidity providers being short those puts. As volatility continues to come in, the exposure of those options to direction (delta) compresses. 

As a result, liquidity providers cut some of their negative (static) delta hedges to that positive delta put position.

Graphic: Via SpotGamma. “SPX prices X-axis. Option delta Y-axis. When the factors of implied volatility and time change, hedging ratios change. For instance, if SPX is at $4,700.00 and IV jumps 15% (all else equal), the dealer may sell an additional 0.2 deltas to hedge their exposure to the addition of a positive 0.2 delta. The graphic is for illustrational purposes, only.”

This means that the potential options expiration (OPEX) related bullishness, so to speak, was pulled forward and, now, markets, being markedly lower than they were immediately after the FOMC event, are at risk of trading into (and below) the sizeable interest down below.

Read: Daily Brief for June 15, 2022.

Graphic: Taken by Physik Invest from Interactive Brokers Group Inc (NASDAQ: IBKR). Updated 6/15/2022.

As stated, yesterday, these options, down below, have little time to expiry and, thus, their gamma (options sensitivity to direction) grows rather large, at near-the-money strikes.

Graphic: Text taken from Exotic Options and Hybrids: A Guide to Structuring, Pricing and Trading. 

As the time to expiry narrows, above the strike in question delta decays, and counterparts buy back their static delta hedges. 

As the time to expiry narrows, below the strike in question delta expands and counterparts sell more static delta to hedge.

Graphic: Text taken from Exotic Options and Hybrids: A Guide to Structuring, Pricing and Trading.

This means that if below these high-interest strikes, associated hedging, less any new reach for protection would pressure markets lower. If above, hedging, less new sales of protection, would bolster markets higher.

Ultimately, if lower, all else equal, the June 17 OPEX will coincide with the removal of the in-the-money options exposures in question. This opens a window during which markets may have less pressure to rally against.

Bonus: As SpotGamma explains, “​​[g]iven the supply and demand of volatility, as well as divergences in the volatility that the market realizes and implies from options activity, there’s a case to be made for maintaining positive exposure to direction via long volatility.”

Read: Trading Volatility, Correlation, Term Structure and Skew by Colin Bennett et al. Originally sourced via Academia.edu.

Graphic: Taken by Physik Invest from Interactive Brokers Group Inc (NASDAQ: IBKR). The divergence in volatility implied (IVOL) by participants’ options activity, versus that which the market realizes (RVOL) resurfaced on June 15, 2022, in the Nasdaq 100 (INDEX: NDX).

Technical: As of 6:30 AM ET, Thursday’s regular session (9:30 AM – 4:00 PM ET), in the S&P 500, will likely open in the lower part of a negatively skewed overnight inventory, outside of prior-range and -value, suggesting a potential for immediate directional opportunity.

In the best case, the S&P 500 trades higher; activity above the $3,688.75 HVNode puts in play the $3,727.75 HVNode. Initiative trade beyond the $3,727.75 HVNode could reach as high as the $3,773.25 HVNode and $3,808.50 HVNode, or higher.

In the worst case, the S&P 500 trades lower; activity below the $3,688.75 HVNode puts in play the $3,664.25 HVNode. Initiative trade beyond the $3,664.25 HVNode could reach as low as the $3,610.75 HVNode and $3,587.25 LVNode, or lower.

Click here to load today’s key levels into the web-based TradingView charting platform. Note that all levels are derived using the 65-minute timeframe. New links are produced, daily.
Graphic: 65-minute profile chart of the Micro E-mini S&P 500 Futures.

What People Are Saying

Definitions

Should the market trend for long periods of time, it will lack sound structure, identified as low volume areas (LVNodes). LVNodes denote directional conviction and ought to offer support on any test. 

If participants were to auction and find acceptance into areas of prior low volume (LVNodes), then future discovery ought to be volatile and quick as participants look to HVNodes for favorable entry or exit.

About

After years of self-education, strategy development, mentorship, and trial-and-error, Renato Leonard Capelj began trading full-time and founded Physik Invest to detail his methods, research, and performance in the markets.

Capelj also develops insights around impactful options market dynamics at SpotGamma and is a Benzinga reporter.

Some of his works include conversations with ARK Invest’s Catherine Wood, investors Kevin O’Leary and John Chambers, FTX’s Sam Bankman-Fried, Kai Volatility’s Cem Karsan, The Ambrus Group’s Kris Sidial, among many others.

Disclaimer

In no way should the materials herein be construed as advice. Derivatives carry a substantial risk of loss. All content is for informational purposes only.

Categories
Commentary

Daily Brief For May 25, 2022

The daily brief is a free glimpse into the prevailing fundamental and technical drivers of U.S. equity market products. Join the 300+ that read this report daily, below!

What Happened

Overnight, equity index futures were steady alongside commodities and bonds. This is ahead of the release of minutes from a Federal Reserve (Fed) policy meeting. 

In the news were advertising and social media firms. Snap Inc (NYSE: SNAP) warned of slower growth and deterioration in the macro-environment. Its peers Meta Platforms Inc (NASDAQ: FB), Alphabet Inc (NASDAQ: GOOGL), and Twitter Inc (NYSE: TWTR) also saw weakness.

China’s COVID Zero commitment likely nudges it off a path to achieve economic targets “by a large margin for the first time ever,” as Bloomberg explains

This is as China and Russia have conducted one of their largest joint air drills “to send their own political, economic and military message to the international community,” much of which is at Davos, Switzerland doing thought exercises.

In a recent podcast, Pippa Malmgren, who is a former White House adviser and economist, well said, particularly in reference to some of the tension abroad, that “autocracy is not working well,” and “[y]ou go to war because … you have a domestic objective.”

Thought it was interesting. Give it a listen, here.

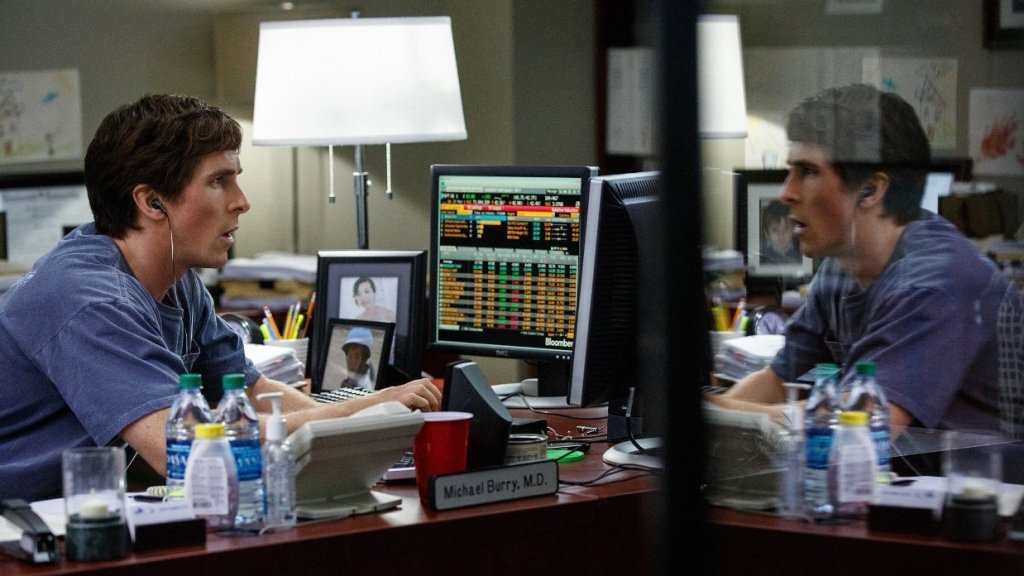
And, finally, Michael Burry of the “Big Short” sent a cryptic tweet alluding to what is likely the risk of another financial collapse. 

Moreover, ahead is data on durable goods and core capital equipment orders (8:30 AM ET). Later, the Fed publishes the minutes of its last policy meeting (2:00 PM ET).

Graphic updated 6:10 AM ET. Sentiment Neutral if expected /ES open is inside of the prior day’s range. /ES levels are derived from the profile graphic at the bottom of the following section. Levels may have changed since initially quoted; click here for the latest levels. SqueezeMetrics Dark Pool Index (DIX) and Gamma (GEX) calculations are based on where the prior day’s reading falls with respect to the MAX and MIN of all occurrences available. A higher DIX is bullish. At the same time, the lower the GEX, the more (expected) volatility. Learn the implications of volatility, direction, and moneyness. SHIFT data used for S&P 500 (INDEX: SPX) options activity. Note that options flow is sorted by the call premium spent; if more positive, then more was spent on call options. Breadth reflects a reading of the prior day’s NYSE Advance/Decline indicator. VIX reflects a current reading of the CBOE Volatility Index (INDEX: VIX) from 0-100.

What To Expect

Fundamental: The Fed will issue policy meeting minutes that may provide clarity with respect to its intent to hike and reduce the size of its balance sheet.

In focus, per ex-Fed insider Ellen Meade, is “the rate path, the expected economic conditions, and what policymakers want to see from the data before they slow the pace of tightening.”

“The minutes may tell us they see the tightening in conditions this time around as greater than in earlier cycles. If that’s the case, then they may judge that they don’t need to raise the funds rate by as much this time around.”

Graphic: Via Morgan Stanley (NYSE: MS) research.

John Authers notes, however, that “inflation tends to move in waves” and it doesn’t, usually, “plateau and stay there.”

Graphic: Via Bloomberg.

“That suggests that even though the focus is already shifting to whether there is evidence of a growth slowdown,” he added, in a statement echoed by Meade who is betting on slower “GDP growth, below its longer-run rate, and a rise in the unemployment rate, perhaps to its longer-run median rate or slightly above.”

Graphic: Via Bloomberg.

Pursuant to those last remarks, the Fed’s Raphael Bostic is already floating a pause to rate hikes near September if inflation falls more than expected over the summer.

As Diane Swonk of Grant Thorton explains, “Policy works with a lag. The Fed wants to catch up but not outrun the market in its effort to tighten credit market conditions.”

Graphic: Via Bloomberg.

Futures First analyst Rishi Mishra, who is also the author of the “On Another Note” newsletter, suggests the Federal Open Market Committee may, rather, hone in on monthly changes with annual inflation still elevated.

“This brings down inflation expectations into a range where the Fed feels comfortable about de-anchoring risks,” Mishra said.

Graphic: Via JPMorgan Chase & Co (NYSE: JPM). Taken from Bloomberg. Though, potentially, “premature,” JPM’s model tracking the S&P 500, credit spreads and yield curve implies a 40% chance of a recession.

JPM’s Marko Kolanovic adds: “We have gone from a situation where both stocks and bonds were sold on the back of de-leveraging, to a situation where bonds rallied as stocks fell, nudging stock/bond correlations toward a more normal (negative) level.”

“We do indeed think this is where things could be gradually heading, but we acknowledge this is not likely to play out in a linear way.”

Graphic: Via @MrBlonde_macro. “Stock/bond correlation negative over the last 10 days. Some ‘normalization’ in cross-market relationships can be a source of relief.” The flip happened with 10-year yields at or above 3%.

Positioning: In yesterday’s in-depth write-up, we talked about the underperformance of implied volatility (IVOL), relative to that which is realized (RVOL).

Dennis Davitt of Millbank Dartmoor Portsmouth had explained that the “RVOL of the underlying S&P 500 is above 27% … with IVOL of options trading between 24%-27%,” which translates to a VIX at 30%.

Graphic: Via Goldman Sachs Group Inc (NYSE: GS). Taken from The Market Ear.

So, essentially, it makes more sense to have exposure to underlying markets, synthetically (i.e., own options). 

This, though, merits a bit more clarification (as I do not want it to be construed as if I was buying, systemically, bets on the downside). The opposite, actually.

Moreover, this was stated in the context of a market that is “(1) stretched and (2) near a critical inflection which we see at $3,700.00 SPX,” per SpotGamma. Separately, investors are bidding “skew on the call side” amid their “fear of missing on the upside.”

That’s when it makes sense to buy closer to at-the-money (ATM) and sell farther from ATM, or out-of-the-money (OTM). For instance, a margin intensive but low cost call +1 [ATM] x -2 [OTM] ratio spread

Note, however, that width and timing are everything. Too much time or too narrow may result in asymmetric losses when the demand for upside bets further out in price and time bids the skew that you’re short, relative to the at-the-money volatility you own. 

I’m willing to talk through this via email, if interested. Ping me at renato@physikinvest.com. I’m mindful that if I do post actual trade ideas, people may take them without knowing how to size and manage them, accordingly. Big yikes!

Goldman validates this thesis: “Even though the VIX’s reaction to recent spot downside has been mild, its high starting point leaves vol high overall, and we like strategies with a short volatility bias, including put selling and 1×2 call spread overlays.”

Graphic: Via Banco Santander SA (NYSE: SAN) research, the return profile, at expiry, of a classic 1×2 (long 1, short 2 further away) ratio spread.

Further, though SpotGamma assigns an edge to lower prices until the June FOMC and OPEX, “markets (which are already ‘fully loaded’ with puts) [are likely] pressured by liquidity providers’ hedging [at most] down to $3,700.00,” the area where that added pressure from hedging cools.

Graphic: Via SpotGamma.

Technical: As of 6:15 AM ET, Wednesday’s regular session (9:30 AM – 4:00 PM ET), in the S&P 500, will likely open in the lower part of a balanced overnight inventory, just inside of prior-range and -value, suggesting a limited potential for immediate directional opportunity.

In the best case, the S&P 500 trades higher; activity above the $3,943.25 HVNode puts in play the $3,969.00 ONH. Initiative trade beyond the ONH could reach as high as the $4,061.00 VPOC and $4,095.00 ONH, or higher.

In the worst case, the S&P 500 trades lower; activity below the $3,943.25 HVNode puts in play the $3,917.00 VPOC. Initiative trade beyond the VPOC could reach as low as the $3,863.25 LVNode and $3,831.00 VPOC, or lower.

Click here to load today’s key levels into the web-based TradingView charting platform. Note that all levels are derived using the 65-minute timeframe. New links are produced, daily.
Graphic: 65-minute profile chart of the Micro E-mini S&P 500 Futures.

Considerations: Push-and-pull, as well as responsiveness near key-technical areas (discernable visually on a chart), suggests technically-driven traders with shorter time horizons are very active.

Such traders often lack the wherewithal to defend retests.

Large participants (who often move by committee) seldom respond to key technical inflections. It is their activity that often results in poor reliability of our technical levels.

Sometimes, the better trade is to wait for the larger participants’ entry and use the expansion of the range as a confirmation of a new trend.

Catalysts to consider include the release of Federal Open Market Committee (FOMC) minutes, Wednesday.

Definitions

Overnight Highs And Lows (ONH and ONL): Typically, there is a low historical probability associated with overnight rally-highs (lows) ending the upside (downside) discovery process.

Volume Areas: A structurally sound market will build on areas of high volume (HVNodes). Should the market trend for long periods of time, it will lack sound structure, identified as low volume areas (LVNodes). LVNodes denote directional conviction and ought to offer support on any test. 

If participants were to auction and find acceptance into areas of prior low volume (LVNodes), then future discovery ought to be volatile and quick as participants look to HVNodes for favorable entry or exit.

POCs: POCs are valuable as they denote areas where two-sided trade was most prevalent in a prior day session. Participants will respond to future value tests as they offer favorable entry and exit.

About

After years of self-education, strategy development, mentorship, and trial-and-error, Renato Leonard Capelj began trading full-time and founded Physik Invest to detail his methods, research, and performance in the markets.

Capelj also develops insights around impactful options market dynamics at SpotGamma and is a Benzinga reporter.

Some of his works include conversations with ARK Invest’s Catherine Wood, investors Kevin O’Leary and John Chambers, FTX’s Sam Bankman-Fried, Kai Volatility’s Cem Karsan, The Ambrus Group’s Kris Sidial, among many others.

Disclaimer

In no way should the materials herein be construed as advice. Derivatives carry a substantial risk of loss. All content is for informational purposes only.