Categories
Commentary

Yield Hunger Sparks Concerns Of A Volmageddon Redux

Good Morning! I hope you are having a good week. I would be so honored if you could comment and/or share this post. Cheers!

As we step into Spring, we’re riding the wave of one of the strongest stock market rallies in over fifty years. It’s been a period of smooth sailing, with record highs beckoning transition from concern over potential downturns to the fear of being left out of further gains.

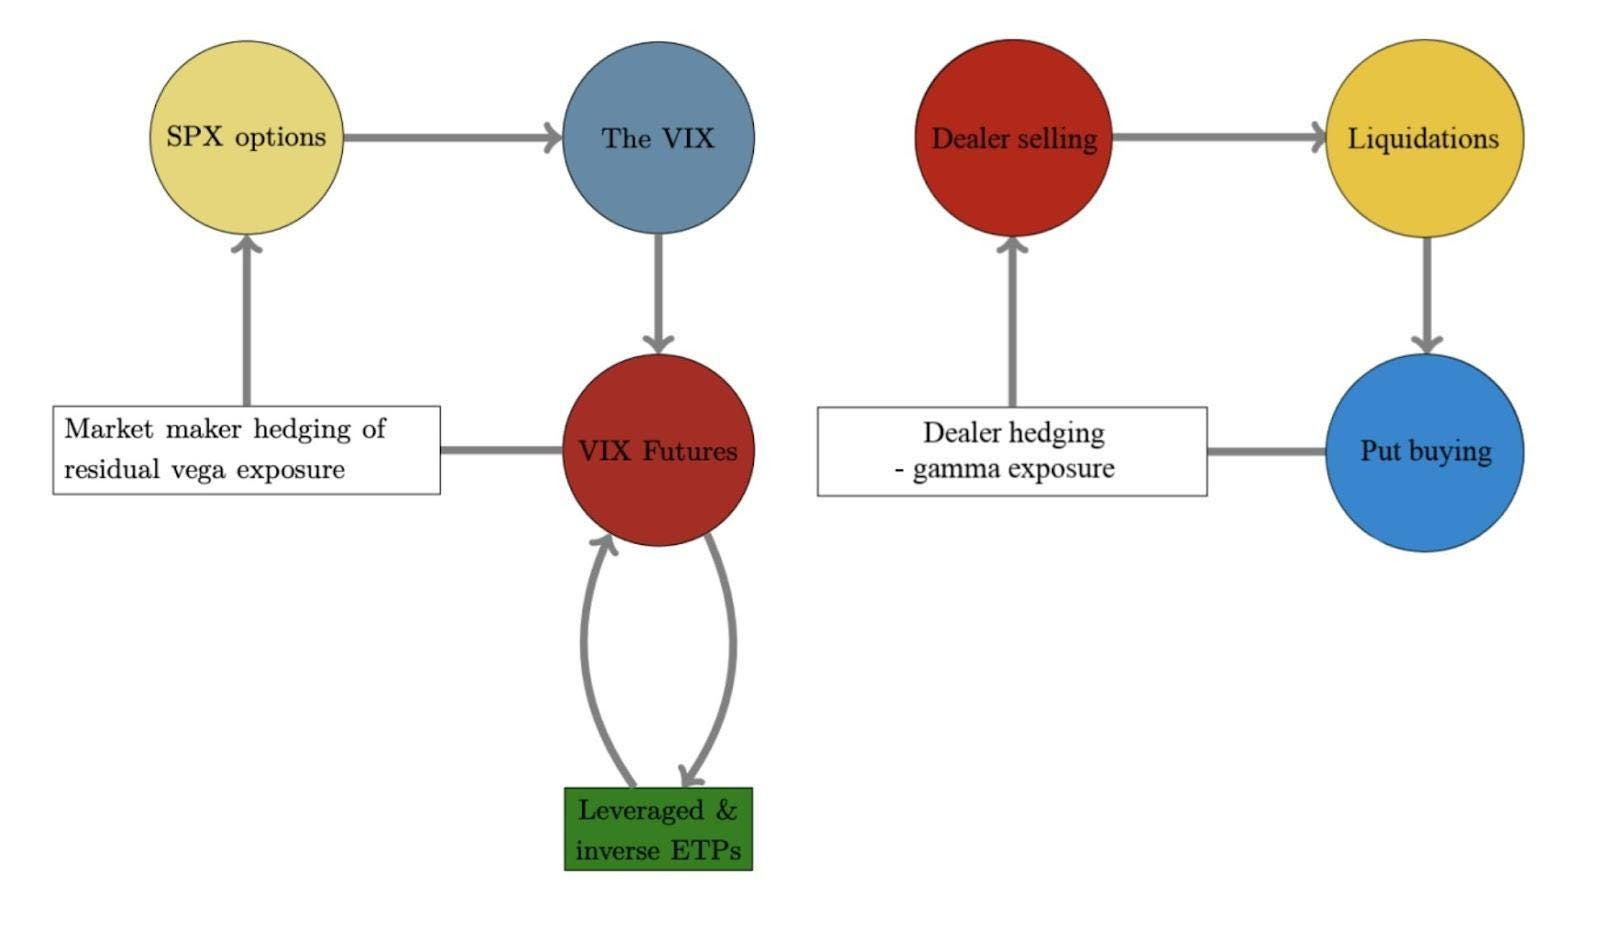
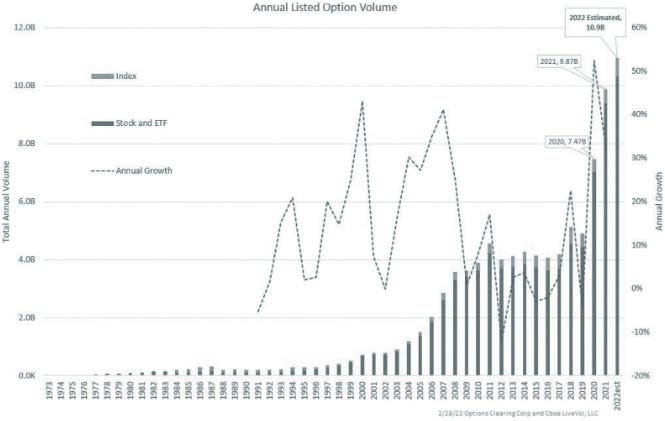
The BIS has commented on some of these trading behaviors, which can drive upward momentum and foster a sense of calm or low volatility. They point to the increased use of yield-enhancing structured products as a critical reason for reducing volatility. These products have stolen the show, boosting investor returns by selling options or betting against market fluctuations. In calm markets, those on the opposite side of these bets hedge in a way that reduces volatility: they buy when underlying asset prices dip and sell when they rise. As the supply of options increases, the liquidity injected to hedge stifles movement, resulting in a stubbornly low Cboe Volatility Index or VIX.

The BIS example illustrates a product that sells call options against an index position to lower the cost basis by collecting premiums. The counterparty buys call options and hedges by selling the same index. If the call options lose value or the market declines, the counterparty buys back the index they sold initially. This strategy is constructive and potentially bullish, especially in a rising market, as one could infer counterparties may postpone rebalancing to optimize profits (i.e., swiftly cut losses and allow profits to accumulate).

Graphic: Retrieved from Bank for International Settlements.

However, these trading behaviors come with risks. 

While individual stocks may experience volatility, the indexes representing them move begrudgingly. Investors have concentrated on selling options or volatility (the all-encompassing term) on indexes to fund volatility in individual components, a strategy known as dispersion. Although typically stabilizing, experts caution that it can end dramatically. One can look at the destructive selling in China as a cautionary example.

Kai Volatility’s Cem Karsan compares the trade to two sumo wrestlers or colossal plates on the Earth’s core exerting immense pressure against each other. While the trade may appear balanced and continue far longer, the accumulated pressures pose significant risks. Major crashes (up or down) happen when entities are compelled to trade volatility and options. Often, the trigger is the inability to cover the margin and meet regulatory requirements, causing a cascading effect (e.g., GameStop and 2020 crash).

The current scenario mirrors the conditions before Volmageddon, where short-volatility tactics failed. 

With implied correlations low, a market shock could see investors exiting their positions abruptly, amplifying volatility. Karsan notes a precursor to such a crash is a weakening supply of margin puts, particularly the highly convex and far out-of-the-money ones. These options play a significant role during stressful market periods, acting as indicators and drivers of impending crashes. The focus is on convexity (i.e., the rate of change of delta for changes in the underlying asset’s price or the nonlinear relationship between the option’s price and the underlying asset) rather than whether there are good odds the underlying asset will trade down to the options in question.

“Implied vol is about liquidity. It isn’t about fear or greed,” writes Capital Flows Research. “Implied vol is about liquidity on specific parts of the distribution of returns on an asset. Remember, even the outright price of an asset is pricing a distribution of outcomes, not a single destination. Options make this even more explicit by having various strikes and expirations with differing premiums and discounts.”

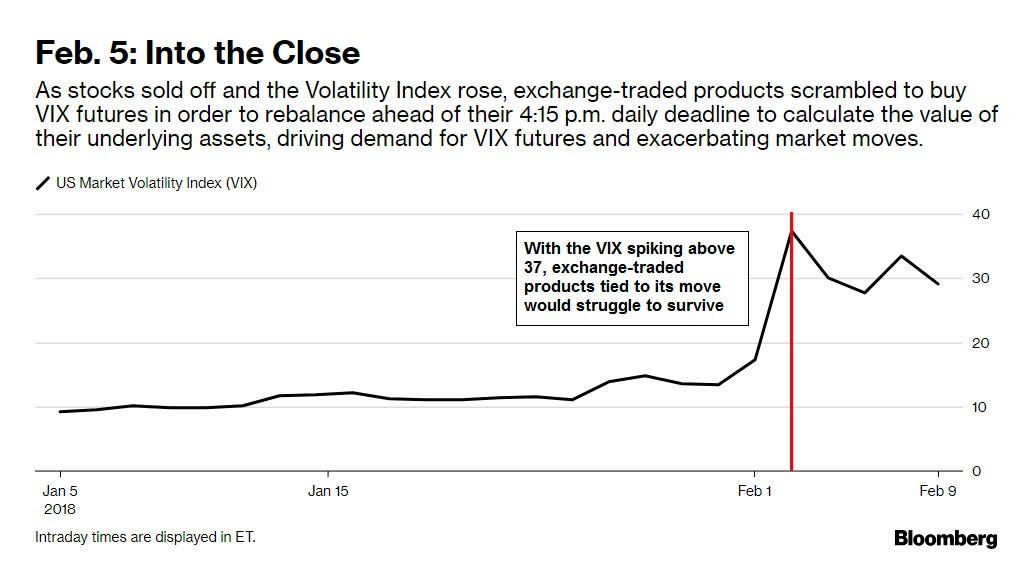
History shows a minor catalyst can lead to a dramatic unwind. Take what happened with S&P 500 options a day before XIV crash day.

“Going into the close the last hour, we saw nickel, ten, and five-cent options trade up to about $0.50 and $0.70,” Karsan elaborates. “They really started to pop in the last hour.”

“And then, the next day, we opened up and they were worth $10.00. You often don’t see them go from a nickel to $0.50. If you do, don’t sell them. Buy them, which is the next trade.”
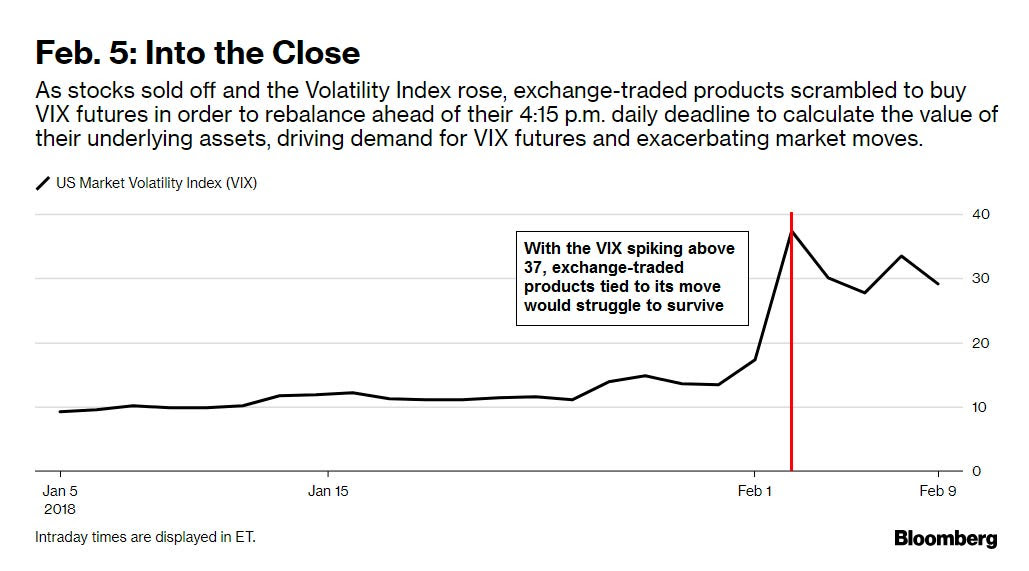
Graphic: Retrieved from Bloomberg.

Similar to downward crashes, there are occasional but now more common upward crashes. 

Recent market movements, particularly the surge in stocks such as Nvidia, Super Micro Computer, and MicroStrategy, echo the frenzy seen with high-flying stocks like GameStop in 2021. This caused losses for some liquidity providers and funds that mistakenly equated the price or level of volatility with value, selling it at a discount to where it would eventually trade.

Graphic: Retrieved from Bloomberg via Simplify Asset Management’s Michael Green.

“I remember several traders I knew trying to short-vol on GME when it was at 300 because it was ‘cheap’ due to its level,” Capital Flows Research adds. “They were blown out of those positions.”

Graphic: Retrieved from Bloomberg via Capital Flows Research.

So, we have played along, nodding to George Soros’s famous statement: “When I see a bubble forming, I rush in to buy, adding fuel to the fire. That is not irrational.”

To explain, we go deeper into something known as implied volatility skew.

Skew refers to the difference in implied volatility across different strike options on the same underlying asset. Typically, options with farther away strike prices (out-of-the-money puts) have higher implied volatility than options with higher strike prices (at-the-money calls).

Implied volatility skew, as shown below, is often nonsymmetrical due to higher demand for downside protection.

When volatility skews become steeper, the disparity in implied volatility between various strike prices widens. For instance, the implied volatility of out-of-the-money (OTM) puts, which offer protection against market downturns, rises compared to at-the-money (ATM) puts and upside protection (calls). This steepening volatility skew indicates heightened apprehension among investors regarding potentially large downward market movements. Similarly, when the implied volatility of upside protection (calls) surpasses that of downside protection (puts), it signals growing concern (i.e., FOMO) about potential upward market movements. A steepening call volatility skew results from distant call options pricing higher implied volatility than usual due to investor demand/fear.

Graphic: Retrieved from Exotic Options and Hybrids: A Guide to Structuring, Pricing and Trading.

As savvy traders, we can construct creative structures and sell options against the closer ones we own to lower our costs on bullish trades. We detailed such bullish trades in our last two commentaries titled “BOXXing For Beginners” and “Foreshocks.” The outcomes for one of Physik Invest’s accounts are detailed below.

Graphic: Retrieved from TD Ameritrade’s thinkorswim platform.

Regrettably, enthusiasm is waning. Using Nvidia as an illustration, the stock surged 2.6% on Friday but plummeted 8% on the same day. The call skew was elevated over the weekend before leveling off earlier this week, which poses difficulties for traders betting on further upward movement.

Graphic: Retrieved from SpotGamma.

We discussed how such a flattening could foreshadow waning risk appetite and potentially herald market softness. SpotGamma indicates that call skews are flattening across the board, as illustrated in the chart below.

The red bars on the left represent approximately 90th percentile skews during a significant stock rally. However, a week later, on the right side, the skew rankings decline. “This appears like the uniformly bullish action in top tech stocks is breaking apart,” SpotGamma explains. This “is a reduction in bullish exuberance.”

Graphic: Retrieved from SpotGamma.

This activity will not likely disrupt the broader market; markets will stay intact as traders double down, selling shorter-dated volatility and buying farther-dated ones. We observe this using SpotGamma’s Fixed Strike Matrix below. In a simplistic sense, red indicates selling, while green suggests buying.

“By default, cells are color-coded red-to-green based on the Implied Volatility Z-Score,” SpotGamma explains. “If the cell is red, Implied Volatility is lower than the average implied volatility over the past two months. If the cell is green, Implied Volatility is higher than the implied volatility over the past two months.”

Graphic: Retrieved from SpotGamma on Monday, March 11, 2024.

The recent compression in short-term volatility aids stabilization, leading to restrained ranges in the indexes relative to components. Among these components, which drove the S&P 500 upwards, some big ones face downward pressure, partly due to the expiration of previously demanded/bought call options. This expiration prompts those initially selling these (e.g., call) options to re-hedge by selling the corresponding stocks.

Graphic: Retrieved from Damped Spring Advisors.

As the indexes remain fixed, the only resolution is a decline in correlation. As larger stocks decline, smaller constituents rise, contributing to the strength observed in the S&P 500 Equal Weight Index.

Graphic: Retrieved from Macro Ops.

Breadth can be evaluated naively by comparing the S&P 500 stocks trading above their 50-day moving average and examining the proportion of index constituents achieving new highs and lows. We see improvement, per the below.

Graphic: Retrieved from Physik Invest via TradingView. Breadth black. Correlation purple.

Based on the above explanation and graphics, after the triple witching expiration of futures, stock, and index options, traders may rebalance their portfolios and sell some of the remaining volatility they’ve bid. 

As explained earlier, this will further compress volatility, reducing the potential downside and providing critical support for stocks. Considering it’s an election year and policymakers prioritize growth over instability, Karsan suggests the market may remain stable with these forces above offering an added boost. Therefore, focus on creatively structuring longer-dated call structures and financing them with other trades to amplify return potential.

If the market consolidates without breaking, we may have the groundwork for a much bigger FOMO-driven call-buying rally culminating in a blow-off. Karsan adds that the signs of this “more combustible situation” would appear when “volatility remains persistent during a rally.” To assess combustibility, observe the options market. 

We remember that calls trade at lower implied volatility than puts, particularly from all the supply. As the market moves higher, it transitions to lower implied volatility, reflected in broad measures like the VIX. If the VIX measures remain steady or higher, “that indicates that fixed-strike volatility is increasing, and if this persists, … it can unsettle volatility and create a situation where dealers themselves … begin to reduce their volatility exposure, leading to a more combustible scenario.”

To elaborate on the reducing exposure note in the previous paragraph, if there is greater demand for calls, counterparties will take on more exposure and hedge through purchases of the underlying asset. The support dealers provide will diminish once this exposure expires. If the assumption is that equity markets are currently expensive, then after another rally, there may be more room for a decline, all else being equal (a simplified perspective), thus increasing risk and combustibility.
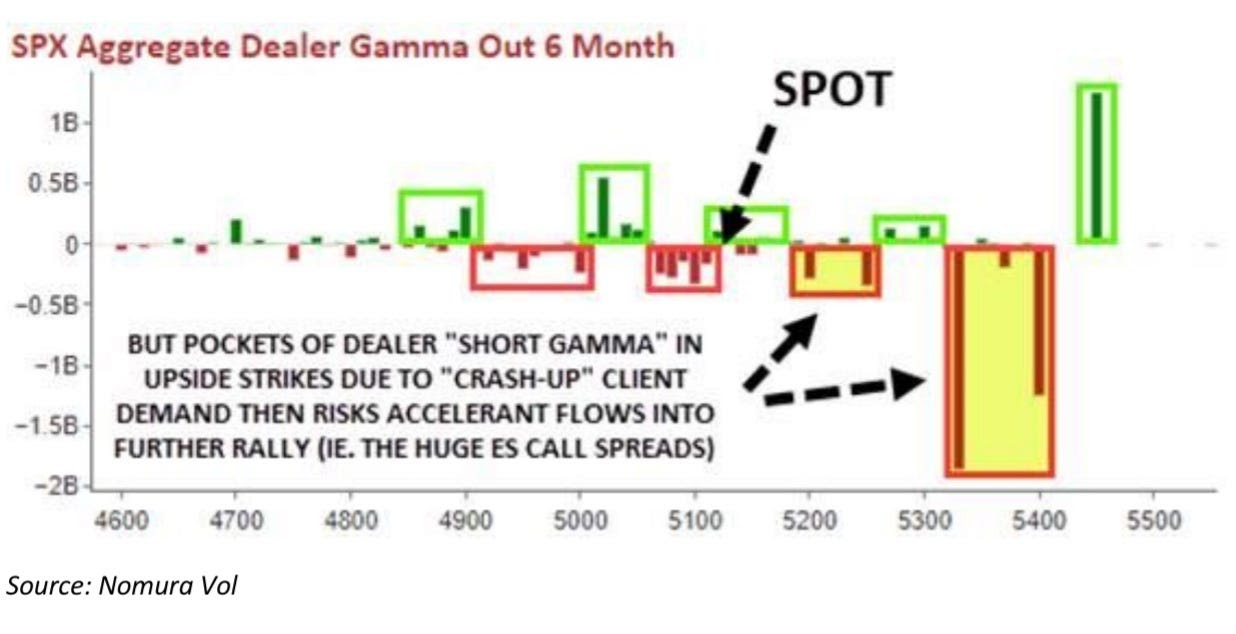
Graphic: Outdated. Retrieved from Nomura. To help explain.

This week, we discussed a lot of information. Some of it may need to be explained better. Therefore, we look forward to your feedback. Separately, I wish my friend Giovanni Berardi congratulations on starting his newsletter. I worked with Berardi, giving him input on some of his positioning-related research. He shares his insights here. Please consider supporting him with a subscription. Cheers, Giovanni!

Categories
Commentary

BOXXing For Beginners

Good Morning! I hope you had a great weekend and enjoy today’s letter. I would be so honored if you could comment and/or share this post. Cheers!
Nvidia Corporation (NASDAQ: NVDA) beat on earnings last week, lifting the entire stock market.

Graphic: Retrieved from Bloomberg via Christian Fromhertz.

The chipmaker confirms it can meet lofty expectations fueled by the artificial intelligence boom, with demand for Nvidia’s newest products likely to outpace supply throughout the year. Despite mounting competition and regulatory challenges in markets like China, Nvidia pursues strategic partnerships to expand its distribution channels.

Graphic: Retrieved from Bloomberg via @Marlin_Capital. NVDA eclipses $2T market capitalization, with its 12-month forward PE now at 33.

Before the earnings announcement, heightened implied volatility derived from options prices on the chipmaker’s stock indicated anticipation of significant fluctuations. The at-the-money straddles, composed of call and put options, suggested movement expectations of as much as +/-10% after earnings.

Various methods exist to estimate the expected move. One approach involves taking the value of the at-the-money straddle for the front month and multiplying it by 85%. Another entails using a narrow range of options.

The volatility skew, which will be defined later, implied that the perceived risk of movement was tilted toward the upside. In any case, staying within the anticipated movement would not favor options buyers, as we show later.

Graphic: Retrieved from Bloomberg.

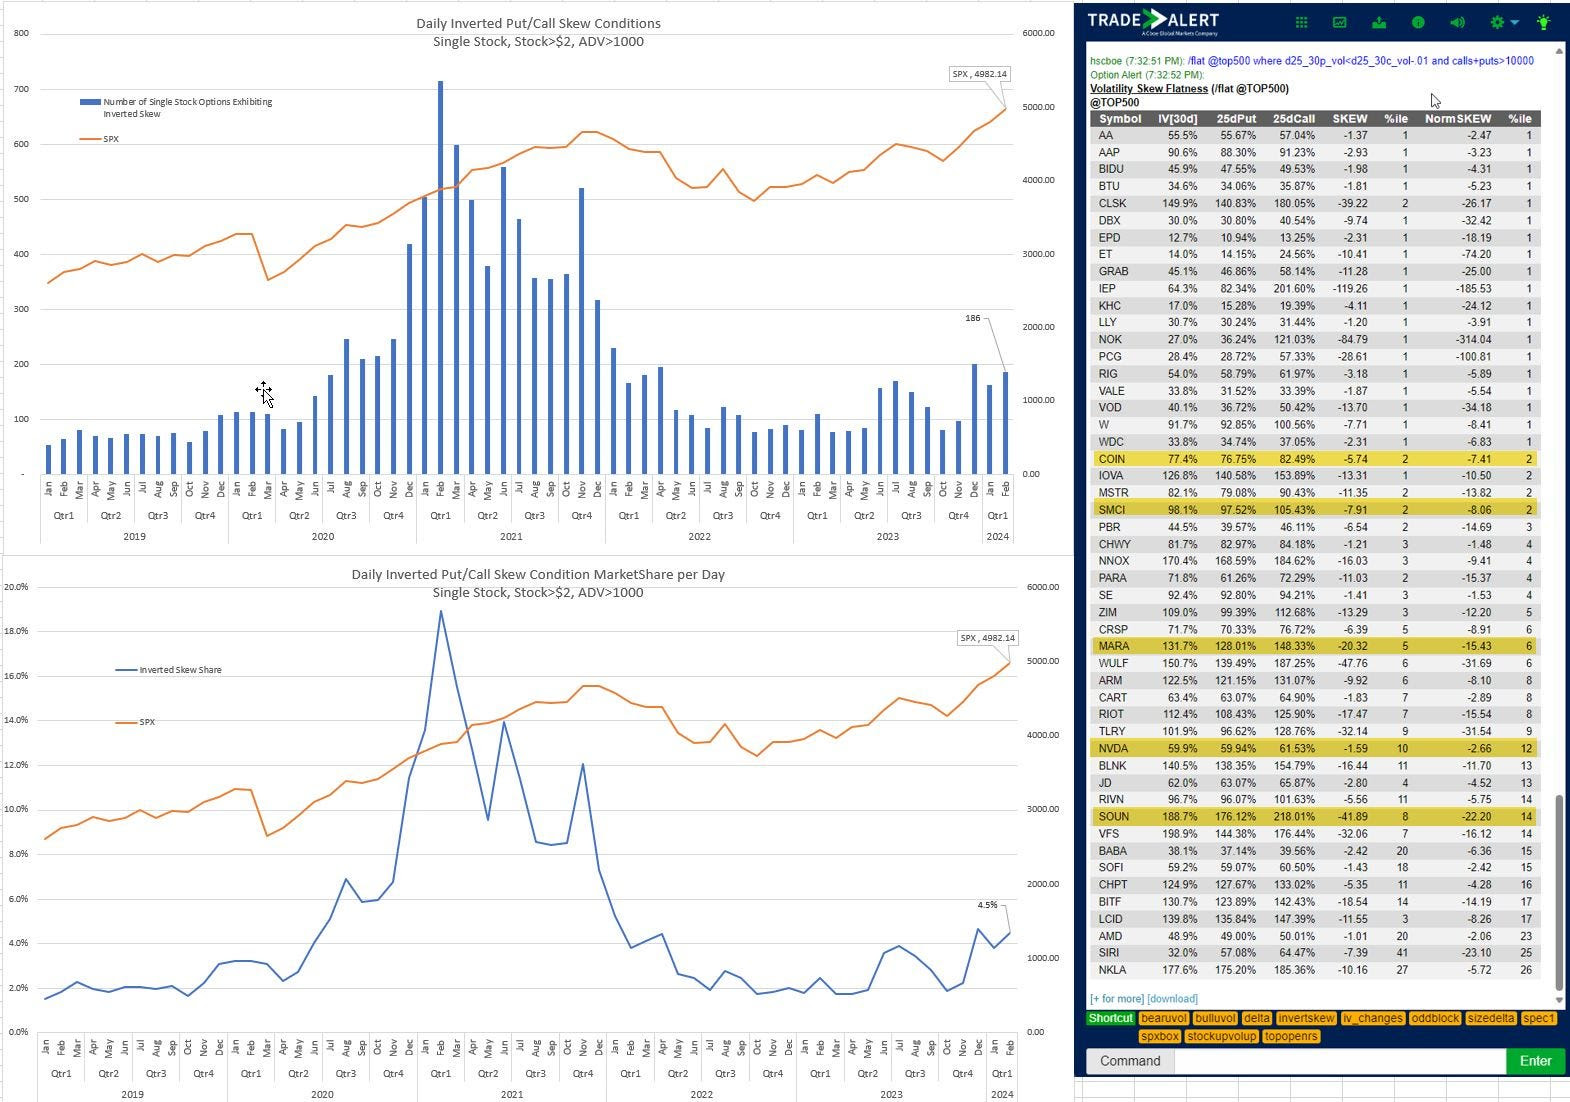
Since late 2023, traders have increasingly been hedging against or speculating on market upswings. This is evident in the higher call option implied volatility. Expectations for significant upward movement are particularly notable in the growing number of stocks where the 25 delta call implied volatility exceeds the 25 delta put implied volatility, shares Henry Schwartz of Cboe Global Markets.

To elaborate, options delta (∆) measures the change in an option’s price relative to changes in the underlying asset’s price. It indicates the option’s sensitivity to the underlying asset’s price movements. A delta of 0.50 means that for every $1 change in the underlying asset’s price, the option’s price would change by $0.50 in the same direction. The skew reflects the difference in implied volatility between out-of-the-money call and put options with the same delta. 

When the 25 delta call implied volatility surpasses that of the 25 delta put implied volatility, a more pronounced positive skew suggests traders are willing to pay a premium for calls. Conversely, if the 25 delta put implied volatility exceeds that of the 25 delta call implied volatility, often observed in products like the S&P 500 (due to concerns about protecting equity downside), there is a negative skew or stronger inclination to pay a higher price for put options.

Graphic: Retrieved from Henry Schwartz.

This persistent fear of missing out on sudden upward movements manifests a cascading effect when markets move higher, says Nomura Americas Cross-Asset Macro Strategist Charlie McElligott.

“The key to equities seemingly being able to keep shaking off nascent pullbacks? Well outside of the ongoing ‘AI  euphoria’ theme and de-grossing of shorts, … it’s been all about the Pavlovian ‘options selling’ flows, which continue to suppress [implied volatility].”

Graphic: Retrieved from Nomura.

As explained by McElligott, these “options selling flows” have the potential to amplify momentum. For instance, when traders or customers purchase call spreads, as they are large, the counterparties or dealers are left with a short skew, negative delta position that loses money if implied volatility rises or markets rise. In response to a rising market, dealers may manage their delta by selling put options or buying call options, stocks, or futures. Adding these positive delta hedges helps propel the market into uncharted territory during swift movements.

Graphic: Retrieved from Nomura.

As validation, after Nvidia Corporation’s stock surged about 10% post-earnings, Bloomberg reported that “to fully re-hedge all open option positions coming into the day, 51 million shares, or 91% of the daily average,” would need to be traded. Bloomberg added that the March 15 $680 call, February 23 $700, and $750 calls experienced the most significant changes in the delta before the market opening.

Graphic: Retrieved from Bloomberg via Global_Macro or @Marcomadness2.

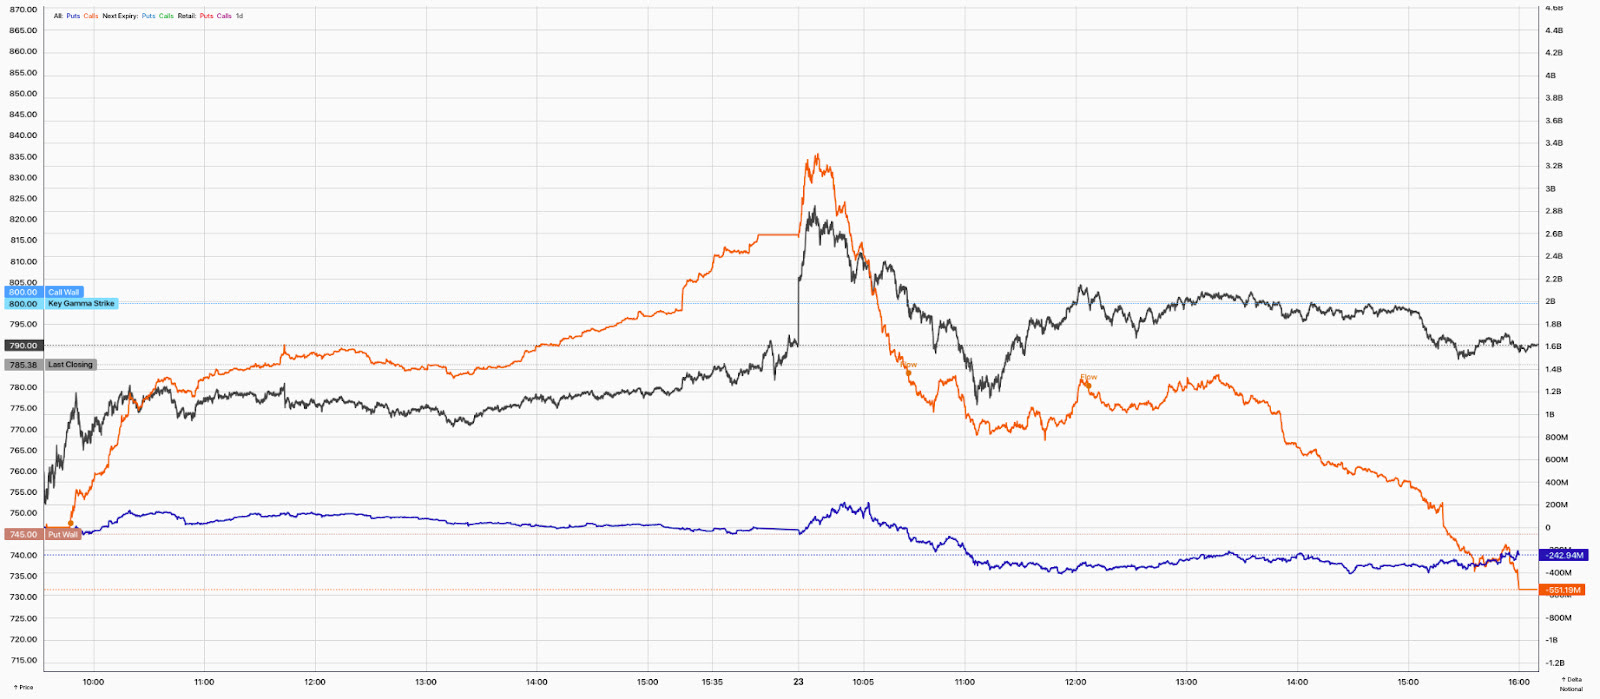
Observing SpotGamma’s real-time options hedging impact measure HIRO, the chipmaker was boosted partly on positive flows from the hedging of call options, as shown by the orange line below, while put options trading had a limited effect, as indicated by the blue line. The re-hedging activity positively affected the stock on Thursday post-earnings and had a pressuring effect on Friday, owing to the short-datedness of some of the options exposure traders initiated.

Graphic: Retrieved from SpotGamma. 

While mentioning pressures, see below the volatility skew before (green) and after (grey) earnings. 

Graphic: Retrieved from SpotGamma.

Short-dated options with very high strikes (e.g., 900+) and close expiration dates (e.g., ten days) struggled to hold their value. SpotGamma shared that the pricing of near-the-money $785 calls expiring on March 15 returned to their previous levels just a week before earnings. Since the actual movement closely matched the expected movement, there was little justification for options well above the market (i.e., +30%) to retain their value.

Graphic: Retrieved from Bloomberg via SpotGamma.

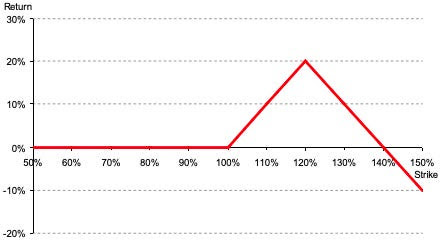
At Physik Invest, we foresaw such a situation and executed 100-point wide 1×2 call ratio spreads between the 900s and 1000s for a credit of approximately 0.90. We closed these positions the next day for an additional credit of 0.50 when the 1000 strike options failed to keep their value as good as the closer 900 strike options. The resulting profit was a 1.40 credit per spread.

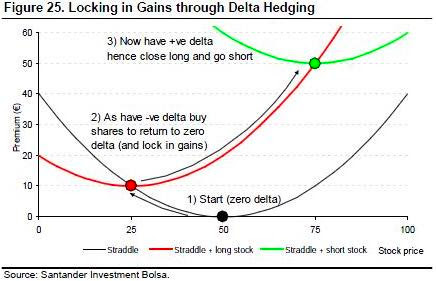
Graphic: Via Banco Santander SA (NYSE: SAN) research. The return profile, at expiry, of a 1×2 (buy 1 and sell 2 further away) ratio spread.

Please be aware that similar trades are present in other high-flying products, albeit less widespread than in 2021 during the meme-stock trend. A simple way to determine whether such trades are safe is to check the pricing of fully in-the-money spreads. If the spreads trade at substantial credits to close, they are worth considering. However, if the spreads require a debit to close, it’s best to avoid them. In the case of Nvidia, the 100-point spread was priced at 25.00 in credit to close the day of earnings.

Graphic: Retrieved from TD Ameritrade’s thinkorswim platform.

Generally speaking, this trend in implied volatility is something that may continue. Kris Sidial from The Ambrus Group says the trend, which masks the risks of short volatility under the hood, such as those tied to risk-management practices, is driven by several factors not limited to the following:

(1) Increased demand for call options.

(2) Larger institutions seeking volatility as a hedge against rising risk exposure as the S&P 500 climbs. 

(3) Significant market movements make it difficult for implied volatility to decrease significantly.

Must Read: Two Major Risks Investors Should Watch Out For

Graphic: Retrieved from The Ambrus Group.

As such, Sidial suggests that “there is significant value in embracing volatility in both directions,” hedging against geopolitical and economic uncertainties while also capitalizing on the market upside. As discussed last week, we focus on leveraging elevated skew to reduce the cost of bullish trades (e.g., metals). Additionally, we plan to replenish our long put skew by acquiring put spreads in equities as a precaution against potential risks ahead, mainly local market peaks this time of year.

Graphic: Retrieved from Bloomberg via Tavi Costa.

With recent data dissuading anticipated cuts, there’s room to safeguard cash at higher rates for longer. 

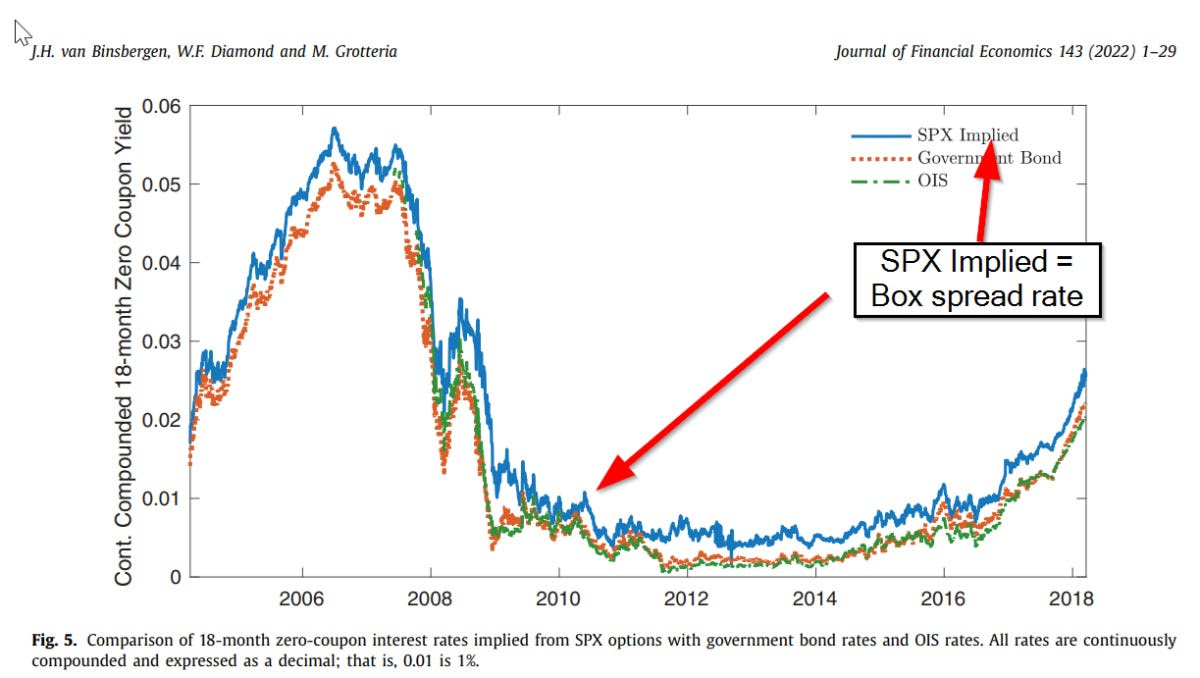
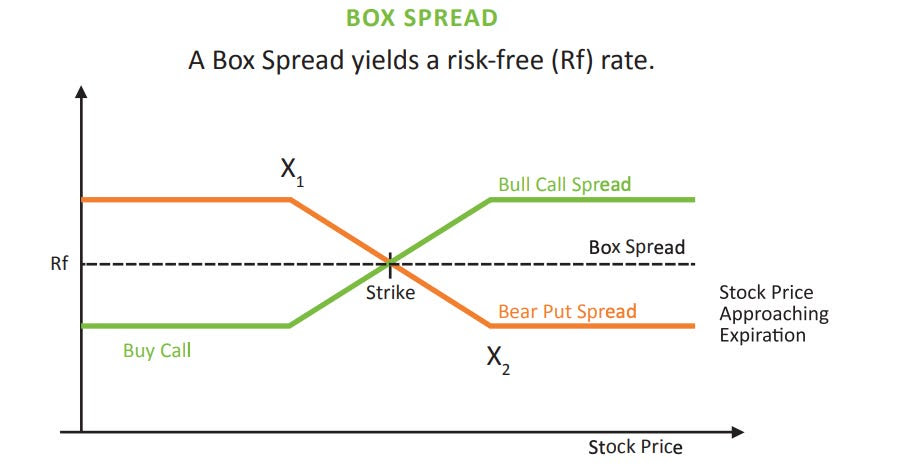
One trade structure to help us do so is the box spread, which includes benefits such as a convenience yield, capital efficiencies achieved through portfolio margining, easy entry/exit on an exchange through most retail brokers, and potential 60% long-term and 40% short-term tax treatment.

Graphic: Retrieved via Alpha Architect. 

Like a Treasury bill, the loan structure combines a bull call spread and a bear put spread. In a bull call spread, an investor purchases a call option and sells another at a higher strike price. A bear put spread involves buying a put option and selling another at a lower strike price. The lower (X1) and higher strikes (X2) match for a box spread, with all legs sharing the same expiration date.

Graphic: Retrieved from OCC.

In calculating the loan rate, we take, for example, a recent box spread trade of Physik Invest’s: BOT +1 IRON CONDOR SPX 100 (Quarterlys) 31 DEC 24 3000/6000/6000/3000 CALL/PUT @2867.90 CBOE.

[(WIDTH−PRICE)/Price](365/DTE) = Implied Interest Rate

Where:

WIDTH: Distance between higher and lower strikes

PRICE: The price of the box spread

DTE: Days until the trade matures

[(3000-2867.90)/2867.90](365/319) = 0.0527036866 = 5.27%

We lend $286,790.00, at a risk-free rate of 5.27%, in exchange for $13,210.00 of interest at maturity. You can track box spread yields more quickly using tools like boxtrades.com. Such insights open up several strategic avenues for traders.

One approach is investing about 95% of your cash into box spreads to return the principal at maturity, risking the 5% interest you make on trades with a limited downside (e.g., SPX bull call spread). 

A more preferable option exists for portfolio margin traders. Portfolio margining is a risk-based approach to determining margin requirements in a customer’s account, aligning collateral with the overall portfolio risk. Portfolio margining considers offsets between correlated products, calculating margin requirements based on projected losses. This approach may lower margin requirements, allowing for more efficient capital utilization.

As portfolio margin traders, we retain our buying power due to the minimal directional risk associated with box spreads, allocating it to other margin-intensive trades. To illustrate, if such a trader initially invests $100,000 in box spreads, they are left with $0 in cash and $100,000 in buying power available for margin-intensive trades (e.g., synthetic long stock or the purchase of an at-the-money call and simultaneous sale of an at-the-money put). You get your inflation protection while participating 100% in up-and-down market movements. Why not, right?

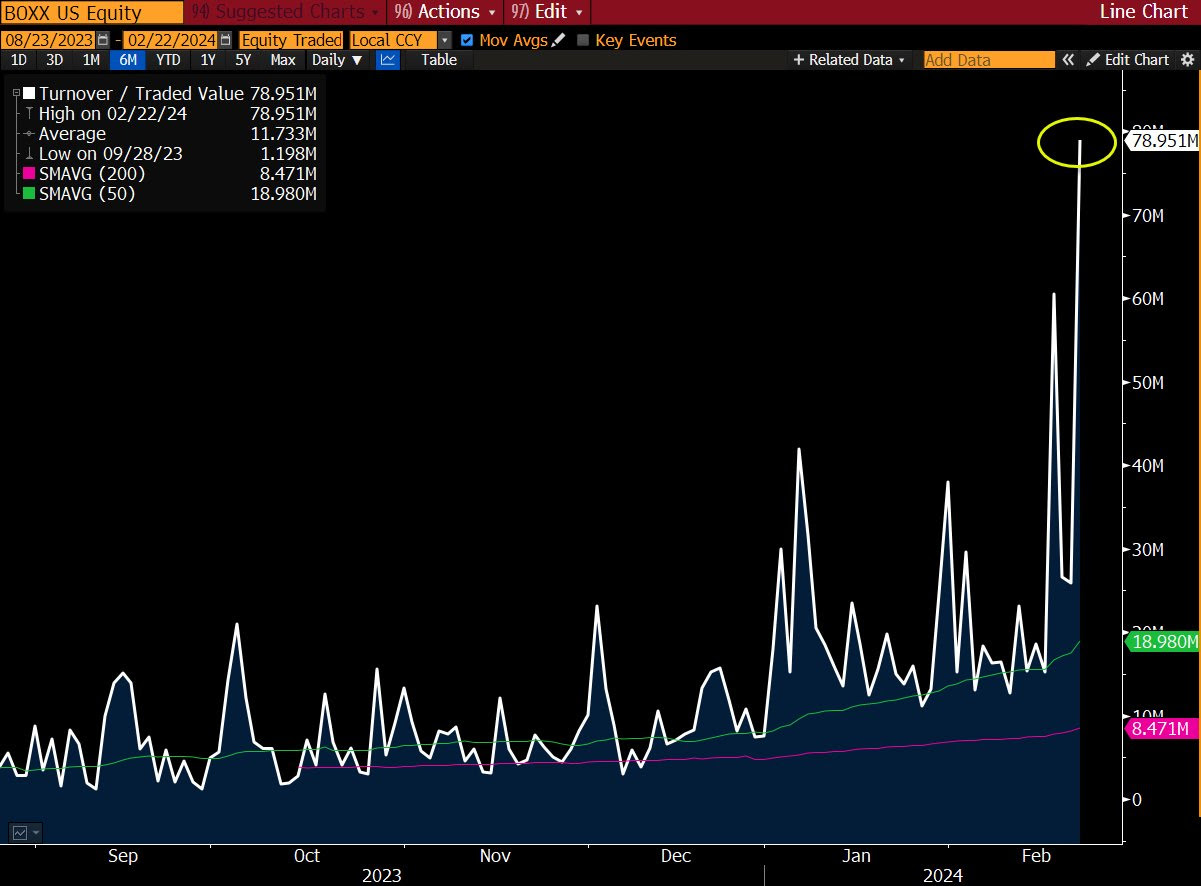
The point of the above passage is that much of what you see online can be done yourself in a tax, margin, and cost-efficient way. Alternatively, you can be hands-off, investing in money markets and CDs or complicated yet cool products like the popularized Alpha Architect 1-3 Month Box ETF (BATS: BOXX), which has grabbed attention for its tax arbitrage through complex strategies and loopholes.

Graphic: Retrieved from Bloomberg via Eric Balchunas.

With BOXX, you’re investing in something as safe as short-term Treasury bills, but you can get your money back anytime and enjoy better tax treatment than Treasury bills. Bloomberg’s Matt Levine has an excellent write-up on the mechanics of BOXX, which you can read here.

We digress. You can do more with your unused cash and buying power when following the methods outlined earlier and as we put well in our “Investing In A High Rate World” report published in April 2023. There, we discussed return stacking utilizing Nasdaq call ratio spreads and S&P 500 box spreads, two trades that continue to kill it this year.

Graphic: Retrieved from Bespoke Investment Group.

We choose these structures, which have limited losses in case of market downside, for the following reasons: There is considerable support for the market, but this support appears fragile. For one, we refer to record-level dispersion trading, which involves the sale of index options and buying options in individual stocks. 

It’s the same short volatility exposure Sidial has warned us about. With some stocks realizing substantial differences in movement from the index, this booming trade may have gone too far, setting the stage for a potential market reversal.

The situation resembles the period leading up to Volmageddon when short-volatility strategies backfired. Implied correlations are low, and if a market shock occurs, investors may be forced to close out their trades, which could feed volatility. As was in the case leading up to Volmageddon, however, volatility can cluster and mean-revert for longer.

Graphic: Retrieved from Bloomberg via Tallbacken Capital Advisors.

.

Categories
Commentary

Bubblicious

Good Morning! I hope you had a great weekend and enjoy today’s letter. I would be so honored if you could comment and/or share this post. Cheers!

Optimism from earnings growth among large stocks overshadows concerns about instability abroadquarterly debt sales, and the diminishing likelihood of an immediate interest rate cut.

“The U.S. is doing pretty well,” Yardeni Research founder Ed Yardeni remarks, noting a shift from speculation about interest rates allows the market to focus on fundamentals. “Right now, the fundamentals are good for the economy. And, there’s plenty of hype around about.”

Multiple rate cuts totaling nearly 125 basis points in the next year remain expected. This seems extreme unless there’s a market crash, says Harley Bassman, inventor of the MOVE Index measuring bond market volatility. Bassman believes current pricing reflects a bimodal scenario, with an 85% chance rates remain stable and a 15% chance they drop to 1%. Combining these probabilities, the market arrives at the anticipated cuts by year-end.

Naturally, markets are cyclical, moving from one extreme to another. Despite the fundamentals being in order, a lack of broad participation is evident in the more significant number of declining stocks than advancing ones. This situation, resembling patterns seen during the late ‘90s infotech-and-telecom boom, is frequently an indicator of less resilient future returns.

Graphic: Retrieved from Bank of America Global Research.

Ryan Detrick of Carson Group notes that February typically experiences less momentum than January, often due to reinvestment and bonus inflows. Data shows that when the S&P 500 recorded a 20% gain for the year, February tended to underperform, especially in the latter half of the month, which typically marked the weakest two-week period of the year.

Graphic: Retrieved from SentimenTrader via Jason Goepfert.

While the same volatility-suppressing trades detailed in last week’s letter continue to support markets where they are ceteris paribus (where customers sell volatility, and dealers hedge by buying stock/futures during declines and selling during strength), there has been “SPX/SPY downside buying (put flys) and ongoing VIX call buying,” Nomura Americas Cross-Asset Macro Strategist Charlie McElligott writes. This steepens implied volatility skew, benefitting the underappreciated hedge opportunities shared in Physik Invest’s Market Intelligence letters.

Graphic: Retrieved from SpotGamma on February 5, 2024.

The recent repricing has allowed unbalanced, out-of-the-money options spreads to retain their value better amid ongoing market gains. The focus has shifted from worries about missed opportunities to safeguarding against potential downturns. This shift may be attributed to concerns beyond poor market breadth and the possibility of localized issues in places like China impacting global markets. These include geopolitical tensionsturbulence in specific capital market segments, lingering effects of extensive government spending, and looming debt crises.

Graphic: Retrieved from SpotGamma on February 1, 2024.

With the popularity of yield-enhancing trades like selling options, there’s concern that if significant market movements materialize, a greater share of end users will shift to buying options, indirectly exacerbating market volatility and downside.

Graphic: Retrieved from QVR Advisors.

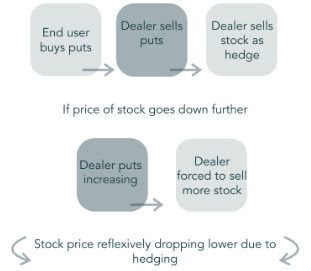
To explain this phenomenon, we start with the options delta, which measures how much an option’s price will change for every $1 change in the underlying asset’s price. When end users sell put options, market makers buy them, assuming a negative delta stance, thus prompting them to acquire the underlying asset to hedge (which has a positive delta). Conversely, when end users buy put options, dealers sell them, taking on a positive delta. Consequently, they need to sell the underlying asset (which has a negative delta) to hedge. In sharp and volatile market declines, options sellers may opt to cover their positions by purchasing options, thereby diminishing stability as counterparties hedge in line with the market movement.

Graphic: Retrieved from Nomura.

Kris Sidial from The Ambrus Group emphasizes second-order effects are further amplified due to the large scale of options selling, adding concentration among market makers as another risk to watch. Scott Rubner, a tactical specialist at Goldman Sachs Group, concurs current market problems, and the unwind of stretched positioning may lead to a weak February.

Categories
Commentary

Turning Nickels Into Dollars: A Winning Strategy For Market Crashes

Good Morning! I hope you had a great weekend and enjoy today’s letter. I would be so honored if you could comment and/or share this post. Cheers!

Risk appetite in the last months was fueled by the emergence of a “goldilocks disinflation thesis,” describes Marko Kolanovic of JPMorgan Chase & Co. This thesis envisions a no-recession scenario where central banks cut rates early, especially in the lead-up to elections.

The market is banking on such anticipatory movement by the Federal Reserve, pricing five rate cuts and the target interest rate moving from 525-550 to 400-425 basis points by year-end. With the backdrop of easing liquidity conditions through 2025 and continuing economic growth, equity investors are positioning for a broader rally. This has led to churn and a loss of momentum.

Graphic: Retrieved from Carson Investment Research via Ryan Detrick.

Though historical trends encourage optimism, Kolanovic is concerned markets are overlooking geopolitical events, such as the Houthi shipping attacksexercises near the Suwałki Gap, and Russia’s testing of electronic warfare. Despite these potential disruptors, atypically low volatility skew and implied correlation indicate a lack of market responsiveness and positioning for less movement.

Recall skew reflects a scenario where increased market volatility disproportionately impacts farther away strike options due to losses from more frequent delta rebalancing in a moving market, leading option sellers to assign higher implied volatility to those strikes to compensate for increased risk. The relationship between index volatility and its components involves both individual volatilities and correlation, with implied correlation as a valuable indicator for pricing dynamics between index options and their components and trading volatility dispersion.

Appearing on The Market Huddle, Kai Volatility’s Cem Karsan emphasized the impact of more structured product issuance and investor volatility selling on index levels, describing how it pins the index and lowers correlation. When a dealer, bank, or market maker on the other side owns options, they need to buy the market when it goes down and sell when it goes up, keeping the index tight and realized volatility low. Much less of this, or even the opposite, is happening in single stocks, so they aren’t experiencing the same level of suppression.

Graphic: Retrieved from The Ambrus Group’s Kris Sidial. Higher short Vega exposure, growing derivative income fund and equity short vol hedge fund AUM, a larger auto-callable market, and record-high dispersion trading flow suppress index vol, posing significant risks.

“As dealers buy and sell index exposure, market makers will attempt to keep the index level and the underlying basket in line via arbitrage constraints,” Newfound Research well explained in their Liquidity Cascades paper. “If dealer hedging has suppressed index-level volatility, but underlying components are still exhibiting idiosyncratic volatility, then the only reconciliation is a decline in correlation.”

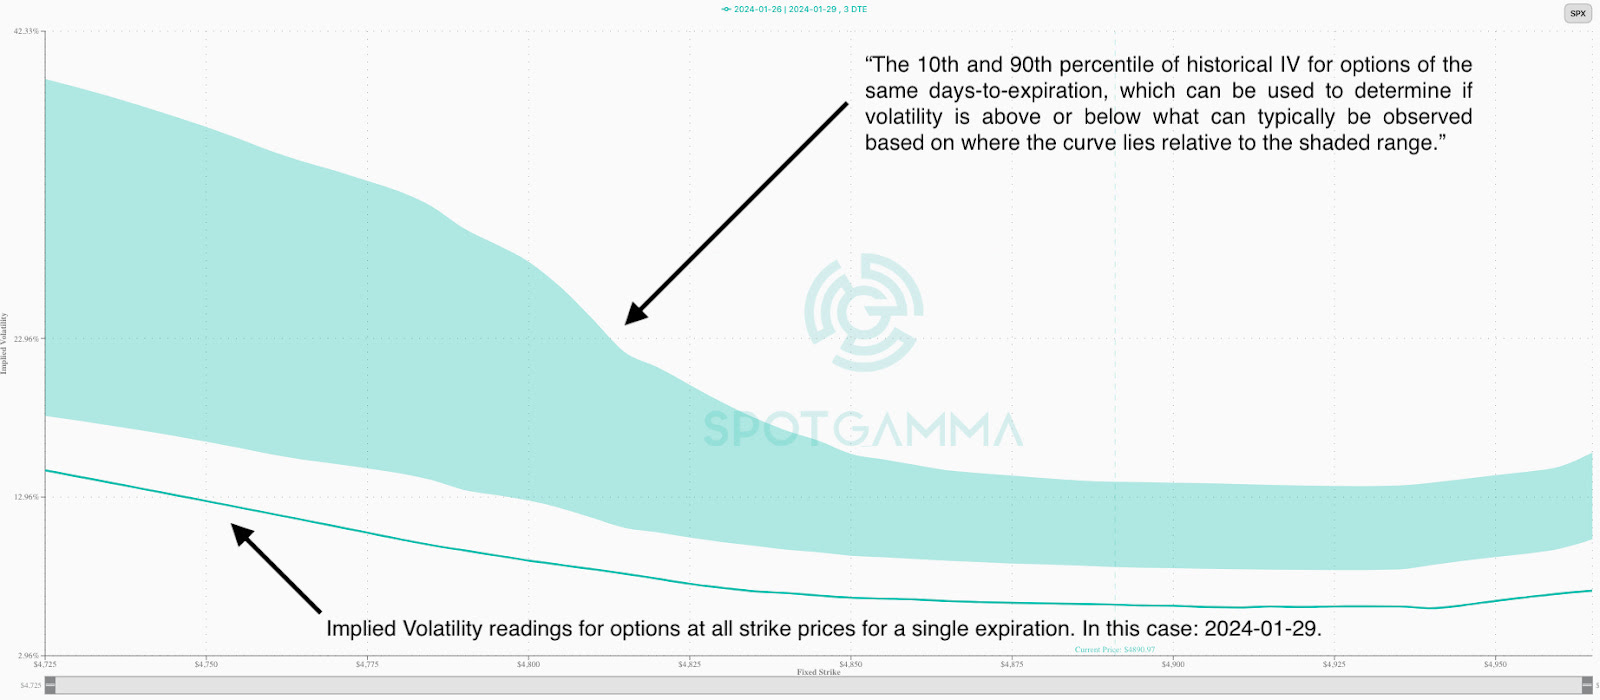
SpotGamma’s Brent Kochuba weighs in, noting low correlation typically aligns with interim stock market highs, presenting a potential cause for caution. Examining data since January 2018, Kochuba points out that the SPX’s average close-to-close change is 88 basis points, with the open-to-close average at 70 basis points. This analysis suggests the current SPX implied volatility (IV) is relatively low. While low IV levels can persist, the concern arises as current readings hint at overbought conditions.

“These low IVs can last for some time, but the general point here is that current readings are starting to suggest overbought conditions as index vols are priced for risk-less perfection, and single stock vols expand due to upside call chasing.”

Graphic: Retrieved from SpotGamma. Short-dated S&P 500 implied volatility is compressed. Updated Sunday, January 28, 2024.

Nomura Cross-Asset Macro Strategist Charlie McElligott explains selling volatility, which continues to attract money as it’s been profitable, is a stabilizing trade in most cases. Kris Sidial, Co-Chief Investment Officer at The Ambrus Group, warns it may end spectacularly in his most recent appearances. The situation in China is a cautionary example, where stock volatility triggered a destructive selling cycle as market participants grappled with structured product risk management.

Graphic: Retrieved from Reuters.

Accordingly, for those who perceive a meaningful chance of movement, there is value in owning options, Goldman Sachs Group says, noting they expect more movement than is priced.

Graphic: Retrieved from Goldman Sachs Group via VolSignals.

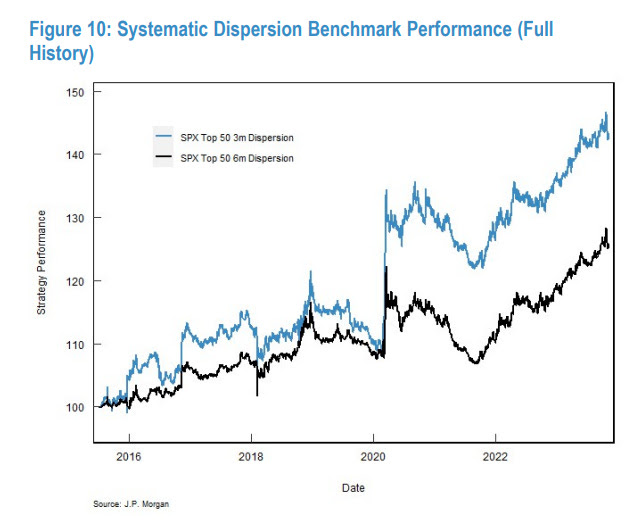
Karsan, drawing parallels to the unwind of short volatility and dispersion trade from February to March of 2020, says the still-crowded trade can be compared to two sumo wrestlers or colossal plates on the Earth’s core exerting immense pressure against each other. While the trade may appear balanced and continue far longer, the accumulated pressures pose significant risks.

Graphic: Retrieved from JPMorgan Chase & Co via @jaredhstocks.

Major crashes happen when entities must trade volatility and options. Often, the trigger is the inability to cover the margin and meet regulatory requirements, causing a cascading effect.

Karsan, drawing on 25 years of experience, notes a precursor to a crash is a weakening supply of margin puts, particularly the highly convex and far out-of-the-money ones. These options play a significant role during stressful market periods, acting as indicators and drivers of impending crashes. The focus is on their convexity rather than whether they will be in the money, as the margin requirements become a determining factor in their impact on market dynamics. History shows a minor catalyst can lead to a dramatic unwind, turning one week to expiry $0.05 to $0.15 S&P 500 put options into $10.00 overnight.

“Prior to the XIV crash day, … going into the close the last hour, we saw nickel, ten, and five-cent options trade up to about $0.50 and $0.70. They really started to pop in the last hour. And then, the next day, we opened up and they were worth $10.00. You don’t see them go from a nickel to $0.50 very often. If you do, don’t sell them. Buy them, which is the next trade.”

Graphic: Retrieved from Bloomberg.

Setting aside the pessimistic narrative, the current scenario favors continued ownership of risk assets. Cautious optimism surrounds this week’s Quarterly Refunding Announcement (QRA), “depending on how much bill issuance is scaled back and on the absolute funding needs,” CrossBorder Capital explained, coupled with Fed-speak and anticipation of cutting interest rates on falling inflation later this year. Still, according to Unlimited Funds ‘ Bob Elliott, predicting outcomes following this week’s releases lacks an advantage; instead, in this environment of churn, momentum loss, and indicators like low correlation and volatility, last week’s trades for managing potential downside stick out, particularly vis-à-vis volatility skew.

Graphic: Retrieved from SpotGamma. Updated Sunday, January 28, 2024.
Categories
Commentary

Daily Brief For March 3, 2023

Physik Invest’s Daily Brief is read free by thousands of subscribers. Join this community to learn about the fundamental and technical drivers of markets.

Graphic updated 7:00 AM ET. Sentiment Risk-On if expected /MES open is above the prior day’s range. /MES levels are derived from the profile graphic at the bottom of this letter. Click here for the latest levels. SqueezeMetrics Dark Pool Index (DIX) and Gamma (GEX) with the latter calculated based on where the prior day’s reading falls with respect to the MAX and MIN of all occurrences available. A higher DIX is bullish. The lower the GEX, the more (expected) volatility. Click to learn the implications of volatility, direction, and moneyness. Breadth reflects a reading of the prior day’s NYSE Advance/Decline indicator. The CBOE VIX Volatility Index (INDEX: VVIX) reflects the attractiveness of owning volatility. UMBS prices via MNDClick here for the economic calendar.

Administrative

Lots of content today but a bit rushed at the desk. If anything is unclear, we will clarify it in the coming sessions. Have a great weekend! – Renato

Fundamental

Physik Invest’s Daily Brief for March 2 talked about balancing the implications of still-hot inflation and an economy on solid footing. Basically, the probability the economy is in a recession is lower than it was at the end of ‘22. For the probabilities to change markedly, there would have to be a big increase in unemployment, for one.

According to a blog by Unlimited’s Bruce McNevin, if the unemployment rate rises by about 1%, recession odds go up by 29%. If the non-farm payroll employment falls by about 2% or 3 million jobs, recession odds increase by about 74%. After a year or so of tightening, unemployment measures are finally beginning to pick up.

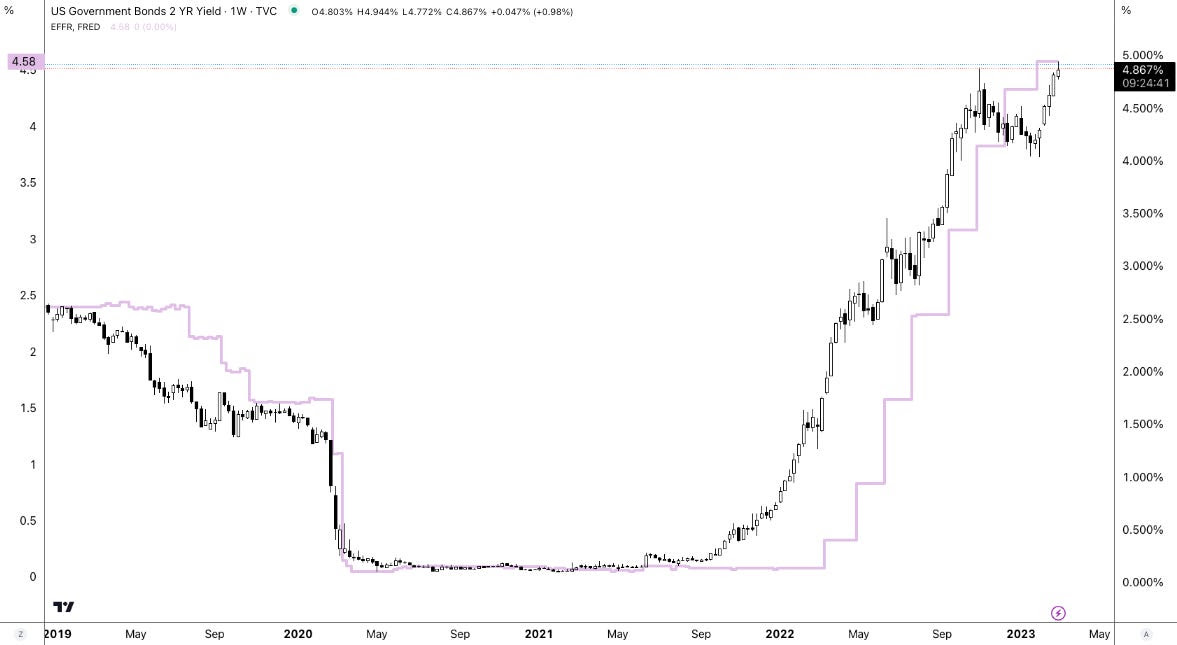
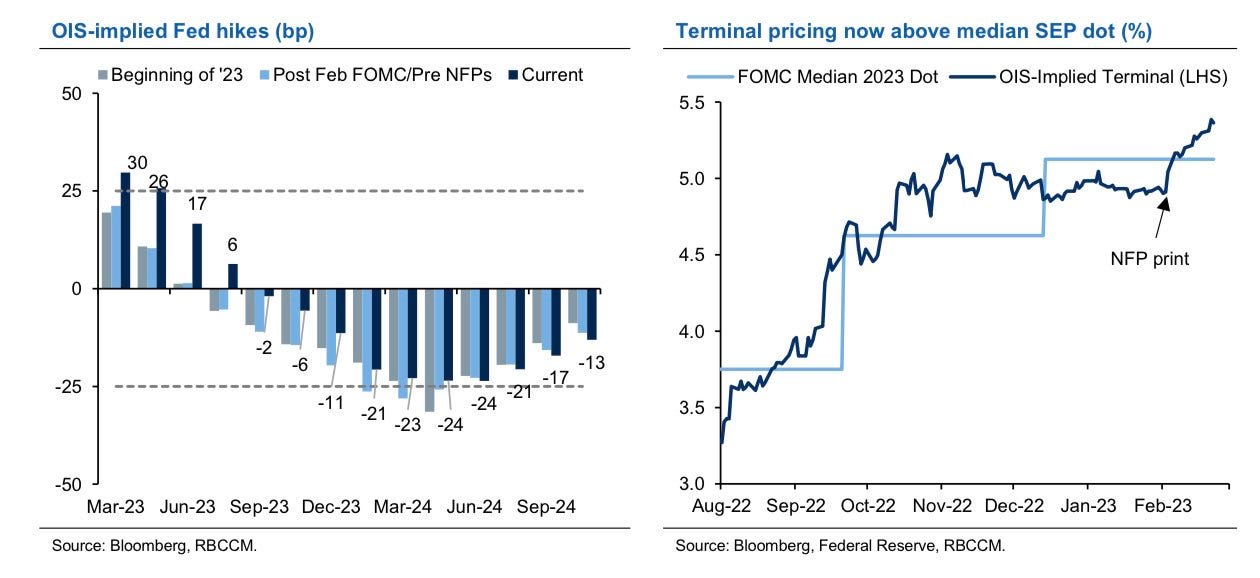
Policymakers, per recent remarks, maintain that more needs to be done, however. For instance, the Federal Reserve’s (Fed) Raphael Bostic, who generally carries an easier stance on monetary policy, mulled whether the Fed should raise interest rates beyond the 5.00-5.25% terminal rate consensus he previously endorsed. This commentary, coupled with newly released economic data, has sent yields surging at the front end. 

Graphic: Retrieved from TradingView.

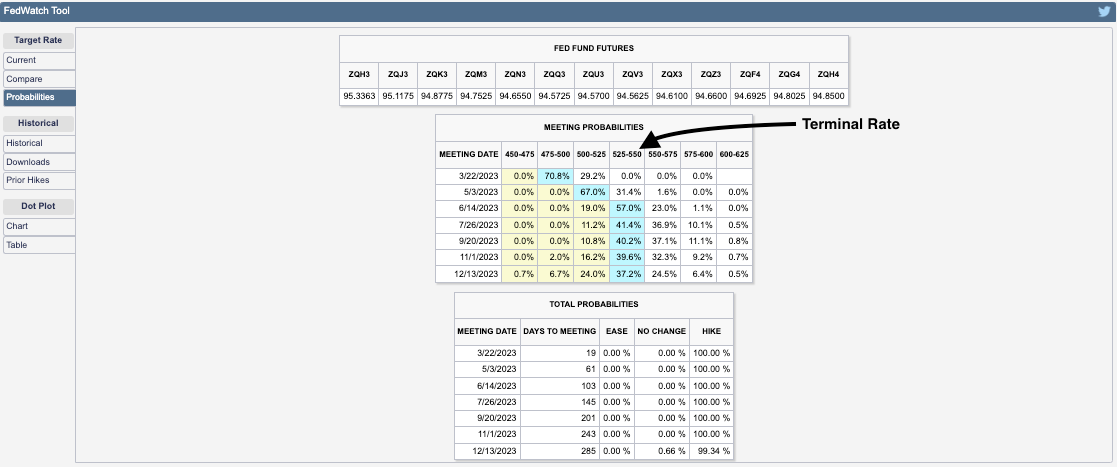
Traders are wildly repricing their terminal rate expectations this week. The terminal rate over the past few days has gone up from 5.25-5.50% to 5.50-5.75%, and back down to 5.25-5.50%.

Graphic: Retrieved from CME Group Inc (NASDAQ: CME).

Positioning

Stocks and bonds performed poorly. Commodity hedges are uninspiring also in that they do not hedge against (rising odds of) recession, per the Daily Brief for March 1

In navigating this precarious environment, this letter has put forward a few trade ideas including the sale of call options structures to finance put options structures, after the mid-February monthly options expiration (OpEx). Though measures suggest “we can [still] get cheap exposure to convexity while a lot of people are worried,” the location for similar (short call, long put) trades is not optimal. Rather, trades including building your own structured note, now catching the attention of some traders online, appear attractive now with T-bill rates surging.

Graphic: Retrieved from Bloomberg.

Such trades reduce portfolio volatility and downside while providing upside exposure comparable to poorly performing traditional portfolio constructions like 60/40.

As an example, per IPS Strategic Capital’s Pat Hennessy, with $1,000,000 to invest and rates at ~5% (i.e., $50,000 is 5% of $1,000,000), one could buy 1000 USTs or S&P 500 (INDEX: SPX) Box Spreads which will have a value of $1 million at maturity for the price of $950,000.

With $50,000 left in cash, one can use options for leveraged exposure to an asset of their choosing, Hennessy explained. Should these options expire worthless, the $50,000 gain from USTs, at maturity, provides “a full return of principal.”

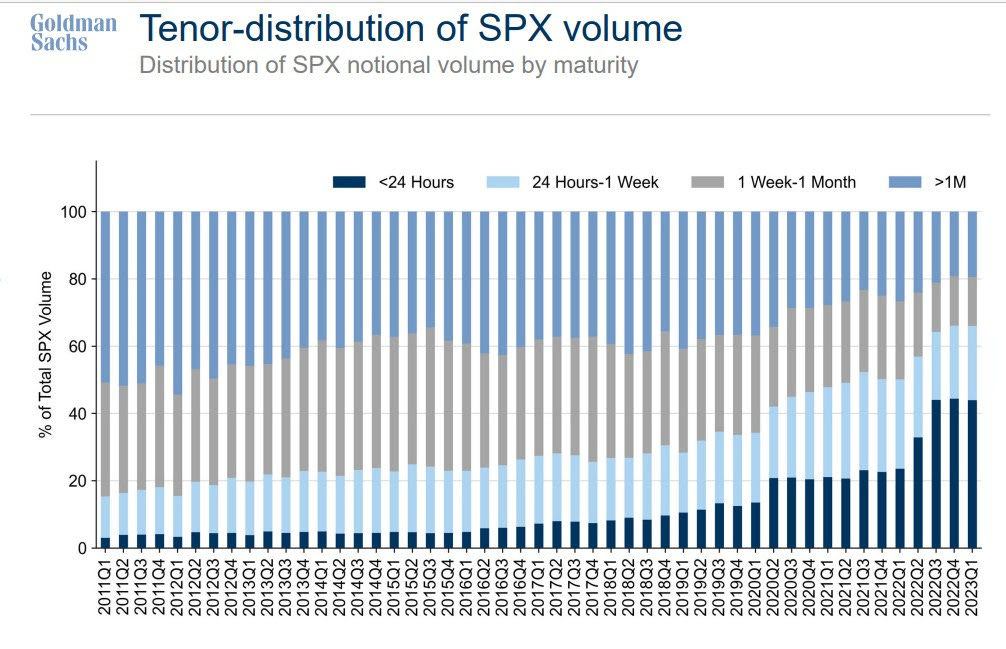
For traders who are focused on short(er)-term movements, one could allocate the cash remaining toward structures that buy and sell call options over very short time horizons (e.g., 0 DTE).

Knowing that the absence of range expansion to the downside, positioning flows may build a platform for the market to rally, one could lean into structures like fixed-width call option butterflies.

For instance, yesterday, Nasdaq 100 (INDEX: NDX) call option butterflies expanded in value ~10 times (i.e., $5 → $50). An example 0 DTE trade is the BUTTERFLY NDX 100 (Weeklys) 2 MAR 23 12000/12100/12200 CALL. Such trade could have been bought near ~$5.00 in debit and, later, sold for much bigger credits (e.g., ~$40.00).

Such trade fits and plays on the narrative described in Physik Invest’s Daily Brief for February 24. That particular letter detailed Bank of America Corporation’s (NYSE: BAC) finding that “volume is uniquely skewed towards the ask early in the day but towards the bid later in the day” for these highly traded ultra-short-dated options.

Graphic: Retrieved from Goldman Sachs Group Inc (NYSE: GS) via Bloomberg. 

Even options insight and data provider SqueezeMetrics agrees: “Buy 0 DTE call.” The typical “day doesn’t end above straddle b/e, but call makes money,” SqueezeMetrics explained. “Dealer and call-buyer both profit. Gap down, repeat.”

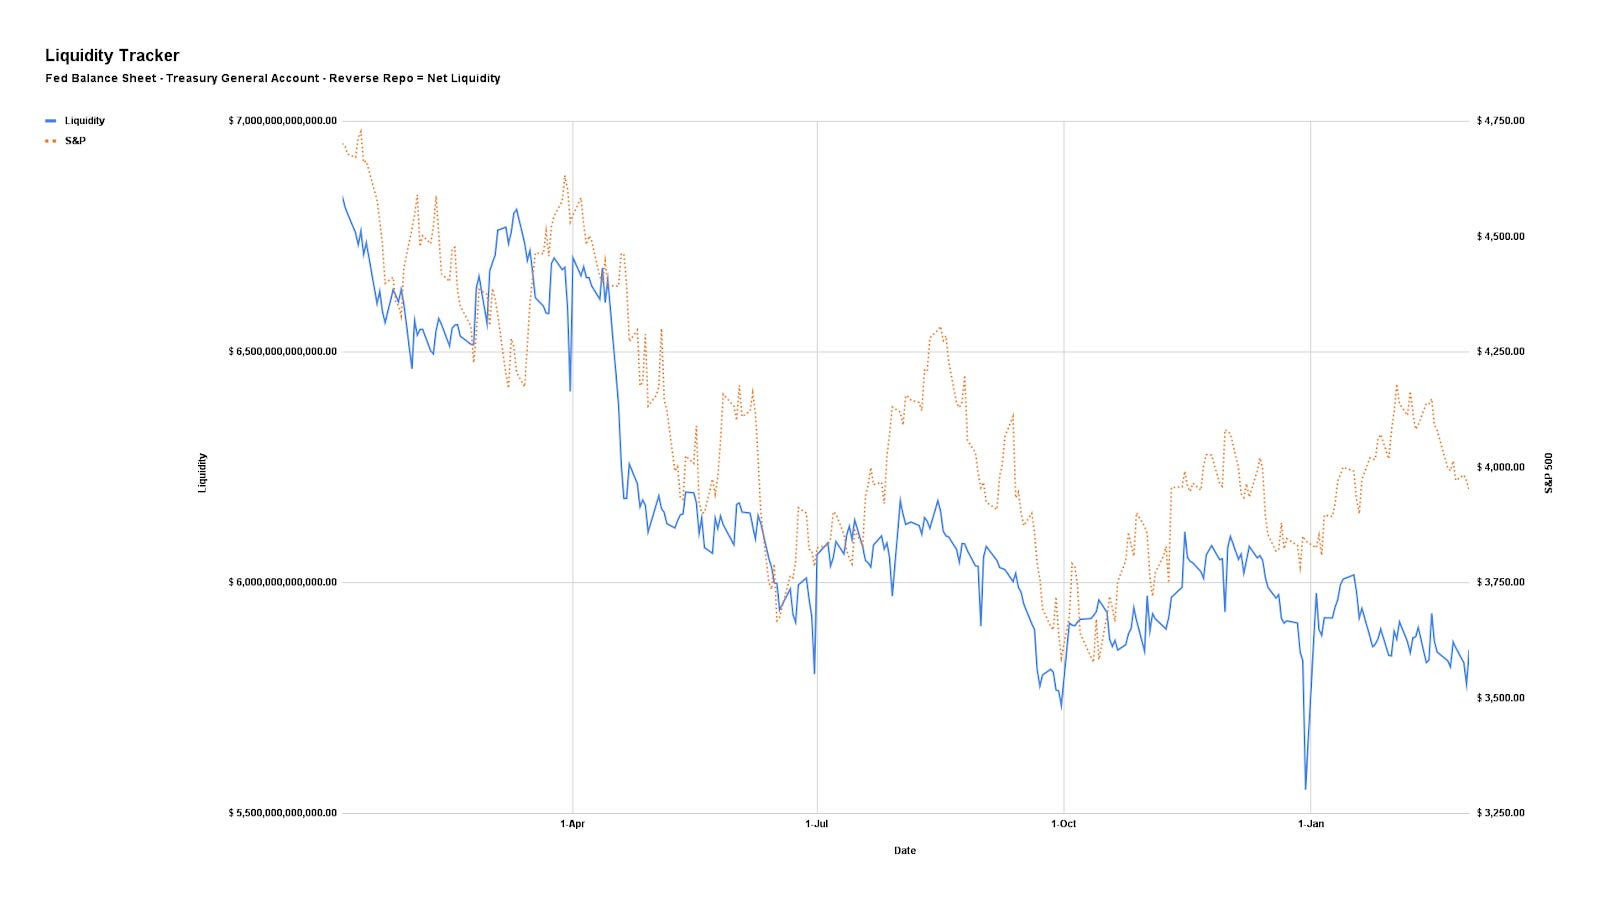
Anyways, back to the bigger trends impacted by liquidity coming off the table and increased competition between equities and fixed income.

Graphic: Via Physik Invest. Net Liquidity = Fed Balance Sheet – Treasury General Account – Reverse Repo.

As this letter put forth in the past, if the “market consolidates and doesn’t break,” as we see, the delta buy-back with respect to dropping implied volatility (IVOL) or vanna and buy-back with respect to the passage of time or charm could build a platform for a FOMO-driven call buying rally that ends in a blow-off. 

Graphic: Retrieved from Piper Sandler’s (NYSE: PIPR) Danny Kirsch. Short volatility and short stocks was attractive to trade. As your letter writer put in a recent SpotGamma note: “With IV at already low levels, the bullish impact of it falling further is weak, hence the SPX trending lower all the while IV measures (e.g., VIX term structure) have shifted markedly lower since last week. If IV was at a higher starting point, its falling would work to keep the market in a far more positive/bullish stance.”

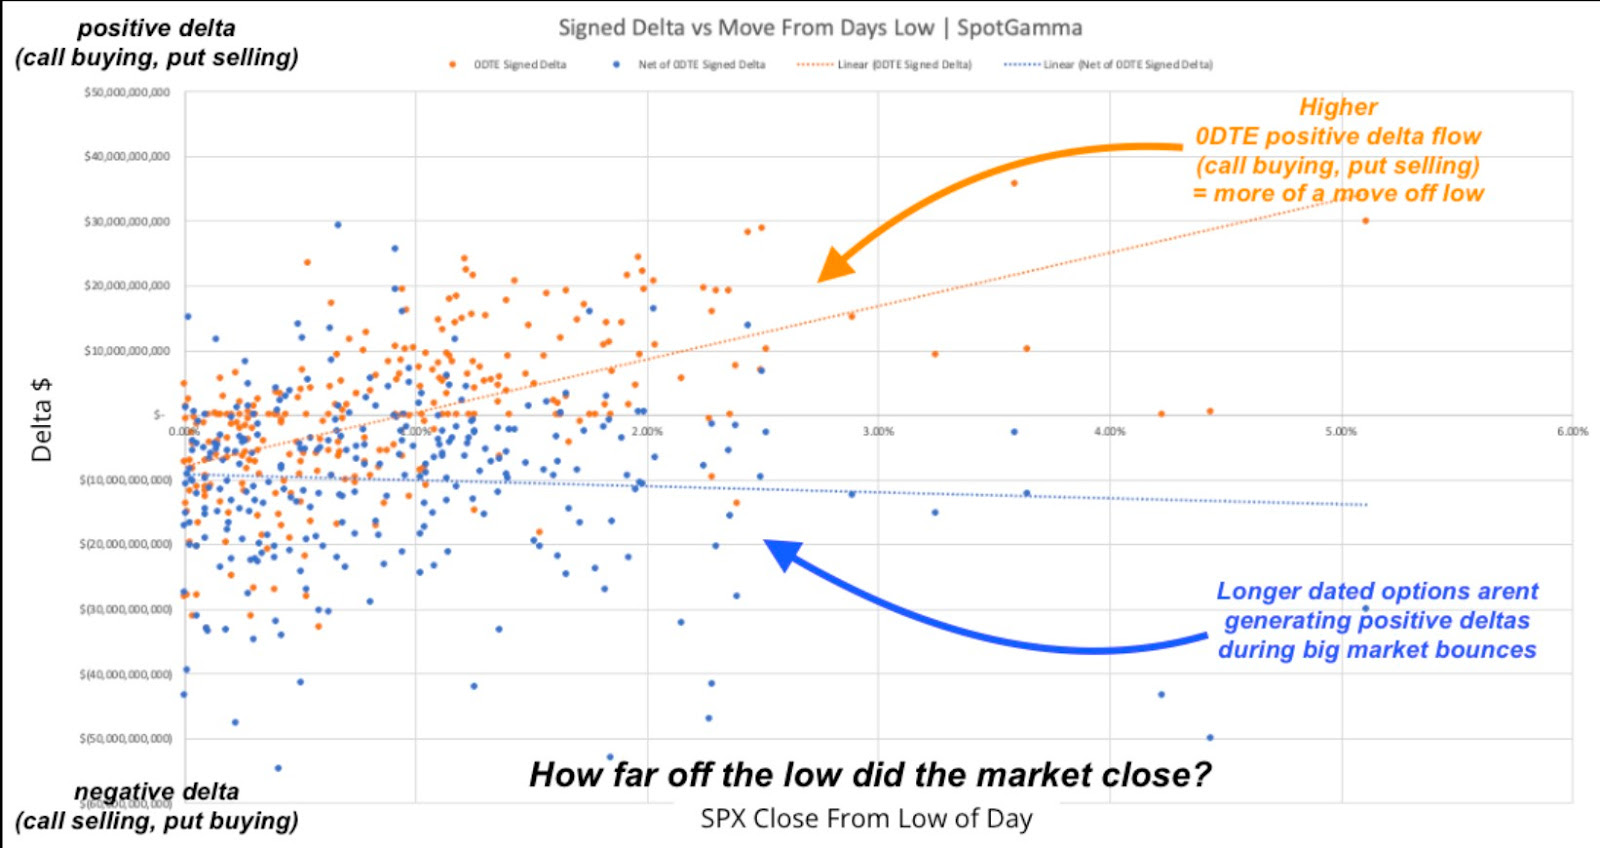
Per data by SpotGamma, another options insight and data provider your letter writer used to write for and highly recommends checking out, call buying, particularly over short time horizons, was often tied to market rallies. 

Graphic: Retrieved from SpotGamma via Bloomberg.

“0DTE does not seem to be associated with betting on a large downside movement. Large downside market volatility appears to be driven by larger, longer-dated S&P volume,” SpotGamma founder Brent Kochuba said in the Bloomberg article. “Where 0DTE is currently most impactful is where it seems 0DTE calls are being used to ‘buy the dips’ after large declines. In a way this suppresses volatility.”

Anyways, the signs of a “more combustible situation” would likely show when “volatility is sticky into a rally,” explained Kai Volatiity’s Cem Karsan. To gauge combustibility, look to the Daily Brief for February 17.

Technical

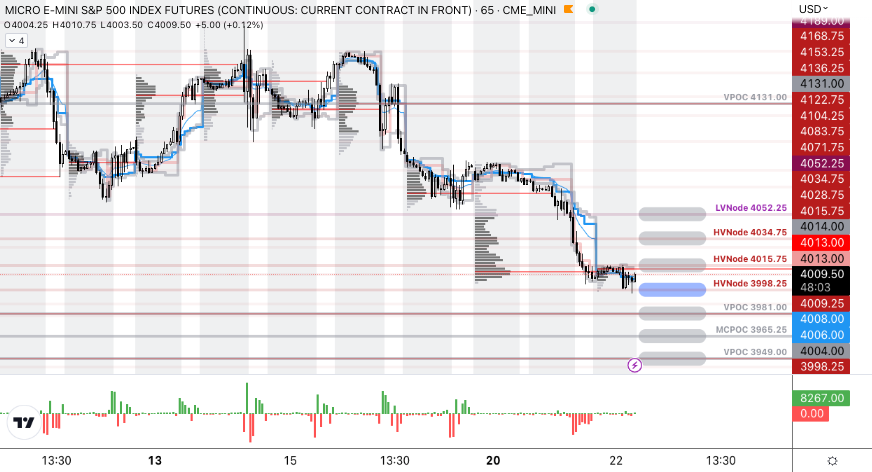
As of 6:50 AM ET, Friday’s regular session (9:30 AM – 4:00 PM ET), in the S&P 500, is likely to open in the upper part of a positively skewed overnight inventory, outside of the prior day’s range, suggesting a potential for immediate directional opportunity.

The S&P 500 pivot for today is $3,988.25. 

Key levels to the upside include $3,999.25, $4,012.25, and $4,024.75.

Key levels to the downside include $3,975.25, $3,965.25, and $3,947.00.

Disclaimer: Click here to load the updated key levels via the web-based TradingView platform. New links are produced daily. Quoted levels likely hold barring an exogenous development.

Graphic: 65-minute profile chart of the Micro E-mini S&P 500 Futures.

Definitions

Volume Areas: Markets will build on areas of high-volume (HVNodes). Should the market trend for a period of time, this will be identified by a low-volume area (LVNodes). The LVNodes denote directional conviction and ought to offer support on any test.

If participants auction and find acceptance in an area of a prior LVNode, then future discovery ought to be volatile and quick as participants look to the nearest HVNodes for more favorable entry or exit.

Vanna: The rate at which the Delta of an option changes with respect to implied volatility.

Charm: The rate at which the Delta of an option changes with respect to time.

POCs: Areas where two-sided trade was most prevalent in a prior day session. Participants will respond to future tests of value as they offer favorable entry and exit.

MCPOCs: Denote areas where two-sided trade was most prevalent over numerous sessions. Participants will respond to future tests of value as they offer favorable entry and exit.

Options Expiration (OPEX): Reduction in dealer Gamma exposure. Often, there is an increase in volatility after the removal of large options positions and associated hedging.

Options: Options offer an efficient way to gain directional exposure.

If an option buyer was short (long) stock, he or she could buy a call (put) to hedge upside (downside) exposure. Additionally, one can spread, or buy (+) and sell (-) options together, strategically.

Commonly discussed spreads include credit, debit, ratio, back, and calendar.

  • Credit: Sell -1 option closer to the money. Buy +1 option farther out of the money.
  • Debit: Buy +1 option closer to the money. Sell -1 option farther out of the money.
  • Ratio: Buy +1 option closer to the money. Sell -2 options farther out of the money. 
  • Back: Sell -1 option closer to the money. Buy +2 options farther out of the money.
  • Calendar: Sell -1 option. Buy +1 option farther out in time, at the same strike.

Typically, if bullish (bearish), sell at-the-money put (call) credit spread and/or buy a call (put) debit/ratio spread structured around the target price. Alternatively, if the expected directional move is great (small), opt for a back spread (calendar spread). Also, if credit spread, capture 50-75% of the premium collected. If debit spread, capture 2-300% of the premium paid.

Be cognizant of risk exposure to the direction (Delta), movement (Gamma), time (Theta), and volatility (Vega). 

  • Negative (positive) Delta = synthetic short (long).
  • Negative (positive) Gamma = movement hurts (helps).
  • Negative (positive) Theta = time decay hurts (helps).
  • Negative (positive) Vega = volatility hurts (helps).

About

The author, Renato Leonard Capelj, spends the bulk of his time at Physik Invest, an entity through which he invests and publishes free daily analyses to thousands of subscribers. The analyses offer him and his subscribers a way to stay on the right side of the market. 

Separately, Capelj is an accredited journalist with past works including interviews with investor Kevin O’Leary, ARK Invest’s Catherine Wood, FTX’s Sam Bankman-Fried, North Dakota Governor Doug Burgum, Lithuania’s Minister of Economy and Innovation Aušrinė Armonaitė, former Cisco chairman and CEO John Chambers, and persons at the Clinton Global Initiative.

Connect

Direct queries to renato@physikinvest.com. Find Physik Invest on TwitterLinkedInFacebook, and Instagram. Find Capelj on TwitterLinkedIn, and Instagram. Only follow the verified profiles.

Calendar

You may view this letter’s content calendar at this link.

Disclaimer

Do not construe this newsletter as advice. All content is for informational purposes. Capelj and Physik Invest manage their own capital and will not solicit others for it.

Categories
Commentary

Daily Brief For February 23, 2023

Physik Invest’s Daily Brief is read free by thousands of subscribers. Join this community to learn about the fundamental and technical drivers of markets.

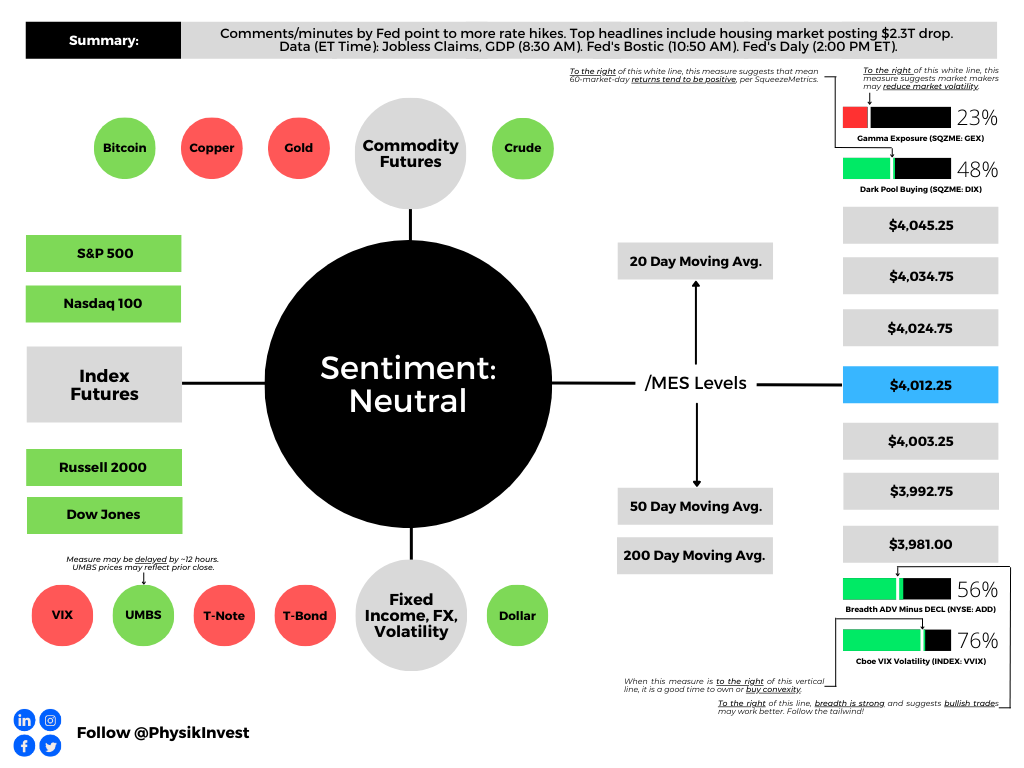
Graphic updated 6:30 AM ET. Sentiment Neutral if expected /MES open is inside of the prior day’s range. /MES levels are derived from the profile graphic at the bottom of this letter. Click here for the latest levels. SqueezeMetrics Dark Pool Index (DIX) and Gamma (GEX) with the latter calculated based on where the prior day’s reading falls with respect to the MAX and MIN of all occurrences available. A higher DIX is bullish. The lower the GEX, the more (expected) volatility. Click to learn the implications of volatility, direction, and moneyness. Breadth reflects a reading of the prior day’s NYSE Advance/Decline indicator. The CBOE VIX Volatility Index (INDEX: VVIX) reflects the attractiveness of owning volatility. UMBS prices via MNDClick here for the economic calendar.

Fundamental

Bloomberg’s John Authers summarized well the release of the Federal Open Market Committee (FOMC) meeting minutes. He said that almost all officials “supported a step down in the pace of tightening by 25 basis points, while a ‘few’ favored or could have supported a bigger 50 basis-point hike. Nobody wanted to stop straightaway.”

“Participants observed that a restrictive policy stance would need to be maintained until the incoming data provided confidence that inflation was on a sustained downward path to 2%, which was likely to take some time,” the minutes said.

Graphic: Retrieved from Royal Bank of Canada (NYSE: RY). 

Notwithstanding hits to markets like housing, which news has concentrated on, the S&P 500 (INDEX: SPX) is trading about 18x forward price-to-earnings, Bank of America Corporation (NYSE: BAC) said, the highest since March 2022 and 20% above the last decade’s average P/E

Graphic: Retrieved from Bloomberg.

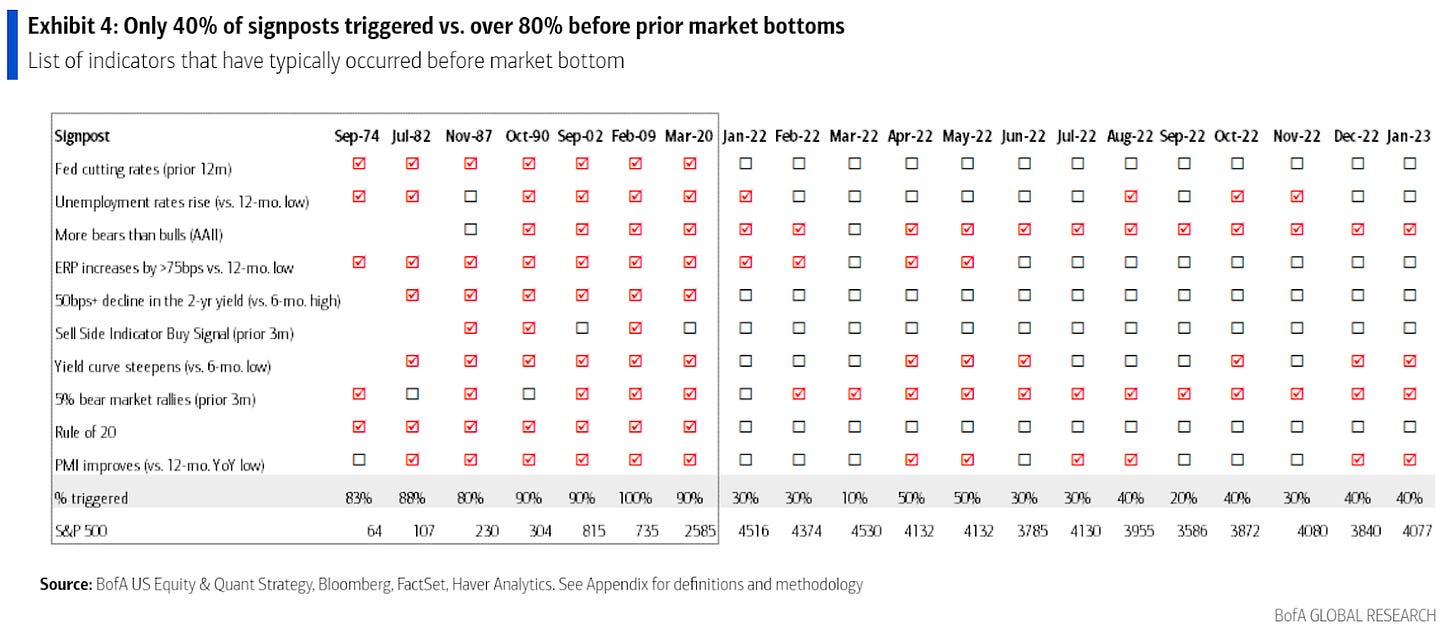
Per Savita Subramanian, “the traditional Rule of 20 … holds that the multiple should be whatever number results by subtracting the inflation rate from 20 — which with inflation at 6.4% would imply that the P/E needs to fall to 13.6.”

Graphic: Retrieved from Bank of America Corporation (NYSE: BAC) via Bloomberg.

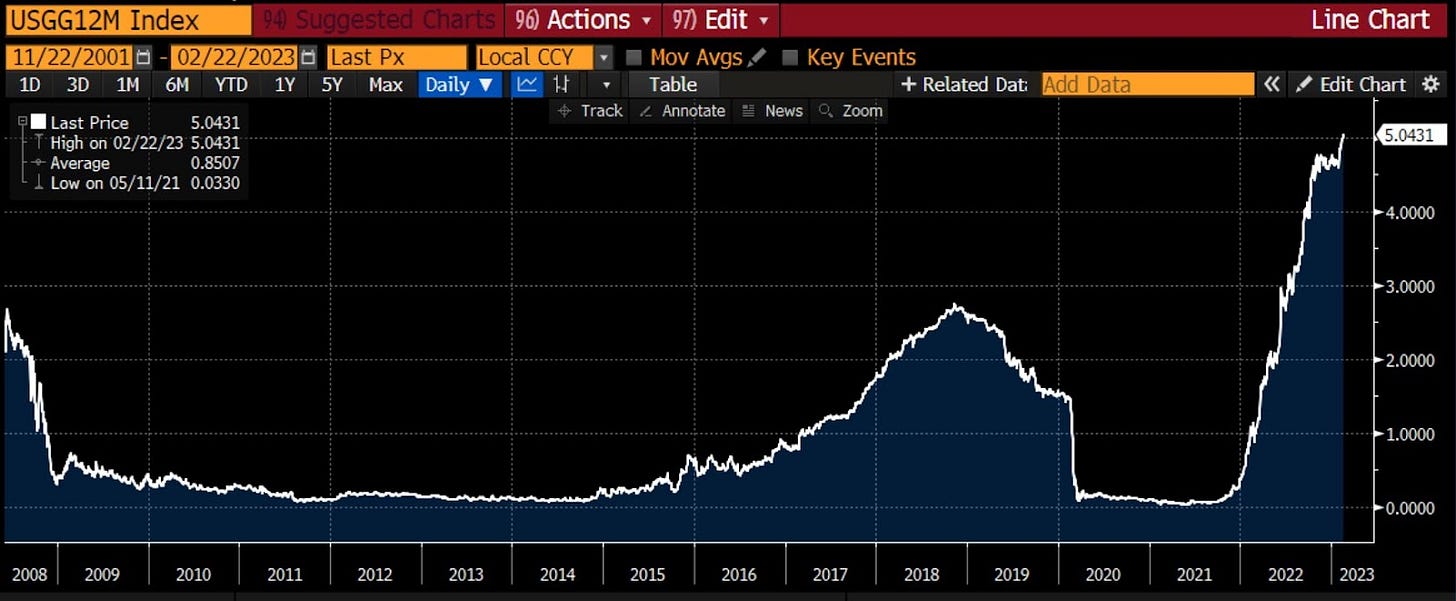
Recall yesterday’s letter discussing the “risk-reward of holding bonds [looking] better than equity (earnings yield).”

Graphic: Retrieved from Bloomberg’s Lisa Abramowicz. “Yields on 12-month T-bills have risen to their highest since 2001. Most of this has to do with Fed rate hike expectations.”

Positioning

The SPX’s decline is orderly and contained. 

However, the break below $4,000.00 SPX did open the door to a “liquidity hole,” SpotGamma explained. New information has traders anticipating more equity market downside; traders are “reset[ing] to lower equity valuations” on the higher-for-longer rate narrative all the while “vanna and gamma hedging serve to pull markets lower.”

The contexts for a far-reaching rally are weakA change in the context is likely to coincide with charged options values (i.e., wound implied volatility or big put delta).

Technical

As of 6:30 AM ET, Thursday’s regular session (9:30 AM – 4:00 PM ET), in the S&P 500, is likely to open in the middle part of a positively skewed overnight inventory, inside of the prior day’s range, suggesting a limited potential for immediate directional opportunity.

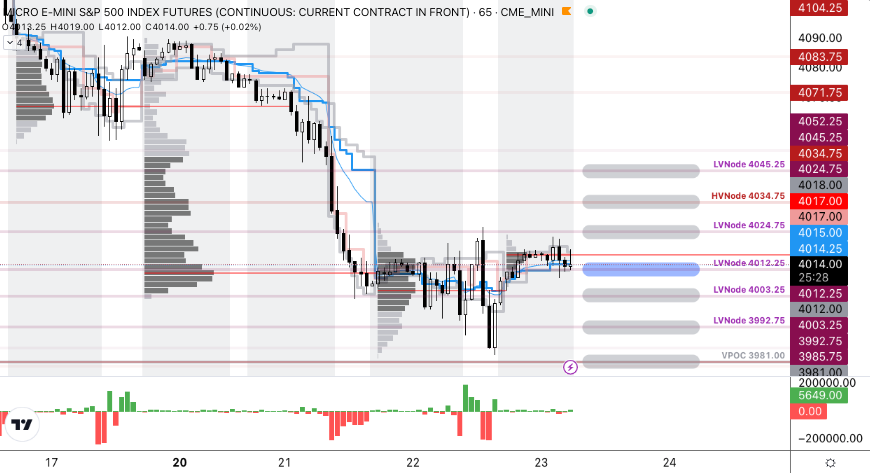
The S&P 500 (FUTURE: /MES) pivot for today is $4,012.25. 

Key levels to the upside include $4,024.75, $4,034.75, and $4,045.25.

Key levels to the downside include $4,003.25, $3,992.75, and $3,981.00.

Disclaimer: Click here to load the updated key levels via the web-based TradingView platform. New links are produced daily. Quoted levels likely hold barring an exogenous development.

Graphic: 65-minute profile chart of the Micro E-mini S&P 500 Futures.

Definitions

Volume Areas: Markets will build on areas of high-volume (HVNodes). Should the market trend for a period of time, this will be identified by a low-volume area (LVNodes). The LVNodes denote directional conviction and ought to offer support on any test.

If participants auction and find acceptance in an area of a prior LVNode, then future discovery ought to be volatile and quick as participants look to the nearest HVNodes for more favorable entry or exit.

Delta: An option’s exposure to the direction or underlying asset movement.

Gamma: The sensitivity of an option’s delta to changes in the underlying asset’s price.

Vanna: The rate at which the delta of an option changes with respect to implied volatility.

POCs: Areas where two-sided trade was most prevalent in a prior day session. Participants will respond to future tests of value as they offer favorable entry and exit.


About

The author, Renato Leonard Capelj, works in finance and journalism.

Capelj spends the bulk of his time at Physik Invest, an entity through which he invests and publishes free daily analyses to thousands of subscribers. The analyses offer him and his subscribers a way to stay on the right side of the market. Separately, Capelj is an options analyst at SpotGamma and an accredited journalist.

Capelj’s past works include conversations with investor Kevin O’Leary, ARK Invest’s Catherine Wood, FTX’s Sam Bankman-Fried, North Dakota Governor Doug Burgum, Lithuania’s Minister of Economy and Innovation Aušrinė Armonaitė, former Cisco chairman and CEO John Chambers, and persons at the Clinton Global Initiative.

Connect

Direct queries to renato@physikinvest.com. Find Physik Invest on TwitterLinkedInFacebook, and Instagram. Find Capelj on TwitterLinkedIn, and Instagram. Only follow the verified profiles.

Calendar

You may view this letter’s content calendar at this link.

Disclaimer

Do not construe this newsletter as advice. All content is for informational purposes. Capelj and Physik Invest manage their own capital and will not solicit others for it.

Categories
Commentary

Daily Brief For February 22, 2023

Physik Invest’s Daily Brief is read free by thousands of subscribers. Join this community to learn about the fundamental and technical drivers of markets.

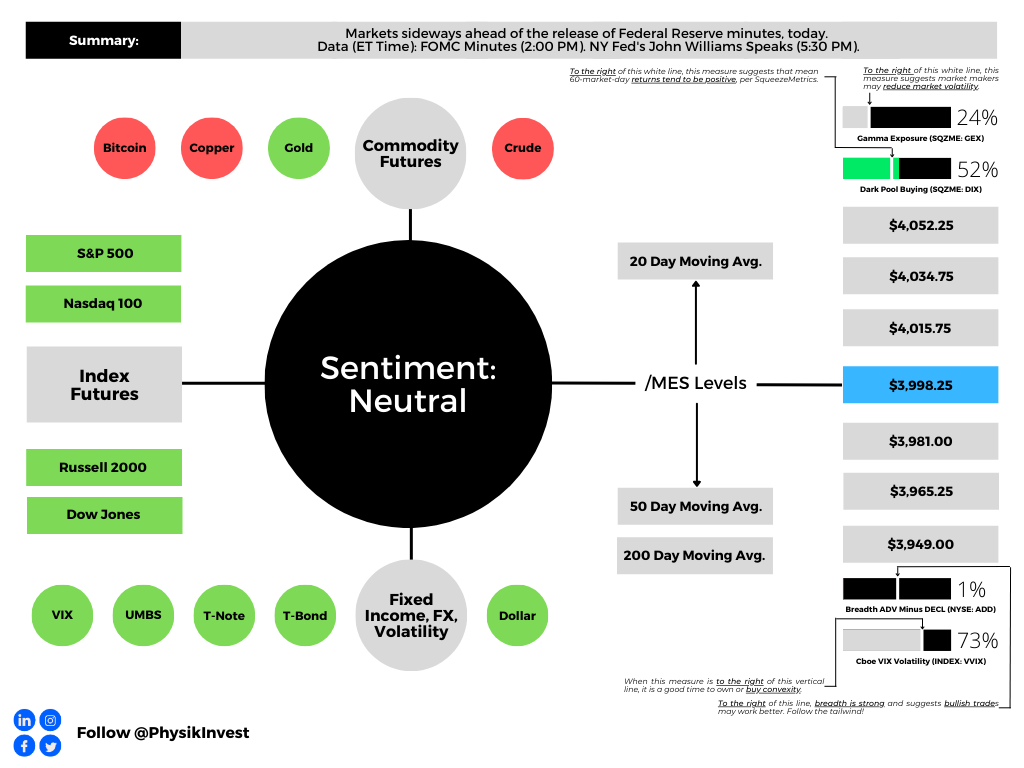
Graphic updated 7:15 AM ET. Sentiment Neutral if expected /MES open is inside of the prior day’s range. /MES levels are derived from the profile graphic at the bottom of this letter. Click here for the latest levels. SqueezeMetrics Dark Pool Index (DIX) and Gamma (GEX) with the latter calculated based on where the prior day’s reading falls with respect to the MAX and MIN of all occurrences available. A higher DIX is bullish. The lower the GEX, the more (expected) volatility. Click to learn the implications of volatility, direction, and moneyness. Breadth reflects a reading of the prior day’s NYSE Advance/Decline indicator. The CBOE VIX Volatility Index (INDEX: VVIX) reflects the attractiveness of owning volatility. UMBS prices via MNDClick here for the economic calendar.

Fundamental

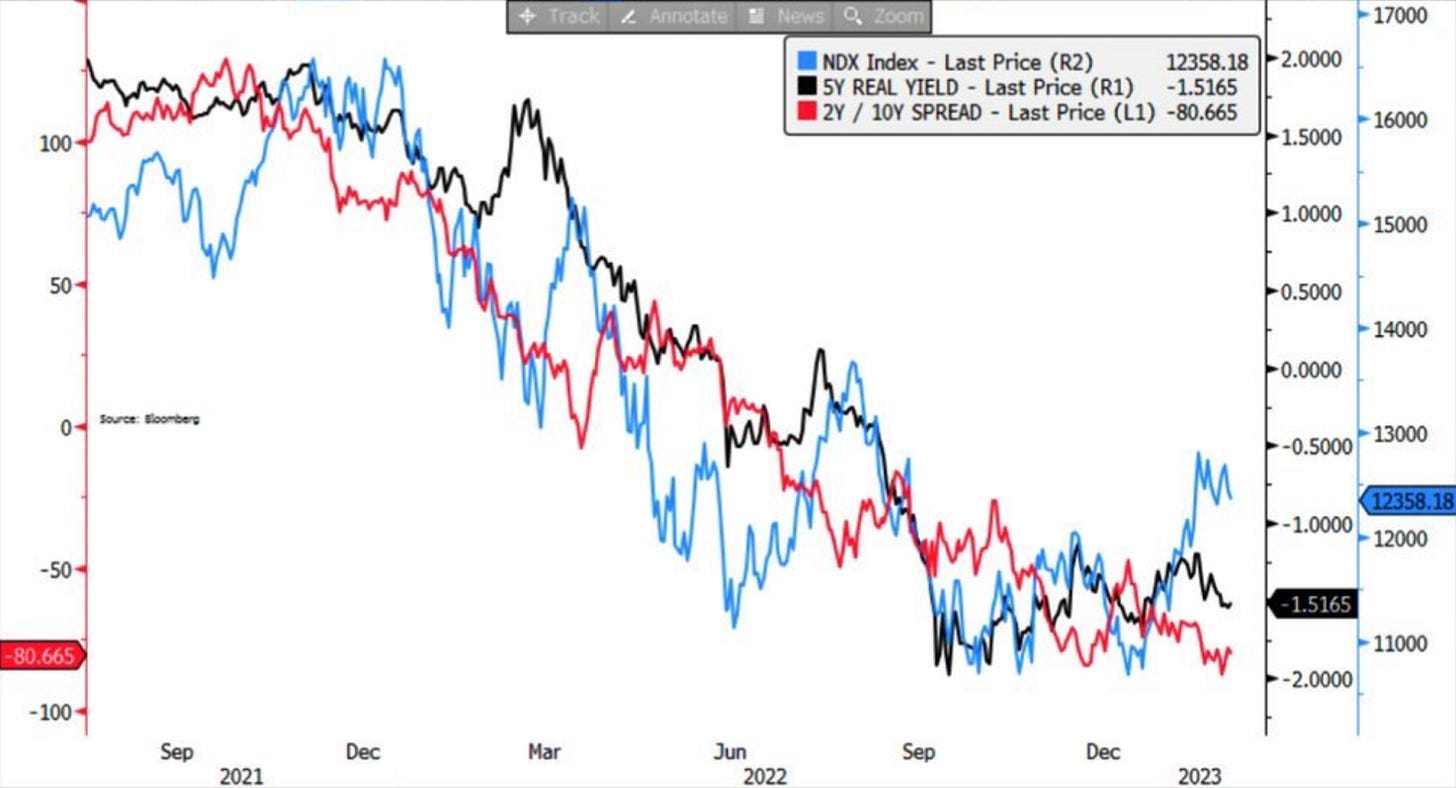
We look beyond all the doom-and-gloom narrative to the bond-equity divergence which JPMorgan Chase & Co’s (NYSE: JPM) Marko Kolanovic wrote about recently.

Essentially, regressions suggest the move in interest rates since the Federal Reserve’s (Fed) meeting earlier this month should have resulted in a 5-10% sell-off in the rate-sensitive Nasdaq. It didn’t. Per Kolanovic, “this divergence cannot go much further.”

Recall interest rates matter to discounted future cash flows. The higher rates are the, worse that is for equities, says Damped Spring’s Andy Constan well in an interview. 

Interest rates matter elsewhere as well. When interest rates increase, “a mortgage goes down in price by a greater amount than the bond because the expected maturity of the mortgage becomes longer. The magnitude of this unbalanced price volatility characteristic is measured by a financial statistic called ‘convexity.’” Managing this convexity can be problematic and force feedback loops, just as we talk about with options per the below. See here for more.

Graphic: The “Biggest tail risk to SPX isn’t any macro data/virus/war but its own options market.”

Kolanvoic ends: The “risk-reward of holding bonds at this level of short-term yields looks better than equity (earnings yield) than any time since the great financial crisis (i.e., the spread between 2y and equity earnings yield is at the lowest point since 2007).”

Graphic: Retrieved from JPMorgan Chase & Co (NYSE: JPM).

Positioning

This letter said there would be movement after last week’s options expirations (OpEx). 

To quote the February 15 letter, ignoring the “excellent” liquidity and traders buying S&P 500 (INDEX: SPX) “hand over fist,” OpEx would result in a decline in counterparty exposure to positive gamma (i.e., positive exposure to movement). Support from an options positioning perspective would decline, and counterparties would “do less to disrupt and more to bolster movement.”

That’s along the lines of what’s happening, though the movement appears orderly.

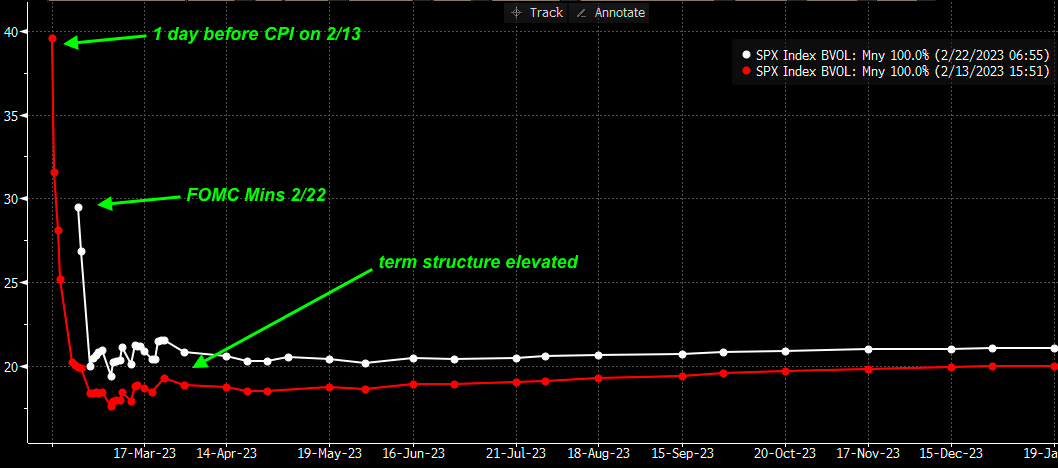
Per SpotGamma, “The selling appears contained, as evidenced by an upward trending [implied volatility or IVOL] term structure and light bid in topline measures of [IVOL] like the [Cboe Volatility Index (INDEX: VIX)].” Notwithstanding this light bid at the front of the term structure, there is no rush to protect, as would be evidenced by longer-dated IVOL shifting “materially higher as traders reset to lower equity valuations.”

Graphic: Retrieved from SpotGamma. “SPX term structure today vs 2/13 (day prior to CPI). Traders had higher vol expectations for CPI vs today’s FOMC minutes, but [the] term structure is now more elevated. Makes sense as SPX [is] -3% lower. However, the loss of stabilizing OPEX positioning, elevated IV, & flat gamma may lead to higher relative vol today.”

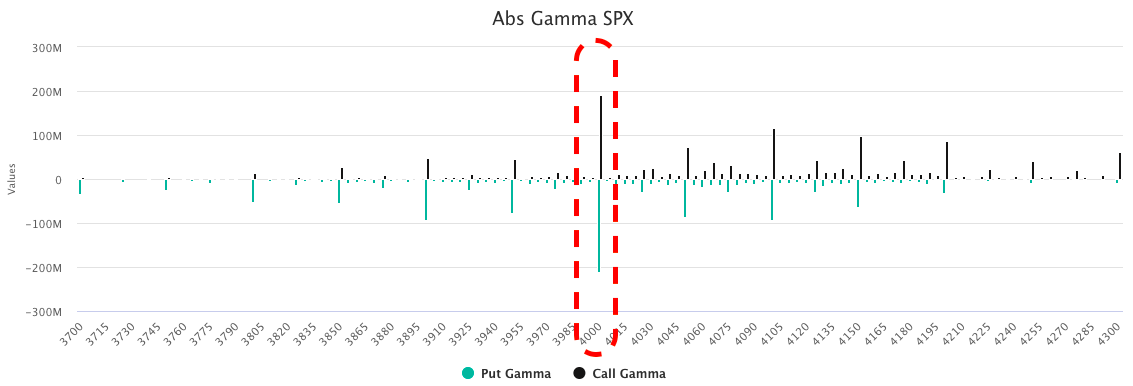
With there being many options positions concentrated near the $4,000.00 SPX area, markets may be at risk of accelerated selling. Below $4,000.00 traders desire to own predominantly puts, and this leaves counterparties “short puts and [] positive delta, as well as negative gamma and vega, meaning they lose money in an increasing way as the market trades lower and volatility increases.” To hedge, counterparties could sell futures or stocks into the decline. This accelerates selling.

Graphic: Retrieved from SpotGamma.

So, with a break of that big $4,000.00 level increasing risk that selling accelerates, the desire to protect will bid IVOL and the marginal impact of its expansion can do more damage than good that any marginal compression can do.

Graphic: Retrieved from SpotGamma. “IV has now compressed to levels associated with recent market tops. If realized vol (RV) declined, then IV could go lower. But, realized isn’t declining.”

In light of this, your letter writer leans negative delta, as well as positive gamma and vega. If the market trades lower, such a setup would make money in short.

Technical

As of 7:15 AM ET, Wednesday’s regular session (9:30 AM – 4:00 PM ET), in the S&P 500, is likely to open in the middle part of a negatively skewed overnight inventory, inside of the prior day’s range, suggesting a limited potential for immediate directional opportunity.

The S&P 500 pivot for today is $3,998.25. 

Key levels to the upside include $4,015.75, $4,034.75, and $4,052.25.

Key levels to the downside include $3,981.00, $3,965.25, and $3,949.00.

Disclaimer: Click here to load the updated key levels via the web-based TradingView platform. New links are produced daily. Quoted levels likely hold barring an exogenous development.

Graphic: 65-minute profile chart of the Micro E-mini S&P 500 Futures.

Definitions

Volume Areas: Markets will build on areas of high-volume (HVNodes). Should the market trend for a period of time, this will be identified by a low-volume area (LVNodes). The LVNodes denote directional conviction and ought to offer support on any test.

If participants auction and find acceptance in an area of a prior LVNode, then future discovery ought to be volatile and quick as participants look to the nearest HVNodes for more favorable entry or exit.

Gamma: The sensitivity of an option’s Delta to changes in the underlying asset’s price.

CPOCs: Denote areas where two-sided trade was most prevalent over all sessions. Participants will respond to future tests of value as they offer favorable entry and exit.

POCs: Areas where two-sided trade was most prevalent in a prior day session. Participants will respond to future tests of value as they offer favorable entry and exit.

MCPOCs: Denote areas where two-sided trade was most prevalent over numerous sessions. Participants will respond to future tests of value as they offer favorable entry and exit.

Inversion Of VIX Futures Term Structure: Longer-dated VIX expiries are less expensive; is a warning of elevated near-term risks for equity market stability.


About

The author, Renato Leonard Capelj, works in finance and journalism.

Capelj spends the bulk of his time at Physik Invest, an entity through which he invests and publishes free daily analyses to thousands of subscribers. The analyses offer him and his subscribers a way to stay on the right side of the market. Separately, Capelj is an options analyst at SpotGamma and an accredited journalist.

Capelj’s past works include conversations with investor Kevin O’Leary, ARK Invest’s Catherine Wood, FTX’s Sam Bankman-Fried, North Dakota Governor Doug Burgum, Lithuania’s Minister of Economy and Innovation Aušrinė Armonaitė, former Cisco chairman and CEO John Chambers, and persons at the Clinton Global Initiative.

Connect

Direct queries to renato@physikinvest.com. Find Physik Invest on TwitterLinkedInFacebook, and Instagram. Find Capelj on TwitterLinkedIn, and Instagram. Only follow the verified profiles.

Calendar

You may view this letter’s content calendar at this link.

Disclaimer

Do not construe this newsletter as advice. All content is for informational purposes. Capelj and Physik Invest manage their own capital and will not solicit others for it.

Categories
Commentary

Daily Brief For January 9, 2023

Physik Invest’s Daily Brief is read by thousands of subscribers. You, too, can join this community to learn about the fundamental and technical drivers of markets.

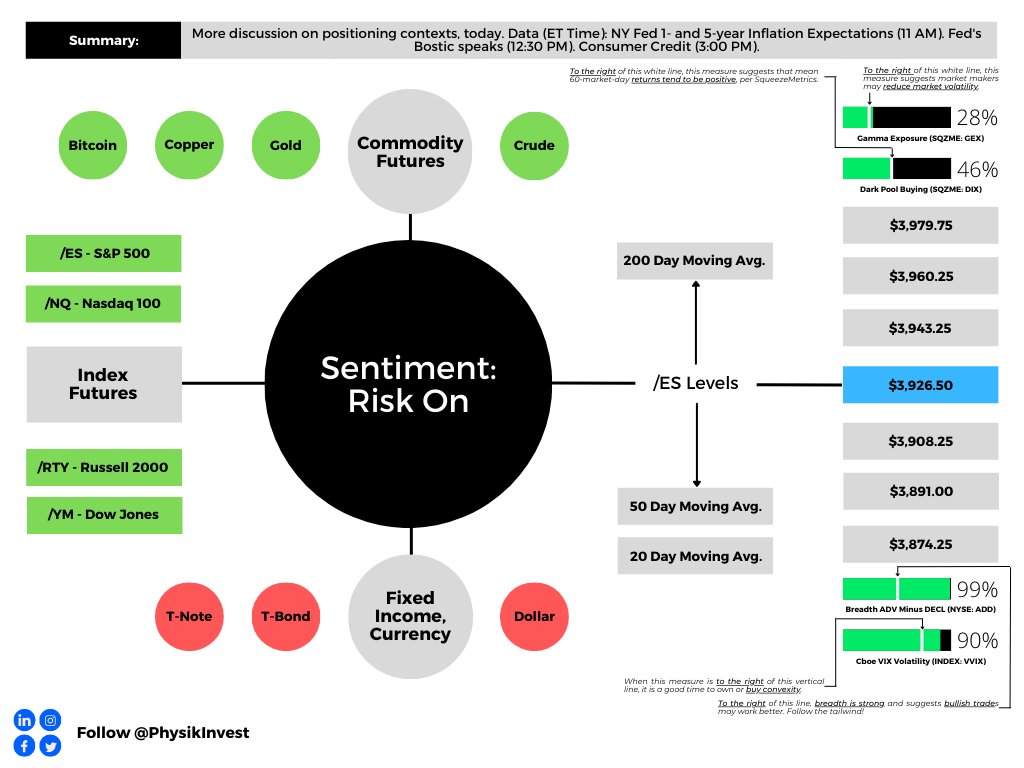
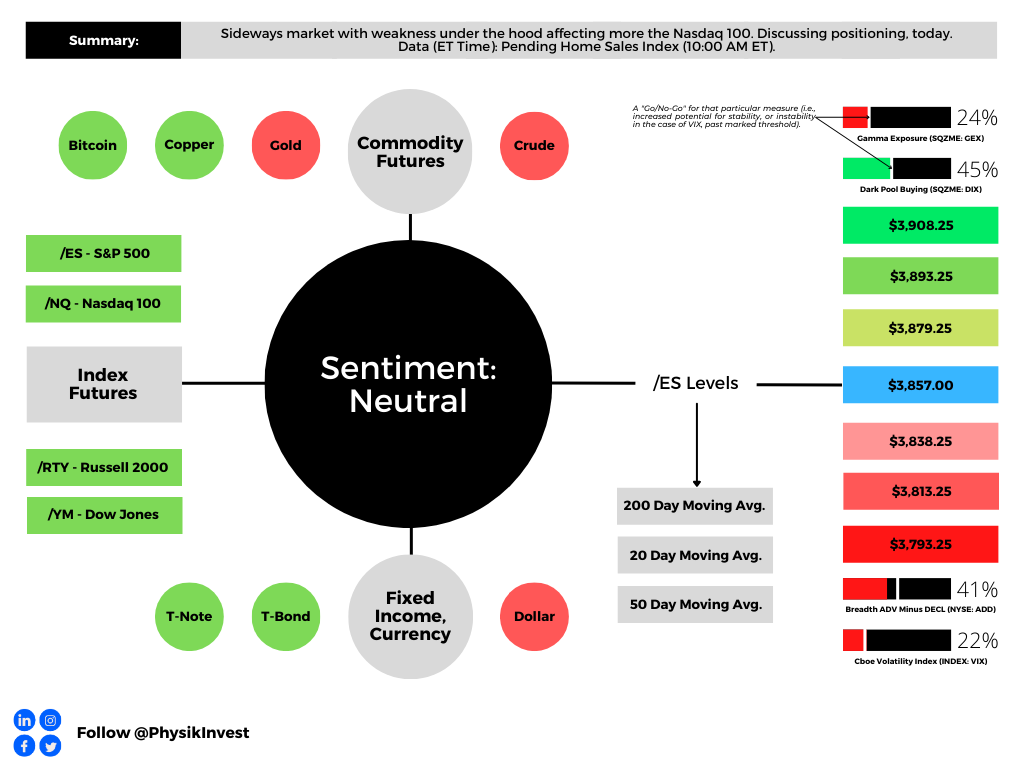
Graphic updated 7:50 AM ET. Sentiment Risk-On if expected /ES open is above the prior day’s range. /ES levels are derived from the profile graphic at the bottom of this letter. Levels may have changed since initially quoted; click here for the latest levels. SqueezeMetrics Dark Pool Index (DIX) and Gamma (GEX) with the latter calculated based on where the prior day’s reading falls with respect to the MAX and MIN of all occurrences available. A higher DIX is bullish. At the same time, the lower the GEX, the more (expected) volatility. Click to learn the implications of volatility, direction, and moneyness. Breadth reflects a reading of the prior day’s NYSE Advance/Decline indicator. The CBOE VIX Volatility Index (INDEX: VVIX) measure reflects the attractiveness of owning volatility. Green means that owning volatility is attractive.

Administrative

In last week’s letters, we discussed, mainly, fundamental and positioning contexts. Today’s letter will add to the discussion on the positioning.

Positioning

Last week, for an article published on Benzinga.com over the weekend, your letter writer spoke with The Ambrus Group’s co-chief investment officer Kris Sidial. Shared were the things to look out for in 2023 and tips for newer traders. The article can be viewed here, at this link.

In short, there are four big takeaways. 

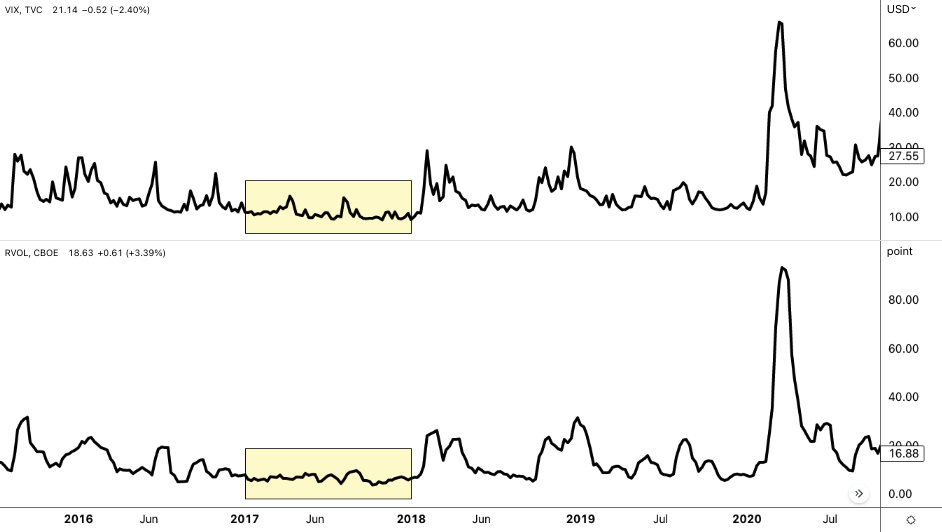
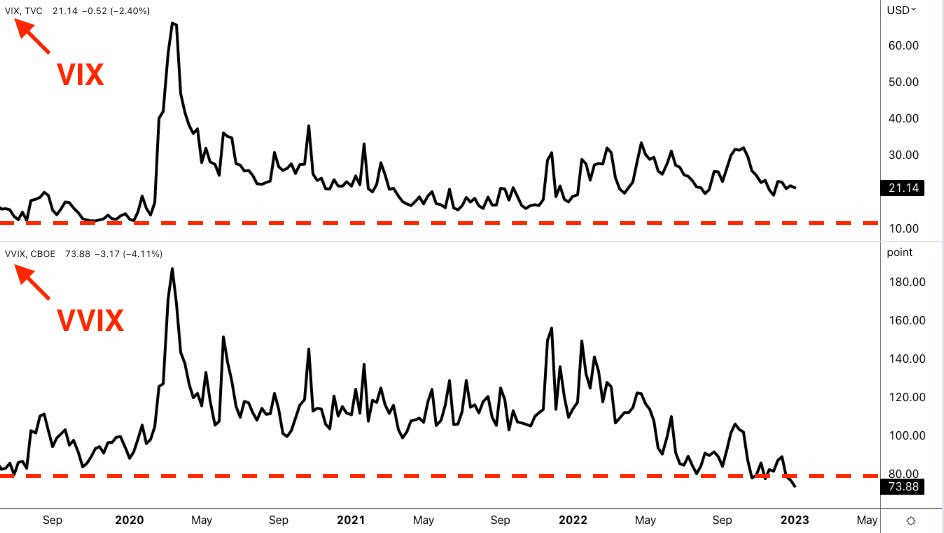
First, though options prices could stay under pressure, naive measures like the VVIX, which is the volatility of the VIX, or the volatility of the S&P 500’s volatility, are printing at levels last seen in 2017. This means “we can get cheap exposure to convexity while a lot of people are worried.”

Graphic: Retrieved from TradingView. Cboe Volatility Index (INDEX: VIX) is on the top. The volatility of the VIX itself (INDEX: VVIX) is at the bottom.

Second, on the other side of the growing S&P 500 and VIX complexes is a small concentrated group of market makers taking on far more exposure to risk. 

Graphic: Retrieved from Ambrus’ publicly available research.

During moments of stress, these market makers may be “unable to keep up with the demands of frenetic investors,” Sidial said, pointing to GameStop Corporation (NYSE: GME) where “there was this reflexive dynamic” that helped push the stock higher in 2021.

“That same dynamic can happen on the way down”; market makers will mark up options prices during intense selling. As the options prices rise, options deltas (i.e., their exposure to direction) rise and this prompts so-called bearish vanna hedging flows.

Graphic: Retrieved from Ambrus’ publicly available research.

“Imagine a scenario where [some disaster happens] and everybody starts buying 0 DTE puts. That’s going to reflexively drive the S&P lower,” Sidial said. “Take, for example, the JPMorgan collar position that clearly has an effect on the market, and people are starting to understand that effect. That’s just one fund. Imagine the whole derivative ecosystem” leaning one way.

Graphic: Retrieved from Ambrus’ publicly available research.

The third is in reference to liquidity. As private market investors’ “deals are getting marked down, [t]o source liquidity, they may have to sell some of their holdings in the public equity markets.” Benn Eifert, the CIO at QVR Advisors, recently put forth that “late-stage technology is a great example where public comps are down 80-90% but privates marked down 20% or not at all. It is possible to imagine large institutions engaging in forced selling of liquid public equities to meet capital calls in private fund investments.”

And, lastly, investors often go “back and forth” and do not stick to a strict process. In trying to pick what will work at one specific time, investors can “miss what is going to work in the future.” Consequently, Sidial says investors should have an outlook and process to express that outlook. “It’s not as easy as saying: ‘Buy volatility because it’s cheap or sell it because it is expensive.’” 

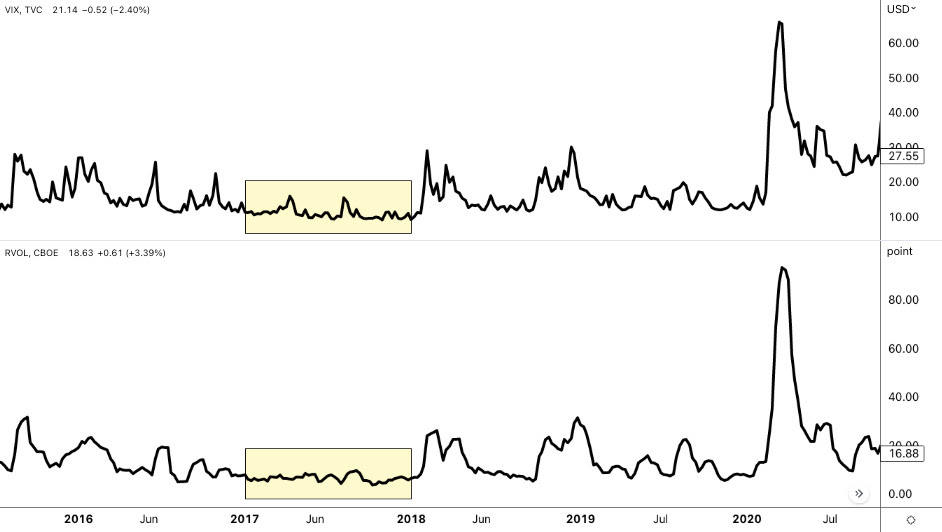
As a validation, in the Benzinga article, your letter writer wrote about 2017 when volatility was at some of its lowest levels. Back then, the correct trade was to sell volatility, in some cases, due to volatility’s bimodality; if you sold volatility back then, you made money due to its clustering.

Graphic: Retrieved from TradingView. Cboe Volatility Index (INDEX: VIX) is on the top. Cboe Realized Volatility (INDEX: RVOL) is at the bottom.

So, “if you’re trading volatility, let there be an underlying catalyst for doing so.” That said, from a “risk-to-reward perspective, … it’s a better bet to be on the long volatility side,” given “that there are so many things that … keep popping up” from a macro perspective.

For Ambrus’ publicly available research, click here. Also, follow Sidial on Twitter, here. Consider reading your letter writer’s past two conversations with Sidial, as well. Here is an article on 2021 and the meme stock debacle. Here is another article talking more about Ambrus’ processes.

Technical

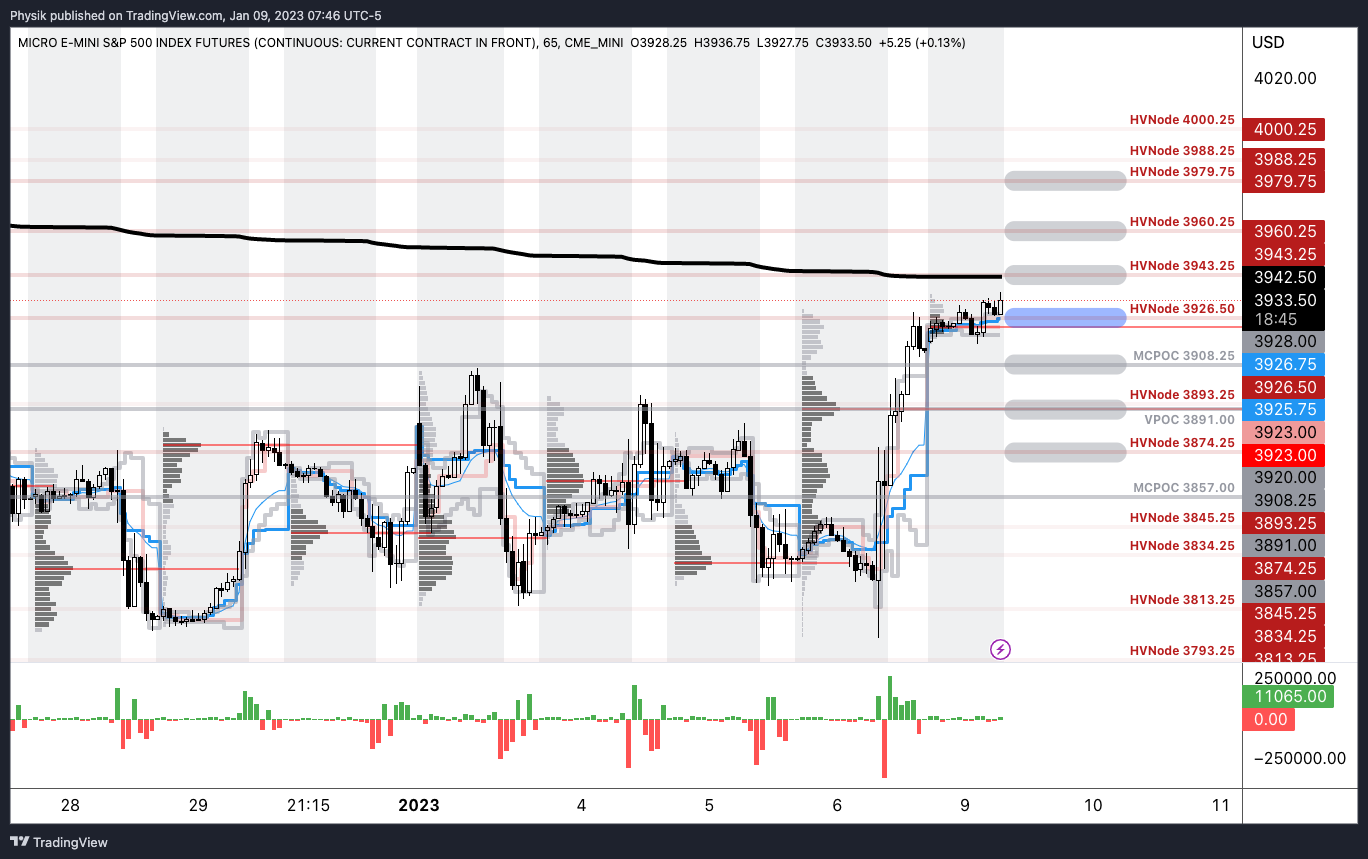
As of 7:50 AM ET, Monday’s regular session (9:30 AM – 4:00 PM ET), in the S&P 500, is likely to open in the upper part of a positively skewed overnight inventory, outside of prior-range and -value, suggesting a potential for immediate directional opportunity.

Our S&P 500 pivot for today is $3,926.50. 

Key levels to the upside include $3,943.25, $3,960.25, and $3,979.75.

Key levels to the downside include $3,908.25, $3,891.00, and $3,874.25.

Click here to load today’s key levels into the web-based TradingView platform. All levels are derived using the 65-minute timeframe. New links are produced, daily. 

As a disclaimer, note the S&P 500 could trade beyond the levels quoted in the letter. Therefore, you should load the key levels on your browser.

Graphic: 65-minute profile chart of the Micro E-mini S&P 500 Futures.

Definitions

Volume Areas: Markets will build on areas of high-volume (HVNodes). Should the market trend for long periods of time, it will be identified by low-volume areas (LVNodes). LVNodes denote directional conviction and ought to offer support on any test.

If participants auction and find acceptance in an area of a prior LVNode, then future discovery ought to be volatile and quick as participants look to HVNodes for favorable entry or exit.

Vanna: The rate at which the Delta of an option changes with respect to implied volatility.

POCs: Denote areas where two-sided trade was most prevalent in a prior day session. Participants will respond to future tests of value as they offer favorable entry and exit.

MCPOCs: Denote areas where two-sided trade was most prevalent over numerous sessions. Participants will respond to future tests of value as they offer favorable entry and exit.


About

In short, an economics graduate working in finance and journalism.

Capelj spends most of his time as the founder of Physik Invest through which he invests and publishes daily analyses to subscribers, some of whom represent well-known institutions.

Separately, Capelj is an equity options analyst at SpotGamma and an accredited journalist interviewing global leaders in business, government, and finance.

Past works include conversations with investor Kevin O’Leary, ARK Invest’s Catherine Wood, FTX’s Sam Bankman-Fried, Lithuania’s Minister of Economy and Innovation Aušrinė Armonaitė, former Cisco chairman and CEO John Chambers, and persons at the Clinton Global Initiative.

Contact

Direct queries to renato@physikinvest.com or Renato Capelj#8625 on Discord.

Calendar

You may view this letter’s content calendar at this link.

Disclaimer

Do not construe this newsletter as advice. All content is for informational purposes.

Categories
Commentary

Daily Brief For December 28, 2022

Physik Invest’s Daily Brief is read by thousands of subscribers. You, too, can join this community to learn about the fundamental and technical drivers of markets.

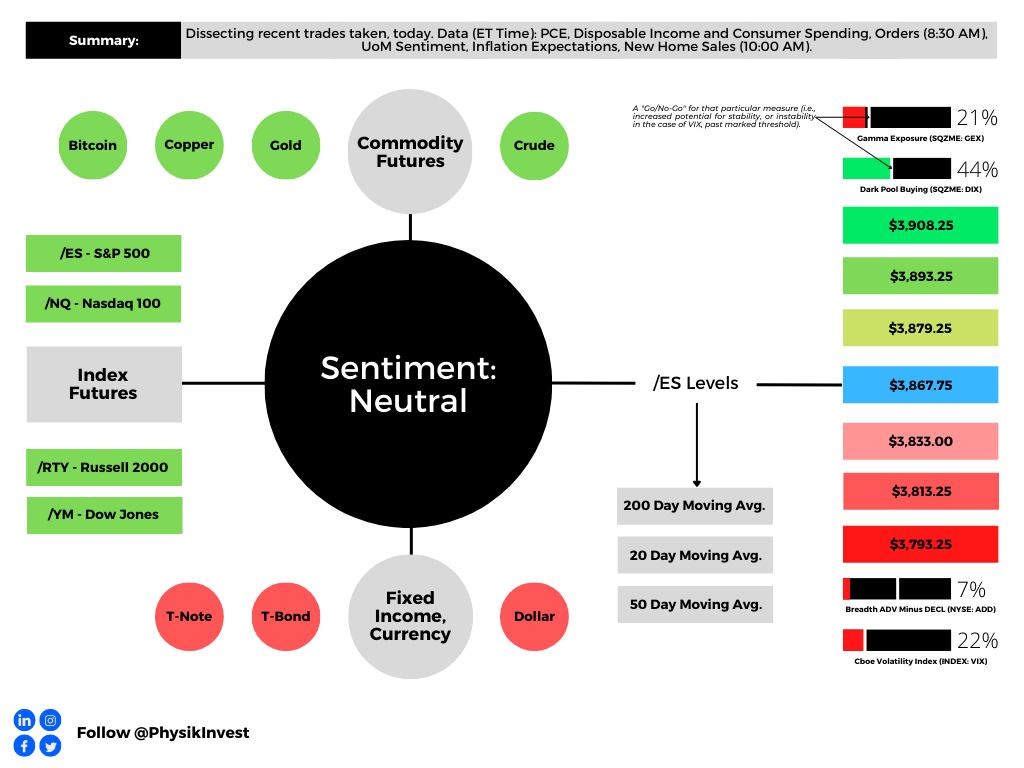
Graphic updated 6:40 AM ET. Sentiment Neutral if expected /ES open is inside of the prior day’s range. /ES levels are derived from the profile graphic at the bottom of this letter. Levels may have changed since initially quoted; click here for the latest levels. SqueezeMetrics Dark Pool Index (DIX) and Gamma (GEX) with the latter calculated based on where the prior day’s reading falls with respect to the MAX and MIN of all occurrences available. A higher DIX is bullish. At the same time, the lower the GEX, the more (expected) volatility. Click to learn the implications of volatility, direction, and moneyness. Breadth reflects a reading of the prior day’s NYSE Advance/Decline indicator. VIX reflects a current reading of the CBOE Volatility Index (INDEX: VIX) from 0-100.

Positioning

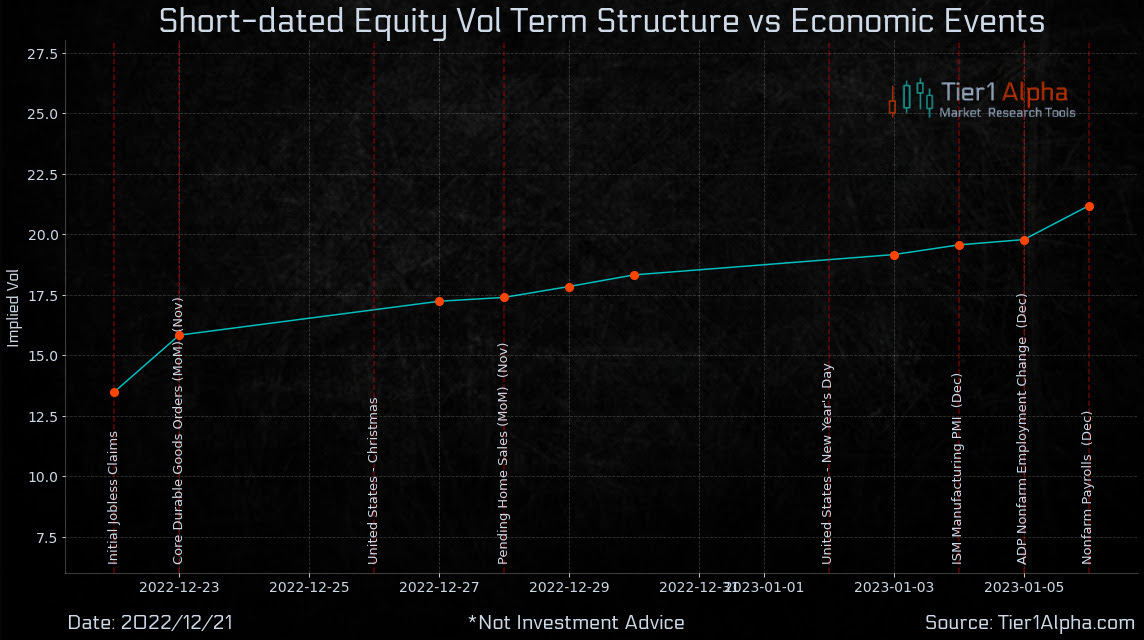
In Physik Invest’s Market Intelligence letter for December 21, we discussed the potential for “pressure on options prices [to] remain through December.” In short, on the odds that “nothing happens through the holidays,” it made sense to sell implied volatility (IVOL) after CPI and FOMC targeting an end-of-month expiration.

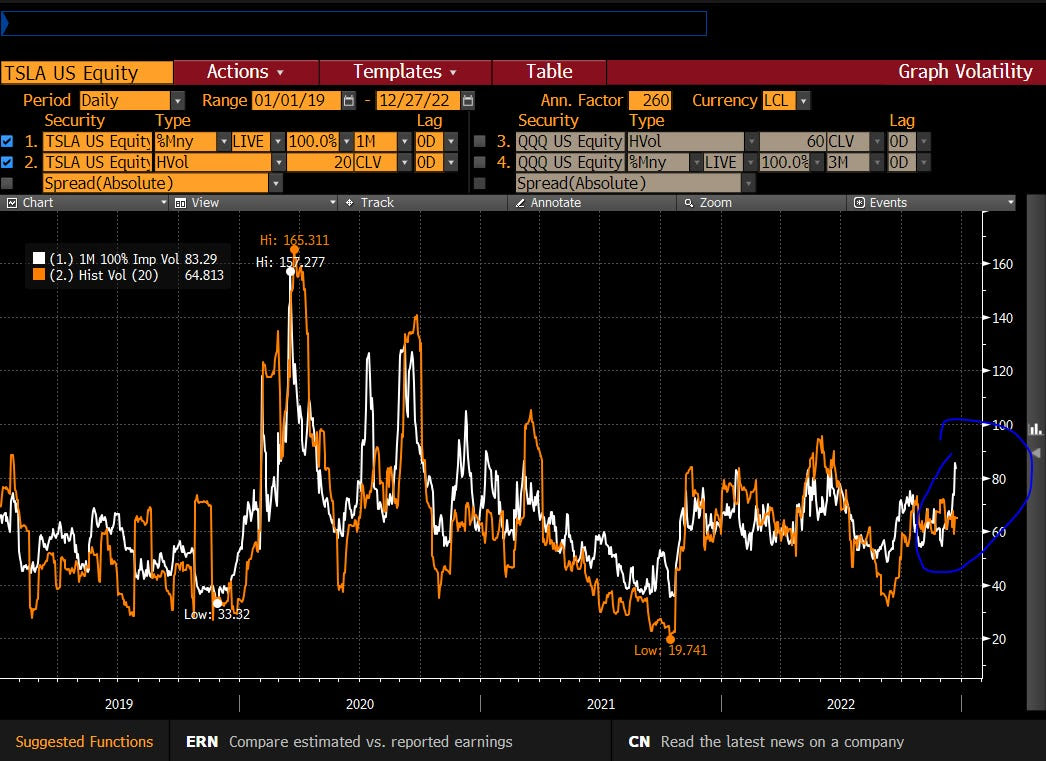
The downward trajectory in IVOL remains intact in spite of some pockets of weakness under the hood in index heavyweights like Tesla Inc (NASDAQ: TSLA); expectations of future movement remain mute at both the index and single stock levels. As a result, short volatility trades (e.g., short straddle) in the indexes and near current market prices, expiring later this month, are doing really well.

Graphic: Retrieved from Kris Sidial. Tesla Inc (NASDAQ: TSLA) 1-month IVOL “relatively muted throughout the pain.”

Part of the equation resulting in this sideways market and tame IVOL environment was discussed in the December 21 letter. Today we add color.

In short, traders’ anticipation of a market drop, as evidenced by them reducing equity exposures into and through the 2022 market decline, coupled with the exploitation of loopholes manifesting increased demand for short-dated exposure to movements (i.e., gamma), and a supply of IVOL that is farther-dated, has put a lid on broad equity IVOL measures like the Cboe Volatility Index (INDEX: VIX) and pushed skew lower.

Consequently, hedges performing well have a lot of +gamma intraday and exposure to realized volatility (RVOL), and less exposure to longer-dated IVOL. The other side of this trade (and those who may be warehousing this risk) has exposure to -gamma and, to hedge that, they must act in a manner that exacerbates realized movement, hence RVOL’s meaningful outperformance.

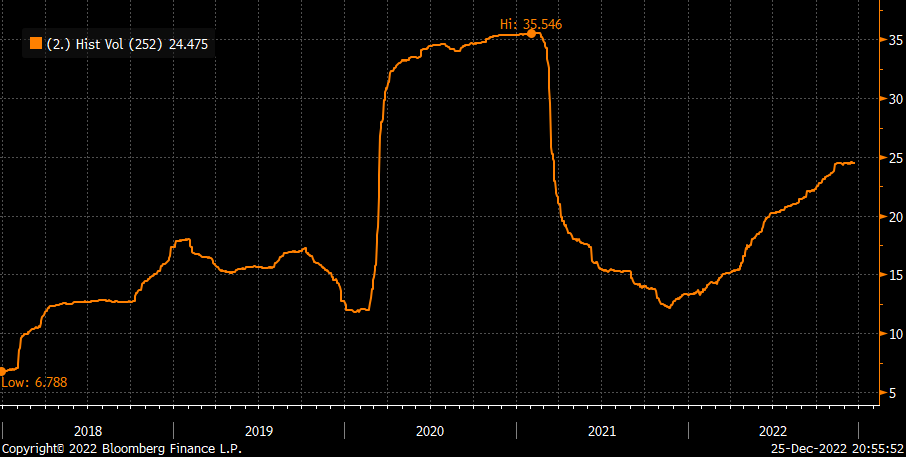
In fact, RVOL in 2022 is nearly two times the level of RVOL in 2021, all the while the IVOL term structure is basically at the “same place it was a year ago,” according to Danny Kirsch of Piper Sandler Companies (NYSE: PIPR).

Graphic: Retrieved from Danny Kirsch, the head of options at Piper Sandler Companies (NYSE: PIPR). “Rolling 1 year realized volatility [for] … 2022 nearly 2x the level of 2021, speaks to long gamma and not vega for 2022.”

In a two-and-a-half-hour Twitter Spaces discussion, Kai Volatility’s Cem Karsan discussed what is the potential cause of this. Some of the blame rests on the way margin calculations (i.e., the loophole mentioned earlier); less cash must be posted if trades are closed the same day, basically. 

Anyways, at the macro level, yes, the trends continue. Generally speaking, IVOL is mute and not accounting for the activity in short-dated options, as discussed by The Ambrus Group’s recent paper, while RVOL is about two times the level it was in 2021, making +gamma profitable.

However, at the micro level, so to speak, as we started out this discussion, traders’ anticipation that “nothing happens through the holidays,” has resulted in the supply of short-dated volatility, boosting the stickiness of open interest at current market prices.

Let’s unpack this further and explain why this activity won’t continue forever.

Near current market prices sit large concentrations of options positions. For instance, we have the $3,835.00 SPX strike (the call part of a massively popular collar trade that is rolled every quarter). At $3,835.00 is the short strike of a big collar trade.

This means the trader (or fund owner) is short the call, hence -delta and -gamma. The other side (or counterpart) is long the call, hence +delta and +gamma.

In theory, the other side, in response to this exposure, will buy weakness and sell strength. In other words, to hedge a long call, the other side sells futures. If the market falls, the call’s delta will fall and become less positive. Therefore, the other side will buy back some of their initial futures hedges (reduce -delta from short futures) to neutralize delta risk. If the market rises, the other side will have more exposure to +delta. To neutralize the delta, the other side will sell more futures.

As a consequence, the market pins.

Graphic: Retrieved from Banco Santander SA (NYSE: SAN).

This is a trend, as we discussed on December 21, that likely continues through year-end. After year-end, the market is likely to “move more freely,” per SpotGamma, “because this options activity that is promoting mean reversion will no longer be there,” and, therefore, the indexes likely trade more “in sync with its wild constituents of the likes of Tesla and beyond.”

More on what’s next:

As Karsan dissected, yesterday, there’s a “liquidity premium” that’s getting crowded short; in this less well-hedged market environment, traders’ realization with respect to liquidity and collateral needs for supporting trading activities may provide the context for some sharp drops. But first, it’s likely (though not certain) the market experiences some relief. Knowing that the long-end is cheap (hence near-zero percentile skew) on a supply and demand basis, it does not make sense to sell options blindly out in time.

Technical

As of 6:30 AM ET, Wednesday’s regular session (9:30 AM – 4:00 PM ET), in the S&P 500, is likely to open in the middle part of a balanced overnight inventory, inside of prior-range and -value, suggesting a limited potential for immediate directional opportunity.

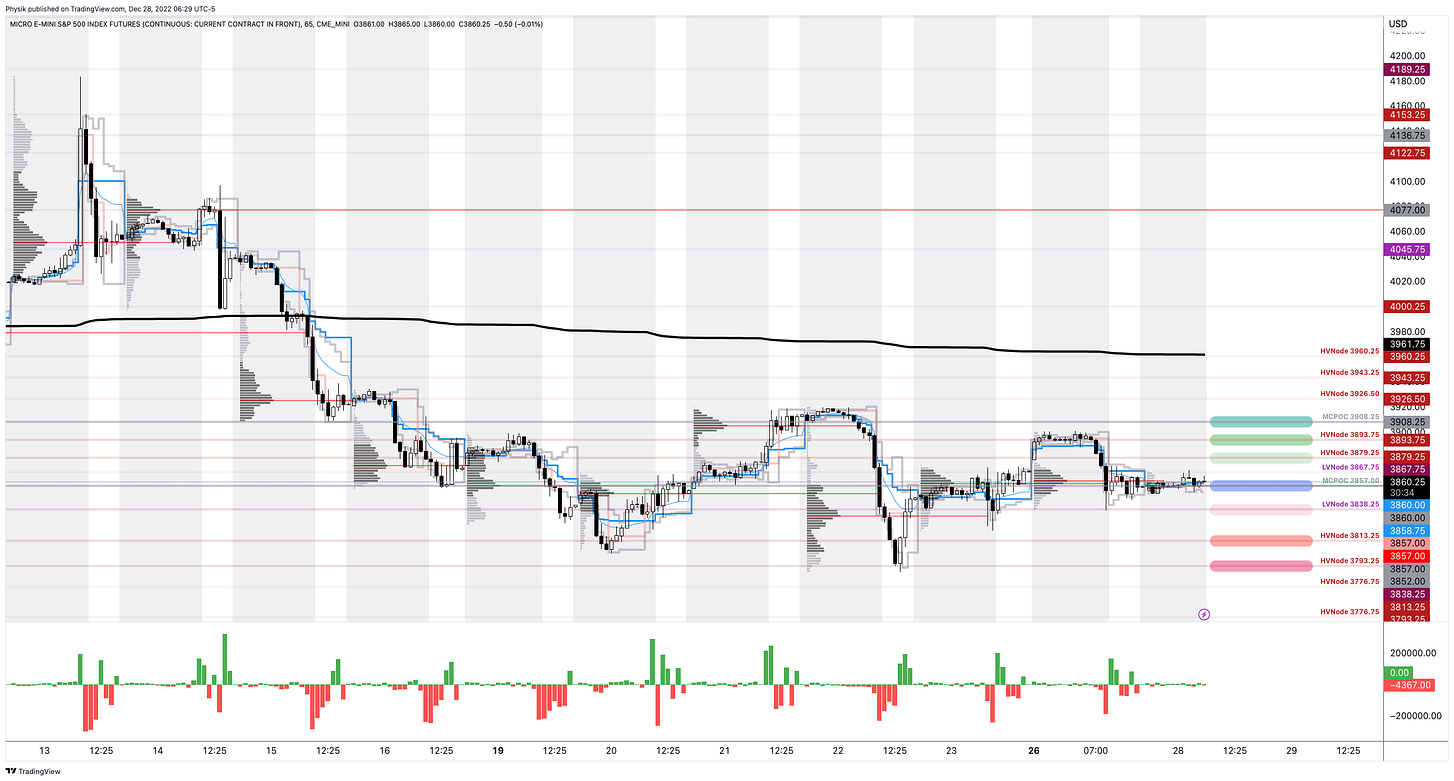
Our S&P 500 pivot for today is $3,857.00. 

Key levels to the upside include $3,879.25, $3,893.75, and $3,908.25. 

Key levels to the downside include $3,838.25, $3,813.25, and $3,793.25.

Click here to load today’s key levels into the web-based TradingView platform. All levels are derived using the 65-minute timeframe. New links are produced, daily.

Graphic: 65-minute profile chart of the Micro E-mini S&P 500 Futures.

Definitions

Volume Areas: Markets will build on areas of high-volume (HVNodes). Should the market trend for long periods of time, it will be identified by low-volume areas (LVNodes). LVNodes denote directional conviction and ought to offer support on any test.

If participants auction and find acceptance in an area of a prior LVNode, then future discovery ought to be volatile and quick as participants look to HVNodes for favorable entry or exit.

MCPOCs: Denote areas where two-sided trade was most prevalent over numerous sessions. Participants will respond to future tests of value as they offer favorable entry and exit.


About

In short, an economics graduate working in finance and journalism.

Capelj spends most of his time as the founder of Physik Invest through which he invests and publishes daily analyses to subscribers, some of whom represent well-known institutions.

Separately, Capelj is an equity options analyst at SpotGamma and an accredited journalist interviewing global leaders in business, government, and finance.

Past works include conversations with investor Kevin O’Leary, ARK Invest’s Catherine Wood, FTX’s Sam Bankman-Fried, Lithuania’s Minister of Economy and Innovation Aušrinė Armonaitė, former Cisco chairman and CEO John Chambers, and persons at the Clinton Global Initiative.

Contact

Direct queries to renato@physikinvest.com or Renato Capelj#8625 on Discord.

Calendar

You may view this letter’s content calendar at this link.

Disclaimer

Do not construe this newsletter as advice. All content is for informational purposes.

Categories
Commentary

Daily Brief For December 23, 2022

Physik Invest’s Daily Brief is read by thousands of subscribers. You, too, can join this community to learn about the fundamental and technical drivers of markets.

Graphic updated 8:30 AM ET. Sentiment Neutral if expected /ES open is inside of the prior day’s range. /ES levels are derived from the profile graphic at the bottom of this letter. Levels may have changed since initially quoted; click here for the latest levels. SqueezeMetrics Dark Pool Index (DIX) and Gamma (GEX) with the latter calculated based on where the prior day’s reading falls with respect to the MAX and MIN of all occurrences available. A higher DIX is bullish. At the same time, the lower the GEX, the more (expected) volatility. Click to learn the implications of volatility, direction, and moneyness. Breadth reflects a reading of the prior day’s NYSE Advance/Decline indicator. VIX reflects a current reading of the CBOE Volatility Index (INDEX: VIX) from 0-100.

Positioning

Friends, please read the entire post.

In the Daily Brief for December 21, 2022, this letter dissected some of the positioning contexts responsible for fixed-strike and top-line implied volatility (IVOL) measures’ downward trajectory with the S&P 500. Since this detailed letter was published, IVOL has increased, albeit not by a massive amount so to speak. The moves lower, coupled with the volatility skew not blowing out, have enabled your letter writer to monetize structures entered into while on travel for a nice return. Let’s talk about it, further.

Heading into consumer price (i.e., inflation) updates, as well as updates from the Federal Reserve on their commitment to stemming inflation, traders sought to protect against (or bet on) movement thereby bidding measures of IVOL.

To quote The Ambrus Group’s Kris Sidial, the “entire term structure was jacked going into CPI and FOMC.” Additionally, “granted nothing out of left field,” Sidial added, it would be tough “for December and January vol[atility] to remain bid.”

Graphic: IVOL term structure retrieved from Tier1Alpha.com.

Accordingly, after the CPI and FOMC, market concerns ebbed and traders’ supply of the options they demanded, particularly at the front-end of the curve, pushed the term structure back to an upward-sloping so-called contango.

Graphic: IVOL term structure retrieved from Tier1Alpha.com.

As was detailed in the December 21 letter, this dynamic following the release of CPI and FOMC would do a lot to keep IVOL and equity movement contained. Knowing this, your letter writer’s trading partner alerted him while on a trip of skew presenting some nice, zero-cost trades that would expand should the market trade lower and IVOL remain contained (i.e., volatility skew not blowing out).

Upon analysis, entered was a simple +1 x -2 Put Ratio Spread (Trade Ticket: SOLD -1 1/2 BACKRATIO SPX 100 20 JAN 23 [AM] 3400/3150 PUT @.10) for a ~$10.00 credit before fees and commissions, a favorite of your letter writer’s.

Graphic: Filled orders on December 14, 2022.

The trades provided exposure to -Delta (direction) and +Gamma (movement).

Graphic: Position statement on December 14, 2022. Using portfolio margin to lower BP Effect.

As an aside, from the start the Vega (sensitivity to changes in IVOL) was negative but, this has a lot to do with how far out the spread is on the chain and, should there be movement as you’re about to see, enabling the put leg you own to start kicking in, so to speak, Vega ends up turning positive very quickly, all else equal.

The below graphic, taken on December 19, prior to much of the spread being monetized, shows a large -Delta, +Gamma, and +Vega (i.e., if the market moves lower or IVOL rises, the spread is to rise in value), much like it did when the market traded down into the beginning of this week and IVOL rose into the end of this week.

Graphic: Position statement on December 19, 2022. Using portfolio margin to lower BP Effect.

For one account, 50% of the initial trade was closed for $205-220.00 in credit per spread. After this closure, the remaining structure, in this one account, was turned into a +2 x -5 Ratio. Why? In short, the market was strengthening and the odds of a large move lower were, in short, low. To have downside exposure but be paid for the initial effort, the conversion from a +4 x -8 to a +2 x -5 resulted in an additional $8.10 credit, leaving your letter writer with a -Delta, +Gamma, and +Vega, still.

Graphic: Trade history on December 23, 2022.

In the days after, the market turned and traded lower, far more than expected. Notwithstanding, the remaining structures (both +1 x -2 and +2 x -5) performed well, though the 2×5’s Vegas briefly turned negative on the sharp selling yesterday, which, if it had remained like that, would have solicited action (i.e., repositioning, closure, or hedging via correlated instrument).

Graphic: Working orders on December 23, 2022.

At the end of the day, what’s important to your letter writer, here, is how the spread prices if the market moves to it today, all else (e.g., time, IVOL, etc) remains equal. If the spread prices at a better price to close at the money, that’s a quick check that says: “Hey, your bet on the market moving lower actually makes money if the market moves lower, all else equal.”

To explain further, look at the working orders above. At current S&P 500 levels, the +1 x -2 prices for $215.00 credit to close. The Delta is negative, as desired, and both the Gamma and Vega are positive. If the spread was at the money, it prices for nearly a $4,500.00 credit to close as shown below.

Graphic: Pricing an order on December 23, 2022.

So, what now? Well, the exposure is really light and much of the structure was monetized. From here, if the market moves lower that would likely be good for the remaining structures. Any costs to enter have been covered and, at this point, the trade is a free bet on the downside.

Obviously, there are pieces not included in this trade dissection, today, including how to properly manage your greek risk, as well as size the position at entry. These are the secret sauces, so to speak, that will either make or break you in the long run.

Should you want more write-ups like this, comment below. Your letter writer attempts to make these updates as informative and engaging as possible. It’s tough, at times, given the dullness of the material. Separately, trading is not as hard as it’s all made out to be. Sure, you need to have a good read on markets (e.g., skew), but, as your letter writer has learned over the many years he’s been engaging with markets, the theory is nothing like practice. No formula will help you price and enter the correct trade structure in a fast-moving meme stock with IVOL blowing out. 

If all could be automated, there would be no market. Markets are the product of human emotion. Avoid acting on theory, blindly. Price different structures, like the ones this letter has detailed, and observe how the different parts of the trade interact with each other as the market moves, IVOL moves, time passes, interest rates change, and so on.

For instance, you could have owned puts early in the week and still lost money as the market moved lower. If you would have leveraged a short leg against your long leg, then you could have offset the decay, as your letter writer did above.

There’s no substitute for time in the seat (e.g., you could have observed the -Vega at the entry on the trade structure above and not entered, missing out on the trade’s expansion. Time in the seat taught your letter writer better).

Don’t construe this letter’s simplicity as naivety, also. In the end, what’s your exposure to movement? If your bet is on movement, will you make money if the market moves? If not, find another trade structure or sit out.

Anyways, happy holidays to you and your closest. It’s been quite the year and I have a lot to be thankful for and reflect on. See you next week, most likely (though your letter writer’s burn-out may result in new publications being delayed until the new year).

Technical

As of 8:20 AM ET, Friday’s regular session (9:30 AM – 4:00 PM ET), in the S&P 500, is likely to open in the upper part of a positively skewed overnight inventory, inside of prior-range and -value, suggesting a limited potential for immediate directional opportunity.

Our S&P 500 pivot for today is $3,867.75. 

Key levels to the upside include $3,879.25, $3,893.75, and $3,908.25. 

Key levels to the downside include $3,833.00, $3,813.25, and $3,793.25.

Click here to load today’s key levels into the web-based TradingView platform. All levels are derived using the 65-minute timeframe. New links are produced, daily.

Graphic: 65-minute profile chart of the Micro E-mini S&P 500 Futures.

Definitions

Volume Areas: Markets will build on areas of high-volume (HVNodes). Should the market trend for long periods of time, it will be identified by low-volume areas (LVNodes). LVNodes denote directional conviction and ought to offer support on any test.

If participants auction and find acceptance in an area of a prior LVNode, then future discovery ought to be volatile and quick as participants look to HVNodes for favorable entry or exit.

POCs: Denote areas where two-sided trade was most prevalent in a prior day session. Participants will respond to future tests of value as they offer favorable entry and exit.

MCPOCs: Denote areas where two-sided trade was most prevalent over numerous sessions. Participants will respond to future tests of value as they offer favorable entry and exit.


About

In short, an economics graduate working in finance and journalism.

Capelj spends most of his time as the founder of Physik Invest through which he invests and publishes daily analyses to subscribers, some of whom represent well-known institutions.

Separately, Capelj is an equity options analyst at SpotGamma and an accredited journalist interviewing global leaders in business, government, and finance.

Past works include conversations with investor Kevin O’Leary, ARK Invest’s Catherine Wood, FTX’s Sam Bankman-Fried, Lithuania’s Minister of Economy and Innovation Aušrinė Armonaitė, former Cisco chairman and CEO John Chambers, and persons at the Clinton Global Initiative.

Contact

Direct queries to renato@physikinvest.com or Renato Capelj#8625 on Discord.

Calendar

You may view this letter’s content calendar at this link.

Disclaimer

Do not construe this newsletter as advice. All content is for informational purposes.