Categories
Commentary

Daily Brief For November 30, 2022

Physik Invest’s Daily Brief is read by thousands of subscribers. You, too, can join this community to learn about the fundamental and technical drivers of markets.

Graphic updated 7:20 AM ET. Sentiment Neutral if expected /ES open is inside of the prior day’s range. /ES levels are derived from the profile graphic at the bottom of this letter. Levels may have changed since initially quoted; click here for the latest levels. SqueezeMetrics Dark Pool Index (DIX) and Gamma (GEX) with the latter calculated based on where the prior day’s reading falls with respect to the MAX and MIN of all occurrences available. A higher DIX is bullish. At the same time, the lower the GEX, the more (expected) volatility. Click to learn the implications of volatility, direction, and moneyness. Breadth reflects a reading of the prior day’s NYSE Advance/Decline indicator. VIX reflects a current reading of the CBOE Volatility Index (INDEX: VIX) from 0-100.

Administrative

For the first time in a while, I am able to catch up to and focus more on active trading, hence the earlier letter, today. What a crazy past few months. Almost back to normal!

We will issue a content calendar, soon, revealing the dates letters are likely to be published and the content that may be covered.

That said, due to the writer’s travel commitments, from 12/6 to 12/9 and 12/12 to 12/16 there will be no commentaries. If any queries, or if you are local to New York City or Paris, ping renato@physikinvest.com or Renato Capelj#8625 on Discord.

Fundamental

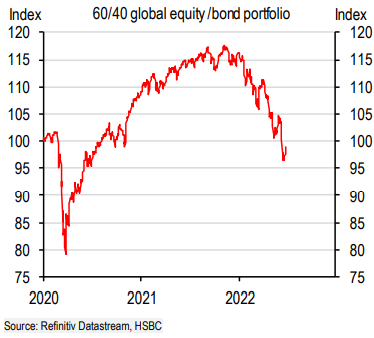
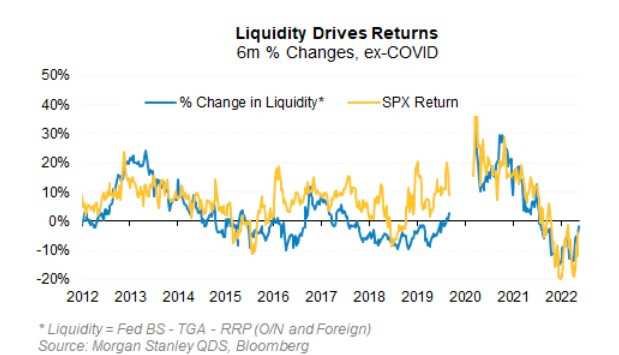
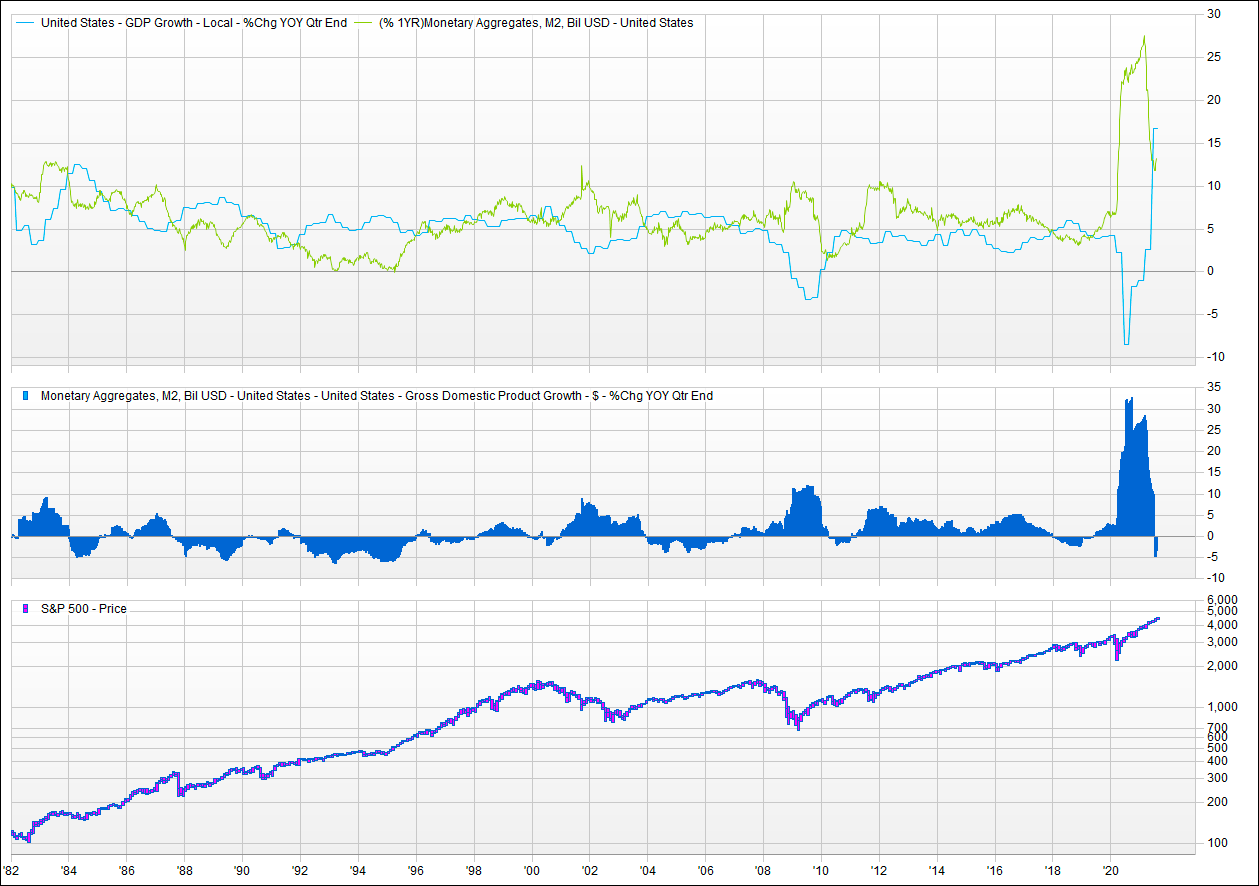
In many ways, the opposite of what happened to bolster a rally across risk assets like equities and crypto is happening, now. As unpacked in detail across letters including our Daily Brief for October 5, 2022, liquidity measures are in a near-lockstep fall with the S&P 500 (INDEX: SPX).

The correlation between so-called net liquidity described further below, and the S&P 500, over the past ten years is about 0.70 and explains more than half of the movement in price-earings multiples over the past decade.

Graphic: Retrieved from Bloomberg.

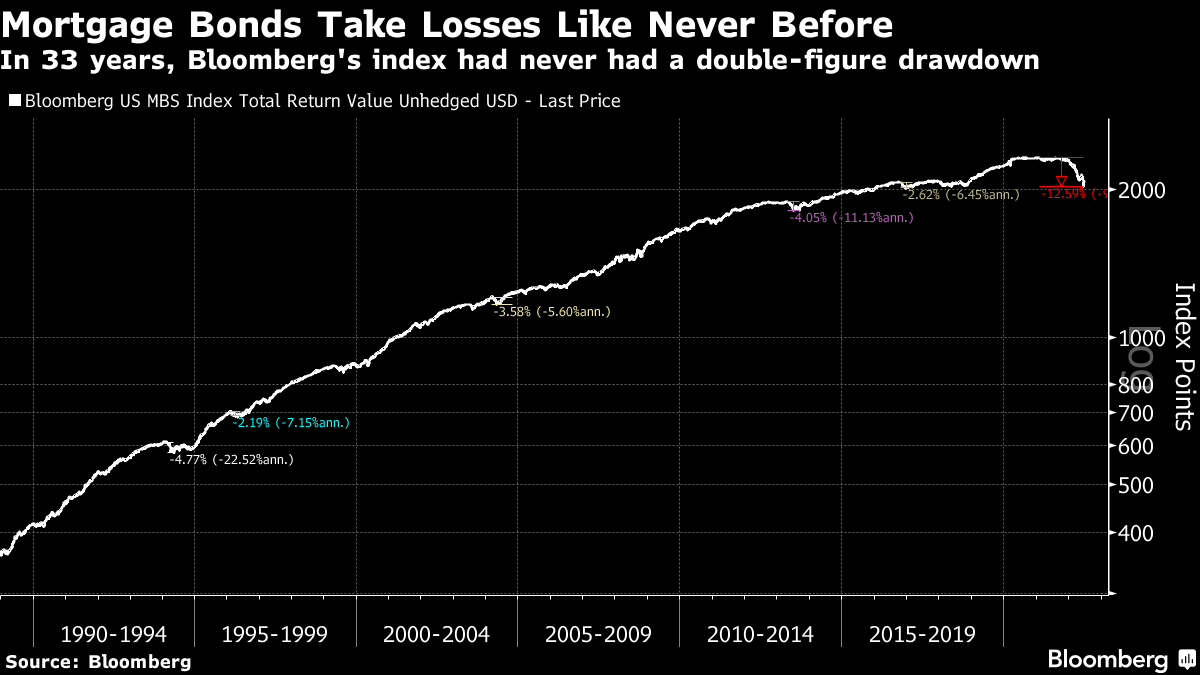
Detailed in previous letters was how processes like quantitative tightening manifest themselves as less demand for assets; per Fabian Wintersberger, central bankers must “recycle bonds into the markets on an unprecedented scale, which could easily lead to lower bond prices/higher yields” causing a “reflux of capital to safe-haven assets, like treasuries.”

Alfonso Peccatiello of The Macro Compass details more on the impact of more or less financial sector money in a post titled “All They Told You About Money Printing Is Really, Really Wrong.”

Adding, “the Fed has [only] reduced its holdings by 1.5% by letting bonds mature on its balance sheet. If they want to reduce the balance sheet back to the level of 2020, it needs to reduce it by 41%; … [therefore], [i]f history is any guide, the stock market has yet to face its most significant problems in such a scenario.”

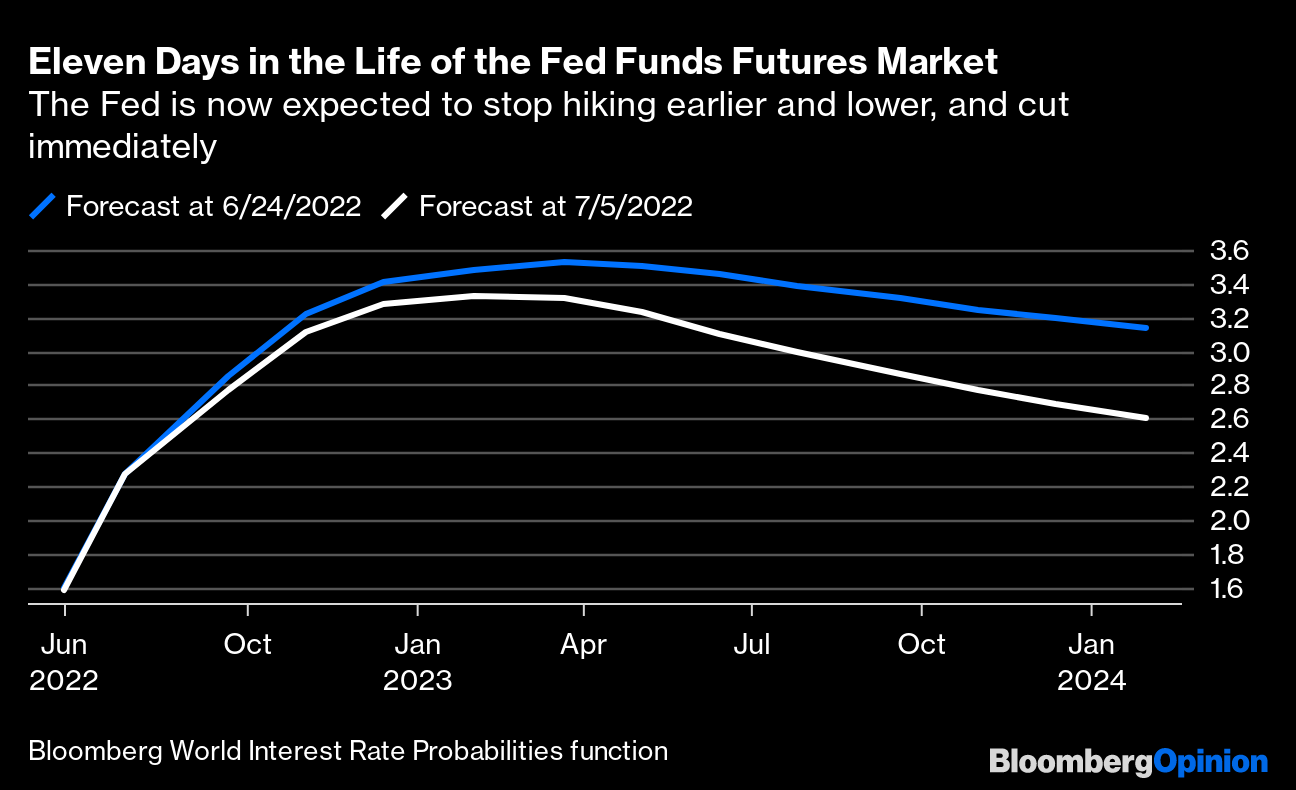
Morgan Stanley’s (NYSE: MS) trading team agrees, per a recent Bloomberg article on a looming bear case for the S&P 500.

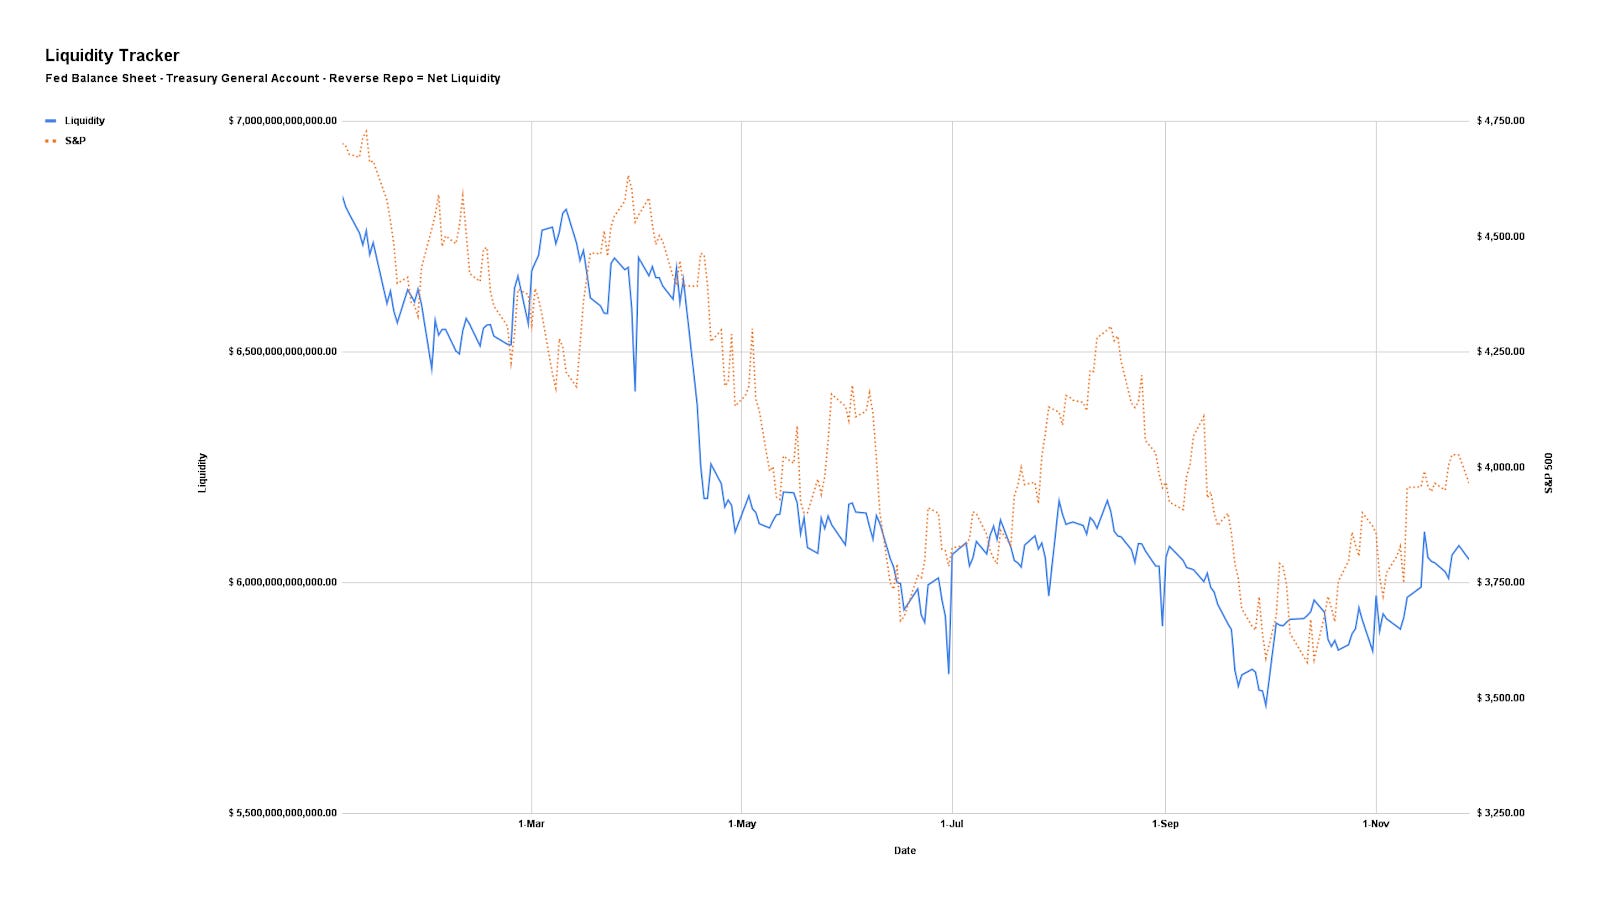
Though “rate increases get all the blame for this year’s bear market” and a projected “slowdown in the pace of rate hikes” helping “equities emerge from the yearlong bear, … the S&P 500 will drop as much as 15% by March, based on historic patterns and projected money flows,” which major inputs include “changes in the Fed’s balance sheet (BS); the Treasury General Account (TGA), or Treasury cash held at the central bank; and Reverse Repo Facilities (RRP), or cash parked at the Fed by money market funds and others.”

Graphic: Retrieved from Bloomberg. Inflation increases are easing.

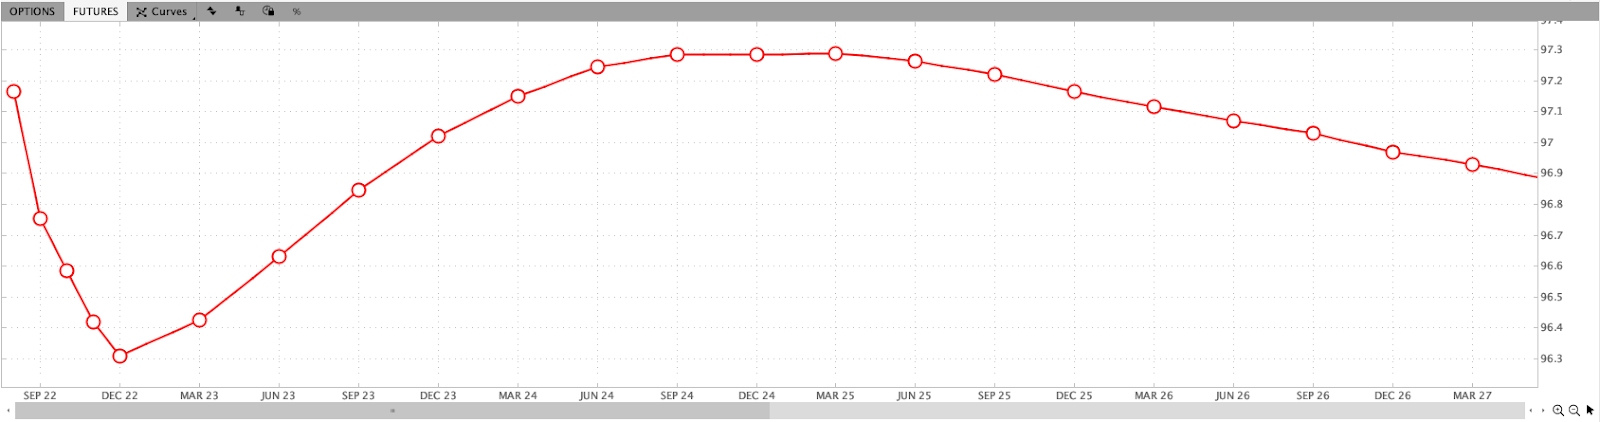
In other words, net liquidity is the Fed’s BS less TGA and RRP. See the below graphic.

Accordingly, “a rise in Fed’s balance sheet means an expansion in liquidity that bodes well for stocks, while an increase in TGA or RRP suggests a contraction in liquidity.” 

Based on the QT pace ($95 billion per month) and forecasts the Treasury cash balance will “rise by $200 billion into yearend, … [amounting] to a squeezing of liquidity that alone implies an 8% drop for the S&P 500 by the end of December.”

Graphic: Via Physik Invest. Data compiled by @jkonopas623. Fed Balance Sheet data, here. Treasury General Account Data, here. Reverse Repo data, here. NL = BS – TGA – RRP.

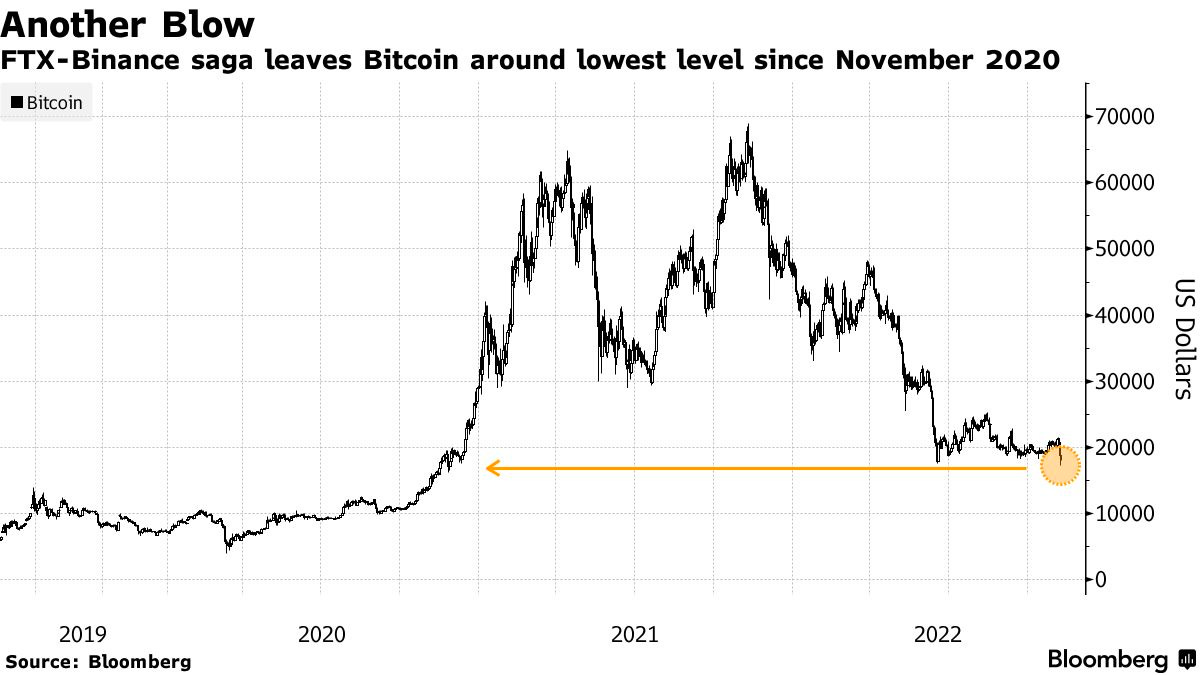
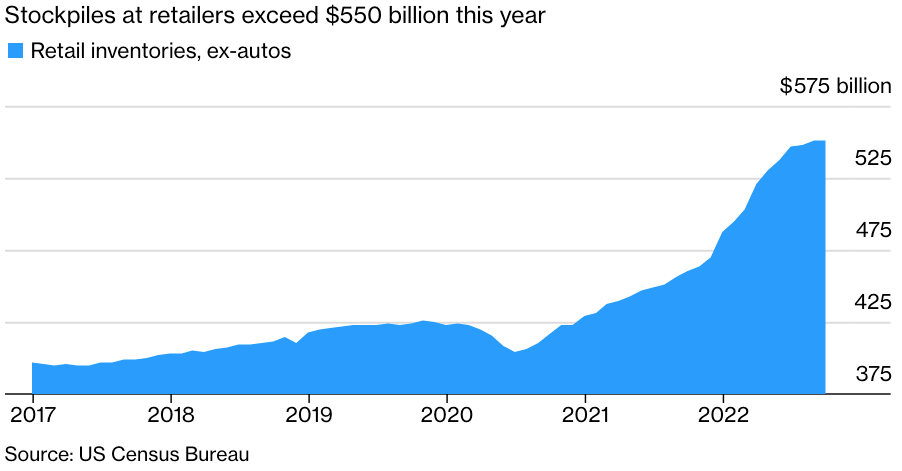
In summary, “there’s no longer enough money to finance [the] production of those goods and to support a stock market that’s still far from cheap.”

Graphic: Retrieved from VettaFi. “If the supply of money (in aggregate, M2) is higher than the demand for money (represented by nominal GDP), then there is “excess” liquidity that can and will find its way into asset prices.  Furthermore, if the growth of money supply exceeds the growth of GDP, that excess liquidity builds, and there is more of it to find its way into more asset prices.  In theory, the inverse would also hold true.  If the growth of GDP exceeds the growth of money supply, then excess liquidity is being consumed by the demand for money.  In this scenario, the real economy is feeding on liquidity that was once flowing into asset prices.”

Positioning

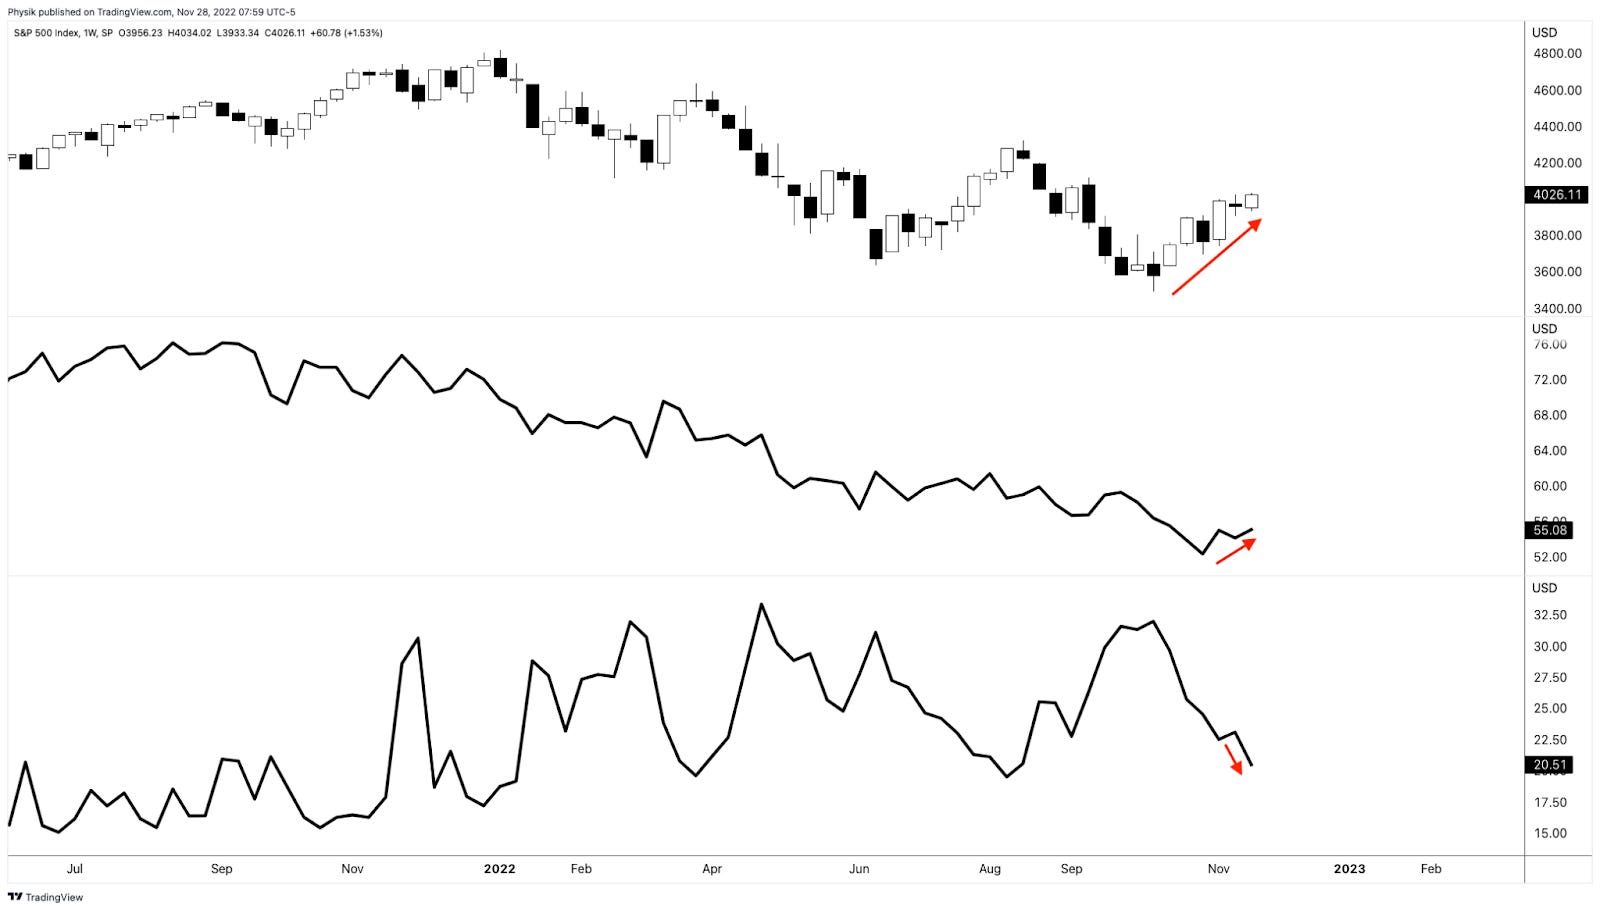
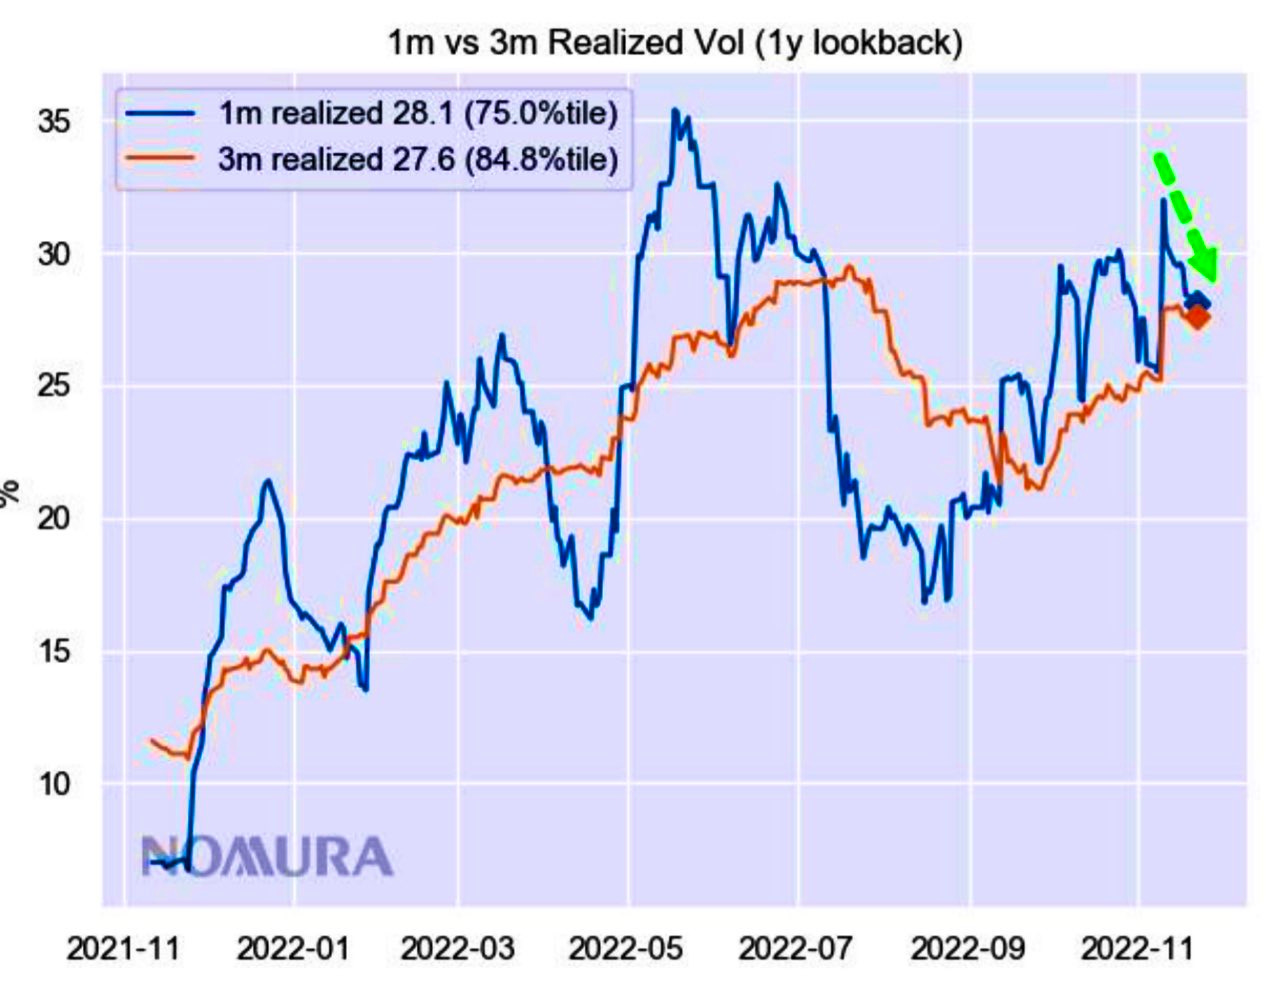
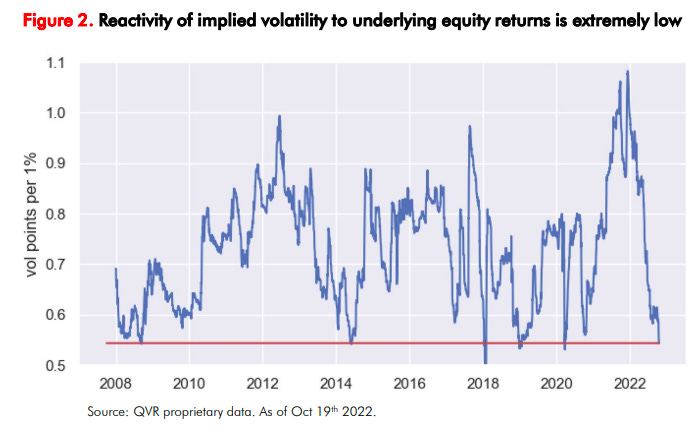
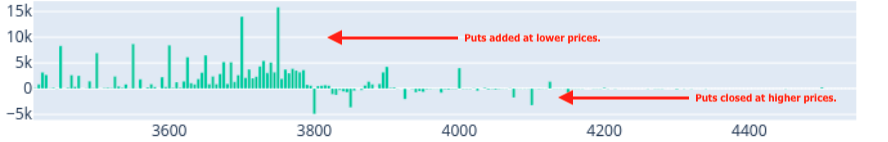
As we said earlier this week (November 29, 2022, and November 28, 2022), it’s not a terrible time to hedge, and selling volatility, blindly, on either side of the market, is not a great trade.

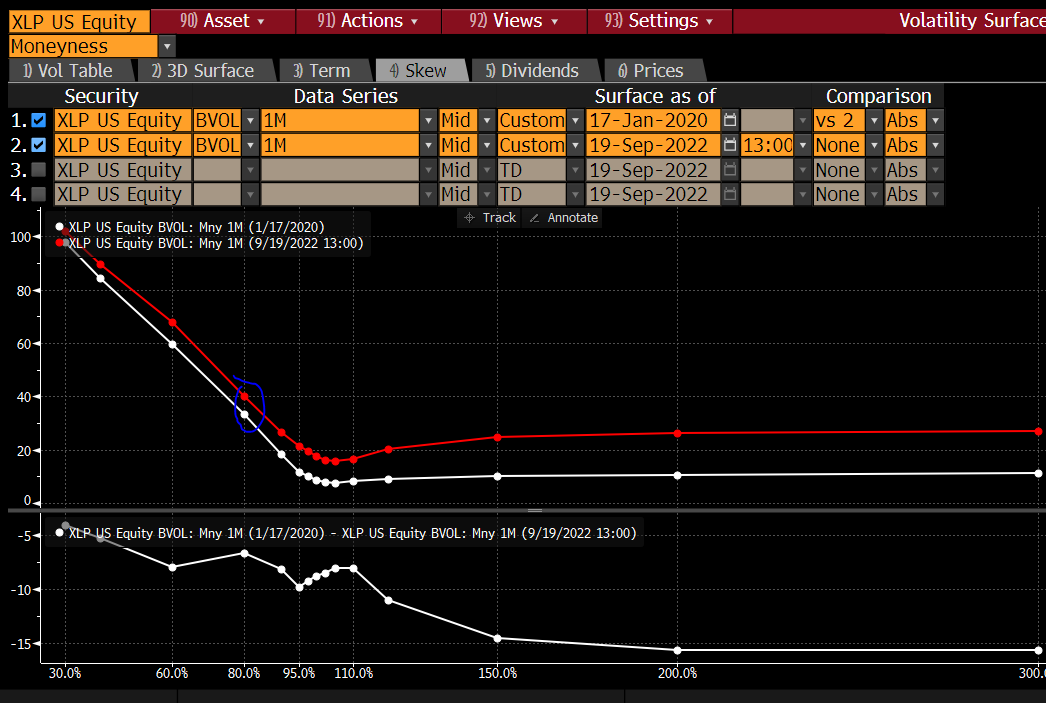
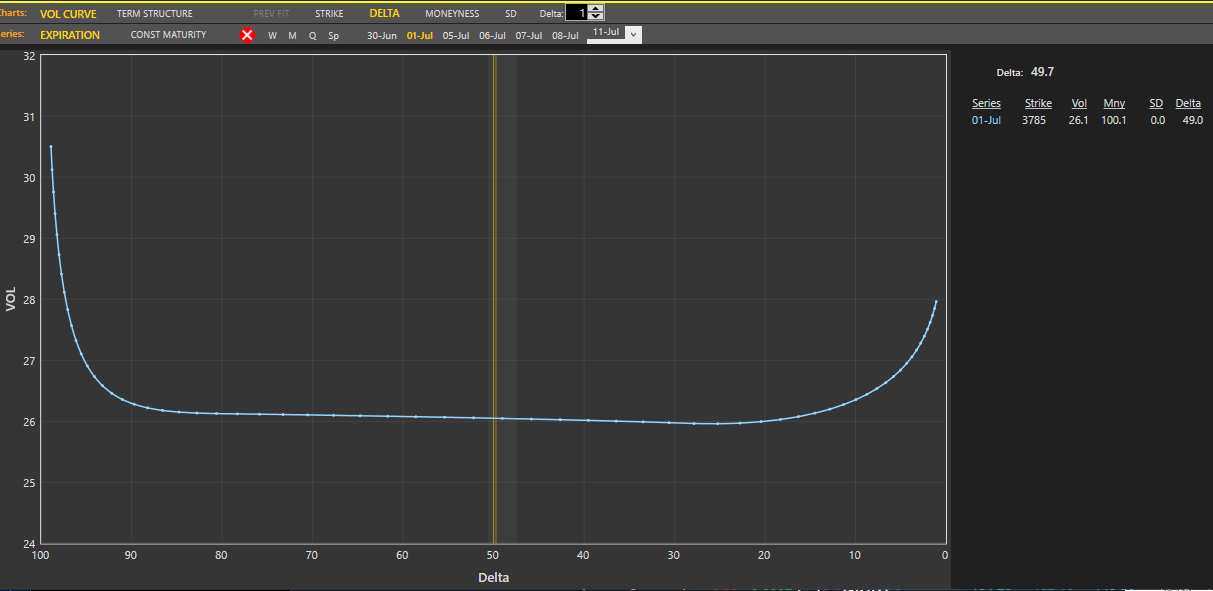
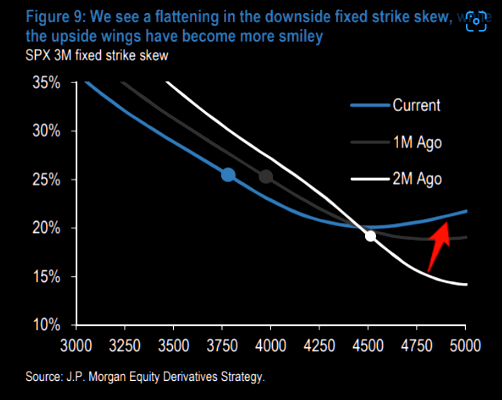
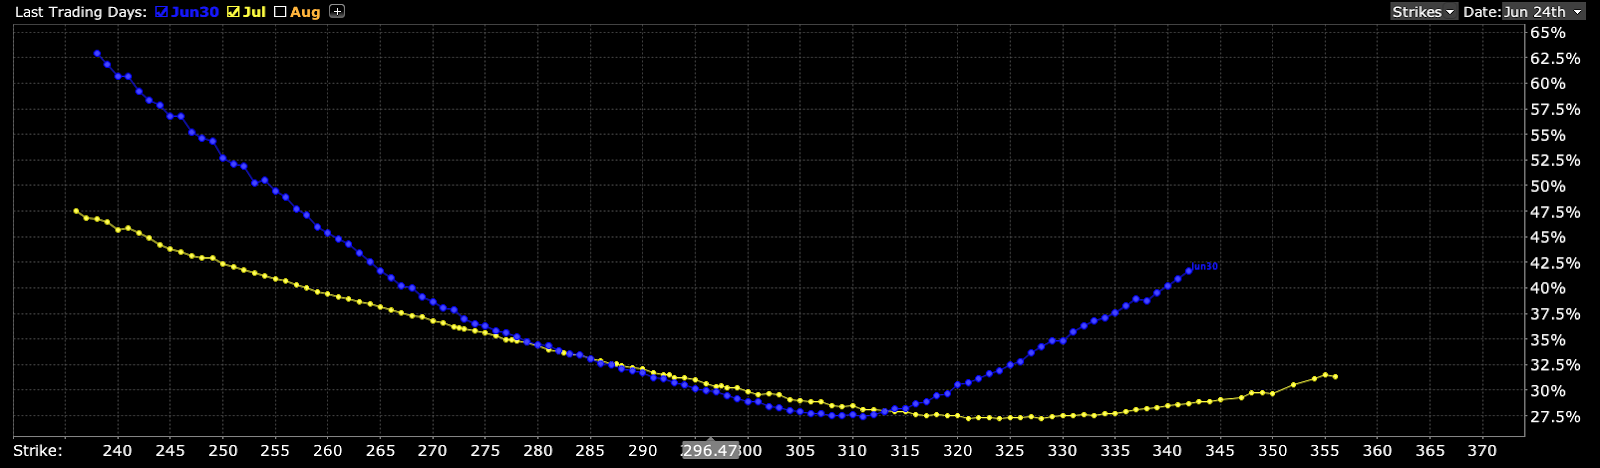
As SpotGamma put well, yesterday, implied volatility (IVOL) is at a low meaning “it makes sense to buy volatility and put on trades that make money if the market moves” but leverage the skew to sell “options to cut down the cost of waiting for that movement to happen.”

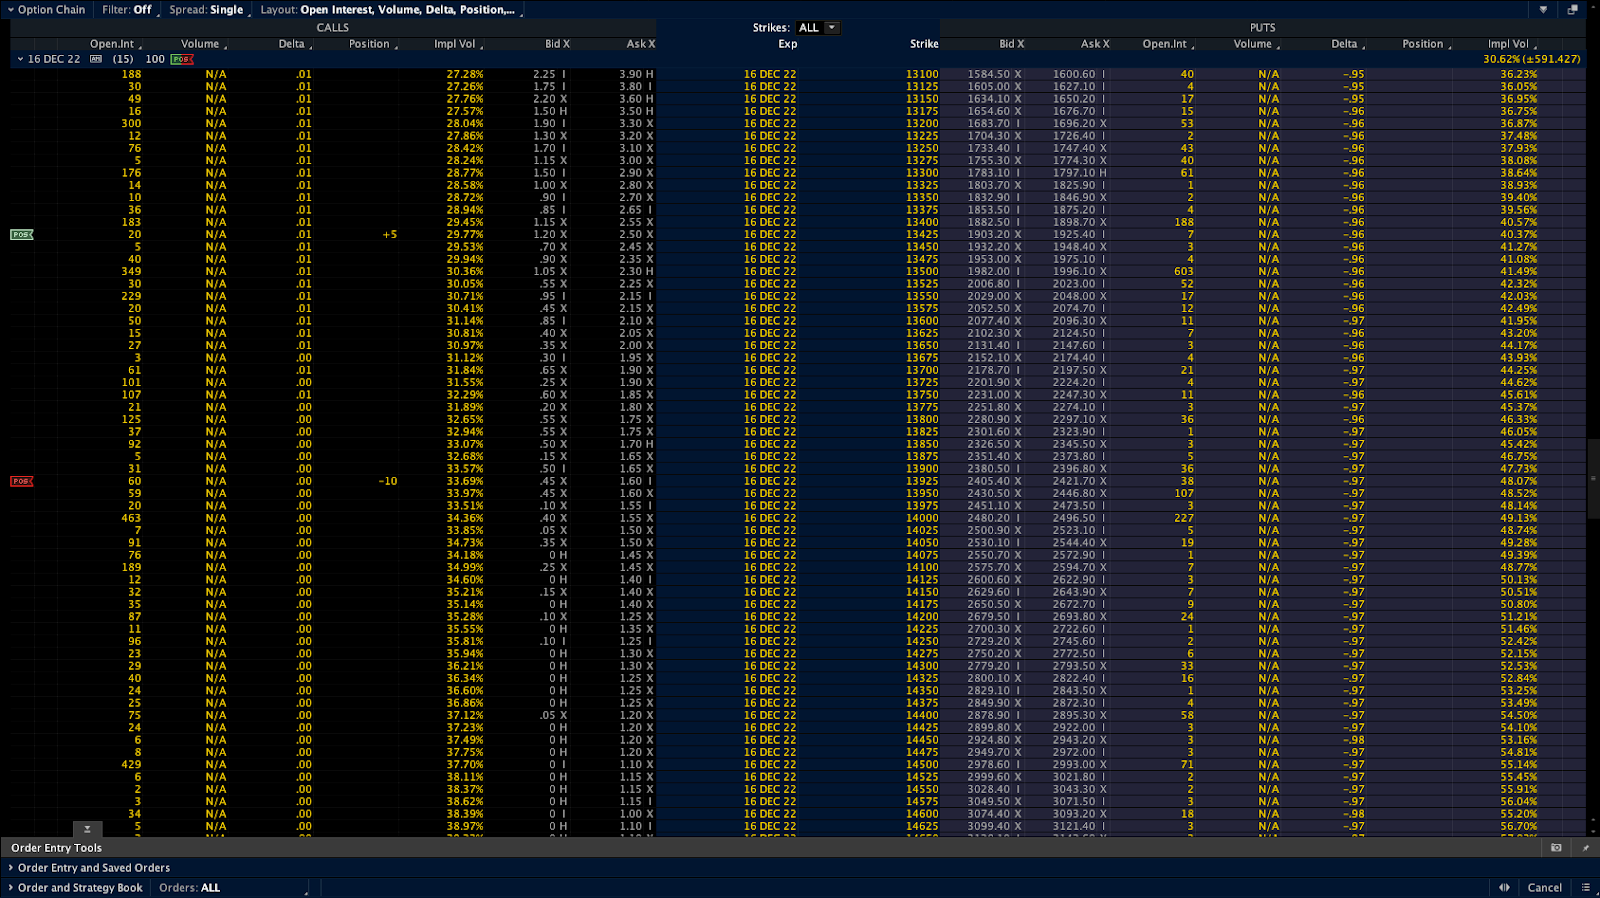
In our letter, yesterday, we highlighted Nasdaq 100 (INDEX: NDX) volatility skew and showed it was smile-shaped, rather than the typical smirk-shaped reverse pattern, making for some great trades to the upside. Through steeper call volatility skew – a result of traders positioning for an upside move – we can use the richness of further away calls to reduce the cost of our bets on the market upside.

Graphic: Updated 11/28/2022. Retrieved from Interactive Brokers (NASDAQ: IBKR). Nasdaq 100 (INDEX: NDX) volatility skew resembles the so-called smile.

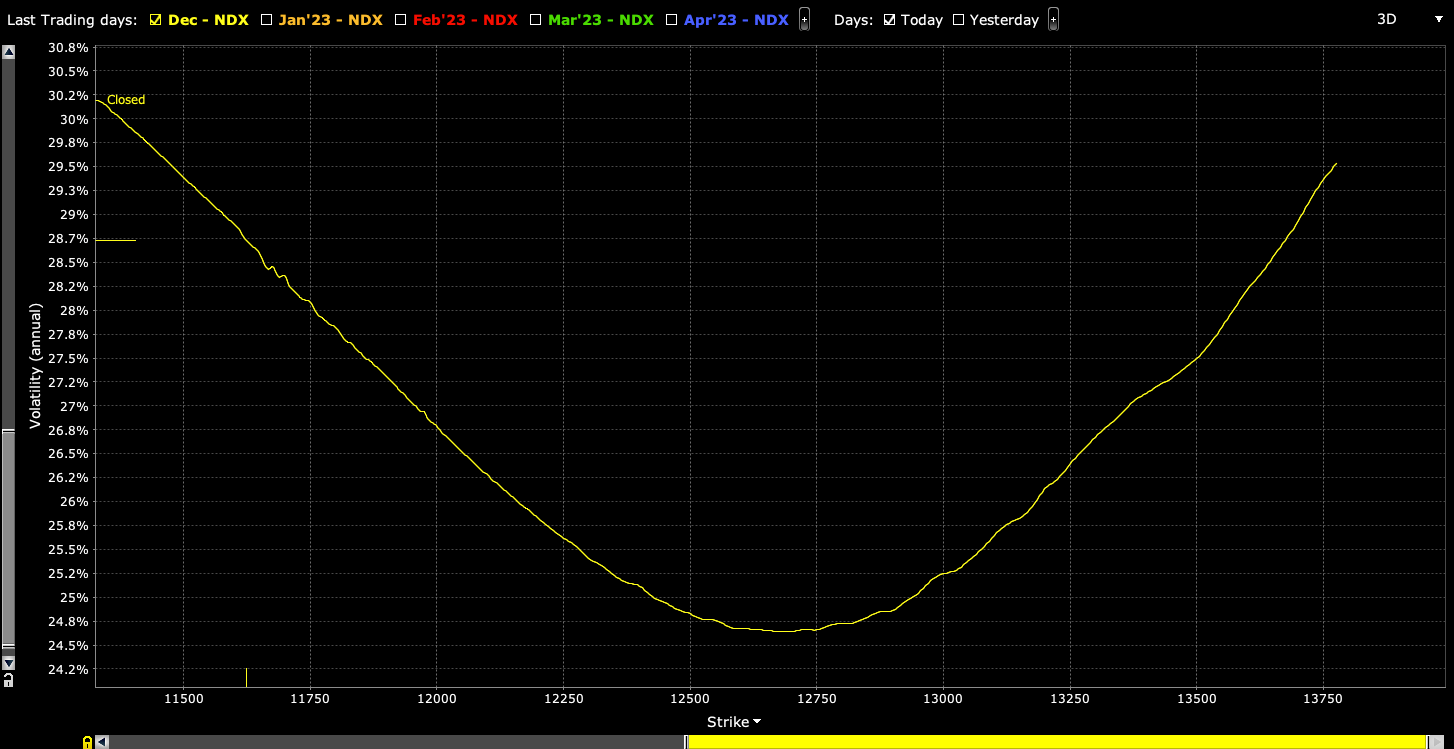
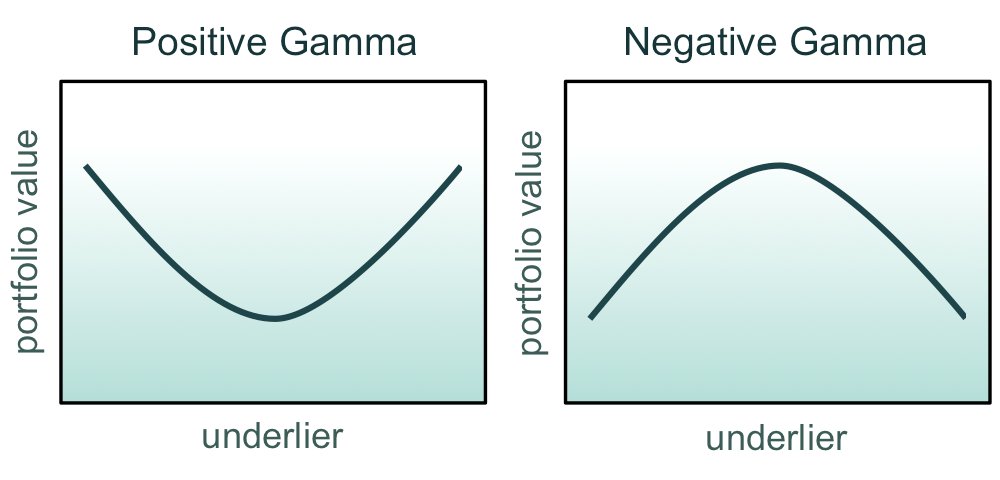
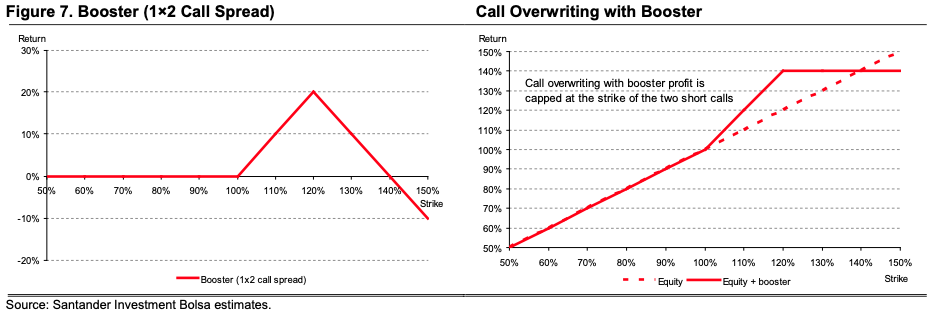
For instance, low-cost 500-1000 points wide call ratio spreads (buy the closer leg, sell two of the farther legs) expiring in fifteen days may work well (e.g., SELL -1 1/2 BACKRATIO NDX 100 16 DEC 22 [AM] 13425/13925 CALL @.20 CR LMT). The immediate concern with these strategies is your exposure to Delta (i.e., direction) and Gamma (i.e., does movement make you money).

The required reading is Dynamic Hedging: Managing Vanilla and Exotic Options!

Graphic: Retrieved from the Charles Schwab Corporation-owned (NYSE: SCHW) thinkorswim platform. Nasdaq 100 options prices.

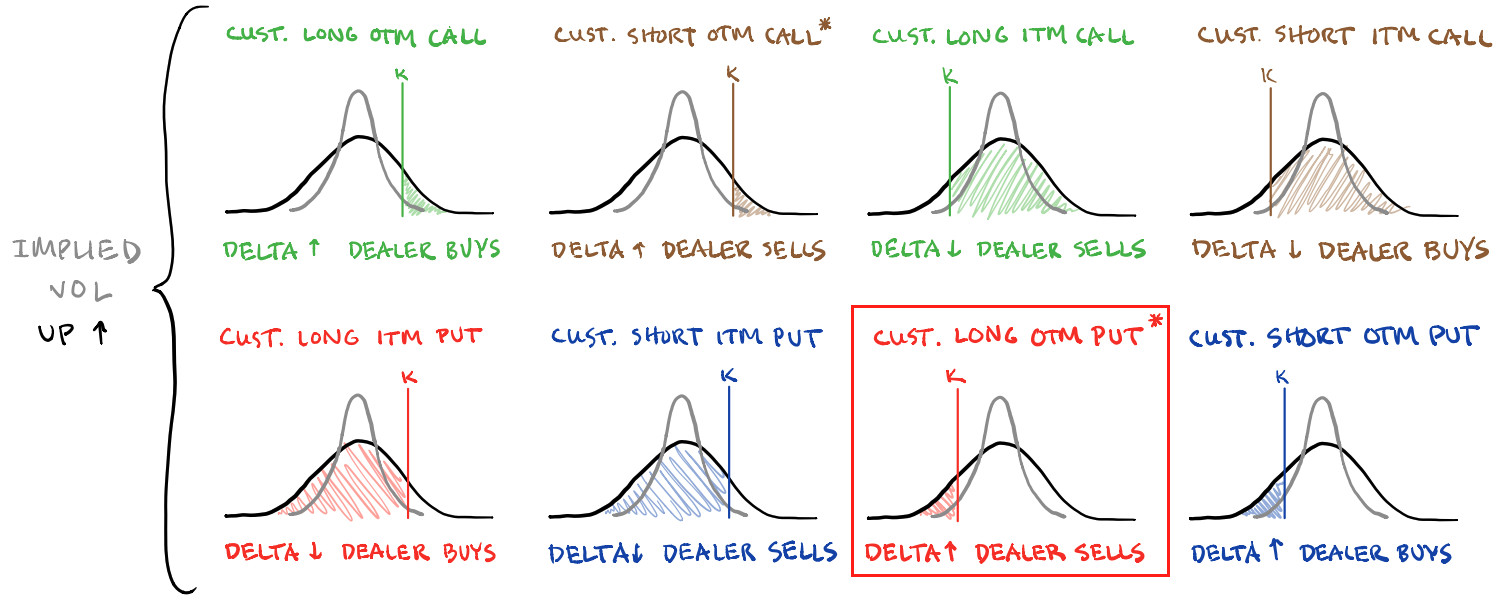
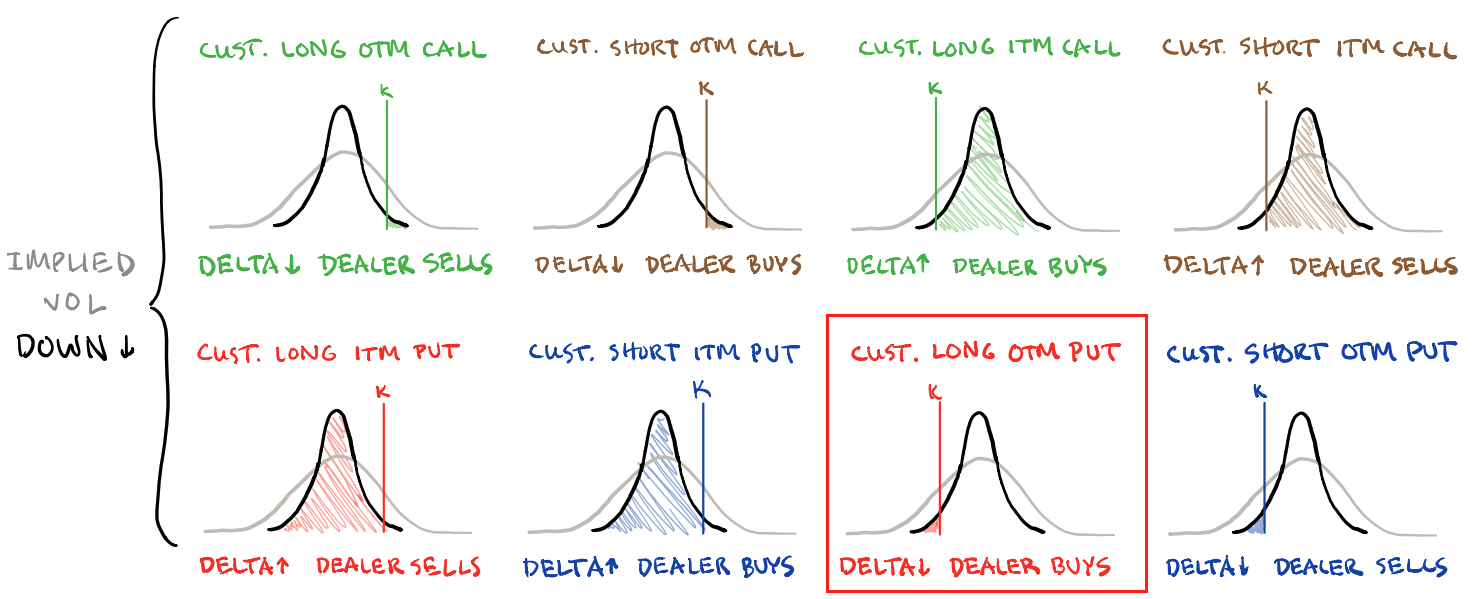
If you are exposed to +Delta and +Gamma, your trade makes money in an increasing way as the market rises, barring any other changes (e.g., passage of time, increases in volatility, etc).

If you are exposed to -Delta and -Gamma, your trade loses money in an increasing way as the market rises, barring any other changes. Should the movement happen quickly, and volatility rise, which is not likely, then that worsens the situation. 

The required reading is Dynamic Hedging: Managing Vanilla and Exotic Options!

This is not advice but a framework for how to act on the theory we talk about on a daily basis. In short, don’t sell calls and puts blindly. Adding, the above trade may not provide safe exposure to the market upside or downside. Given the sideways trade and contraction in ranges, we aim to be well-positioned for a move from low to high volatility. Stay safe and watch your risk.

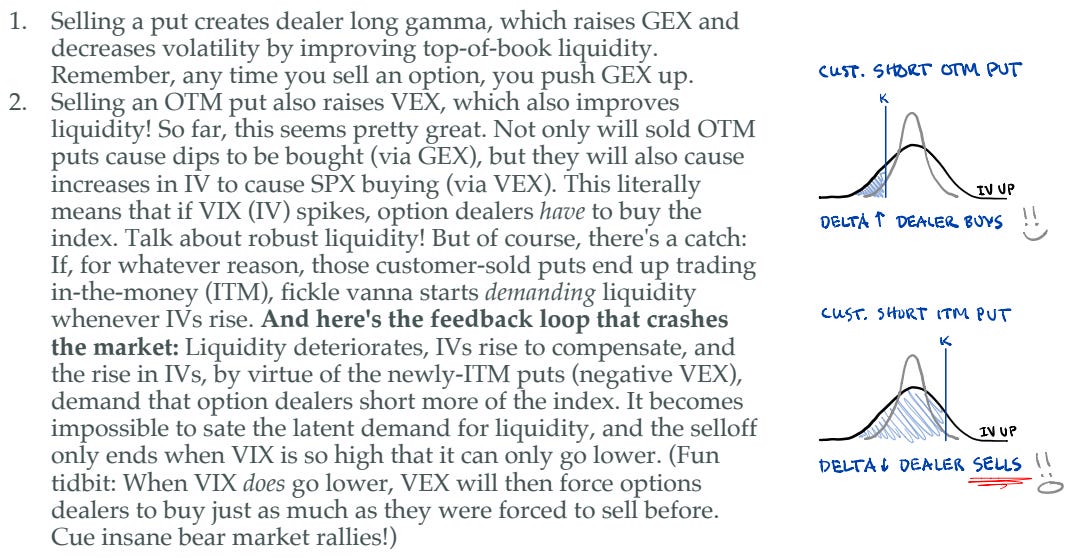
Noting, should you sell IVOL, the market trade lower, and the demand for IVOL rises, you may be left in an awkward position; big market drops statistically add to the likelihood of more drops.

Read The Second Leg Down: Strategies for Profiting after a Market Sell-Off!

Graphic: Retrieved from SqueezeMetrics.

Technical

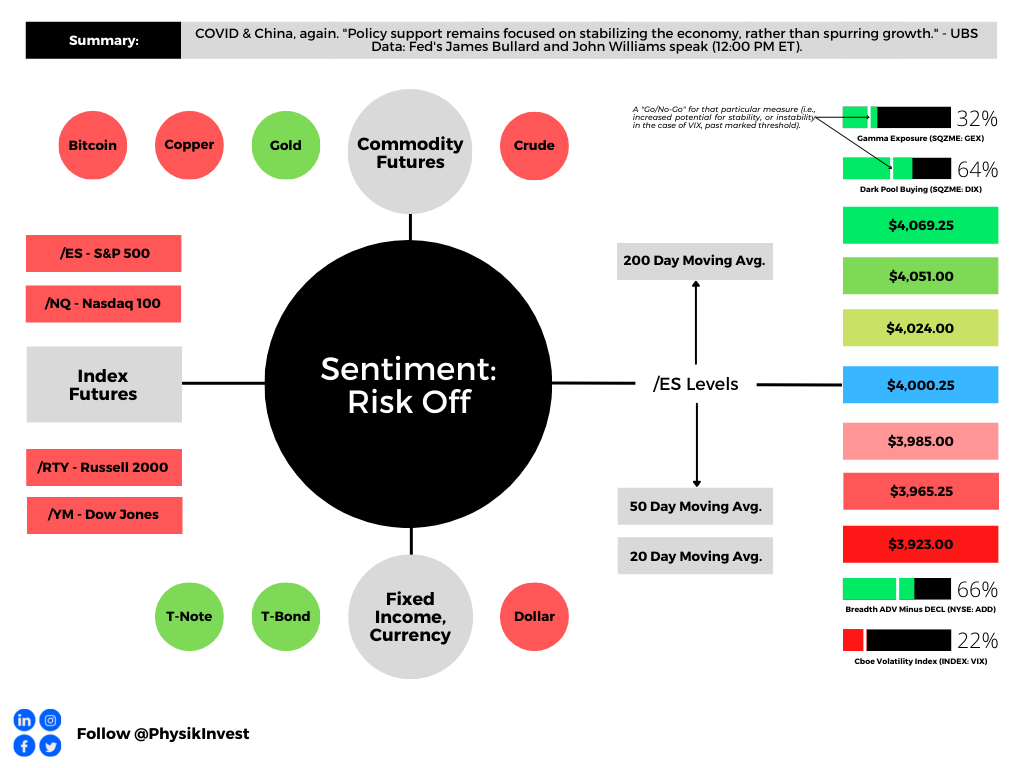
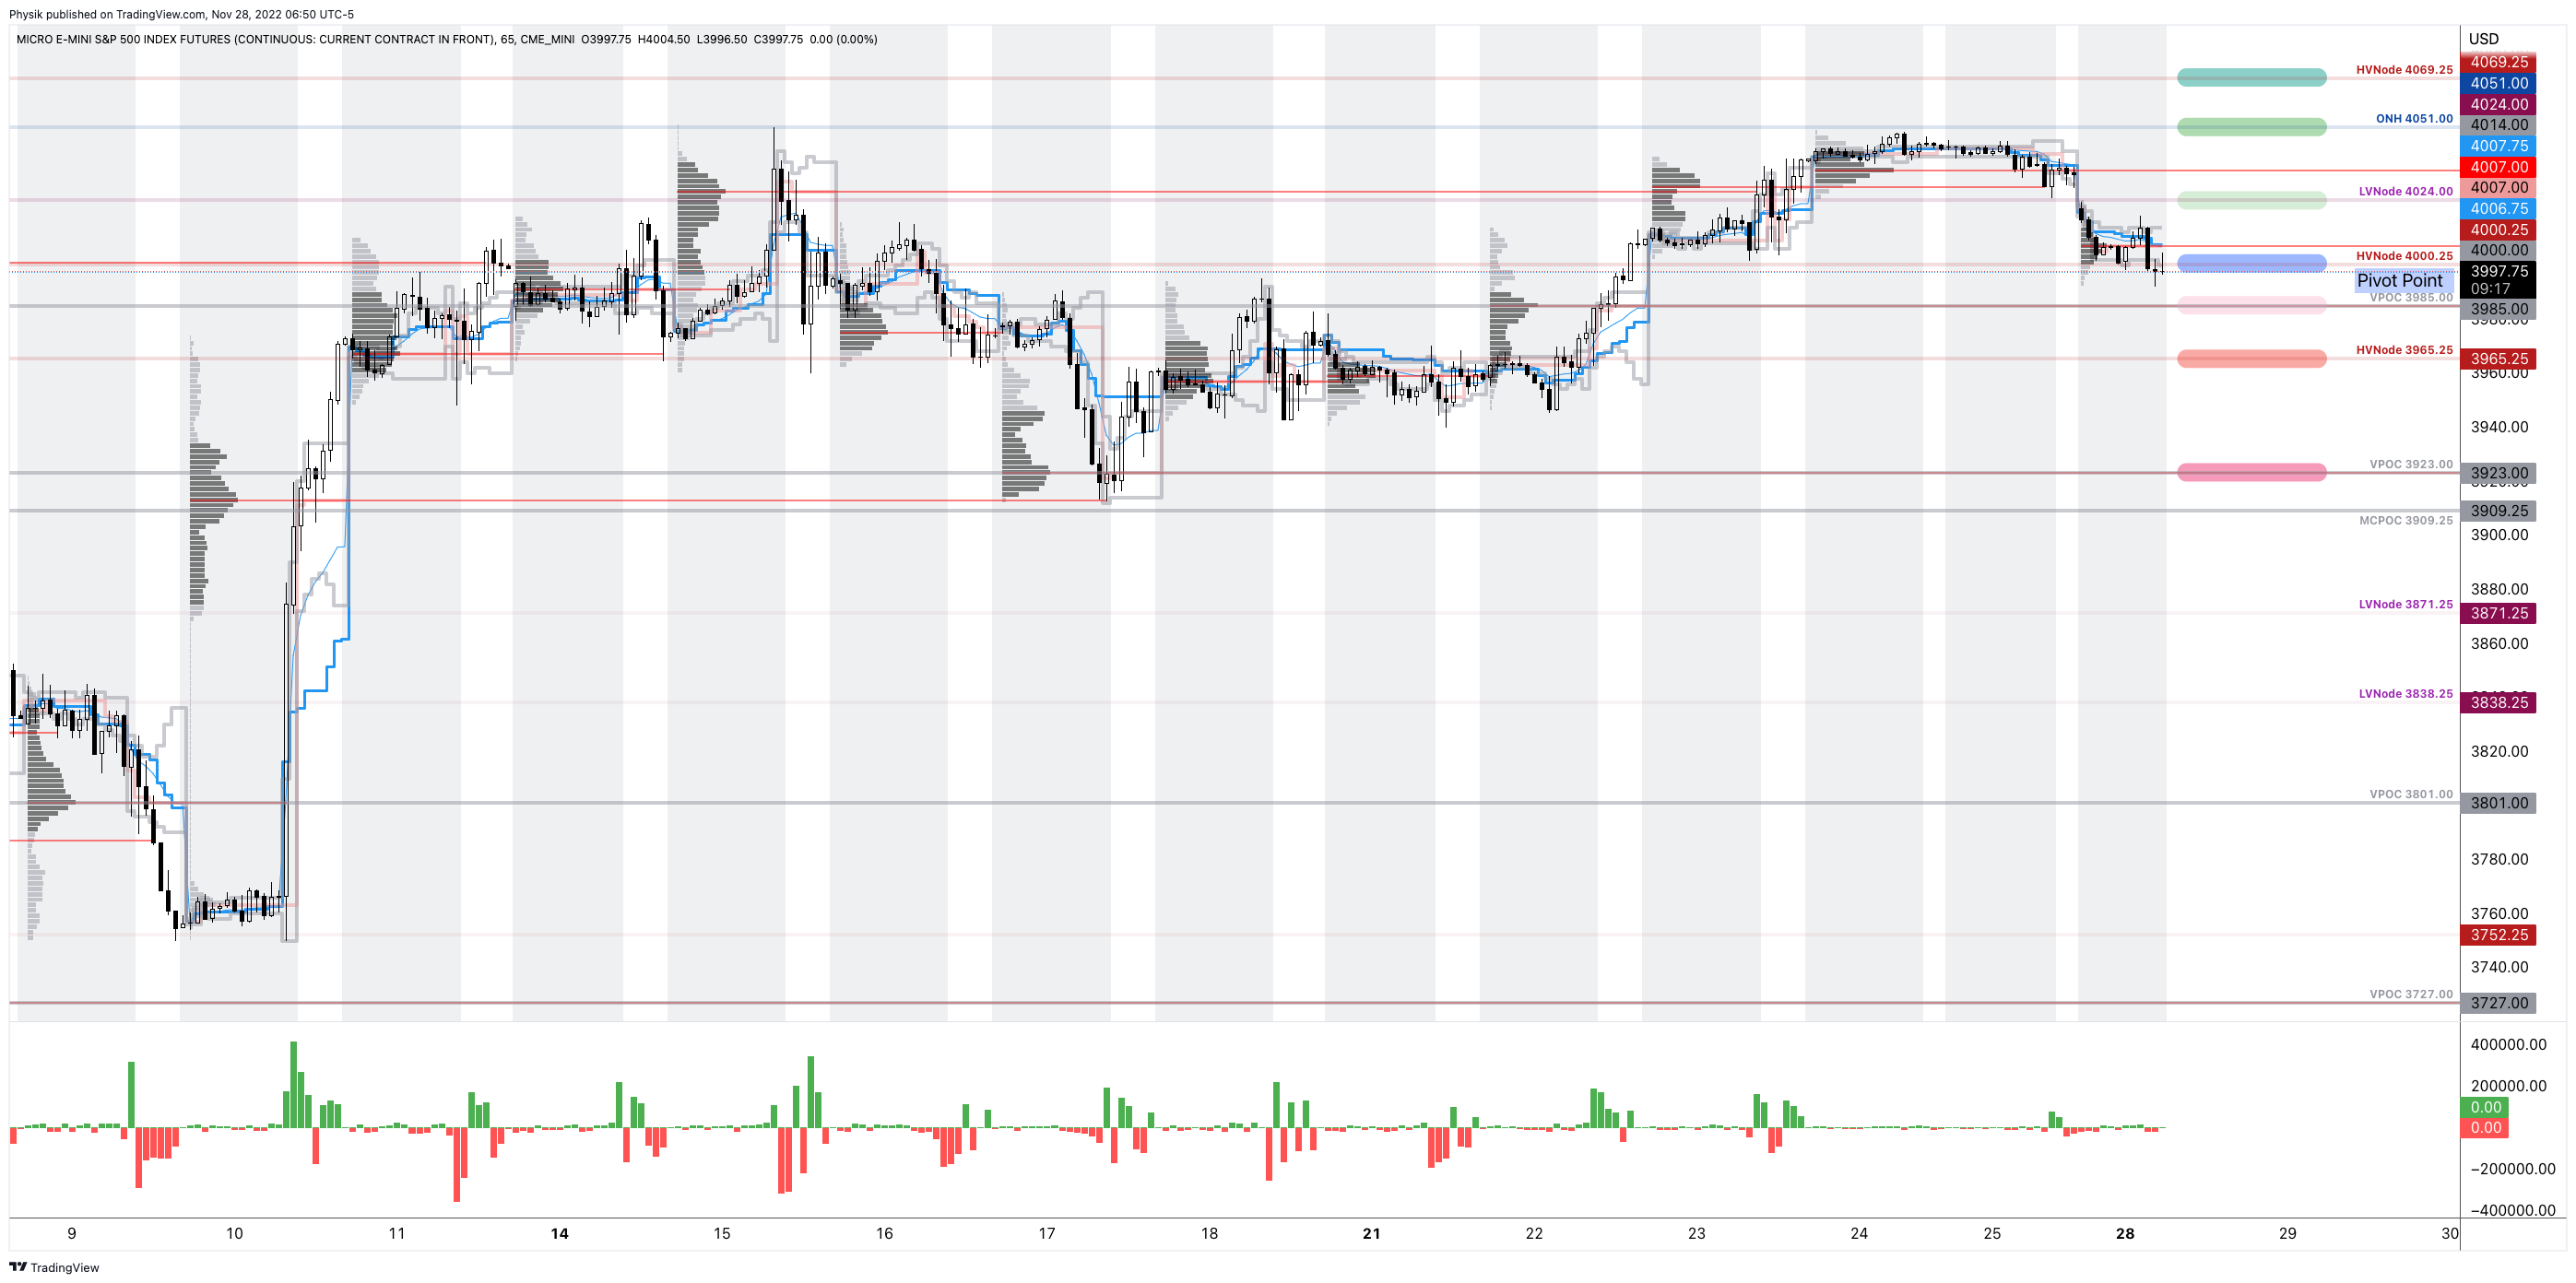
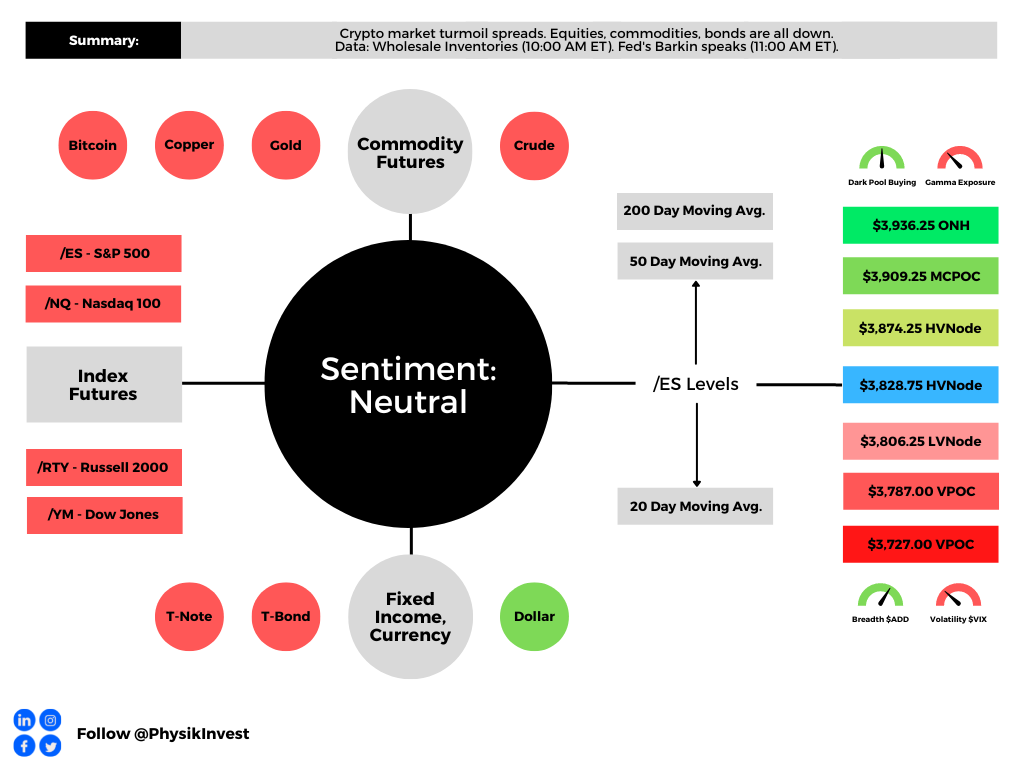
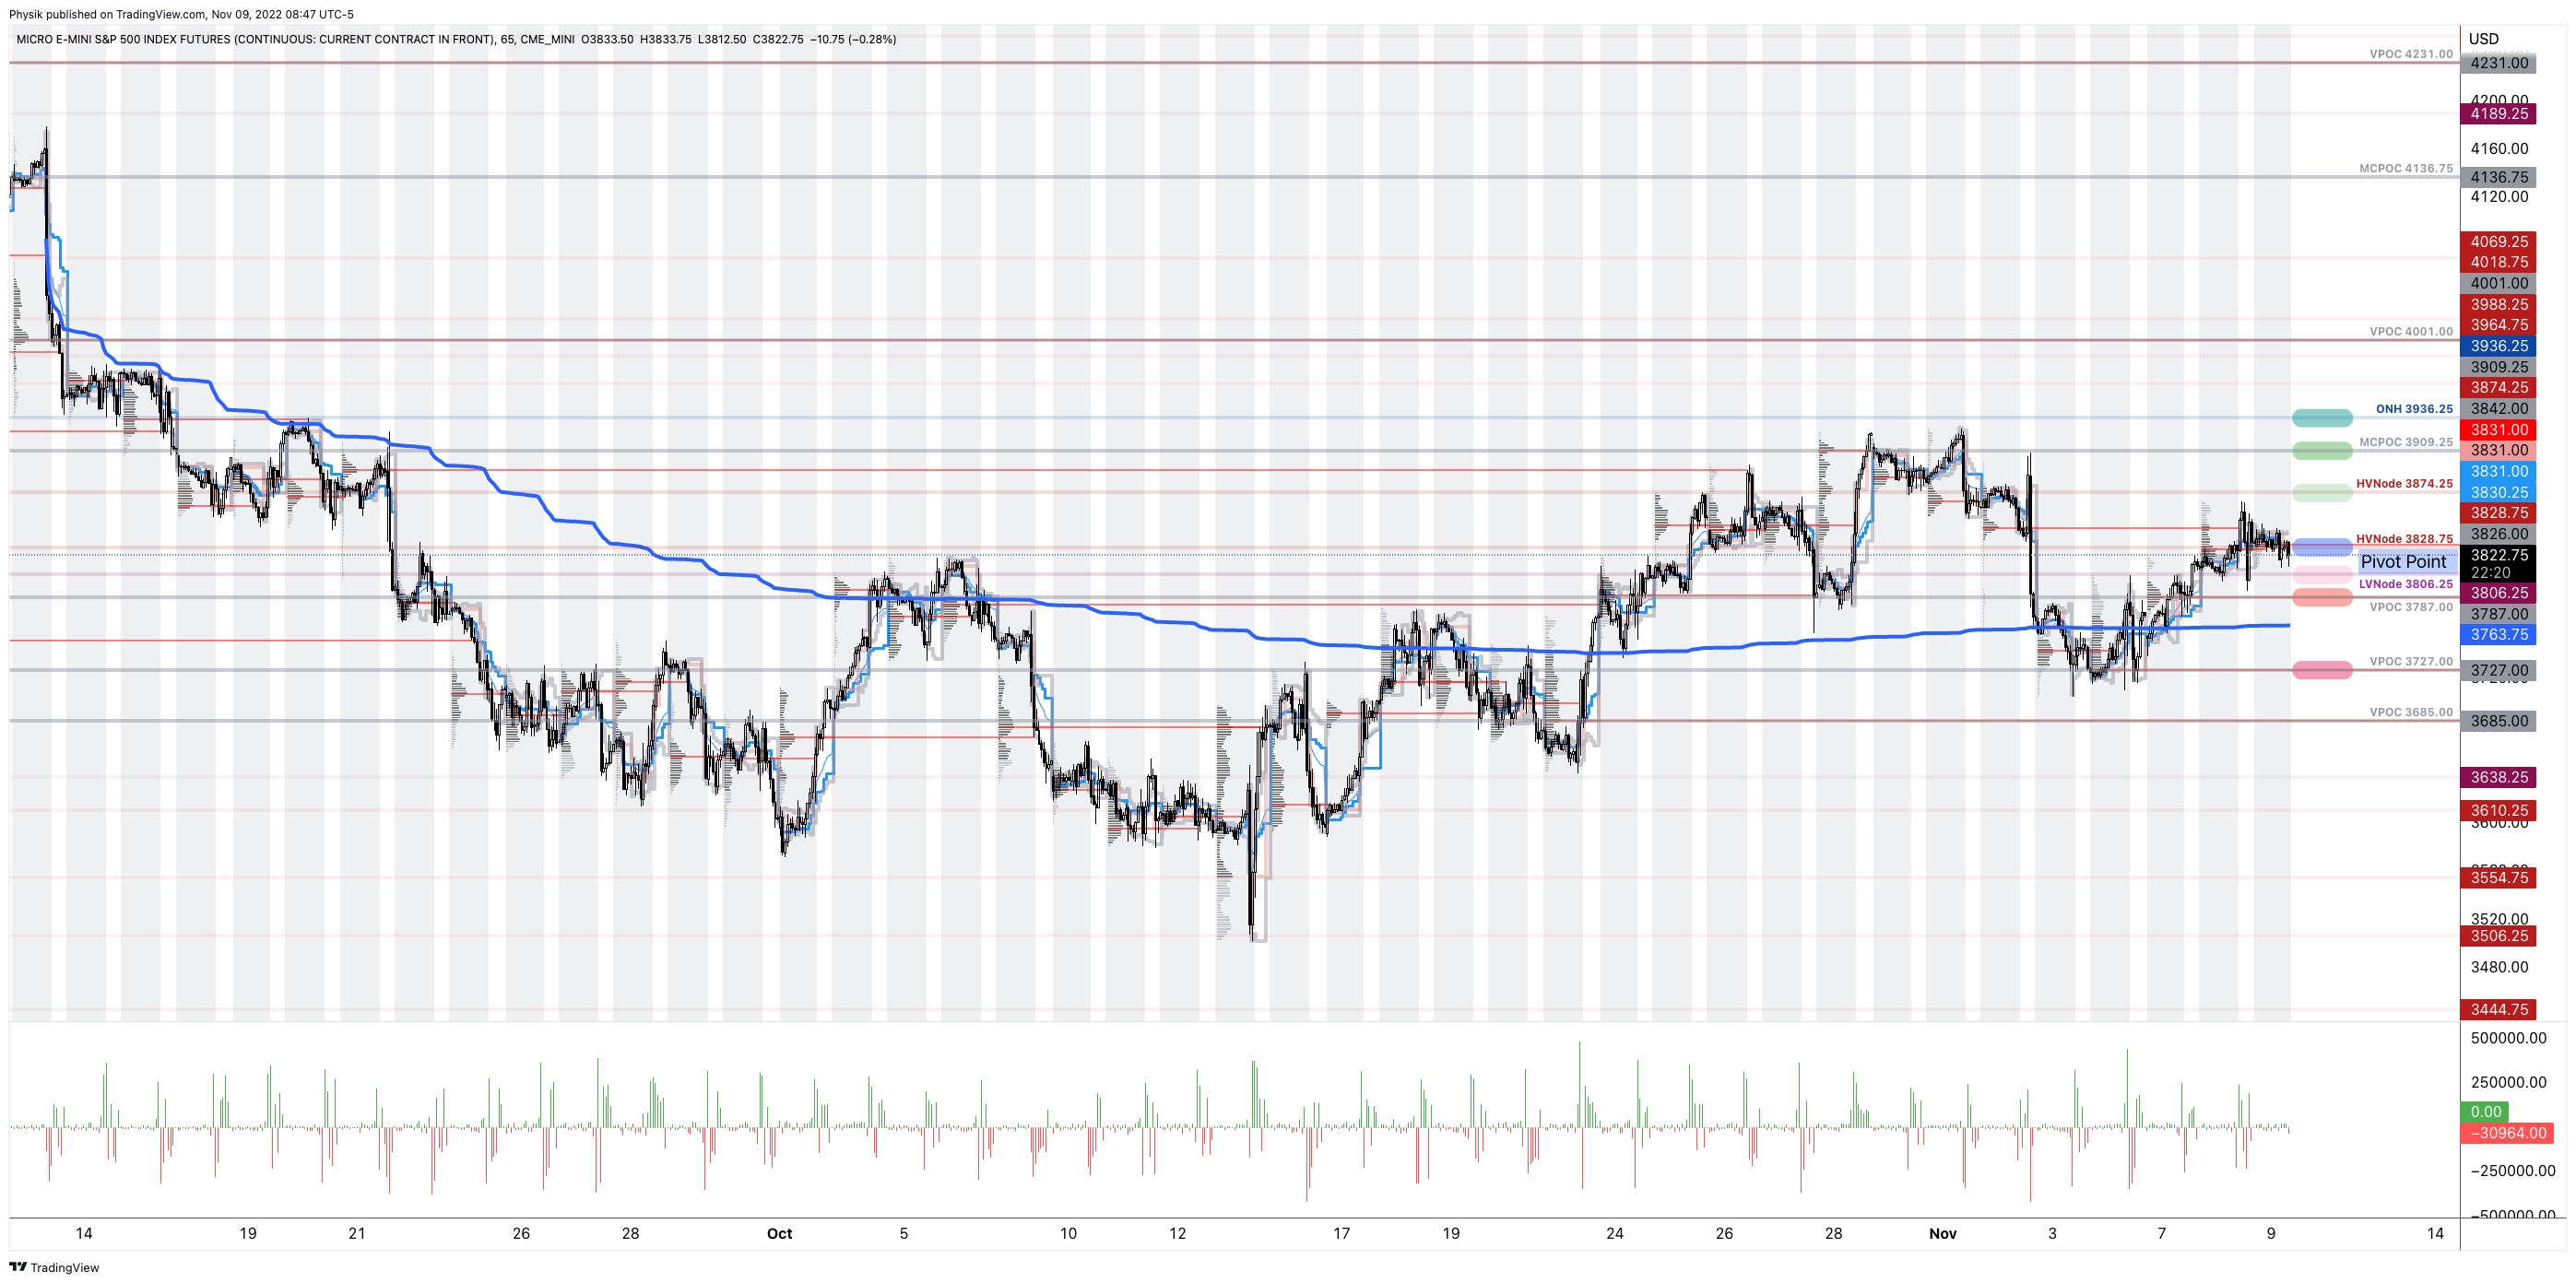
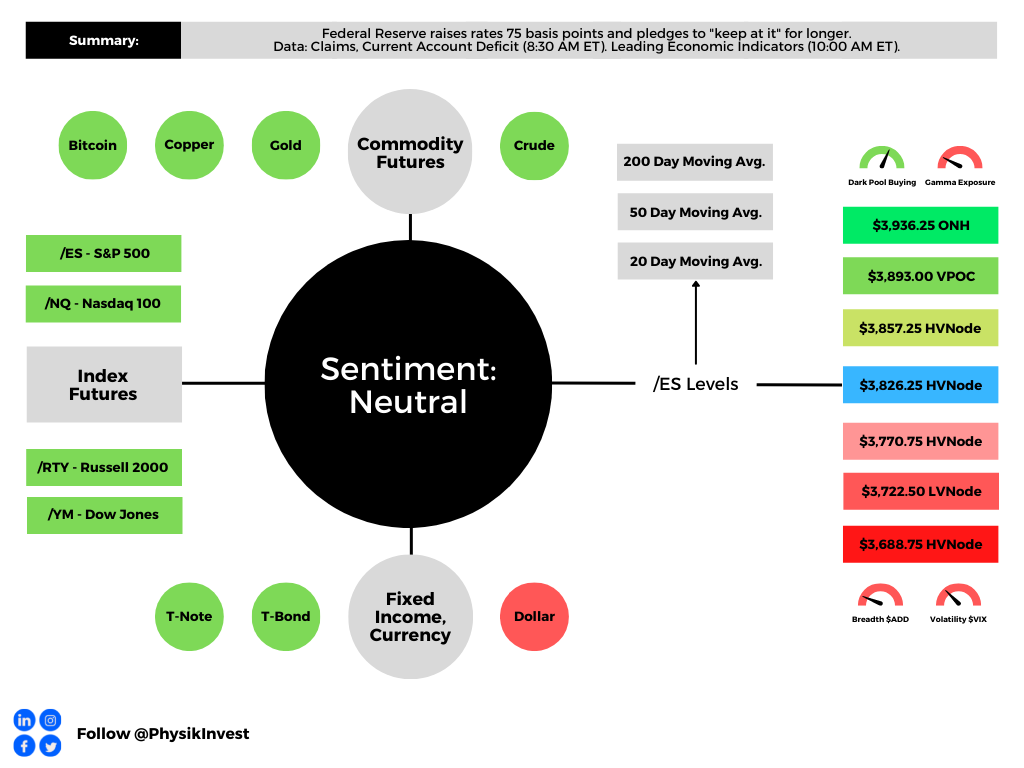
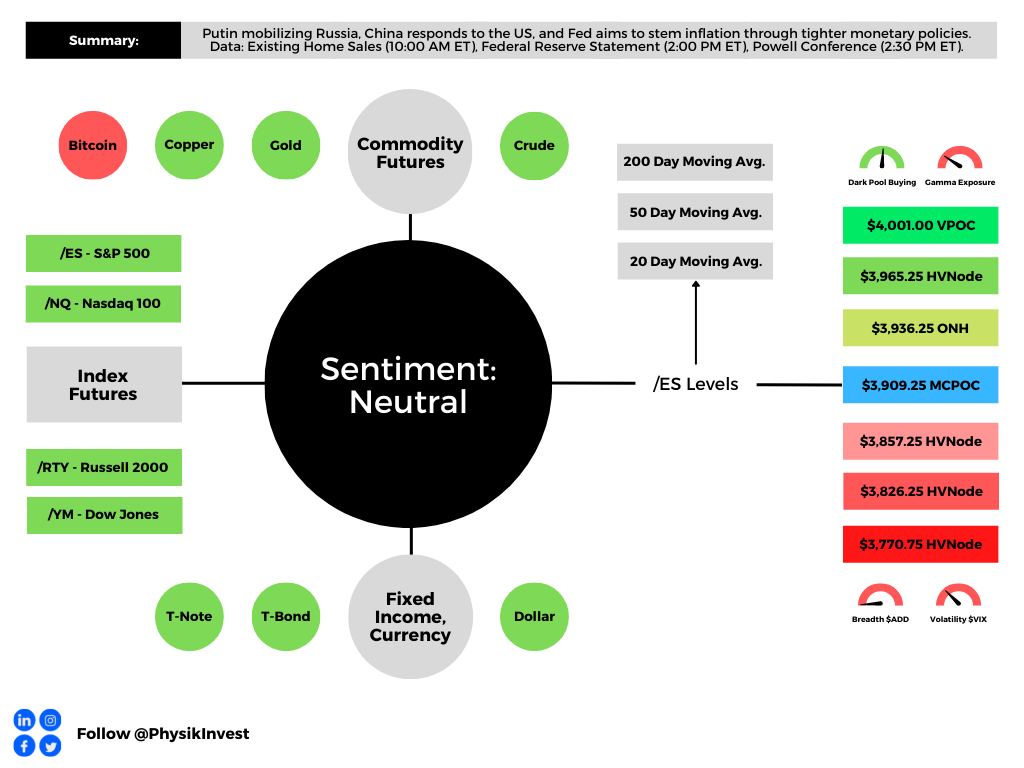
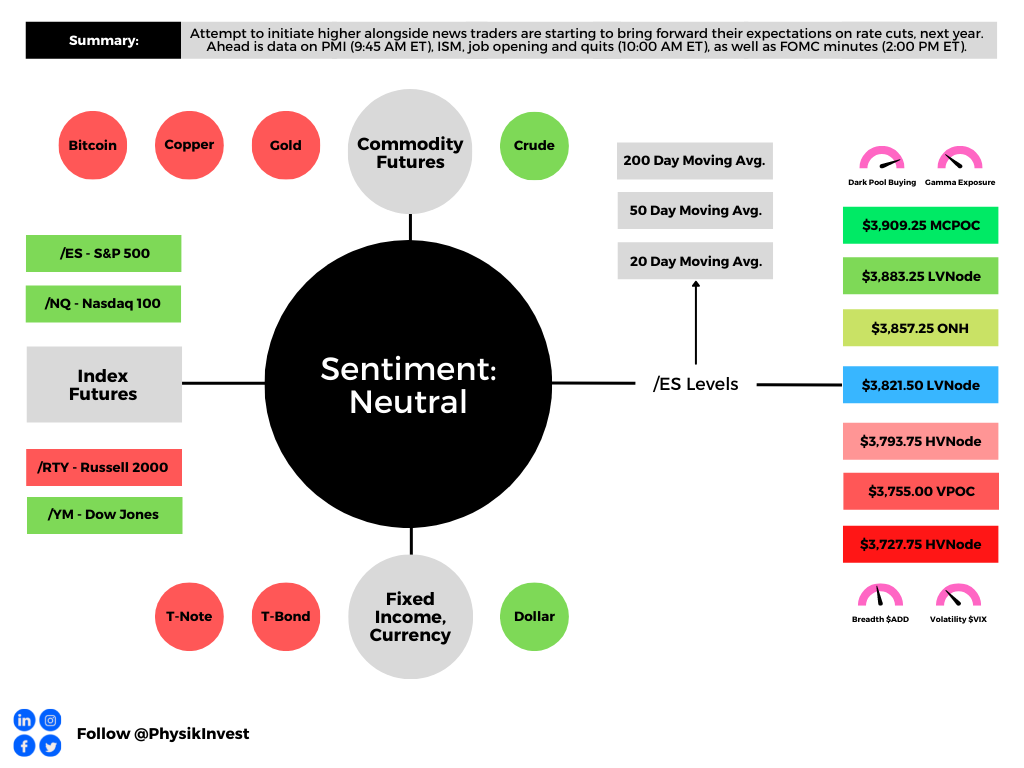
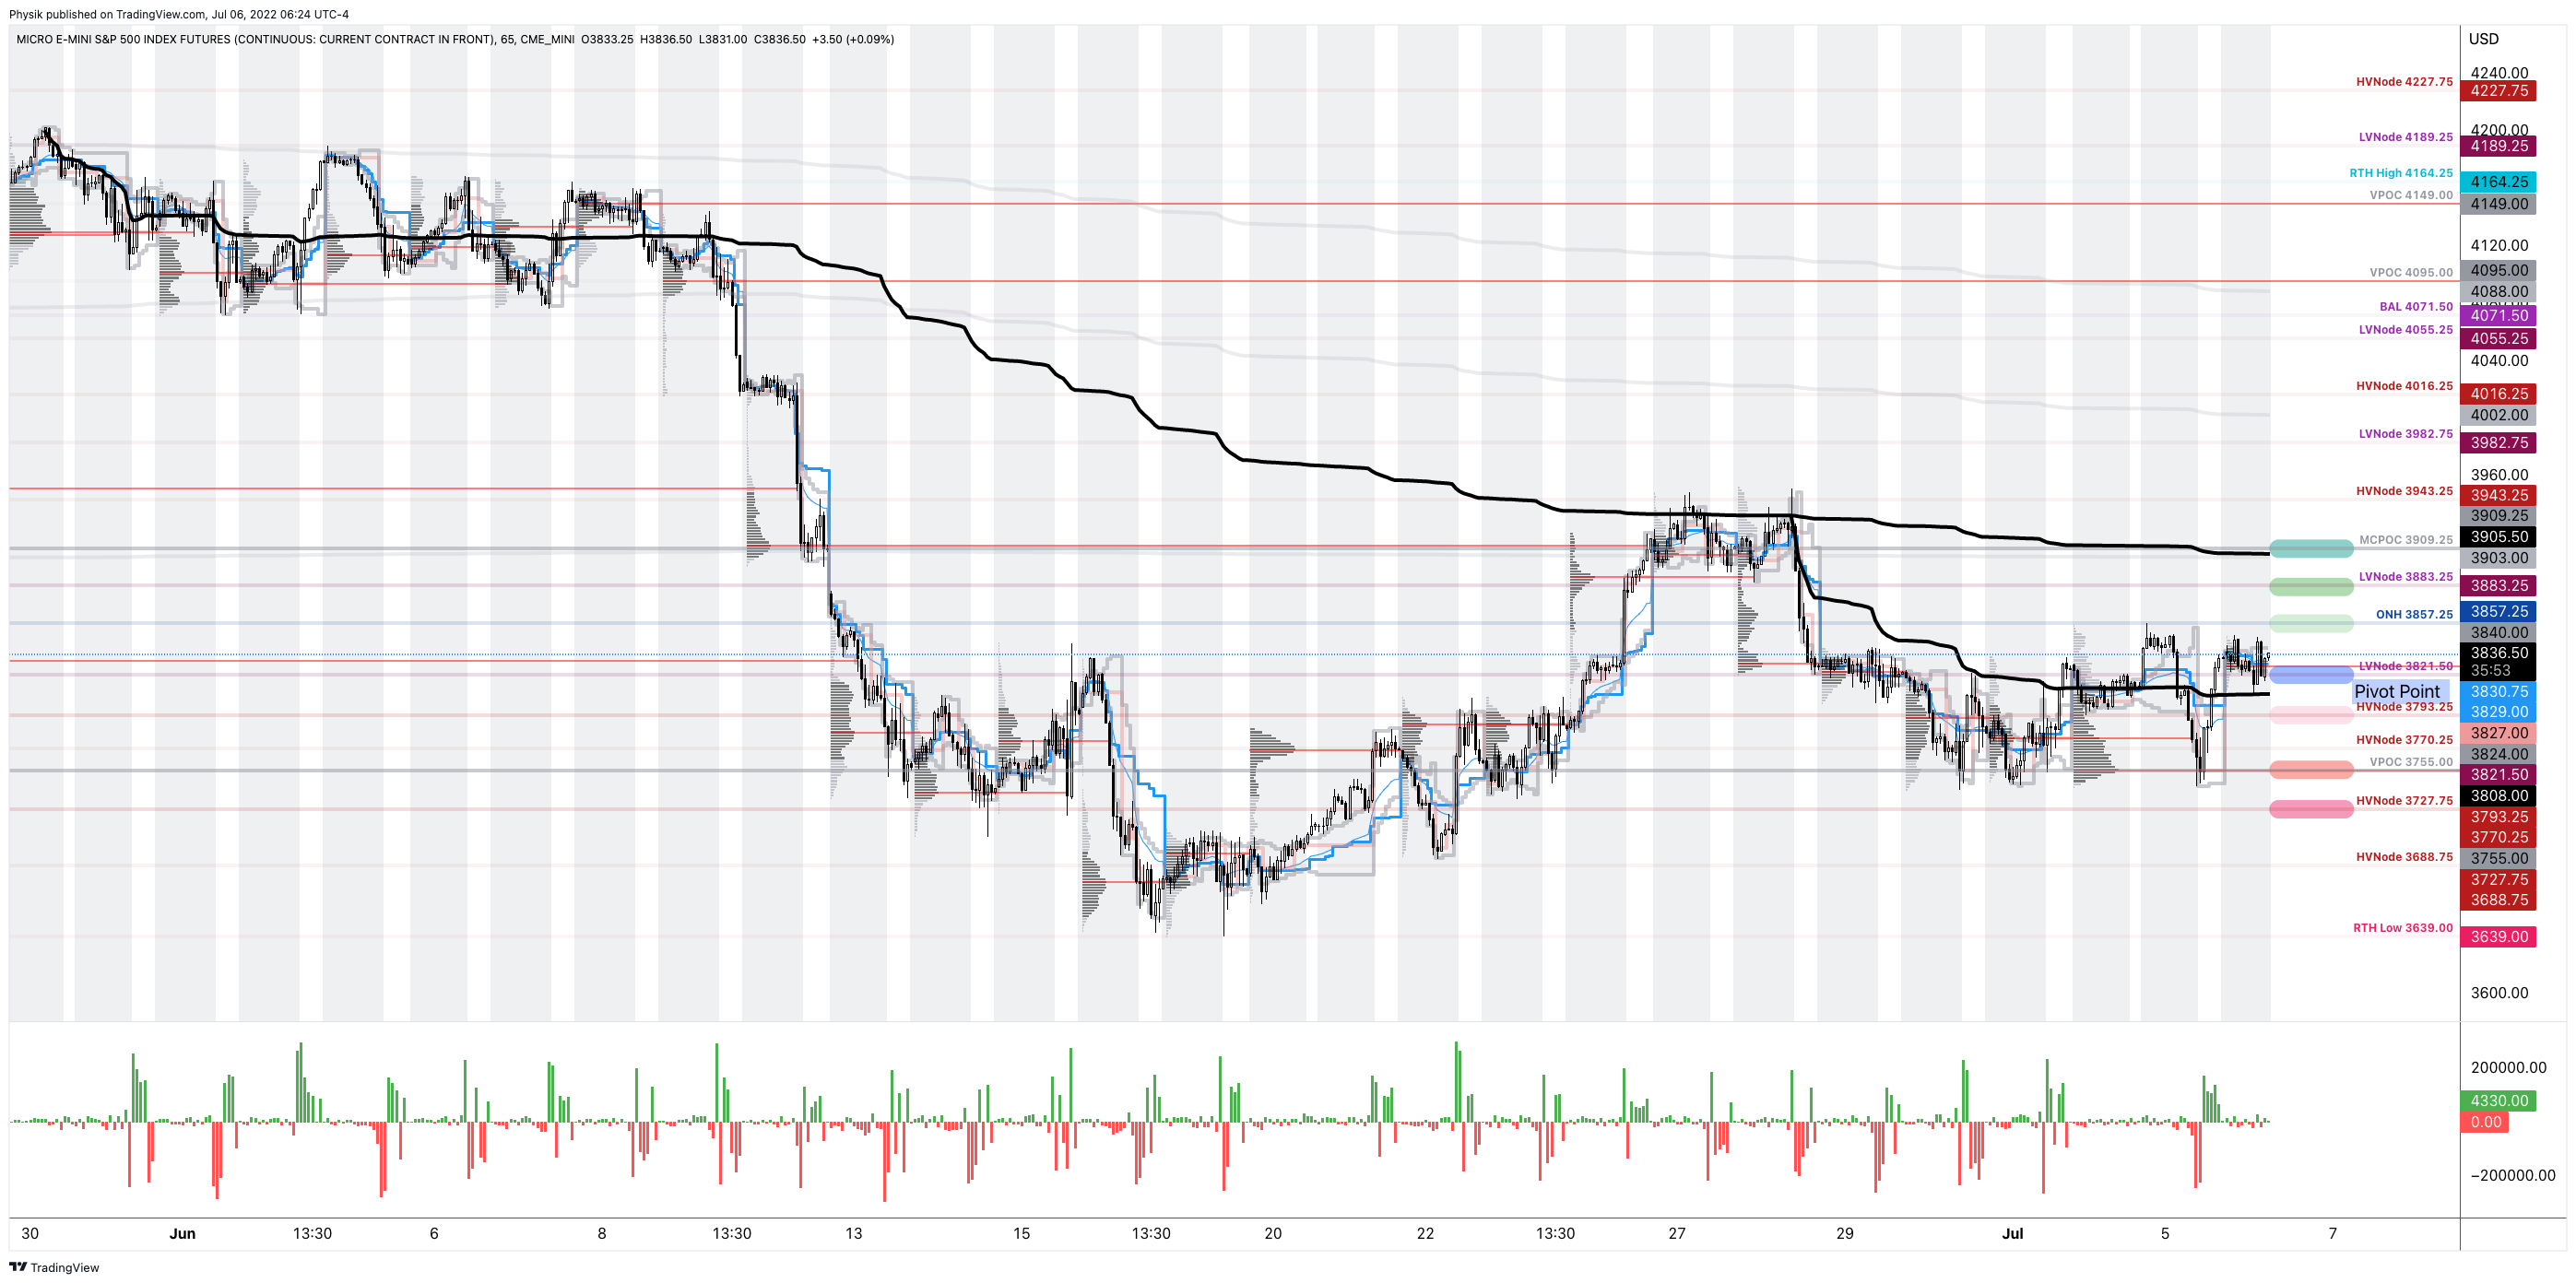
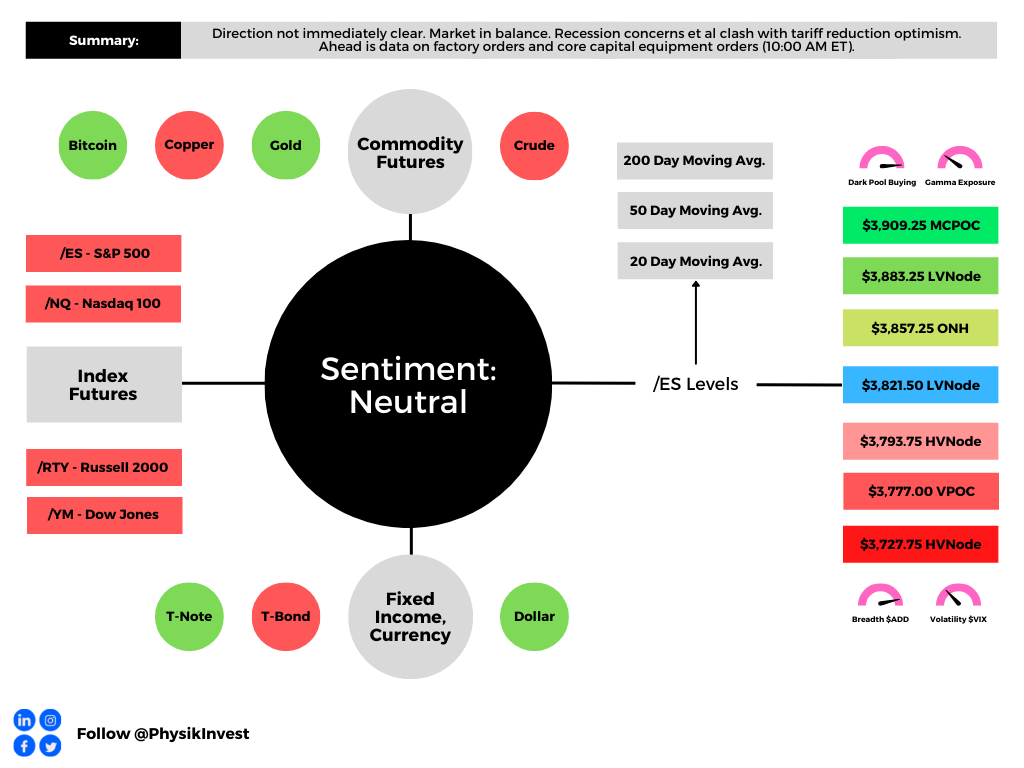
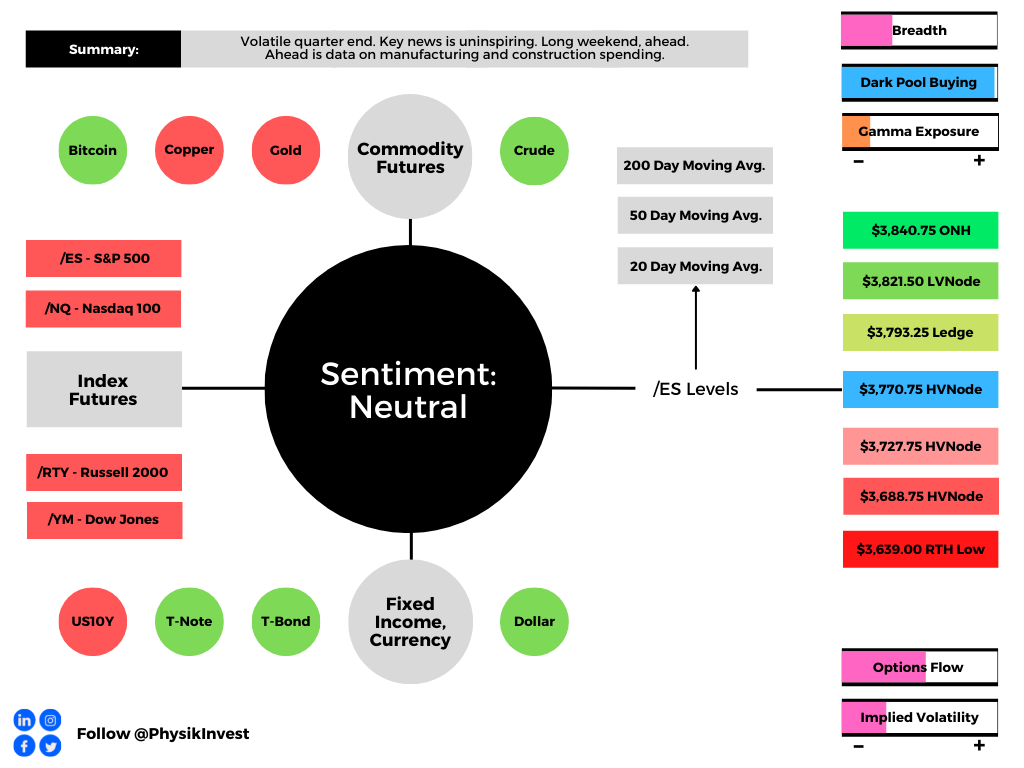
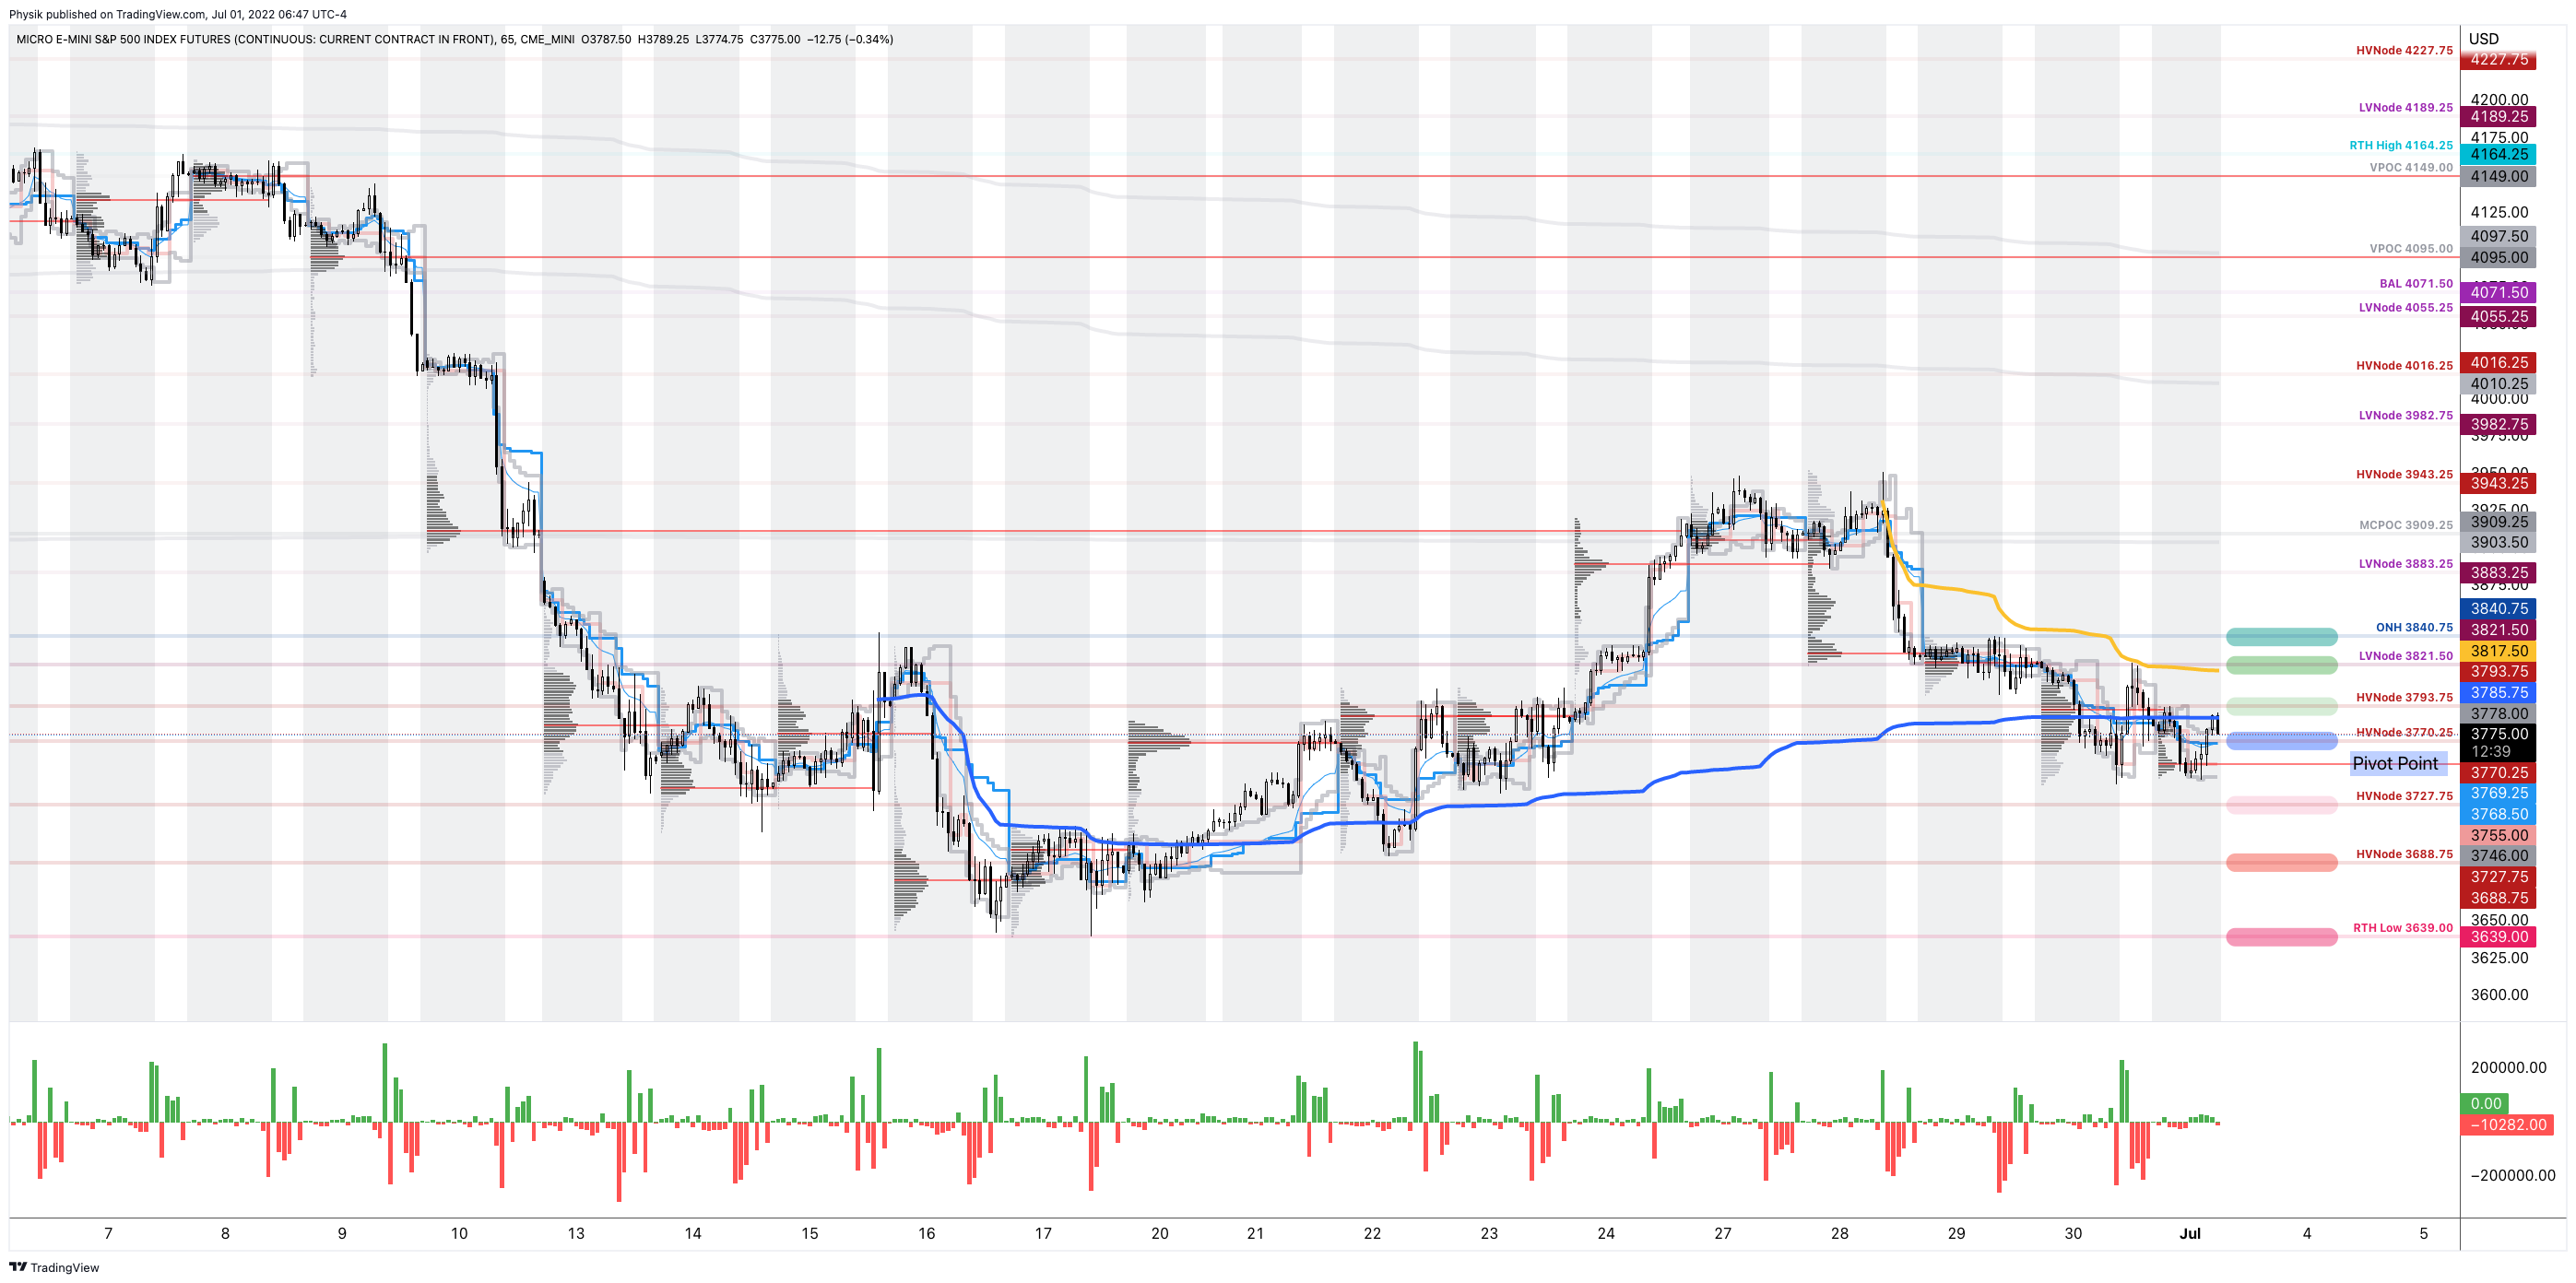
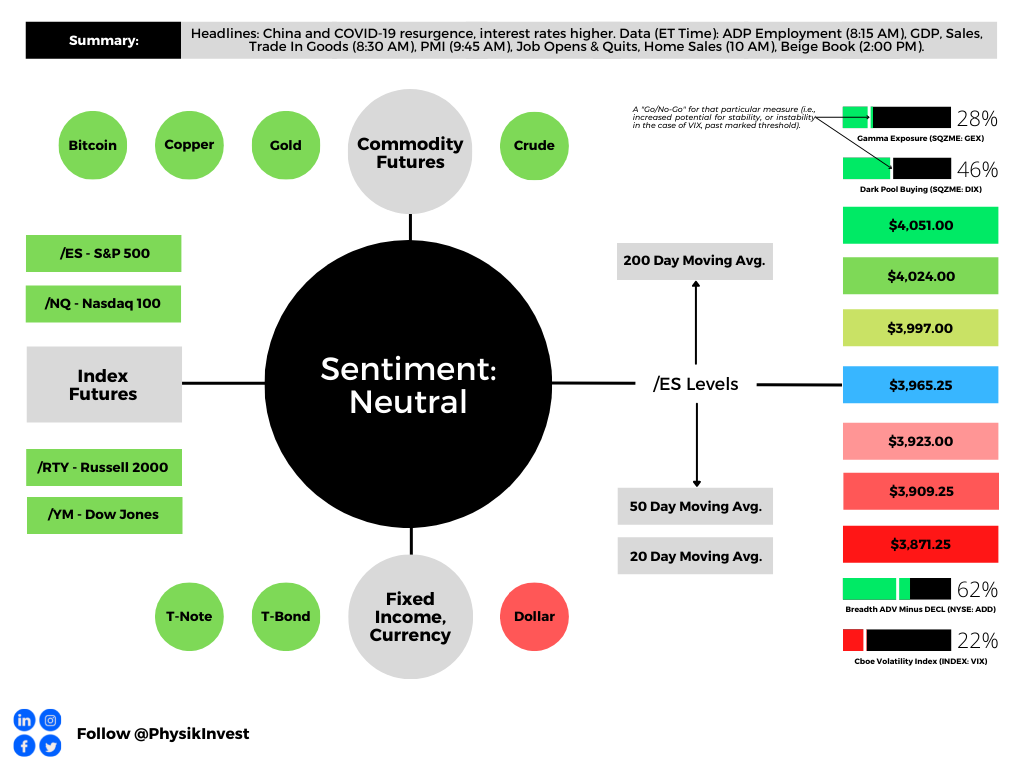
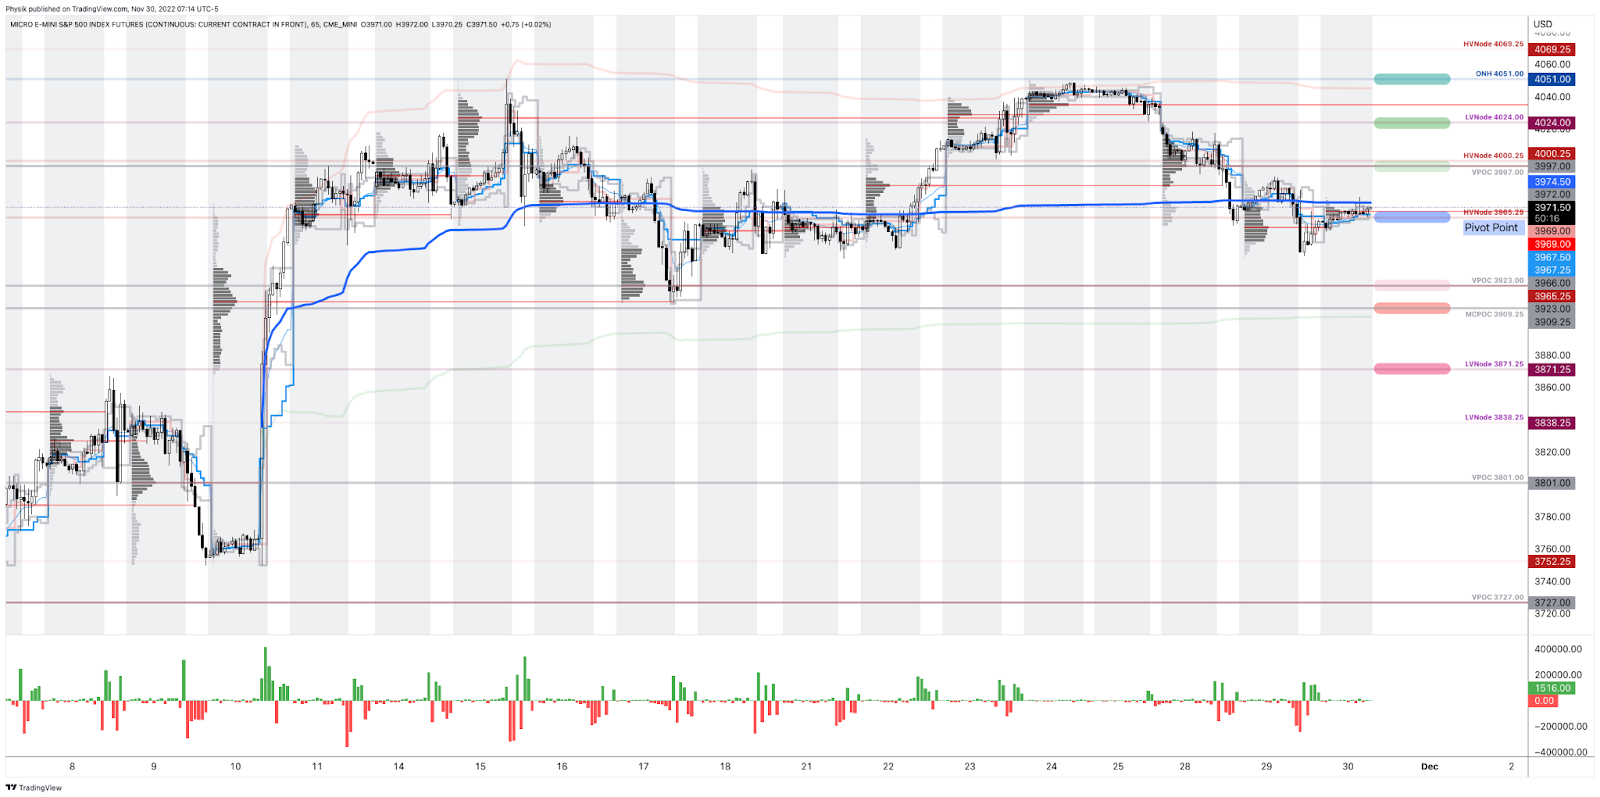
As of 7:15 AM ET, Wednesday’s regular session (9:30 AM – 4:00 PM ET), in the S&P 500, is likely to open in the upper part of a positively skewed overnight inventory, inside of prior-range and -value, suggesting a limited potential for immediate directional opportunity.

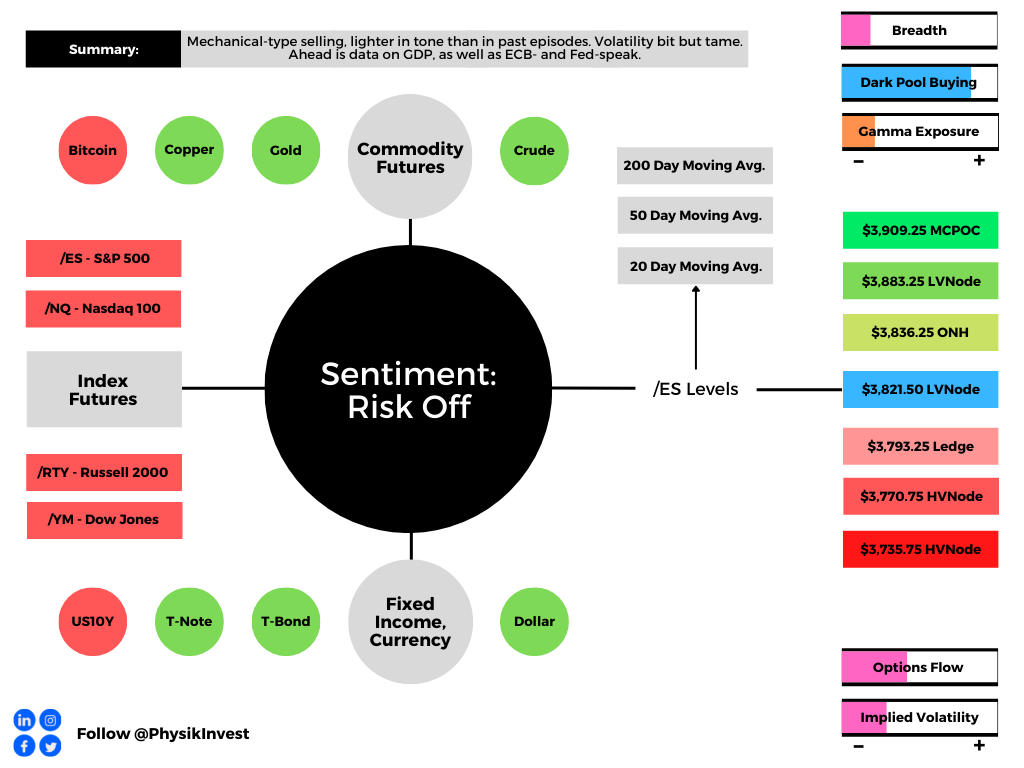
Our S&P 500 pivot for today is $3,965.25. 

Key levels to the upside include $3,997.00, $4,024.00, and $4,051.00. 

Key levels to the downside include $3,923.00, $3,909.25, and $3,871.25.

Click here to load today’s key levels into the web-based TradingView platform. All levels are derived using the 65-minute timeframe. New links are produced, daily.

Graphic: 65-minute profile chart of the Micro E-mini S&P 500 Futures.

Definitions

Volume Areas: Markets will build on areas of high-volume (HVNodes). Should the market trend for long periods of time, it will be identified by low-volume areas (LVNodes). LVNodes denote directional conviction and ought to offer support on any test.

If participants auction and find acceptance in an area of a prior LVNode, then future discovery ought to be volatile and quick as participants look to HVNodes for favorable entry or exit.

Gamma: The sensitivity of an option’s Delta to changes in the underlying asset’s price.

Volga: The sensitivity of an option’s Vega to changes in the underlying’s implied volatility.

POCs: Denote areas where two-sided trade was most prevalent in a prior day session. Participants will respond to future tests of value as they offer favorable entry and exit.

MCPOCs: Denote areas where two-sided trade was most prevalent over numerous sessions. Participants will respond to future tests of value as they offer favorable entry and exit.

Volume-Weighted Average Prices (VWAPs): A metric highly regarded by chief investment officers, among other participants, for quality of trade. Additionally, liquidity algorithms are benchmarked and programmed to buy and sell around VWAPs.


About

In short, an economics graduate working in finance and journalism.

Capelj spends most of his time as the founder of Physik Invest through which he invests and publishes daily analyses to subscribers, some of whom represent well-known institutions.

Separately, Capelj is an equity options analyst at SpotGamma and an accredited journalist interviewing global leaders in business, government, and finance.

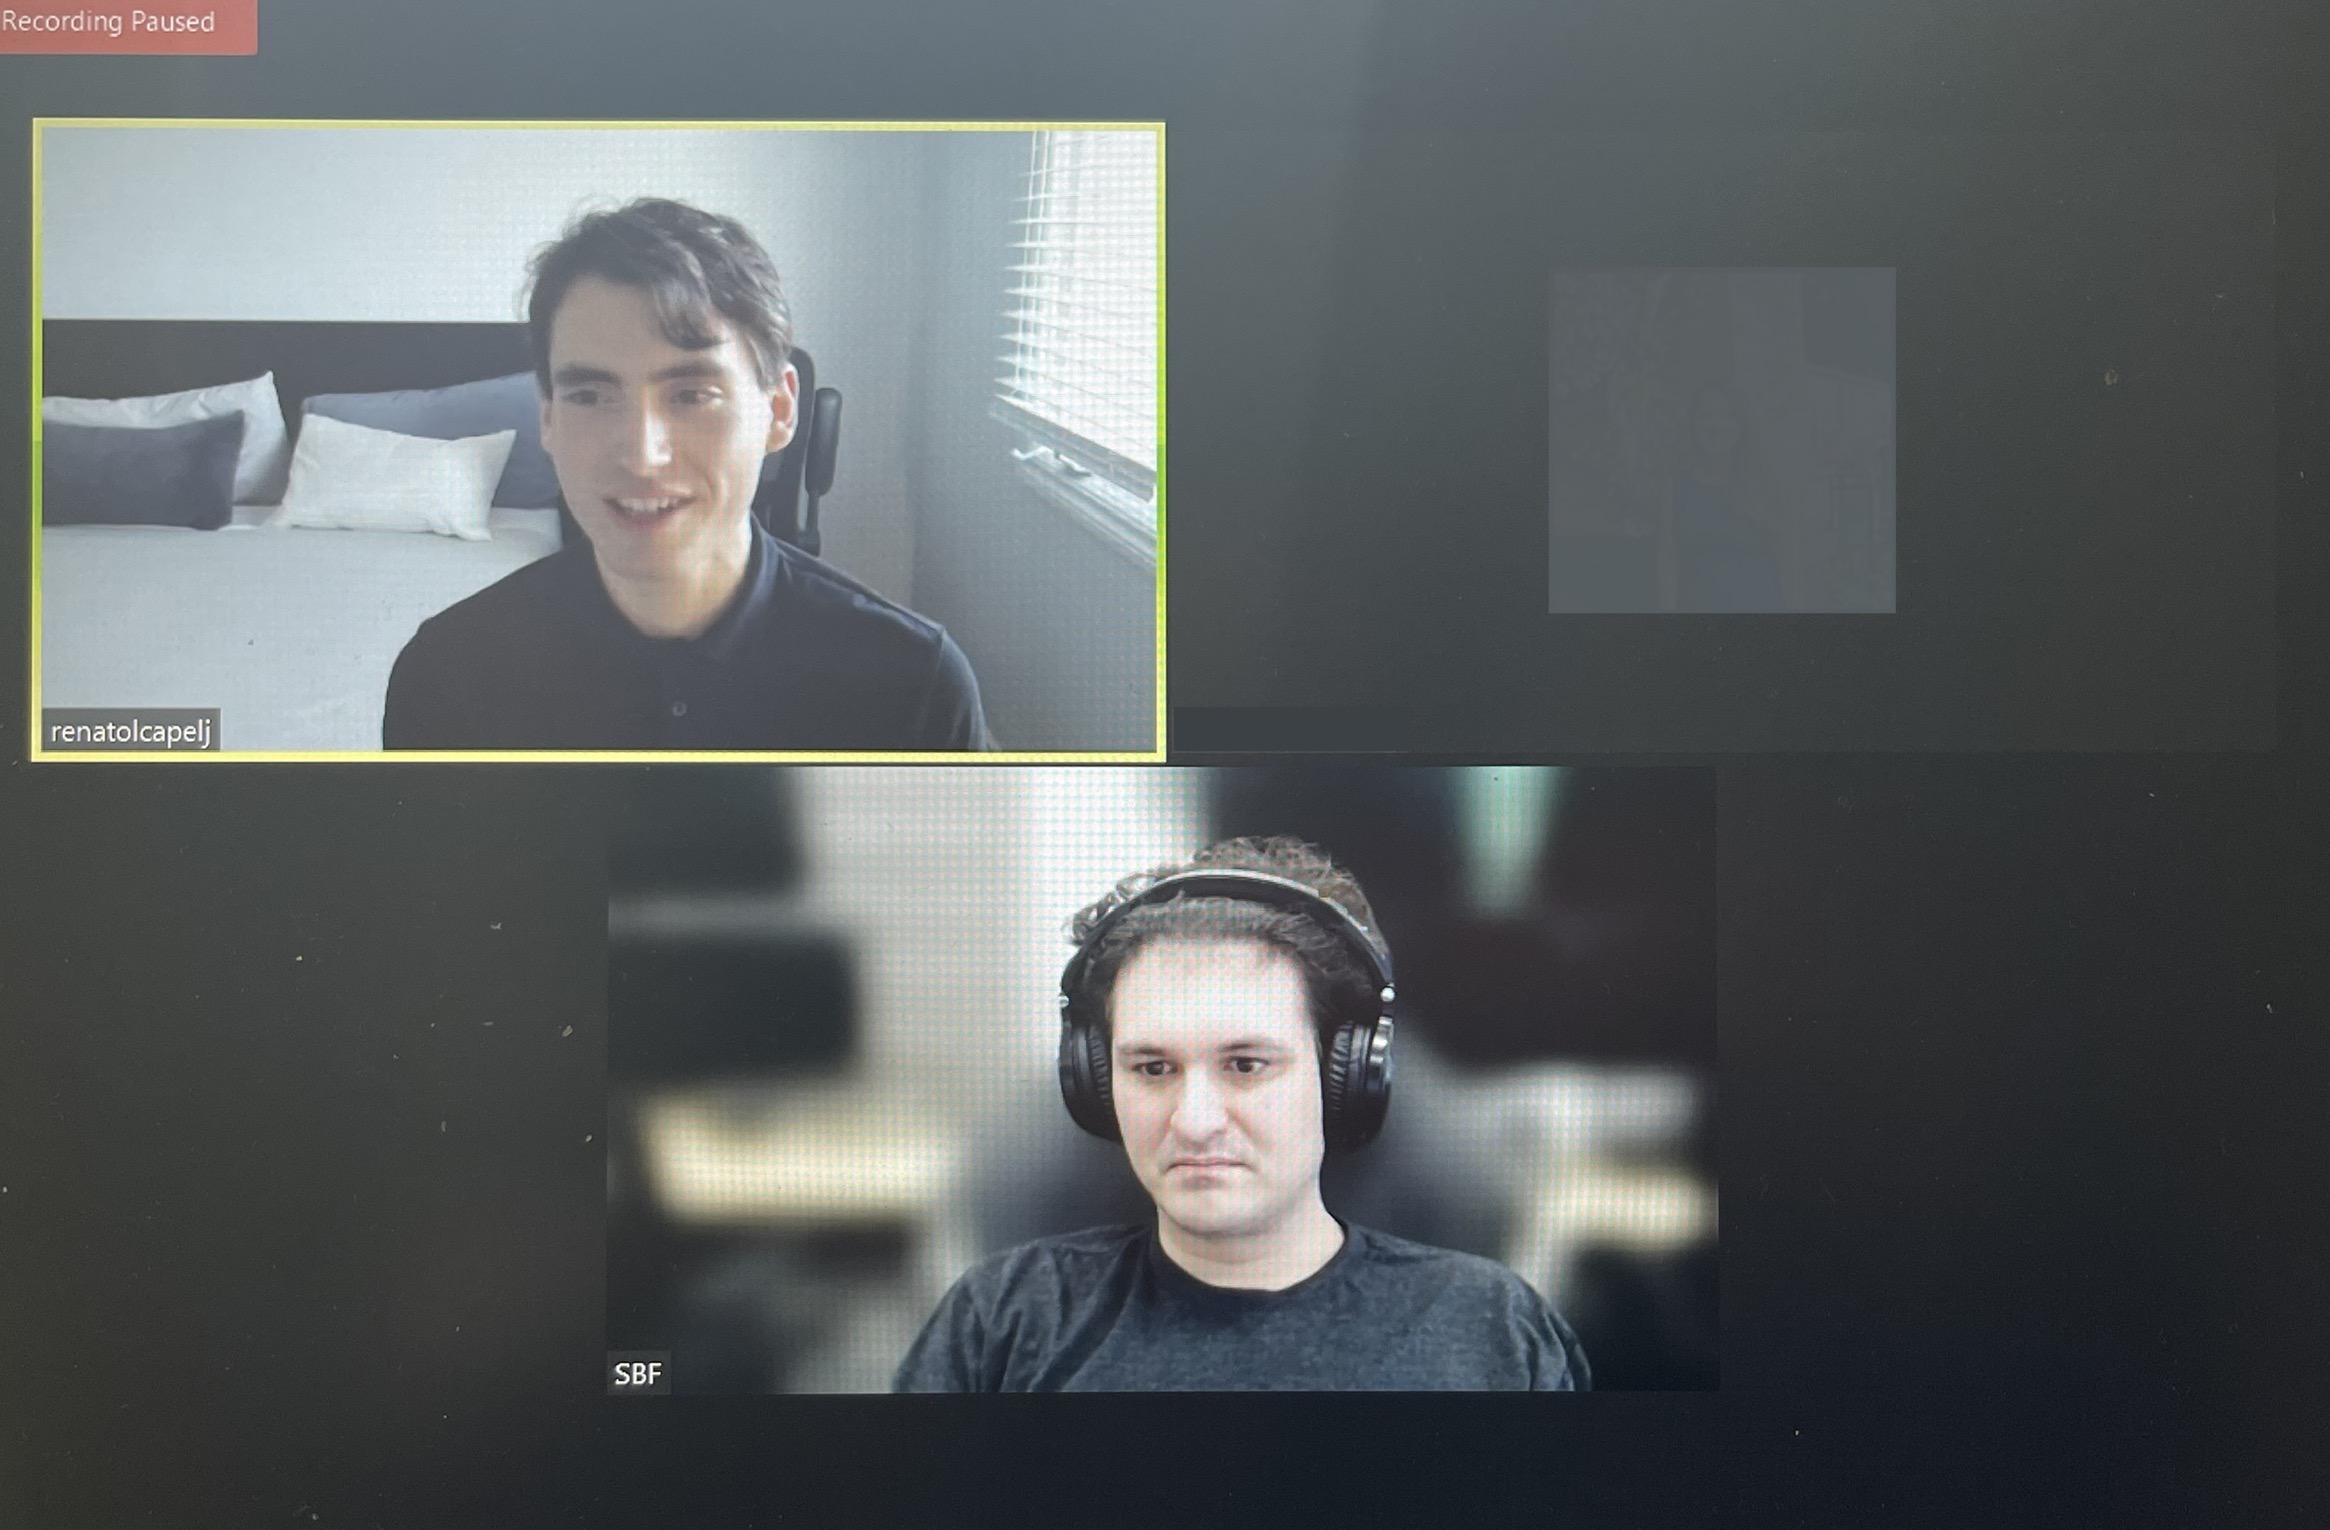
Past works include conversations with investor Kevin O’Leary, ARK Invest’s Catherine Wood, FTX’s Sam Bankman-Fried, Lithuania’s Minister of Economy and Innovation Aušrinė Armonaitė, former Cisco chairman and CEO John Chambers, and persons at the Clinton Global Initiative.

Contact

Direct queries to renato@physikinvest.com or Renato Capelj#8625 on Discord.

Disclaimer

Do not construe this newsletter as advice. All content is for informational purposes.

Categories
Commentary

Daily Brief For November 28, 2022

Physik Invest’s Daily Brief is read by over 1,200 people. To join this community and learn about the fundamental and technical drivers of markets, subscribe below.

Graphic updated 6:50 AM ET. Sentiment Risk-Off if expected /ES open is below the prior day’s range. /ES levels are derived from the profile graphic at the bottom of this letter. Levels may have changed since initially quoted; click here for the latest levels. SqueezeMetrics Dark Pool Index (DIX) and Gamma (GEX) with the latter calculated based on where the prior day’s reading falls with respect to the MAX and MIN of all occurrences available. A higher DIX is bullish. At the same time, the lower the GEX, the more (expected) volatility. Click to learn the implications of volatility, direction, and moneyness. Breadth reflects a reading of the prior day’s NYSE Advance/Decline indicator. VIX reflects a current reading of the CBOE Volatility Index (INDEX: VIX) from 0-100.

Administrative

Hope you had a great holiday with your closest!

Fundamental

Minutes from a Federal Open Market Committee (FOMC) meeting dropped last week.

As strategist Rishi Mishra summarized well, “the focus shift[ed] to the terminal rate from the pace of tightening; although the terminal rate would be higher than previously expected, the pace at which we get there will be slower because they want to take lags into account.”

Graphic: Retrieved from Rishi Mishra.

At its core, the economy has not slowed as much as the Fed was expecting, said Ellen Meade, a former Fed Board economist; “[t]hey can’t stop the rate increases until they see some measured evidence that the economy is slowing.”

So, with inflation “still at its highest since the 1980s,” according to Fabian Wintersberger, all the while financial conditions have loosened on easing inflation pressures, markets have yet to face their “most significant problems, [and] … keeping interest rates around 5% will not be a Fed pivot” (which is likely to happen near the middle of 2023, per the consensus analysis).

In short, the Fed must further raise rates and unwind liquidity injections.

To bring the “balance sheet back to [2020 levels], [the Fed] needs to reduce it by 41%.” The balance sheet has only been reduced by 1.5%. Should liquidity keep shrinking, that pulls investors out of risk.

Graphic: Via Physik Invest. Data compiled by @jkonopas623. Fed Balance Sheet data, here. Treasury General Account Data, here. Reverse Repo data, here. NL = BS – TGA – RRP.

Positioning

From a volatility perspective, it’s not a terrible time to hedge

An example demonstrates the point, well. As lightly discussed in last week’s letters, in mid-June, a trading partner and I noticed a change in tone in the non-linearity of volatility and skew with respect to linear changes in the price of the market or S&P 500 (INDEX: SPX).

The cost of certain spread structures (e.g., long/short one option near- or at-the-money and short/long two or more further out-of-the-money options) changed by hundreds of percent for only a few basis points of change in the underlying’s price.

Here’s more detail:

The market rose (boosted by a “vol crunch” and “systemic exposure reallocation,” per Nomura Holdings Inc’s [NYSE: NMR] Charlie McElligott) and, though top-line measures of IVOL have declined (e.g., INDEX: VIX), volatility skew is performing well.

Graphic: Retrieved from TradingView. Top, S&P 500 (INDEX: SPX). Middle Nations SkewDex (INDEX: SDEX). Bottom Cboe Volatility Index (INDEX: VIX). According to one paper from Nations Indexes, “SkewDex tells market participants how expensive out-of-the-money options are in relation to at-the-money options and thus, how risk-averse investors are.”

As Kai Volatility’s Cem Karsan once explained, this suggests “a potentially critical change in dealer positioning [and] the distribution of underlying outcomes”.

IVOL is at a lower bound and the bullish impacts yielded by its compressing have, largely, played out.

There is more to be gained by movement higher in IVOL. By owning protection, particularly that which is farther from current prices, you are positioned to monetize on non-linear repricings of volatility (as we saw earlier this year and may still see).

Graphic: Retrieved from Nomura Holdings Inc (NYSE: NMR).

Technical

As of 6:45 AM ET, Monday’s regular session (9:30 AM – 4:00 PM ET), in the S&P 500, is likely to open in the lower part of a negatively skewed overnight inventory, outside of prior-range and -value, suggesting a potential for immediate directional opportunity.

Our S&P 500 pivot for today is $4,000.25. 

Key levels to the upside include $4,024.00, $4,051.00, and $4,069.25. 

Key levels to the downside include $3,985.00, $3,965.25, and $3,923.00.

Click here to load today’s key levels into the web-based TradingView platform. All levels are derived using the 65-minute timeframe. New links are produced, daily.

Graphic: 65-minute profile chart of the Micro E-mini S&P 500 Futures.

Definitions

Overnight Rally Highs (Lows): Typically, there is a low historical probability associated with overnight rally-highs (lows) ending the upside (downside) discovery process.

Volume Areas: A structurally sound market will build on areas of high volume (HVNodes). Should the market trend for long periods of time, it will lack sound structure, identified as low volume areas (LVNodes). LVNodes denote directional conviction and ought to offer support on any test. 

If participants were to auction and find acceptance into areas of prior low volume (LVNodes), then future discovery ought to be volatile and quick as participants look to HVNodes for favorable entry or exit.

POCs: POCs are valuable as they denote areas where two-sided trade was most prevalent in a prior day session. Participants will respond to future tests of value as they offer favorable entry and exit.

MCPOCs: POCs are valuable as they denote areas where two-sided trade was most prevalent over numerous day sessions. Participants will respond to future tests of value as they offer favorable entry and exit.

About

After years of self-education, strategy development, mentorship, and trial-and-error, Renato Leonard Capelj began trading full-time and founded Physik Invest to detail his methods, research, and performance in the markets. 

Capelj also writes options market analyses at SpotGamma and is a Benzinga journalist. 

His past works include private discussions with ARK Invest’s Catherine Wood, investors Kevin O’Leary and John Chambers, the infamous Sam Bankman-Fried of FTX, former Bridgewater Associate Andy Constan, Kai Volatility’s Cem Karsan, The Ambrus Group’s Kris Sidial, the Lithuanian Delegation’s Aušrinė Armonaitė, among many others.

Contact

Direct queries to renato@physikinvest.com or Renato Capelj#8625 on Discord.

Disclaimer

Do not construe this newsletter as advice. All content is for informational purposes.

Categories
Commentary

Daily Brief For November 9, 2022

The daily brief is a free glimpse into the prevailing fundamental and technical drivers of U.S. equity market products. Join the 1,200+ that read this report daily, below!

Graphic updated 8:45 AM ET. Sentiment Neutral if expected /ES open is inside of the prior day’s range. /ES levels are derived from the profile graphic at the bottom of the following section. Levels may have changed since initially quoted; click here for the latest levels. SqueezeMetrics Dark Pool Index (DIX) and Gamma (GEX) calculations are based on where the prior day’s reading falls with respect to the MAX and MIN of all occurrences available. A higher DIX is bullish. At the same time, the lower the GEX, the more (expected) volatility. Learn the implications of volatility, direction, and moneyness. Breadth reflects a reading of the prior day’s NYSE Advance/Decline indicator. VIX reflects a current reading of the CBOE Volatility Index (INDEX: VIX) from 0-100.

Fundamental

A crypto-market leader and a lender of last resort – FTX – co-founded by Sam Bankman-Fried (SBF) was little questioned by many. It appears, however, that the company had growing pain points.

Events are developing quickly, too add. Here is a note that SBF issued to investors after entering into a nonbinding agreement with Binance.

Graphic: Retrieved from @gurgavin on Twitter. Read the story on The Block.

In short, there’s little substance.

Let’s go through the motions and start unpacking this debacle. Should we have loose ends, we’ll address those in the coming days.

In late December of 2021, I spoke with SBF regarding his background and aims with FTX. The resulting work was published on Benzinga.com, where I continue to work part-time as a writer and project lead.

Graphic: Retrieved from Renato Leonard Capelj. On the top is Renato Leonard Capelj. On the bottom is SBF.

In short, SBF is an MIT alumnus who started in finance at Jane Street, a trading firm and liquidity provider. Eventually, he saw an opportunity elsewhere; there were spot price inconsistencies across cryptocurrency exchanges.

SBF then founded the firm Alameda Research in 2017. A focus, there, was to extract premiums to spot via arbitrage. SBF et al would purchase Bitcoin (CRYPTO: BTC) domestically, send it to foreign exchanges to sell at higher prices, and, then, convert and wire the funds back. 

​​“You do have to put together this incredibly sophisticated global corporate framework in order to be able to actually do this trade,” SBF said in one conversation. “That’s the real task, the real hard part.”

In light of some frustration with existing exchange offers, SBF founded FTX.com and FTX.US parent FTX Trading Ltd. As late as September 2022, FTX was seeking $1 billion at a value of $32 billion. The firm was looking to become a one-stop-shop for retail and institutional market participants such as FTX brand ambassador and spokesperson Kevin O’Leary who I talked to just prior to my interview with SBF.

“If you’re being compliant internally and also with regulators in each jurisdiction you operate in, you don’t have the option to be off-sides,” O’Leary explained to me on FTX building one of the larger infrastructures institutions’ compliance departments could easily “work with and external auditors can audit.”

Eventually, the exchange grew to become a major player.

FTX was a top-five exchange, adding market share through acquisitions of players like Blockfolio and LedgerX, as well as building a reputation of transparency, or so it appeared, through its work with regulators.

Adding, SBF said to me he wanted FTX to cater to other asset classes and “become a global liquidity venue across the board.” In mid-to-late this year, FTX added stock trading via no-fee brokerage accounts, a follow-through on his vision.

The expansion narrative cooled, however. There was the collapse of the TerraUSD stablecoin, Celsius Network, Three Arrows Capital, and Voyager Digital, which FTX’s subsidiary in the US, FTX.US, won assets to in an auction this year.

At the surface, it appeared FTX was “seemingly untouchable,” as Immutable Holdings’ Jordan Fried explained online. Check out my last chat with Jordan Fried, here.

However, “cracks started to appear [and] people in crypto were taking notice”; the CEOs of both Alameda Research and FTX.US stepped down. Fried added that the situation worsened when Alameda Research’s balance sheet was leaked.

The firm had $14.6 billion in assets (nearly $4 billion in FTT, which is FTX’s utility token, and about $2 billion in FTT token collateral) against $8 billion in liabilities.

“Binance owns a bunch of FTT themselves and, two days ago, Changpeng Zhao (CZ) [who is the] founder of Binance, [said] that SBF … could be lobbying to get regulators to help out FTX more than Binance.” In response, CZ was to “dump all $2 billion of FTT” Binance was holding.

This coincided with a large selling pressure on the FTX utility token. With Alameda Research having ~50% of their assets in FTT, Fried says, “they were dead in the water”. A run appeared likely and, with FTX and Alameda Research’s dealings so intertwined, “the failure of one meant the failure of another.”

On the heels of billions in withdrawals, users weren’t “getting their cash” and, ultimately, in SBF seeking to protect users’ assets, FTX entered into a strategic transaction with Binance.

The follow-on impacts of this week’s events, during which SBF saw a ~90% wipeout of his wealth, can be speculated on. Apparent losers include SoftBank Group Corporation’s (OTC: SFTBY) Vision Fund, the Ontario Teachers’ Pension Plan, and Tiger Global Management.

Some, including Arthur Breitman of Tezos (CRYPTO: XTZ), mulled the impact of FTX’s potential divestment from Solana (CRYPTO: SOL) which “took a drubbing Tuesday,” along with just about every other crypto token including Bitcoin.

Graphic: Retrieved from Bloomberg.

Noteworthy are the impacts of this crypto-market turmoil in equities. As I stated in a note to SpotGamma subscribers yesterday, following “news of a liquidity crunch at FTX, when the selling accelerated in FTT [] and Bitcoin, so did the selling in the S&P 500.”

“The bottom, in all three products, happened at 2:30 PM ET.”

Graphic: Retrieved by Physik Invest from TradingView.

I add that these products – S&P 500 (INDEX: SPX) and Bitcoin – have traded in sync and held positive correlations.

In short, both are recipients of the same risk-on and -off flows. Easy monetary policies cut financial asset volatility and pushed market participants into riskier investments. In short, it was easier to borrow and make longer-duration bets on ideas (e.g., crypto and Ponzi-like DeFi, growth, risky private equity investments) with a lot of promise in the future. 

Financial asset investments were more attractive. That’s, in part, why we saw asset inflation early on in 2020 when policymakers embarked on historic interventions.

Monetary authorities cut interest rates and bought bonds, all the while money was sent to people. Risk assets were the first to respond. Then, as the economy reopened, demand picked up, supply chains tightened, and prices in the real economy inflated.

As we added on Monday, de-globalization and persistent supply chokepoints (e.g., Ukraine and Russia) have done little to help. Inflation remains a problem and investors are seeking safety amid Fed intervention. 

Financial assets are in less demand while real assets are in more demand. A disruption (or reversal) in these policies puts at risk the prevailing carry regime. A stock and crypto market drop is, in part, the result of an unwind in carry. 

The drop is a deflationary shock, precisely what policymakers are seeking, per Credit Suisse Group AG’s (NYSE: CS) Zoltan Pozsar who says inflation is a structural issue, and “we [have] to generate a round of negative wealth effects to lower demand such that it becomes more in line with the new realities of supply.” 

As we established on Monday, that invokes “collateral damage to the US economy,” S&P Global Inc (NYSE: SPGI) economists have put forth “as households and businesses pull back spending and investment.” 

For example, just announced today, Meta Platforms Inc (NASDAQ: META), which became wrapped up in the speculativeness of the early 2020s reaching beyond the crypto markets, hence the name change from Facebook Inc, is seeking to cut 11,000 jobs.

Per Bloomberg, “the macroeconomic downturn, increased competition, and ads signal loss have caused [] revenue to be much lower than expected.”

Ultimately, a deflationary pulse manifesting disinflation in consumer prices may prompt the policymakers to reverse on rates and efforts like quantitative tightening (QT), the (out)flow of capital from capital markets.

We’re seeing demand erode and many businesses starting to suffer the effects of a switch to “just-in-case” from “just-in-time,” according to S&P Global Inc. Inventories (which are to be sold at a loss) are piling up and workers are needed less.

That’s a recession.

Graphic: Retrieved from Bloomberg. “The overhang is leading to canceled orders, a sharp slowdown in global trade growth and stagnating factory activity. On one hand, it’s good that logistics networks are seeing relief from the logjams that plagued the start of 2022 — ocean-shipping rates have tumbled close to pre-pandemic levels and delivery times are shortening.”

This said, the “risk of recession, whether it is real or merely implied by an inversion of the yield curve, won’t deter the Fed from hiking rates higher faster or from injecting more volatility to build up negative wealth effects.”

“Rallies could beget more forceful pushback from the Fed,” which is a concern given the poor performance in implied volatility (IVOL) that’s resulted in participants’ disinterest in maintaining their hedges this year; equities’ left tail is growing.

Graphic: Retrieved from Bloomberg. Initially created by QVR Advisors. “When shares drop, demand for fresh protection remains subdued given the unusually thin positioning among big money. At the same time, put owners quickly book profits, often leading to a drop in implied vol.

In summary, there’s no longer “a disinterest and unimportance to cash flows.” The commitment to reducing liquidity and credit has consequences on the real economy and asset prices which rose and kept the deflationary pressure of policies at bay.  

It is elevated volatility and persistent declines that are to prompt investors to lower their selling prices in risk(ier) assets (e.g., options bets, metals, cryptocurrency and stablecoins, equities, bonds), and compete for cash.

Positioning

Based on traders’ current positioning, the market, absent exogenous shocks, is more so prone to sharp upside reversals and a slow(er) grind lower.

As the former Bridgewater Associate Andy Constan explained to me once, therefore, you “want Deltas and leverage” via options trades that are defined risk and two-to-four months out in maturity.

We shall go more into this, later.

Technical

As of 8:45 AM ET, Wednesday’s regular session (9:30 AM – 4:00 PM ET), in the S&P 500, is likely to open in the lower part of a negatively skewed overnight inventory, inside of prior-range and -value, suggesting a limited potential for immediate directional opportunity.

In the best case, the S&P 500 trades higher.

If above the $3,828.75 HVNode, the $3,874.25 HVNode is in play. Initiative trade beyond the latter could reach as high as the $3,909.25 MCPOC and $3,936.25 ONH, or higher.

In the worst case, the S&P 500 trades lower.

If above the $3,828.75 HVNode, the $3,806.25 LVNode is in play. Initiative trade beyond the latter could reach as low as the $3,787.00 VPOC and $3,727.00 VPOC, or lower.

Click here to load today’s key levels into the web-based TradingView charting platform. Note that all levels are derived using the 65-minute timeframe. New links are produced, daily.

Graphic: 65-minute profile chart of the Micro E-mini S&P 500 Futures.

Definitions

Volume Areas: A structurally sound market will build on areas of high volume (HVNodes). Should the market trend for long periods of time, it will lack sound structure, identified as low volume areas (LVNodes). LVNodes denote directional conviction and ought to offer support on any test. 

If participants were to auction and find acceptance into areas of prior low volume (LVNodes), then future discovery ought to be volatile and quick as participants look to HVNodes for favorable entry or exit.

POCs: POCs are valuable as they denote areas where two-sided trade was most prevalent in a prior day session. Participants will respond to future tests of value as they offer favorable entry and exit.

MCPOCs: POCs are valuable as they denote areas where two-sided trade was most prevalent over numerous day sessions. Participants will respond to future tests of value as they offer favorable entry and exit.

About

After years of self-education, strategy development, mentorship, and trial-and-error, Renato Leonard Capelj began trading full-time and founded Physik Invest to detail his methods, research, and performance in the markets.

Capelj also develops insights around impactful options market dynamics at SpotGamma and is a Benzinga reporter.

Some of his works include conversations with ARK Invest’s Catherine Wood, investors Kevin O’Leary and John Chambers, FTX’s Sam Bankman-Fried, ex-Bridgewater Associate Andy Constan, Kai Volatility’s Cem Karsan, The Ambrus Group’s Kris Sidial, among many others.

Disclaimer

In no way should the materials herein be construed as advice. Derivatives carry a substantial risk of loss. All content is for informational purposes only.

Categories
Commentary

Daily Brief For September 22, 2022

The daily brief is a free glimpse into the prevailing fundamental and technical drivers of U.S. equity market products. Join the 950+ that read this report daily, below!

Graphic updated 8:00 AM ET. Sentiment Neutral if expected /ES open is inside of the prior day’s range. /ES levels are derived from the profile graphic at the bottom of the following section. Levels may have changed since initially quoted; click here for the latest levels. SqueezeMetrics Dark Pool Index (DIX) and Gamma (GEX) calculations are based on where the prior day’s reading falls with respect to the MAX and MIN of all occurrences available. A higher DIX is bullish. At the same time, the lower the GEX, the more (expected) volatility. Learn the implications of volatility, direction, and moneyness. Breadth reflects a reading of the prior day’s NYSE Advance/Decline indicator. VIX reflects a current reading of the CBOE Volatility Index (INDEX: VIX) from 0-100.

Administrative

An easy read, today. For more complex, see the September 20 and 19 letters. Also, there will not be a letter published for Friday, September 23, 2022. See you next week, team!

Fundamental

Equity markets traded down, yesterday, on the heels of the Federal Reserve’s (Fed) decision to raise interest rates by 0.75% and “keep at it” for longer, eyeing a 1.25% jump, in sum, by 2023.

This puts the current target rate at 3.00-3.25%.

Separately, if the “keep at it” quote sounds familiar, that’s because it is. The Fed Paul Volcker’s memoir is titled “Keeping at It.”

Graphic: CME Group Inc’s (NASDAQ: CME) FedWatch Tool shows higher odds of a 75 to 100 basis point rate hike in November, along the lines of what the futures market was pricing heading into the event.

The Fed Chair Jerome Powell admitted there may be below-trend growth and the potential for unemployment to reach 4.4% next year, up from the current rate of 3.7%. Projected increases, as of yesterday, show interest rates at 4.4% by 2023, and 4.6% in 2023, before moderation in 2024 to 3.9%, as well summarized by Bloomberg.

Graphic: Retrieved from Bloomberg.

Moreover, economists suggest that raising rates to 4.5% would cost the economy nearly 1.7 million jobs while rates at 5% would bring that number to 2 million. A higher savings rate and increased funds at the state level would likely cushion the blow, however.

In response, the likes of Ark Invest’s Cathie Wood, who we quoted recently regarding her thoughts on why the Fed needs to lower the pace of tightening and/or cut, said:

“Most disappointing about the Fed’s decision today was its unanimity. None of those voting on the Federal Reserve is focused on the significant price deflation in the pipeline. The Fed seems to be making decisions based on lagging indicators and analogies.”

She adds that the Fed is setting the stage for deflation:

“The Fed is solving supply chain issues by crushing demand and, in my view, unleashing deflation, setting it up for a major pivot.”

Graphic: Initially retrieved from Bloomberg. Taken from Ophir Gottlieb who concludes costs are dropping, as observed via shipping, gasoline, manufacturing, cars, and rent measures.

Moreover, it’s the case that “[a]s rates rise and debt servicing costs increase, ‘many zombie institutions, zombie households, corporates, banks, shadow banks, and zombie countries are going to die,’” said economist Nouriel Roubini, who predicted the 2008 financial crisis. 

Prior to the Fed event, Roubini forecasted a 75 basis point hike in September, followed by a 50 basis point hike in November. The market is pricing more than what Roubini thought the Fed would probably do after Wednesday’s Fed meeting.

In his opinion, stay “light on equities and have more cash, … [as] equities and other assets can fall by 10%, 20%, 30%.”

Positioning

In short, unexpected was the post-event response. In recent times, post-Fed moves have been positive, driven by the “rebalancing of dealer inventory,” per Kai Volatility’s Cem Karsan.

That didn’t happen and let’s unpack why.

Basically, into the event, traders demanded protection and bid implied volatility (IVOL). The assumption is that counterparties, who are likely on the other end, have exposure to positive Delta and negative Gamma, which they hedge through negative Delta trades in the underlying.

Should fears have been assuaged, the supply of that protection once demanded, would have decreased IVOL (and options Delta), providing the markets a boost.

Graphic: Retrieved from SqueezeMetrics.

That didn’t happen. Instead, traders added protection, as shown by this SpotGamma graphic tracking changes in put open interest on the S&P 500 (INDEX: SPX).

Graphic: Retrieved from SpotGamma. Updated September 22, 2022.

This bid some basic measures of IVOL into the close.

Graphic: Retrieved from VIX Central. Updated September 21, 2022.

That’s as these particular options, which were added at much lower prices, as I explained in a SpotGamma note, recently, “are far more sensitive to changes in direction and IVOL.”

These options can go “from having very little Delta (exposure to direction) to a lot more Delta on the move lower,” quickly. “If we maintain that liquidity providers are short those puts, a positive Delta trade, then those liquidity providers [will sell] futures and stock, a negative Delta trade to stay hedged.”

Graphic: Retrieved from SqueezeMetrics.

Notwithstanding, it’s still the case that a “reload on fresh short-dated downside” flows heighten the risk of a “negative Delta squeeze … into month end,” said Nomura Holdings Inc’s (NYSE: NMR) Charlie McElligott. 

Therefore, “you have to consider a move up [to] $4,000.00 as part of your distribution of outcomes to the upside,” as that is near where “market makers are ‘long,’” as part of an impactful collar trade many are aware sits.

As an aside, some online conversation was sparked around placing cash into riskless trades for some small, but guaranteed, rates of return. In that conversation, Box Spreads were put forth as a solution to lend cash and earn a competitive interest rate.

For context, “Boxes allow market participants to create a loan structure similar to a Treasury bill. T-bills are ‘discount’ instruments that are purchased at a value less than the stated face value. Upon maturity, bills call for the return of the stated face value.”

“For example, one might buy a $1 million 90-day T-bill for $998,000. Ninety days later, the $1 million face or principal value is returned and the $2,000 discount is earned as interest. One may represent the rate on this transaction as a 0.80% or 80 basis point discount yield [= (360/90) x ($2,000/$1,000,000)]. The effective rate on a box represents a ‘discount yield’ similar to a quoted T-bill rate.”

Graphic: Retrieved from boxtrades.com.

IPS Strategic Capital’s Pat Hennessy explains that SPX boxes “typically yield[] 20-40 bps above [the] corresponding maturity risk-free rate.” Additionally, there are tax advantages to using the S&P 500’s 1256 contracts. 

For easier fills, use the “3K/4K line in an AM settled expiry,” Hennessy noted. “Helps if you know where the broker market is.”

Technical

As of 8:00 AM ET, Thursday’s regular session (9:30 AM – 4:00 PM ET), in the S&P 500, is likely to open in the upper part of a balanced overnight inventory, inside of prior-range and -value, suggesting a limited potential for immediate directional opportunity.

In the best case, the S&P 500 trades higher.

Any activity above the $3,826.25 HVNode puts into play the $3,857.25 HVNode. Initiative trade beyond the latter could reach as high as the $3,893.00 VPOC and $3,936.25 ONH, or higher.

In the worst case, the S&P 500 trades lower.

Any activity below the $3,826.25 HVNode puts into play the $3,770.75 HVNode. Initiative trade beyond the HVNode could reach as low as the $3,722.50 LVNode and $3,688.75 HVNode, or lower.

Click here to load today’s key levels into the web-based TradingView charting platform. Note that all levels are derived using the 65-minute timeframe. New links are produced, daily.
Graphic: 65-minute profile chart of the Micro E-mini S&P 500 Futures.

Definitions

Volume Areas: A structurally sound market will build on areas of high volume (HVNodes). Should the market trend for long periods of time, it will lack sound structure, identified as low volume areas (LVNodes). LVNodes denote directional conviction and ought to offer support on any test. 

If participants were to auction and find acceptance into areas of prior low volume (LVNodes), then future discovery ought to be volatile and quick as participants look to HVNodes for favorable entry or exit.

POCs: POCs are valuable as they denote areas where two-sided trade was most prevalent in a prior day session. Participants will respond to future tests of value as they offer favorable entry and exit.

MCPOCs: POCs are valuable as they denote areas where two-sided trade was most prevalent over numerous day sessions. Participants will respond to future tests of value as they offer favorable entry and exit.

About

After years of self-education, strategy development, mentorship, and trial-and-error, Renato Leonard Capelj began trading full-time and founded Physik Invest to detail his methods, research, and performance in the markets.

Capelj also develops insights around impactful options market dynamics at SpotGamma and is a Benzinga reporter.

Some of his works include conversations with ARK Invest’s Catherine Wood, investors Kevin O’Leary and John Chambers, FTX’s Sam Bankman-Fried, ex-Bridgewater Associate Andy Constan, Kai Volatility’s Cem Karsan, The Ambrus Group’s Kris Sidial, among many others.

Disclaimer

In no way should the materials herein be construed as advice. Derivatives carry a substantial risk of loss. All content is for informational purposes only.

Categories
Commentary

Daily Brief For September 21, 2022

The daily brief is a free glimpse into the prevailing fundamental and technical drivers of U.S. equity market products. Join the 900+ that read this report daily, below!

Graphic updated 7:00 AM ET. Sentiment Neutral if expected /ES open is inside of the prior day’s range. /ES levels are derived from the profile graphic at the bottom of the following section. Levels may have changed since initially quoted; click here for the latest levels. SqueezeMetrics Dark Pool Index (DIX) and Gamma (GEX) calculations are based on where the prior day’s reading falls with respect to the MAX and MIN of all occurrences available. A higher DIX is bullish. At the same time, the lower the GEX, the more (expected) volatility. Learn the implications of volatility, direction, and moneyness. Breadth reflects a reading of the prior day’s NYSE Advance/Decline indicator. VIX reflects a current reading of the CBOE Volatility Index (INDEX: VIX) from 0-100.

Administrative

Short and to the point, today, after yesterday’s detailed letter on inflation, monetary policy action, and beyond. Good luck, everyone!

Fundamental

Ongoing is a “messy divorce” between large powers. We have talked about this in the past.

In the news was Putin’s mobilization of troops and renewed warning of a nuclear threat. This is a day after Biden said the US would defend Taiwan against China. In response, Mao Ning, the Chinese foreign ministry spokesperson, said this:

“The US remarks seriously violate the one-China principle … and send a severely wrong signal to the separatist forces of Taiwan independence. China strongly deplores and rejects it and has made solemn complaints with the US side.”

“We will do our utmost to strive for the prospect of peaceful reunification with the utmost sincerity, while we will not tolerate any activities aimed at splitting China and reserve the option to take all necessary measures.”

The aforementioned do more to shift “the pillars of the low inflation world” – de-globalization and populism – which the Federal Reserve (Fed) has a limited toolkit to solve for.

Pending is a large “L”-shaped recession to slow inflation, generate negative wealth effects, lower demand, and position for a recovery that will likely be “fiscally funded industrial policy.”

Shifting to today, the Federal Reserve is to step up its efforts to tame inflation by raising interest rates to the highest level since 2008. The consensus calls for up to a 75 basis point rate hike. 

Bloomberg economist Anna Wong, Andrew Husby, and Eliza Winger put forth:

“Powell will emphasize the committee’s determination to hold rates higher for longer. He will be more forthcoming in acknowledging the likely pain involved in bringing down inflation. He may opt not to say that the committee plans to downshift the pace of rate hikes.”

Positioning

Yesterday, we briefly talked about post-event moves which are often positive and driven by the structural “rebalancing of dealer inventory,” per Kai Volatility’s Cem Karsan.

“In the past four Fed Days, the benchmark index has climbed an average of roughly 1.4% on all days, with more than 2% gains on three of the four,” said Bloomberg’s John Authers. Adding, “the S&P 500 has averaged a gain of more than 1% on Fed Days over the last 10 meetings.”

Graphic: Retrieved from Bloomberg. Via the Bespoke Investment Group.

Basically, into the event, traders have demanded protection and bid implied volatility (IVOL).

Graphic: Retrieved from SpotGamma. 

Should fears be assuaged, the supply of that protection should decrease IVOL, this is what may provide markets a boost.

Graphic: Retrieved from SqueezeMetrics.

From thereon, the “second move and final resolution, if you wait for it, is usually tied to the incremental effects on liquidity (QE/QT).”

In the case of the latter, per The Ambrus Group’s Kris Sidial, “[o]utright tails in single stocks continue to be ‘cheap’ relative to what you are seeing in the broad market.”

“Market is discounting any sort of crash risk. Which seems reasonable granted that a lot of the current macro theme is geared towards a longer-term effect.”

Graphic: Retrieved from Bloomberg. Taken from Kris Sidial. “January 2022 was a time that was associated with really low vol (VIX = ~12). Consumer Staples Select Sector SPDR Fund (NYSE: XLP) 1M 80MNY tails today are only 4 vols over where they were during that time.”

Technical

As of 7:00 AM ET, Wednesday’s regular session (9:30 AM – 4:00 PM ET), in the S&P 500, is likely to open in the upper part of a negatively skewed overnight inventory, inside of prior-range and -value, suggesting a limited potential for immediate directional opportunity.

In the best case, the S&P 500 trades higher.

Any activity above the $3,909.25 MCPOC puts into play the $3,936.25 ONH. Initiative trade beyond the ONH could reach as high as the $3,965.25 HVNode and $4,001.00 VPOC, or higher.

In the worst case, the S&P 500 trades lower.

Any activity below the $3,909.25 MCPOC puts into play the $3,857.25 HVNode. Initiative trade beyond the latter could reach as low as the $3,826.25 and $3,770.75 HVNode, or lower.

Click here to load today’s key levels into the web-based TradingView charting platform. Note that all levels are derived using the 65-minute timeframe. New links are produced, daily.
Graphic: 65-minute profile chart of the Micro E-mini S&P 500 Futures.

Definitions

Volume Areas: A structurally sound market will build on areas of high volume (HVNodes). Should the market trend for long periods of time, it will lack sound structure, identified as low volume areas (LVNodes). LVNodes denote directional conviction and ought to offer support on any test. 

If participants were to auction and find acceptance into areas of prior low volume (LVNodes), then future discovery ought to be volatile and quick as participants look to HVNodes for favorable entry or exit.

POCs: POCs are valuable as they denote areas where two-sided trade was most prevalent in a prior day session. Participants will respond to future tests of value as they offer favorable entry and exit.

MCPOCs: POCs are valuable as they denote areas where two-sided trade was most prevalent over numerous day sessions. Participants will respond to future tests of value as they offer favorable entry and exit.

About

After years of self-education, strategy development, mentorship, and trial-and-error, Renato Leonard Capelj began trading full-time and founded Physik Invest to detail his methods, research, and performance in the markets.

Capelj also develops insights around impactful options market dynamics at SpotGamma and is a Benzinga reporter.

Some of his works include conversations with ARK Invest’s Catherine Wood, investors Kevin O’Leary and John Chambers, FTX’s Sam Bankman-Fried, ex-Bridgewater Associate Andy Constan, Kai Volatility’s Cem Karsan, The Ambrus Group’s Kris Sidial, among many others.

Disclaimer

In no way should the materials herein be construed as advice. Derivatives carry a substantial risk of loss. All content is for informational purposes only.

Categories
Commentary

Daily Brief For July 6, 2022

The daily brief is a free glimpse into the prevailing fundamental and technical drivers of U.S. equity market products. Join the 300+ that read this report daily, below!

Graphic updated 6:25 AM ET. Sentiment Neutral if expected /ES open is inside of the prior day’s range. /ES levels are derived from the profile graphic at the bottom of the following section. Levels may have changed since initially quoted; click here for the latest levels. SqueezeMetrics Dark Pool Index (DIX) and Gamma (GEX) calculations are based on where the prior day’s reading falls with respect to the MAX and MIN of all occurrences available. A higher DIX is bullish. At the same time, the lower the GEX, the more (expected) volatility. Learn the implications of volatility, direction, and moneyness. Breadth reflects a reading of the prior day’s NYSE Advance/Decline indicator. VIX reflects a current reading of the CBOE Volatility Index (INDEX: VIX) from 0-100.

What To Expect

Fundamental: Impressive was the strength of the Nasdaq 100 (INDEX: NDX), relative to the S&P 500 (INDEX: SPX), yesterday. 

Graphic: Via Charles Schwab Corporation-owned (NYSE: SCHW) TD Ameritrade’s Thinkorswim. Retrieved by Physik Invest.

This is as traders are now paring back their bets on monetary tightening, given the deterioration in the U.S. economic outlook. The NDX, which has been most sensitive to changes in monetary policies, accordingly, responded best as that index is comprised of assets that have the most to lose in a high-rate, aggressive quantitative tightening (QT) environment.

Graphic: Via Bloomberg. “In less than two weeks, the market has dropped its prediction for a peak rate brought forward the moment of the first cut, and forecasts a far more aggressive cutting program that will start next spring.”

For context, QT is the central banking authorities’ removal of balance sheet assets via sales or the non-reinvestment of the principal sum of maturing securities. Accordingly, if bonds are sold, their values fall and yields rise. This pushes yield-hungry investors into less risky categories.

Graphic: Retrieved from @patrick_saner. “A 60/40 portfolio is now worth less than before the pandemic.”

“As you look at where to park your cash for the next six months, you could do worse than to look at a mix of oversold treasuries and stocks – offering both compelling yield and a good degree of value protection,” explains Toggle CEO Jan Szilagyi in a note.

Graphic: Via Toggle.

These are comments, however, in the face of what has been a “multiple compression,” as we talked about last week. The upcoming earnings season is likely to shed clarity with respect to corporates’ ability to weather or pass on higher costs, among other things.

In the case of a so-called “earnings compression,” some commentators suggest the market is not priced correctly and another leg lower may be initiated.

Adding, expected are the Federal Open Market Committee (FOMC) meeting minutes, today. 

They are likely to “indicate that policymakers were worried about the un-anchoring of inflation expectations, … justifying the Fed’s shift in placing more focus on headline inflation measures rather than just core measures,” according to Bloomberg’s chief U.S. economist Anna Wong.

Graphic: Via Bloomberg. “After surging consistently to hit an all-time high in the two years after the March 2020 shutdown, the [Commodity Research Bureau Raw Industrials index] turned sharply southward.”

Positioning: Data shows net gamma exposure increasing which may increasingly feed into smaller ranges if prices continue to rise.

Further, continued are gaps between volatility measures for the rates and equity markets. This is, in part, due to the supply of volatility, as we’ve talked about in past commentaries.

The Ambrus Group’s Kris Sidial adds: “Another reason why equity vol on the index level has been so well offered is due to the structured products market continuing its dominance.”

“Investors are turning to alternatives in this market & these solutions continue to gain attention which leads to index level vol selling.”

Graphic: Via The Ambrus Group’s Kris Sidial. “[S]ome dealers will opportunistically look to sell vol in some buckets in the front of the term structure.”

Given this, the relationship between realized volatility (RVOL) has crept and, at times, exceeded that which the market has implied (IVOL). This, coupled with naive metrics for skew, suggests to us that it still makes sense to be a buyer of volatility, albeit via more complex structures.

Graphic: Via Pat Hennessy. “Tomorrow’s SPX expo (Jul1) is wildin… 26 vol for any strike with a 37 or 38 handle with a ridiculous curvature in the tails. God speed to all the 1dte theta gang. Selling OTM puts/calls for the same vol as ATM seems… umm… not good.”

Technical: As of 6:30 AM ET, Wednesday’s regular session (9:30 AM – 4:00 PM ET), in the S&P 500, is likely to open in the mid-to-upper part of a balanced overnight inventory, inside of prior-range and -value, suggesting a potential for immediate directional opportunity.

In the best case, the S&P 500 trades higher.

Any activity above the $3,821.50 LVNode puts into play the $3,857.25 ONH. Initiative trade beyond the ONH could reach as high as the $3,883.25 LVNode and $3,909.25 MCPOC, or higher.

In the worst case, the S&P 500 trades lower.

Any activity below the $3,821.50 LVNode puts into play the $3,793.25 HVNode. Initiative trade beyond the HVNode could reach as low as the $3,755.00 VPOC and $3,727.75 HVNode, or lower.

Click here to load today’s key levels into the web-based TradingView charting platform. Note that all levels are derived using the 65-minute timeframe. New links are produced, daily.
Graphic: 65-minute profile chart of the Micro E-mini S&P 500 Futures.

Definitions

Overnight Rally Highs (Lows): Typically, there is a low historical probability associated with overnight rally-highs (lows) ending the upside (downside) discovery process.

Volume Areas: A structurally sound market will build on areas of high volume (HVNodes). Should the market trend for long periods of time, it will lack sound structure, identified as low volume areas (LVNodes). LVNodes denote directional conviction and ought to offer support on any test. 

If participants were to auction and find acceptance into areas of prior low volume (LVNodes), then future discovery ought to be volatile and quick as participants look to HVNodes for favorable entry or exit.

POCs: POCs are valuable as they denote areas where two-sided trade was most prevalent in a prior day session. Participants will respond to future tests of value as they offer favorable entry and exit.

About

After years of self-education, strategy development, mentorship, and trial-and-error, Renato Leonard Capelj began trading full-time and founded Physik Invest to detail his methods, research, and performance in the markets.

Capelj also develops insights around impactful options market dynamics at SpotGamma and is a Benzinga reporter.

Some of his works include conversations with ARK Invest’s Catherine Wood, investors Kevin O’Leary and John Chambers, FTX’s Sam Bankman-Fried, former Bridgewater Associate Andy Constan, Kai Volatility’s Cem Karsan, The Ambrus Group’s Kris Sidial, among many others.

Disclaimer

In no way should the materials herein be construed as advice. Derivatives carry a substantial risk of loss. All content is for informational purposes only.

Categories
Commentary

Daily Brief For July 5, 2022

The daily brief is a free glimpse into the prevailing fundamental and technical drivers of U.S. equity market products. Join the 300+ that read this report daily, below!

Graphic updated 6:30 AM ET. Sentiment Neutral if expected /ES open is inside of the prior day’s range. /ES levels are derived from the profile graphic at the bottom of the following section. Levels may have changed since initially quoted; click here for the latest levels. SqueezeMetrics Dark Pool Index (DIX) and Gamma (GEX) calculations are based on where the prior day’s reading falls with respect to the MAX and MIN of all occurrences available. A higher DIX is bullish. At the same time, the lower the GEX, the more (expected) volatility. Learn the implications of volatility, direction, and moneyness. SHIFT data used for S&P 500 (INDEX: SPX) options activity. Note that options flow is sorted by the call premium spent; if more positive, then more was spent on call options. Breadth reflects a reading of the prior day’s NYSE Advance/Decline indicator. VIX reflects a current reading of the CBOE Volatility Index (INDEX: VIX) from 0-100.

What To Expect

Fundamental: In the headlines were the chip boom’s loss of steam, the Bank of England’s consideration of 50-year mortgages, the potential collapse or rise in oil by year-end, NATO’s resumption of expansion processes, slowing car sales, China tariffs reduction, Germany’s first monthly trade deficit since 1991 on inflation, and more.

Graphic: Via Bloomberg.

Key in last week’s narratives was U.S. manufacturing’s decline as new orders were below that of inventories.

Bloomberg’s John Authers explains that “[t]he signal grows even more discomforting if the new orders number is below the recessionary cutoff at 50.”

Graphic: Via Eric Basmajian. “Given that the ISM Manufacturing PMI holds a very strong correlation to earnings estimates, credit spreads, and more, the probability that we see further declines should be a warning sign that more turbulence is ahead in cyclical risk assets.”

“​​If the new story of imminent slowdown and a limited monetary tightening campaign turns out to be true, then the narrative on earnings will have to change. That positivity about earnings is what is keeping stocks from selling off far more,” Authers adds.

“The next couple of weeks will bring critical macro data on inflation and employment; but immediately after that, the earnings numbers will start to flow. It might not be pretty.”

Graphic: Via Charles Schwab Corporation-owned (NYSE: SCHW) TD Ameritrade’s Thinkorswim. The Eurodollar (FUTURE: /GE) futures curve is a reflection of participants’ outlook on interest rates. The peak of the Fed-rate-hike cycle – terminal rate – is around DEC 2022.

Positioning: Data on net gamma exposures points to more volatile ranges. 

Given the relationship between realized (RVOL) and implied (IVOL) volatility, as well as naive metrics for skew, it makes sense to not be a seller of volatility, especially in options that are short-dated and farther out.

Graphic: Via Pat Hennessy. “Tomorrow’s SPX expo (Jul1) is wildin… 26 vol for any strike with a 37 or 38 handle with a ridiculous curvature in the tails. God speed to all the 1dte theta gang. Selling OTM puts/calls for the same vol as ATM seems… umm… not good.”

Moreover, participants’ combined view is that markets are likely to head lower, via Deutsche Bank AG (NYSE: DB).

Graphic: Via Deutsche Bank AG (NYSE: DB). Taken from The Market Ear.

However, as we discussed in sessions prior, their demand for exposure to the upside resulted in “a flattening in the downside strike skew, while the upside wings have become more smiley.”

Graphic: Via JPMorgan Chase & Co (NYSE: JPM). Taken from The Market Ear.

A “higher starting point” in implied volatility (IVOL), and a still-present right-tail (from the positioning for a bear market rally), make it so we may position, for less cost, in short-dated structures with asymmetric payouts, on both sides of the market.

Read: For more on how to play, read the Daily Brief for June 30, 2022.

Technical: As of 6:30 AM ET, Tuesday’s regular session (9:30 AM – 4:00 PM ET), in the S&P 500, is likely to open in the middle part of a balanced overnight inventory, inside of prior-range and -value, suggesting a limited potential for immediate directional opportunity.

In the best case, the S&P 500 trades higher.

Any activity above the $3,821.50 LVNode puts into play the $3,857.25 ONH. Initiative trade beyond the ONH could reach as high as the $3,883.25 LVNode and $3,909.25 MCPOC, or higher.

In the worst case, the S&P 500 trades lower.

Any activity below the $3,821.50 LVNode puts into play the $3,793.75 HVNode. Initiative trade beyond the HVNode could reach as low as the $3,777.00 VPOC and $3,727.75 HVNode, or lower.

Click here to load today’s key levels into the web-based TradingView charting platform. Note that all levels are derived using the 65-minute timeframe. New links are produced, daily.
Graphic: 65-minute profile chart of the Micro E-mini S&P 500 Futures.

Definitions

Overnight Rally Highs (Lows): Typically, there is a low historical probability associated with overnight rally-highs (lows) ending the upside (downside) discovery process.

Volume Areas: A structurally sound market will build on areas of high volume (HVNodes). Should the market trend for long periods of time, it will lack sound structure, identified as low volume areas (LVNodes). LVNodes denote directional conviction and ought to offer support on any test. 

If participants were to auction and find acceptance into areas of prior low volume (LVNodes), then future discovery ought to be volatile and quick as participants look to HVNodes for favorable entry or exit.

POCs: POCs are valuable as they denote areas where two-sided trade was most prevalent in a prior day session. Participants will respond to future tests of value as they offer favorable entry and exit.

About

After years of self-education, strategy development, mentorship, and trial-and-error, Renato Leonard Capelj began trading full-time and founded Physik Invest to detail his methods, research, and performance in the markets.

Capelj also develops insights around impactful options market dynamics at SpotGamma and is a Benzinga reporter.

Some of his works include conversations with ARK Invest’s Catherine Wood, investors Kevin O’Leary and John Chambers, FTX’s Sam Bankman-Fried, former Bridgewater Associate Andy Constan, Kai Volatility’s Cem Karsan, The Ambrus Group’s Kris Sidial, among many others.

Disclaimer

In no way should the materials herein be construed as advice. Derivatives carry a substantial risk of loss. All content is for informational purposes only.

Categories
Commentary

Daily Brief For July 1, 2022

The daily brief is a free glimpse into the prevailing fundamental and technical drivers of U.S. equity market products. Join the 300+ that read this report daily, below!

What Happened

Overnight, equity index futures were sideways to lower. Commodities and bonds were mixed. Implied volatility measures fell. The dollar rose.

A volatile quarter-end ahead of a long weekend. Noteworthy is the market’s responsiveness to visual levels. For instance, the S&P 500’s (FUTURE: /ES) high of the day printed at $3,821.50 or so, a key level in yesterday’s morning letter. 

This points to heightened activity by technically-driven traders with short time horizons. Such traders often lack the wherewithal to defend retests and, additionally, the type of trade may be indicative of the other time frame participants waiting for more information to initiate trades.

Moreover, on an annual basis, core inflation was the lowest since November while consumers’ spending cooled suggesting the economy is on a weaker footing. In Europe, inflation hit a record, boosting calls for more aggressive monetary policy action.

Adding, Goldman Sachs Group Inc (NYSE: GS) strategists see equity valuations falling further “[u]nless bond yields start to decline and buffer rising equity risk premiums.” Michael Burry, the Founder of Scion Asset Management, too, sees declines lasting on “earnings compression.”

Ahead is data on S&P Global Inc’s (NYSE: SPGI) manufacturing PMI (9:45 AM ET), as well as the ISM manufacturing index and construction spending (10:00 AM ET).

Graphic updated 6:45 AM ET. Sentiment Neutral if expected /ES open is inside of the prior day’s range. /ES levels are derived from the profile graphic at the bottom of the following section. Levels may have changed since initially quoted; click here for the latest levels. SqueezeMetrics Dark Pool Index (DIX) and Gamma (GEX) calculations are based on where the prior day’s reading falls with respect to the MAX and MIN of all occurrences available. A higher DIX is bullish. At the same time, the lower the GEX, the more (expected) volatility. Learn the implications of volatility, direction, and moneyness. SHIFT data used for S&P 500 (INDEX: SPX) options activity. Note that options flow is sorted by the call premium spent; if more positive, then more was spent on call options. Breadth reflects a reading of the prior day’s NYSE Advance/Decline indicator. VIX reflects a current reading of the CBOE Volatility Index (INDEX: VIX) from 0-100.

What To Expect

Fundamental: A bit philosophical here, today, as a difficult half-year has passed and I’m low on the time I have to commit to analysis this morning.

Markets are substantially lower from the end of 2021, all the while there are now, in greater quantity and frequency, calls being made that equities have more room to the downside.

That very well may be the case, and the upcoming earnings season is likely to provide investors clarity with respect to corporates’ ability to weather or pass on higher costs, among other things.

Read: Former Bridgewater Associate Talks Recession Odds, Capturing A Macro Edge.

Regardless, everything we discuss on a daily basis – fundamental and technical market drivers – will do little for us if we do not have a framework for assessing risk and opportunity

Before ever taking a position, I ask myself the following: What is it that I have to lose? For me, the answer depends. 

At times, it is dependent on a position’s payoff profile. At others, it’s the max pain I’m willing to subject myself to during adverse market conditions or when I have limited mental capital. 

As Dennis Gartman of the Gartman Letter said:

“Capital comes in two varieties: Mental and that which is in your pocket or account.”

“[T]he mental is the more important and expensive of the two. Holding to losing position costs measurable sums of actual capital, but costs immeasurable sums of mental capital.”

Graphic: Retrieved from Twitter. Dennis Gartman’s Rules of Trading.

And, with that, the other key is that the money is made in not losing it. Fortunately, this law was impressed on me, early. Returning 100%, only to suffer a 50% loss, sets you back to where you were, initially.

These comments are pursuant to traders I’ve had the honor of connecting with over the past year or so. Many made a killing to only have given most, if not all of it, back.

This has an immeasurable effect on one’s mental capital.

Though I’ve not participated in the most recent weaknesses, my mental capital has suffered. I’ve, subsequently, reduced the size of my positions and opted to define my losses, buying into volatility while it is cheap, as I view it, and waiting for the relationship to flip to sell in size.

Returning to the comment on whether the market’s de-rate has played out. I do not know. Can it go further? Probably. There are a host of references converging below current market prices, as pointed to in the Technicals section, below, that probably are taken at some point in the year.

That said, whether long or short, ask what it is that you have to lose? 

If it’s a number, define your loss and take the trade. Take (or provide) liquidity when others don’t want to. Buy (or sell) volatility when it is cheap (or expensive). Let the trade work.

It’s a coinflip, probably, at the end of the day. If we know what we have to gain and lose, we’ve moved the expected outcome that much further our way. Have a good long weekend, team.

Read: A guide to making money for individual traders retrieved from SqueezeMetrics.

Technical: As of 6:30 AM ET, Friday’s regular session (9:30 AM – 4:00 PM ET), in the S&P 500, will likely open in the middle part of a balanced overnight inventory, inside of prior-range and -value, suggesting a limited potential for immediate directional opportunity.

In the best case, the S&P 500 trades higher; activity above the $3,770.25 HVNode puts in play the $3,793.75 HVNode. Initiative trade beyond the latter HVNode could reach as high as the $3,821.50 LVNode and $3,840.75 ONH, or higher.

In the worst case, the S&P 500 trades lower; activity below the $3,770.25 HVNode puts in play the $3,727.75 HVNode. Initiative trade beyond the latter HVNode could reach as low as the $3,688.75 HVNode and $3,639.00 RTH Low, or lower.

Click here to load today’s key levels into the web-based TradingView charting platform. Note that all levels are derived using the 65-minute timeframe. New links are produced, daily.
Graphic: 65-minute profile chart of the Micro E-mini S&P 500 Futures.

Considerations: At $3,500.00 in the S&P 500 (INDEX: SPX), or $350.00 in the SPDR S&P 500 ETF Trust (NYSE: SPY) is the convergence of multiple visual references.

The 50.00% retracement (COVID-19 low through to 2021 peak), the 200-week moving average, and the volume-weighted average price anchored from the 2018 market bottom all converge at this $3,500.00 ($350.00) high open interest strike.

Graphic: Via TradingView. Taken by Physik Invest. SPDR S&P 500 ETF Trust (NYSE: SPY).

Definitions

Overnight Rally Highs (Lows): Typically, there is a low historical probability associated with overnight rally-highs (lows) ending the upside (downside) discovery process.

Volume Areas: A structurally sound market will build on areas of high volume (HVNodes). Should the market trend for long periods of time, it will lack sound structure, identified as low volume areas (LVNodes). LVNodes denote directional conviction and ought to offer support on any test. 

If participants were to auction and find acceptance into areas of prior low volume (LVNodes), then future discovery ought to be volatile and quick as participants look to HVNodes for favorable entry or exit.

About

After years of self-education, strategy development, mentorship, and trial-and-error, Renato Leonard Capelj began trading full-time and founded Physik Invest to detail his methods, research, and performance in the markets.

Capelj also develops insights around impactful options market dynamics at SpotGamma and is a Benzinga reporter.

Some of his works include conversations with ARK Invest’s Catherine Wood, investors Kevin O’Leary and John Chambers, FTX’s Sam Bankman-Fried, Kai Volatility’s Cem Karsan, The Ambrus Group’s Kris Sidial, among many others.

Disclaimer

In no way should the materials herein be construed as advice. Derivatives carry a substantial risk of loss. All content is for informational purposes only.

Categories
Commentary

Daily Brief For June 30, 2022

The daily brief is a free glimpse into the prevailing fundamental and technical drivers of U.S. equity market products. Join the 300+ that read this report daily, below!

What Happened

Overnight, equity index and commodity futures auctioned lower while bonds, the dollar, and implied volatility metrics were bid at the tail-end of the quarterly rebalancing period.

Participants have bet on a half-point rate cut in 2023 amid heightened recession odds, all the while the projected target rate sits in the range of 2.25-2.50% for the July 27, 2022 meeting.

Pursuant to this letter’s remarks in the days prior, trades biased long volatility are performing well, particularly those structured a standard deviation and beyond prior prices. We’ll unpack why that is, today.

Ahead is data on PCE inflation, disposable income, and consumer spending, as well as jobless claims (8:30 AM ET) and Chicago PMI (9:45 AM ET).

Graphic updated 6:30 AM ET. Sentiment Risk-Off if expected /ES open is below the prior day’s range. /ES levels are derived from the profile graphic at the bottom of the following section. Levels may have changed since initially quoted; click here for the latest levels. SqueezeMetrics Dark Pool Index (DIX) and Gamma (GEX) calculations are based on where the prior day’s reading falls with respect to the MAX and MIN of all occurrences available. A higher DIX is bullish. At the same time, the lower the GEX, the more (expected) volatility. Learn the implications of volatility, direction, and moneyness. SHIFT data used for S&P 500 (INDEX: SPX) options activity. Note that options flow is sorted by the call premium spent; if more positive, then more was spent on call options. Breadth reflects a reading of the prior day’s NYSE Advance/Decline indicator. VIX reflects a current reading of the CBOE Volatility Index (INDEX: VIX) from 0-100.

What To Expect

Fundamental: Discussed in recent letters were the prospects of whether a recession would be necessary for stemming inflation.

Read: The Fed needs to remove the heat from the demand without prompting an accident among mortgage financiers.

Graphic: Via Bloomberg. “[W]hat’s happened to mortgage-backed bonds this year is a radical departure. Bloomberg’s index dates back to 1988 when the asset class was still in its infancy. This is the first time it has ever withstood a decline that stretches into double figures.”

“That’s the message the market took,” Bloomberg’s John Authers explained. “[T]he most painful surprise over the second half of this year would be for inflation to stay sticky.”

“That would quash the belief in a swift easing campaign in 2023.”

Graphic: CME Group Inc’s (NASDAQ: CME) FedWatch Tool.

Some, like the Federal Reserve’s (Fed) Loretta Mester, suggest that gone are the days to err on the side of being too accommodative.

“It also calls into question the conventional view that monetary policy should always look through supply shocks,” Mester said. “In some circumstances, such shocks could threaten the stability of inflation expectations and would require policy action.”

Graphic: Via Bloomberg. “The Richmond Fed’s survey of manufacturing isn’t generally one of the most closely monitored releases, but as this one was the worst since the Great Recession (barring only one month during the Covid shutdown), it garnered more attention than usual.”

Moreover, the Fed’s preferred inflation measure – the personal consumption expenditure deflator (PCE) – is set to update. The expectation is that core PCE drops, “thanks to base effects from last year,” bolstering the “narrative that inflation will soon be licked.”

Graphic: Via Bloomberg.

Positioning: Discussed, earlier this week, was whether it made sense to lean toward owning volatility, rather than selling it outright.

A “higher starting point” in implied volatility (IVOL), and a still-present right-tail (from the positioning for a bear market rally), made it so we could position, for less cost, in short-dated structures with asymmetric payouts, on both sides of the market.

Read: Trading Volatility, Correlation, Term Structure and Skew by Colin Bennett et al. Originally sourced via Academia.edu.

For instance, S&P 500 (INDEX: SPX) spreads +1 (near-the-money) x -2 (out-of-the-money), in excess of 200 points or so in width and up to 15 days to expiration, are performing well, today, pricing in excess of a 600% gain, only after pricing for little to no cost to enter in the days prior.

Disclaimer: Have delta in the direction you want the market to move, as well as positive gamma. In our case, we wanted negative delta (short bias) and positive gamma (profits amplified).

Graphic: Via Glyn Holton. “Positive gamma corresponds to curvature that opens upward. Negative gamma corresponds to curvature that opens downward.”

Recent market weaknesses will allow us to monetize and rotate those proceeds into speculative directional bets on the call-side, potentially. After all, the money is made in not losing it. Stay nimble. These are not trade recommendations. Be open-minded.

Graphic: Via Pat Hennessy. “[T]he performance of short-dated 1×2 put ratios in SPX this year. Despite being short the tail, the grind lower has been well captured by this trade structure.”

Technical: As of 6:30 AM ET, Thursday’s regular session (9:30 AM – 4:00 PM ET), in the S&P 500, will likely open in the lower part of a negatively skewed overnight inventory, outside of prior-range and -value, suggesting a potential for immediate directional opportunity.

In the best case, the S&P 500 trades higher; activity above the $3,770.75 HVNode puts in play the $3,793.25 Ledge. Initiative trade beyond the Ledge could reach as high as the $3,821.50 LVNode and $3,840.75 ONH, or higher.

In the worst case, the S&P 500 trades lower; activity below the $3,770.75 HVNode puts in play the $3,735.75 HVNode. Initiative trade beyond the HVNode could reach as low as the $3,722.50 LVNode and $3,696.00 LVNode, or lower.

Click here to load today’s key levels into the web-based TradingView charting platform. Note that all levels are derived using the 65-minute timeframe. New links are produced, daily.
Graphic: 65-minute profile chart of the Micro E-mini S&P 500 Futures.

Considerations: Responsiveness near key-technical areas (that are discernable visually on a chart), suggests technically-driven traders with short time horizons are very active. 

Such traders often lack the wherewithal to defend retests and, additionally, the type of trade may be indicative of the other time frame participants waiting for more information to initiate trades.

Definitions

Overnight Rally Highs (Lows): Typically, there is a low historical probability associated with overnight rally-highs (lows) ending the upside (downside) discovery process.

Volume Areas: A structurally sound market will build on areas of high volume (HVNodes). Should the market trend for long periods of time, it will lack sound structure, identified as low volume areas (LVNodes). LVNodes denote directional conviction and ought to offer support on any test. 

If participants were to auction and find acceptance into areas of prior low volume (LVNodes), then future discovery ought to be volatile and quick as participants look to HVNodes for favorable entry or exit.

About

After years of self-education, strategy development, mentorship, and trial-and-error, Renato Leonard Capelj began trading full-time and founded Physik Invest to detail his methods, research, and performance in the markets.

Capelj also develops insights around impactful options market dynamics at SpotGamma and is a Benzinga reporter.

Some of his works include conversations with ARK Invest’s Catherine Wood, investors Kevin O’Leary and John Chambers, FTX’s Sam Bankman-Fried, Kai Volatility’s Cem Karsan, The Ambrus Group’s Kris Sidial, among many others.

Disclaimer

In no way should the materials herein be construed as advice. Derivatives carry a substantial risk of loss. All content is for informational purposes only.

Categories
Commentary

Daily Brief For June 29, 2022

The daily brief is a free glimpse into the prevailing fundamental and technical drivers of U.S. equity market products. Join the 300+ that read this report daily, below!

What Happened

Overnight, equity index futures traded sideways-to-lower, keeping intact the bearish tone from yesterday. Commodities were mixed. Bonds, the dollar, and implied volatility were bid.

At a micro-level, the selling was not similar to that of past market turmoil events. Instead, stocks were sold, but on the back of tame and steady volumes. Adding, the market’s responsiveness to key visual areas may mean that participants with shorter time horizons are more active, pointing to the potential that those with larger horizons are waiting for better entry or more information.

In terms of the news, similar to yesterday, narratives remain uninspiring. The key is that there are signs that inflation may soon turn the corner, as discussed in yesterday morning’s letter. In accordance with that perspective are comments by trader and macro strategist Andy Constan, who this letter’s author spoke with last week and will share insights extracted, below.

Ahead is data on GDP (8:30 AM ET), as well as talks by Federal Reserve (Fed) and European Central Bank (ECB) officials (9:00 AM ET, 11:30 AM ET, and 1:05 PM ET).

Graphic updated 6:40 AM ET. Sentiment Risk-Off if expected /ES open is below the prior day’s range. /ES levels are derived from the profile graphic at the bottom of the following section. Levels may have changed since initially quoted; click here for the latest levels. SqueezeMetrics Dark Pool Index (DIX) and Gamma (GEX) calculations are based on where the prior day’s reading falls with respect to the MAX and MIN of all occurrences available. A higher DIX is bullish. At the same time, the lower the GEX, the more (expected) volatility. Learn the implications of volatility, direction, and moneyness. SHIFT data used for S&P 500 (INDEX: SPX) options activity. Note that options flow is sorted by the call premium spent; if more positive, then more was spent on call options. Breadth reflects a reading of the prior day’s NYSE Advance/Decline indicator. VIX reflects a current reading of the CBOE Volatility Index (INDEX: VIX) from 0-100.

What To Expect

Perspectives: This letter’s objective is to provide salient information one may use in developing a tradeable narrative. Today, we’re taking a different approach and adding some diversity to the format by threading important points from the conversation Physik Invest’s Renato Capelj had with trader and macro strategist Andy Constan, the CEO and CIO of Damped Spring Advisors.

Without further ado, here it is.

The University of Pennsylvania alumnus had his start in finance in the 1980s when he joined Salomon Brothers. There, he excelled quickly and was the “go-to for questions.”

At one point, Salomon tapped Constan for his assistance with the 1987 stock market crash where he learned more about self-reinforcing market strains and how dynamic hedging processes may manifest market volatility.

Constan, later, managed Salomon’s derivatives operations, as well as the sale of those services. He said a lot of his success, in those years, was owed to making “everything systematic” and “operat[ing] with a framework.”

He, then, spent some time at Ray Dalio’s Bridgewater Associates where he was key in the firm’s research on volatility as an asset class. The lesson Bridgewater instilled was to “spend time finding the persistent trade,” parameterizing and executing, accordingly.

The alpha stream from the capture of that systemic edge is an asset itself.

Through the decades of experience, Constan eventually pivoted after recognizing that edges built on top of relative value (RV) – “the capture of inefficiencies generated from some form of concentrated positioning that pushes assets out of whack” – would fail on macro happenings.

Most noteworthy were Constan’s comments on the market’s de-rate

As we’ve talked about in this letter in the past, for decades monetary policies were the go-to instrument for stimulation. This money stocked a technological revolution, bolstered the supply of goods, and, by that token, promoted deflation, which was kept at bay by rising asset prices.

Trends in the geopolitical climate, a focus on fiscal stimulation, as well as supply chokepoints, have stoked goods and services inflation. The commitment to addressing inequality, as well as misallocations of capital through a tightening of liquidity and credit has consequences on the economy and asset prices, which are highly connected given multi-decade trends.

Stemming inflation, via supply-side economics, alone, is folly, as explained in the article. Trends like de-globalization are destructive to prosperity.

“The most destructive things to future prosperity are the tendencies that have developed over the last five years, like Brexit, the border wall, and the war in Ukraine. Comparative advantages, which globalization is essential for, generates uninsured supply chains and now we’re spending money on insurance.”

As the article explains, at its core, prices are set by the equilibrium between the supply and demand for goods. Both are not in line, and the stimulative monetary policies that helped keep the supply-side in check are not on the table, all the while supply chain replication is not adding to production.

Though that’s inflationary, political gridlock is a dampener on the trend.

What about the more pressing matter? Are we in a recession? 

The simple answer is yes, and 2022 is likely to be a 1% total GDP year with a 4% inflation rate. That said, an equity market recovery is not off the table.

We’re in a recession — a period of modestly to significantly below-trend growth — and the fiscal side would have to not force the Fed to do more by having a large spending bill which would hurt markets in a meaningful way.”

On the expression of opinions, Constan’s preferred method is to use defined risk options trades structured around his macro theses two to four months out in maturity. 

If volatility is rich, he will lean on selling credit. If volatility is cheap, he will opt to buy spreads. 

“I want deltas and leverage. My macro indicators give me an edge on price and in the worst case, the loss is limited to 10%, if everything has to go against me all at once. I can be 100% invested and only risk 10%.”

Read Full-Text: Former Bridgewater Associate Talks Recession Odds, Capturing A Macro Edge

Follow Andy Constan on Twitter, here.

Positioning: Little has changed. The volatility that the markets are realizing (RVOL) is high and, at times, in excess of that implied (IVOL). 

To cut to the chase, there’s a “higher starting point” in IVOL, and a still-present right-tail (from the positioning for a bear market rally).

Graphic: Taken by Physik Invest from Interactive Brokers Group Inc (NASDAQ: IBKR) on 6/24/2022. Multi-expiry skew in the Invesco QQQ Trust Series 1 (NASDAQ: QQQ). Notice the v-shape in the shorter maturity and smirk in the longer maturity. Here’s what that means.

Both make it so we may, for zero or no cost, trade short-dated structures with asymmetric payouts.

Read: Trading Volatility, Correlation, Term Structure and Skew by Colin Bennett et al. Originally sourced via Academia.edu.

Graphic: Via Banco Santander SA (NYSE: SAN) research, the return profile, at expiry, of a classic 1×2 (long 1, short 2 further away) ratio spread (the inverse of a back spread).

Technical: As of 6:30 AM ET, Wednesday’s regular session (9:30 AM – 4:00 PM ET), in the S&P 500, will likely open in the lower part of a negatively skewed overnight inventory, outside of prior-range and -value, suggesting a potential for immediate directional opportunity.

In the best case, the S&P 500 trades higher; activity above the $3,821.50 LVNode puts in play the $3,836.25 ONH. Initiative trade beyond the ONH could reach as high as the $3,883.25 LVNode and $3,909.25 MCPOC, or higher.

In the worst case, the S&P 500 trades lower; activity below the $3,821.50 LVNode puts in play the $3,793.25 Ledge. Initiative trade beyond the Ledge could reach as low as the $3,770.75 and $3,735.75 HVNode, or lower.

Click here to load today’s key levels into the web-based TradingView charting platform. Note that all levels are derived using the 65-minute timeframe. New links are produced, daily.
Graphic: 65-minute profile chart of the Micro E-mini S&P 500 Futures.

Considerations: Push-and-pull (responsiveness) near key-technical areas (that are discernable visually on a chart), suggests technically-driven traders with short time horizons are very active. 

Such traders often lack the wherewithal to defend retests and, additionally, the type of trade may be indicative of the other time frame participants waiting for more information to initiate trades.

What People Are Saying

Definitions

Overnight Rally Highs (Lows): Typically, there is a low historical probability associated with overnight rally-highs (lows) ending the upside (downside) discovery process.

Volume Areas: A structurally sound market will build on areas of high volume (HVNodes). Should the market trend for long periods of time, it will lack sound structure, identified as low volume areas (LVNodes). LVNodes denote directional conviction and ought to offer support on any test. 

If participants were to auction and find acceptance into areas of prior low volume (LVNodes), then future discovery ought to be volatile and quick as participants look to HVNodes for favorable entry or exit.

MCPOCs: POCs are valuable as they denote areas where two-sided trade was most prevalent over numerous day sessions. Participants will respond to future tests of value as they offer favorable entry and exit.

Volume-Weighted Average Prices (VWAPs): A metric highly regarded by chief investment officers, among other participants, for quality of trade. Additionally, liquidity algorithms are benchmarked and programmed to buy and sell around VWAPs.

About

After years of self-education, strategy development, mentorship, and trial-and-error, Renato Leonard Capelj began trading full-time and founded Physik Invest to detail his methods, research, and performance in the markets.

Capelj also develops insights around impactful options market dynamics at SpotGamma and is a Benzinga reporter.

Some of his works include conversations with ARK Invest’s Catherine Wood, investors Kevin O’Leary and John Chambers, FTX’s Sam Bankman-Fried, Kai Volatility’s Cem Karsan, The Ambrus Group’s Kris Sidial, among many others.

Disclaimer

In no way should the materials herein be construed as advice. Derivatives carry a substantial risk of loss. All content is for informational purposes only.