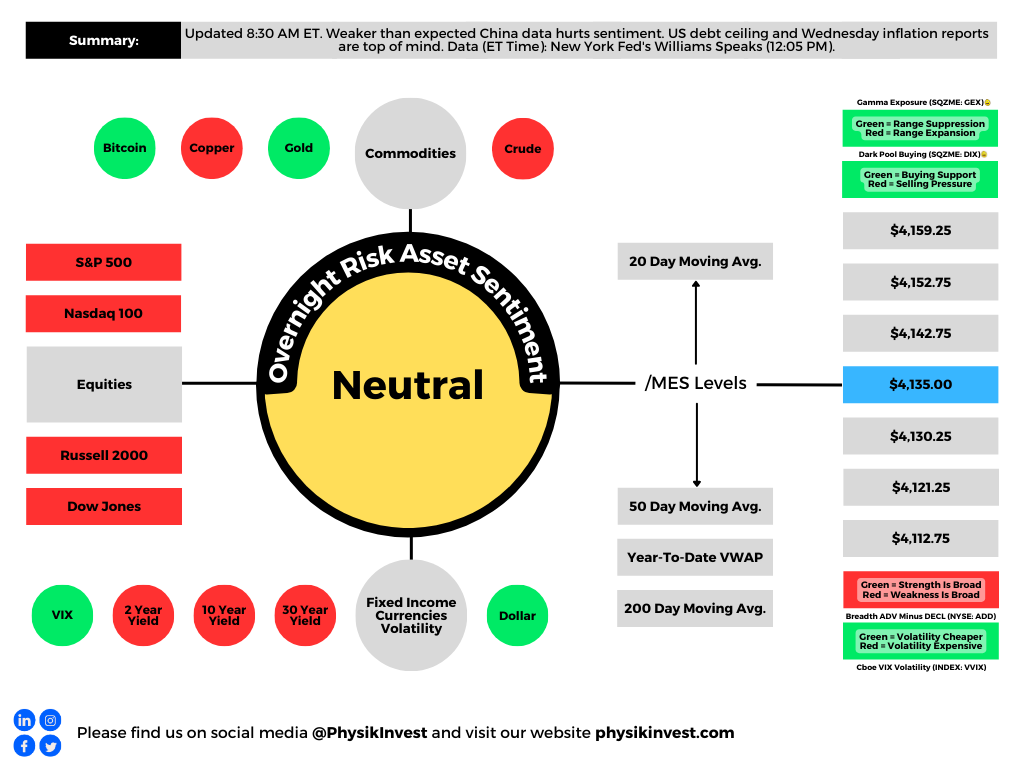
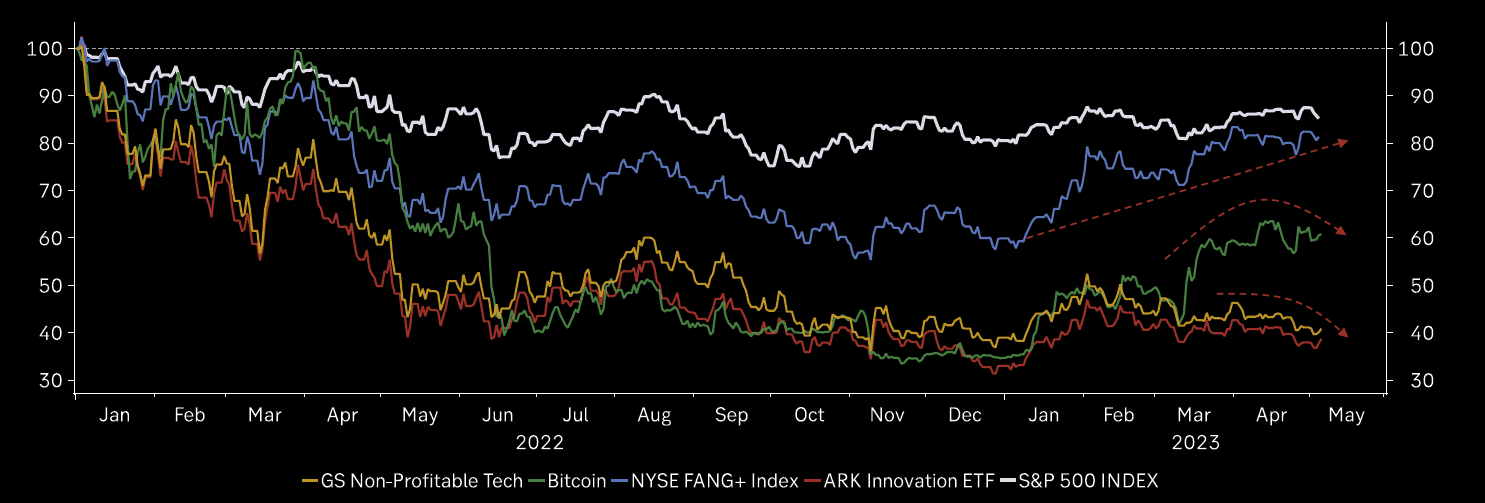
Sentiment calmer on the heels of some weaker-than-expected data from China. Generally speaking, markets are holding well, led by technology and innovation.
Graphic: Retrieved from Goldman Sachs Group Inc (NYSE: GS) via The Market Ear.
Price doesn’t tell the whole story, however. Breadth is softening while market boosters are slowly being picked off. Tier1Alpha says that “1-month realized volatility rose nearly 13%, [and] … if volatility continues to rise, it will have an outsized effect on the 1-month vol, as the sample is now largely filled by the smaller returns we experienced in April.” Altogether, this “could result in larger [selling] flows being triggered from systematic strategies that use volatility scaling as a means for risk control.”
Graphic: Retrieved from Bespoke Investment Group via The Market Ear.
“With that vol premium getting squeezed out, there is little room for error,” SpotGamma adds; uncertainties that may manifest pressure and compound weaknesses under the hood include inflation reports and the debt ceiling issue.
“The next big moment comes Tuesday, when President Joe Biden is scheduled to meet House Speaker Kevin McCarthy and other congressional leaders,” Bloomberg explains. “The meeting is high stakes. Republican leaders want promises of future spending cuts before they approve a higher ceiling, while Biden is insisting on a ‘clean’ increase.”
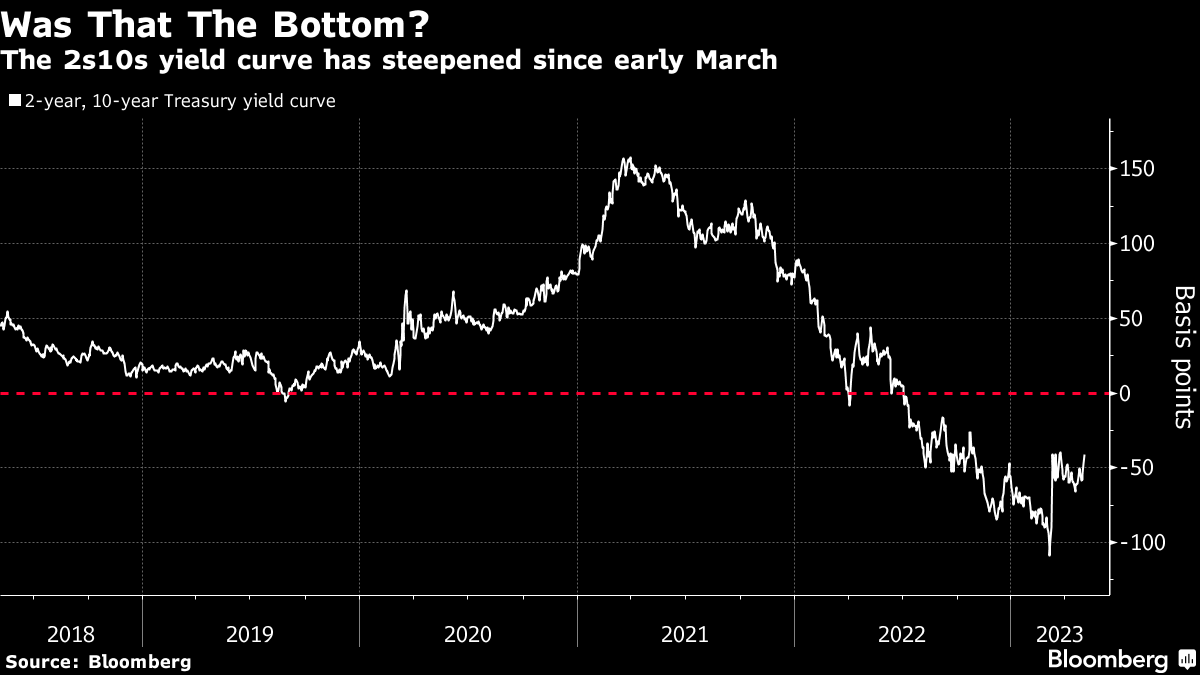
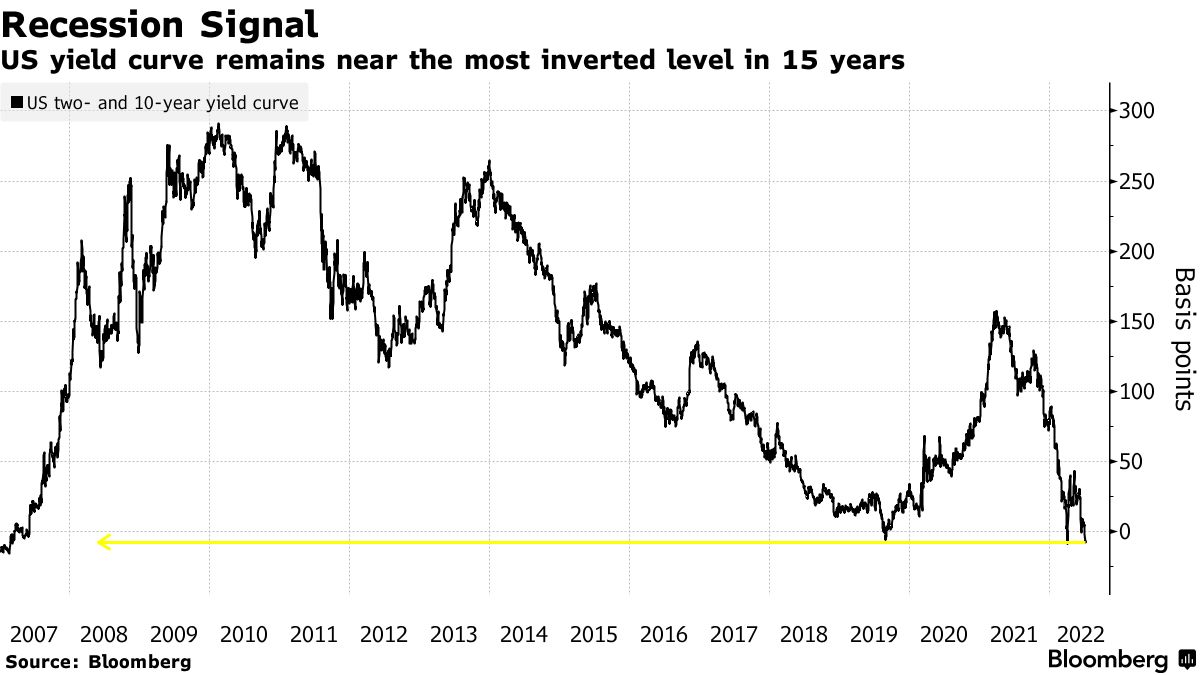
Further, traders expect increased chances of rate cuts. This may not be outlandish; “Looking at the past 17 hiking episodes, the two-year, 10-year Treasury yield curve bottoms out 108 trading days before the first rate cut.”
“Using that guide, the 2s10s curve reached negative 111 basis points on March 8 and has since steepened to about negative 41 basis points. Assuming that marked the trough, 108 trading days lands in mid-August — sandwiched between the Fed’s July 26 and September 20 rate decisions.”
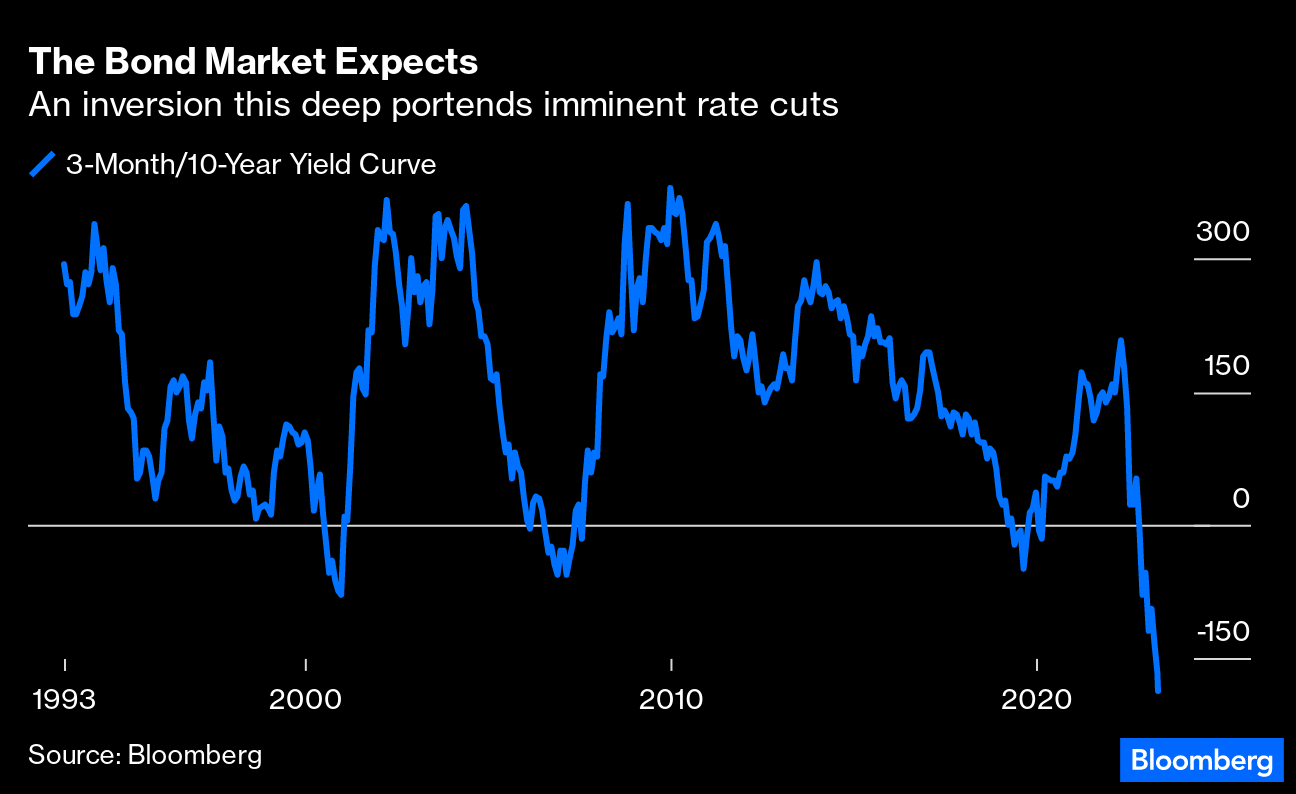
Graphic: Retrieved from Bloomberg. “Look at the gap between the three-month and the 10-year yields, generally regarded as a surefire recession indicator. It’s also a great indicator of imminent rate cuts. An inversion is also a timing signal because it makes little or no sense unless you’re confident that rate cuts will be starting soon. And over the last 30 years, the curve has never been as inverted as it is now.”
For better hedging participation in market upside, check out Physik Invest’s recently published trade structuring report.
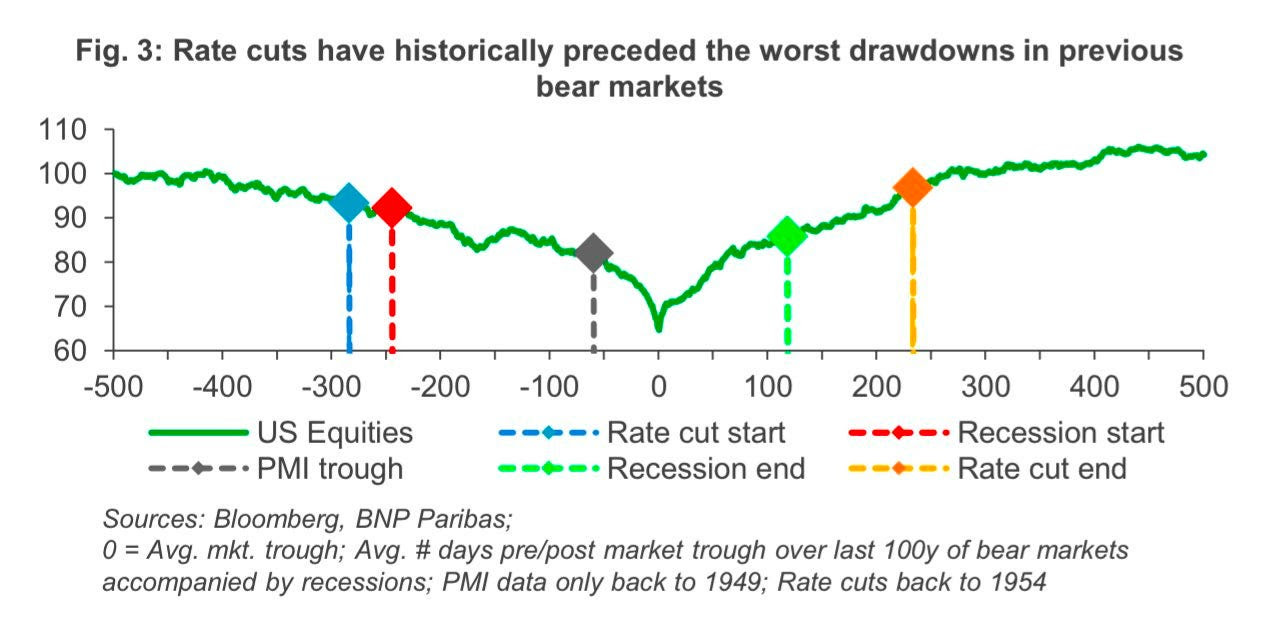
Graphic: Retrieved from BNP Paribas (OTC: BNPQY) via Bloomberg. JPMorgan Chase & Co (NYSE: JPM) strategists say that “the first quarter will likely be the high point for stocks this year, … adding that equities won’t reach lows until the Fed has pivoted to rate cuts.”
About
Welcome to the Daily Brief by Physik Invest, a soon-to-launch research, consulting, trading, and asset management solutions provider. Learn about our origin story here, and consider subscribing for daily updates on the critical contexts that could lend to future market movement.
Separately, please don’t use this free letter as advice; all content is for informational purposes, and derivatives carry a substantial risk of loss. At this time, Capelj and Physik Invest, non-professional advisors, will never solicit others for capital or collect fees and disbursements. Separately, you may view this letter’s content calendar at this link.
Inflation and employment rates remain high. Additionally, consumers show resilience, and earnings are strong. As a consequence, markets are back to pricing higher rates for longer. This is a pressure on bonds and stocks which appear “overvalued relative to coming bad news on both economic growth and corporate earnings.”
Graphic: Retrieved from Bloomberg via @Marcomadness2. Hedge funds are net short 2Y and SOFR futures.
Morgan Stanley (NYSE: MS) says stocks are at risk of a pullback, accordingly.
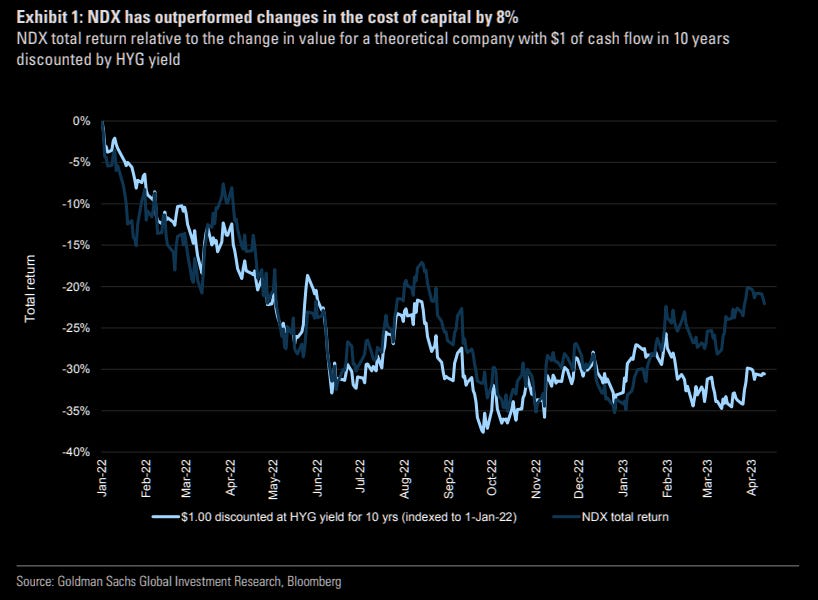
Graphic: Retrieved from Goldman Sachs Group Inc (NYSE: GS) via The Market Ear. The indexes have front-run the pause and pivot; Goldman Sachs Group Inc (NYSE: GS) data suggests a statistically significant disconnect between the Nasdaq 100 (INDEX: NDX) and yield.
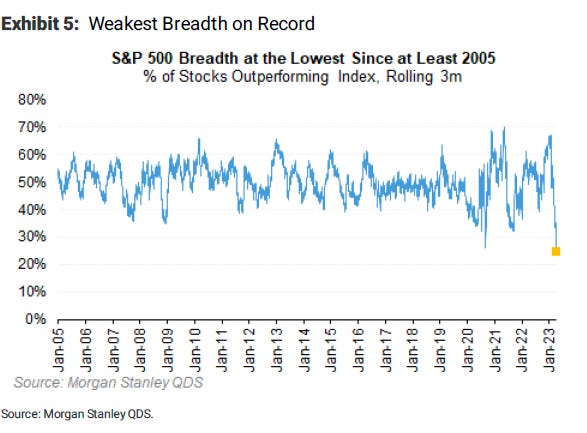
With the percentage of stocks outperforming the S&P 500 the lowest on record, MS added, a slump in technology is the big risk if yields continue to rise; the bear market is not yet over. “If there is one thing that can throw cold water on the large mega-cap rally, it’s higher yields due to a Fed that can’t stop hiking.”
Graphic: Retrieved from Morgan Stanley (NYSE: MS) via Bloomberg.
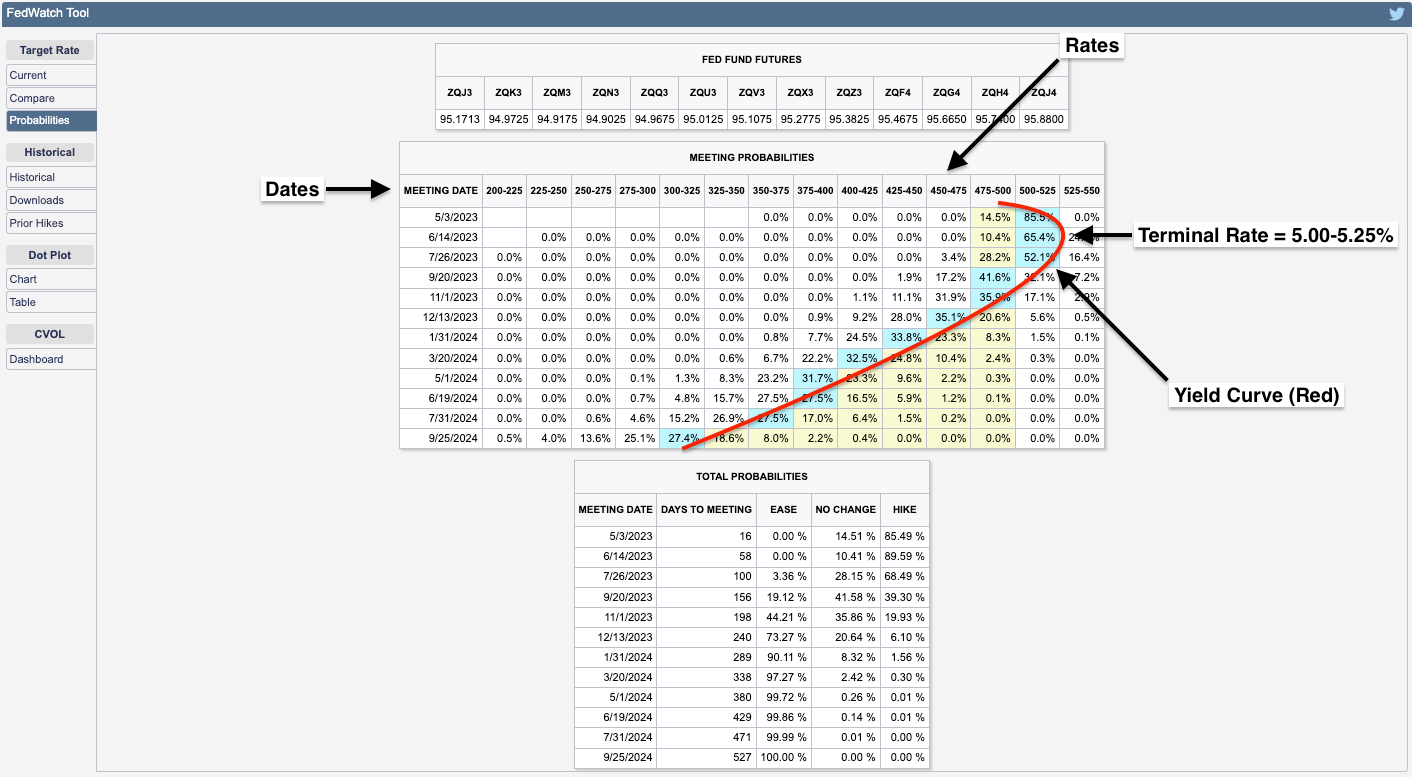
Moody’s Corporation (NYSE: MCO) expects a “0.25-percentage point increase to the fed funds rate when the FOMC reconvenes in early May.” Following this hike, there is likely to be a pause at a 5.00-5.25% terminal rate for a few months.
Graphic: Retrieved from CME Group Inc’s (NASDAQ: CME) FedWatch Tool.
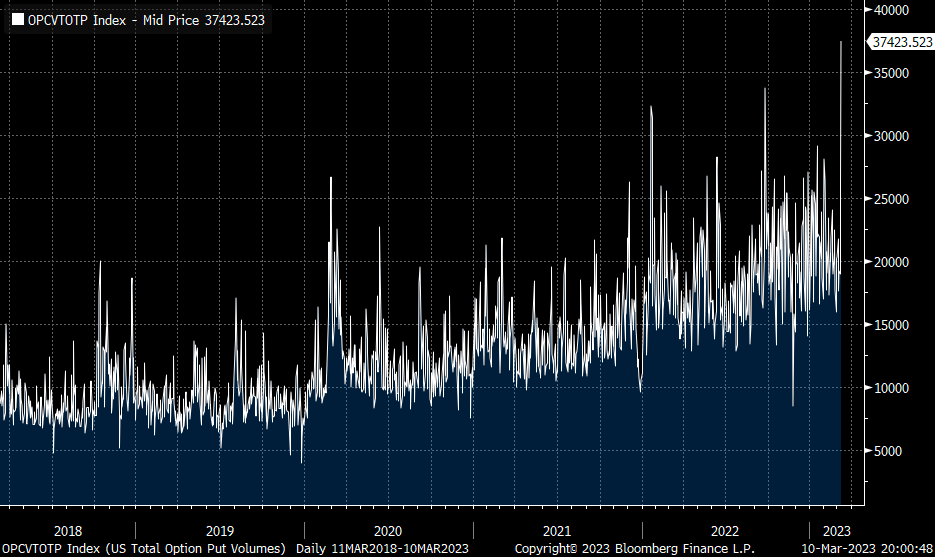
From a positioning perspective, Kai Volatility’s Cem Karsan stated that in the past 6-9 months, there has been a significant increase in the volume of options with zero days to expiration (0 DTE), which now accounts for 44% of the total volume. This increase in short-dated options volume has been accompanied by a similarly sized decrease in longer-dated options volume.
Further, the majority of trading activity in these short-dated options is split between hedging and directional trading, as well as yield harvesting via out-of-the-money (OTM) options sales. Though the short-dated activity may prompt cascading events in market downturns, the main issue is the reduced use of longer-dated options; a supply and demand imbalance likely resolves itself with an implied volatility repricing of great size where longer-dated options outperform those that are shorter-dated.
Traders can look to position for a potential IVOL repricing, particularly in the back half of the year when dealer positioning is less clear, buybacks are to fall off of a cliff, and the boost from short-covering has played its course.
Traders can continue to play near-term strength via call spread structures and use those profits to reduce the costs of owning longer-dated bets on markets or rates falling and IVOL increasing. If not interested in directional exposure, traders may allocate funds to T-bills and SPX box spreads which allow traders to create a loan structure similar to a T-bill. If savvy, one could find some structures yielding ~5.5%. Traders can also consider blending T-bills and boxes with directional exposure. This way, they can cut portfolio volatility but still have a bit of leverage potential. Please check out our past letters for trade structure specifics. Have a great day!
About
Welcome to the Daily Brief by Physik Invest, a soon-to-launch research, consulting, trading, and asset management solutions provider. Learn about our origin story here, and consider subscribing for daily updates on the critical contexts that could lend to future market movement.
Separately, please don’t use this free letter as advice; all content is for informational purposes, and derivatives carry a substantial risk of loss. At this time, Capelj and Physik Invest, non-professional advisors, will never solicit others for capital or collect fees and disbursements. Separately, you may view this letter’s content calendar at this link.
Physik Invest’s Daily Brief is read free by thousands of subscribers. Join this community to learn about the fundamental and technical drivers of markets.
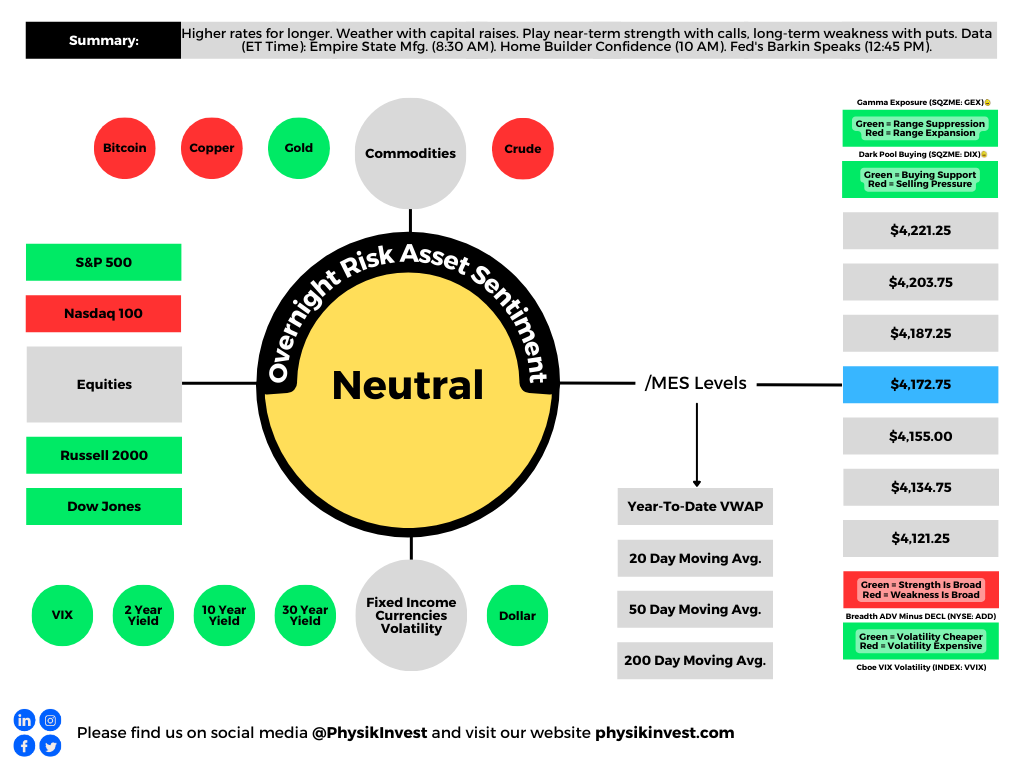
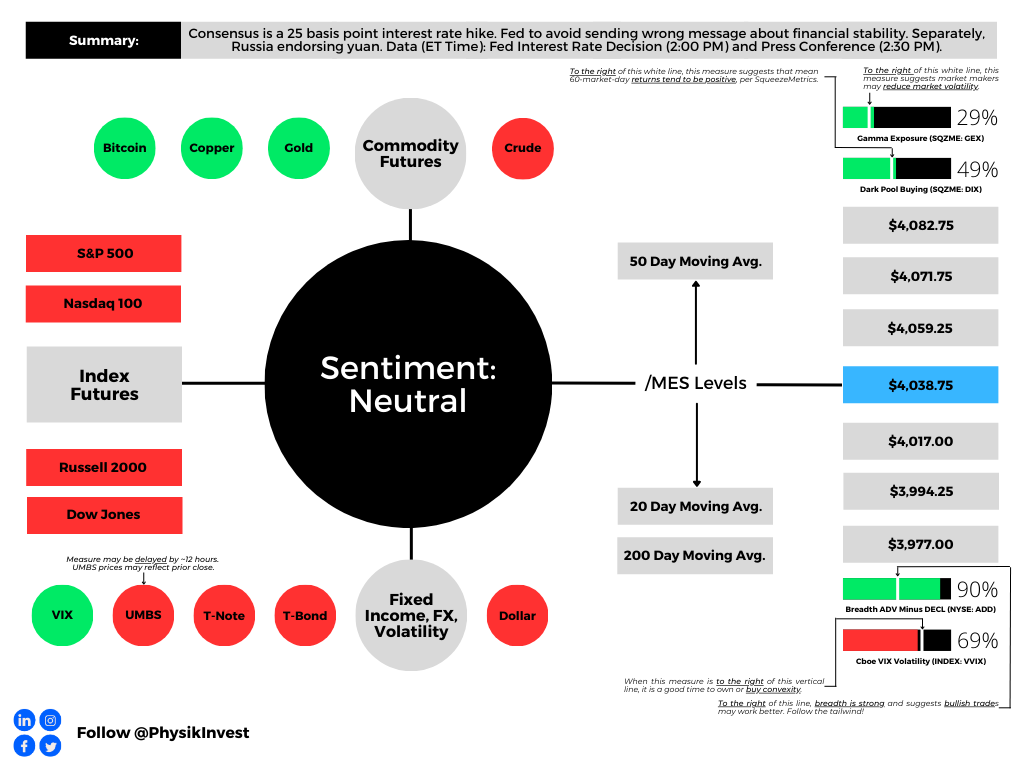
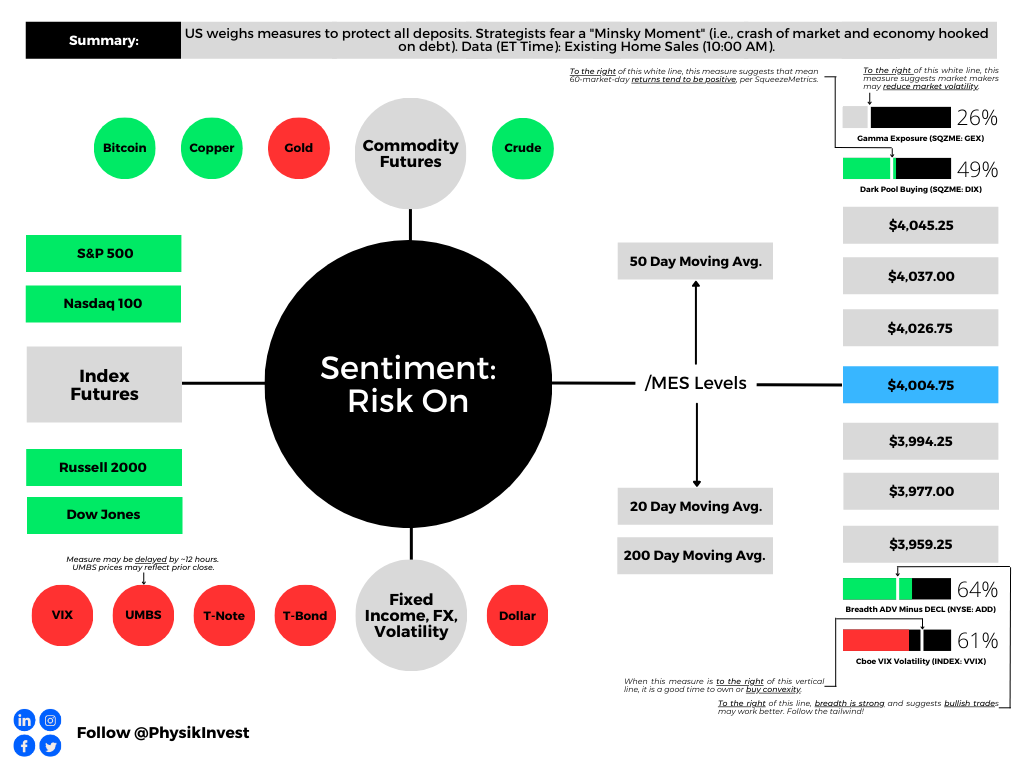
Graphic updated 8:20 AM ET. Sentiment Neutral if expected /MES open is inside of the prior day’s range./MES levels are derived from the profile graphic at the bottom of this letter. Click here for the latest levels. SqueezeMetrics Dark Pool Index (DIX) and Gamma (GEX) with the latter calculated based on where the prior day’s reading falls with respect to the MAX and MIN of all occurrences available. A higher DIX is bullish. The lower the GEX, the more (expected) volatility. Click to learn the implications of volatility, direction, and moneyness. Breadth reflects a reading of the prior day’s NYSE Advance/Decline indicator. The CBOE VIX Volatility Index (INDEX: VVIX) reflects the attractiveness of owning volatility. UMBS prices via MND. Click here for the economic calendar.
Administrative
Recall our past letters pondering the use of the yuan for settlements in the East. Well, there’s been progress on that end.
Putin: We are in favor of using the Chinese yuan for settlements between Russia and the countries of Asia, Africa, and Latin America. I am confident that these forms of settlement in yuan will develop between Russian partners and their counterparts in third countries. pic.twitter.com/Mnw1WfjW4Y
Also recall “the recycling of petrodollars by oil-rich nations” fueling “several emerging market debt crises” and prompting “the creation of a more speculative, debt-fueled economy in the US.” Is this a reversing trend? We shall unpack in a future letter, soon.
Fundamental
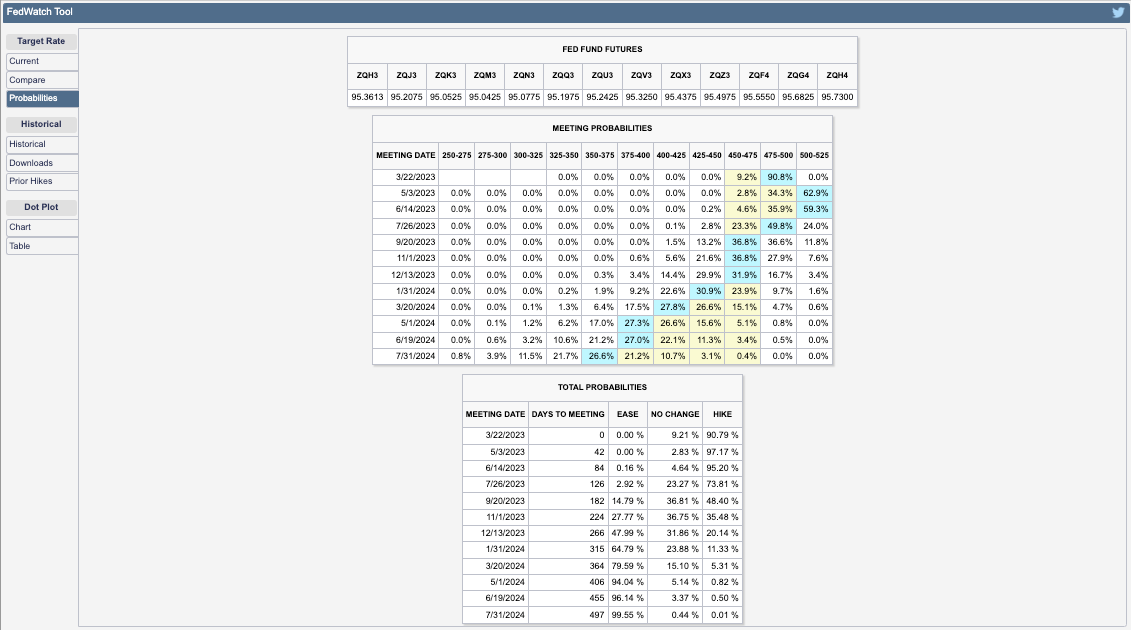
The Federal Reserve (Fed) is likely to bump its current target rate up 25 basis points to 4.75-5.00%. Failing to bump interest rates would likely send the wrong message about financial stability. To give up on the inflation fight (a pause or interest rate cut) would tell investors “look out below,” Bloomberg summarizes.
Graphic: Retrieved from CME Group Inc’s (NASDAQ: CME) FedWatch Tool.
The path after is less certain, though most think there is likely to be at least one additional hike in the coming months. The catch is that if market-induced financial tightening persists through the second quarter, it would substitute for rate hikes.
Assuming the Fed publishes its summary of economic projections (SEP) or dot plot, they will likely show the governors “getting less aggressive,” adds Bloomberg’s John Authers.
If we recall, Kai Volatility’s Cem Karsan talked about the Fed not wanting liquidations; they want a slow sale, not a fire sale. So, with there being a lag, the Fed may want to slow and assess, carefully telegraphing this being not a pivot. A pivot would probably inspire confidence among investors to own assets “mak[ing] things hotter,” Karsan explains, noting that the Fed really needs to walk up the long end of the yield curve. Recall that the long end fell considerably on the back of the turmoil and intervention, as well as recent data (e.g., housing starts showing more supply, likely a mortgage application booster that would further “make things hotter”).
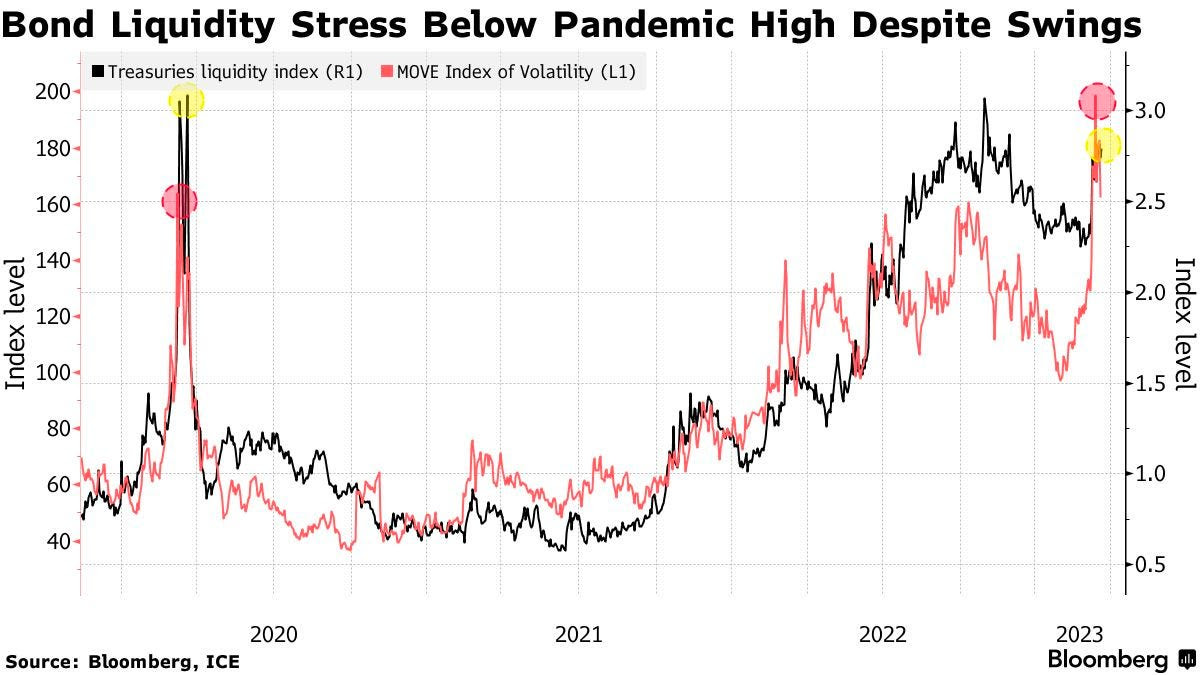
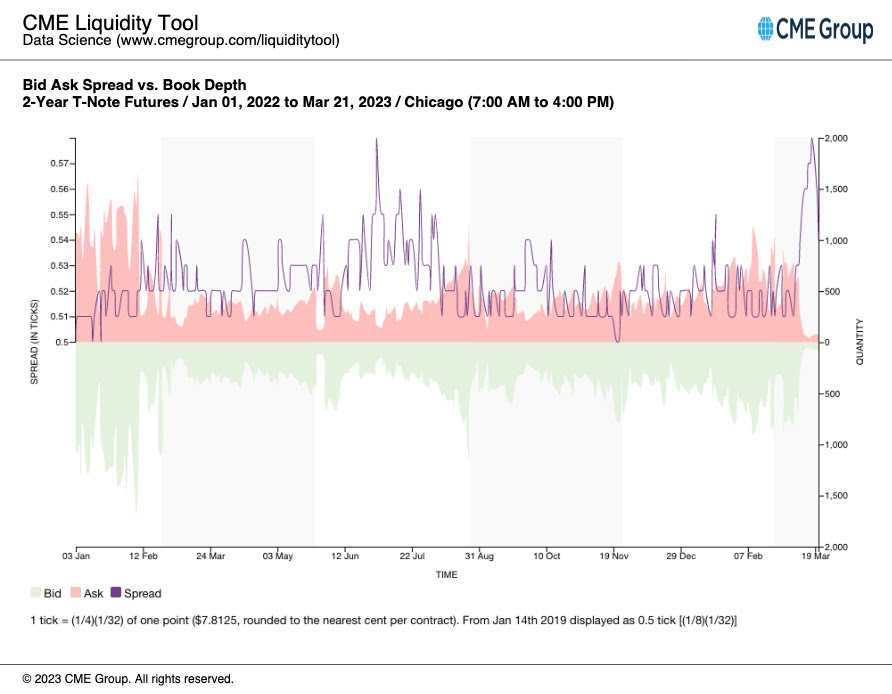
In large part the result of low liquidity, Treasury volatility could prompt the Fed to adjust their quantitative tightening or QT (i.e., the flow of capital out of capital markets) program, instead. Just as quantitative easing or QE (i.e., the flow of capital into capital markets) did little to spark off inflation, it’s unlikely that temping QT would disrupt efforts to rein inflation.
Graphic: Retrieved from CME Group Inc’s (NASDAQ: CME) Liquidity Tool. Per a Bloomberg article, “the spread between offered prices and what sellers will accept has widened for all maturities, … a sign of thinning market depth” and illiquidity.
Adjusting QT, which is contributing to the excessive volatility, “would be preferable to not raising rates … [since] an abrupt pause in rate hikes would likely resurrect the notion that there’s, indeed, a Fed ‘put’ designed to bail out Wall Street at the first sign of stress,” a potential catalyst for market upside, says Robert Burgess.
In Tuesday’s letter, we talked about the potential for fears of downside easing and fears of missing out (i.e., FOMO) on upside rising. Specifically, the letter said the following:
“A response may be FOMO-type demand for call options exposures, coupled with CTAs further ‘raising their equity exposure’ on trend signals and lower volatility, boosting markets into a ‘more combustible’ state as explained on 2/17. This fear of missing out is visible in options volatility skew; traders are hedging those tail outcomes.”
In support of the most recent strength, per JPMorgan Chase & Co’s (NYSE: JPM) trade desk commentary, there is a buy skew. Goldman Sachs Group Inc (NYSE: GS) strategists agree, noting that flows are almost entirely “cover-driven.”
Recall that traders sought protection amidst all the calamities recently. Accordingly, measures of implied volatility or IVOL including the Cboe Volatility Index or VIX rose (e.g. traders demand exposure to downside put protection by way of S&P 500 options which bids options prices and manifests higher IVOL and counterparty pressure from their equity future/stock sales to hedge this demand). These same measures of IVOL are now falling as traders’ closure of protection results in counterparty pressures being lifted (helping explain, in part, the above “cover-driven” remark by GS).
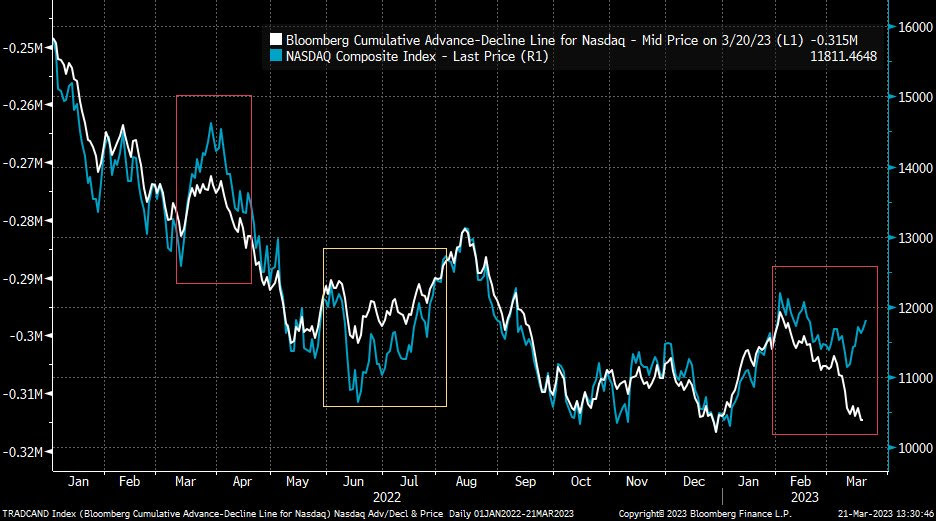
Does this rally have breadth behind it? Look no further than market internals.
Graphic: Retrieved from Bloomberg via Liz Young. “The Nasdaq’s Cumulative Advance-Decline line has parted ways with index direction in recent days. In other words, the index has rallied despite weak breadth (more stocks falling than rising), the two lines are likely to find their way back together somehow…”
A pause before the Fed announcement, and then breadth catches up to price?
Or, has the typical post-Fed IVOL boost been spent?
Regardless, we maintain that low-cost call options structures as proposed in previous letters worked (and may continue to work). Notwithstanding, look for opportunities to play the downside should markets trade higher into a “more combustible” position.
More on trade ideas in the next letters. Take care.
Technical
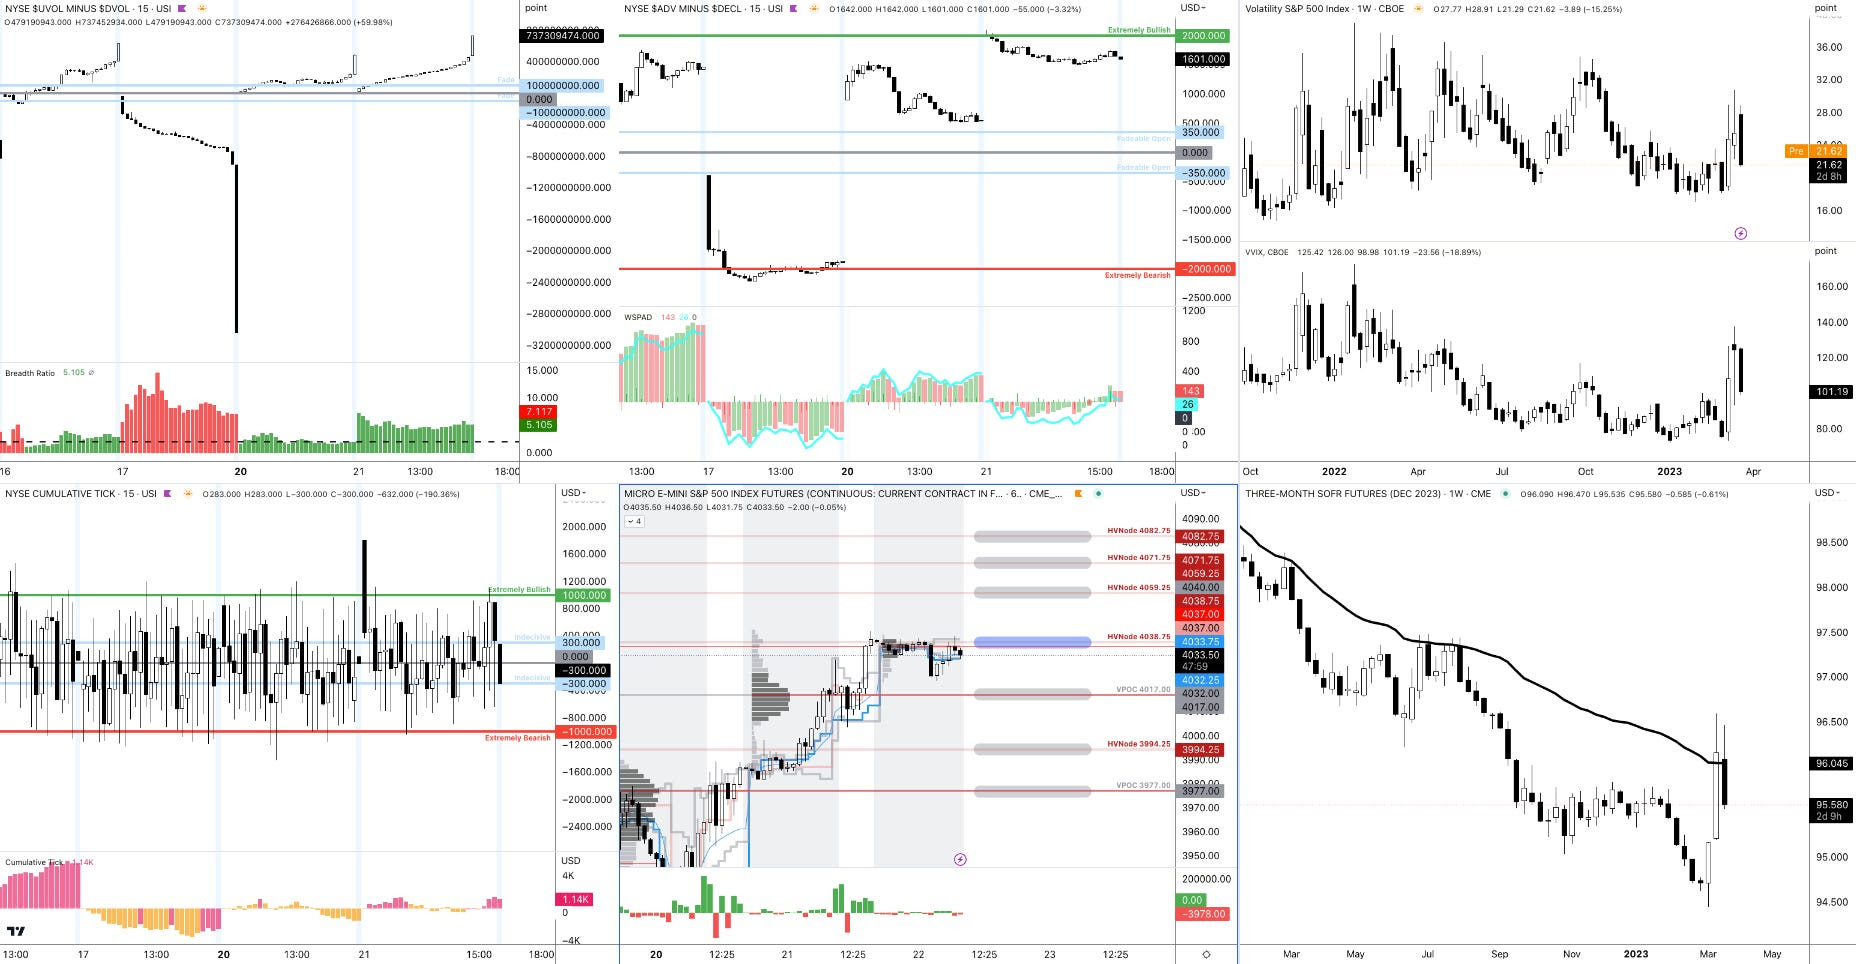
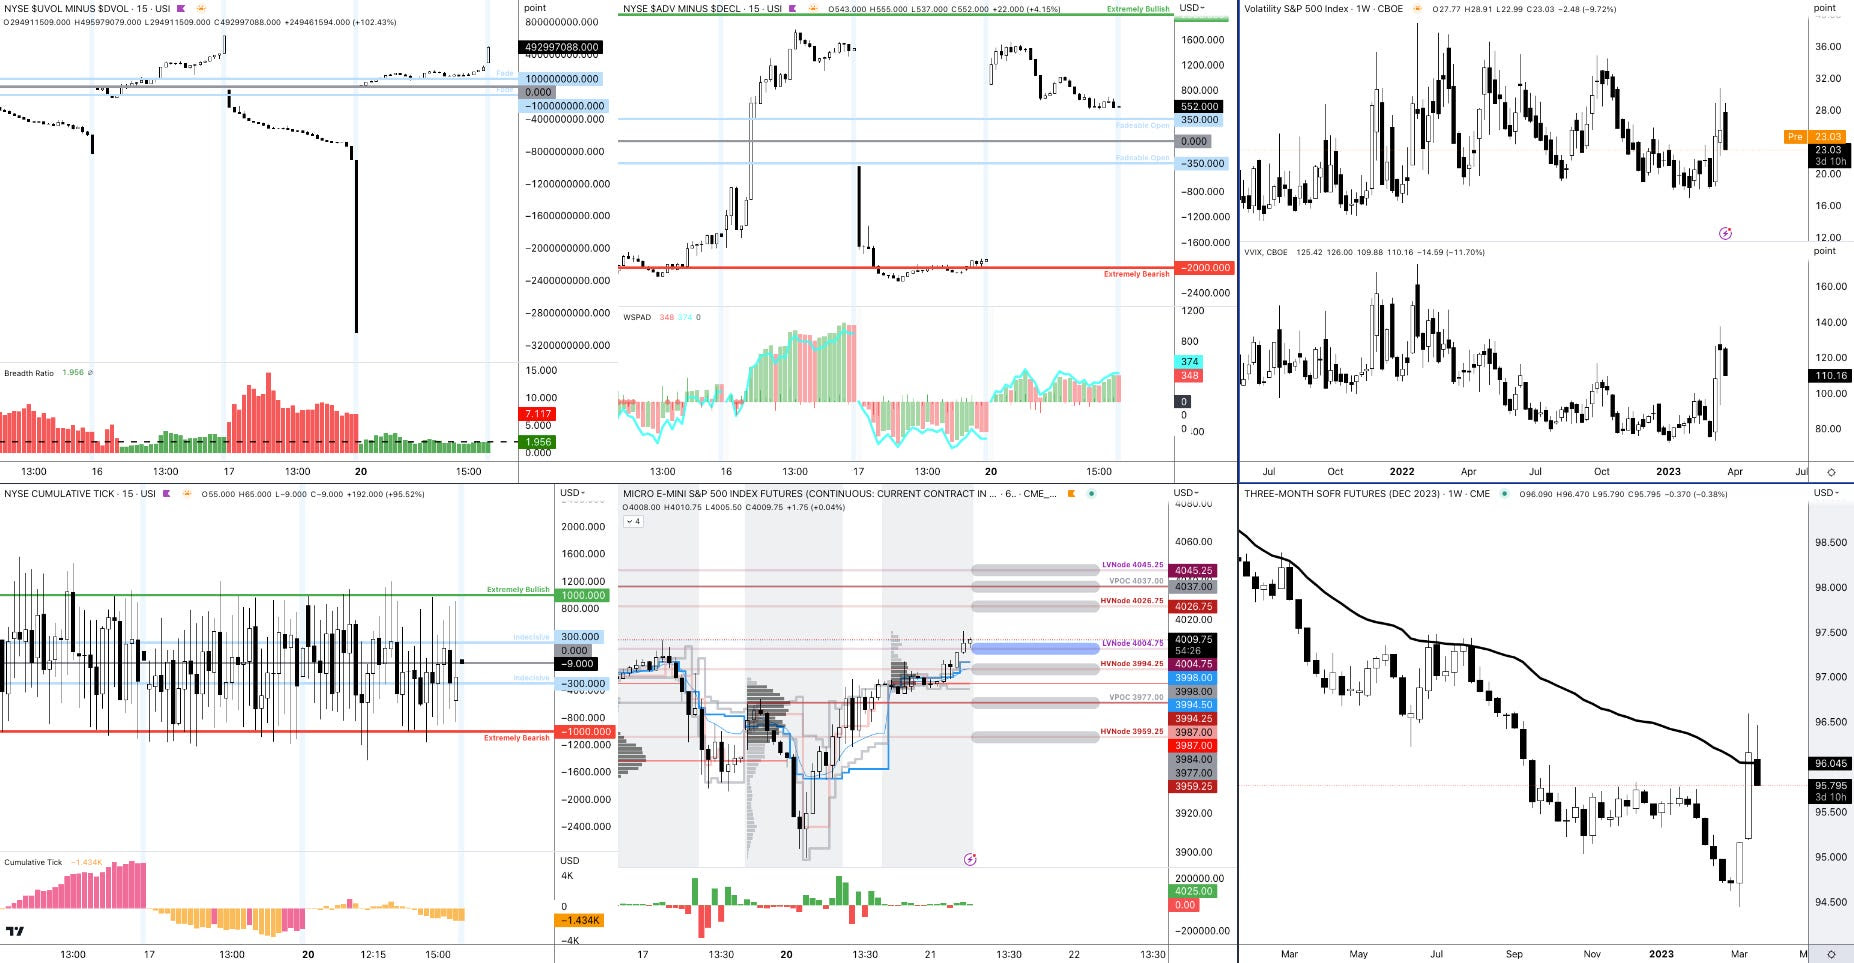
As of 8:15 AM ET, Wednesday’s regular session (9:30 AM – 4:00 PM ET), in the S&P 500, is likely to open in the upper part of a negatively skewed overnight inventory, inside of the prior day’s range, suggesting a limited potential for immediate directional opportunity.
The S&P 500 pivot for today is $4,038.75.
Key levels to the upside include $4,059.25, $4,071.75, and $4,082.75.
Key levels to the downside include $4,017.00, $3,994.25, and $3,977.00.
Disclaimer: Click here to load the updated key levels via the web-based TradingView platform. New links are produced daily. Quoted levels likely hold barring an exogenous development.
Graphic: 65-minute profile chart of the Micro E-mini S&P 500 Futures (bottom middle).
Definitions
Volume Areas: Markets will build on areas of high-volume (HVNodes). Should the market trend for a period of time, this will be identified by a low-volume area (LVNodes). The LVNodes denote directional conviction and ought to offer support on any test.
If participants auction and find acceptance in an area of a prior LVNode, then future discovery ought to be volatile and quick as participants look to the nearest HVNodes for more favorable entry or exit.
POCs: Areas where two-sided trade was most prevalent in a prior day session. Participants will respond to future tests of value as they offer favorable entry and exit.
About
The author, Renato Leonard Capelj, spends the bulk of his time at Physik Invest, an entity through which he invests and publishes free daily analyses to thousands of subscribers. The analyses offer him and his subscribers a way to stay on the right side of the market.
You may view this letter’s content calendar at this link.
Disclaimer
Do not construe this newsletter as advice. All content is for informational purposes. Capelj and Physik Invest manage their own capital and will not solicit others for it.
Physik Invest’s Daily Brief is read free by thousands of subscribers. Join this community to learn about the fundamental and technical drivers of markets.
Graphic updated 7:00 AM ET. Sentiment Risk-On if expected /MES open is above the prior day’s range. /MES levels are derived from the profile graphic at the bottom of this letter. Click here for the latest levels. SqueezeMetrics Dark Pool Index (DIX) and Gamma (GEX) with the latter calculated based on where the prior day’s reading falls with respect to the MAX and MIN of all occurrences available. A higher DIX is bullish. The lower the GEX, the more (expected) volatility. Click to learn the implications of volatility, direction, and moneyness. Breadth reflects a reading of the prior day’s NYSE Advance/Decline indicator. The CBOE VIX Volatility Index (INDEX: VVIX) reflects the attractiveness of owning volatility. UMBS prices via MND. Click here for the economic calendar.
Administrative
Not all doom and gloom. Make sure to read to the end!
Fundamental
In the Daily Brief for 3/20, we summarized the financial industry and policymaker responses that would turn asset fire sales into managed, orderly asset sales.
The net result of the intervention would be a reduction in credit creation, a tightening of financial conditions, as well as a slowing of the economy and inflation while, potentially, setting “a dangerous precedent that simply encourage[s] future irresponsible behavior” (e.g., risky lending/borrowing), the House Freedom Caucus put eloquently. Basically, the fear is in policymakers underwriting the losses of prevailing carry-type strategies and setting the stage for an even bigger unwind or so-called “Minsky moment,” the “sudden crash of markets and economies that are hooked on debt,” Bloomberg reports.
"Regional banks relied on a business model that relied on uninsured deposits," says @Lazard's @porszag. "The government needs to make explicit what a lot of people are assuming: that for the foreseeable future, uninsured deposits don't exist. Everything is insured." pic.twitter.com/GgZ9ZF2f7r
A systemic credit event is among strategists’ biggest fear, indeed. A Bank of America Corporation (NYSE: BAC) survey shows a credit event happening on the heels of a US shadow banking, corporate debt, and developed-market real-estate collapse. Recall this letter writer’s conversation with Simplify Asset Management’s Michael Green who said he sees “cracks in bubbles like commercial real estate” already appearing, too.
Bloomberg adds that JPMorgan Chase & Co (NYSE: JPM) strategists think the inverted yield curve signals recession and the stocks are likely nearing their high point.
Graphic: Retrieved from Callum Thomas’ Weekly S&P 500 ChartStorm.
JPM adds that market lows won’t occur until interest rate cuts ensue.
Graphic: Retrieved from BNP Paribas ADR (OTC: BNPQY).
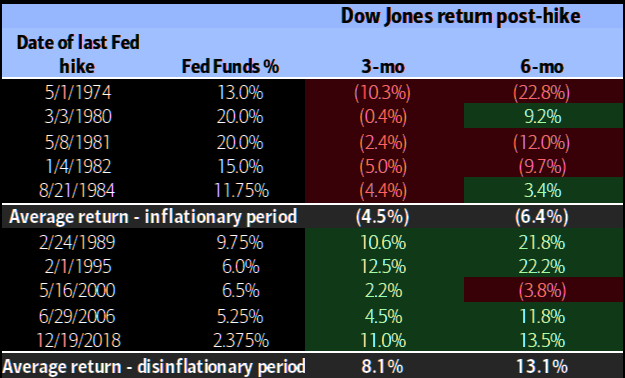
Recall 3/20’s letter citing BAC research that finds selling markets on the last Fed rate hike is a good strategy. The “Minsky moment” comment/fear has others at JPM adding that investors should sell into relief bounces.
Graphic: Retrieved from Bank of American Corporation (NYSE: BAC) via The Market Ear.
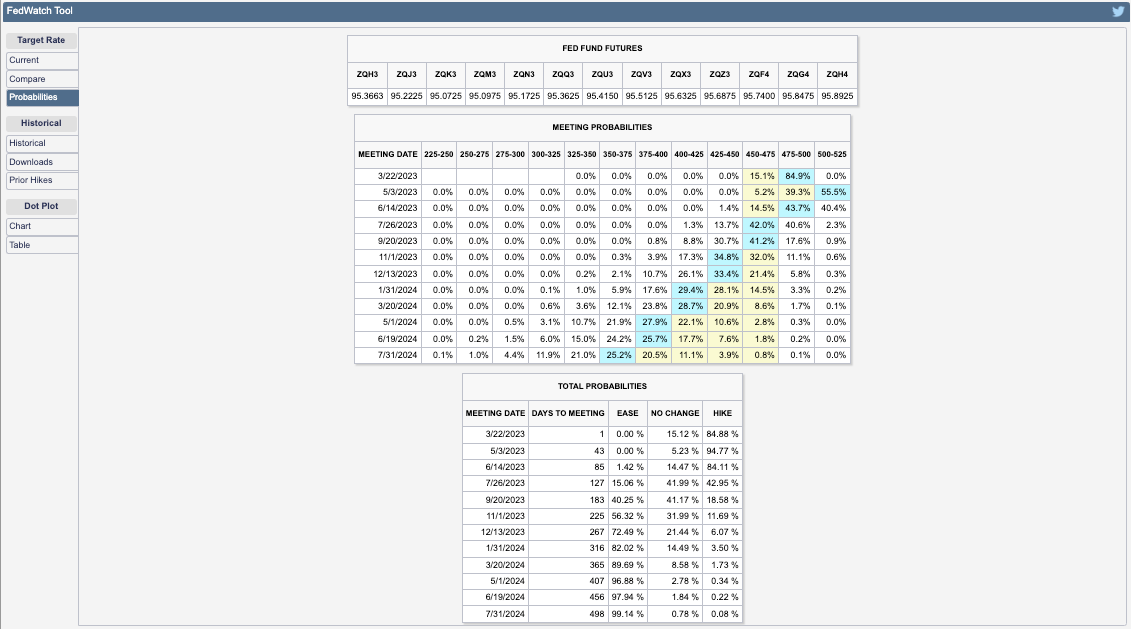
Most participants foresee rates continuing to rise by at least 25 basis points, per the CME Group Inc’s (NASDAQ: CME) FedWatch Tool. Following Wednesday’s (expected) hike, the path forward appears uncertain. Yesterday, the terminal/peak rate was at 4.75-5.00%. Today, the peak has shifted higher to 5.00-5.25%.
Graphic: Retrieved from CME Group Inc (NASDAQ: CME).
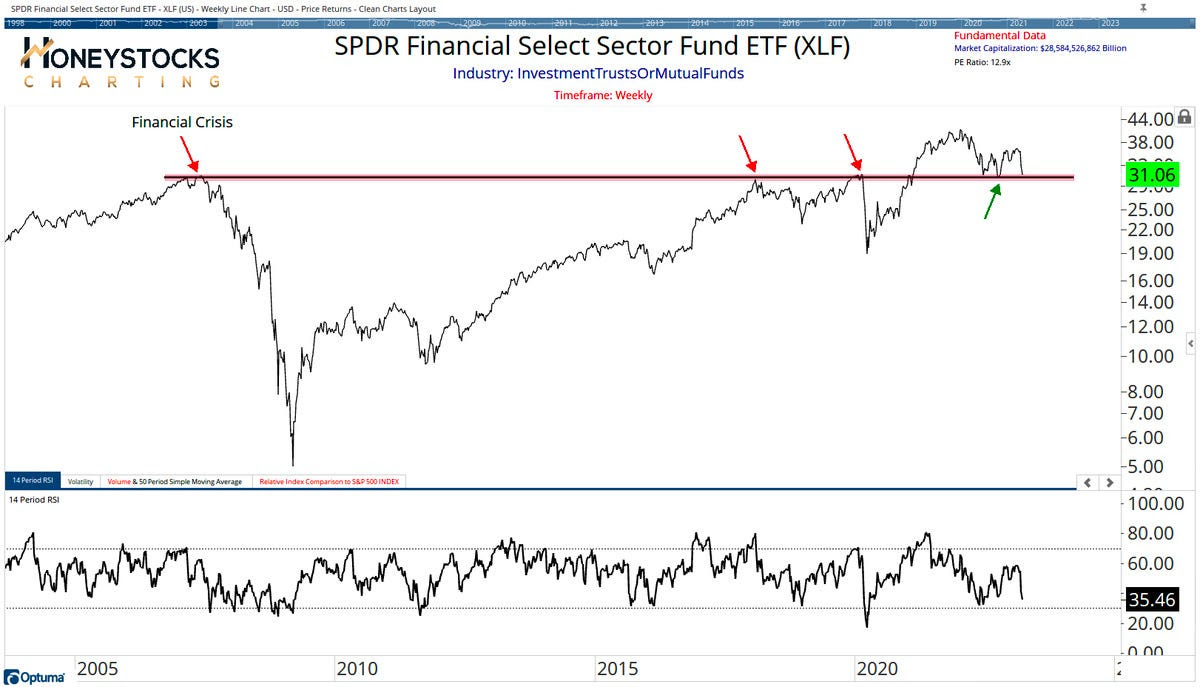
Financials look ready to fall off a cliff, to add. If they do, the whole market likely goes.
Graphic: Retrieved from Callum Thomas’ Weekly S&P 500 ChartStorm.
Positioning
We keep referring back to our Daily Briefs published last week (e.g., 3/13 and 3/14). In those letters, we talked about the growing concern about markets enduring some exogenous shocks.
We opted to take the less extreme side since policymakers’ response was likely to stem (or push into the future) turmoil. Additionally, with participants easing up on their long-equity exposure, equity markets were likely to stay contained, relative to bond markets where the lack of liquidity is an issue, some believe. Anyways, following important events including inflation updates (i.e., CPI) and derivatives expiries, short bursts of strength (particularly in some of the previously depressed products such as the Nasdaq 100 or NDX, as explained 3/17) were likely to ensue heading into the end of this month and next month. Additionally, certain rates trades via options we set forth on 3/14 were ripe for monetization, too.
Rotating into a money market or T-bill fund or box spreads, while allocating some remaining cash to leverage potential by way of some call options structures, appeared attractive. While the T-bill or box spread exposures did not budge much, call options structures as proposed on 3/14 worked (and are likely to continue to work) rather well. The monetization of the rate structures discussed on 3/14 was timely, also.
The potential for coming events including the Federal Reserve’s (Fed) interest rate decision on Wednesday 3/22 to assuage participants’ fears of slowing may, accordingly, prompt fears of missing out on the upside, Bloomberg reports. A response may be FOMO-type demand for call options exposures, coupled with CTAs further “raising their equity exposure” on trend signals and lower volatility, boosting markets into a “more combustible” state as explained on 2/17. This fear of missing out is visible in options volatility skew; traders are hedging those tail outcomes.
Technical
As of 7:00 AM ET, Tuesday’s regular session (9:30 AM – 4:00 PM ET), in the S&P 500, is likely to open in the upper part of a positively skewed overnight inventory, outside of the prior day’s range, suggesting a potential for immediate directional opportunity.
The S&P 500 pivot for today is $4,004.75.
Key levels to the upside include $4,026.75, $4,037.00, and $4,045.25.
Key levels to the downside include $3,994.25, $3,977.00, and $3,959.25.
Disclaimer: Click here to load the updated key levels via the web-based TradingView platform. New links are produced daily. Quoted levels likely hold barring an exogenous development.
Graphic: 65-minute profile chart of the Micro E-mini S&P 500 Futures.
Definitions
Volume Areas: Markets will build on areas of high-volume (HVNodes). Should the market trend for a period of time, this will be identified by a low-volume area (LVNodes). The LVNodes denote directional conviction and ought to offer support on any test.
If participants auction and find acceptance in an area of a prior LVNode, then future discovery ought to be volatile and quick as participants look to the nearest HVNodes for more favorable entry or exit.
POCs: Areas where two-sided trade was most prevalent in a prior day session. Participants will respond to future tests of value as they offer favorable entry and exit.
Options Expiration (OPEX): Reduction in dealer Gamma exposure. There may be an increase in volatility after the removal of large options positions and associated hedging.
Volume-Weighted Average Prices (VWAPs): A metric highly regarded by chief investment officers, among other participants, for quality of trade. Additionally, liquidity algorithms are benchmarked and programmed to buy and sell around VWAPs.
About
The author, Renato Leonard Capelj, spends the bulk of his time at Physik Invest, an entity through which he invests and publishes free daily analyses to thousands of subscribers. The analyses offer him and his subscribers a way to stay on the right side of the market.
You may view this letter’s content calendar at this link.
Disclaimer
Do not construe this newsletter as advice. All content is for informational purposes. Capelj and Physik Invest manage their own capital and will not solicit others for it.
Physik Invest’s Daily Brief is read free by thousands of subscribers. Join this community to learn about the fundamental and technical drivers of markets.
Graphic updated 6:30 AM ET. Sentiment Neutral if expected /MES open is inside of the prior day’s range. /MES levels are derived from the profile graphic at the bottom of this letter. Click here for the latest levels. SqueezeMetrics Dark Pool Index (DIX) and Gamma (GEX) with the latter calculated based on where the prior day’s reading falls with respect to the MAX and MIN of all occurrences available. A higher DIX is bullish. The lower the GEX, the more (expected) volatility. Click to learn the implications of volatility, direction, and moneyness. Breadth reflects a reading of the prior day’s NYSE Advance/Decline indicator. The CBOE VIX Volatility Index (INDEX: VVIX) reflects the attractiveness of owning volatility. UMBS prices via MND. Click here for the economic calendar.
Administrative
A long(er) letter, today. Through the end-of-this week, newsletters may be shorter due to the letter writer’s commitments. Take care!
Fundamental
Yesterday’s letter focused on the SVB Financial Group (NASDAQ: SIVB) failure, albeit with an optimistic tone. In short, the bank could not make good on fast accelerating withdrawals. Read more here.
According to one TechCrunch article, the likes of Founders Fund “reportedly advised their portfolio companies … to withdraw their money, … [and], if everybody is telling each other that SVB is in trouble, that will be a challenge,” as it was.
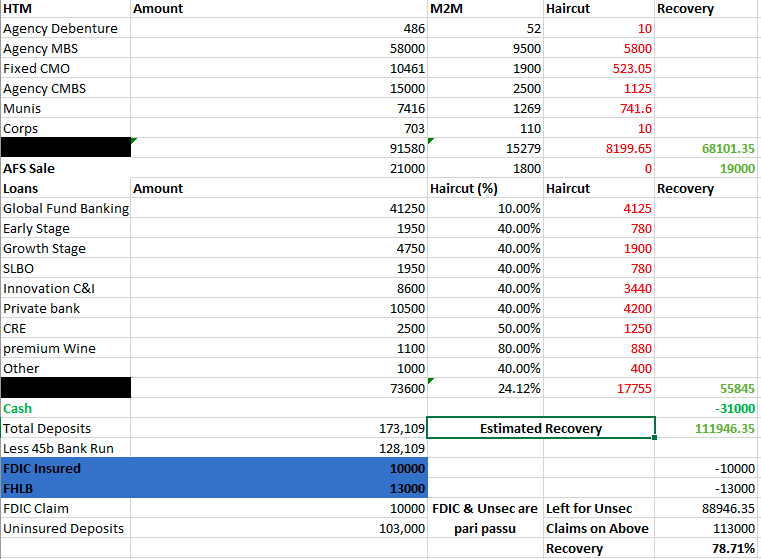
Graphic: Retrieved from @Citrini7. In the worst-case scenario, it was likely that uninsured depositors at SIVB would have received $0.80 on each dollar barring a bailout.
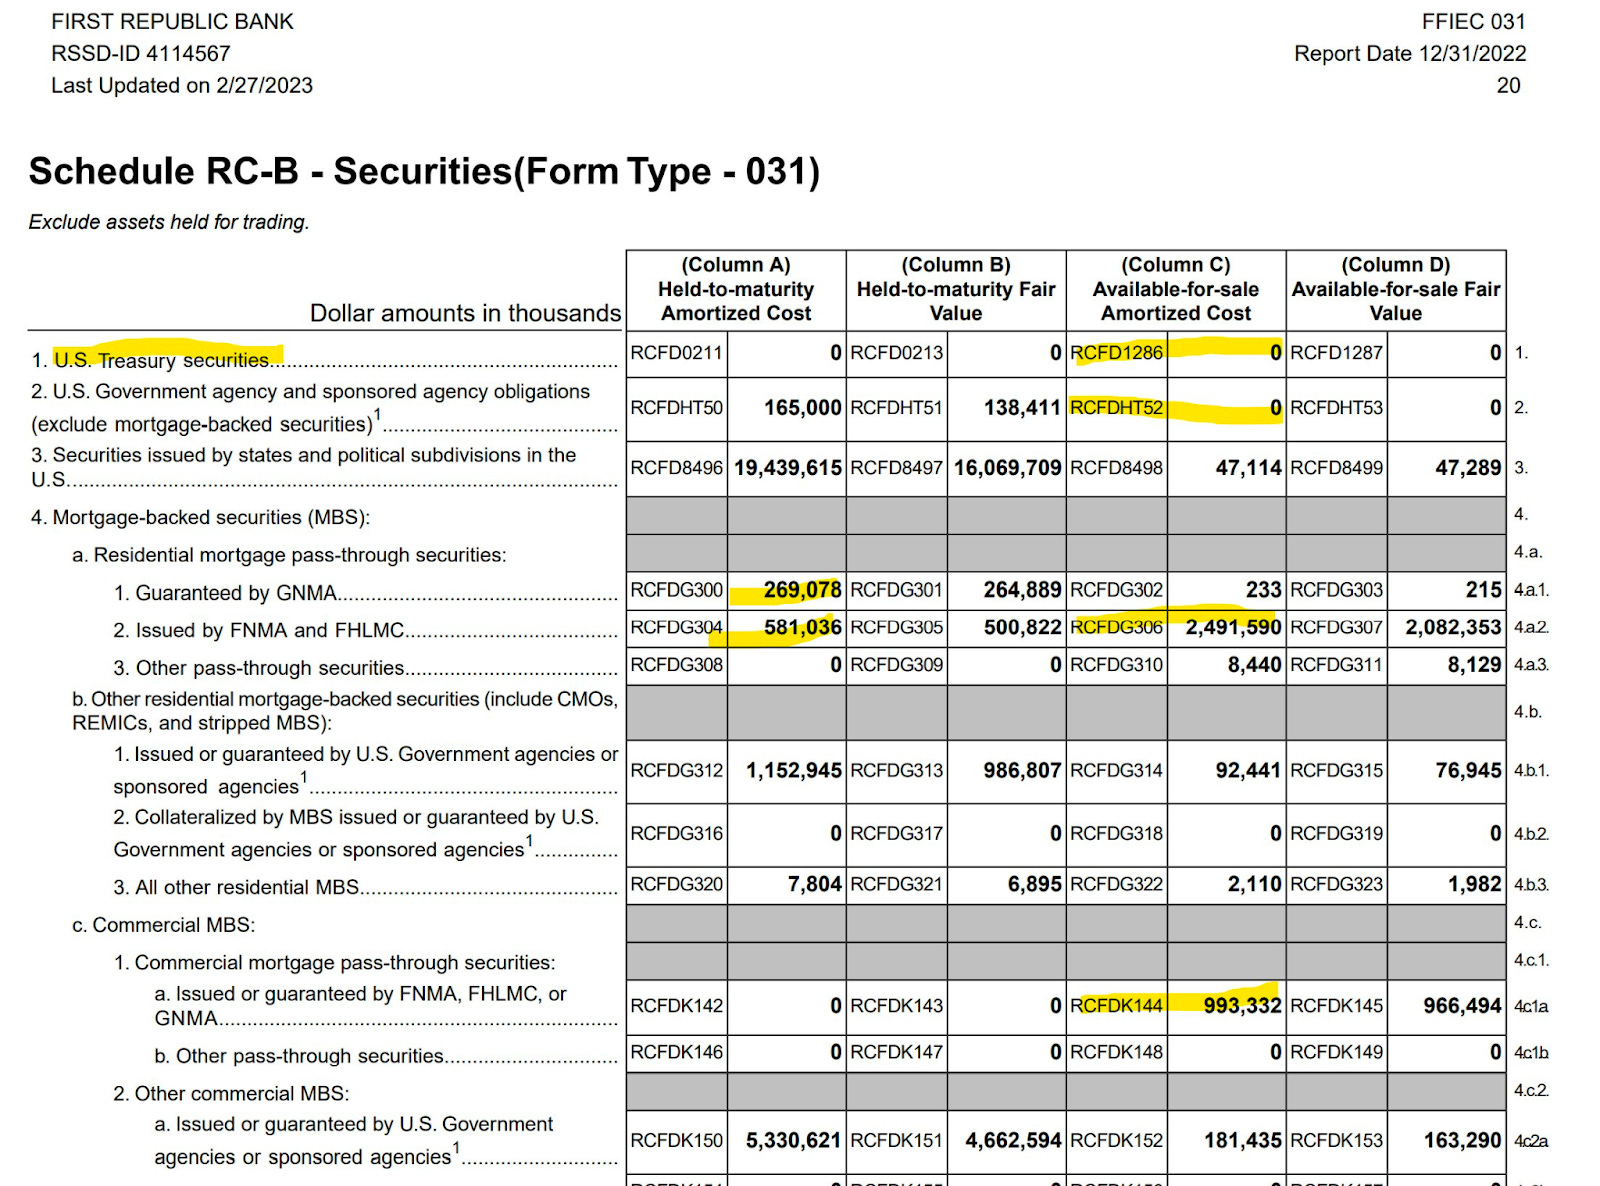
Authorities later put forth emergency measures guaranteeing all deposits. The effort shored up confidence in the banking system and markets strengthened, though some regional names such as First Republic Bank (NYSE: FRC) continued trading weak. In FRC’s case, the Federal Reserve’s (Fed) new bailout facility does not help. As former Fed trader Joseph Wang explains, “you need Treasuries and Agency MBS to tap the facility, and [FRC] barely owns any.”
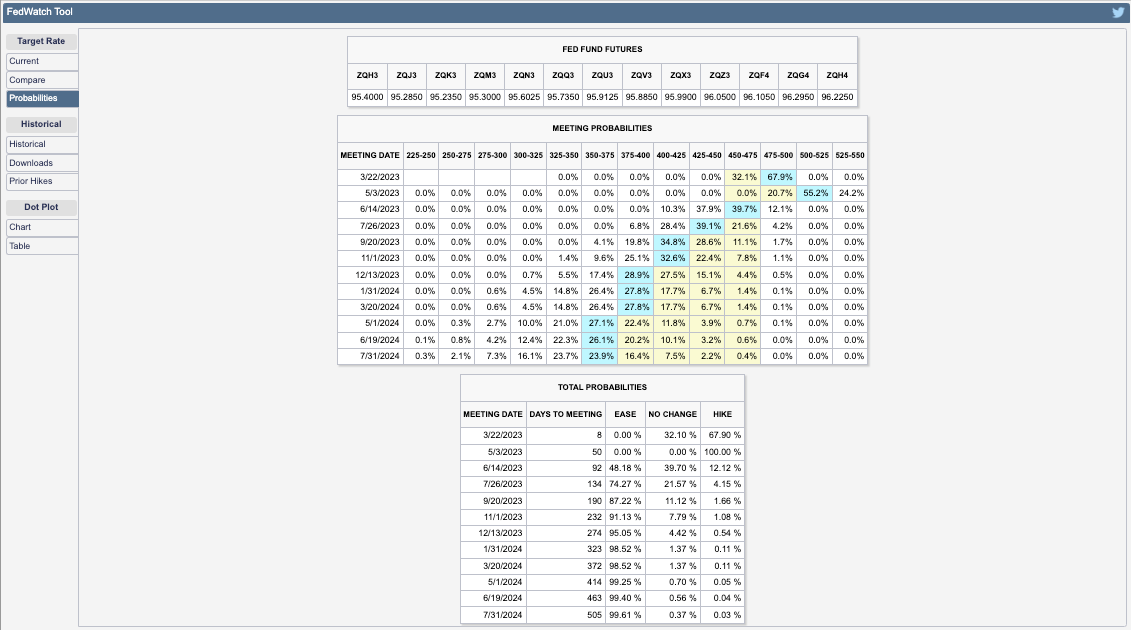
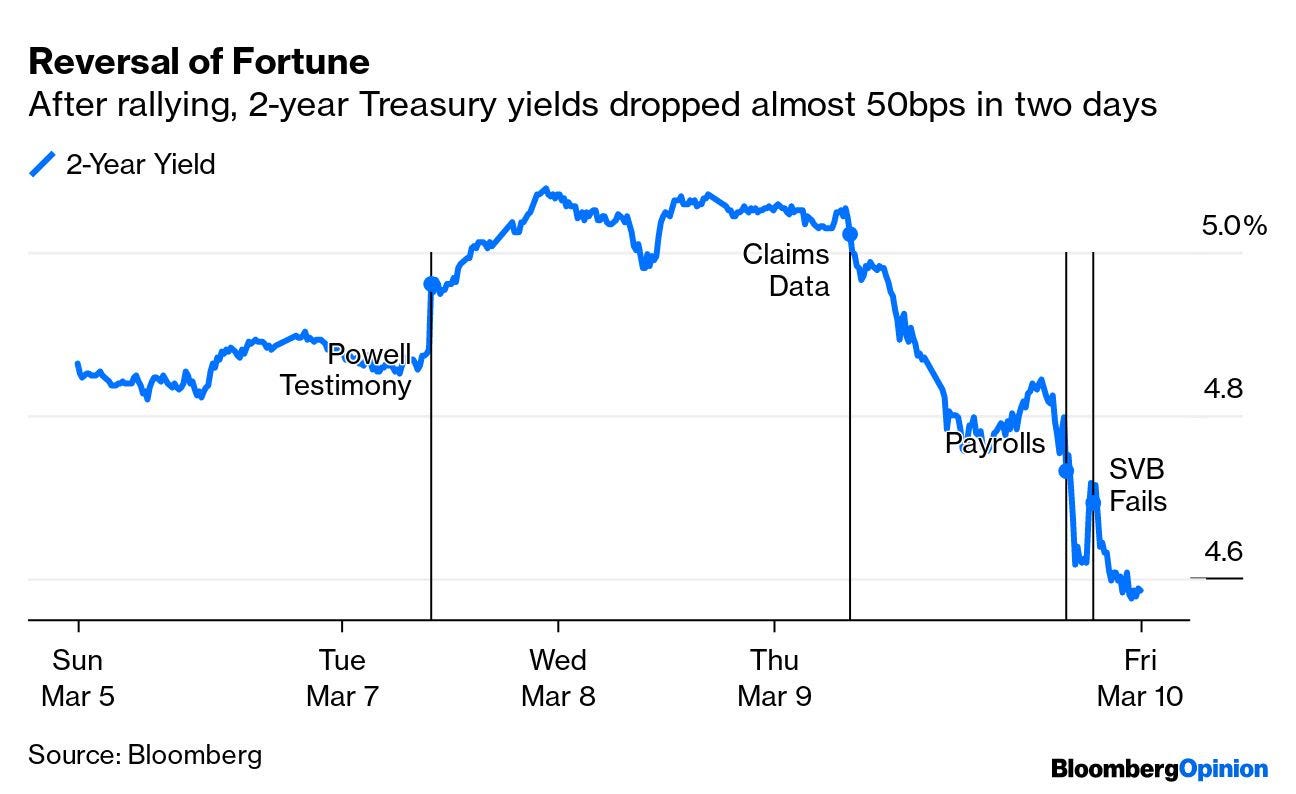
Anyways, as yesterday’s letter briefly mentioned, expectations on the path of Fed Funds shifted. Traders put the terminal/peak rate at 5.00-5.25%, down from 5.50-5.75%, while pricing cuts after spring. Previously, no cuts were expected in 2023.
Graphic: Retrieved from CME Group Inc’s (NASDAQ: CME) FedWatch Tool.
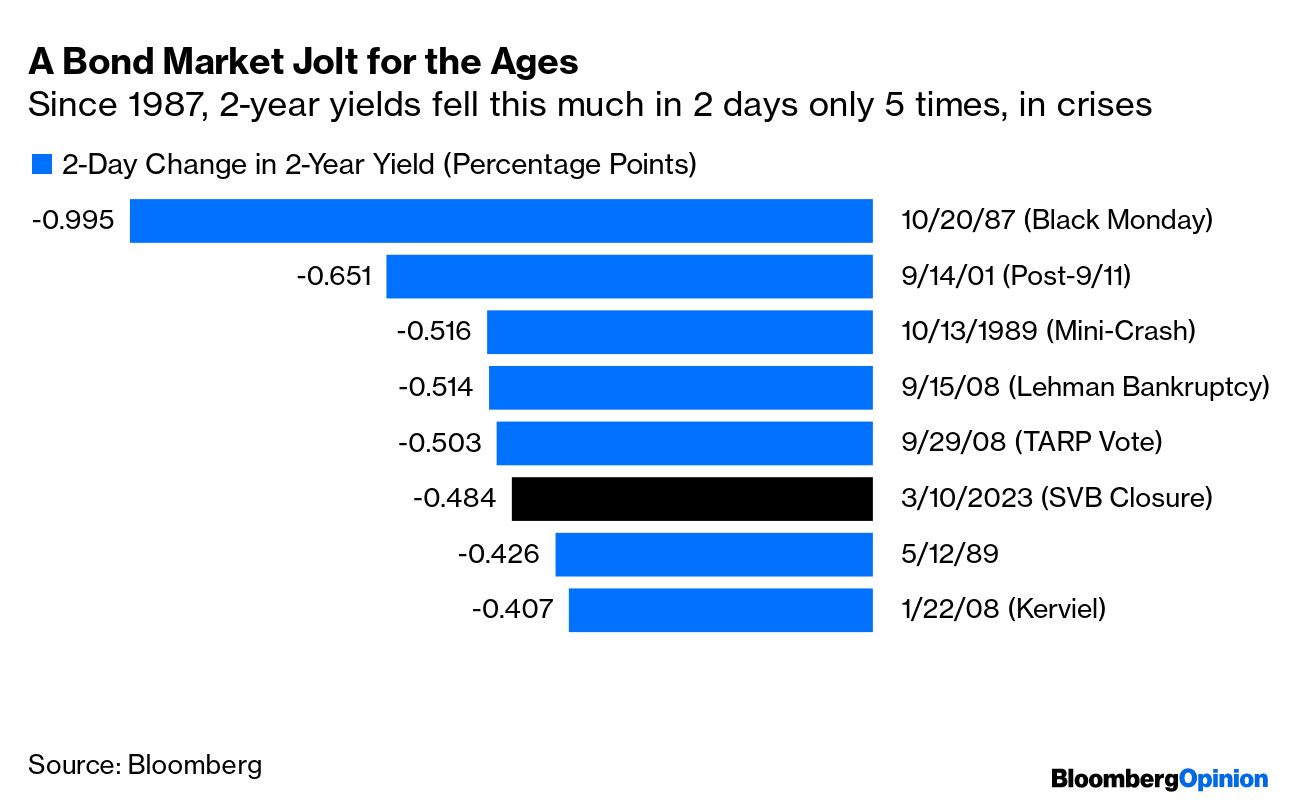
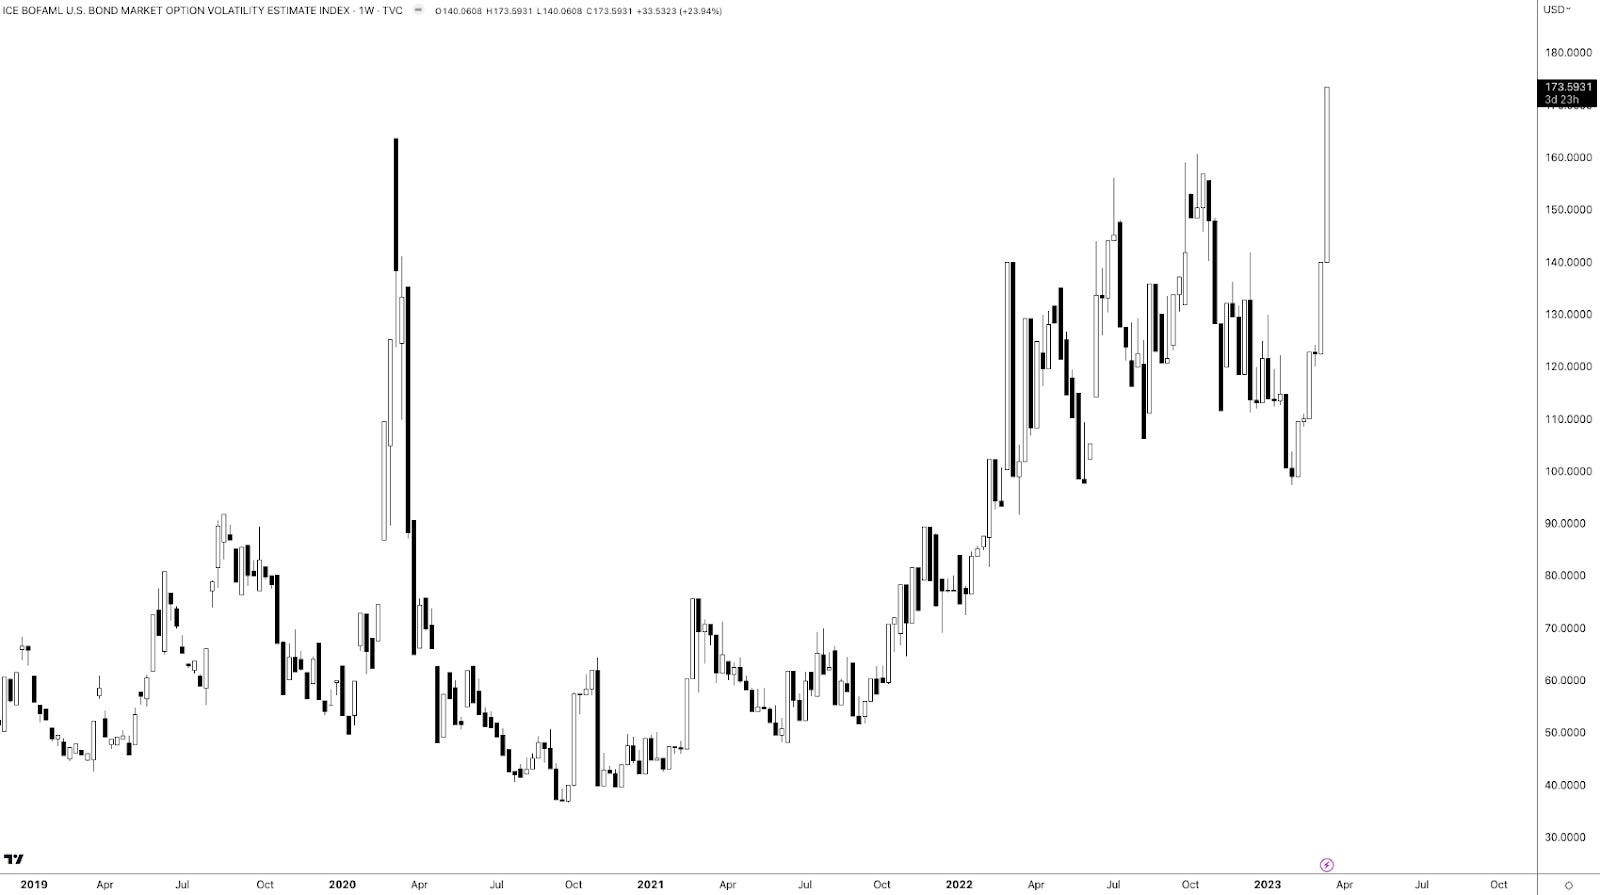
Measures of US Treasury yield volatility implied by options (i.e., bets or hedges on or against market movement) adjusted higher, accordingly. This is often a harbinger of equity market volatility.
Graphic: Merrill Lynch Option Volatility Estimate retrieved from TradingView
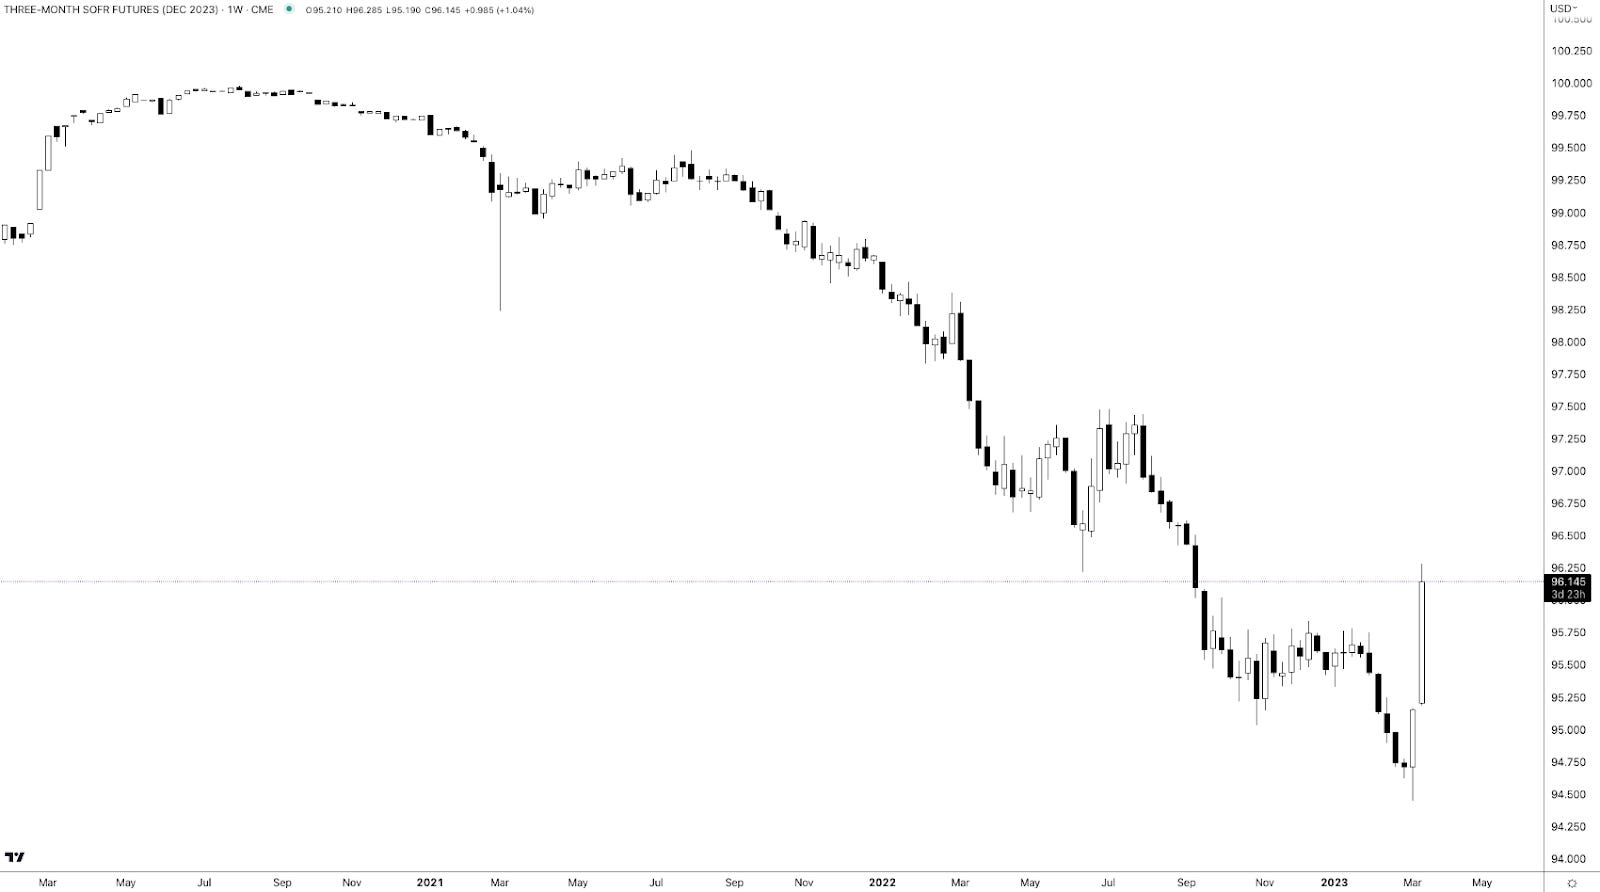
Call options on the three-month Secured Overnight Financing Rate (FUTURE: SOFR) future (i.e., bets on interest rates falling in the future) paid handsomely.
For instance, bull call spreads that expire in December 2023 (e.g., BUY +1 VERTICAL /SR3Z23:XCME 1/2500 DEC 23 /SR3Z23:XCME 96/97 CALL @.0375) increased in value by about 650.00% to $0.33 (i.e., $750.00 per contract).
Graphic: Retrieved via TradingView. Three-month SOFR Future (December 2023). When SOFR is at a lower (higher) number, the market is pricing an increase (decrease) in interest rates. Participants put the December 2023 SOFR rate at 100-96.145 = 3.855%.
In the equity space, some readers may have caught some commentary on spot-vol beta in the VIX complex strengthening like we have not seen in a while, a nod to the harbinger of equity market volatility remark a few paragraphs higher.
Recommended Readings:
Read: The Ambrus Group’s Kris Sidial on two major risks investors should watch out for in 2023. In short, volatility’s sensitivity to underlying prices (spot-vol beta) was low, and Sidial cast blame, in part, on commodity trading advisors and strong volatility supply.
Read: Simplify Asset Management’s Michael Green on using option and bond overlays to hedge big uncertainties facing markets. Following 2022, investors swapped poor-performing long-dated volatility exposures for ones with bounded risk and less time to expiry, hence the increase in 0 DTE trading.
Graphic: Retrieved from Piper Sandler’s (NYSE: PIPR) Danny Kirsch.
This spot-vol beta remark suggests that (at least some of) the volatility in rates, as well as certain small pockets of the equity and crypto market, manifested demand for crash protection in the S&P 500, “which feeds back into VIX,” one explanation put well.
Graphic: Retrieved from Piper Sandler’s (NYSE: PIPR) Danny Kirsch. “[Last] week finally got a bit of explosiveness in VIX as fixed strike volatility got bid. This is VIX generic front month future and move in SPX. Last time it really “paid” to have VIX upside was Jan of 2022 (point in upper left corner).”
Notwithstanding, for these options to keep their value and continue to perform well, realized volatility (RVOL) must pick up substantially, which is not likely.
Unlimited’s Bob Elliott comments: “the bond market is pricing a broad-based credit crunch, … [and though] it’s not crazy for the Fed to slow down here given the current uncertainty,” odds are financial problems are contained and the Fed moves forward with its mission to get (and keep) inflation down.
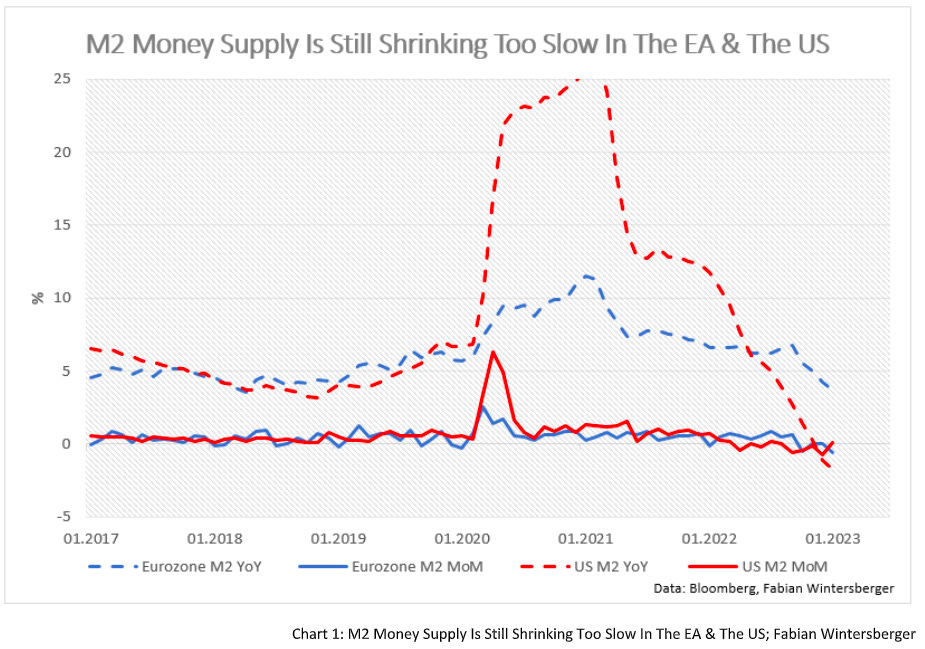
Graphic: Retrieved from Fabian Wintersberger. Just as the “monetary expansion supported the rise in equity and bond prices in January.”
Consequently, “the pricing of Dec23s and 5yr BEIs makes no sense,” Elliott adds. This means the example SOFR trade above is/was ripe for some monetization, and equity volatility must be dealt with carefully (i.e., price movements must be higher than they are now which would be difficult given that authorities/Fed do not want liquidations).
In support of siding with the less extreme take, we paraphrase Kai Volatility’s Cem Karsan who says that for years prior to the 2007-2008 turmoil, macro tourists were calling for a crash.
For markets to crumble, there would have to be an exogenous event far greater in implications than what just transpired with SIVB over the weekend. With odds that such turmoil doesn’t happen soon, coupled with participants easing up on their long-equity exposure (i.e., selling stock and not needing to hedge, hence the statement that owning equity volatility must be dealt with carefully), RVOL is likely to stay contained. That’s not to say that this volatility observed in the rates market can’t persist. It’s also not to say that markets can’t continue to trade lower (in fact, with interest rates rising and processes like quantitative tightening challenging bank liquidity, there is less incentive for investors to reside in lower-yielding equities). It just means that, barring some exogenous event, the market remains intact.
Graphic: Retrieved from Jack Farley. “Silicon Valley Bank owns >$80 Billion of Mortgage-Backed Securities (MBS), a market that is ‘more prone to bouts of volatility’ because ‘small investors & leveraged funds have become the main buyers’ as the Fed & banks step away from market, according to Dec 2022 BIS report.”
Positioning
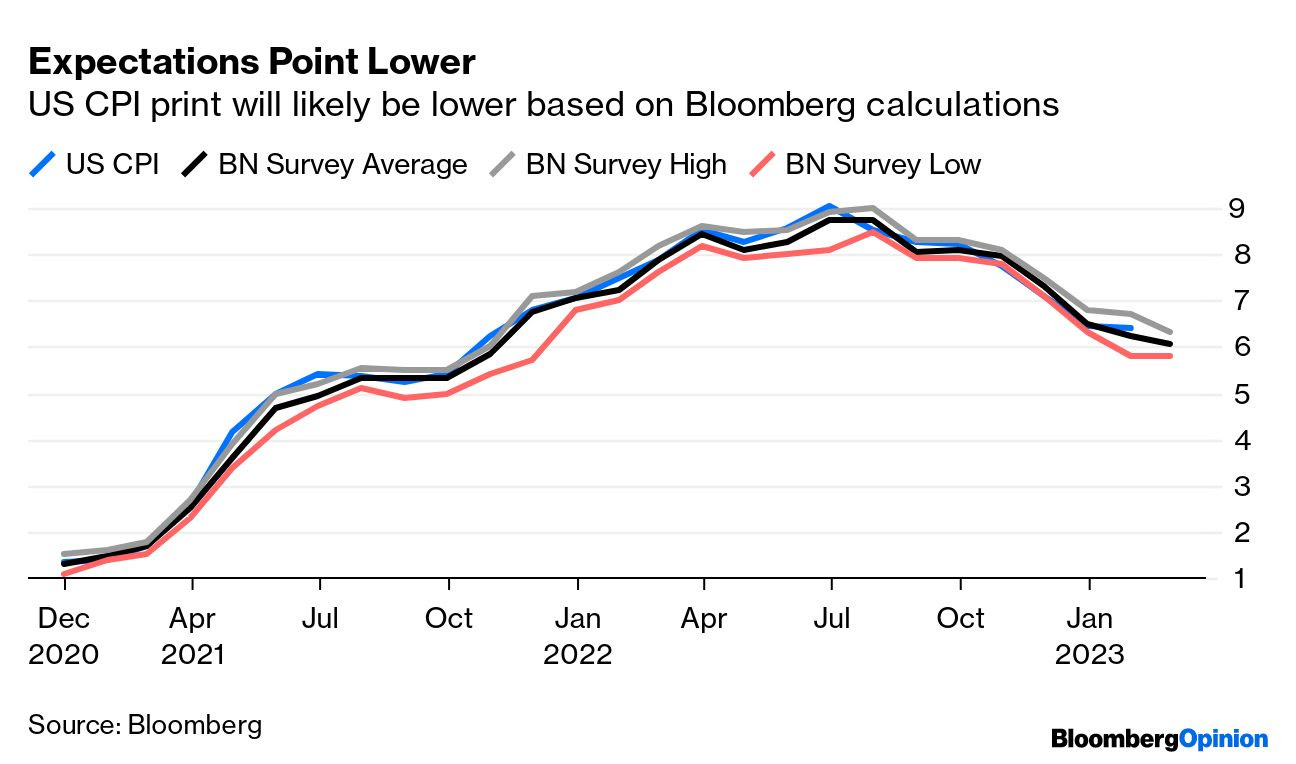
Following important events like the release of the Consumer Price Index (CPI) today, the compression of implied volatility or IVOL, coupled with the nearing of big options expirations (OpEx), sets the market up for potential short bursts of strength heading into the end of the month and next month.
Graphic: Retrieved from Bloomberg. Inflation has been well within forecasts.
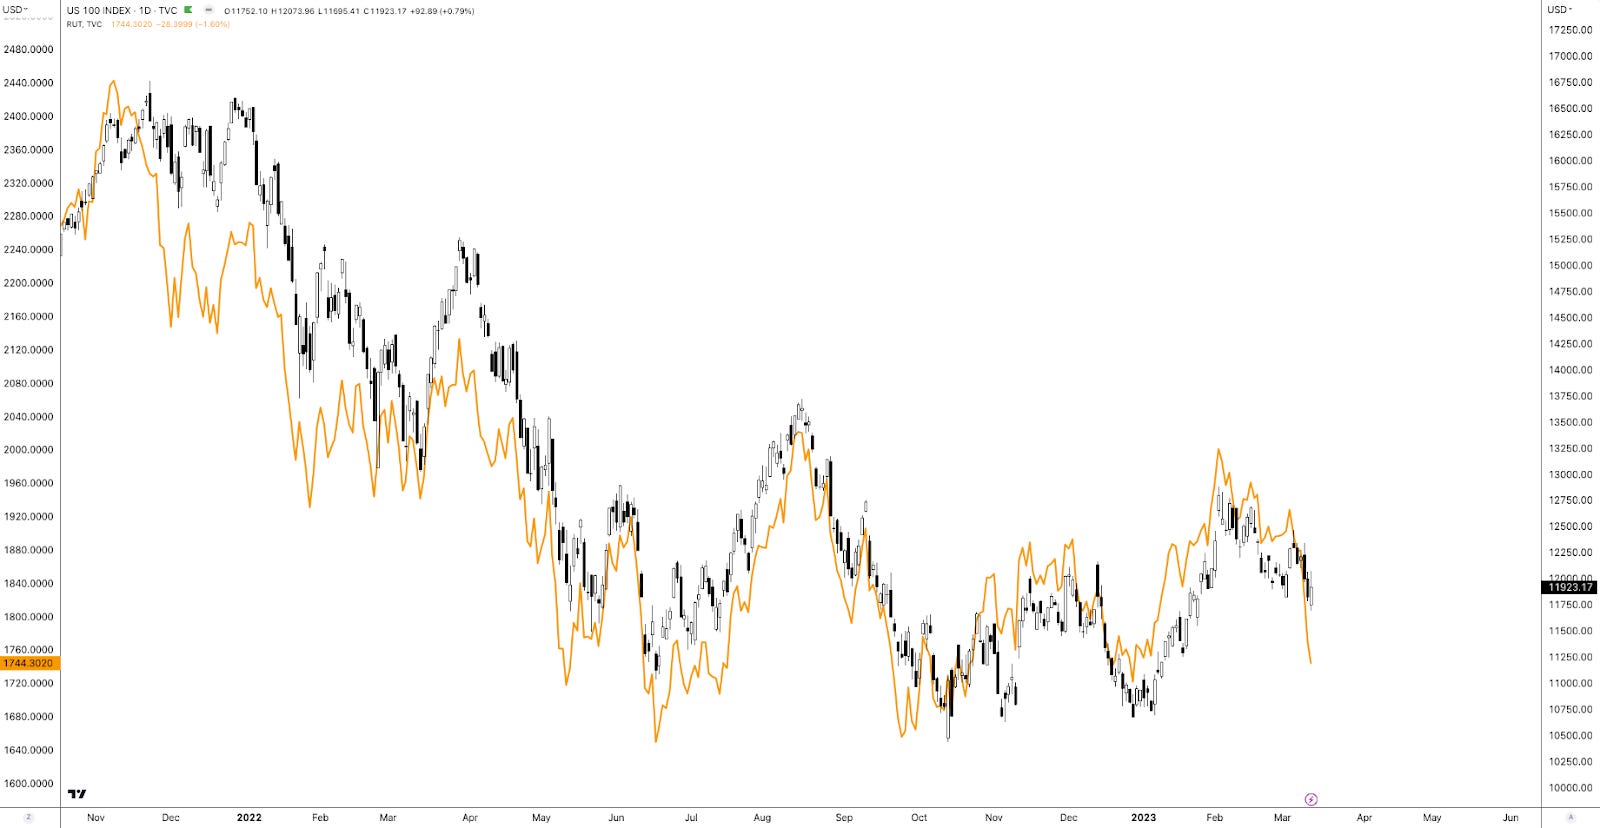
A quick comparison of the Russell 2000 (INDEX: RUT) and Nasdaq 100 (INDEX: NDX) suggests this options-induced strength may help keep the recent re-grossing theme intact. The compression of wound IVOL and passage of OpEx, coupled with the still-live re-grossing theme, may put a floor under equities.
Graphic: Retrieved from TradingView. Orange = RUT. Candles = NDX. Note the weakness in RUT. Note the strength of the Nasdaq relative to the Russell.
To play, one could place a portion of their cash in money market funds or T-bill ETFs or box spreads, for instance, while allocating another portion to leverage potential by way of some call options structures that use one or more short options to help bring down the cost of a long option that is closer to current market prices (e.g., a bull call spread or short ratio call spread). To note, based on options prices as of this writing, it may be too early to enter call structures (i.e., too expensive given the context).
DEFINED OUTCOME INVESTING
-Worried about the prospects of the 60/40 portfolio? -Looking for a strategy that takes advantage of higher interest rates? -Tired of market timing?
A 🧵on how to use exchange-traded options + U.S. Treasurys to define your risk today, for tomorrow.
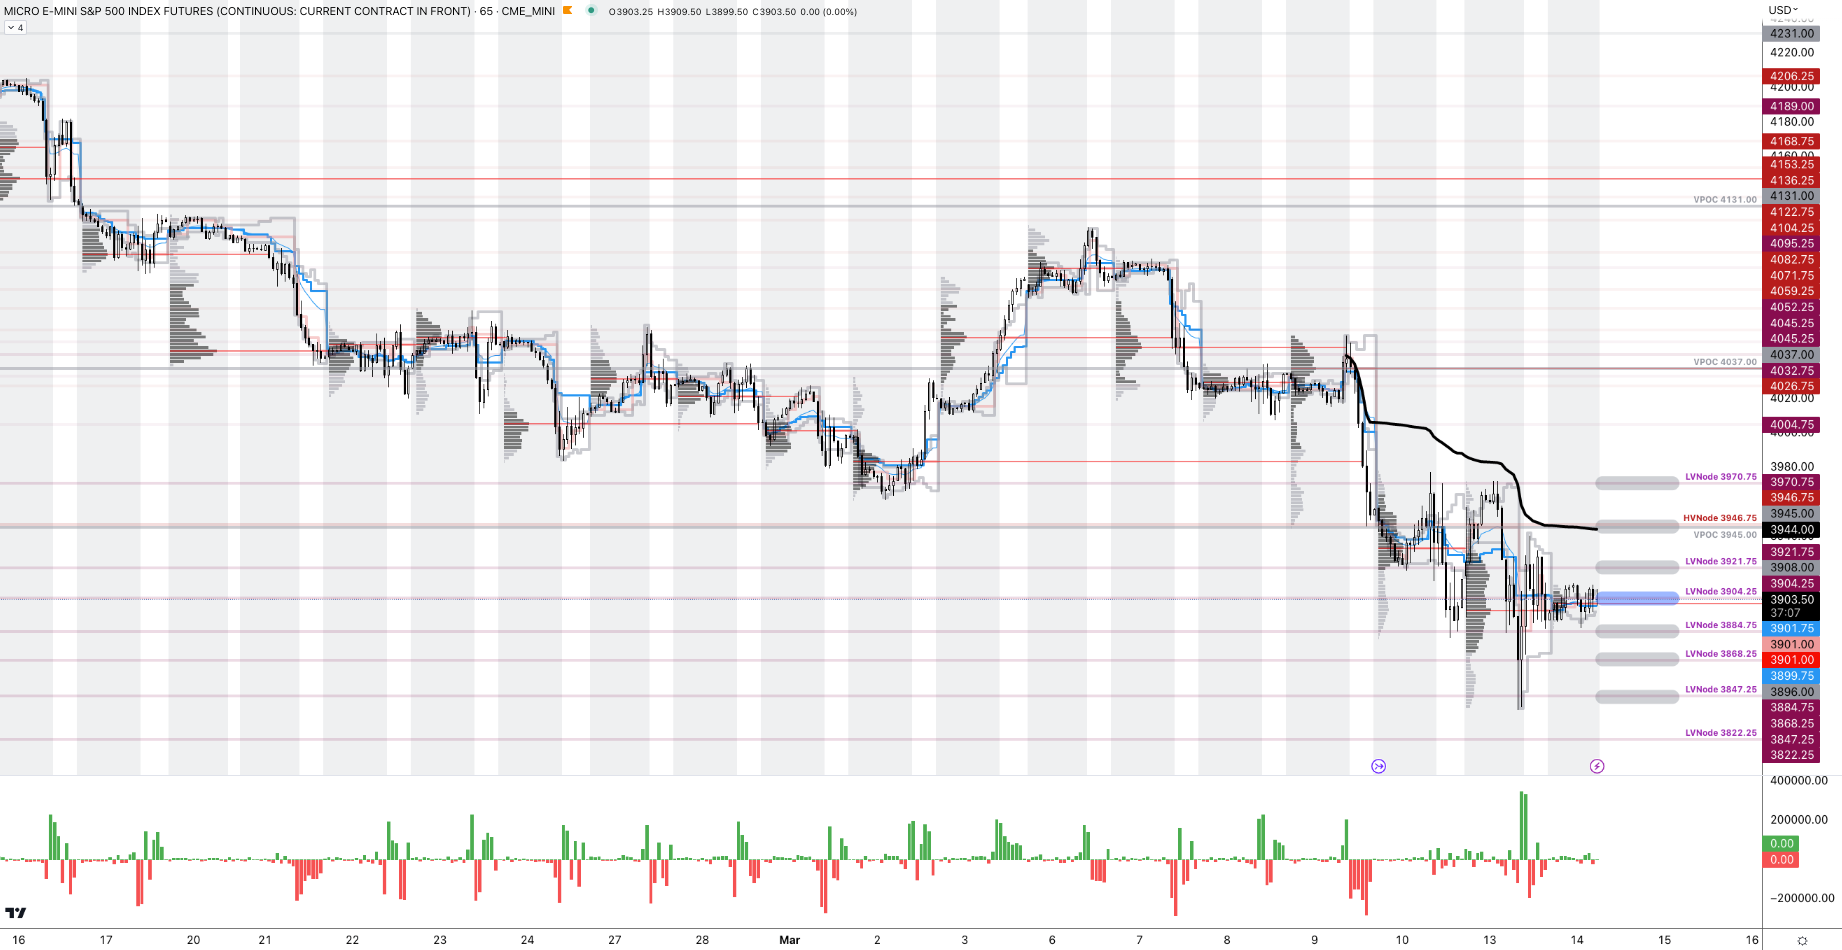
As of 6:30 AM ET, Tuesday’s regular session (9:30 AM – 4:00 PM ET), in the S&P 500, is likely to open in the middle part of a balanced overnight inventory, inside of the prior day’s range, suggesting a limited potential for immediate directional opportunity.
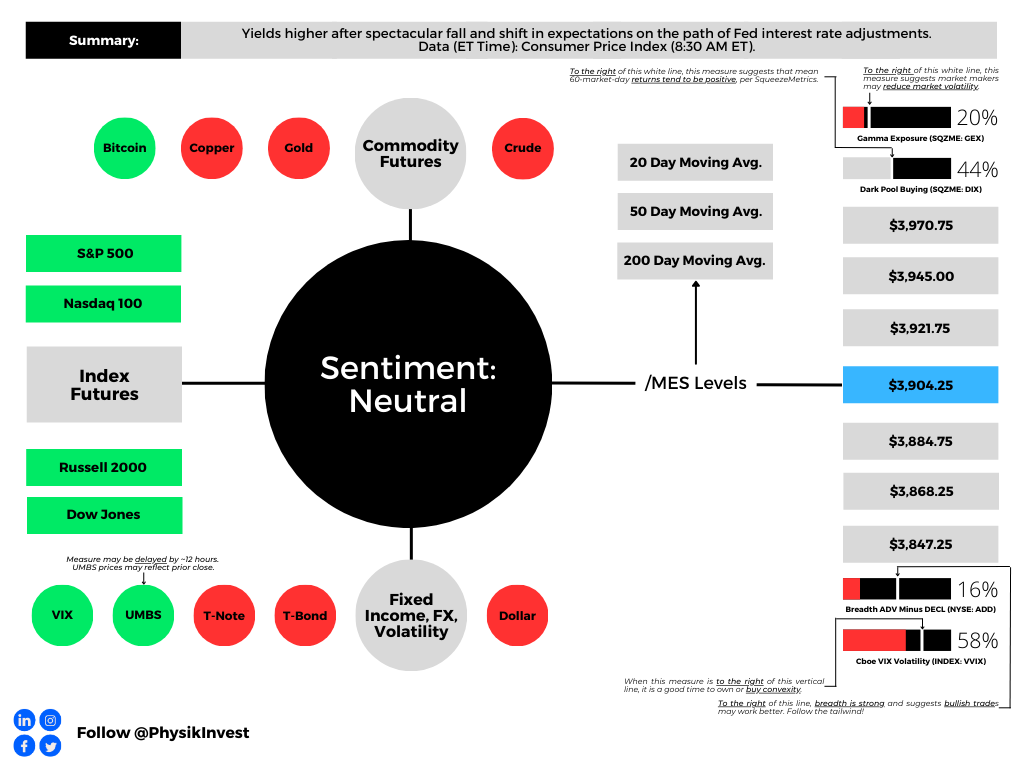
The S&P 500 pivot for today is $3,904.25.
Key levels to the upside include $3,921.75, $3,945.00, and $3,970.75.
Key levels to the downside include $3,884.75, $3,868.25, and $3,847.25.
Disclaimer: Click here to load the updated key levels via the web-based TradingView platform. New links are produced daily. Quoted levels likely hold barring an exogenous development.
Graphic: 65-minute profile chart of the Micro E-mini S&P 500 Futures.
Definitions
Volume Areas: Markets will build on areas of high-volume (HVNodes). Should the market trend for a period of time, this will be identified by a low-volume area (LVNodes). The LVNodes denote directional conviction and ought to offer support on any test.
If participants auction and find acceptance in an area of a prior LVNode, then future discovery ought to be volatile and quick as participants look to the nearest HVNodes for more favorable entry or exit.
POCs: Areas where two-sided trade was most prevalent in a prior day session. Participants will respond to future tests of value as they offer favorable entry and exit.
Volume-Weighted Average Prices (VWAPs): A metric highly regarded by chief investment officers, among other participants, for quality of trade. Additionally, liquidity algorithms are benchmarked and programmed to buy and sell around VWAPs.
About
The author, Renato Leonard Capelj, spends the bulk of his time at Physik Invest, an entity through which he invests and publishes free daily analyses to thousands of subscribers. The analyses offer him and his subscribers a way to stay on the right side of the market.
You may view this letter’s content calendar at this link.
Disclaimer
Do not construe this newsletter as advice. All content is for informational purposes. Capelj and Physik Invest manage their own capital and will not solicit others for it.
Physik Invest’s Daily Brief is read free by thousands of subscribers. Join this community to learn about the fundamental and technical drivers of markets.
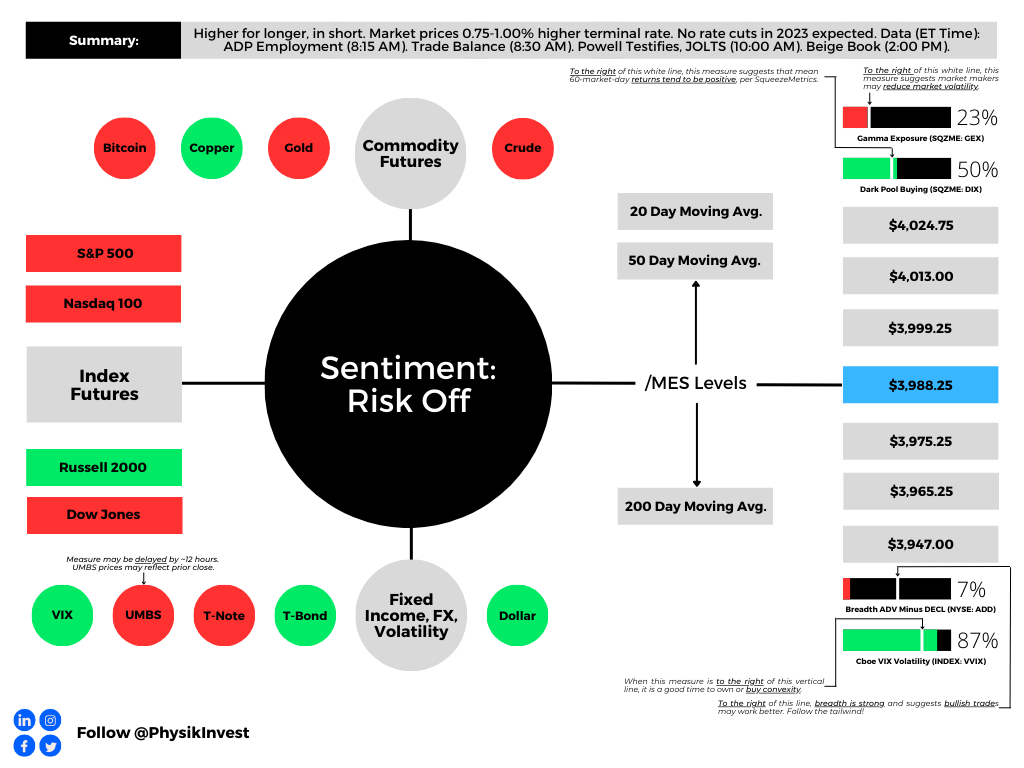
Graphic updated 8:00 AM ET. Sentiment Risk-Off if expected /MES open is below the prior day’s range. /MES levels are derived from the profile graphic at the bottom of this letter. Click here for the latest levels. SqueezeMetrics Dark Pool Index (DIX) and Gamma (GEX) with the latter calculated based on where the prior day’s reading falls with respect to the MAX and MIN of all occurrences available. A higher DIX is bullish. The lower the GEX, the more (expected) volatility. Click to learn the implications of volatility, direction, and moneyness. Breadth reflects a reading of the prior day’s NYSE Advance/Decline indicator. The CBOE VIX Volatility Index (INDEX: VVIX) reflects the attractiveness of owning volatility. UMBS prices via MND. Click here for the economic calendar.
Fundamental
Note: The write-up on the conversation with Simplify’s Mike Green and your letter writer coming soon. Your letter writer is juggling Physik Invest, Benzinga, and two weeks of jury duty! Oh, my.
Following Federal Reserve (Fed) Chair Jerome Powell’s testimony yesterday, traders shifted their outlook on the path of interest rates. The terminal rate now sits between 5.50% and 5.75%, and there are no cuts priced in 2023. Traders are also anticipating a 0.50% hike at the March meeting, up from 0.25%.
Graphic: Retrieved from CME Group Inc’s (NASDAQ: CME) FedWatch Tool. Updated 3/8/2023.
The likes of Ken Griffin, who is the founder of Citadel and Citadel Securities, said the Fed’s updates have confused investors. He advised Powell to talk less about inflation.
“Every time they take the foot off the brake, or the market perceives they’re taking their foot off the brake, and the job’s not done, they make their work even harder,” he explained. TS Lombard’s Steven Blitz added the downshifts in hikes were a mistake and the testimony was a “tacit admission.”
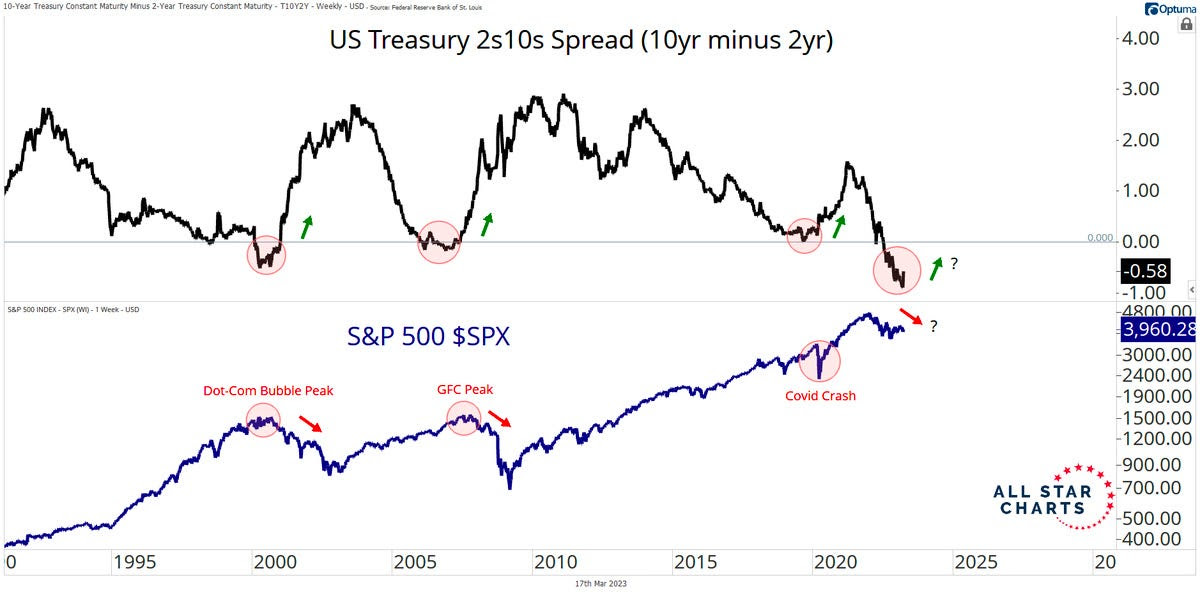
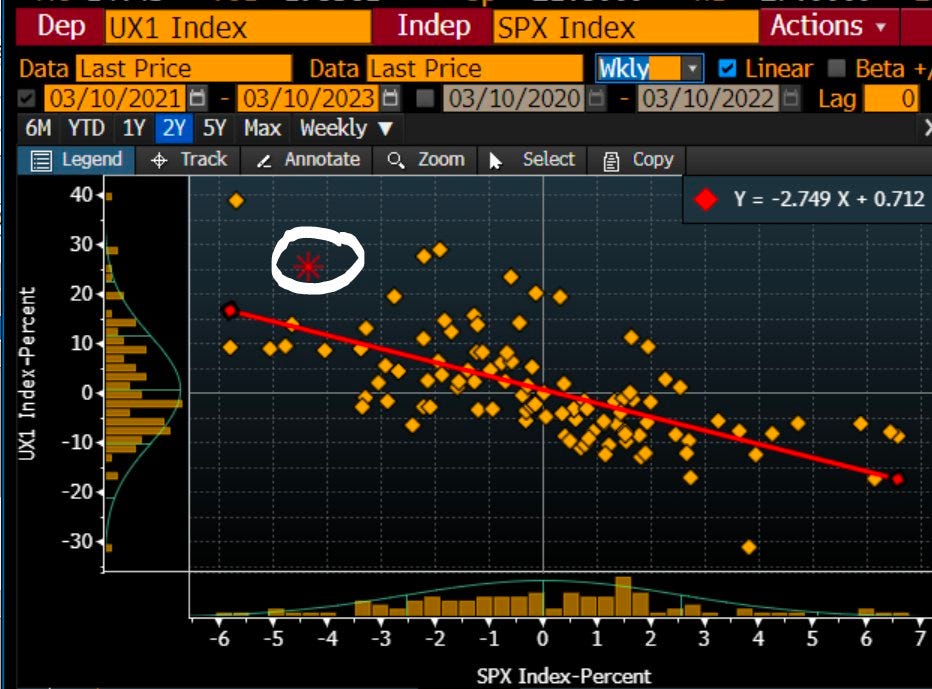
Anyways, the 2- and 10-year Treasury yield spread is at levels when the Fed’s Volcker tightened up the economy to tackle double-digit inflation. Bespoke Investment notes that after that particular spread inverted in October of 1979, the economy peaked at the end of January 1980 but the stock market remained strong.
“The next year, the S&P 500 rallied 22.9%, the Nasdaq was up 36.0%, and the Russell 2000 was up over 40.0%.”
Graphic: Retrieved from Bloomberg.
However, Bespoke adds that “back then, the S&P 500 was trading for just 7.3 times trailing earnings. Today, the S&P 500 trades at a multiple that’s two-and-a-half times that level.” Per last week’s letters, investors’ salvation may be found in less traditional portfolio constructions. That’s what Simplify Asset Management portfolio manager and strategist Mike Green said to your letter writer last week in an interview as well.
Given the unreliability of data, Green explains, and the positioning, investors can get through a lot of the uncertainty by buying a one-year bond and stepping out.
“A real decrease in the purchasing power of the dollar means stock prices should go up because they are something you’re purchasing like everything else. The problem is that would, then, require significant multiple compression as you move forward. So, corporations would be making more money, but that money would be valued less richly because of the inflation.” Conversely, we see multiple expansions, Green said in casting doubt on recent market strength. “Earnings are actually going down.”
With the S&P 500 trading upwards of 20% above the last decade’s average forward price-to-earnings, traditional rules imply the P/E likely falls, and that is supportive of Green’s doubt and support of alternative portfolio constructions layering bond and volatility (i.e., options) exposure to target a full return of principal at the least.
“Using options allows you to introduce a degree of convexity in portfolios where [you] can take risks with a limited downside because [you’ve] either protected [your] downside or simply expended a degree of premium on it.”
With deterioration in some markets “offset by a lack of inventory” and/or hesitancy to sell, the marginal impact of “one person being in distress” may eventually “set a new clearing price … chang[ing] valuations for everybody.” That’s a good place to be as the owner of options protection.
Technical
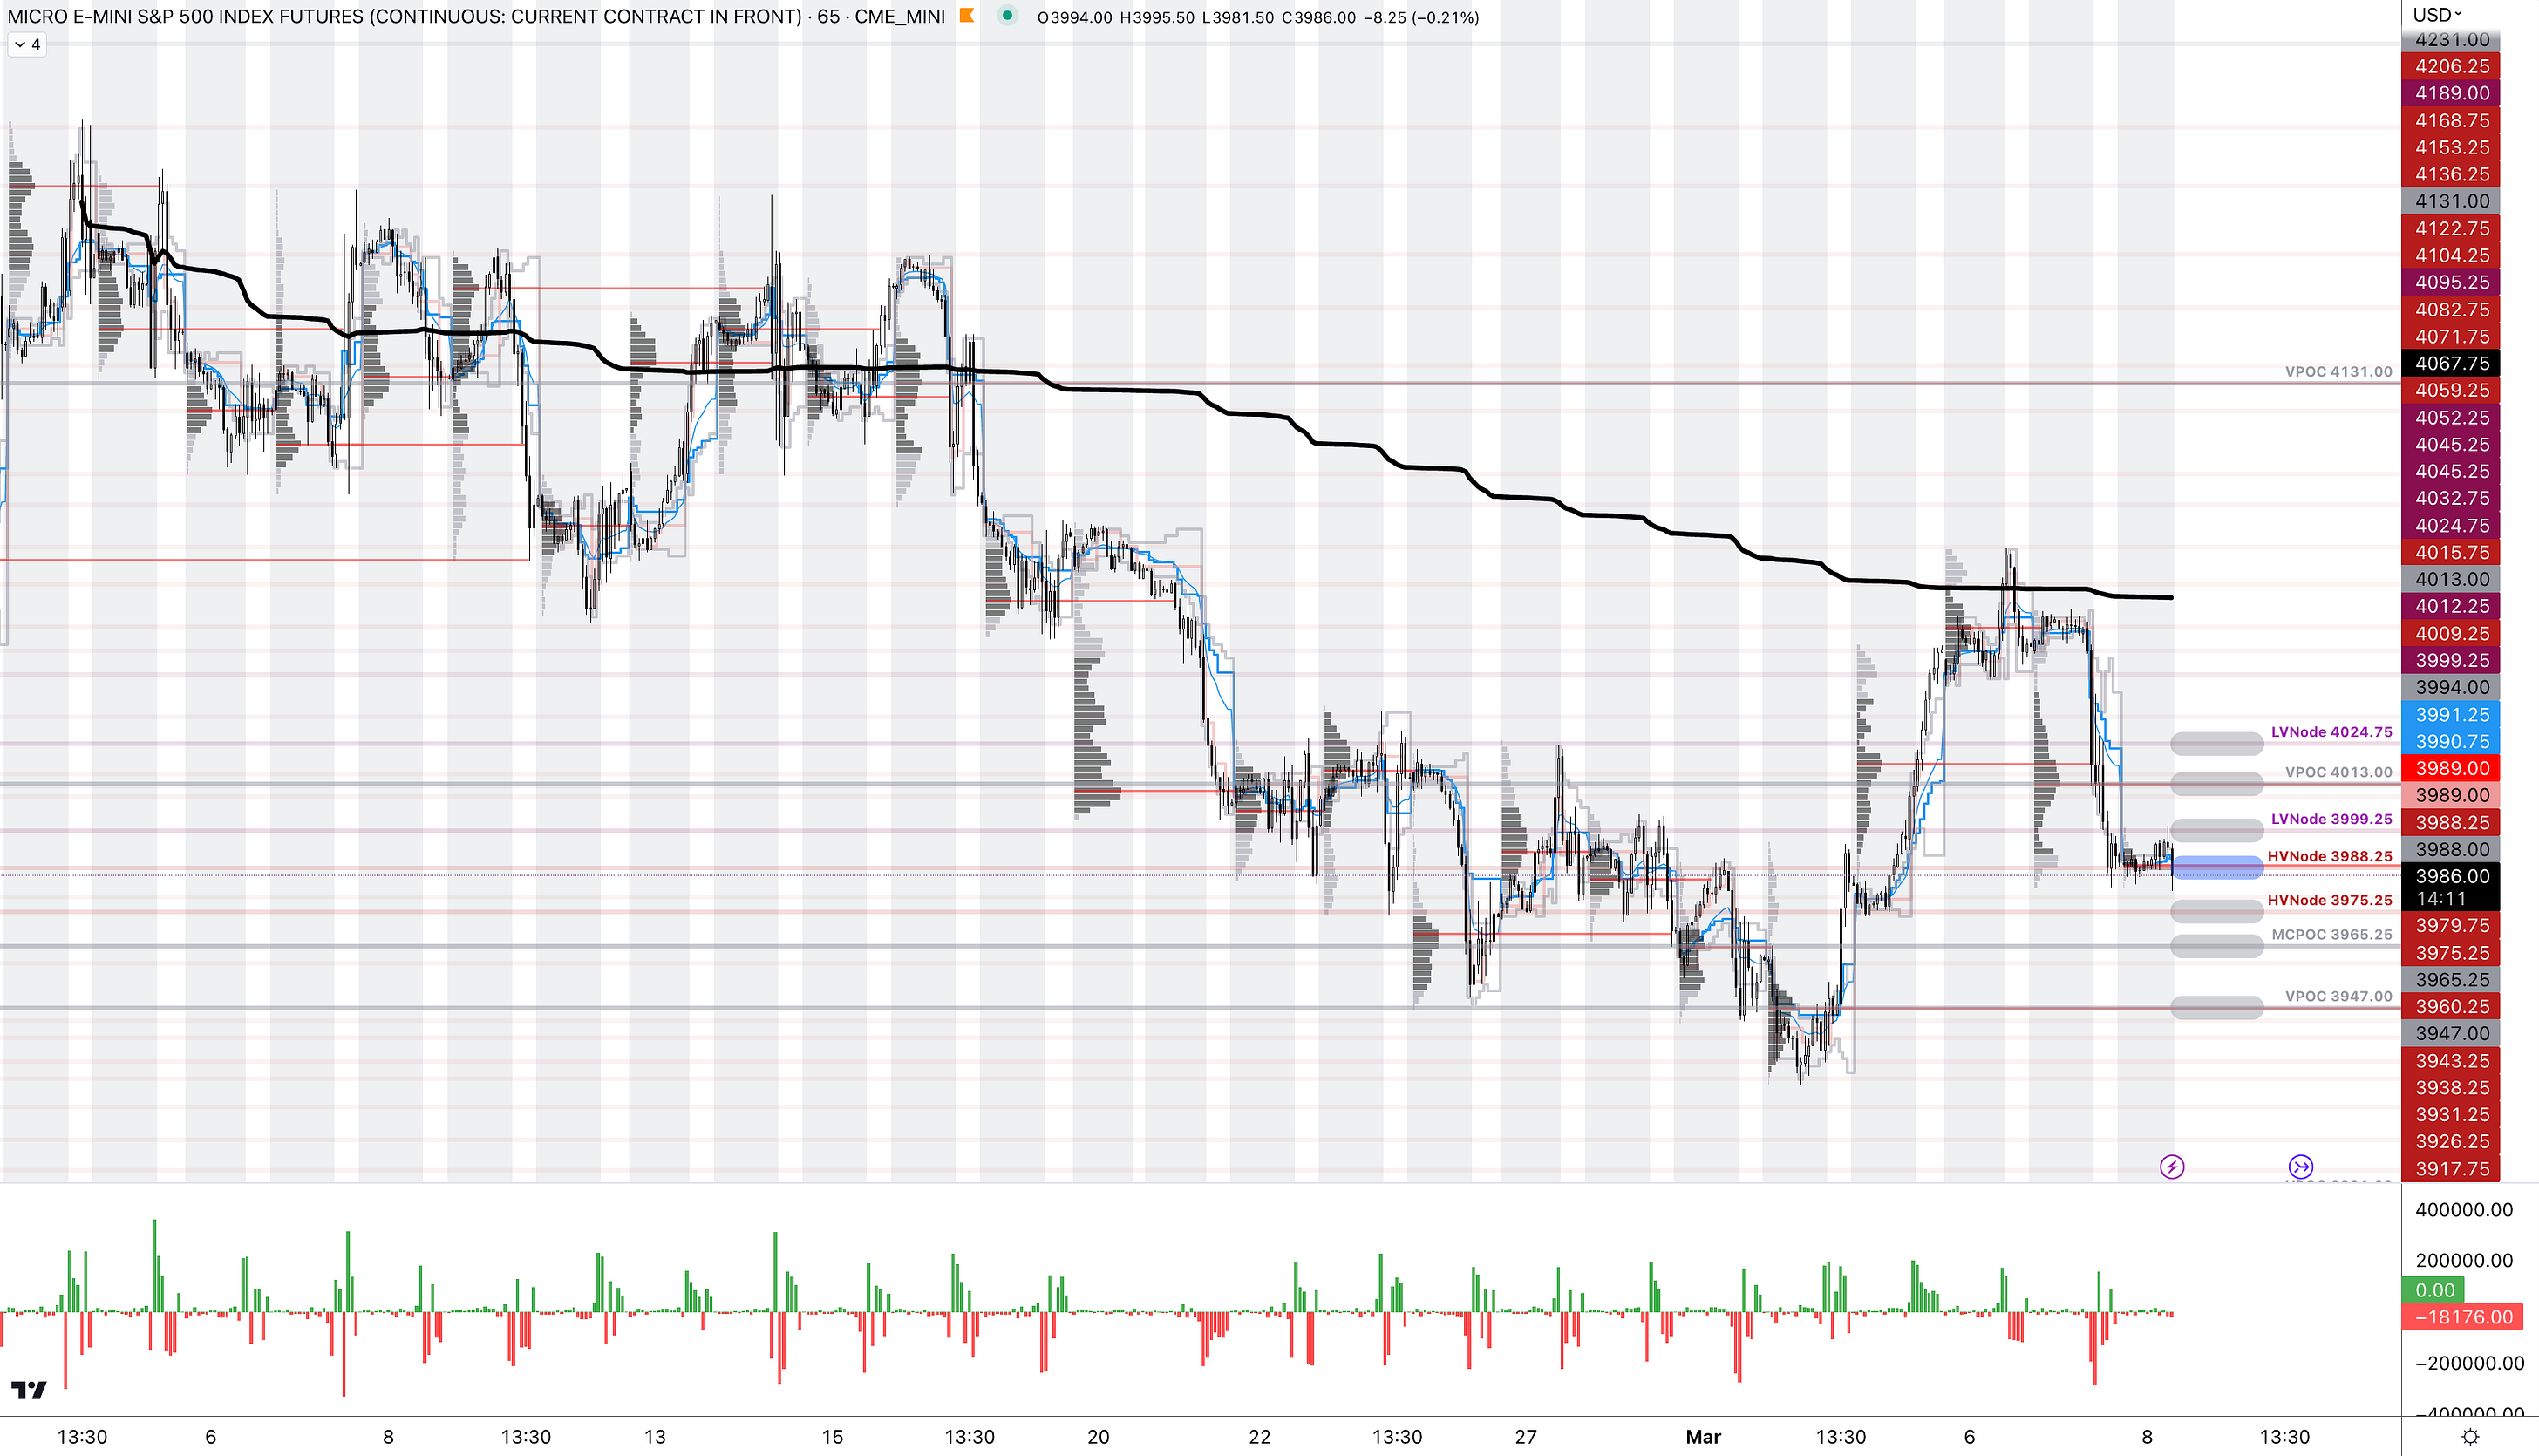
As of 7:50 AM ET, Wednesday’s regular session (9:30 AM – 4:00 PM ET), in the S&P 500, is likely to open in the lower part of a balanced overnight inventory, outside of the prior day’s range, suggesting a potential for immediate directional opportunity.
The S&P 500 pivot for today is $3,988.25.
Key levels to the upside include $3,999.25, $4,013.00, and $4,024.75.
Key levels to the downside include $3,975.25, $3,965.25, and $3,947.00.
Disclaimer: Click here to load the updated key levels via the web-based TradingView platform. New links are produced daily. Quoted levels likely hold barring an exogenous development.
Graphic: 65-minute profile chart of the Micro E-mini S&P 500 Futures.
Definitions
Volume Areas: Markets will build on areas of high-volume (HVNodes). Should the market trend for a period of time, this will be identified by a low-volume area (LVNodes). The LVNodes denote directional conviction and ought to offer support on any test.
If participants auction and find acceptance in an area of a prior LVNode, then future discovery ought to be volatile and quick as participants look to the nearest HVNodes for more favorable entry or exit.
POCs: Areas where two-sided trade was most prevalent in a prior day session. Participants will respond to future tests of value as they offer favorable entry and exit.
MCPOCs: Denote areas where two-sided trade was most prevalent over numerous sessions. Participants will respond to future tests of value as they offer favorable entry and exit.
About
The author, Renato Leonard Capelj, spends the bulk of his time at Physik Invest, an entity through which he invests and publishes free daily analyses to thousands of subscribers. The analyses offer him and his subscribers a way to stay on the right side of the market.
You may view this letter’s content calendar at this link.
Disclaimer
Do not construe this newsletter as advice. All content is for informational purposes. Capelj and Physik Invest manage their own capital and will not solicit others for it.
Physik Invest’s Daily Brief is read free by thousands of subscribers. Join this community to learn about the fundamental and technical drivers of markets.
Graphic updated 6:30 AM ET. Sentiment Neutral if expected /MES open is inside of the prior day’s range. /MES levels are derived from the profile graphic at the bottom of this letter. Click here for the latest levels. SqueezeMetrics Dark Pool Index (DIX) and Gamma (GEX) with the latter calculated based on where the prior day’s reading falls with respect to the MAX and MIN of all occurrences available. A higher DIX is bullish. The lower the GEX, the more (expected) volatility. Click to learn the implications of volatility, direction, and moneyness. Breadth reflects a reading of the prior day’s NYSE Advance/Decline indicator. The CBOE VIX Volatility Index (INDEX: VVIX) reflects the attractiveness of owning volatility. UMBS prices via MND. Click here for the economic calendar.
Fundamental
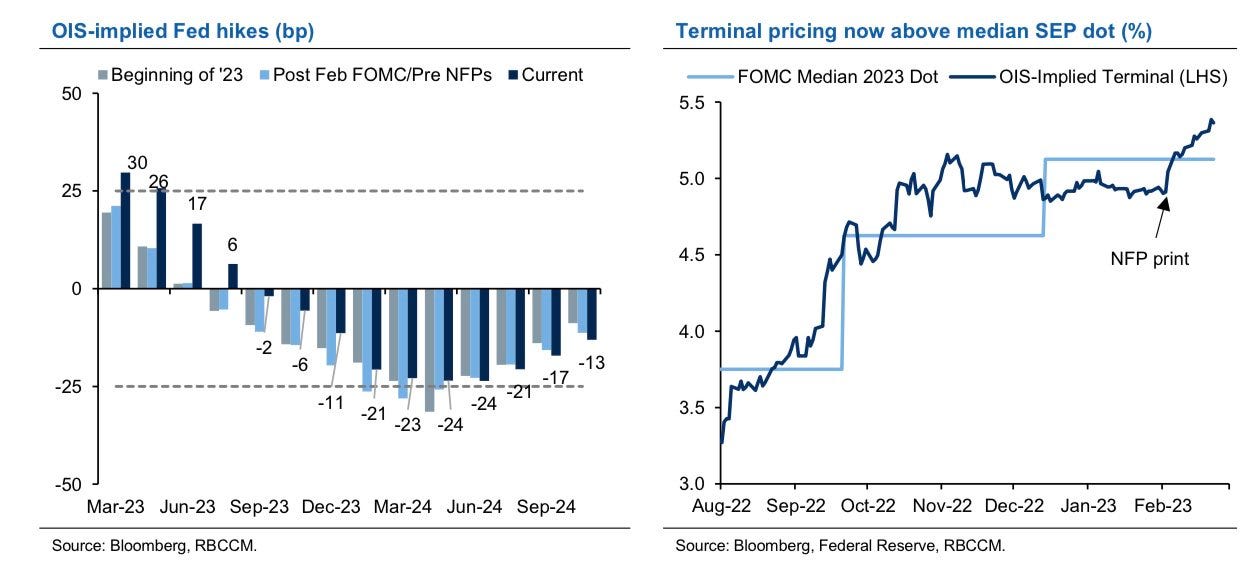
Bloomberg’s John Authers summarized well the release of the Federal Open Market Committee (FOMC) meeting minutes. He said that almost all officials “supported a step down in the pace of tightening by 25 basis points, while a ‘few’ favored or could have supported a bigger 50 basis-point hike. Nobody wanted to stop straightaway.”
“Participants observed that a restrictive policy stance would need to be maintained until the incoming data provided confidence that inflation was on a sustained downward path to 2%, which was likely to take some time,” the minutes said.
Graphic: Retrieved from Royal Bank of Canada (NYSE: RY).
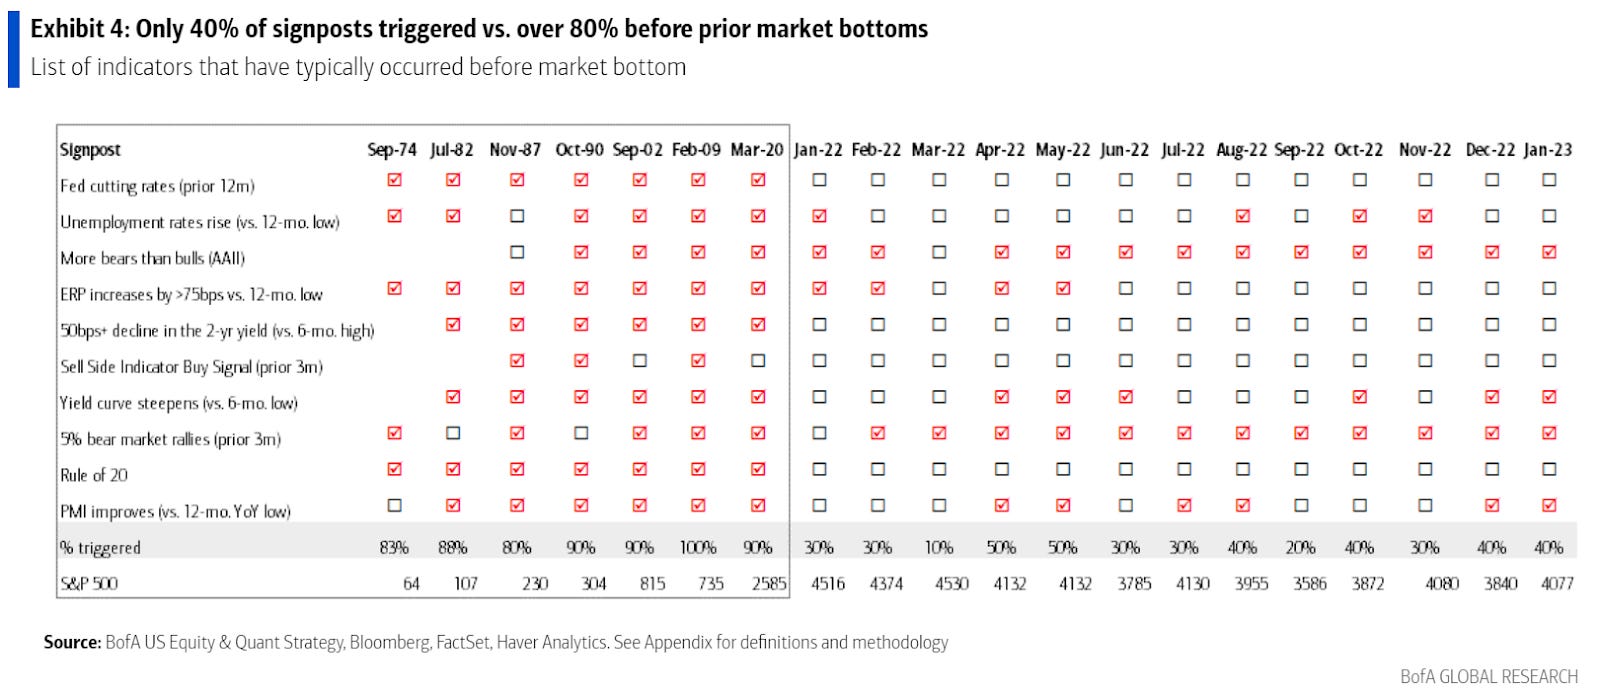
Notwithstanding hits to markets like housing, which news has concentrated on, the S&P 500 (INDEX: SPX) is trading about 18x forward price-to-earnings, Bank of America Corporation (NYSE: BAC) said, the highest since March 2022 and 20% above the last decade’s average P/E.
Graphic: Retrieved from Bloomberg.
Per Savita Subramanian, “the traditional Rule of 20 … holds that the multiple should be whatever number results by subtracting the inflation rate from 20 — which with inflation at 6.4% would imply that the P/E needs to fall to 13.6.”
Graphic: Retrieved from Bank of America Corporation (NYSE: BAC) via Bloomberg.
Recall yesterday’s letter discussing the “risk-reward of holding bonds [looking] betterthan equity (earnings yield).”
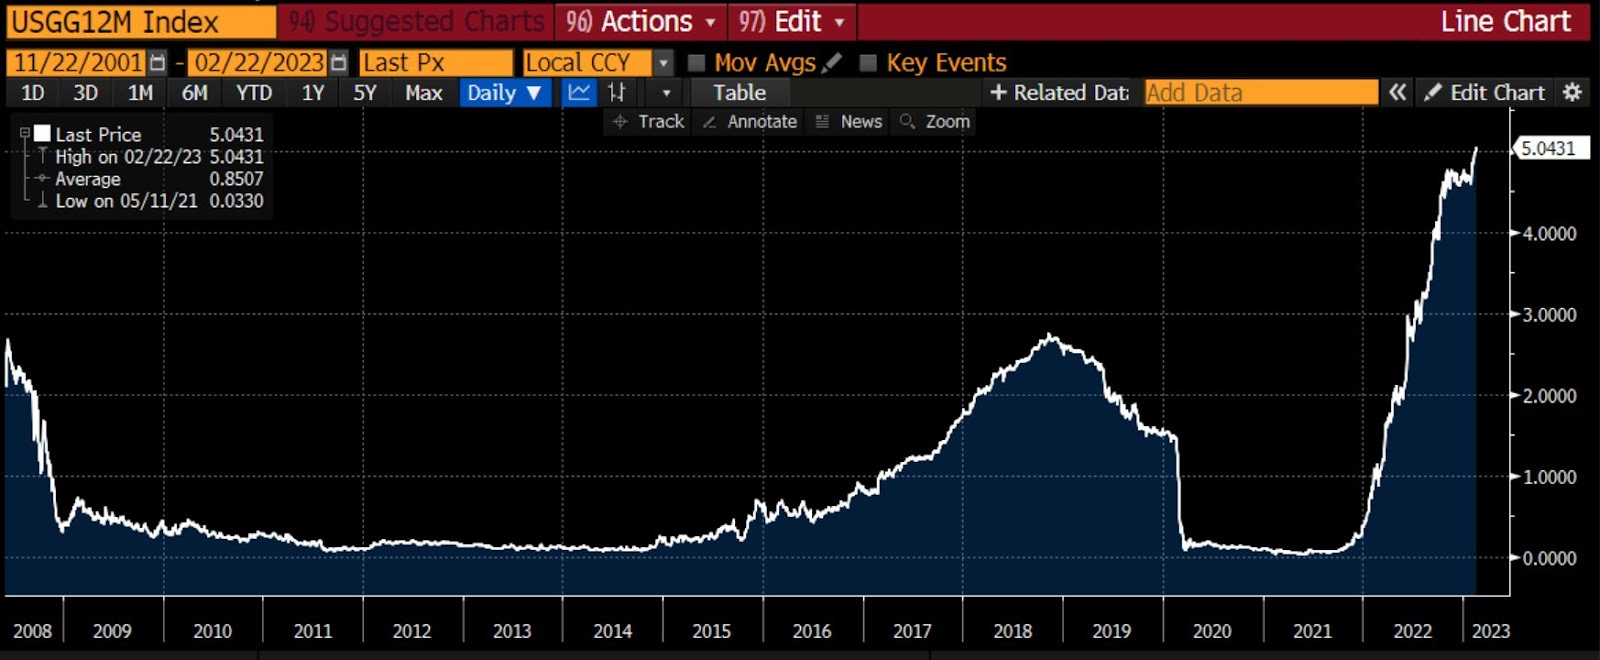
Graphic: Retrieved from Bloomberg’s Lisa Abramowicz. “Yields on 12-month T-bills have risen to their highest since 2001. Most of this has to do with Fed rate hike expectations.”
Positioning
The SPX’s decline is orderly and contained.
However, the break below $4,000.00 SPX did open the door to a “liquidity hole,” SpotGamma explained. New information has traders anticipating more equity market downside; traders are “reset[ing] to lower equity valuations” on the higher-for-longer rate narrative all the while “vanna and gamma hedging serve to pull markets lower.”
The contexts for a far-reaching rally are weak. A change in the context is likely to coincide with charged options values (i.e., wound implied volatility or big put delta).
Technical
As of 6:30 AM ET, Thursday’s regular session (9:30 AM – 4:00 PM ET), in the S&P 500, is likely to open in the middle part of a positively skewed overnight inventory, inside of the prior day’s range, suggesting a limited potential for immediate directional opportunity.
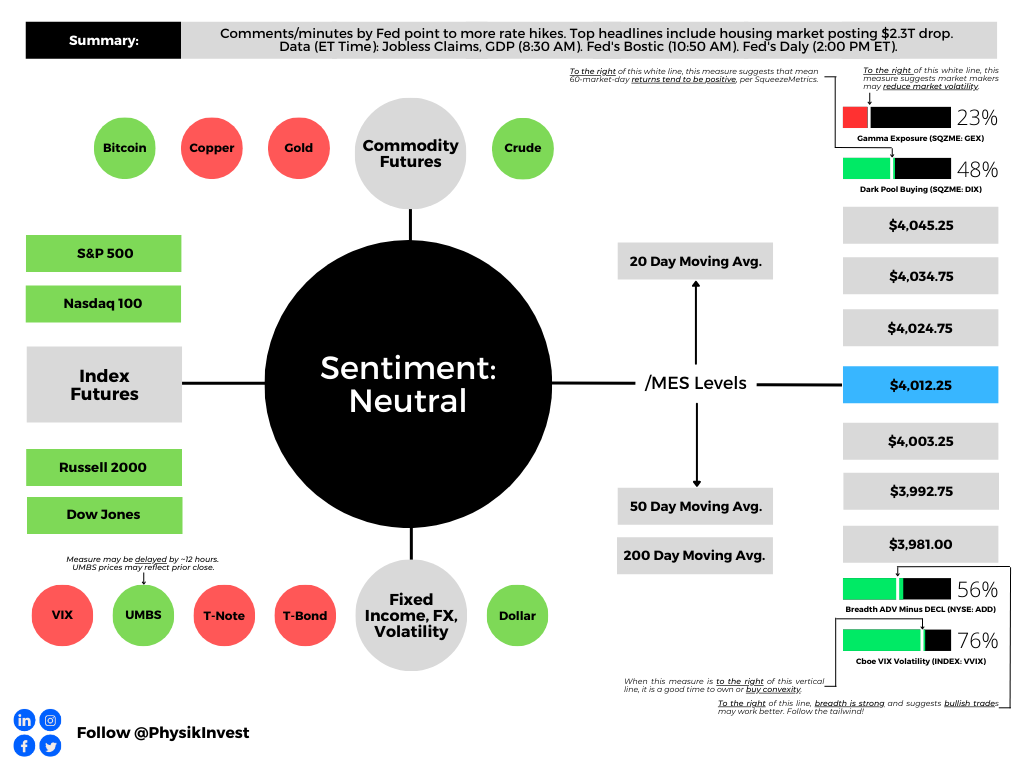
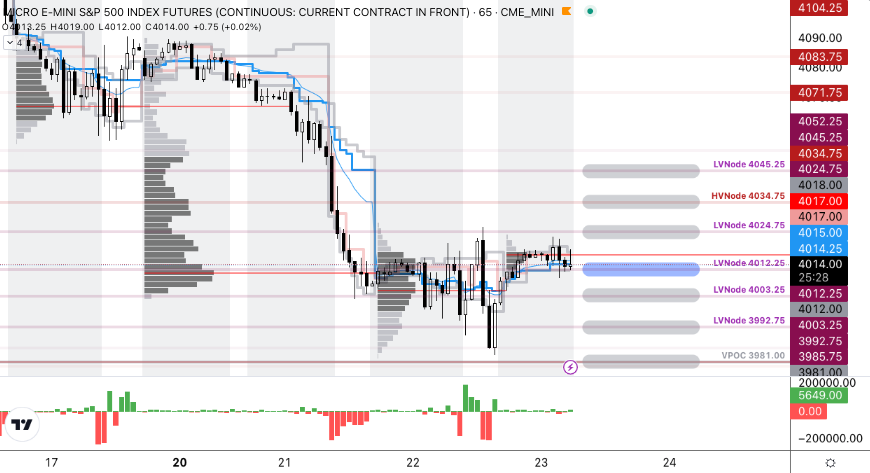
The S&P 500 (FUTURE: /MES) pivot for today is $4,012.25.
Key levels to the upside include $4,024.75, $4,034.75, and $4,045.25.
Key levels to the downside include $4,003.25, $3,992.75, and $3,981.00.
Disclaimer: Click here to load the updated key levels via the web-based TradingView platform. New links are produced daily. Quoted levels likely hold barring an exogenous development.
Graphic: 65-minute profile chart of the Micro E-mini S&P 500 Futures.
Definitions
Volume Areas: Markets will build on areas of high-volume (HVNodes). Should the market trend for a period of time, this will be identified by a low-volume area (LVNodes). The LVNodes denote directional conviction and ought to offer support on any test.
If participants auction and find acceptance in an area of a prior LVNode, then future discovery ought to be volatile and quick as participants look to the nearest HVNodes for more favorable entry or exit.
Delta: An option’s exposure to the direction or underlying asset movement.
Gamma: The sensitivity of an option’s delta to changes in the underlying asset’s price.
Vanna: The rate at which the delta of an option changes with respect to implied volatility.
POCs: Areas where two-sided trade was most prevalent in a prior day session. Participants will respond to future tests of value as they offer favorable entry and exit.
About
The author, Renato Leonard Capelj, works in finance and journalism.
Capelj spends the bulk of his time at Physik Invest, an entity through which he invests and publishes free daily analyses to thousands of subscribers. The analyses offer him and his subscribers a way to stay on the right side of the market. Separately, Capelj is an options analyst at SpotGamma and an accredited journalist.
You may view this letter’s content calendar at this link.
Disclaimer
Do not construe this newsletter as advice. All content is for informational purposes. Capelj and Physik Invest manage their own capital and will not solicit others for it.
Physik Invest’s Daily Brief is read free by thousands of subscribers. Join this community to learn about the fundamental and technical drivers of markets.
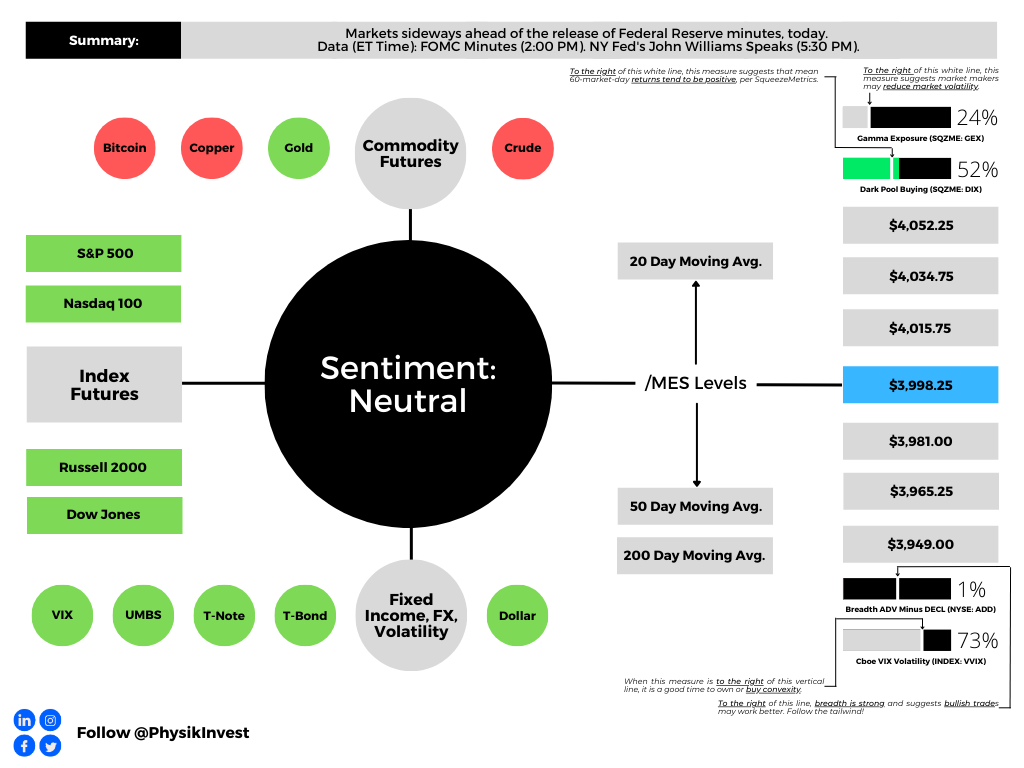
Graphic updated 7:15 AM ET. Sentiment Neutral if expected /MES open is inside of the prior day’s range. /MES levels are derived from the profile graphic at the bottom of this letter. Click here for the latest levels. SqueezeMetrics Dark Pool Index (DIX) and Gamma (GEX) with the latter calculated based on where the prior day’s reading falls with respect to the MAX and MIN of all occurrences available. A higher DIX is bullish. The lower the GEX, the more (expected) volatility. Click to learn the implications of volatility, direction, and moneyness. Breadth reflects a reading of the prior day’s NYSE Advance/Decline indicator. The CBOE VIX Volatility Index (INDEX: VVIX) reflects the attractiveness of owning volatility. UMBS prices via MND. Click here for the economic calendar.
Fundamental
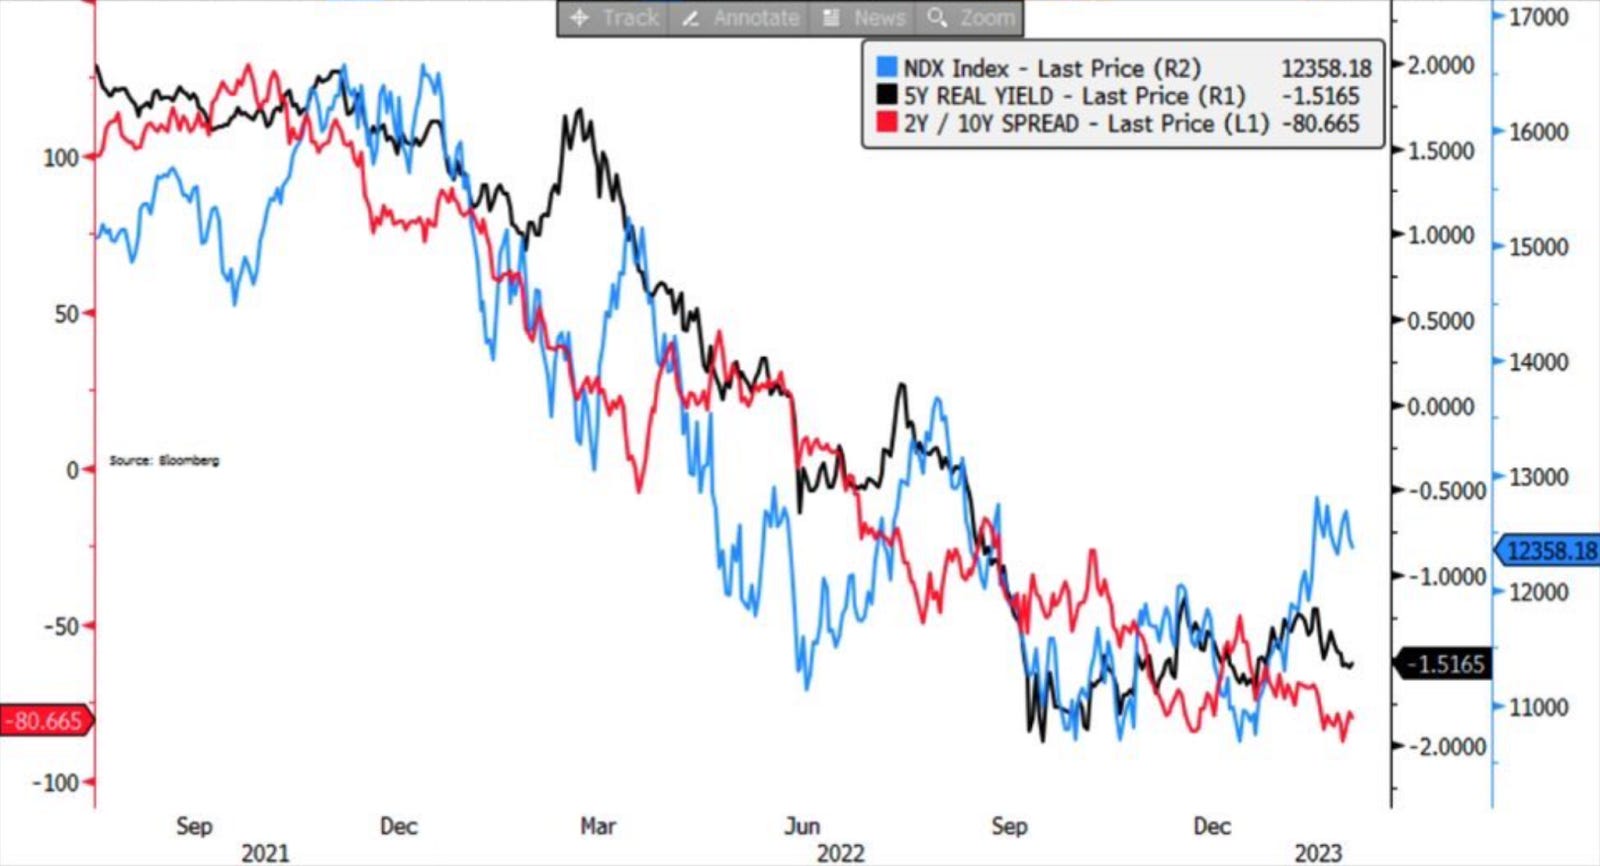
We look beyond all the doom-and-gloom narrative to the bond-equity divergence which JPMorgan Chase & Co’s (NYSE: JPM) Marko Kolanovic wrote about recently.
Essentially, regressions suggest the move in interest rates since the Federal Reserve’s (Fed) meeting earlier this month should have resulted in a 5-10% sell-off in the rate-sensitive Nasdaq. It didn’t. Per Kolanovic, “this divergence cannot go much further.”
Recall interest rates matter to discounted future cash flows. The higher rates are the, worse that is for equities, says Damped Spring’s Andy Constan well in an interview.
Interest rates matter elsewhere as well. When interest rates increase, “a mortgage goes down in price by a greater amount than the bond because the expected maturity of the mortgage becomes longer. The magnitude of this unbalanced price volatility characteristic is measured by a financial statistic called ‘convexity.’” Managing this convexity can be problematic and force feedback loops, just as we talk about with options per the below. See here for more.
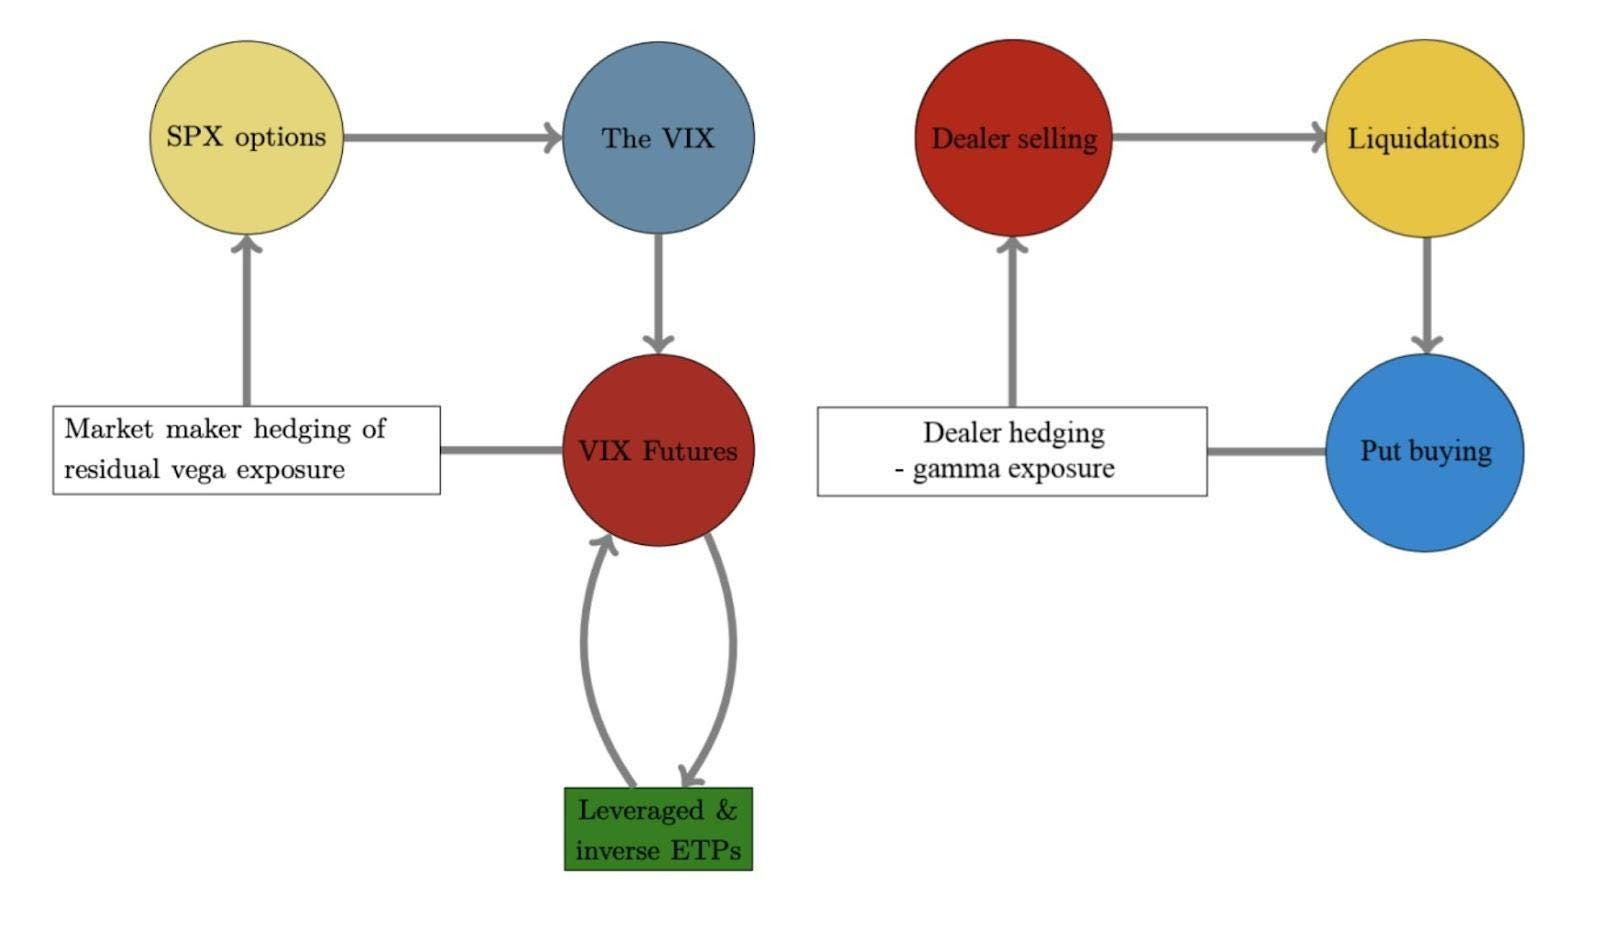
Graphic: The “Biggest tail risk to SPX isn’t any macro data/virus/war but its own options market.”
Kolanvoic ends: The “risk-reward of holding bonds at this level of short-term yields looks better than equity (earnings yield) than any time since the great financial crisis (i.e., the spread between 2y and equity earnings yield is at the lowest point since 2007).”
Graphic: Retrieved from JPMorgan Chase & Co (NYSE: JPM).
Positioning
This letter said there would be movement after last week’s options expirations (OpEx).
To quote the February 15 letter, ignoring the “excellent” liquidity and traders buying S&P 500 (INDEX: SPX) “hand over fist,” OpEx would result in a decline in counterparty exposure to positive gamma (i.e., positive exposure to movement). Support from an options positioning perspective would decline, and counterparties would “do less to disrupt and more to bolster movement.”
That’s along the lines of what’s happening, though the movement appears orderly.
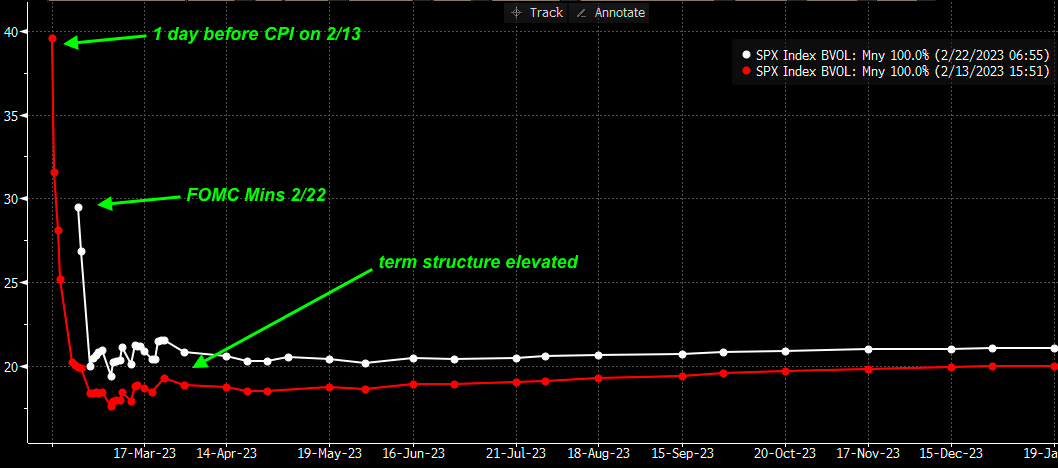
Per SpotGamma, “The selling appears contained, as evidenced by an upward trending [implied volatility or IVOL] term structure and light bid in topline measures of [IVOL] like the [Cboe Volatility Index (INDEX: VIX)].” Notwithstanding this light bid at the front of the term structure, there is no rush to protect, as would be evidenced by longer-dated IVOL shifting “materially higher as traders reset to lower equity valuations.”
Graphic: Retrieved from SpotGamma. “SPX term structure today vs 2/13 (day prior to CPI). Traders had higher vol expectations for CPI vs today’s FOMC minutes, but [the] term structure is now more elevated. Makes sense as SPX [is] -3% lower. However, the loss of stabilizing OPEX positioning, elevated IV, & flat gamma may lead to higher relative vol today.”
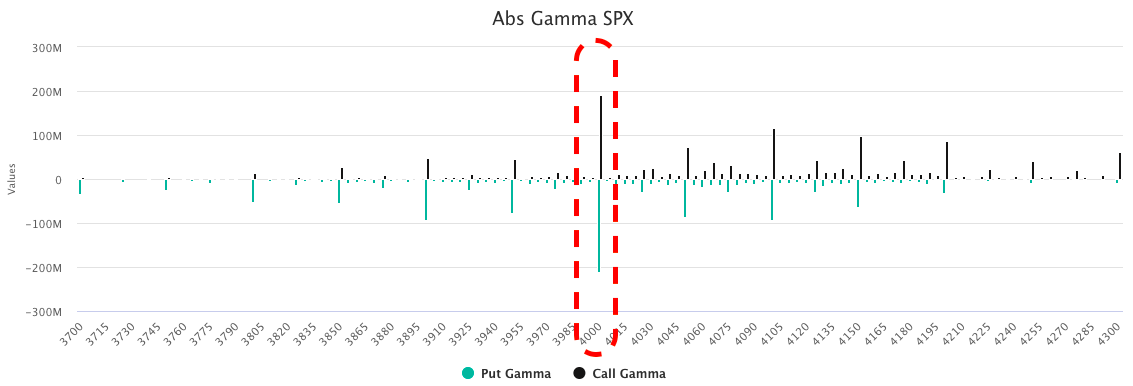
With there being many options positions concentrated near the $4,000.00 SPX area, markets may be at risk of accelerated selling. Below $4,000.00 traders desire to own predominantly puts, and this leaves counterparties “short puts and [] positive delta, as well as negative gamma and vega, meaning they lose money in an increasing way as the market trades lower and volatility increases.” To hedge, counterparties could sell futures or stocks into the decline. This accelerates selling.
So, with a break of that big $4,000.00 level increasing risk that selling accelerates, the desire to protect will bid IVOL and the marginal impact of its expansion can do more damage than good that any marginal compression can do.
Graphic: Retrieved from SpotGamma. “IV has now compressed to levels associated with recent market tops. If realized vol (RV) declined, then IV could go lower. But, realized isn’t declining.”
In light of this, your letter writer leans negative delta, as well as positive gamma and vega. If the market trades lower, such a setup would make money in short.
Technical
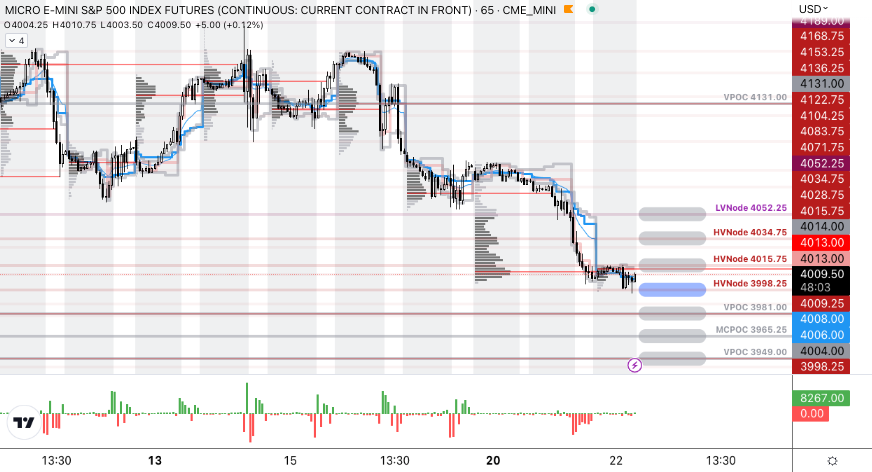
As of 7:15 AM ET, Wednesday’s regular session (9:30 AM – 4:00 PM ET), in the S&P 500, is likely to open in the middle part of a negatively skewed overnight inventory, inside of the prior day’s range, suggesting a limited potential for immediate directional opportunity.
The S&P 500 pivot for today is $3,998.25.
Key levels to the upside include $4,015.75, $4,034.75, and $4,052.25.
Key levels to the downside include $3,981.00, $3,965.25, and $3,949.00.
Disclaimer: Click here to load the updated key levels via the web-based TradingView platform. New links are produced daily. Quoted levels likely hold barring an exogenous development.
Graphic: 65-minute profile chart of the Micro E-mini S&P 500 Futures.
Definitions
Volume Areas: Markets will build on areas of high-volume (HVNodes). Should the market trend for a period of time, this will be identified by a low-volume area (LVNodes). The LVNodes denote directional conviction and ought to offer support on any test.
If participants auction and find acceptance in an area of a prior LVNode, then future discovery ought to be volatile and quick as participants look to the nearest HVNodes for more favorable entry or exit.
Gamma: The sensitivity of an option’s Delta to changes in the underlying asset’s price.
CPOCs: Denote areas where two-sided trade was most prevalent over all sessions. Participants will respond to future tests of value as they offer favorable entry and exit.
POCs: Areas where two-sided trade was most prevalent in a prior day session. Participants will respond to future tests of value as they offer favorable entry and exit.
MCPOCs: Denote areas where two-sided trade was most prevalent over numerous sessions. Participants will respond to future tests of value as they offer favorable entry and exit.
Inversion Of VIX Futures Term Structure: Longer-dated VIX expiries are less expensive; is a warning of elevated near-term risks for equity market stability.
About
The author, Renato Leonard Capelj, works in finance and journalism.
Capelj spends the bulk of his time at Physik Invest, an entity through which he invests and publishes free daily analyses to thousands of subscribers. The analyses offer him and his subscribers a way to stay on the right side of the market. Separately, Capelj is an options analyst at SpotGamma and an accredited journalist.
You may view this letter’s content calendar at this link.
Disclaimer
Do not construe this newsletter as advice. All content is for informational purposes. Capelj and Physik Invest manage their own capital and will not solicit others for it.
The daily brief is a free glimpse into the prevailing fundamental and technical drivers of U.S. equity market products. Join the 900+ that read this report daily, below!
Graphic updated 6:20 AM ET. Sentiment Neutral if expected /ES open is inside of the prior day’s range. /ES levels are derived from the profile graphic at the bottom of the following section. Levels may have changed since initially quoted; click here for the latest levels. SqueezeMetrics Dark Pool Index (DIX) and Gamma (GEX) calculations are based on where the prior day’s reading falls with respect to the MAX and MIN of all occurrences available. A higher DIX is bullish. At the same time, the lower the GEX, the more (expected) volatility. Learn the implications of volatility, direction, and moneyness. Breadth reflects a reading of the prior day’s NYSE Advance/Decline indicator. VIX reflects a current reading of the CBOE Volatility Index (INDEX: VIX) from 0-100.
Fundamental
A hot topic over the past sessions is speculation on the Federal Reserve’s (Fed) next steps and the impact those steps may have.
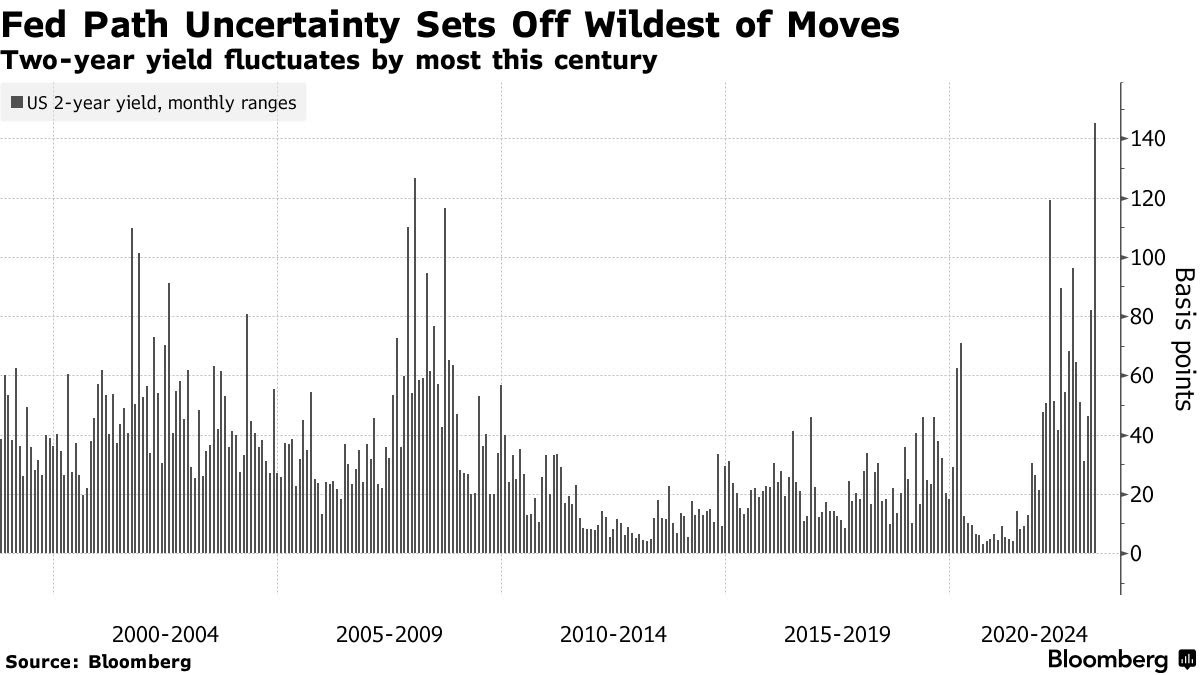
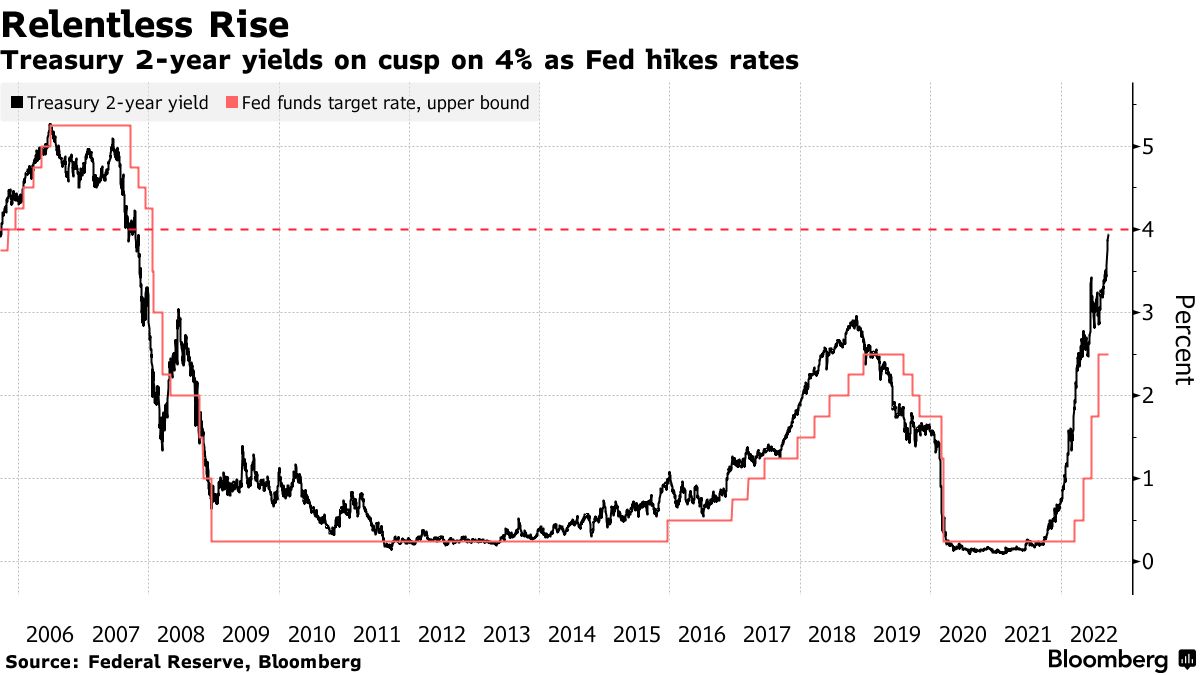
Further, in the news, last night, aside from the prospects of another big hike, was “the biggest annual increase since 1994” in two-year Treasury yields. That’s in part due to recent upside surprises in inflation talked about yesterday and last week.
Graphic: Retrieved from Bloomberg. US Government Bonds 2 YR Yield and Fed Funds.
Per the CME Group Inc’s (NASDAQ: CME) FedWatch Tool, there’s a near-80% chance of a 50 to 75 basis point bump to the target rate, as the Fed looks to stem inflation.
Graphic: Retrieved from CME Group Inc (NASDAQ: CME).
This is all the while the Fed will let their Treasuries mature and, “instead of using the proceeds to buy another Treasury,” they will “buy nothing and reduce their balance sheet,” explained the Damped Spring’s Andy Constan.
Accordingly, “to pay that bond off, the US Treasury has to issue a bond,” and this bond will need to be “bought by the private sector” which has “to sell something to buy the bond, and that starts at the riskiest asset,” like crypto, watches, and cars, for instance.
Let’s unpack this further, below.
The transmission mechanism of quantitative easing (QE) and tightening (QT) is very weak “to economic activity but very strong to financial markets.”
In a detailed explainer, initially quoted in the September 16 letter, we learned “QE creates new reserves on bank balance sheets. The added cushion gives banks … more room to lend or to finance trading activity by hedge funds, … further enhancing market liquidity.”
Therefore, QE (QT) will mildly inflate (deflate) the economy as asset owners are pushed further out (in) on the risk curve. In practice, with QE, owners get pushed from Treasury to corporate bonds, bonds to equities, equities to crypto, and, finally, homes, watches, cars, and beyond.
With QT, as put forth, earlier, the reverse happens.
As Joseph Wang, author of Central Banking 101, said, in short, with QT “consumers have less wealth to spend” and this means that drops in financial markets and the tightening of “financial conditions impact the real economy,” negatively, albeit not as harshly as a rise in interest rates.
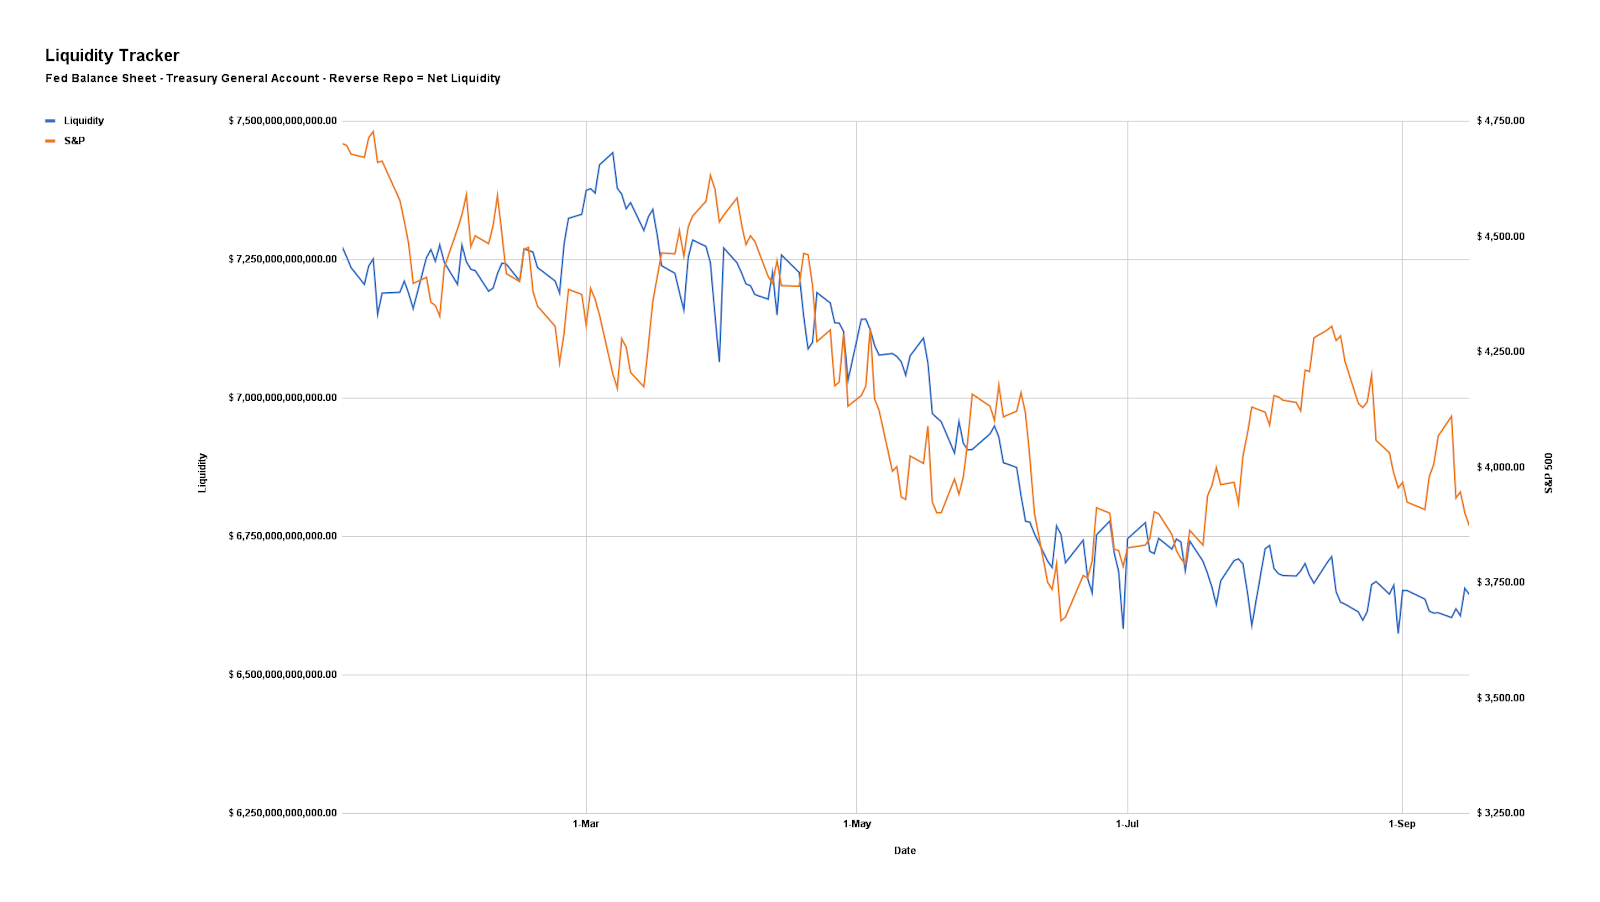
Unpacking further, with the Treasury set to increase issuance, thus boosting the government’s checking account, or Treasury General Account (TGA), “the level of reserves in the banking system declines, or the level of RRP could also decline,” Wang added.
This is as all of the above are liabilities to the Fed. Therefore, money comes out of the economy, via a fall in reserves, and this is put into the government’s checking account (TGA boost).
The linked reduction in bank deposits and reserves bolsters “repurchase agreement rates and borrowing benchmarks linked to them,” per Bloomberg. This, then, may play into “an additional tightening of overall financial conditions,” as mentioned, earlier.
Graphic: Via Physik Invest. Data compiled by @jkonopas623. Fed Balance Sheet data, here. Treasury General Account Data, here. Reverse Repo data, here. NL = BS – TGA – RRP.
Here’s a provision.
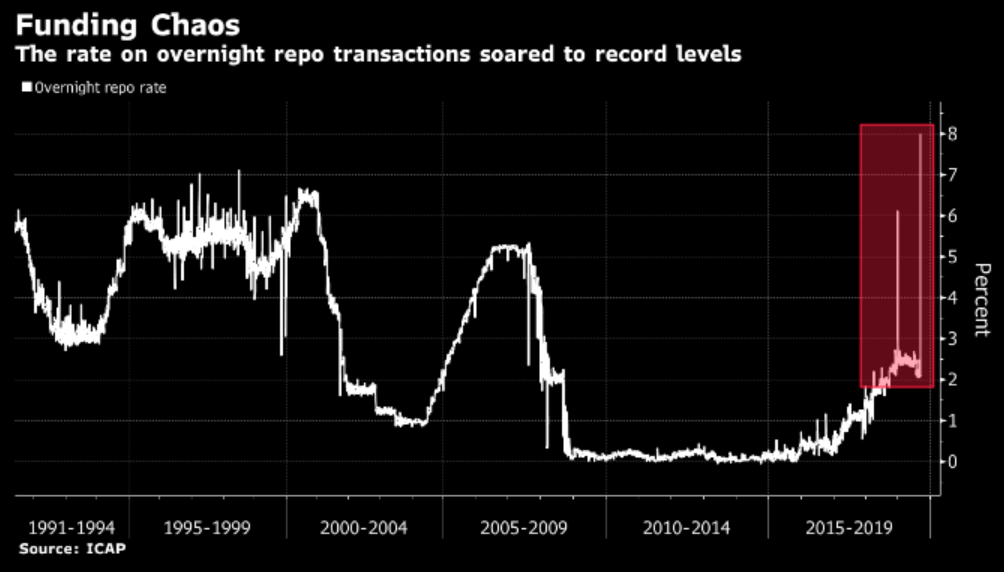
It’s the case that the Fed believes it needs a certain level of reserves for the proper functioning of the financial system (~$2 trillion). Wang explained that in 2019, banks dumped a lot of their reserves into repo to earn some extra return.
When QT was about to end, there was less money in their reserves which preceded a spike in rates and a blow-up among those who needed the money the most, as explained here.
“The Fed saw the system breaking at around 8% GDP and thinks that is where the limit is,” he added. “This suggests, going forward, the Fed is going to have to do something to top up the reserves in the banking system, and they have tools to do that.”
What’s the result, then?
These tools include capping the RRP, “forcing money out into the banking system,” as well as modifying the supplementary leverage ratio (SLR), making it “cheaper for banks to maintain a large balance sheet.”
Together, this, ultimately, may increase “the capacity of banks to make loans [and] create credit, so that is financial easing.”
As Wang said in another work best: These “easing effects may even overwhelm the tightening impact of a marginally longer QT.”
So, what can we expect?
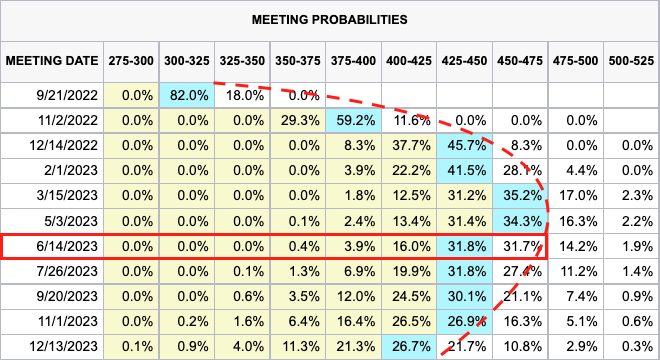
In terms of timelines, Wang puts forth that economic data will likely prompt a mid-2023 cut in rates, which is in line with what the futures market is pricing.
Graphic: Retrieved from CME Group Inc (NASDAQ: CME).
Before then, traders are pricing nearly 225 to 250 basis points of rate increases. Based on where rates are at, now, some argue the market may still be too expensive.
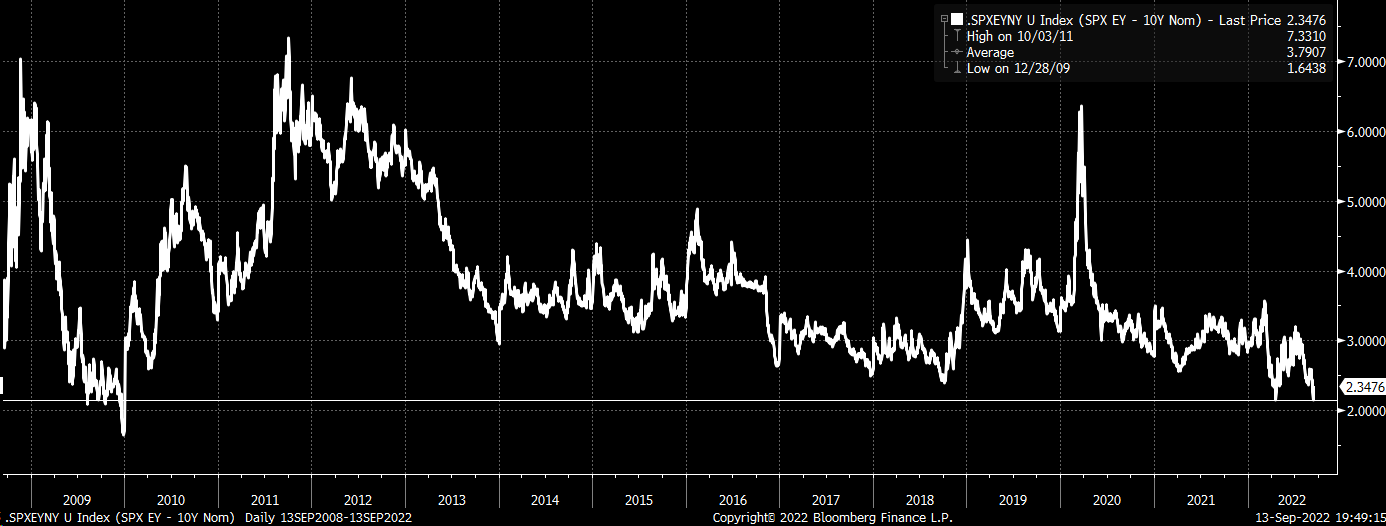
Graphic: Retrieved from Bloomberg via Michael J. Kramer. “What is amazing is how expensive this market is relative to rates. The spread between the S&P 500 Earnings yield and the 10-Yr nominal rate is at multi-year lows.”
Positioning
We’ve talked about this before but what is expected, after Wednesday’s Fed update, is a move that is “structural,” as Kai Volatility’s Cem Karsan has put it before, and “a function of inevitable rebalancing of dealer inventory post-event.”
“The second move and final resolution, if you wait for it, is usually tied to the incremental effects on liquidity (QE/QT).”
Should participants’ fears with respect to the pace of tightening, for one, be assuaged, then it is likely that the protection demanded heading into the meeting, that’s bidding measures of implied volatility (IVOL), is supplied. This likely provides a boost.
From thereon, markets are more at the whims of macro-type positioning on rising rates and the withdrawal of liquidity.
Technical
As of 6:20 AM ET, Tuesday’s regular session (9:30 AM – 4:00 PM ET), in the S&P 500, is likely to open in the lower part of a negatively skewed overnight inventory, inside of prior-range and -value, suggesting a limited potential for immediate directional opportunity.
In the best case, the S&P 500 trades higher.
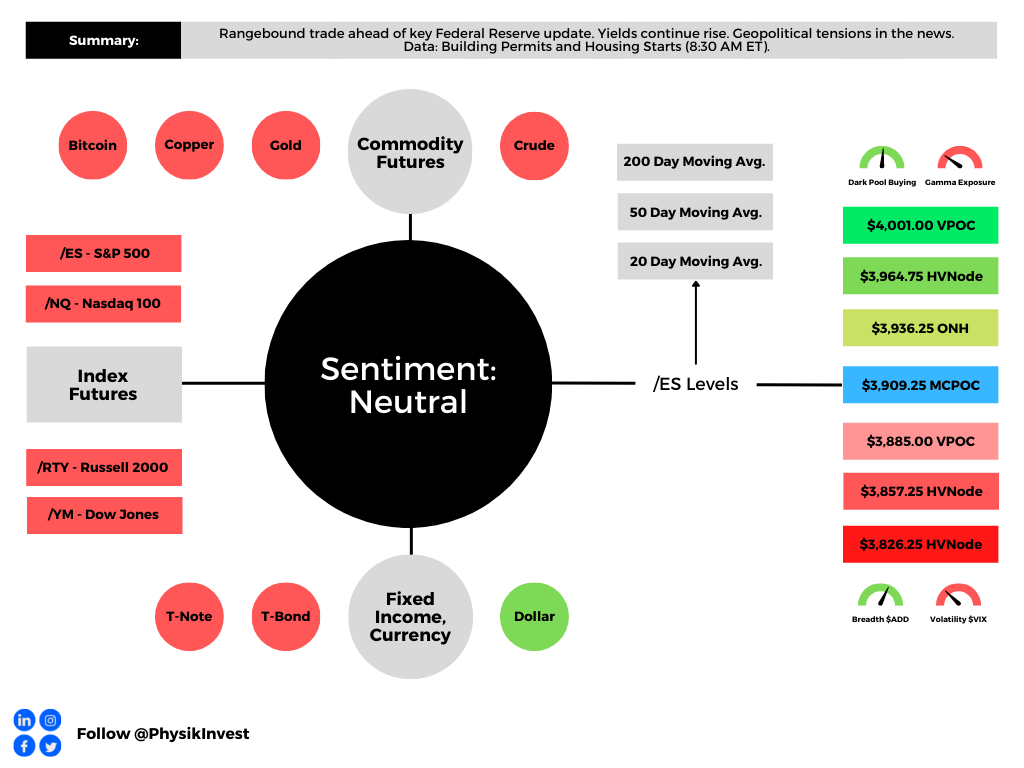
Any activity above the $3,909.25 MCPOC puts into play the $3,936.25 ONH. Initiative trade beyond the ONH could reach as high as the $3,964.75 HVNode and $4,001.00 VPOC, or higher.
In the worst case, the S&P 500 trades lower.
Any activity below the $3,909.25 MCPOC puts into play the $3,885.00 VPOC. Initiative trade beyond the VPOC could reach as low as the $3,857.25 and $3,826.25 HVNode, or lower.
Click here to load today’s key levels into the web-based TradingView charting platform. Note that all levels are derived using the 65-minute timeframe. New links are produced, daily.
Graphic: 65-minute profile chart of the Micro E-mini S&P 500 Futures.
Definitions
Volume Areas: A structurally sound market will build on areas of high volume (HVNodes). Should the market trend for long periods of time, it will lack sound structure, identified as low volume areas (LVNodes). LVNodes denote directional conviction and ought to offer support on any test.
If participants were to auction and find acceptance into areas of prior low volume (LVNodes), then future discovery ought to be volatile and quick as participants look to HVNodes for favorable entry or exit.
POCs: POCs are valuable as they denote areas where two-sided trade was most prevalent in a prior day session. Participants will respond to future tests of value as they offer favorable entry and exit.
MCPOCs: POCs are valuable as they denote areas where two-sided trade was most prevalent over numerous day sessions. Participants will respond to future tests of value as they offer favorable entry and exit.
About
After years of self-education, strategy development, mentorship, and trial-and-error, Renato Leonard Capelj began trading full-time and founded Physik Invest to detail his methods, research, and performance in the markets.
Capelj also develops insights around impactful options market dynamics at SpotGamma and is a Benzinga reporter.
In no way should the materials herein be construed as advice. Derivatives carry a substantial risk of loss. All content is for informational purposes only.
The daily brief is a free glimpse into the prevailing fundamental and technical drivers of U.S. equity market products. Join the 300+ that read this report daily, below!
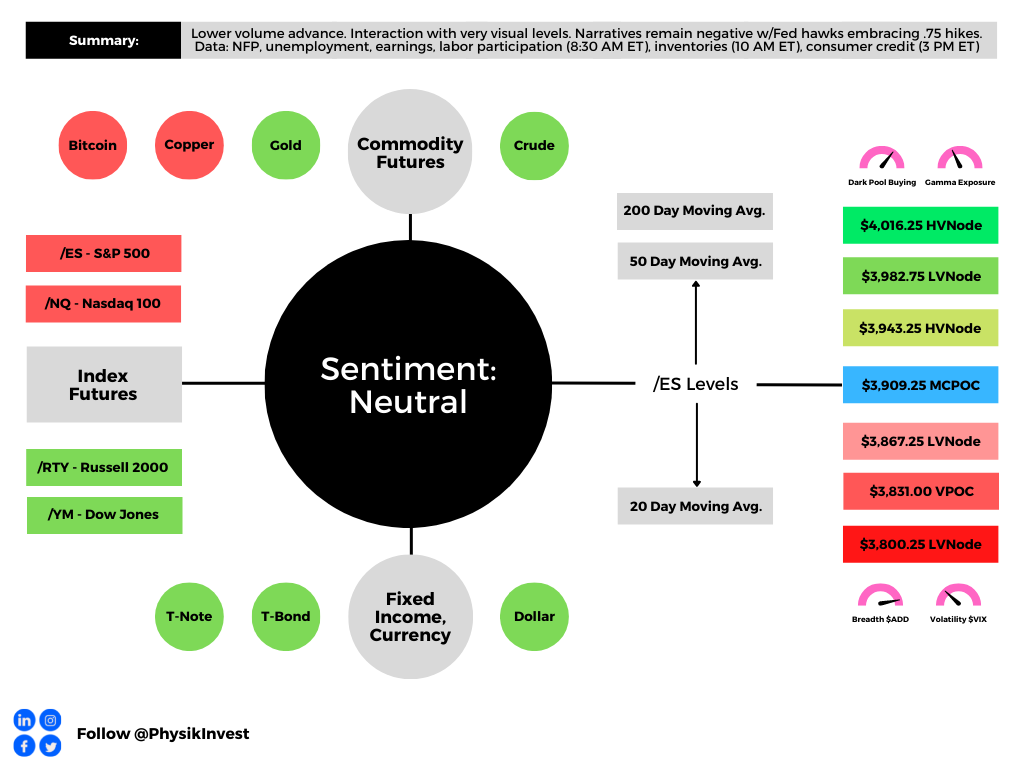
Graphic updated 6:30 AM ET. Sentiment Neutral if expected /ES open is inside of the prior day’s range. /ES levels are derived from the profile graphic at the bottom of the following section. Levels may have changed since initially quoted; click here for the latest levels. SqueezeMetrics Dark Pool Index (DIX) and Gamma (GEX) calculations are based on where the prior day’s reading falls with respect to the MAX and MIN of all occurrences available. A higher DIX is bullish. At the same time, the lower the GEX, the more (expected) volatility. Learn the implications of volatility, direction, and moneyness. Breadth reflects a reading of the prior day’s NYSE Advance/Decline indicator. VIX reflects a current reading of the CBOE Volatility Index (INDEX: VIX) from 0-100.
Fundamental
A light few letters after what it seems were like weeks of heavy content to discuss.
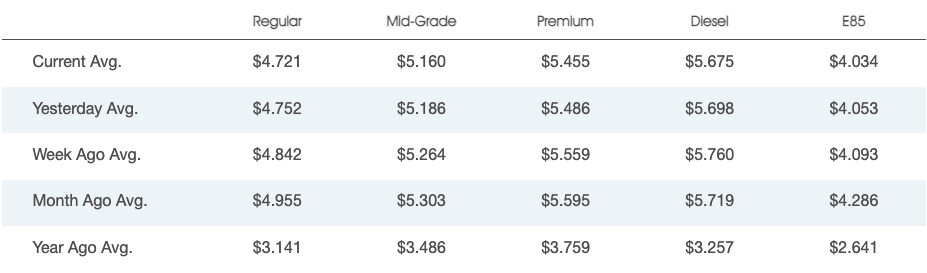
Further, prices at the pump are falling on an “unseasonal” drop in consumption, all the while the biggest bulls have tempered their outlooks on the market citing inflation and the implications of geopolitical tensions.
Graphic: National average gas prices posted by AAA.
An overseas slowdown affecting China likely solicits stimulus. Reported was China’s Ministry of Finance considering the sale of special bonds with proceeds used to pay for infrastructure and boost a slowed economy increasingly in the clear from Covid.
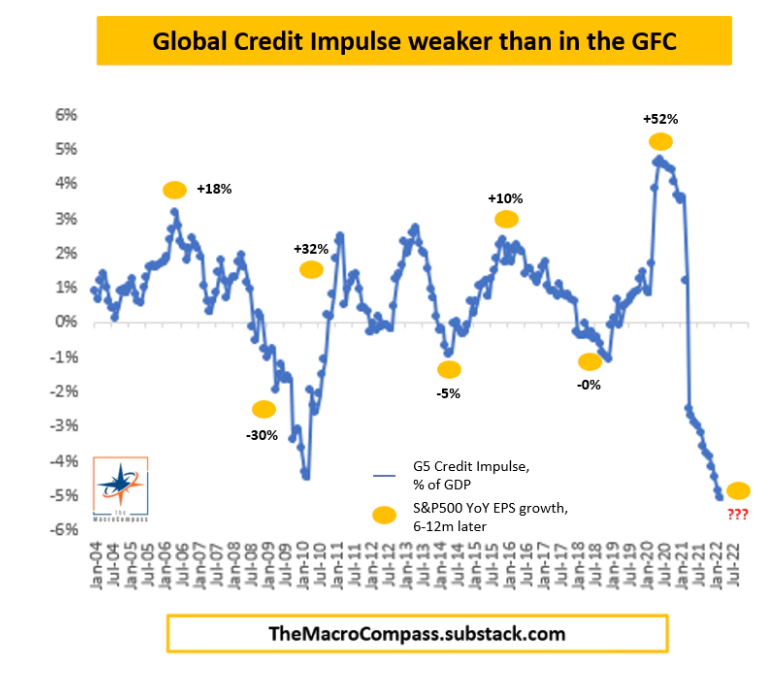
Graphic: Shared by Alfonso Peccatiello. “the pace of real-economy money printing (not bank reserves…) going on in the 5 largest economies in the world. It’s a good leading indicator for economic growth & the performance of several asset classes. It just printed below the GFC lows.”
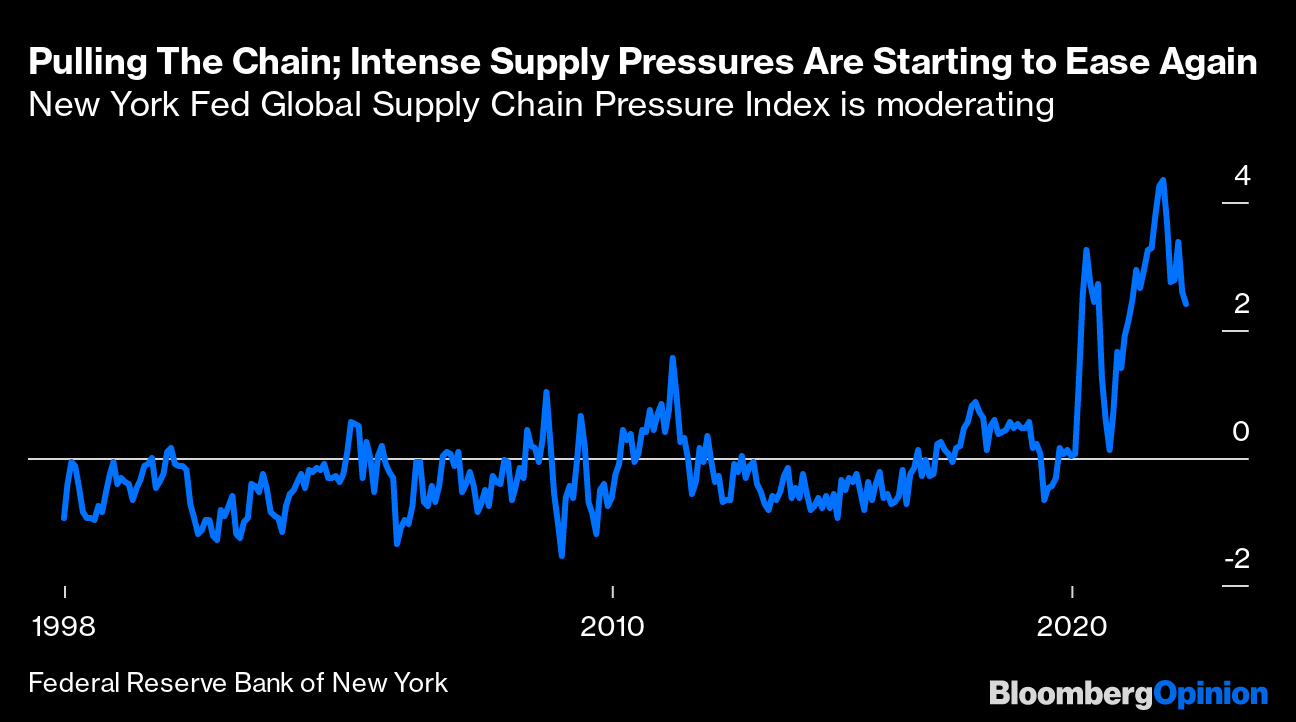
Moreover, as talked about yesterday, inflation may have peaked. Inventories are pointing to a looming supply gut.
Accordingly, the Federal Reserve (Fed), just as it was slow to end stimulus late last year and early this year, maybe slow in moderating its efforts to de-stimulate.
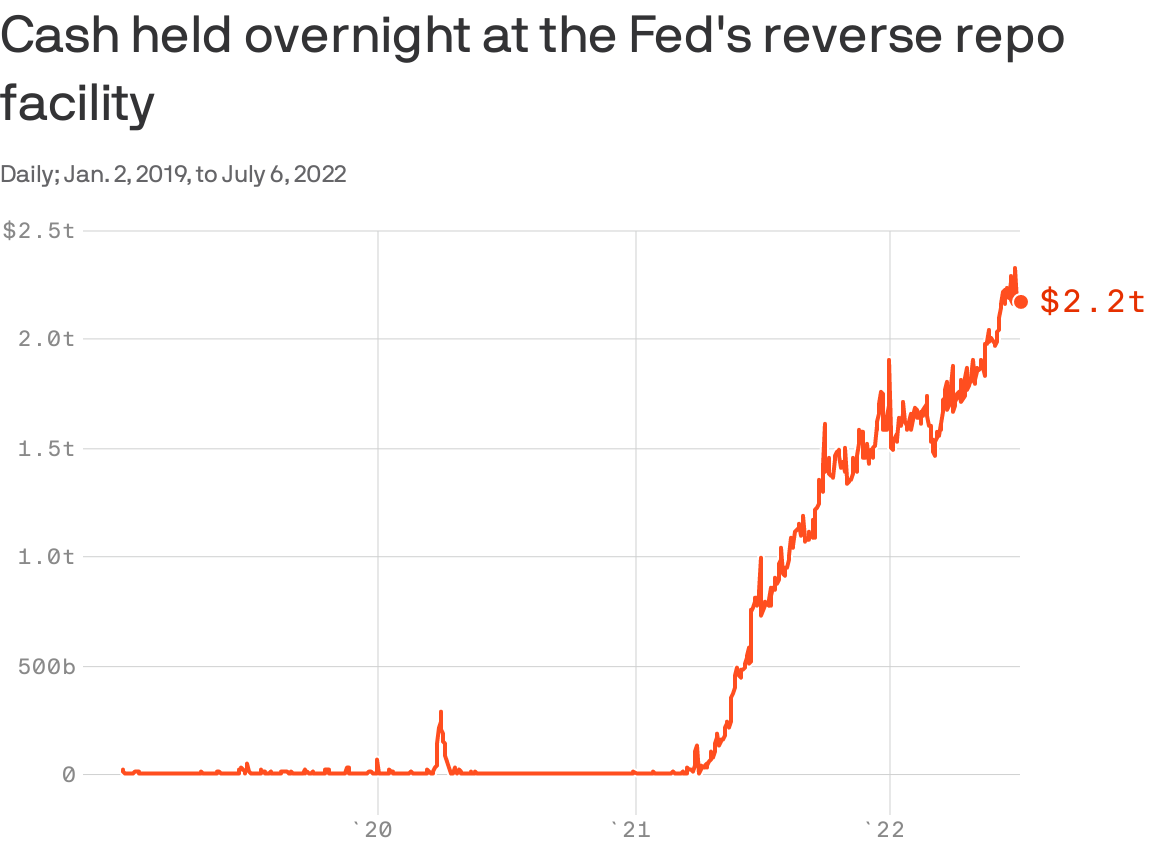
Graphic: Retrieved from Axios. “The glut of cash being parked at the Fed is reflective of policies that have already run their course, especially with quantitative tightening underway.” But, “it’s a representation of how much too far the Fed went in easing,” says Thomas Simon, an economist at Jefferies Financial Group (NYSE: JEF).
Minutes from the last Federal Open Market Committee (FOMC) meeting revealed a rate hike up to 75 basis points in July would be appropriate, per Moody’s Corporation (NYSE: MCO).
A strong jobs report would likely prompt the Fed “to raise rates even more aggressively as they pursue their goal to raise the unemployment rate,” explains Bryce Doty of Sit Fixed Income.
“As [the Fed] seek[s] to destroy demand, they are also destroying supply. As a result, inflation will persist longer and the economy will be even worse.”
This is pursuant to calls by the Credit Suisse Group AG’s (NYSE: CS) Zoltan Pozsar who put forth, earlier this year, that the “Fed is pursuing demand destruction through negative wealth effects,” as the “central banks can only deal with nominal [and] not real chokepoints.”
Graphic: Via JPMorgan Chase & Co (NYSE: JPM). Taken from The Market Ear. “A stronger dollar, lower equity prices, and higher mortgage rates will weigh on demand growth [and] Over time weaker output demand should lead to weaker labor demand Don’t fight the Fed as this is what Fed wants (slower growth).”
Ultimately, the “risk of recession, whether it is real or merely implied by an inversion of the yield curve, won’t deter the Fed from hiking rates higher faster or from injecting more volatility to build up negative wealth effects.”
“Rallies could beget more forceful pushback from the Fed – the new game.”
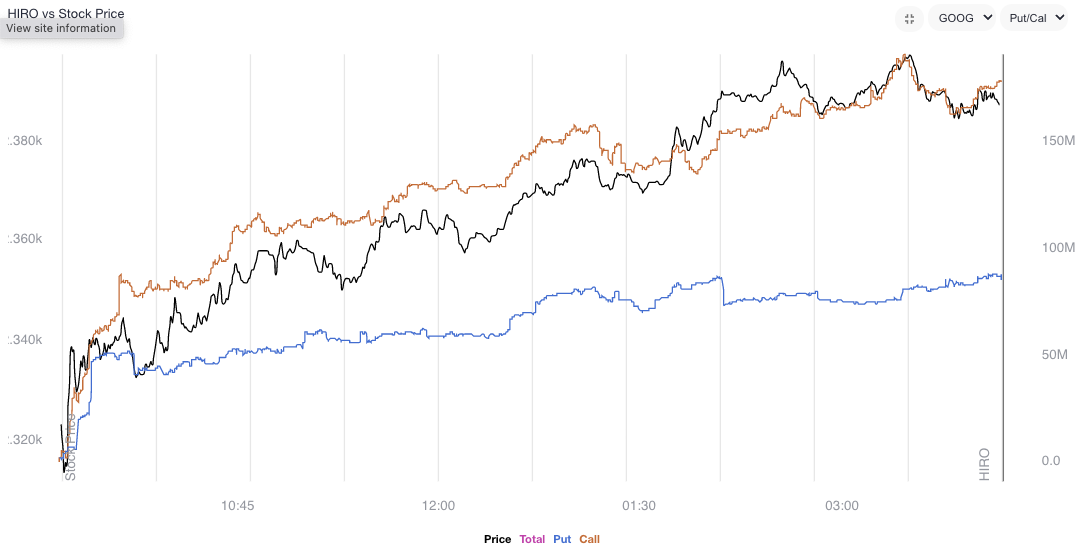
Data shows net gamma exposure increasing which may increasingly feed into smaller ranges and a positive drift amid shorter-dated volatility sales and a pick up in call demand, particularly in some of the larger index weights.
Graphic: Via SpotGamma’s Hedging Impact of Real-Time Options (HIRO) indicator for Alphabet Inc (NASDAQ: GOOG) (NASDAQ: GOOGL). Rising orange and blue lines point to call buying and put selling, both of which have bullish implications.
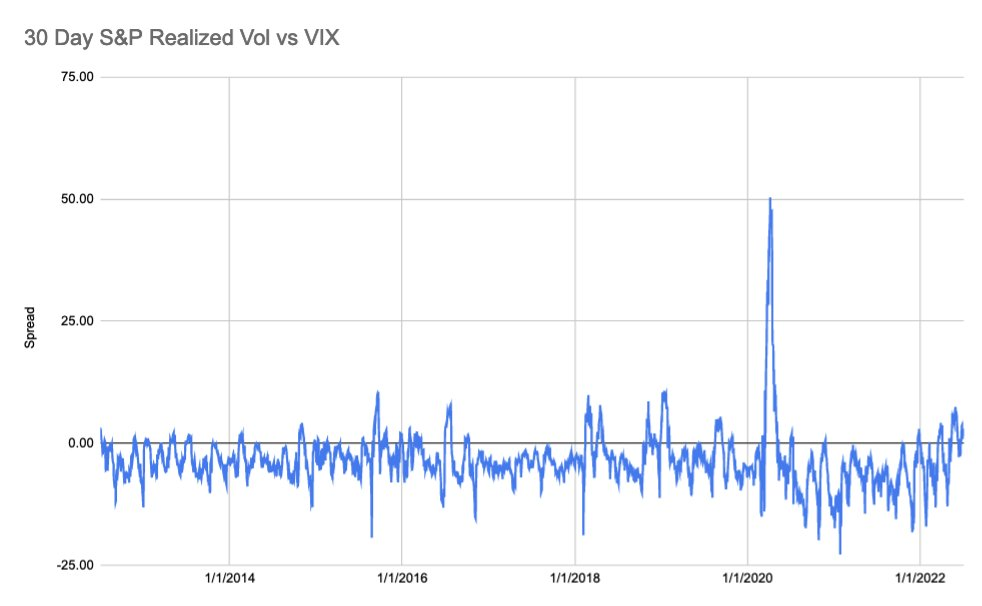
The creep in volatility realized (RVOL), versus that which is implied (IVOL), coupled with “a flattening in the downside fixed strike skew, while the upside wings [are] more smiley,” per JPMorgan Chase & Co (NYSE: JPM), makes it so we can put on more complex structures.
Graphic: Via S&P Global Inc (NYSE: SPGI). As explained by SpotGamma, “30-day realized SPX volatility is now trading above the VIX, something that generally shows after major selloffs wherein IV “premium” needs to reset to calmer/higher equity markets.”
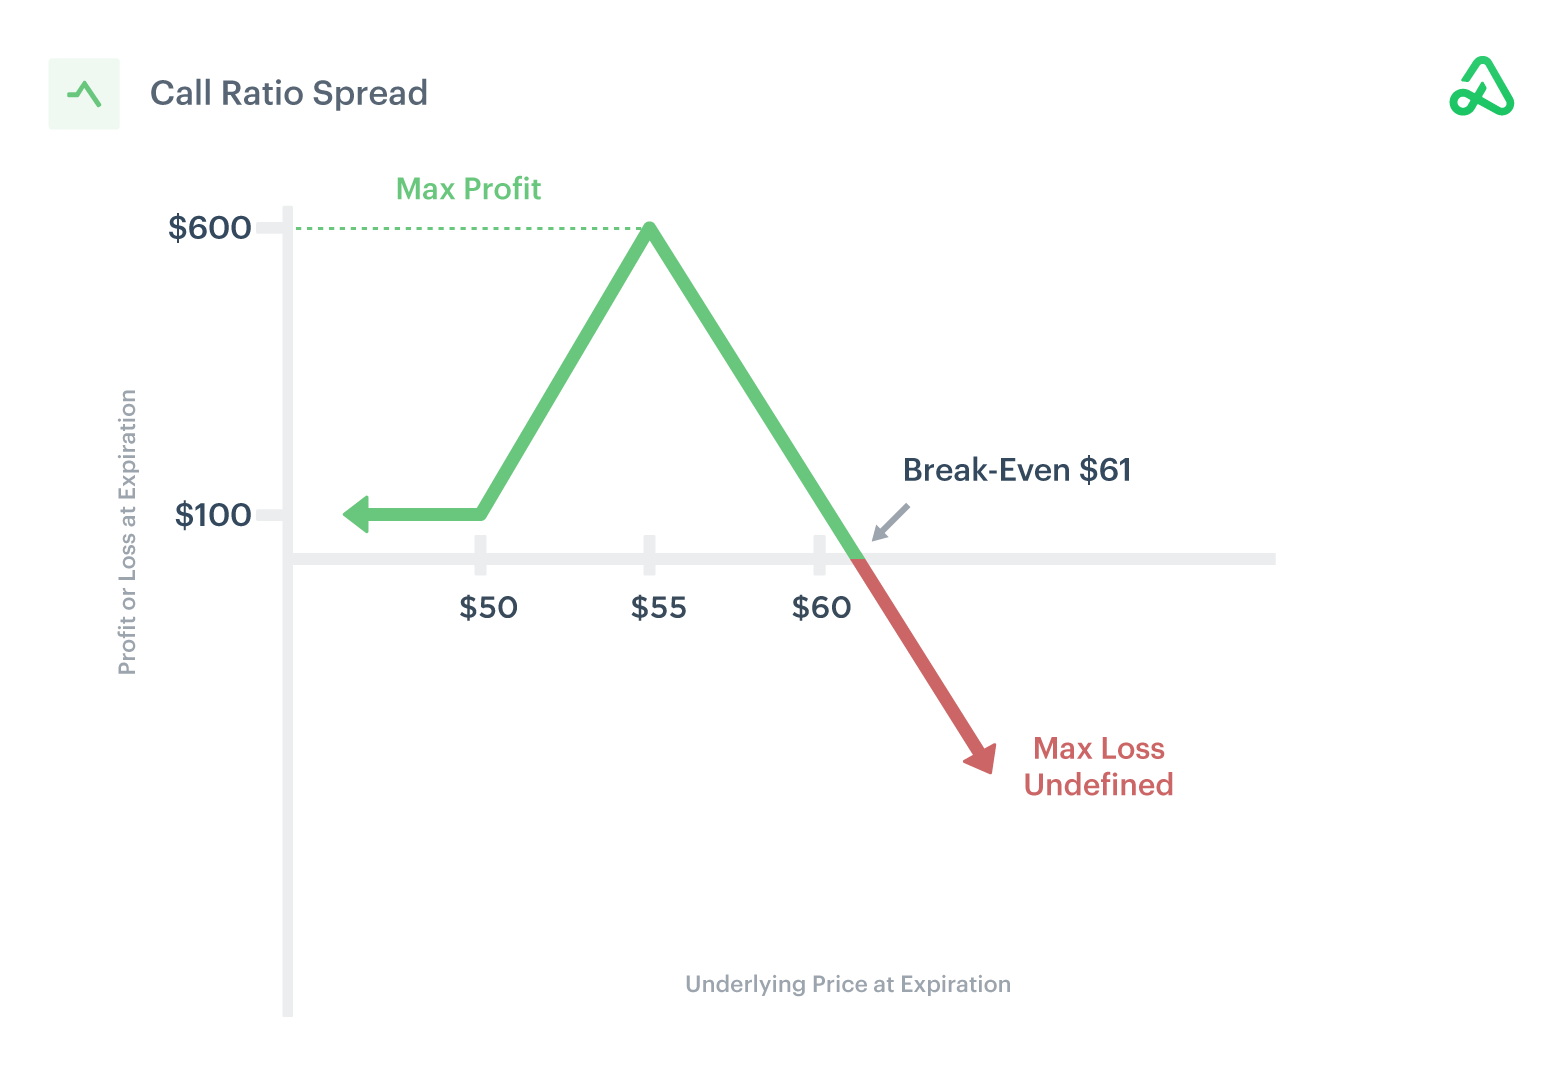
For instance, ratio spreads continue to work well for low- or no-cost exposure to the upside.
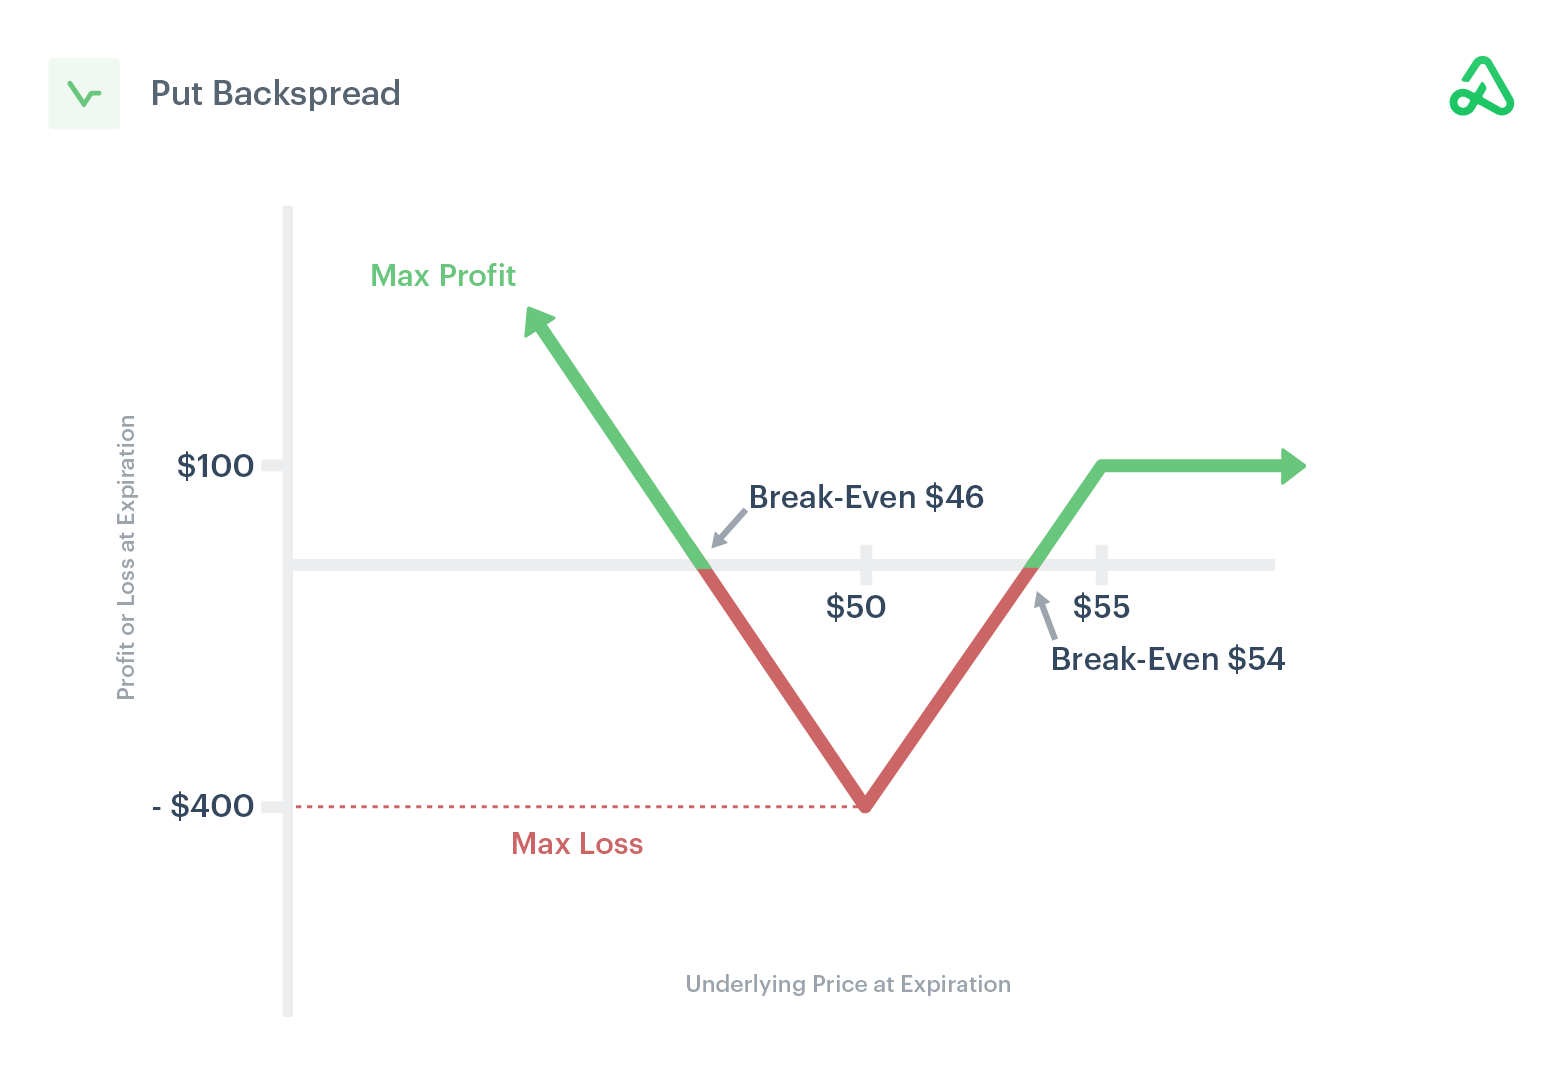
Likewise, if one thought volatility, though at a high starting point particularly at the money (ATM), was due for a repricing, they would look for exposure to the downside via something such as an inverse ratio (or backspread).
This is as the ATMs, unlike those further out of the money (OTM), are less convex in vega.
As of 6:30 AM ET, Friday’s regular session (9:30 AM – 4:00 PM ET), in the S&P 500, is likely to open in the upper part of a negatively skewed overnight inventory, inside of prior-range and -value, suggesting a limited potential for immediate directional opportunity.
In the best case, the S&P 500 trades higher.
Any activity above the $3,909.25 MCPOC puts into play the $3,943.25 HVNode. Initiative trade beyond the HVNode could reach as high as the $3,982.75 LVNode and $4,016.25 HVNode, or higher.
In the worst case, the S&P 500 trades lower.
Any activity below the $3,909.25 MCPOC puts into play the $3,867.25 LVNode. Initiative trade beyond the LVNode could reach as low as the $3,831.00 VPOC and $3,800.25 LVNode, or lower.
Click here to load today’s key levels into the web-based TradingView charting platform. Note that all levels are derived using the 65-minute timeframe. New links are produced, daily.
Graphic: 65-minute profile chart of the Micro E-mini S&P 500 Futures.
Considerations: Responsiveness near key-technical areas (that are discernable visually on a chart), suggests technically-driven traders with short time horizons are very active.
Such traders often lack the wherewithal to defend retests and, additionally, the type of trade may be indicative of the other time frame participants waiting for more information to initiate trades.
Definitions
Volume Areas: A structurally sound market will build on areas of high volume (HVNodes). Should the market trend for long periods of time, it will lack sound structure, identified as low volume areas (LVNodes). LVNodes denote directional conviction and ought to offer support on any test.
If participants were to auction and find acceptance into areas of prior low volume (LVNodes), then future discovery ought to be volatile and quick as participants look to HVNodes for favorable entry or exit.
POCs: POCs are valuable as they denote areas where two-sided trade was most prevalent in a prior day session. Participants will respond to future tests of value as they offer favorable entry and exit.
MCPOCs: POCs are valuable as they denote areas where two-sided trade was most prevalent over numerous day sessions. Participants will respond to future tests of value as they offer favorable entry and exit.
Volume-Weighted Average Prices (VWAPs): A metric highly regarded by chief investment officers, among other participants, for quality of trade. Additionally, liquidity algorithms are benchmarked and programmed to buy and sell around VWAPs.
About
After years of self-education, strategy development, mentorship, and trial-and-error, Renato Leonard Capelj began trading full-time and founded Physik Invest to detail his methods, research, and performance in the markets.
Capelj also develops insights around impactful options market dynamics at SpotGamma and is a Benzinga reporter.
In no way should the materials herein be construed as advice. Derivatives carry a substantial risk of loss. All content is for informational purposes only.