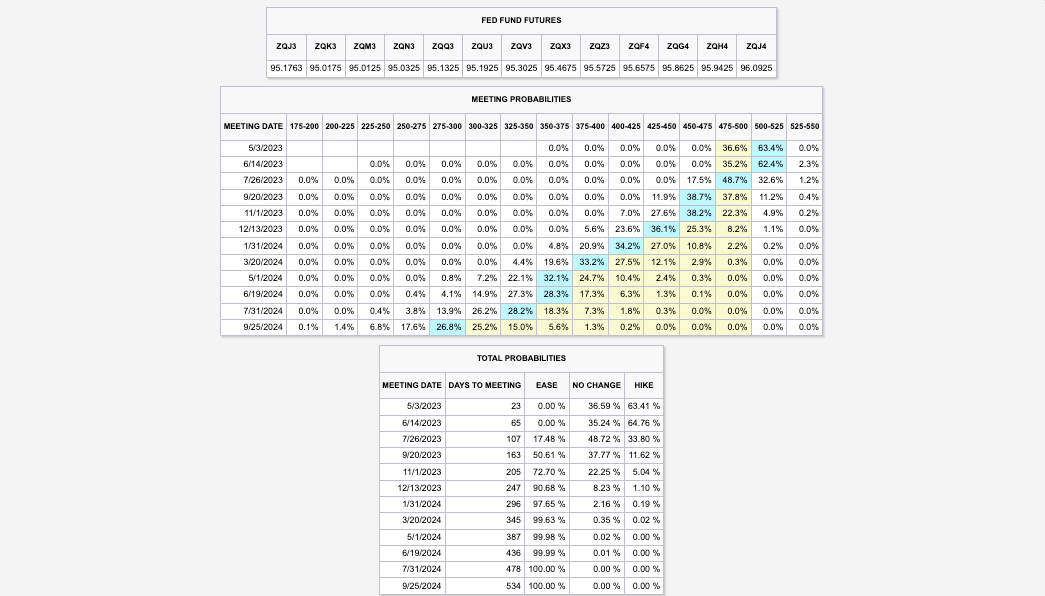
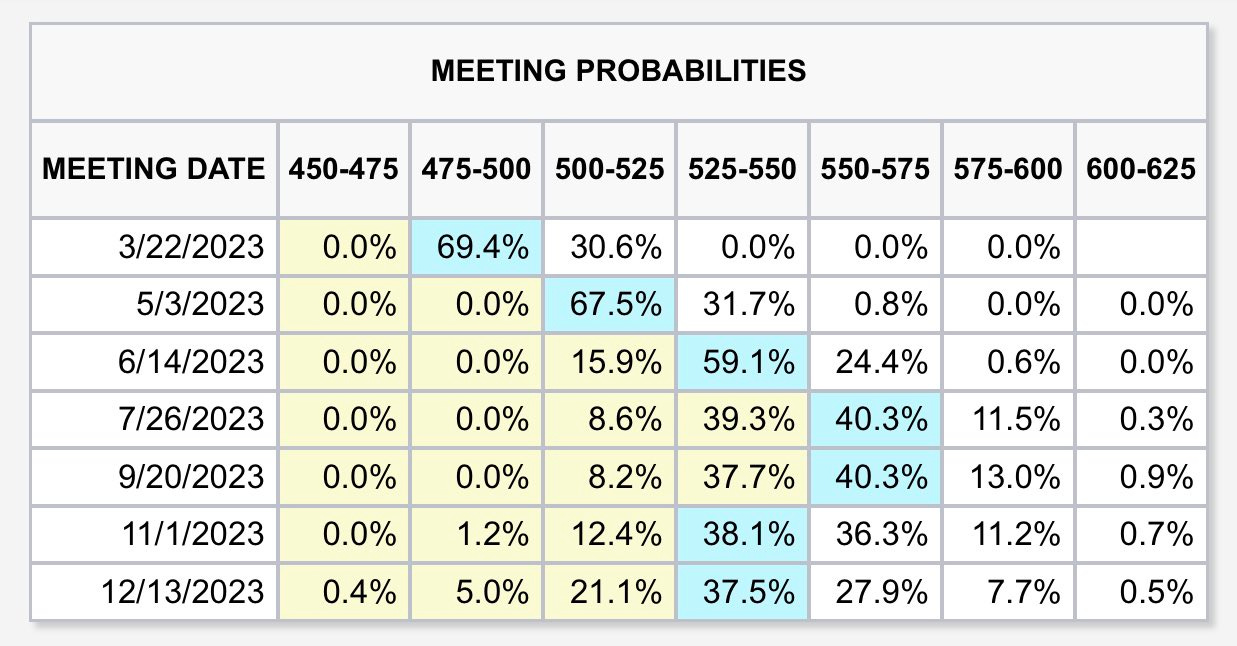
US payroll data has increased the possibility of a rate hike by the Federal Reserve or Fed in early May, leading to higher rates and affecting those who expected a pause or pivot through poorly performing yield curve steepener trades. The market expects the Fed to raise its target rate to 5.00-5.25% and keep it there through mid-year.
Graphic: Retrieved from CME Group Inc’s (NASDAQ: CME) FedWatch Tool.
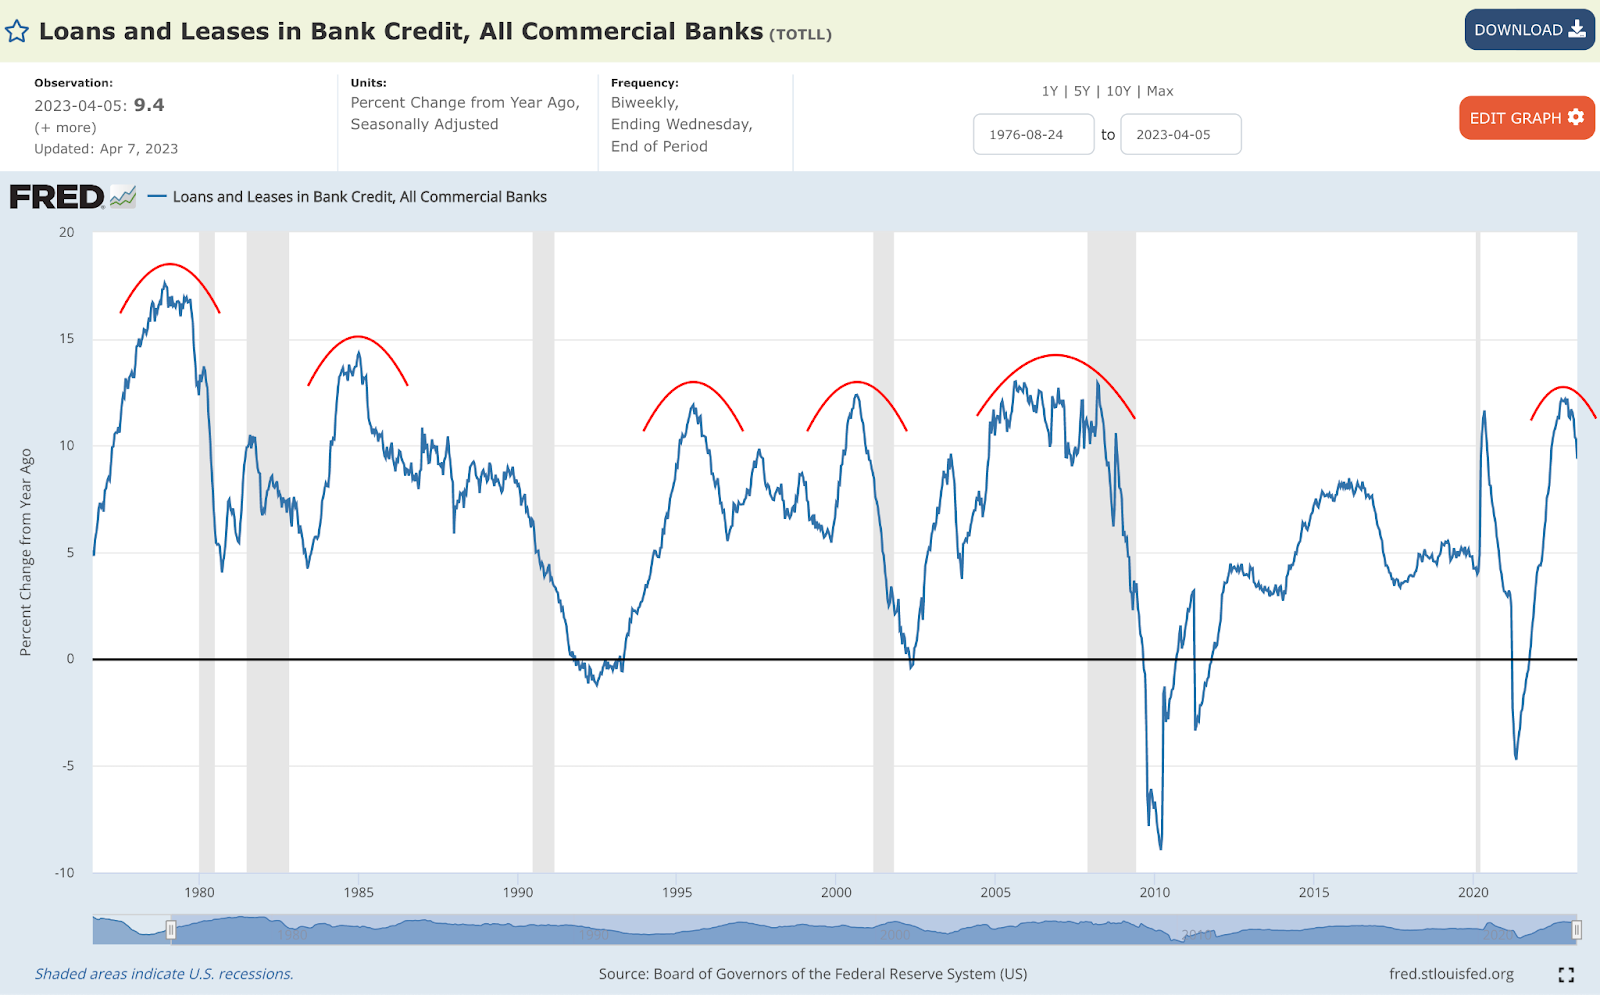
There is more to the pressure than just yields. Surveys indicate a drop in profits for sensitive areas of the equity market, such as technology and banks; as soon as the labor market starts softening, a credit crunch is expected to accelerate by some.
Graphic: Retrieved from the St. Louis Fed via Cubic Analytics.
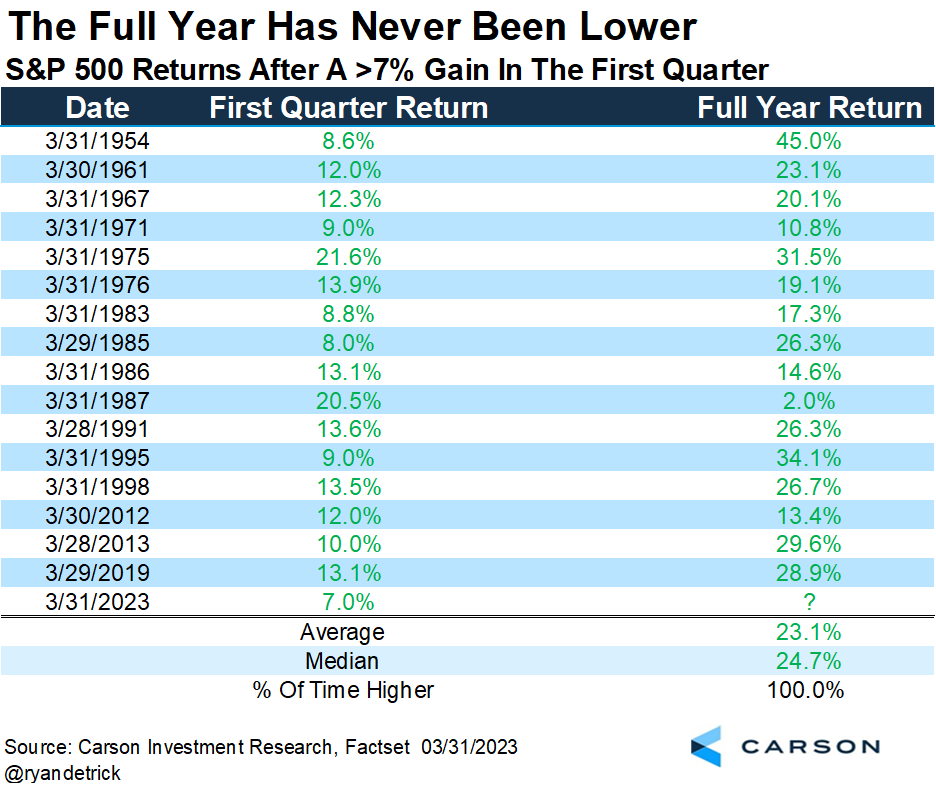
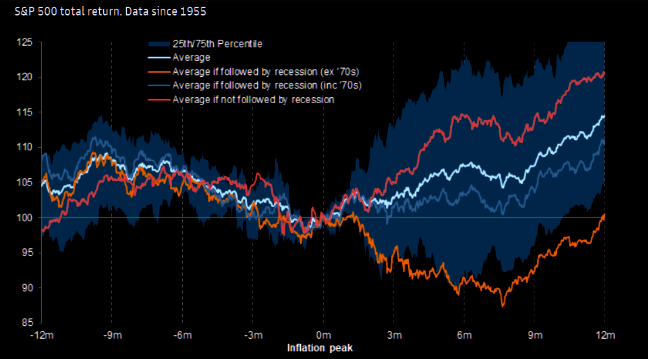
Despite the turbulence from earnings, data suggests the S&P 500 (INDEX: SPX) may perform well through year-end. Historically, the full-year return was always positive when the S&P 500 had a positive first quarter. However, there have been exceptions, says Callum Thomas, quoting data gathered by Ryan Detrick.
Graphic: Retrieved from Ryan Detrick via Callum Thomas’ Weekly S&P 500 ChartStorm.
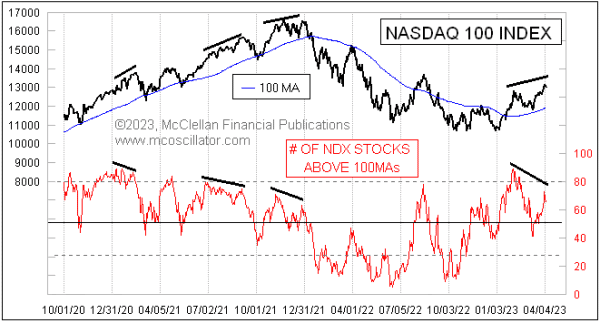
Peeking beneath the hood, only a few (primarily rate-sensitive) stocks have bolstered recent index strength; many components are not participating in the rally, which could be a harbinger of potential post-earnings weaknesses.
Graphic: Retrieved from McClellan Financial Publications.
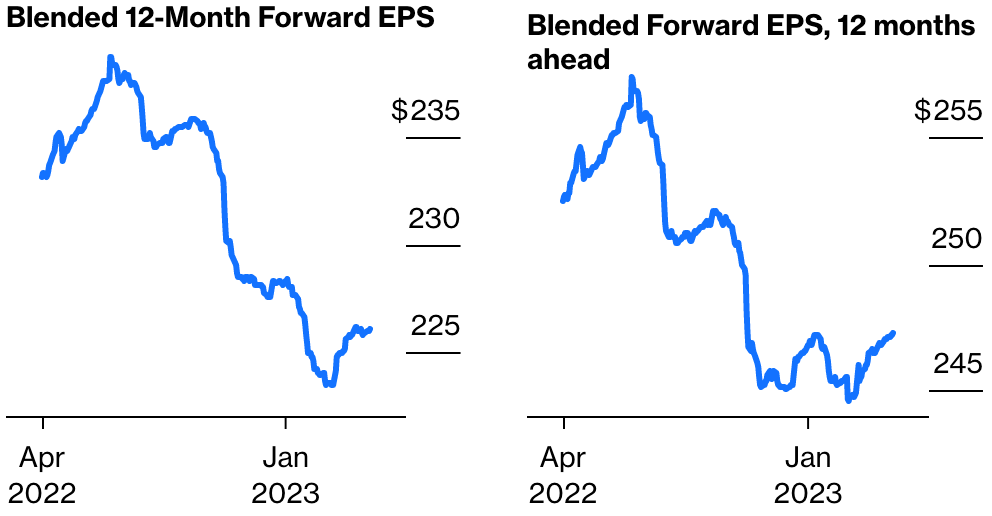
Notwithstanding, if rates continue to fall, so do borrowing costs; falling inflation cuts pressures on input cost; rising unemployment helps keep labor costs under control, Bloomberg reports. The forecasts (not surveys) actually show earnings holding up better than the narrative suggests.
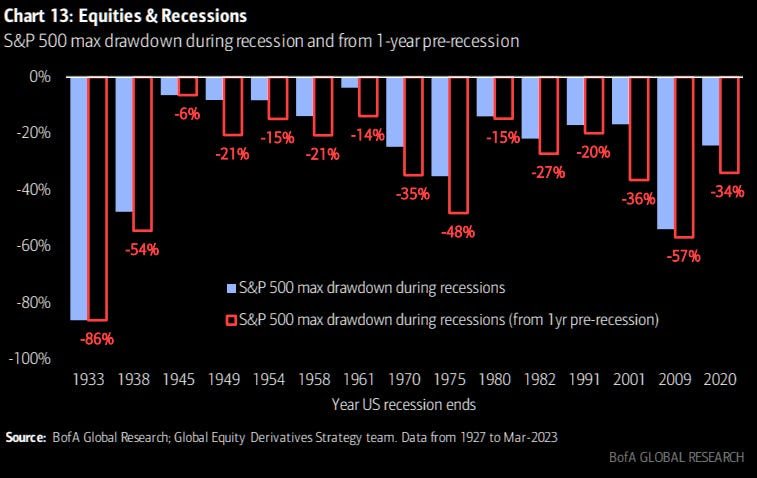
So what, then? In an annual report, JPMorgan Chase & Co (NYSE: JPM) concludes that if “we have higher inflation for longer, the Fed may be forced to increase rates higher than people expect despite the recent bank crisis.” Compounding the rate hikes is quantitative tightening or QT, the process of a central bank reducing the amount of money it has injected into an economy by selling bonds or other financial assets, which “may have ongoing impacts that might, over time, be another force, pushing longer-term rates higher than currently envisioned.” The net effect, though insights gleaned from the curve may be muddied due to the scale of recent interventions, is an “inverted yield curve [implying] we are going into a recession” and lower credit creation because, as Sergei Perfiliev well puts it, “if capital ends with the Fed, it is dead – it has left the economy and the banking system.”
Graphic: Retrieved from Bank of America Corporation (NYSE: BAC) via TheMarketEar.
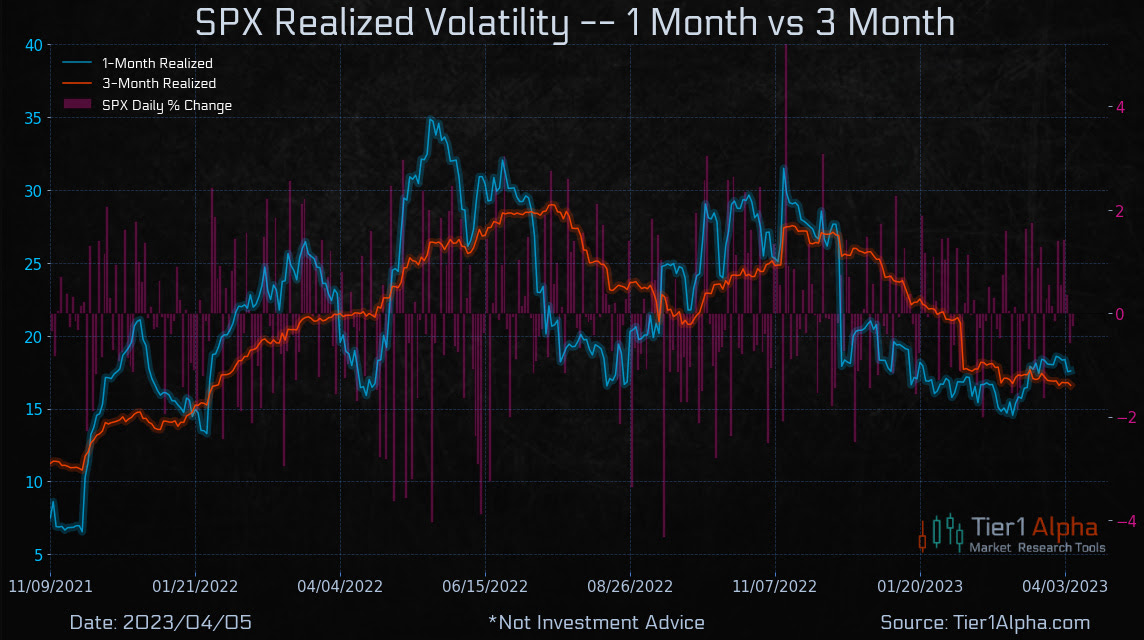
How do we position ourselves, given all these narratives? Equity volatility implied (IVOL) and realized (RVOL) decreased. This may continue to be a booster. In fact, “if markets remain within a +/-1.5% range, a drop in volatility could trigger significant buying activity from the vol-control space, with up to $14 billion in notional flows hitting the tape, creating a favorable environment for equities,” says Tier1Alpha.
So, positioning-wise, stocks could trade up into a “more combustible” state where “volatility is sticky into a rally,” as Kai Volatility’s Cem Karsan said would happen.
SpotGamma confirms that, based on current positioning, SPX IVOL is projected to move up as the underlying index moves up; there are likely many people chasing the rally with long calls, “creating a swelling of call skew.”
In this environment, very wide call ratio spread structures discussed in past letters may continue to do well. We can use the profits from those call structures to cut the cost of our bets on the equity market downside and lower interest rates.
Graphic: Retrieved from SpotGamma’s Weekend Note.
About
Welcome to the Daily Brief by Physik Invest, a soon-to-launch research, consulting, trading, and asset management solutions provider. Learn about our origin story here, and consider subscribing for daily updates on the critical contexts that could lend to future market movement.
Separately, please don’t use this free letter as advice; all content is for informational purposes, and derivatives carry a substantial risk of loss. At this time, Capelj and Physik Invest, non-professional advisors, will never solicit others for capital or collect fees and disbursements. Separately, you may view this letter’s content calendar at this link.
Physik Invest’s Daily Brief is a free newsletter sent to thousands of subscribers daily. Intrigued about what moves markets and how that can impact your financial wellness? Subscribe below.
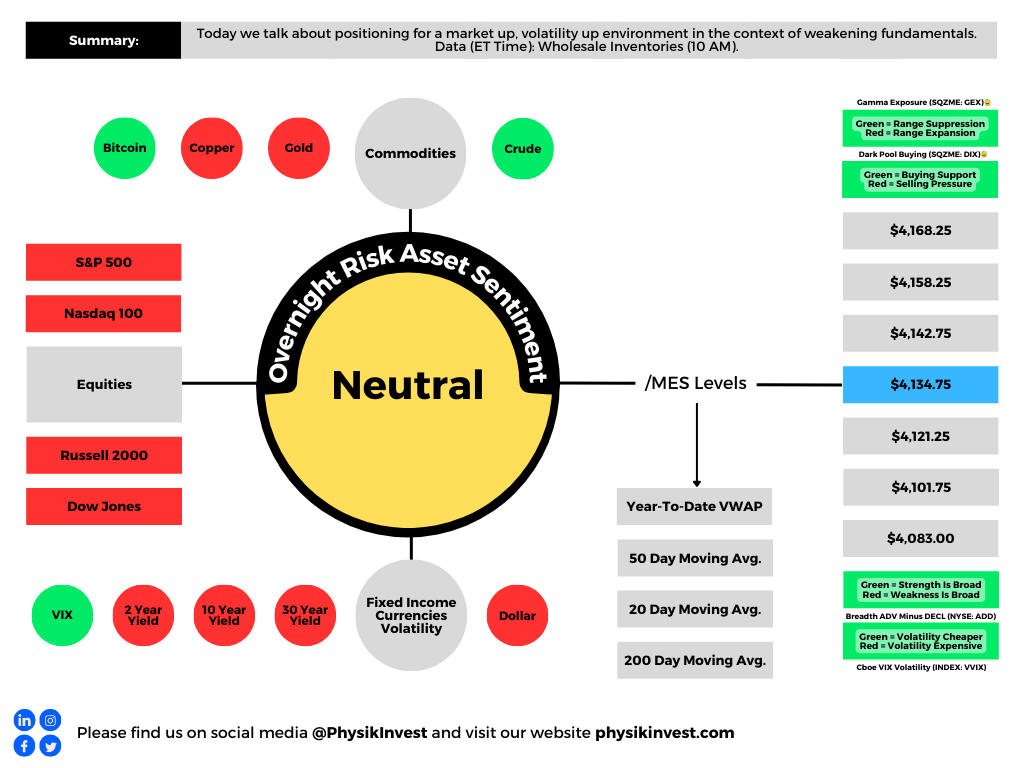
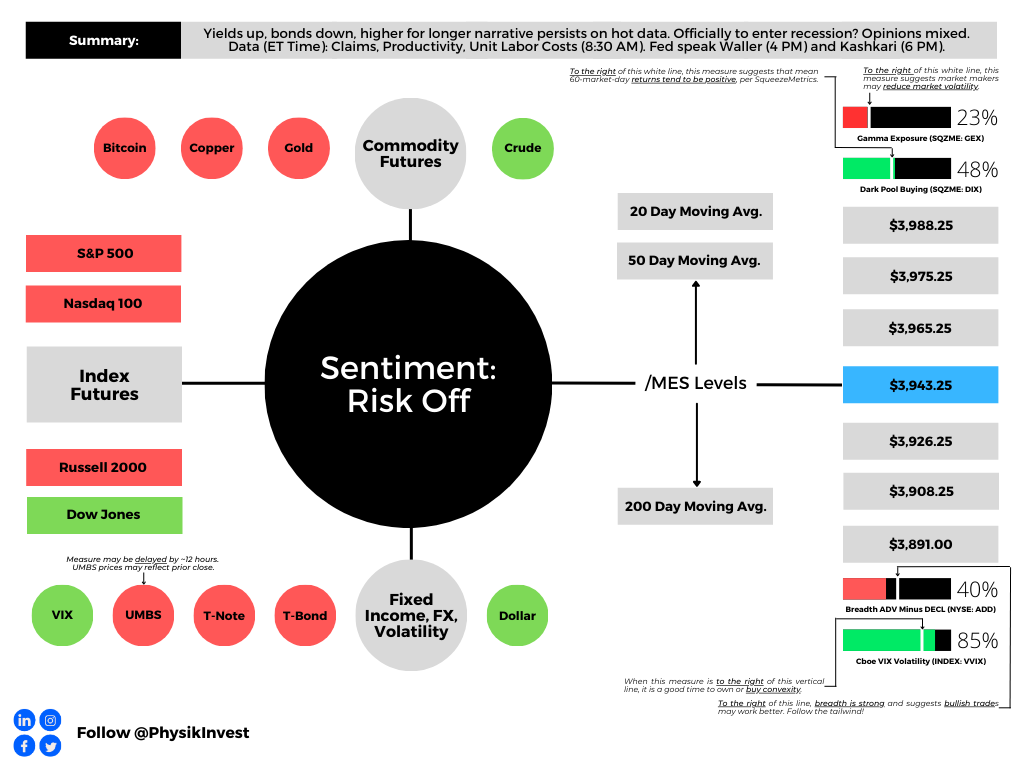
Graphic updated 7:00 AM ET. Sentiment Risk-On if expected /MES open is above the prior day’s range. Click here for the latest levels. /MES levels are derived from the profile graphic at the bottom of this letter. SqueezeMetrics Dark Pool Index (DIX) and Gamma (GEX) with the latter calculated based on where the prior day’s reading falls with respect to the MAX and MIN of all occurrences available. A higher DIX is bullish. The lower the GEX, the more (expected) volatility. Click to learn the implications of volatility, direction, and moneyness. Breadth reflects a reading of the prior day’s NYSE Advance/Decline indicator. The CBOE VIX Volatility Index (INDEX: VVIX) reflects the attractiveness of owning volatility. UMBS prices via MND. Click here for the economic calendar.
Administrative
The newsletter format needs to evolve a bit. Feedback is welcomed! If you are looking for the link to the daily chart, see the caption below the graphic above. Take care!
Positioning
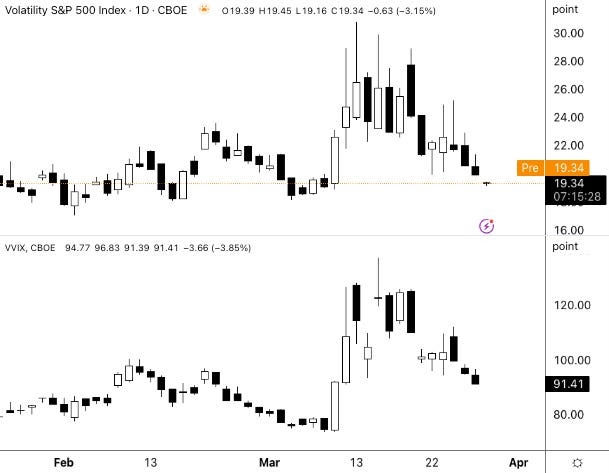
Fear of contagion prompted demands for protection. Measures of implied volatility or IVOL rose, and consequently, these demands for protection pressured markets.
Previously, this letter explained for protection to keep its value, there would have to be a shift higher in realized volatility or RVOL. Well, RVOL did not come back in a big way at the index level, as many expected.
Thus, the positive effects of the bank-related stimulation and traders’ pulling forward their timeline for easing were compounded by the unwinding of hedging strategies.
Graphic: Retrieved from Bloomberg via SpotGamma. “This drop in 5-day realized vol (orange) is pretty sharp, given it occurred from such a low relative level. ‘Can’t short it, don’t want to buy it.’ This vol decline comes as SPX put open interest was cleared with March OPEX, and big VIX call interest expired last week.”
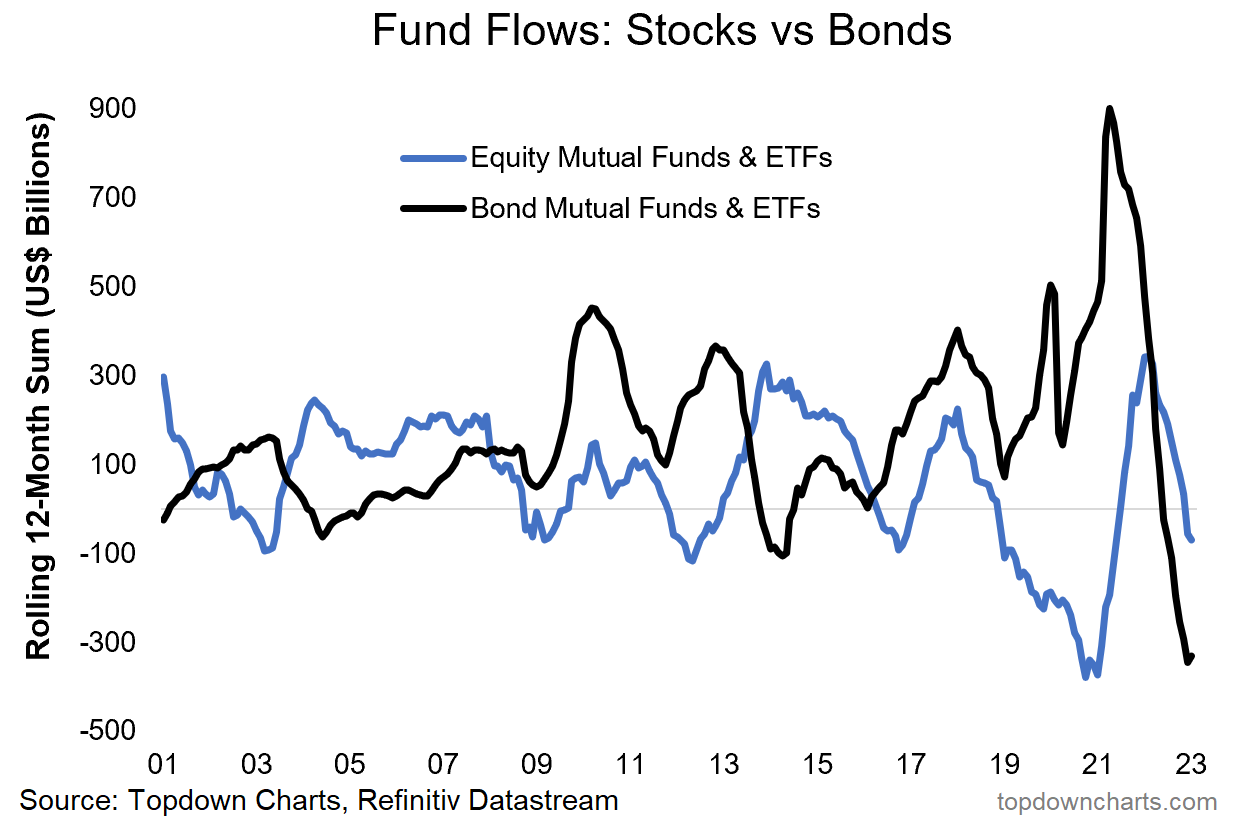
Previously depressed products like the Nasdaq 100 or NDX, which are generally very sensitive to monetary tightening, have performed well.
Graphic: Retrieved from Callum Thomas’ Topdown Charts.
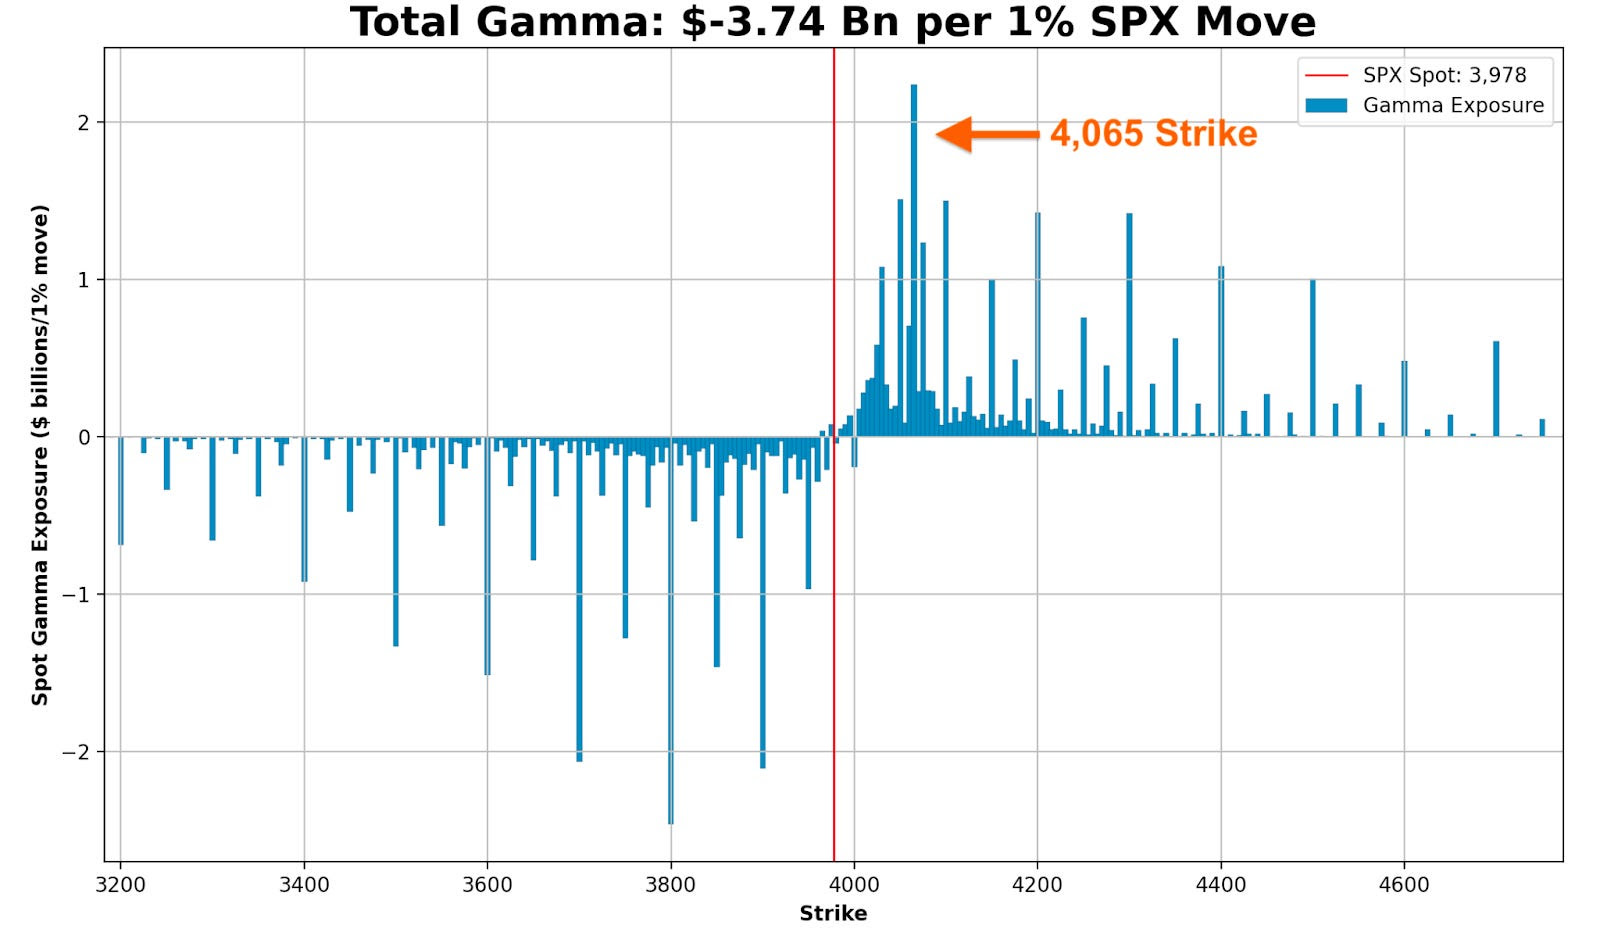
As we near month-end, there is a quarterly derivatives expiry. Above current S&P 500 or SPX levels is a significant concentration of soon-to-roll-off open interest held short by investors. This means the counterparties are dynamically hedging a call they own; they’re selling strength and buying weakness, albeit in a less and less meaningful way, as those options near this expiration and their probability of paying out (i.e., delta or exposure to direction) falls.
Some would allege that volatility compression and time decay would have solicited a more meaningful response from options counterparties at those strike prices above; the absence of downside follow-through had traders supplying previously demanded downside put protection and catalyzing a rally. However, there are not many things for the market to rally on, and so much time has passed that the charm effects (i.e., the impact of time passing on an options delta) have lessened dramatically, some explain.
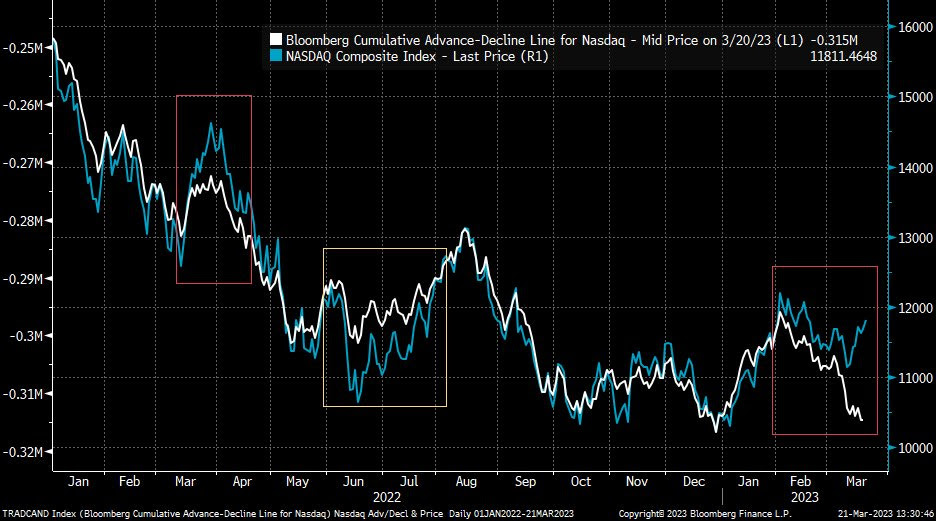
Graphic: Retrieved from Bloomberg via Liz Young. “The Nasdaq’s Cumulative Advance-Decline line has parted ways with index direction in recent days. In other words, the index has rallied despite weak breadth (more stocks falling than rising), the two lines are likely to find their way back together somehow…”
Therefore, it’s probably likely that the market remains contained through month-end. After, movement may increase. This letter acknowledged RVOL might come back in a big way, particularly with the bank intervention doing more to thwart credit creation.
The caveat is that markets can trade spiritedly for far longer. There is a potential for the markets to move into a far “more combustible” position. With call skews far up meaningfully steep, still-present low- and zero-cost call structures this letter has talked about in the past remain attractive.
Graphic: Retrieved from Charles Schwab Corporation-owned (NYSE: SCHW) thinkorswim.
If the market falls apart, your costs are low, and losses are minimal. If markets move higher into that “more combustible” position, wherein “volatility is sticky into a rally,” you may monetize your call structures and roll some of those profits into bear put spreads (i.e., buy put and sell another at a lower strike).
The signs of a “more combustible situation” would likely show when “volatility is sticky into a rally,” explains Kai Volatility’s Cem Karsan. To gauge combustibility, look to the options market.
Remember, calls trade at a lower IVOL than puts. As the market trades higher, it slides to a lower IVOL, reflected by broad IVOL measures. If broad IVOL measures are sticky/bid, “that’s an easy way to say that fixed-strike volatility is coming up and, if that can happen for days, that can unpin volatility and create a situation where dealers themselves are no longer [own] a ton of volatility; they start thinning out on volatility themselves, and that creates a more combustible situation.”
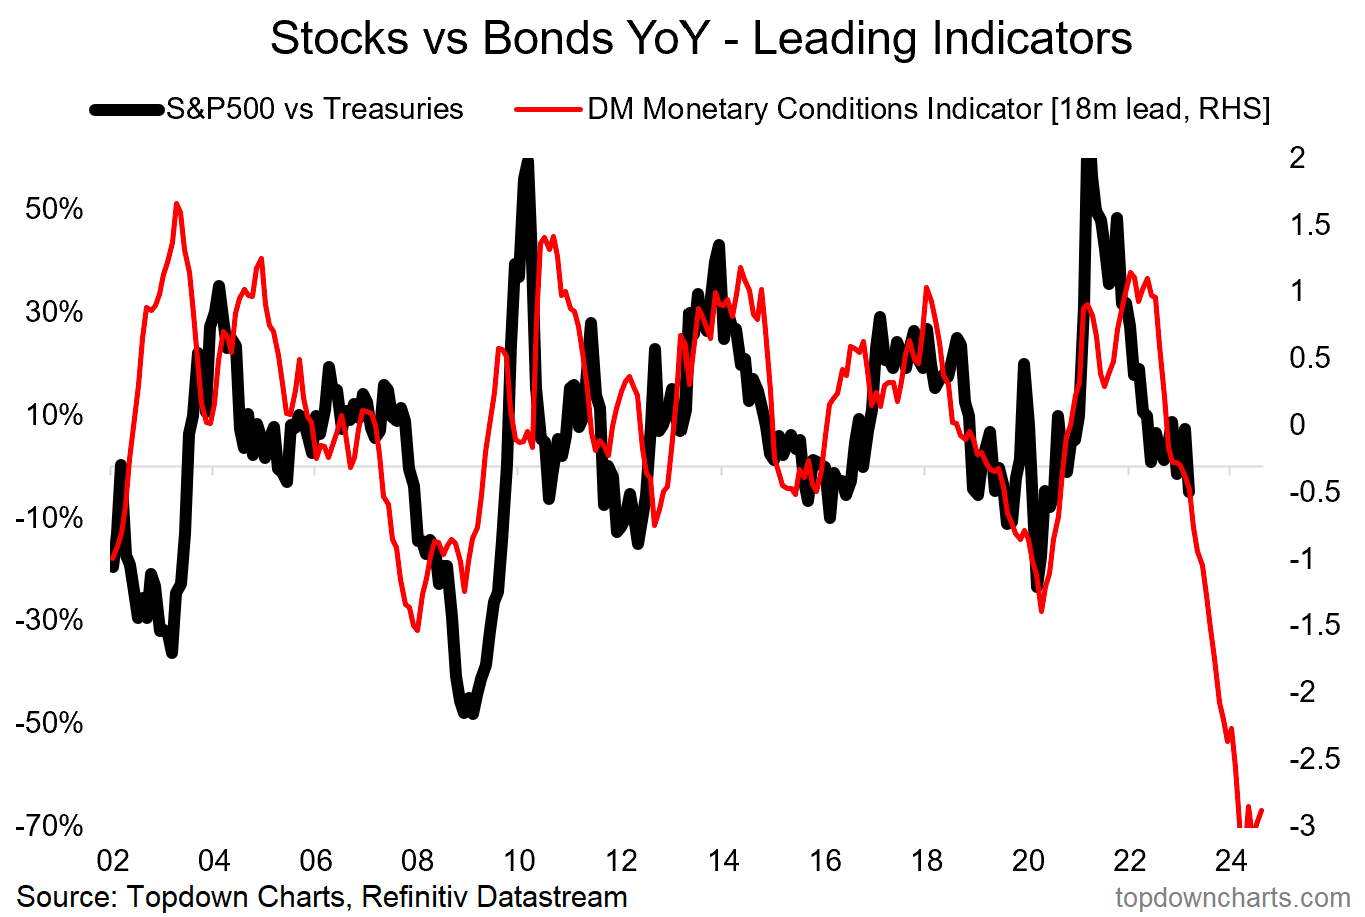
To explain the “thinning out” part of the last paragraph, recall participants often opt to own equity and downside (put) protection financed, in part, with sales of upside (call) protection. More demand for calls will result in counterparties taking on more exposure against movement (i.e., negative gamma) hedged via purchases of the underlying. Once that exposure expires and/or decays, that dealer-based support will be withdrawn. If the assumption is that equity markets are expensive now, then, after another rally, there may be more room to fall, all else equal (a simplistic way to look at this), hence the increased precariousness and combustibility.
Graphic: Retrieved from Callum Thomas’ Topdown charts.
About
The author, Renato Leonard Capelj, spends the bulk of his time at Physik Invest, an entity through which he invests and publishes free daily analyses to thousands of subscribers. The analyses offer him and his subscribers a way to stay on the right side of the market.
You may view this letter’s content calendar at this link.
Disclaimer
Do not construe this newsletter as advice; all content is for informational purposes. Capelj and Physik Invest are non-professional advisors managing their own capital. They will never openly solicit others for capital or manage others’ capital to collect fees and disbursements.
Physik Invest’s Daily Brief is read free by thousands of subscribers. Join this community to learn about the fundamental and technical drivers of markets.
Graphic updated 6:15 AM ET. Sentiment Risk-Off if expected /MES open is below the prior day’s range. /MES levels are derived from the profile graphic at the bottom of this letter. Click here for the latest levels. SqueezeMetrics Dark Pool Index (DIX) and Gamma (GEX) with the latter calculated based on where the prior day’s reading falls with respect to the MAX and MIN of all occurrences available. A higher DIX is bullish. The lower the GEX, the more (expected) volatility. Click to learn the implications of volatility, direction, and moneyness. Breadth reflects a reading of the prior day’s NYSE Advance/Decline indicator. The CBOE VIX Volatility Index (INDEX: VVIX) reflects the attractiveness of owning volatility. UMBS prices via MND. Click here for the economic calendar.
Fundamental
A tight monetary environment resulted in a hesitation to take risks. With inflation high, in the face of exogenous events (e.g., geopolitics disrupting deflationary influences) and beyond, assets were sold.
With inflation still hot and the economy on solid footing (i.e., “stronger growth for longer” per Unlimited’s Bruce McNevin), traders price even “tighter monetary policy and a harder eventual landing to ease inflation pressure.” This is not good for assets.
In fact, for a moment yesterday, traders put the terminal rate at 5.50-5.75%, up from 5.25-5.50% prior to the market opening.
Graphic: Retrieved from CME Group Inc’s (NASDAQ: CME) via The Kobeissi Letter on March 1, 2023, at 10:55 AM.
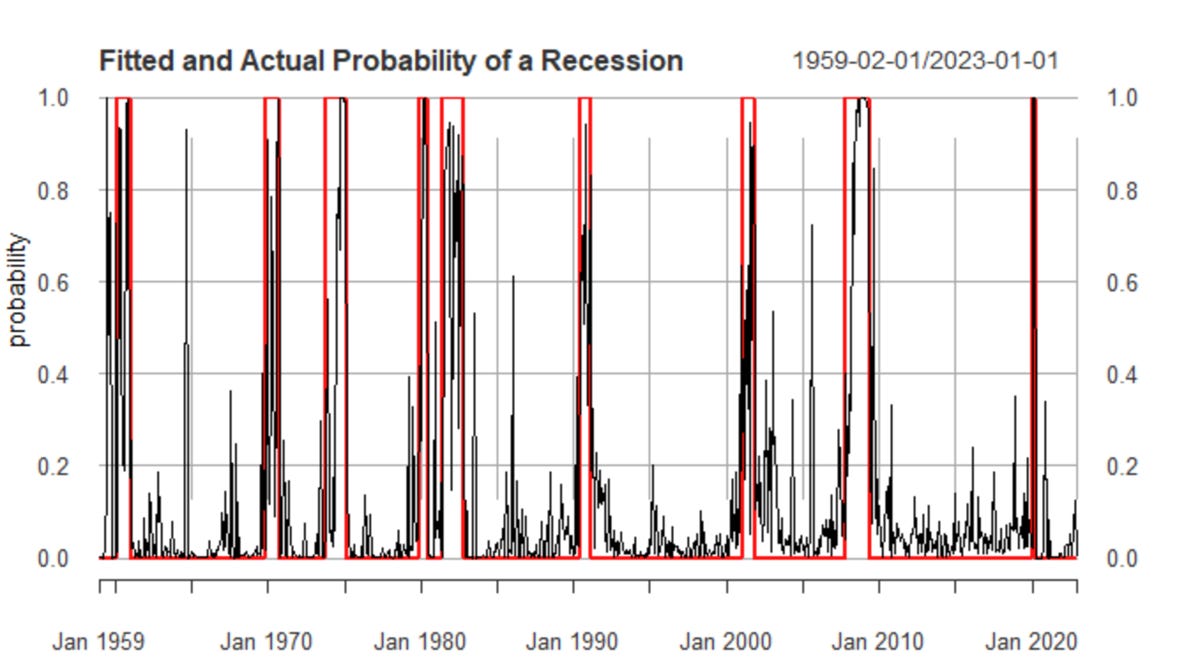
For the Federal Reserve (Fed) to hit its inflation target, likely in the range of 2-4% per Oaktree Capital Management’s Howard Marks said the real Fed Funds rate has to be positive. This effort puts the economy at risk of recession, said the Federal Reserve’s Neel Kashkari.
“Typically when the Fed raises rates to cool down inflation, it leads to a recession,” Kashkari explained, adding that “getting inflation down is job number one.”
Per Unlimited’s McNevin, the probability the economy is in a recession is lower than it was at the end of last year. For probabilities to change, there would have to be a large increase in unemployment. For instance, if the unemployment rate rises by about 1%, recession odds go up by 29%. If non-farm payroll employment falls by about 2% or 3 million jobs, recession odds jump by 74%.
Per last month’s remarks by Kai Volatility’s Cem Karsan, quoted in Physik Invest’s Daily Brief for February 17, 2023, if the market was to not breakdown sharply after February monthly options expiration (OpEx), as we see today, then options decay could build a platform for a FOMO-driven call buying rally that ends in a blow-off.
Consequently, trades this letter put forth last month (e.g., call verticals sold to finance put verticals expiring months from now) would suffer greatly.
“We’ve had an intraday range of 33.5 [points] thus far. That’s not vol[atility] expansion, which is what I’d want to see if I was short,” volatility trader Darrin John put well. “If the market doesn’t do what you think it should, in a reasonable amount of time, then it’s best to [exit].”
At the same time, with portfolio constructions like 60/40 not as attractive in this macroeconomic environment (i.e., asset headwind from monetary tightening, as well as slowing growth and inflation headwind to bonds and commodities), traders can look to Physik Invest’s Daily Brief for February 28, 2023, for ideas on how to navigate. In that letter, we talked about how traders can participate in the upside by about the same amount they would with a traditional construction (e.g., 60/40) while eliminating their downside risk exposure.
For instance, one can buy enough bonds/box spreads so that, at their maturity, the principal is returned. The cash remaining can be invested in leverage potential.
Ending with a supporting quote from Oaktree’s Howard Marks: “Investors can now potentially get solid returns from credit instruments, meaning they no longer have to rely as heavily on riskier investments to achieve their overall return targets.”
Technical
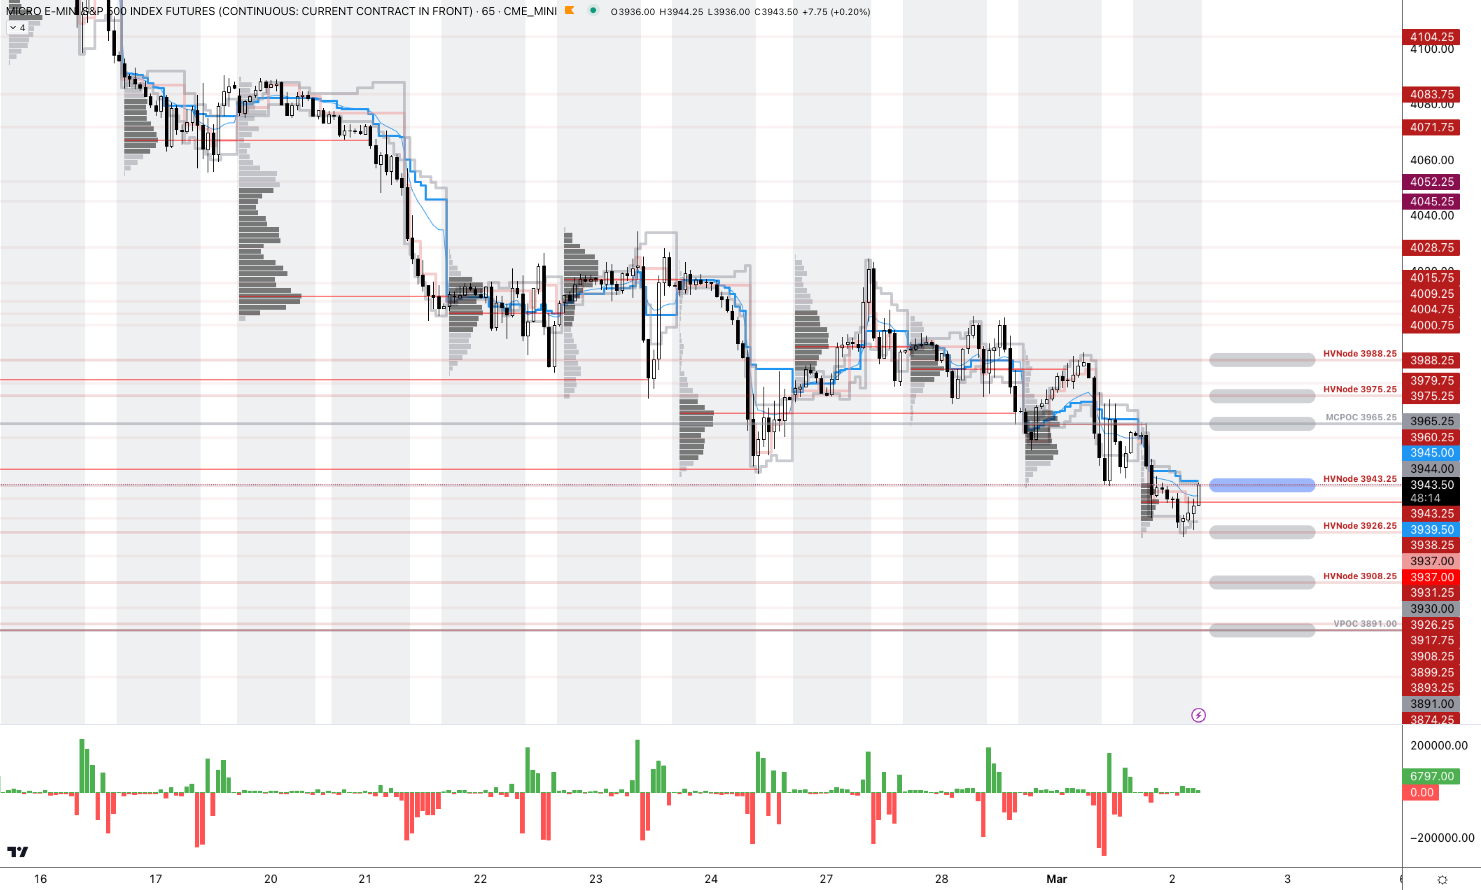
As of 6:00 AM ET, Thursday’s regular session (9:30 AM – 4:00 PM ET), in the S&P 500, is likely to open in the middle part of a negatively skewed overnight inventory, outside of the prior day’s range, suggesting a potential for immediate directional opportunity.
The S&P 500 pivot for today is $3,943.25.
Key levels to the upside include $3,965.25, $3,975.25, and $3,988.25.
Key levels to the downside include $3,926.25, $3,908.25, and $3,891.00.
Disclaimer: Click here to load the updated key levels via the web-based TradingView platform. New links are produced daily. Quoted levels likely hold barring an exogenous development.
Graphic: 65-minute profile chart of the Micro E-mini S&P 500 Futures.
Definitions
Volume Areas: Markets will build on areas of high-volume (HVNodes). Should the market trend for a period of time, this will be identified by a low-volume area (LVNodes). The LVNodes denote directional conviction and ought to offer support on any test.
If participants auction and find acceptance in an area of a prior LVNode, then future discovery ought to be volatile and quick as participants look to the nearest HVNodes for more favorable entry or exit.
MCPOCs: Denote areas where two-sided trade was most prevalent over numerous sessions. Participants will respond to future tests of value as they offer favorable entry and exit.
POCs: Areas where two-sided trade was most prevalent in a prior day session. Participants will respond to future tests of value as they offer favorable entry and exit.
Options Expiration (OPEX): Reduction in dealer Gamma exposure. There is usually an increase in volatility after the removal of large options positions and associated hedging.
About
The author, Renato Leonard Capelj, spends the bulk of his time at Physik Invest, an entity through which he invests and publishes free daily analyses to thousands of subscribers. The analyses offer him and his subscribers a way to stay on the right side of the market.
You may view this letter’s content calendar at this link.
Disclaimer
Do not construe this newsletter as advice. All content is for informational purposes. Capelj and Physik Invest manage their own capital and will not solicit others for it.
The daily brief is a free glimpse into the prevailing fundamental and technical drivers of U.S. equity market products. Join the 800+ that read this report daily, below!
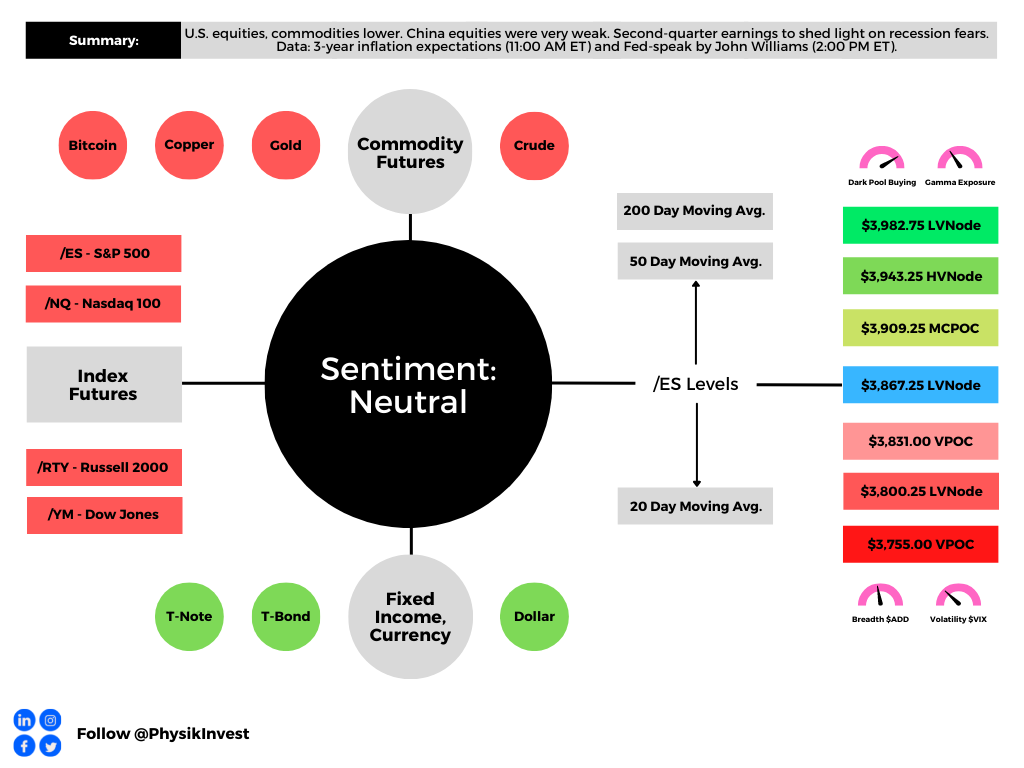
Graphic updated 7:30 AM ET. Sentiment Neutral if expected /ES open is inside of the prior day’s range. /ES levels are derived from the profile graphic at the bottom of the following section. Levels may have changed since initially quoted; click here for the latest levels. SqueezeMetrics Dark Pool Index (DIX) and Gamma (GEX) calculations are based on where the prior day’s reading falls with respect to the MAX and MIN of all occurrences available. A higher DIX is bullish. At the same time, the lower the GEX, the more (expected) volatility. Learn the implications of volatility, direction, and moneyness. Breadth reflects a reading of the prior day’s NYSE Advance/Decline indicator. VIX reflects a current reading of the CBOE Volatility Index (INDEX: VIX) from 0-100.
Fundamental
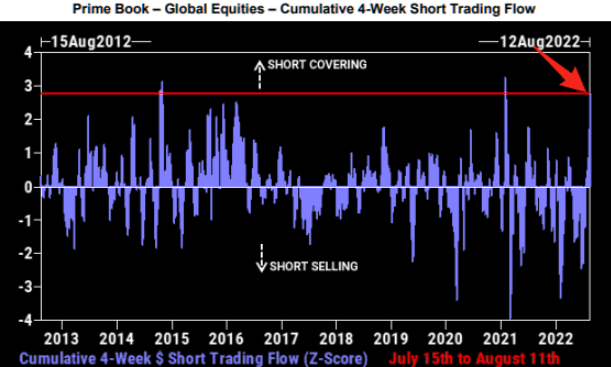
According to Goldman Sachs Group Inc (NYSE: GS) Prime Services, this is the third largest short-covering rally in three years.
Graphic: Retrieved from The Market Ear. Via Goldman Sachs Group Inc.
The rally, as discussed in past commentaries, is, in part, the result of “volatility-target funds” and “trend-following funds” getting back into the market as volatility falls, sentiment and data on jobs improve, as well as cooler-than-expected inflation figures.
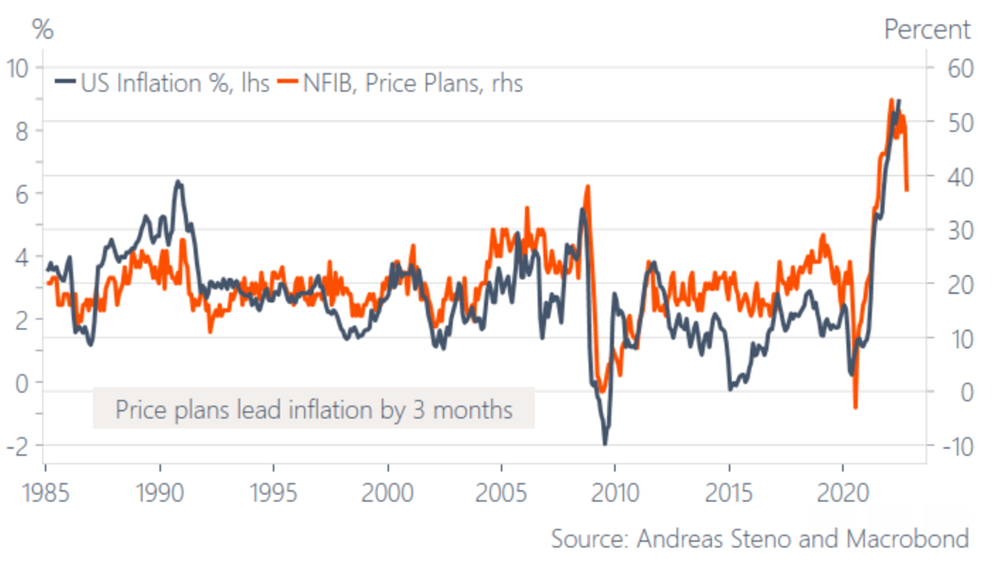
Graphic: Retrieved from Stenos Signals. “Unless SMEs are lying, inflation has peaked for now … Will it change the market psychology?”
“The machines seem hell-bent on pushing the financial conditions easing trade,” said Dennis DeBusschere, the founder of 22V Research.
“Machines are eating the words from the Fed speakers for breakfast.”
Graphic: Retrieved from Bloomberg. “The issue is the giant pool of systematic funds that moves in and out of the market based on how turbulent prices are. With peace at hand of late amid a four-week rally, so-called volatility-target funds and similar strategies such as risk parity are buying between $2 billion to $4 billion of stocks per day, according to an estimate by JPMorgan Chase & Co.’s Kate Gandolfo.”
Notwithstanding, JPMorgan Chase & Co (NYSE: JPM) estimates overall CTA exposures remain subdued. To incite ultra-impactful “buy signals” the S&P 500 would have to rise to $4,400.00.
This “would prompt CTAs to step up buying” and, potentially, turn “‘max long’ on stocks, buying probably $100 billion to $200 billion across various trend-following strategies.”
Though the S&P 500 has yet to retake the $4,400.00 level, likely to remain as support until the end of the week, at least, are options hedging flows, which we talked about last week.
“That can last perhaps another 100 days if volatility stays low,” JPM’s Kate Gandolfo suggested.
For context, at least at the index level, customers are short call, long put against their equity. In a rising market, the call side solicits increased hedging on the part of counterparties.
If counterparties are long the call, and the market is rising (falling), they must sell (buy) underlying to re-hedge. This can further contain realized volatility and support the market.
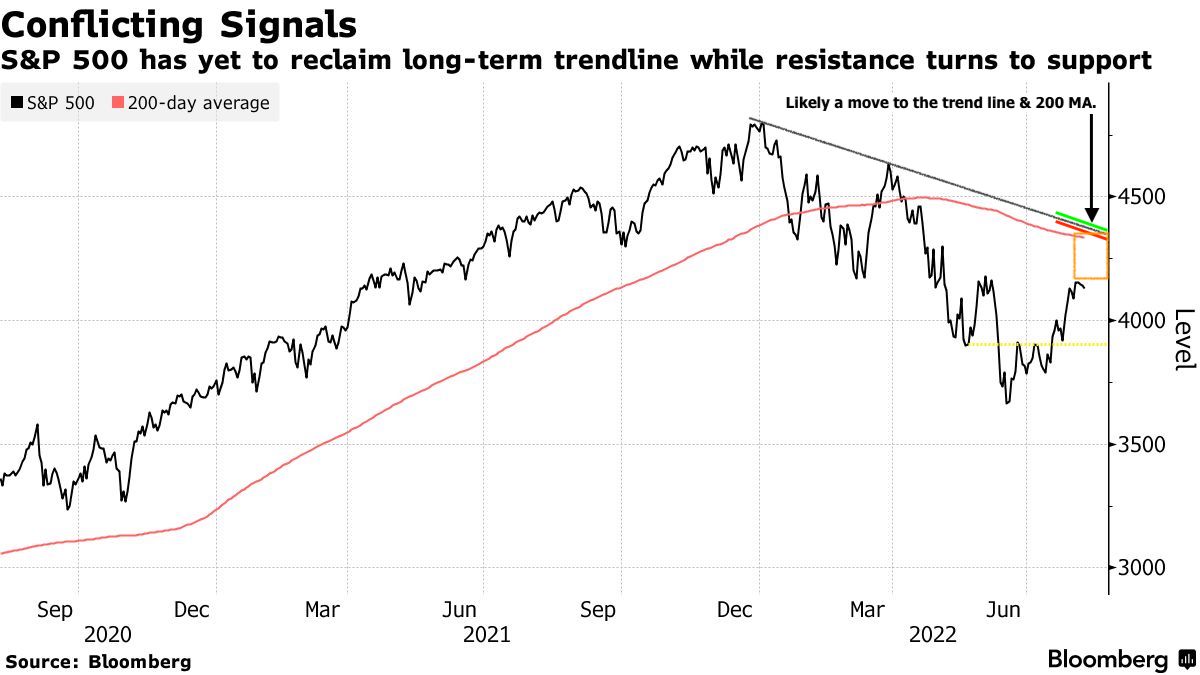
To act on this information, you are best off shrinking your timeframe and using if/then statements to put on trades. For instance, if the market rises past the downtrend line in the S&P 500, then the 2022 equity bear market is over. We should bias ourselves long, at that point.
Graphic: Retrieved from Bloomberg. Drawn on by Physik Invest.
Accordingly, over a larger horizon, its growth impulses, as well as the availability of credit and liquidity determine whether a market’s movements have legs.
Accordingly, “in the 1970s, the peak in inflation proved THE timing to load up on risk assets, but the missing link is a bottoming growth cycle,” Andreas Steno Larsen explained.
“The swiftly weakening growth cycle may rather be the EXACT reason why inflation has started to fade.”
In fact, Credit Suisse Group AG’s (NYSE: CS) Zoltan Pozsar sees inflation as a longer-lasting structural issue as “the pillars of the low inflation world – [de-globalization and populism] – are changing.”
As Crossmark Global Investments’ Victoria Fernandez puts it well, “We have probably reached peak inflation, but the stickiness of the inflation that remains (i.e., rents) keeps pressure on the Fed and therefore the markets.”
“We expected a summer rally due to better-than-expected earnings, but we aren’t satisfied that this is sustainable. A soft landing is still achievable, but we still anticipate volatility with so many unknowns out there.”
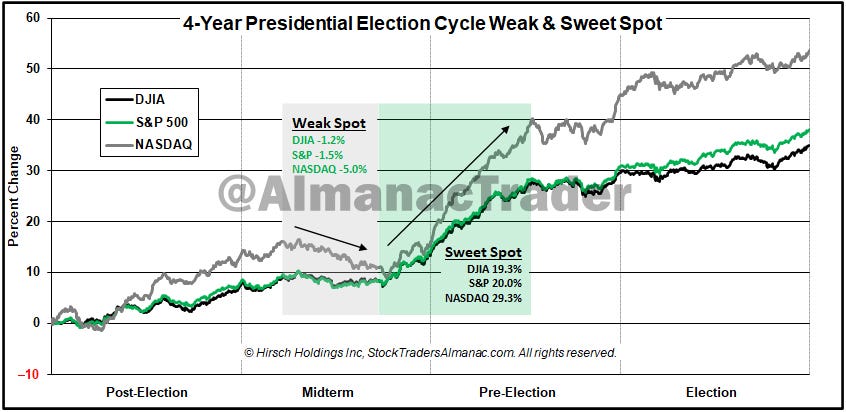
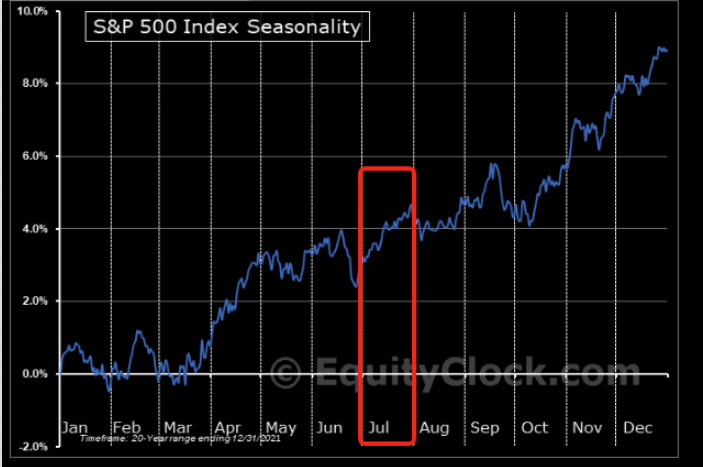
Graphic: Retrieved from Callum Thomas’ Weekly S&P 500 ChartStorm. The “seasonal/cycle outlook is for a lower low or retest of the lows over the next three months as we are in the worst two months of the year and are smack dab in the *Weak Spot* of the 4-Year Cycle”
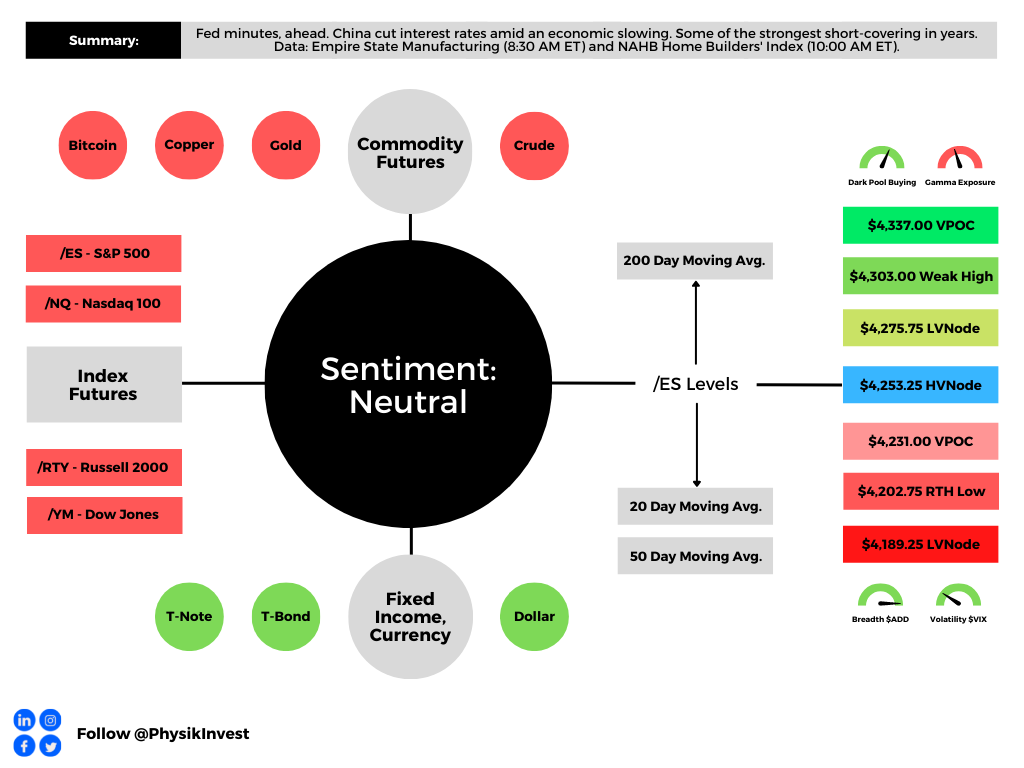
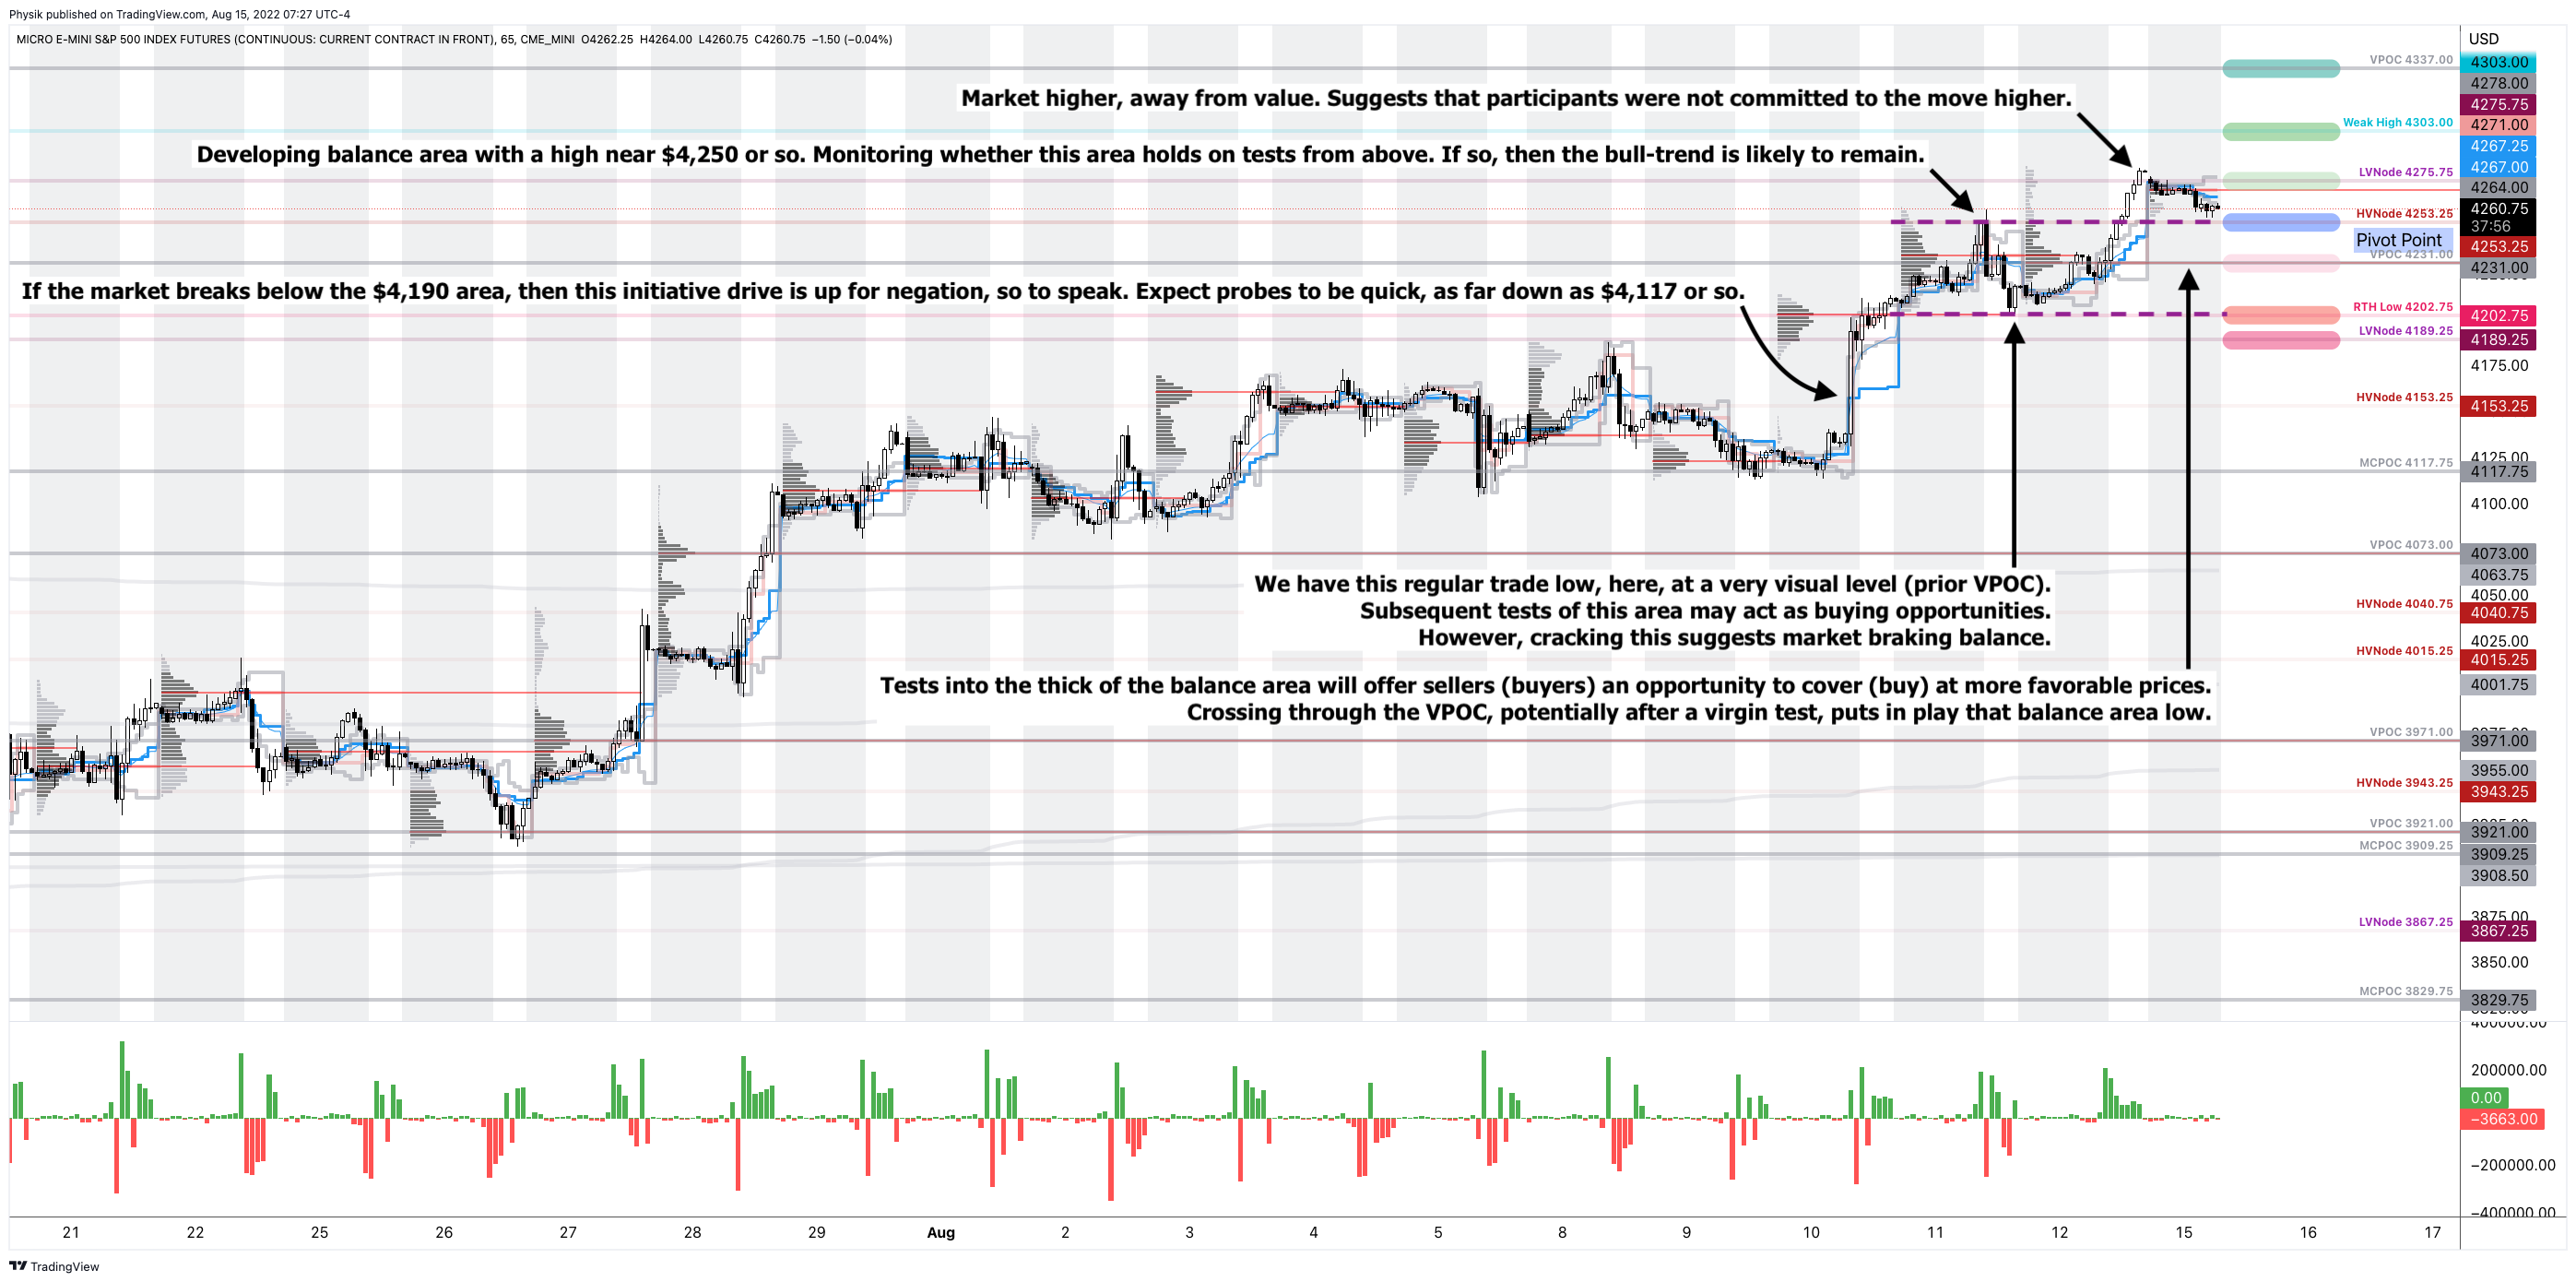
As of 7:30 AM ET, Monday’s regular session (9:30 AM – 4:00 PM ET), in the S&P 500, is likely to open in the lower part of a negatively skewed overnight inventory, inside of prior-range and -value, suggesting a limited potential for immediate directional opportunity.
In the best case, the S&P 500 trades higher.
Any activity above the $4,253.25 HVNode puts into play the $4,275.75 LVNode. Initiative trade beyond the LVNode could reach as high as the $4,303.00 Weak High and $4,337.00 VPOC, or higher.
In the worst case, the S&P 500 trades lower.
Any activity below the $4,253.25 HVNode puts into play the $4,231.00 VPOC. Initiative trade beyond the VPOC could reach as low as the $4,202.75 RTH Low and $4,189.25 LVNode, or lower.
Click here to load today’s key levels into the web-based TradingView charting platform. Note that all levels are derived using the 65-minute timeframe. New links are produced, daily.
Graphic: 65-minute profile chart of the Micro E-mini S&P 500 Futures.
Definitions
Volume Areas: A structurally sound market will build on areas of high volume (HVNodes). Should the market trend for long periods of time, it will lack sound structure, identified as low volume areas (LVNodes). LVNodes denote directional conviction and ought to offer support on any test.
If participants were to auction and find acceptance into areas of prior low volume (LVNodes), then future discovery ought to be volatile and quick as participants look to HVNodes for favorable entry or exit.
POCs: POCs are valuable as they denote areas where two-sided trade was most prevalent in a prior day session. Participants will respond to future tests of value as they offer favorable entry and exit.
MCPOCs: POCs are valuable as they denote areas where two-sided trade was most prevalent over numerous day sessions. Participants will respond to future tests of value as they offer favorable entry and exit.
Volume-Weighted Average Prices (VWAPs): A metric highly regarded by chief investment officers, among other participants, for quality of trade. Additionally, liquidity algorithms are benchmarked and programmed to buy and sell around VWAPs.
About
After years of self-education, strategy development, mentorship, and trial-and-error, Renato Leonard Capelj began trading full-time and founded Physik Invest to detail his methods, research, and performance in the markets.
Capelj also develops insights around impactful options market dynamics at SpotGamma and is a Benzinga reporter.
In no way should the materials herein be construed as advice. Derivatives carry a substantial risk of loss. All content is for informational purposes only.
The daily brief is a free glimpse into the prevailing fundamental and technical drivers of U.S. equity market products. Join the 300+ that read this report daily, below!
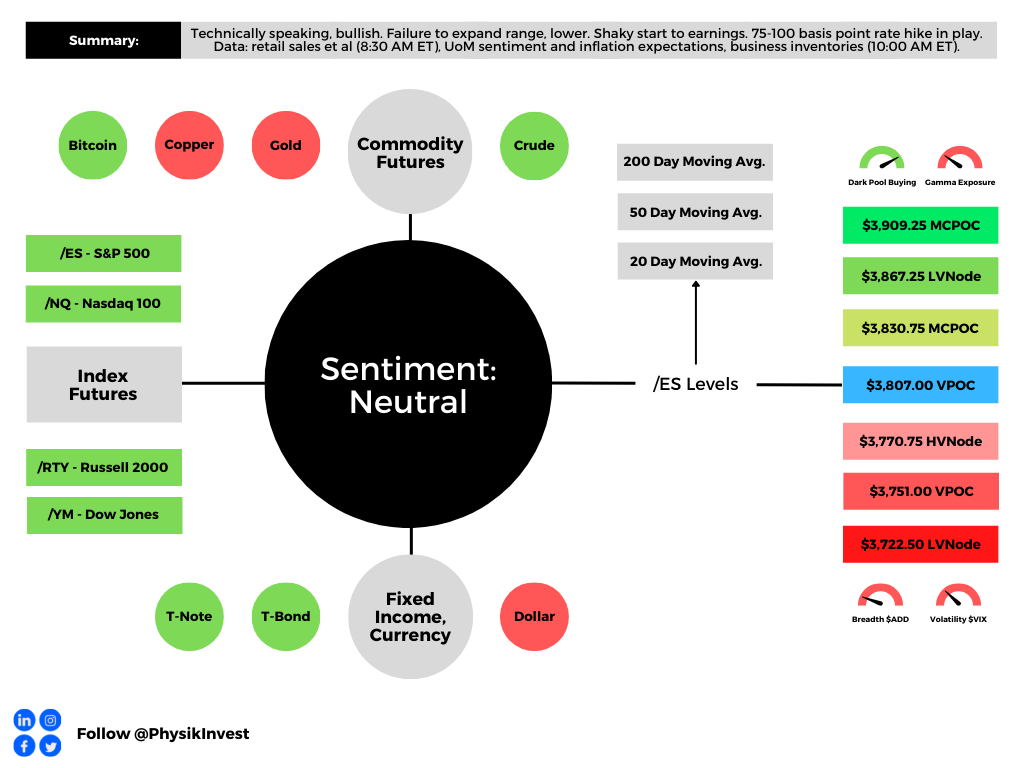
Graphic updated 6:35 AM ET. Sentiment Neutral if expected /ES open is inside of the prior day’s range. /ES levels are derived from the profile graphic at the bottom of the following section. Levels may have changed since initially quoted; click here for the latest levels. SqueezeMetrics Dark Pool Index (DIX) and Gamma (GEX) calculations are based on where the prior day’s reading falls with respect to the MAX and MIN of all occurrences available. A higher DIX is bullish. At the same time, the lower the GEX, the more (expected) volatility. Learn the implications of volatility, direction, and moneyness. Breadth reflects a reading of the prior day’s NYSE Advance/Decline indicator. VIX reflects a current reading of the CBOE Volatility Index (INDEX: VIX) from 0-100.
Fundamental
Note: A really interesting discussion in the below positioning section which tidies up some of the past analyses we’ve made. Read on for more!
Ahead are updates on retail sales, import prices, Empire State Manufacturing (8:30 AM ET), industrial production and capacity utilization (9:15 AM ET), as well as University of Michigan consumer sentiment and inflation expectations, and business inventories (10:00 AM ET).
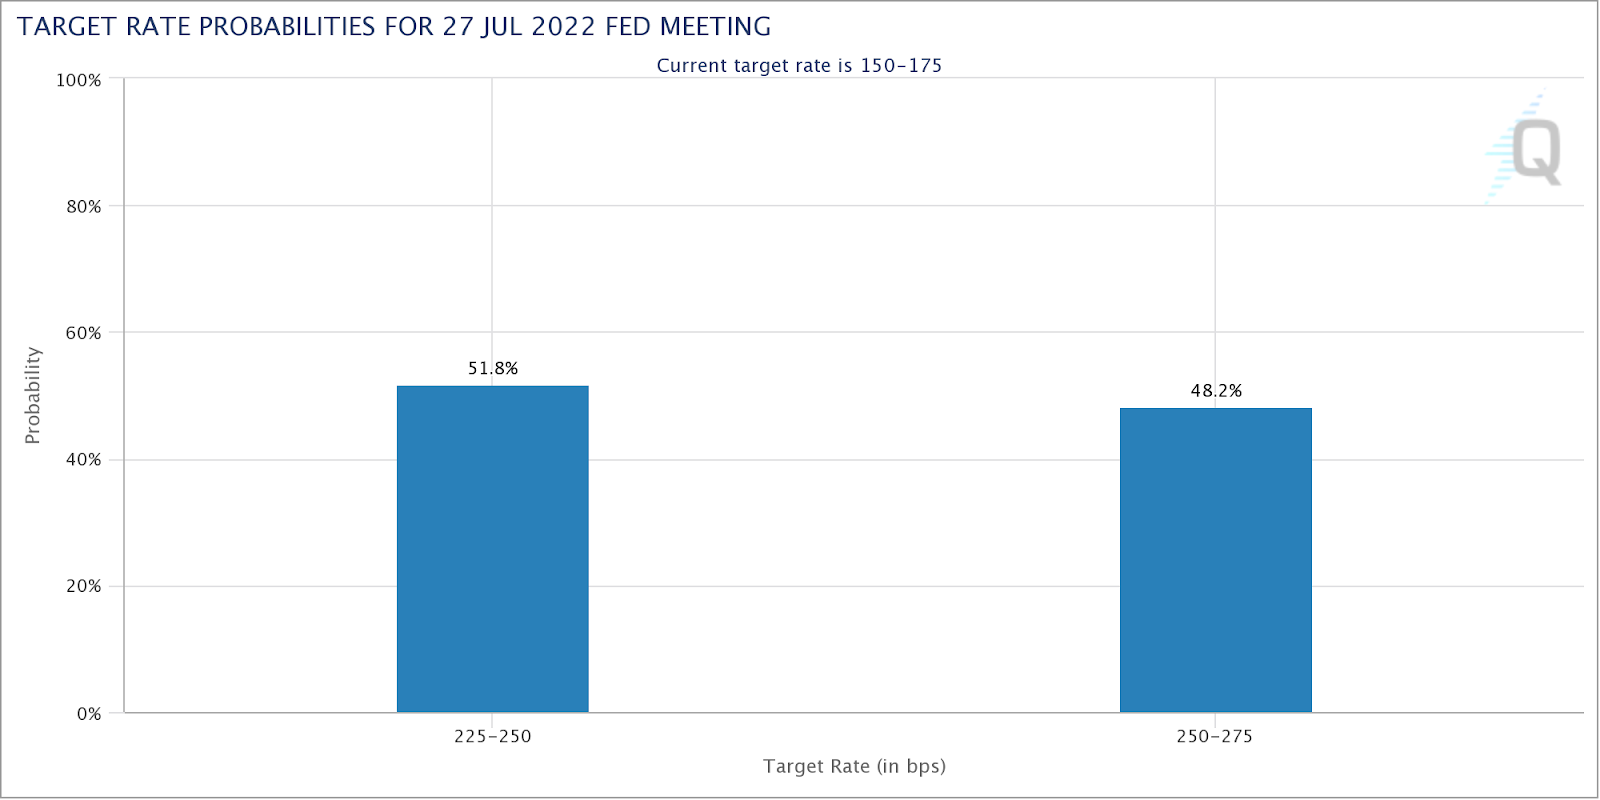
This week, markets repriced after data on inflation came in hot. Participants have bet on tough action from the Federal Reserve (Fed). Now, there is a near-50% chance of a 100 basis point hike later in July.
Graphic: Via CME Group Inc’s (NASDAQ: CME) FedWatch Tool.
Per The Macro Compass, published by Alfonso Peccatiello, companies have downgraded their outlooks and job creation “is much less impressive” amid labor force shrinkage.
“[T]he number of total employed people in the US divided by its total population in the 25-54y age bracket dropped below 80%,” he explains. “Over the last 30 years, at the peak of each economic cycle, this ratio was over 80%.”
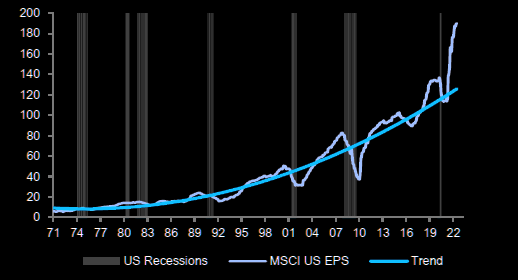
Accordingly, earnings “are nowhere near pricing the economic slowdown, … [and there still remains] way too much optimism.”
Graphic: Retrieved from The Market Ear. Via Barclays Plc (NYCE: BCS).
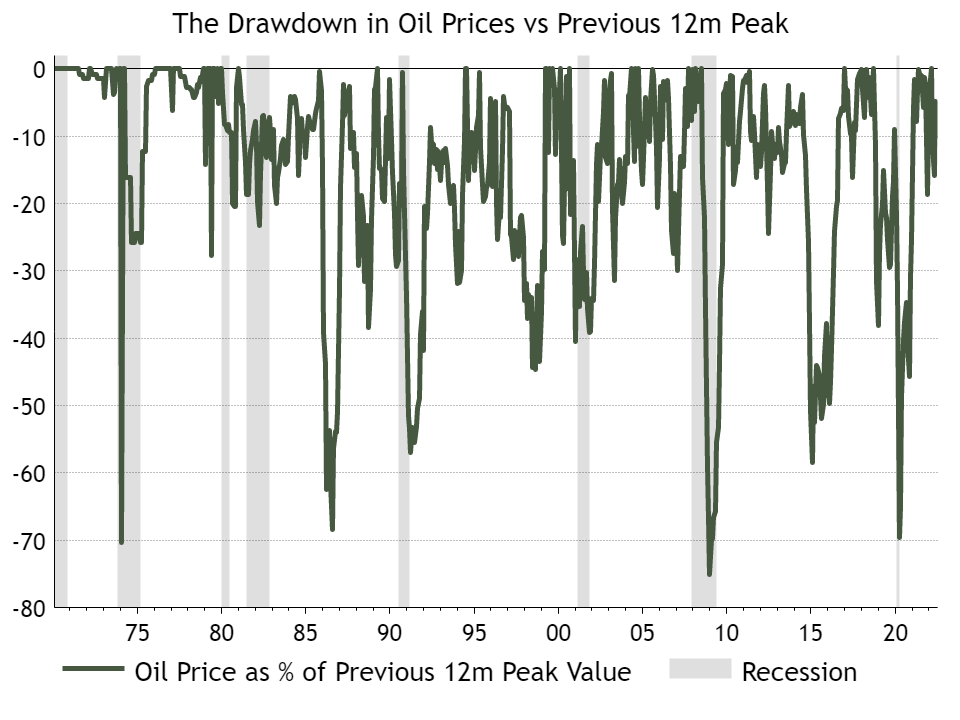
Additionally, commodities (even more so those that are industrial and “are the cleanest expression of global demand”) have endured selling pressure with a near 30% copper drawdown likely to precede positive total returns for long bonds, Peccatiello explains.
Graphic: Retrieved from Callum Thomas. With “[r]ecessions see[ing] oil prices fall by 20% to 70%, … being bullish on oil at this point is either betting against history or [] recession.”
Positioning
The drawdown in commodities is significant as that was, arguably, the last place that offered participants a hedge against their poorly performing bond and equity exposures.
“A lot of people allocated to commodity trend following and that did a good job in the first two quarters,” The Ambrus Group’s Kris Sidial explained.
“CTAs were performing and you had a lot of people who did not need to buy [equity] volatility because their portfolios were covered from the inflation hedges.”
That, coupled with the sale of ultra-short-dated volatility, particularly in some of the single names to capture “rich” volatility, as well as hedging of structured products issuances, continues to play into suppressed index volatility.
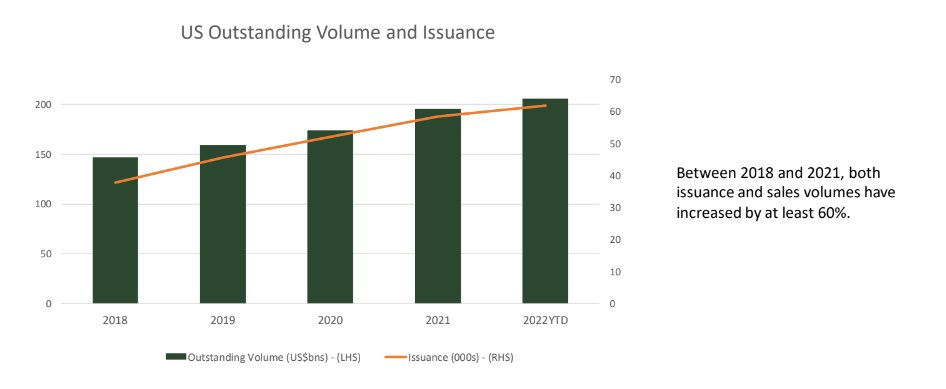
For context: Rising rates and a drive for yield have been a boon for exotic derivatives.

Participants often seek exposure to products that are essentially short volatility a year or so out. The counterparty, here, is long volatility on these notes. To hedge risk – since “you can’t just be long volatility, … [otherwise] you’ll bleed money for long periods of time” – the bank will hedge risk in the listed market.

However, on a one-year auto-callable, for which it would be appropriate to sell one-year volatility in the listed market, “some of these banks … create this synthetic calendar profile where they’re … sell[ing] a little bit of one-month vol because they can take in that theta a whole lot faster, or two- and three-month vol,” spreading exposure in buckets.

See, here, for a sample presentation on what is an Auto-Callable Yield Note.

This suppresses “vol in the front of the term structure, and … opens up the door to … that other move where if everybody is selling vol in the front of the term structure,” it may blow out on a large increase in demand.

“If you look back during COVID, there are articles about banks that lost a lot of money because of the[ir] hedges. This has happened previously and you’re seeing little blips of it start to” return.
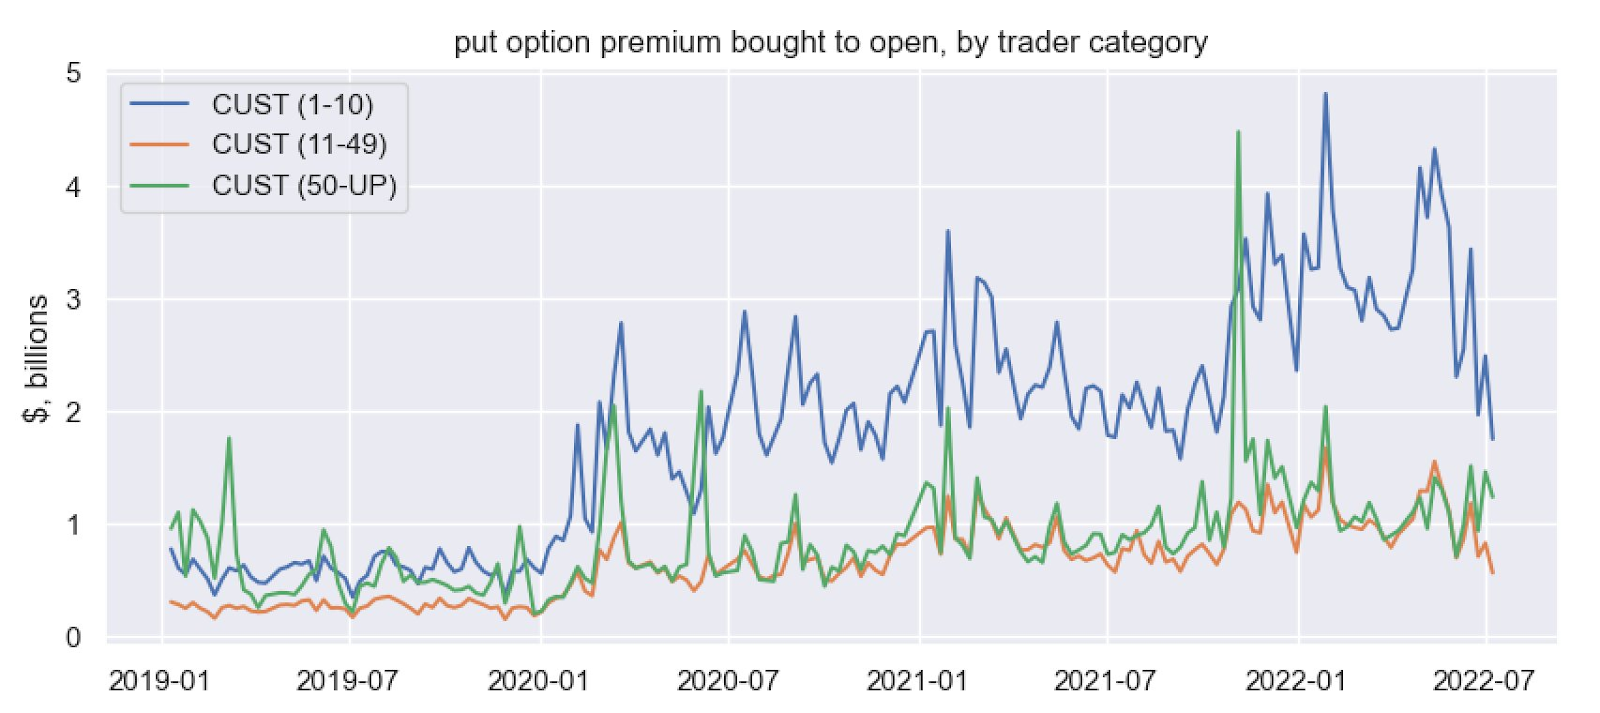
Graphic: Retrieved from The Ambrus Group’s Kris Sidial. “[S]ome dealers will opportunistically look to sell vol in some buckets in the front of the term structure.”
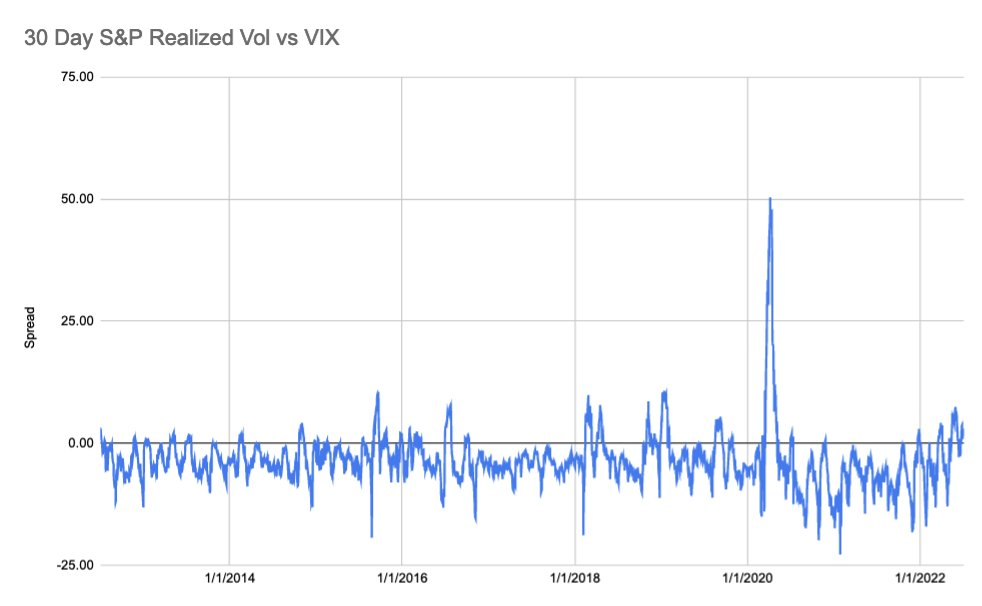
Basically, “the macro landscape … opened up another area to hedge” which resulted in the increased movement of realized equity (RVOL) volatility, relative to that which is implied (IVOL).
Graphic: Via S&P Global Inc (NYSE: SPGI). As explained by SpotGamma, “30-day realized SPX volatility is now trading above the VIX, something that generally shows after major selloffs wherein IV “premium” needs to reset to calmer/higher equity markets.”
Now, with commodities not offering protection, one has to be concerned if “the flock move[s].”
“If commodities are not performing, they’re not going to work as a hedge for your portfolio. That opens the door … [to] markets sliding lower and [people] need[ing] to get hedges on,” which is likely to bid equity volatility where some single names “are only trading three to four vol points above where they were trading in January of 2020,” the complete dismissal of a crash.
Therefore, “if you wanted to go out and hedge, the opportunity is still there in the equity space.”
Technical
As of 6:30 AM ET, Friday’s regular session (9:30 AM – 4:00 PM ET), in the S&P 500, is likely to open in the middle part of a balanced overnight inventory, inside of prior-range and -value, suggesting a limited potential for immediate directional opportunity.
In the best case, the S&P 500 trades higher.
Any activity above the $3,807.00 VPOC puts into play the $3,830.75 MCPOC. Initiative trade beyond the MCPOC could reach as high as the $3,867.25 LVNode and $3,909.25 MCPOC, or higher.
In the worst case, the S&P 500 trades lower.
Any activity below the $3,807.00 VPOC puts into play the $3,770.75 HVNode. Initiative trade beyond the HVNode could reach as low as the $3,751.00 VPOC and $3,722.50 LVNode, or lower.
Click here to load today’s key levels into the web-based TradingView charting platform. Note that all levels are derived using the 65-minute timeframe. New links are produced, daily.
Graphic: 65-minute profile chart of the Micro E-mini S&P 500 Futures.
Considerations: Responsiveness near key-technical areas (that are discernable visually on a chart), suggests technically-driven traders with short time horizons are very active.
Such traders often lack the wherewithal to defend retests and, additionally, the type of trade may be indicative of the other time frame participants waiting for more information to initiate trades.
Definitions
Volume Areas: A structurally sound market will build on areas of high volume (HVNodes). Should the market trend for long periods of time, it will lack sound structure, identified as low volume areas (LVNodes). LVNodes denote directional conviction and ought to offer support on any test.
If participants were to auction and find acceptance into areas of prior low volume (LVNodes), then future discovery ought to be volatile and quick as participants look to HVNodes for favorable entry or exit.
POCs: POCs are valuable as they denote areas where two-sided trade was most prevalent in a prior day session. Participants will respond to future tests of value as they offer favorable entry and exit.
MCPOCs: POCs are valuable as they denote areas where two-sided trade was most prevalent over numerous day sessions. Participants will respond to future tests of value as they offer favorable entry and exit.
Volume-Weighted Average Prices (VWAPs): A metric highly regarded by chief investment officers, among other participants, for quality of trade. Additionally, liquidity algorithms are benchmarked and programmed to buy and sell around VWAPs.
About
After years of self-education, strategy development, mentorship, and trial-and-error, Renato Leonard Capelj began trading full-time and founded Physik Invest to detail his methods, research, and performance in the markets.
Capelj also develops insights around impactful options market dynamics at SpotGamma and is a Benzinga reporter.
In no way should the materials herein be construed as advice. Derivatives carry a substantial risk of loss. All content is for informational purposes only.
The daily brief is a free glimpse into the prevailing fundamental and technical drivers of U.S. equity market products. Join the 300+ that read this report daily, below!
Graphic updated 7:00 AM ET. Sentiment Neutral if expected /ES open is inside of the prior day’s range. /ES levels are derived from the profile graphic at the bottom of the following section. Levels may have changed since initially quoted; click here for the latest levels. SqueezeMetrics Dark Pool Index (DIX) and Gamma (GEX) calculations are based on where the prior day’s reading falls with respect to the MAX and MIN of all occurrences available. A higher DIX is bullish. At the same time, the lower the GEX, the more (expected) volatility. Learn the implications of volatility, direction, and moneyness. Breadth reflects a reading of the prior day’s NYSE Advance/Decline indicator. VIX reflects a current reading of the CBOE Volatility Index (INDEX: VIX) from 0-100.
Fundamental
To start, thank you to the many new subscribers who joined in the past weeks. I’m honored.

Further, today we start broad (fundamental) and hone into specifics on how to act in the current trade environment (positioning), as well as potential inflection (technical) points.

I encourage you to read through to the technicals part, if possible. Have a great week!
Seasonally speaking, the markets are in the midst of one of the most bullish periods of the year.
With bonds and equity products now off their swing lows and commodities off their highs (as inflation has, potentially, peaked), we have to question how much more?
Graphic: Retrieved from Goldman Sachs Group Inc (NYSE: GS).
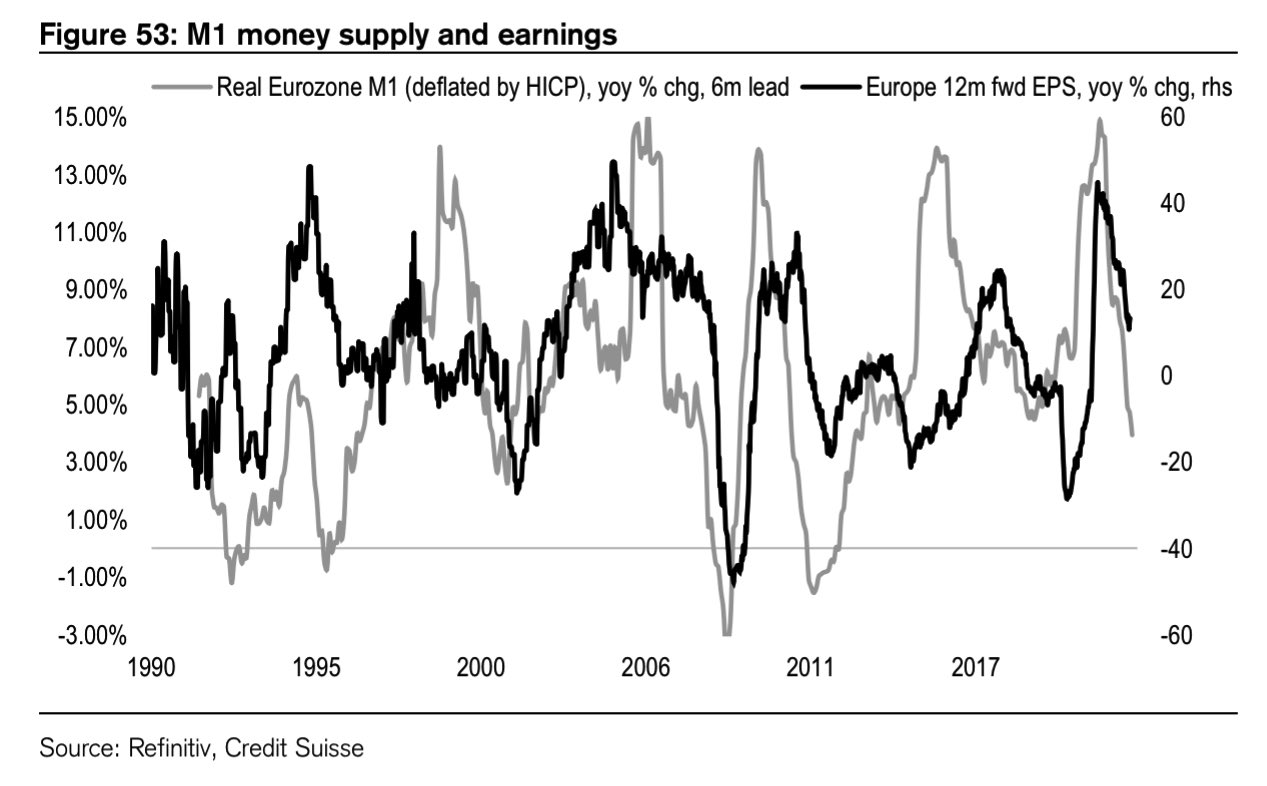
Well, thus far, and this is something we’ve talked about in the past, markets have suffered through compression in multiples. Does it stop or is there a looming earnings compression?
Graphic: Retrieved from Credit Suisse Group AG (NYSE: CS).
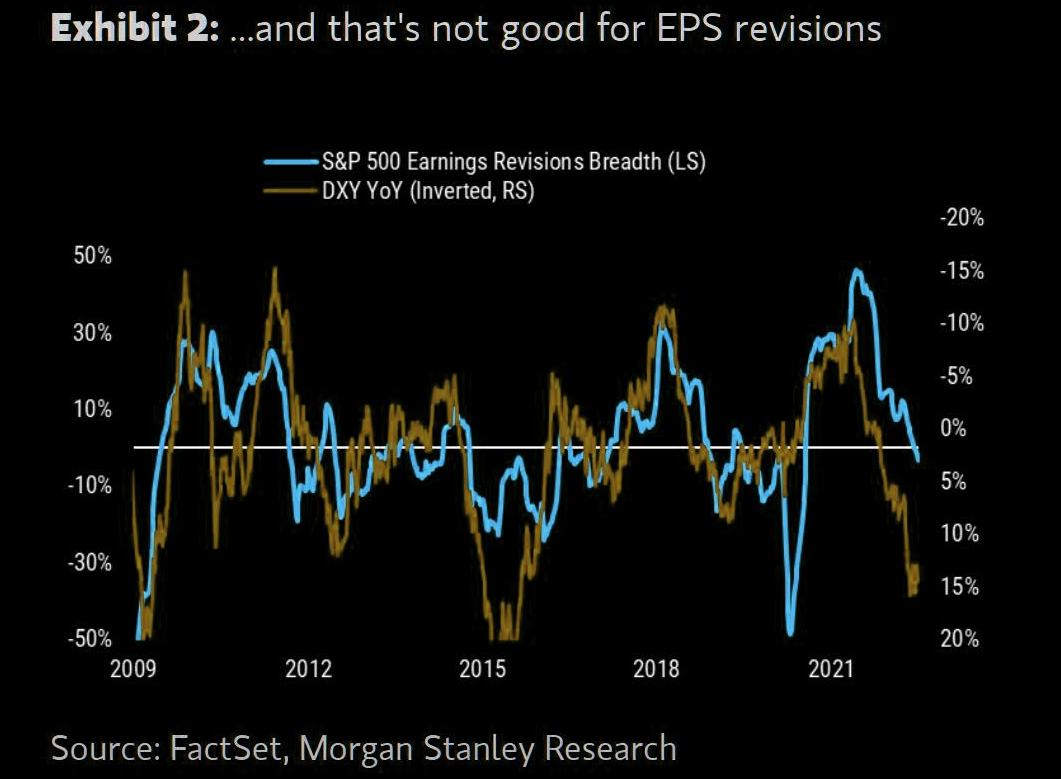
The earnings season shall shed clarity on the answer all the while – what is known – a strong dollar is sure to translate into a headwind for S&P 500 earnings growth.
Graphic: Retrieved from The Market Ear. Via Morgan Stanley (NYSE: MS) research. “The simple math on S&P 500 earnings from currency is that for every percentage point increase on a year-on-year basis it’s approximately a 0.5xhit to EPS growth. At today’s 16% year-on-year level, that translates into an 8% headwind for S&P 500 EPS growth, all else equal”
“The main point for equity investors is that this dollar strength is just another reason to think earnings revisions are coming down,” Morgan Stanley’s Mike Wilson explains.
“[T]he recent rally in stocks is likely to fizzle out before too long.”
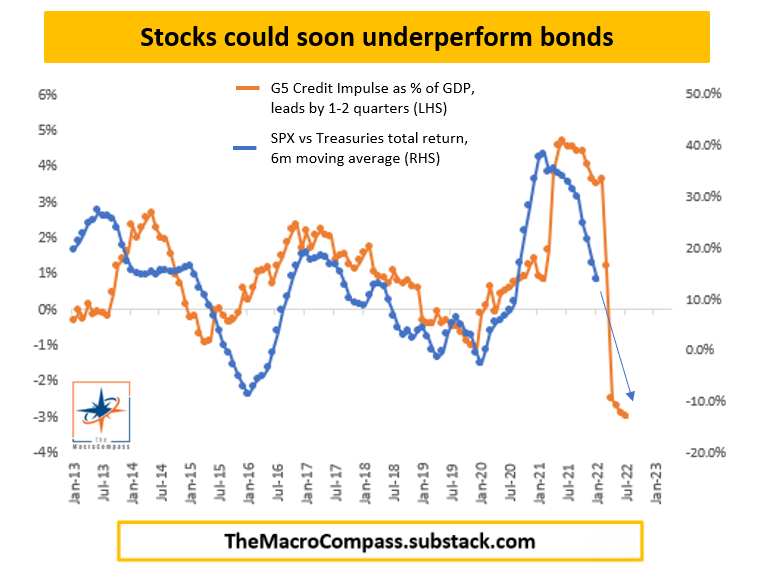
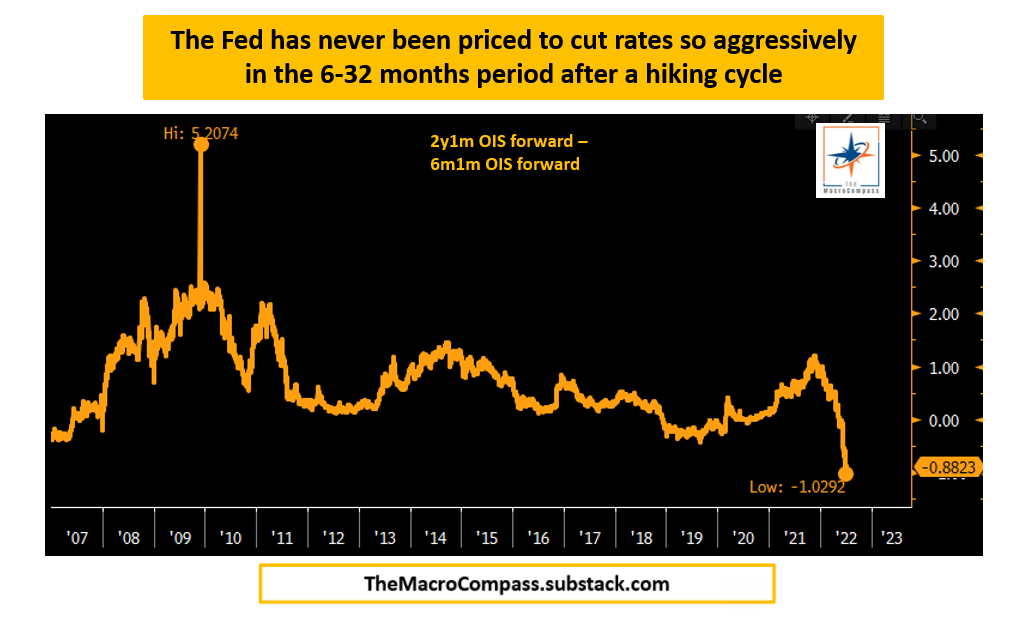
Moreover, with the impulse in credit falling, labor market showing preliminary signs of weakness, a drawdown in commodities (which is consistent with sharply lower economic growth), and bond market pricing rate cuts in early 2023, immediately following the hiking cycle, portfolios can “stay away from highly speculative assets, own USD cash and start allocating towards 5-10y+ government bonds,” as Alfonso Peccatiello explains well in his letter, The Macro Compass.
Graphic: Retrieved from The Macro Compass published by Alfonso Peccatiello.
Positioning
Calmer trade alongside easing volatility and generally rising gamma exposures. Trade, at times, was responsive. Participants would add positive (negative) delta bets into weakness (strength).
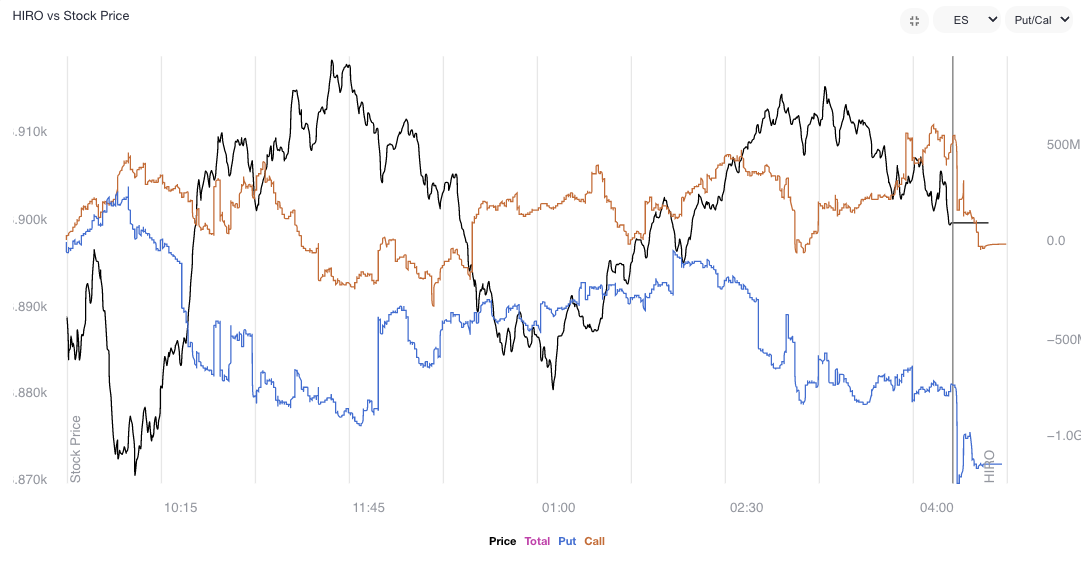
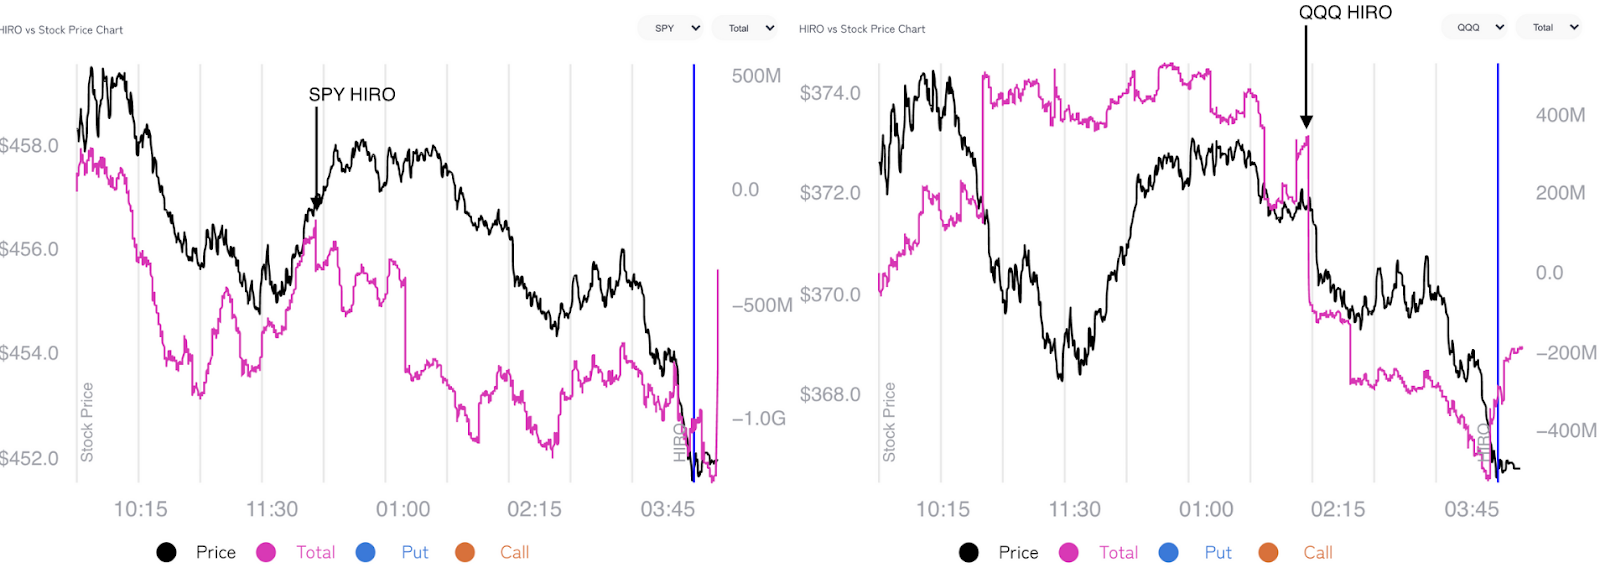
Graphic: Updated 7/8/2022. SpotGamma’s Hedging Impact of Real-Time Options (HIRO) indicator registers the sale of put (blue line) and call (orange) options.
Noteworthy is the continued sale of volatility, particularly across shorter time horizons, as well as increased demand for call options, especially in some of the larger index weights. Volatility sale, on the part of customers, leaves liquidity providers warehousing long volatility (which is kind of a naive thing to say as we’re discounting customer trades being paired off with each other).
Nonetheless, these liquidity providers’ positions, all else equal, will maintain or increase in value if underlying(s) realize volatility (especially that far in excess of implied). To hedge, rips (dips) will be sold (bought) to offset the increasing positive (negative) delta.
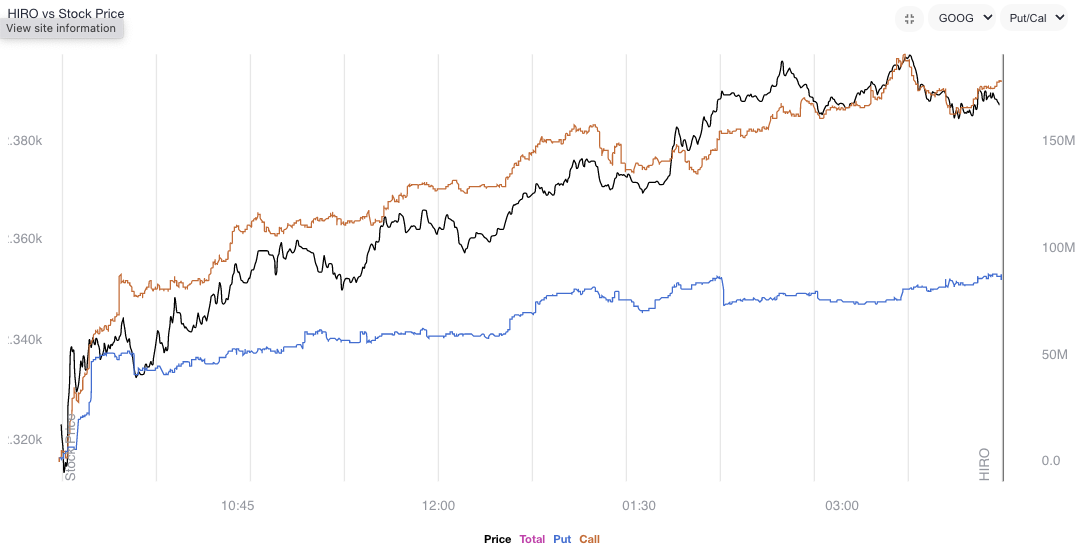
Graphic: Updated 7/7/2022. SpotGamma’s HIRO indicator for Alphabet Inc (NASDAQ: GOOG) (NASDAQ: GOOGL). Rising orange and blue lines point to call buying and put selling, both of which have bullish implications.
Moreover, this trend in volatility supply is in part on the loss of interest in “leveraged long S&P” trades, as well as “marginal demand for puts,” as SqueezeMetrics has stated, before.
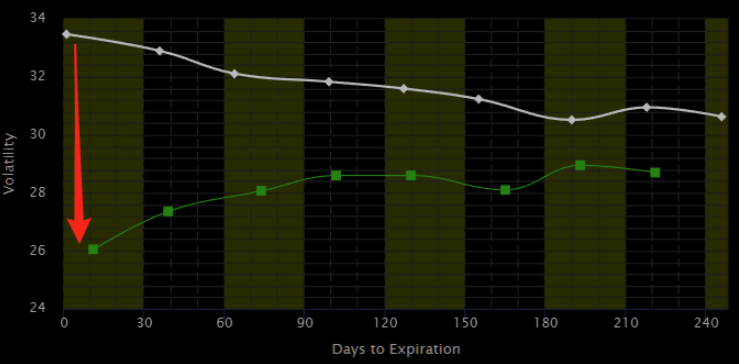
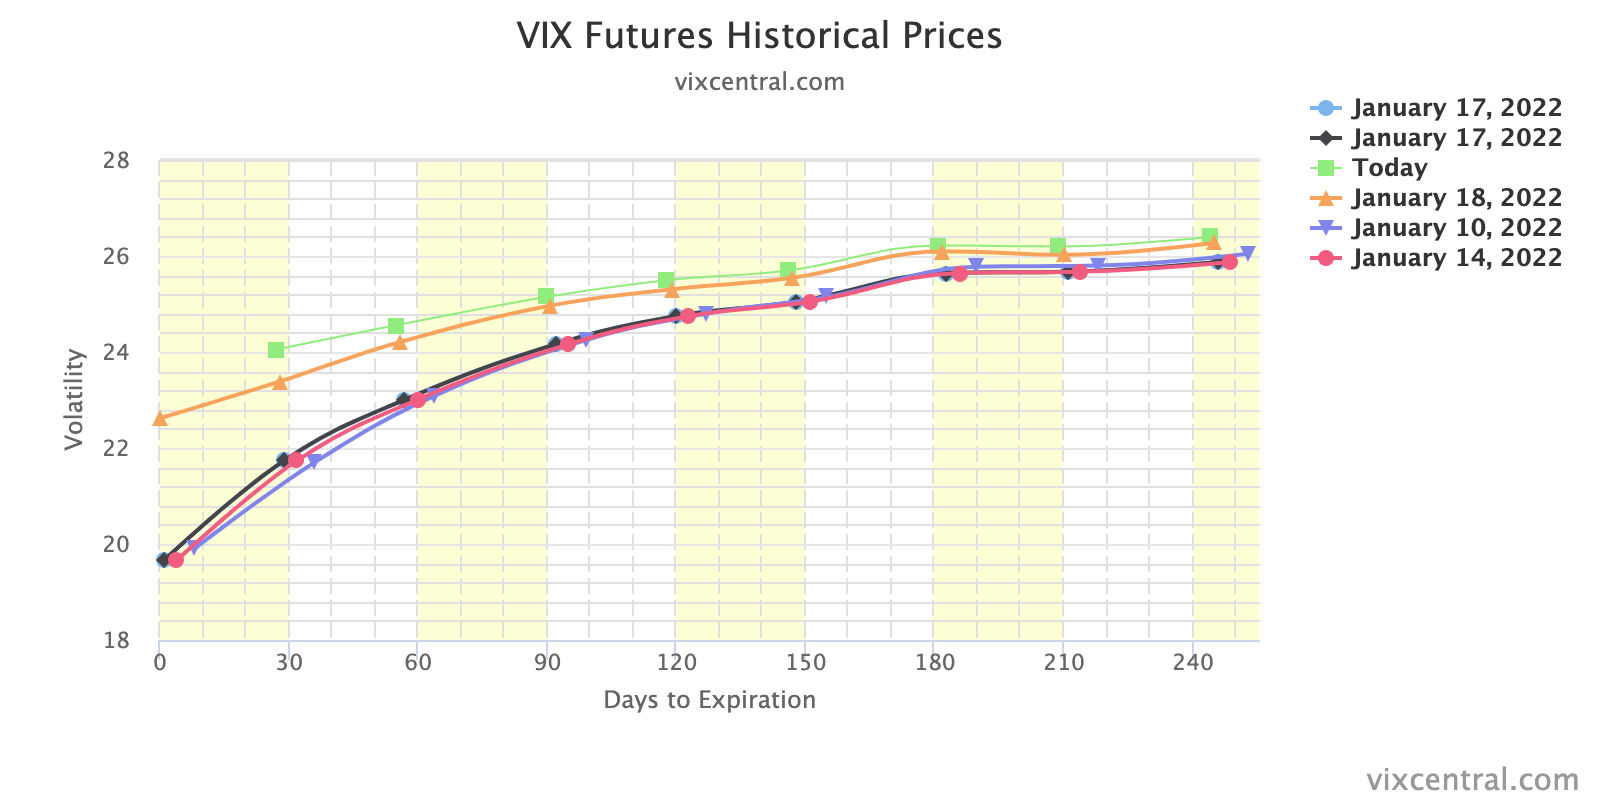
Graphic: Retrieved from The Market Ear. Originally sourced via VIX Central. “Chart shows the VIX term structure ‘crash’ since June 13, which was the most recent VIX peak. The curve is now back to normal with the short end of the curve ‘much’ lower than longer-term maturities. Let’s see how far down they ‘press’ this.”
“Creeping into net selling territory is ‘smart’ bear market positioning. Short delta, short skew.”
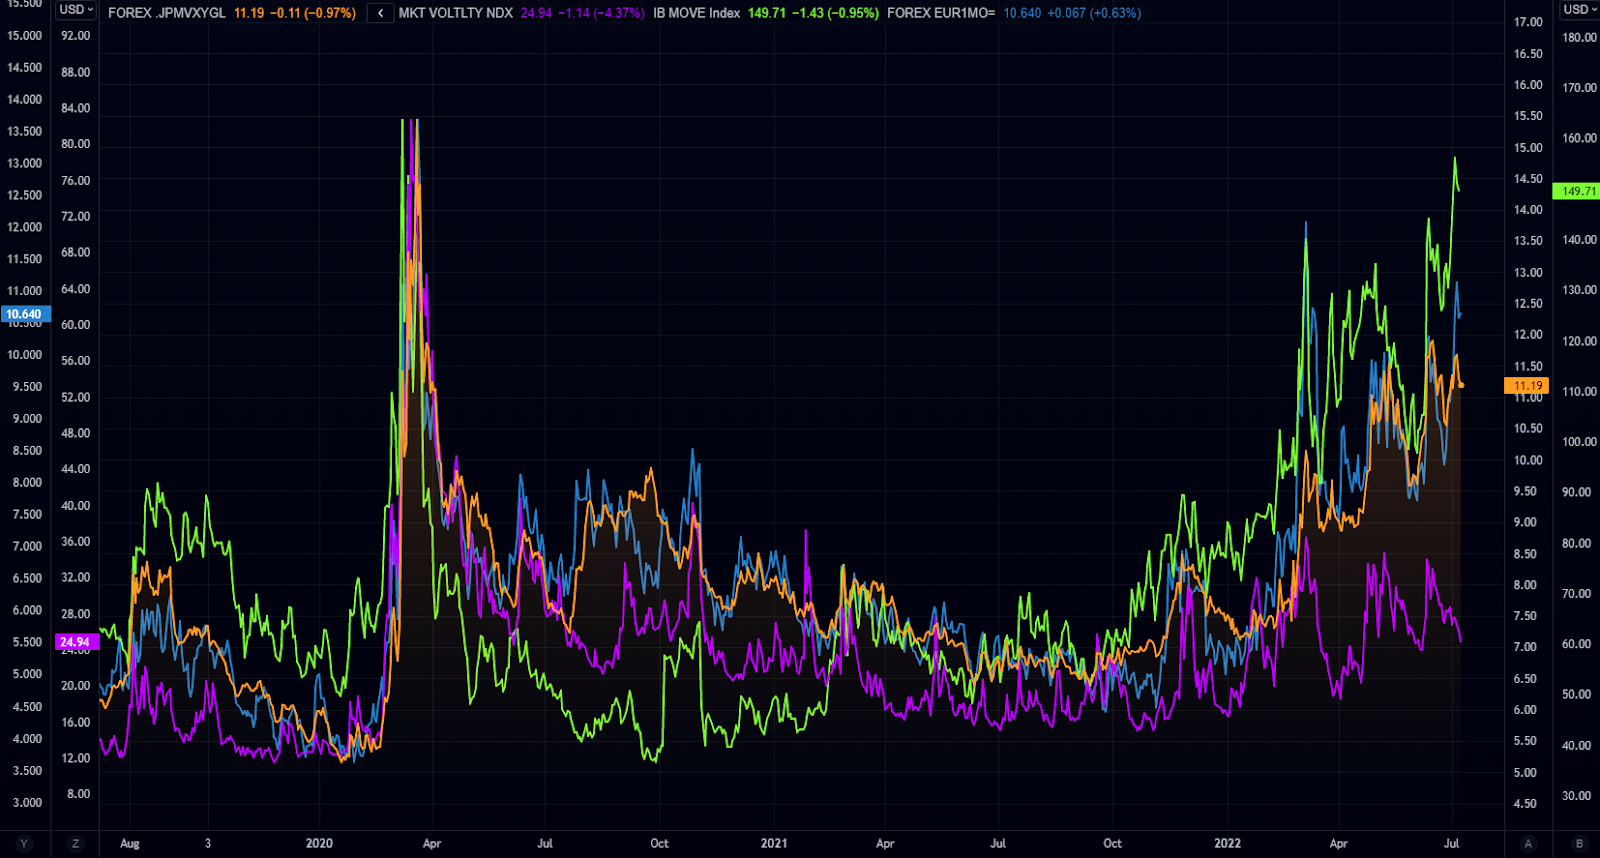
Graphic: Retrieved from The Market Ear. “VIX has decoupled from cross-asset volatilities.”
Accordingly, the volatility markets have realized (RVOL) has crept (and exceeded, at times) the volatility implied (IVOL).
Graphic: Via S&P Global. As explained by SpotGamma, “30-day realized SPX volatility is now trading above the VIX, something that generally shows after major selloffs wherein IV “premium” needs to reset to calmer/higher equity markets.”
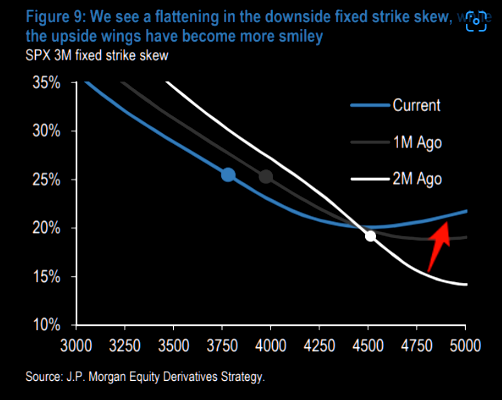
This, coupled with “a flattening in the downside fixed strike skew, while the upside wings [are] more smiley,” as described by JPMorgan Chase & Co (NYSE: JPM), has made for attractive low-cost spread opportunities, as talked about in the July 8, 2022 letter.
Graphic: Via JPMorgan Chase & Co (NYSE: JPM). Taken from The Market Ear.
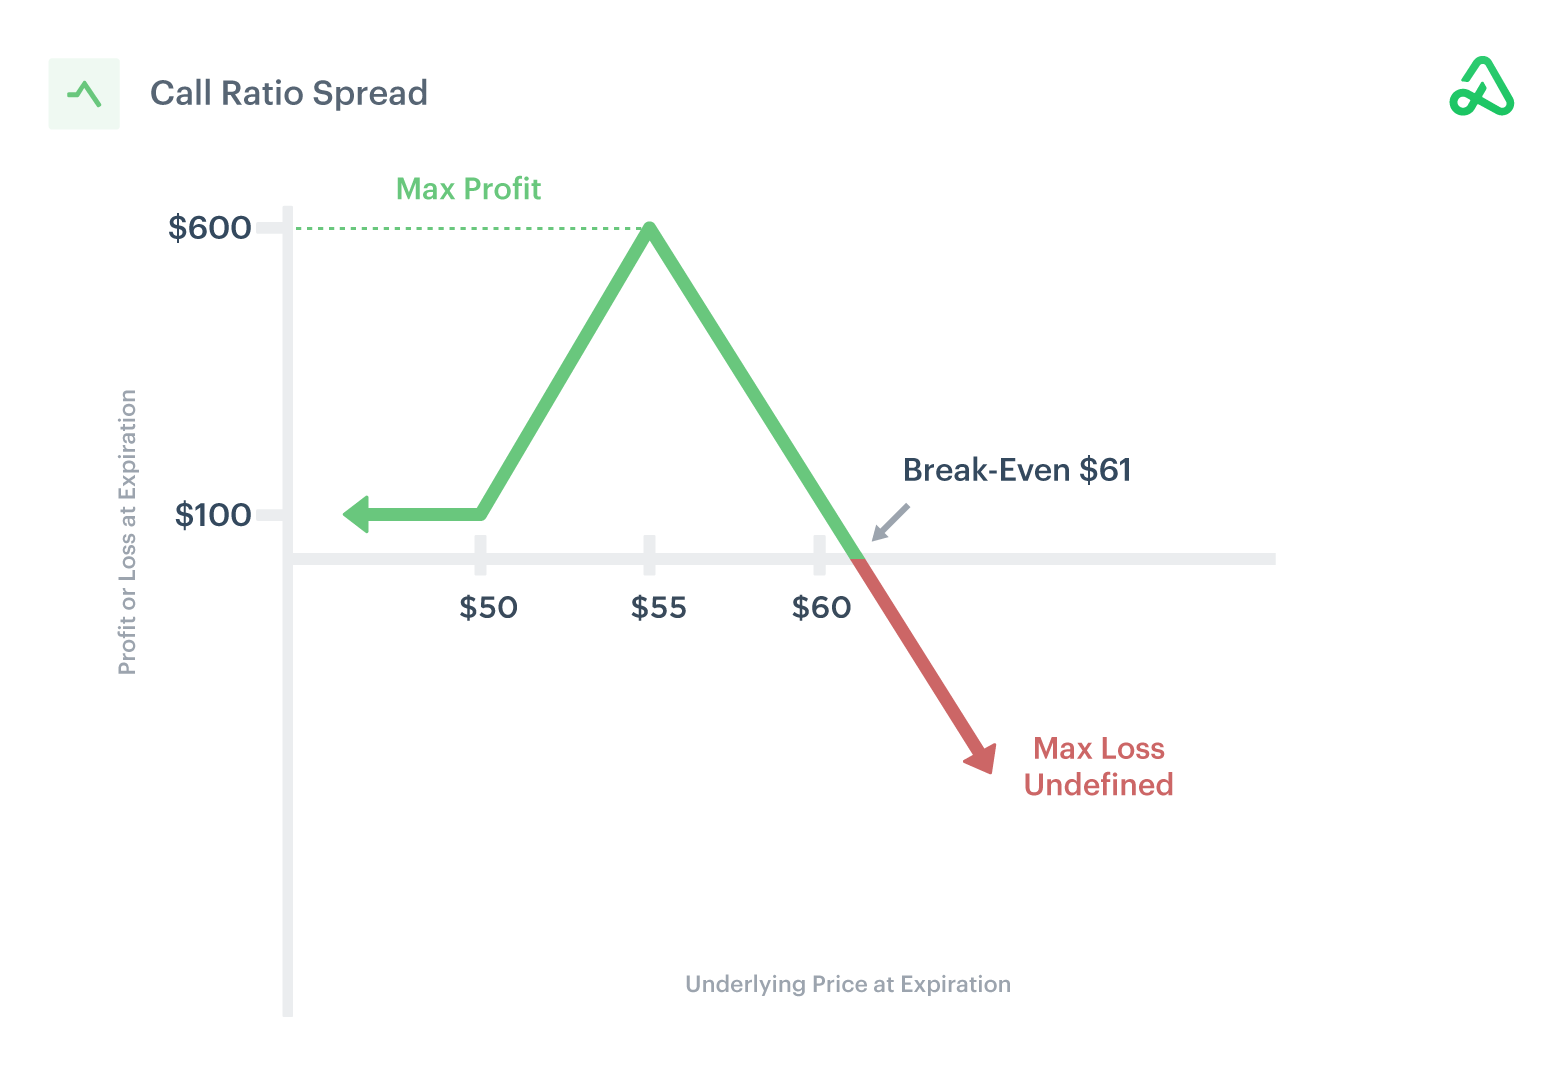
For instance, as discussed Friday, ratio spreads continue to work well for low- or no-cost exposure to the upside.
Pursuant to those remarks, no-cost spreads this letter’s writer has structured in Alphabet Inc (NASDAQ: GOOG) (NASDAQ: GOOGL) are pricing hundreds of dollars in credit to close.
Graphic: Via Charles Schwab Corporation-owned (NYSE: SCHW) TD Ameritrade’s Thinkorswim.
Obviously, there’s no mention, here, of the risk management (e.g., sizing and width) involved. Again, this is as I’m trying to give actionable info without providing explicit recommendations.
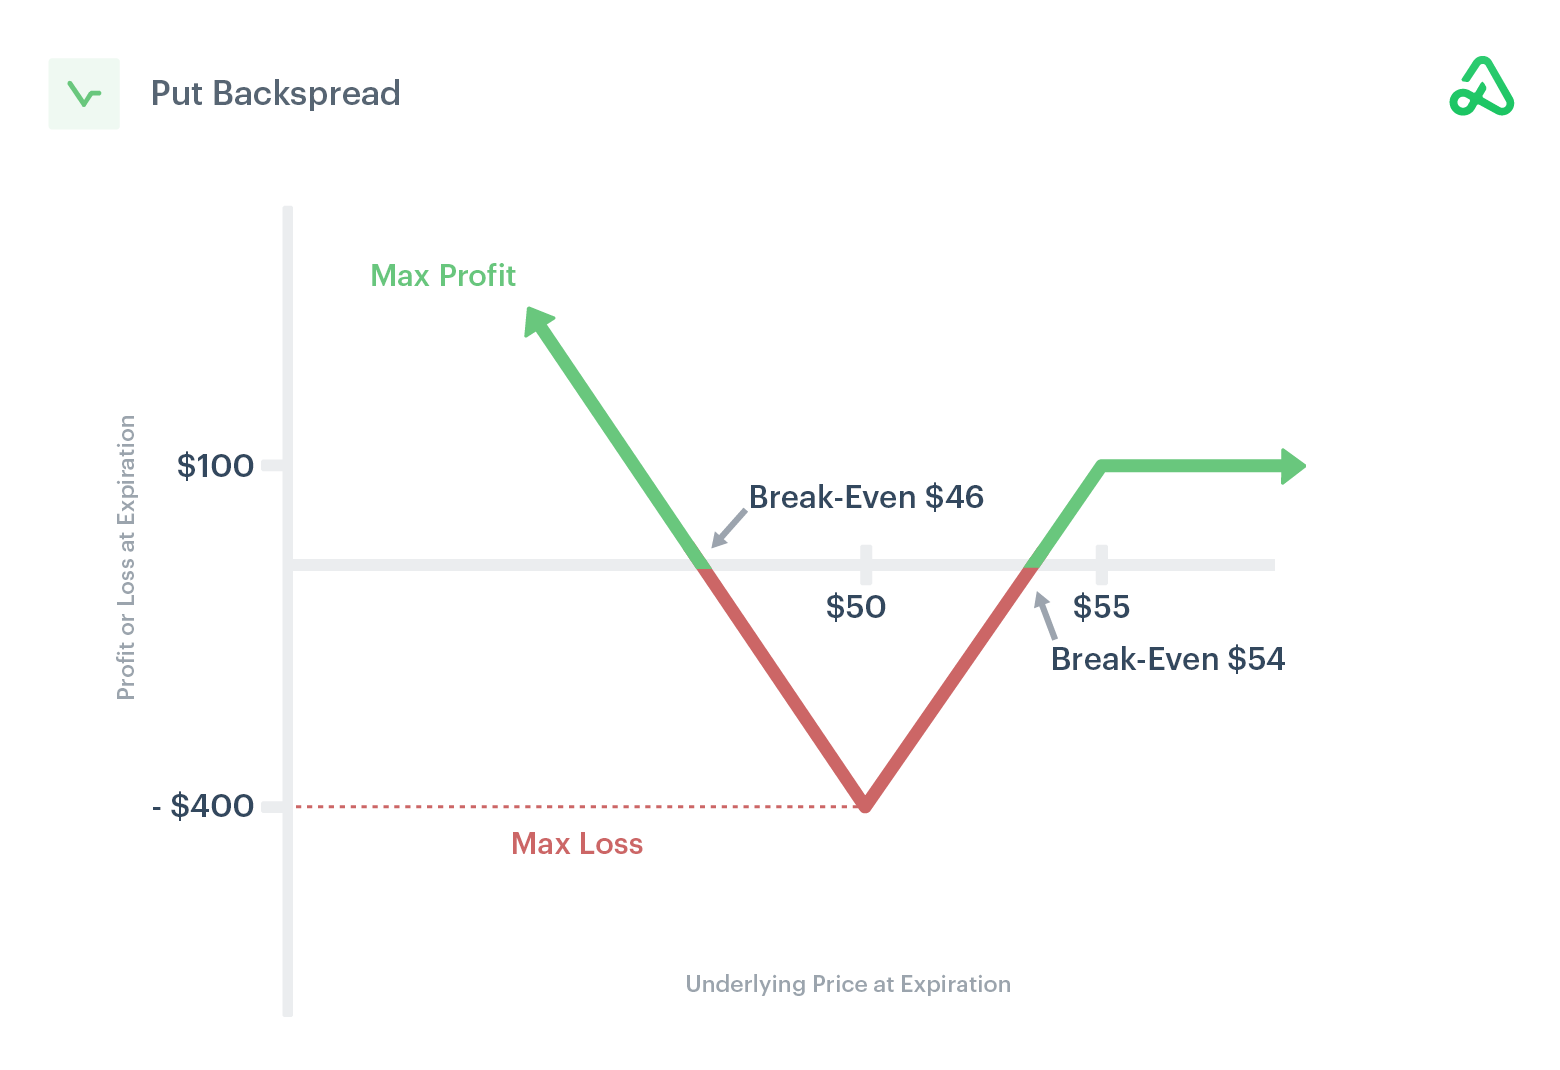
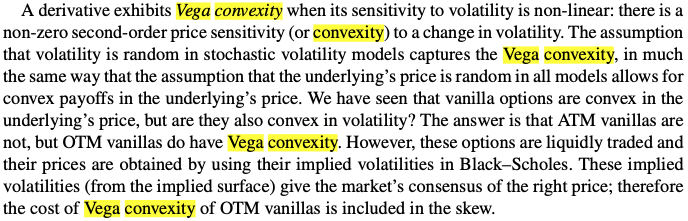
Similarly, if one thought volatility, though at a high starting point particularly at the money (ATM), was due for a repricing, they would look for exposure to the downside via something such as an inverse ratio (or back spread), as said last week.
This is as the ATMs, unlike those further out of the money (OTM), are less convex in vega.
Graphic: Via Mohamed Bouzoubaa et al’s Exotic Options and Hybrids.
Technical
As of 7:00 AM ET, Monday’s regular session (9:30 AM – 4:00 PM ET), in the S&P 500, is likely to open in the middle-to-lower part of a negatively skewed overnight inventory, inside of prior-range and -value, suggesting a limited potential for immediate directional opportunity.
In the best case, the S&P 500 trades higher.
Any activity above the $3,867.25 LVNode puts into play the $3,909.25 MCPOC. Initiative trade beyond the MCPOC could reach as high as the $3,943.25 HVNode and $3,982.75 LVNode, or higher.
In the worst case, the S&P 500 trades lower.
Any activity below the $3,867.25 LVNode puts into play the $3,831.00 VPOC. Initiative trade beyond the VPOC could reach as low as the $3,800.25 LVNode and $3,755.00 VPOC, or lower.
Click here to load today’s key levels into the web-based TradingView charting platform. Note that all levels are derived using the 65-minute timeframe. New links are produced, daily.
Graphic: 65-minute profile chart of the Micro E-mini S&P 500 Futures.
Considerations: Responsiveness near key-technical areas (that are discernable visually on a chart), suggests technically-driven traders with short time horizons are very active.
Such traders often lack the wherewithal to defend retests and, additionally, the type of trade may be indicative of the other time frame participants waiting for more information to initiate trades.
Example: The below 65-minute S&P 500 chart with volume profiles was included in the July 8, 2022 edition of the newsletter. Prices were near an inflection (micro-composite point of control and two key volume-weighted average price levels). From thereon, selling surfaced.This is what is meant by responsiveness near key-technical areas.
Graphic: Updated 7/2/22. 65-minute profile chart of the Micro E-mini S&P 500 Futures.
Definitions
Volume Areas: A structurally sound market will build on areas of high volume (HVNodes). Should the market trend for long periods of time, it will lack sound structure, identified as low volume areas (LVNodes). LVNodes denote directional conviction and ought to offer support on any test.
If participants were to auction and find acceptance into areas of prior low volume (LVNodes), then future discovery ought to be volatile and quick as participants look to HVNodes for favorable entry or exit.
POCs: POCs are valuable as they denote areas where two-sided trade was most prevalent in a prior day session. Participants will respond to future tests of value as they offer favorable entry and exit.
MCPOCs: POCs are valuable as they denote areas where two-sided trade was most prevalent over numerous day sessions. Participants will respond to future tests of value as they offer favorable entry and exit.
Volume-Weighted Average Prices (VWAPs): A metric highly regarded by chief investment officers, among other participants, for quality of trade. Additionally, liquidity algorithms are benchmarked and programmed to buy and sell around VWAPs.
About
After years of self-education, strategy development, mentorship, and trial-and-error, Renato Leonard Capelj began trading full-time and founded Physik Invest to detail his methods, research, and performance in the markets.
Capelj also develops insights around impactful options market dynamics at SpotGamma and is a Benzinga reporter.
In no way should the materials herein be construed as advice. Derivatives carry a substantial risk of loss. All content is for informational purposes only.
Editor’s Note: The Daily Brief is a free glimpse into the prevailing fundamental and technical drivers of U.S. equity market products. Join the 200+ that read this report daily, below!
Overnight, equity index futures auctioned lower in light of an escalation of geopolitical tensions between Russia, Ukraine, and the rest of the world.
Western powers imposed harsh sanctions including the exclusion of some Russian lenders from the SWIFT messaging system “that underpins trillions of dollars worth of transactions,” globally.
As the Russian ruble lost ⅓ of its value and costs of insuring Russian government debt rose, the Bank of Russia (BoR) doubled its key interest rate to 20% and imposed some capital controls to take from the risk of a potential run on banks. Policymakers also banned foreign security sales.
The odds of an aggressive lift-off in interest rates by the Federal Reserve declined, accordingly. The market is now pricing in under six hikes for 2022 as crisis opens room for policy mistakes.
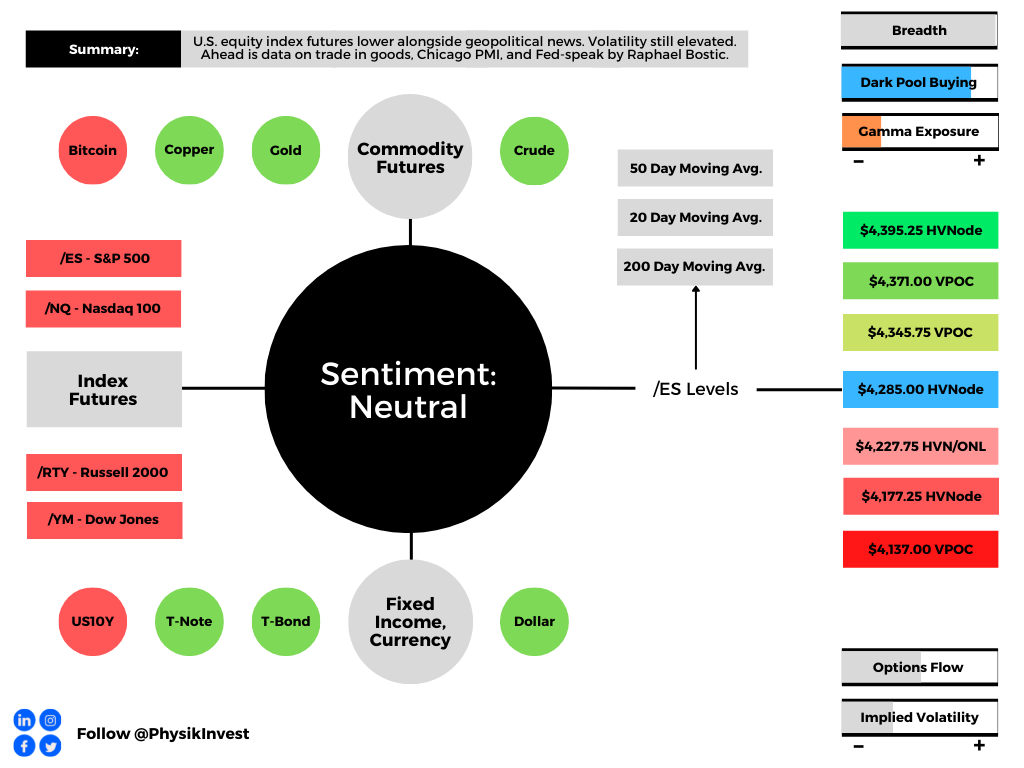
Ahead is data on trade in goods (8:30 AM ET), Chicago PMI (9:45 AM ET), and Fed-speak by Atlanta Fed President Raphael Bostic (10:30 AM ET).
Graphic updated 6:30 AM ET. Sentiment Neutral if expected /ES open is inside of the prior day’s range. /ES levels are derived from the profile graphic at the bottom of the following section. Levels may have changed since initially quoted; click here for the latest levels. SqueezeMetrics Dark Pool Index (DIX) and Gamma (GEX) calculations are based on where the prior day’s reading falls with respect to the MAX and MIN of all occurrences available. A higher DIX is bullish. At the same time, the lower the GEX, the more (expected) volatility. Learn the implications of volatility, direction, and moneyness. SHIFT data used for S&P 500 (INDEX: SPX) options activity. Note that options flow is sorted by the call premium spent; if more positive, then more was spent on call options. Breadth reflects a reading of the prior day’s NYSE Advance/Decline indicator. VIX reflects a current reading of the CBOE Volatility Index (INDEX: VIX) from 0-100.
What To Expect
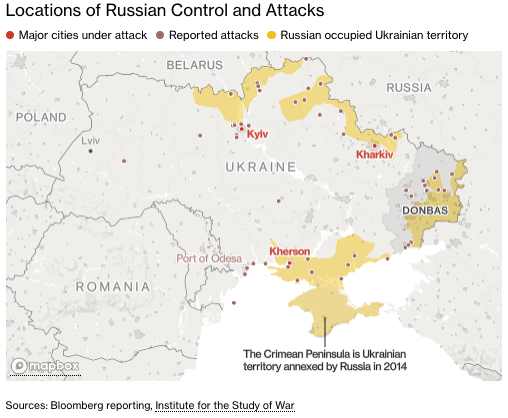
Fundamental: As of February 27, 2022, there are reports that with its invasion of Ukraine, “Moscow was frustrated by the slow progress caused by an unexpectedly strong Ukrainian defense and failure to achieve complete air dominance.”
Graphic: Via Bloomberg, locations of Russian controls and attacks.
At present, Russia has only committed 50% of its available firepower to the war and solicited the involvement of neighboring allies. Still, even at 50%, it’s rough.
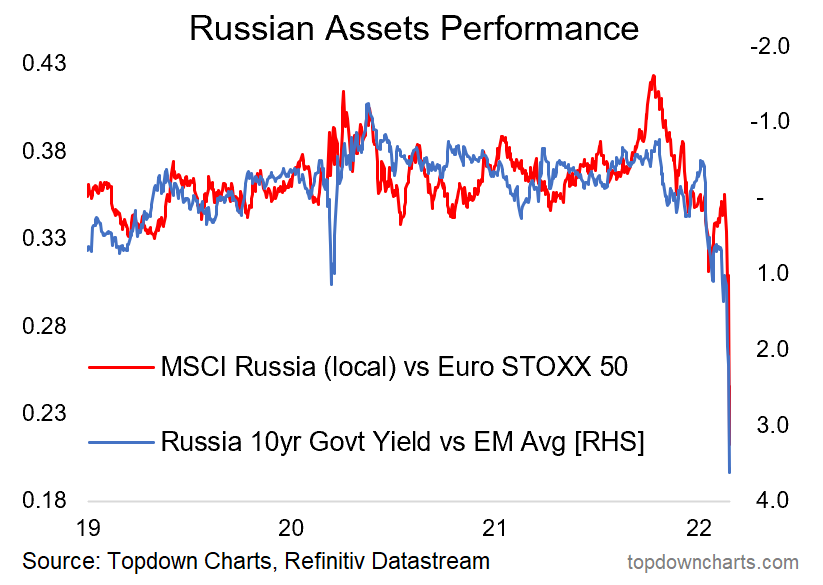
Russian markets, to put it simply, are in turmoil as a result of this conflict. Its policymakers, to stem the bleed, have banned foreigners from selling assets.
Graphic: Via Topdown Charts, Russian assets are imploding.
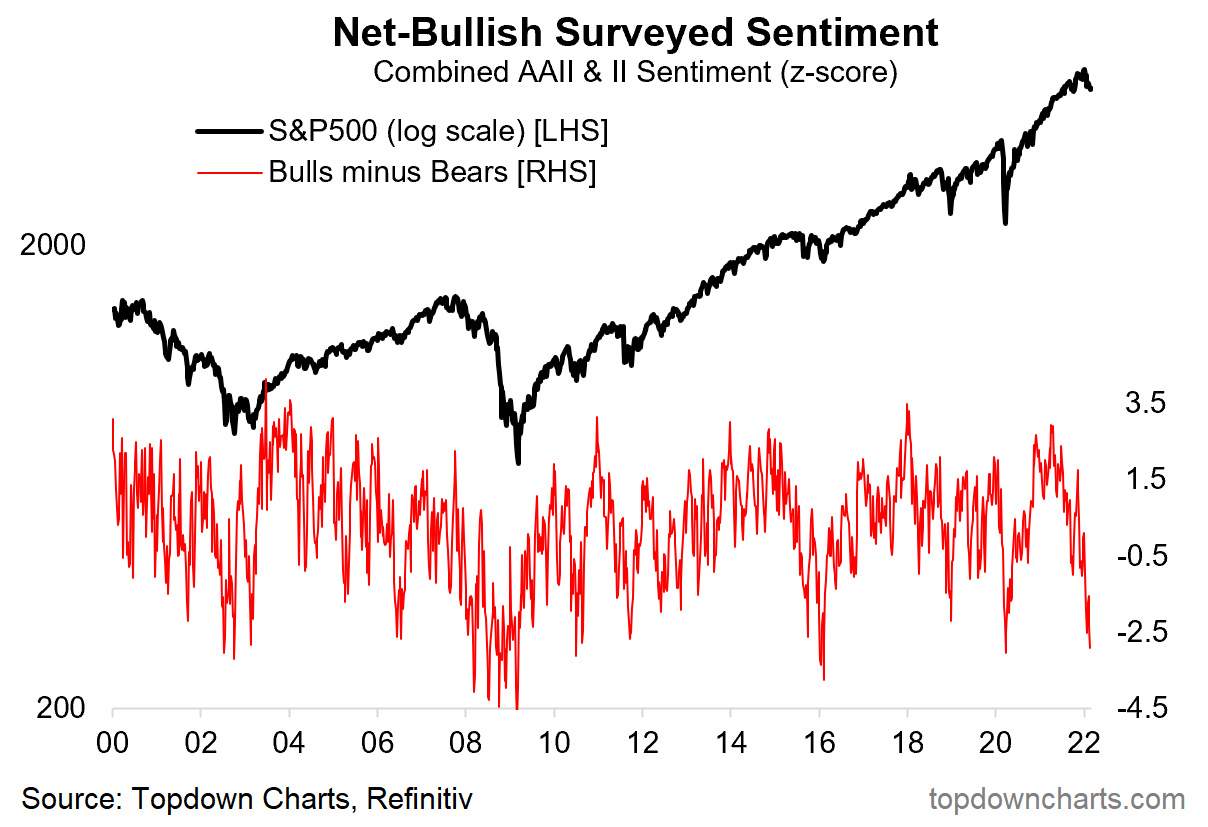
Accordingly, sentiment is as bad as it was in 2020, 2016, the period spanning 2008-2009, as well as the period just after the topping of the tech-and-telecom bubble.
Graphic: Via Topdown Charts, “sentiment basically as bad as the COVID crash.”
In light of the world’s response to this conflict, Russia, too, has heightened its nuclear readiness.
Russian state TV has reportedly said:
“Our submarines alone can launch more than 500 nuclear warheads, which guarantees the destruction of the US and NATO for good measure. The principle is: why do we need the world if Russia won’t be in it?”
Moreover, over the weekend, Credit Suisse Group AG’s (NYSE: CS) Zoltan Pozsar, in gauging the implications of conflict and sanctions, explained that excluding Russia from SWIFT may lead to missed payments and overdrafts similar to that experienced during March of 2020.
“Banks’ inability to make payments due to their exclusion from SWIFT is the same as Lehman’s inability to make payments due to its clearing bank’s unwillingness to send payments on its behalf,” he noted.
“The consequence of excluding banks from SWIFT is real, and so is the need for central banks to re-activate daily U.S. dollar funds supplying operations.”
In light of this, some have advanced a narrative around a potential run on Russian banks.
The Moscow bank run: a queue for a Tinkoff ATM in the Liga shopping center in Khimki. There are about 70 people in line. Eyewitnesses say the money in the ATM runs out within 40 minutes. @bazabazonpic.twitter.com/MTMkEiCRHJ
However, former BoR official Sergey Aleksashenko, in an alarmed yet less pessimistic take on CNBC, suggested a “low likelihood” of a run on the ruble.
Further, in light of the deceleration at home in the U.S., Pozsar concludes that “the Fed’s balance sheet might expand again before it contracts via QT (quantitative tightening).”
Graphic: Alfonso Peccatiello of The Macro Compass. He says “YTD: 2022 hikes priced in up from 3 to 6-7. Curves big-time flatter. Inflation expectations 10 bps lower. Real yields higher 40-50 bps. Credit spreads wider. Cyclical growth impulse fading away. Not a risk-on environment.”
Interactive Brokers Group Inc’s (NASDAQ: IBKR) Chief Strategist Steve Sosnick adds: “The tide of money is still positive, and it should provide a cushion for nervous markets as long as that remains the case. But when we consider that monetary conditions are supposed to be changing, volatility should persist if the monetary tide actually ebbs as expected.”
Perspectives: “Geopolitical catastrophes tend to be worse than believed in the short term but less than believed in the long term,” Ophir Gottlieb of Capital Market Laboratories notes.
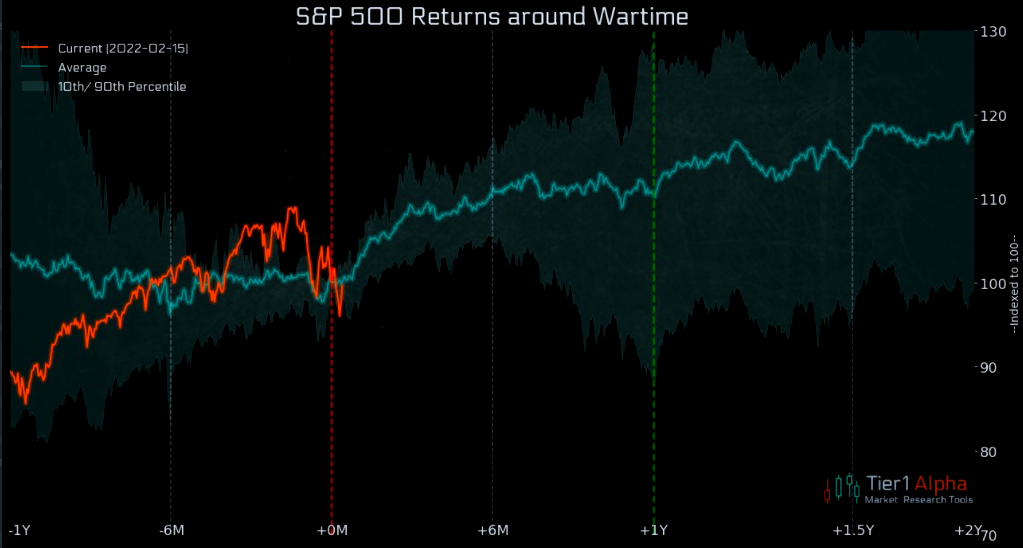
Similarly, JPMorgan Chase & Co’s (NYSE: JPM) head of global equity strategy Mislav Matejka says that “If one is selling on the back of the latest geopolitical developments now, the risk is of getting whipsawed.”
“Historically, [the] vast majority of military conflicts, especially if localized, did not tend to hurt investor confidence for too long, and would end up as buying opportunities.”
Adding, in light of the liquidation into last Thursday’s open (after which there was a large reversal), the VIX futures term structure, though in backwardation, was not as steep as in past moments of true panic.
IBKR’s Sosnick explains that “Even though VIX futures [were higher on Thursday morning] across the board and the curve has further steepened, neither the spot level nor the curve are yet demonstrating panic.”
“I interpret the message of the market to be that we should continue to expect volatility – remember that volatility encompasses moves in both directions – but not to expect that a major bottom was put into place in recent sessions.”
With realized volatility is heightened and implied volatility not performing, so to speak, @darjohn25 explains, try to avoid “any short gamma on all short-dated tenors—you want to own the short term stuff for the foreseeable future.”
Technical: As of 6:30 AM ET, Monday’s regular session (9:30 AM – 4:00 PM ET), in the S&P 500, will likely open in the middle part of a negatively skewed overnight inventory, inside of prior-range and -value, suggesting a limited potential for immediate directional opportunity.
Gap Scenarios Potentially In Play: Gaps ought to fill quickly. Should they not, that’s a signal of strength; do not fade. Leaving value behind on a gap-fill or failing to fill a gap (i.e., remaining outside of the prior session’s range) is a go-with indicator.

Auctioning and spending at least 1-hour of trade back in the prior range suggests a lack of conviction; in such a case, do not follow the direction of the most recent initiative activity.
In the best case, the S&P 500 trades higher; activity above the $4,285.50 high volume area (HVNode) puts in play the $4,345.75 untested point of control (VPOC). Initiative trade beyond the VPOC could reach as high as the $4,371.00 VPOC and $4,395.25 HVNode, or higher.
In the worst case, the S&P 500 trades lower; activity below the $4,285.50 HVNode puts in play the $4,227.75 HVNode and overnight low (ONL) area. Initiative trade beyond the HVNode/ONL could reach as low as the $4,177.25 HVNode and $4,137.00 VPOC, or lower.
Click here to load today’s key levels into the web-based TradingView charting platform. Note that all levels are derived using the 65-minute timeframe. New links are produced, daily.
Graphic: 65-minute profile chart of the Micro E-mini S&P 500 Futures.
What People Are Saying
As a young market maker in the Eurodollar Options pit, I remember going into my first shit show like this and my boss advising me.
Overnight Rally Highs (Lows): Typically, there is a low historical probability associated with overnight rally-highs (lows) ending the upside (downside) discovery process.
Volume Areas: A structurally sound market will build on areas of high volume (HVNodes). Should the market trend for long periods of time, it will lack sound structure, identified as low volume areas (LVNodes). LVNodes denote directional conviction and ought to offer support on any test.
If participants were to auction and find acceptance into areas of prior low volume (LVNodes), then future discovery ought to be volatile and quick as participants look to HVNodes for favorable entry or exit.
POCs: POCs are valuable as they denote areas where two-sided trade was most prevalent in a prior day session. Participants will respond to future tests of value as they offer favorable entry and exit.
Excess: A proper end to price discovery; the market travels too far while advertising prices. Responsive, other-timeframe (OTF) participants aggressively enter the market, leaving tails or gaps which denote unfair prices.
Volume-Weighted Average Prices (VWAPs): A metric highly regarded by chief investment officers, among other participants, for quality of trade. Additionally, liquidity algorithms are benchmarked and programmed to buy and sell around VWAPs.
About
After years of self-education, strategy development, mentorship, and trial-and-error, Renato Leonard Capelj began trading full-time and founded Physik Invest to detail his methods, research, and performance in the markets.
Capelj is also a Benzinga finance and technology reporter interviewing the likes of Shark Tank’s Kevin O’Leary, JC2 Ventures’ John Chambers, FTX’s Sam Bankman-Fried, and ARK Invest’s Catherine Wood, as well as a SpotGamma contributor developing insights around impactful options market dynamics.
Disclaimer
Physik Invest does not carry the right to provide advice.
In no way should the materials herein be construed as advice. Derivatives carry a substantial risk of loss. All content is for informational purposes only.
Editor’s Note: The Daily Brief is a free glimpse into the prevailing fundamental and technical drivers of U.S. equity market products. Join the 200+ that read this report daily, below!
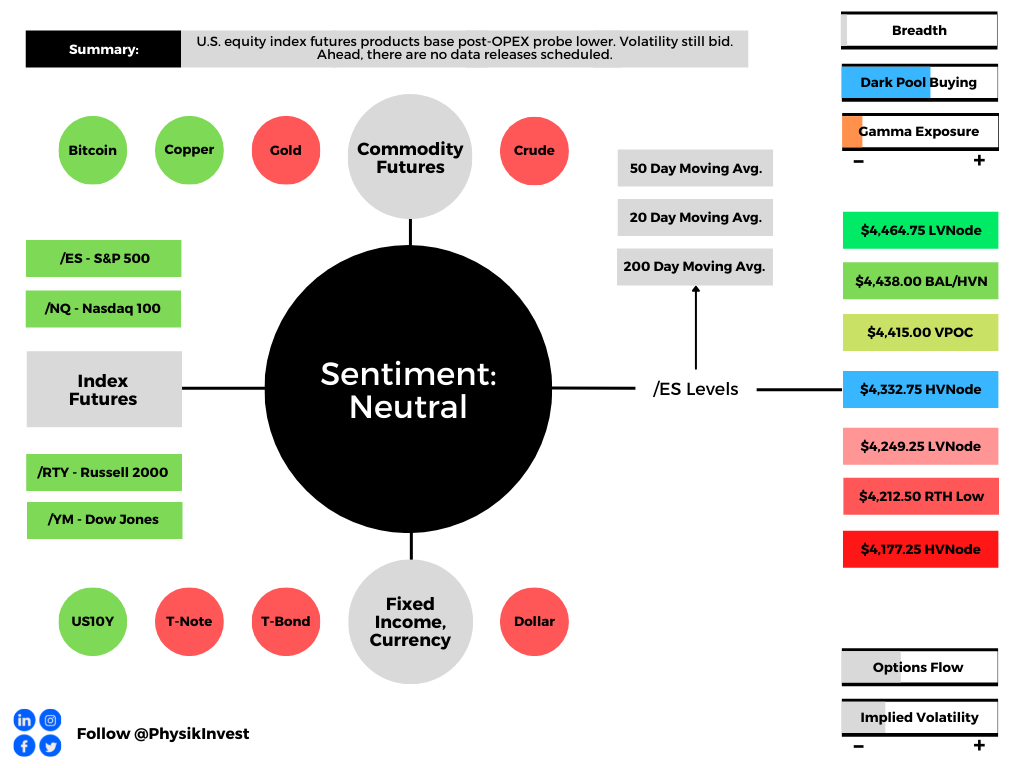
Overnight, equity index futures traded sideways to higher after Monday’s post-options expiration (OPEX) probe lower. Ahead, there are no data releases scheduled.
Graphic updated 6:15 AM ET. Sentiment Neutral if expected /ES open is inside of the prior day’s range. /ES levels are derived from the profile graphic at the bottom of the following section. Levels may have changed since initially quoted; click here for the latest levels. SqueezeMetrics Dark Pool Index (DIX) and Gamma (GEX) calculations are based on where the prior day’s reading falls with respect to the MAX and MIN of all occurrences available. A higher DIX is bullish. At the same time, the lower the GEX, the more (expected) volatility. Learn the implications of volatility, direction, and moneyness. SHIFT data used for S&P 500 (INDEX: SPX) options activity. Note that options flow is sorted by the call premium spent; if more positive, then more was spent on call options. Breadth reflects a reading of the prior day’s NYSE Advance/Decline indicator. VIX reflects a current reading of the CBOE Volatility Index (INDEX: VIX) from 0-100.
What To Expect
Fundamental: At what point are monetary tightening and geopolitical tensions priced in?
According to some strategists, such as JPMorgan Chase & Co’s (NYSE: JPM) Marko Kolanovic, the sell-off is overdone and, if anything, Ukraine tensions “would likely prompt a dovish reassessment.”
“Short-term rates markets have likely moved too far vs. what CBs will ultimately deliver in hikes this year,” he adds. “We expect risky asset markets to rebound as they digest these risks and sentiment improves, aided by inflows from systematic investors and corporate buybacks.”
In the worst case, though, pursuant to notes by peers in the industry, Kolanovic nods to the fact that if selling were to continue, there would likely be a point the would Fed reassess tightening.
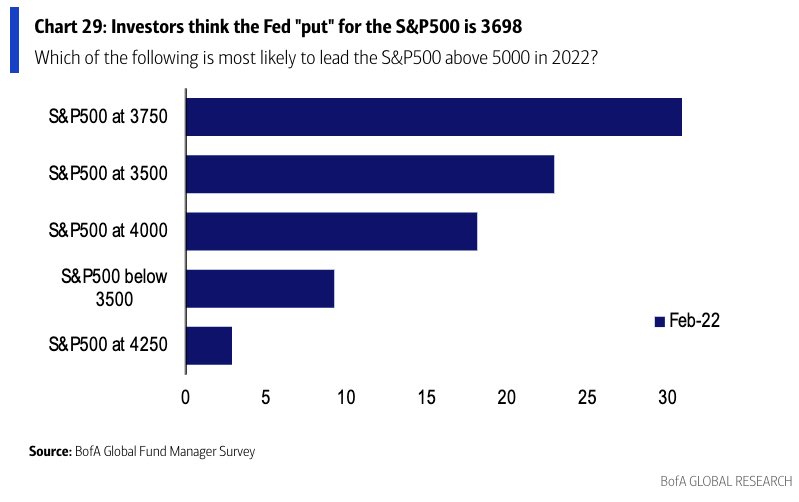
Basically, in the worst case, there is the potential that further selling invokes the so-called “Fed put,” which is about 15% below current prices.
“[R]isk is being repriced to fit the world where real rates are a lot higher, and the Fed put (is) much lower thanks to the Fed’s need to fight inflation,” says rates strategist Rishi Mishra.
Graphic: Via Bank of America Corporation (NYSE: BAC). Retrieved from Callum Thomas.
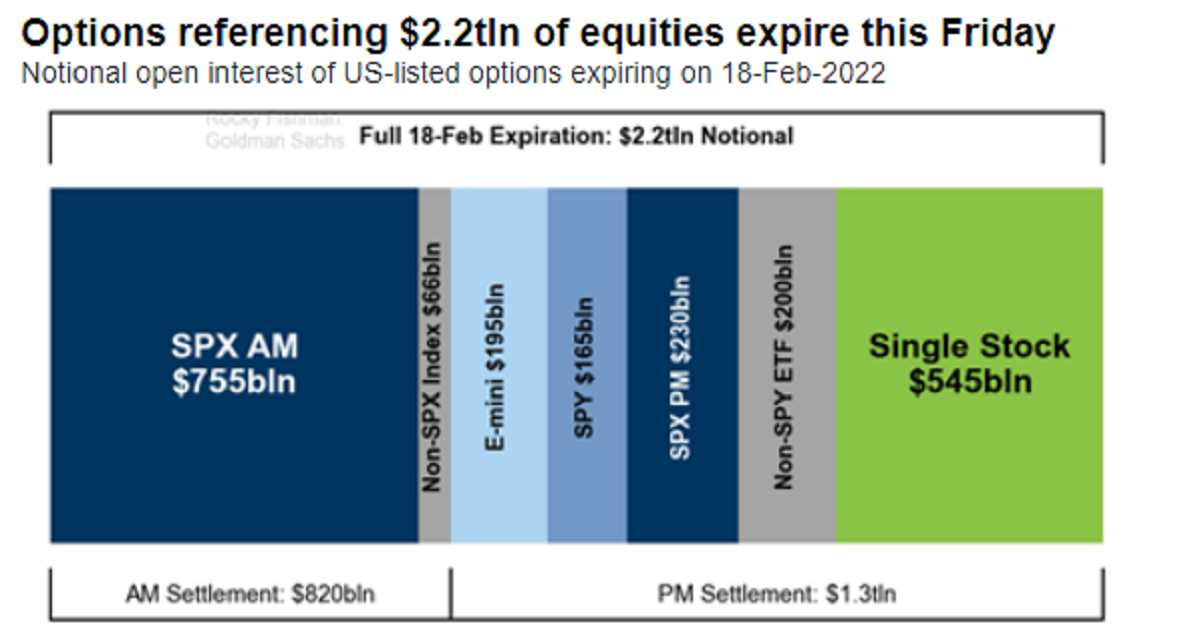
Positioning: Markets stabilize after last week’s large monthly options expiration (OPEX).
Graphic: Via Goldman Sachs Group Inc (NYSE: GS). Taken from Bloomberg.
Per Bloomberg, that event saw the roll-off of nearly $2.2 trillion in options. In the past, this event had bullish implications (i.e., markets rose into OPEX). That is not the case, really, any longer.
It is participants’ increased awareness of the implications of options and OPEX has resulted in a front running; according to SqueezeMetrics, “People didn’t know about the OpEx week effect (in this case, largely charm). Now everyone and their mother knows about it.”
For context, charm is a measure of an options delta’s change with respect to the passage of time. As time passes, delta “bleeds” as options decay.
As most participants, at least at the index level, own protection, the counterparties to this trade are short protection. These counterparties, therefore, have positive exposure to delta (i.e., as index falls [rises], position loses [makes] money) and negative exposure to gamma, or delta (directional) sensitivity to underlying price changes (i.e., as the index moves against short option exposure, losses are multiplied).
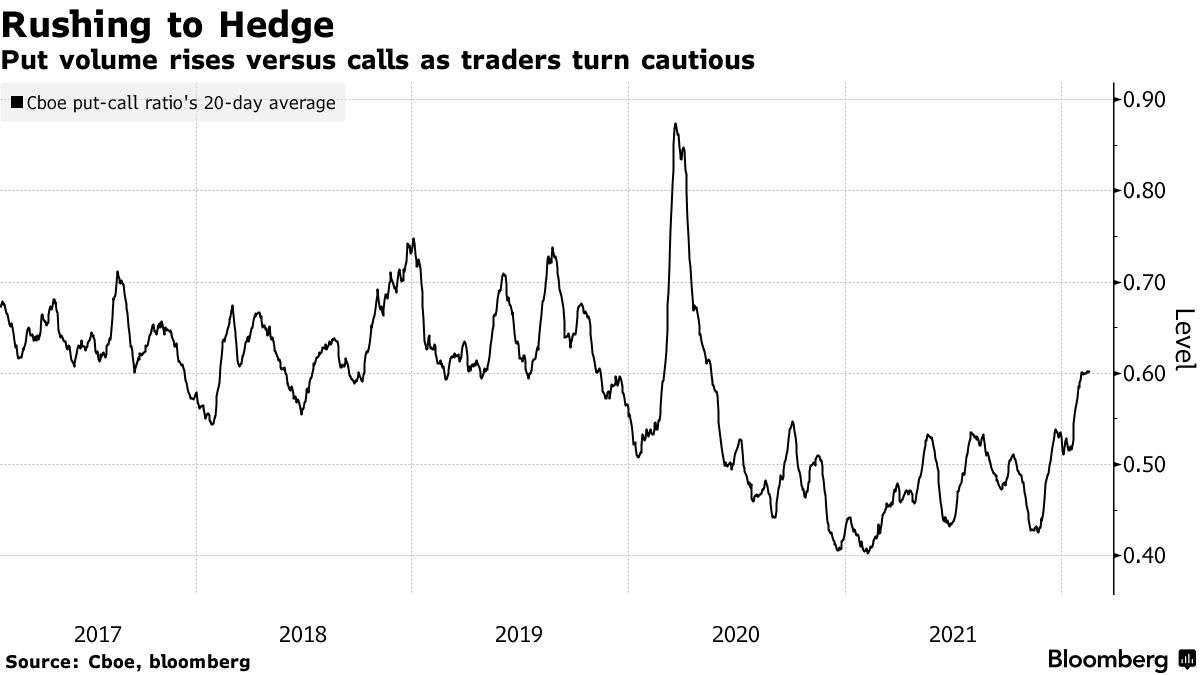
Moreover, given the growth of options volumes, participants’ heavy demand for protection matters more, to put simply. Counterparties, in light of this recent drop, pressured markets with their hedging. The decay (and eventual expiry) of this protection marks options deltas down.
Graphic: Rising put volumes coincide with early 2022 market sell-off.
To re-hedge, counterparties buy back short stock and futures hedges. This supportive action is what has been front-run; the bullishness of the event happens days and weeks prior.
The unwind of these hedges now, as seen Friday-Tuesday, often culminates in a post-OPEX low. That “means chase-y accelerant flows from dealer hedging into moves and creating overshoots in both directions,” Nomura Holdings Inc’s (NYSE: NMR) Charlie McElligott wrote.
Taken together, according to SpotGamma, though “post-OPEX, the removal of linear short (-delta) hedges [to put-heavy exposures] may further bolster attempts higher, … [t]he removal of downside (put) protection may also open the door for weakness in a case where some outside (fundamental) event solicits real-money selling and a new demand for protection.”
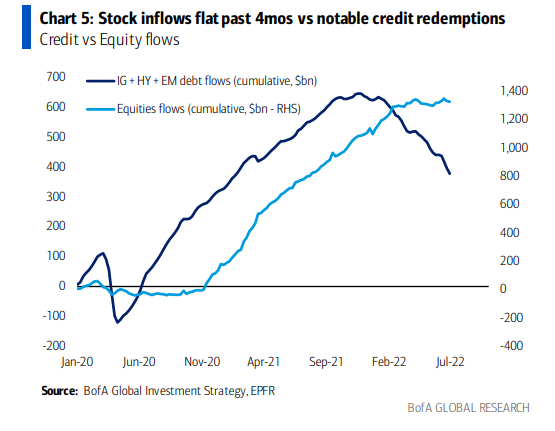
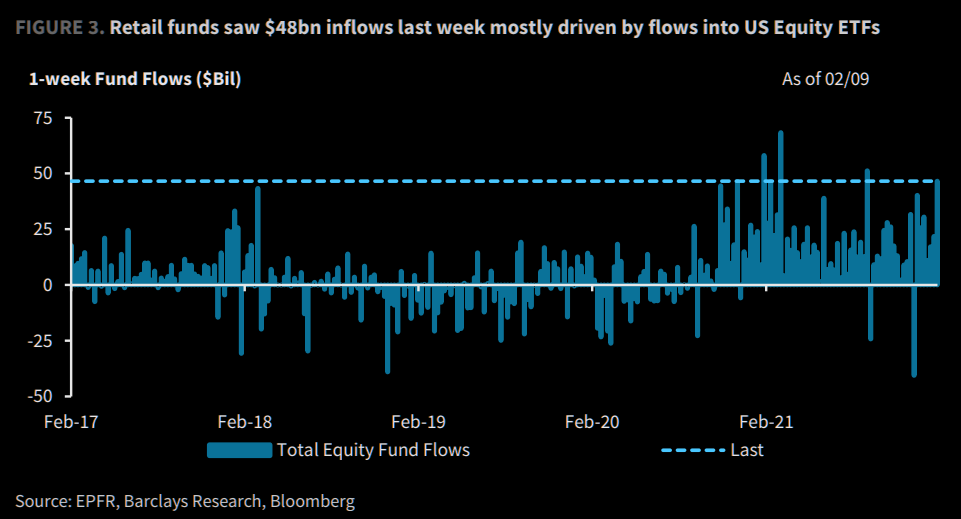
Graphic: Via EPFR, Barclays, and Bloomberg. Taken from The Market Ear.
“The market looks fairly well hedged and it’s why up until today we’ve had little follow-through on the downside despite negative headlines,” Danny Kirsch, head of options at Piper Sandler Companies (NYSE: PIPR), said in an interview.
“We’ll see if things open up after the February expiry.”
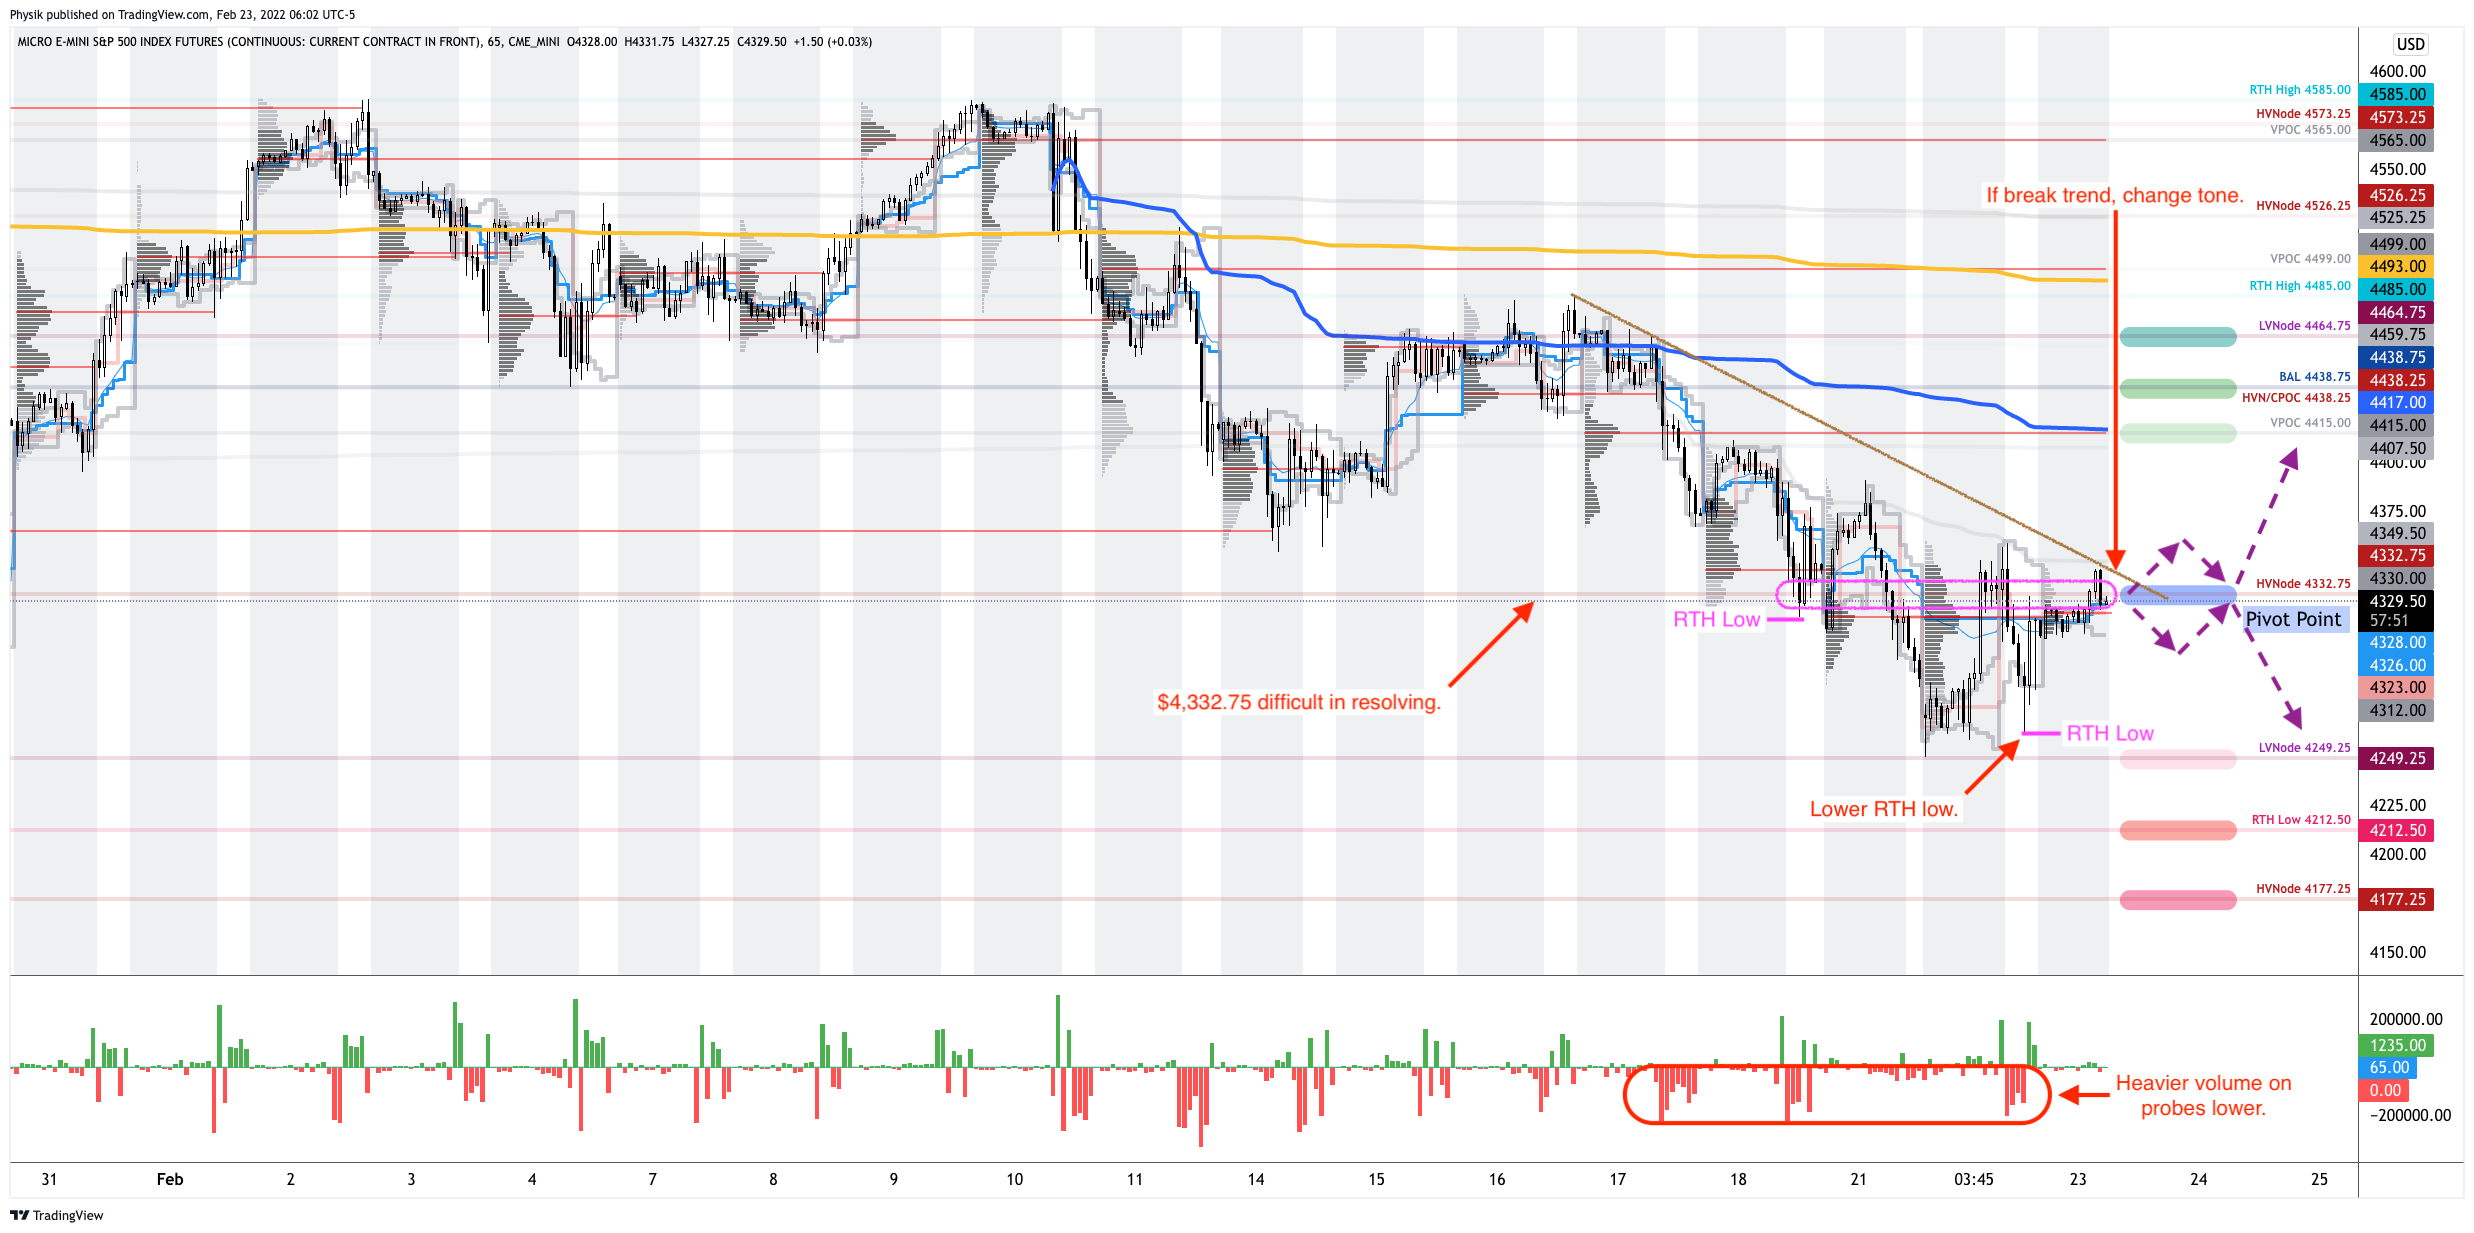
Technical: As of 6:30 AM ET, Wednesday’s regular session (9:30 AM – 4:00 PM ET), in the S&P 500, will likely open in the upper part of its overnight inventory, inside of prior-range and -value, suggesting a limited potential for immediate directional opportunity.
In the best case, the S&P 500 trades higher; activity above the $4,332.75 high volume area (HVNode) puts in play the $4,415.00 untested point of control (VPOC). Initiative trade beyond the VPOC could reach as high as the $4,438.00 key response area and $4,464.00 low volume area (LVNode), or higher.
In the worst case, the S&P 500 trades lower; activity below the $4,332.75 HVNode puts in play the $4,249.00 LVNode. Initiative trade beyond the LVNode could reach as low as the $4,212.50 regular trade low (RTH Low) and $4,177.25 HVNode, or lower.
Click here to load today’s key levels into the web-based TradingView charting platform. Note that all levels are derived using the 65-minute timeframe. New links are produced, daily.
Graphic: 65-minute profile chart of the Micro E-mini S&P 500 Futures.
What People Are Saying
Seriously, guys.
The ''bad news = good news'' narrative for markets doesn't work if the Fed is tightening amidst a slowdown and a military escalation risk.
Volume Areas: A structurally sound market will build on areas of high volume (HVNodes). Should the market trend for long periods of time, it will lack sound structure, identified as low volume areas (LVNodes). LVNodes denote directional conviction and ought to offer support on any test.
If participants were to auction and find acceptance into areas of prior low volume (LVNodes), then future discovery ought to be volatile and quick as participants look to HVNodes for favorable entry or exit.
Liquidation Breaks: The profile shape suggests participants were “too” long and had poor
Vanna: The rate at which the delta of an option changes with respect to volatility.
Charm: The rate at which the delta of an option changes with respect to time.
Options: If an option buyer was short (long) stock, he or she would buy a call (put) to hedge upside (downside) exposure. Option buyers can also use options as an efficient way to gain directional exposure.
POCs: POCs are valuable as they denote areas where two-sided trade was most prevalent in a prior day session. Participants will respond to future tests of value as they offer favorable entry and exit.
About
After years of self-education, strategy development, mentorship, and trial-and-error, Renato Leonard Capelj began trading full-time and founded Physik Invest to detail his methods, research, and performance in the markets.
Capelj is also a Benzinga finance and technology reporter interviewing the likes of Shark Tank’s Kevin O’Leary, JC2 Ventures’ John Chambers, FTX’s Sam Bankman-Fried, and ARK Invest’s Catherine Wood, as well as a SpotGamma contributor developing insights around impactful options market dynamics.
Disclaimer
Physik Invest does not carry the right to provide advice.
In no way should the materials herein be construed as advice. Derivatives carry a substantial risk of loss. All content is for informational purposes only.
Editor’s Note: The Daily Brief is a free glimpse into the prevailing fundamental and technical drivers of U.S. equity market products. Join the 200+ that read this report daily, below!
Overnight, equity index futures broke the confines of tight consolidation.
As stated some commentaries ago, the odds pointed to a continued counter-trend rally; volatility compression, coupled with metrics that point to buying support, was to bolster follow-through.
Ahead is data on Wholesale Inventories (10:00 AM ET), as well as Fed-speak by Governor Michelle Bowman (10:30 AM ET) and President Loretta Mester (12:00 PM ET).
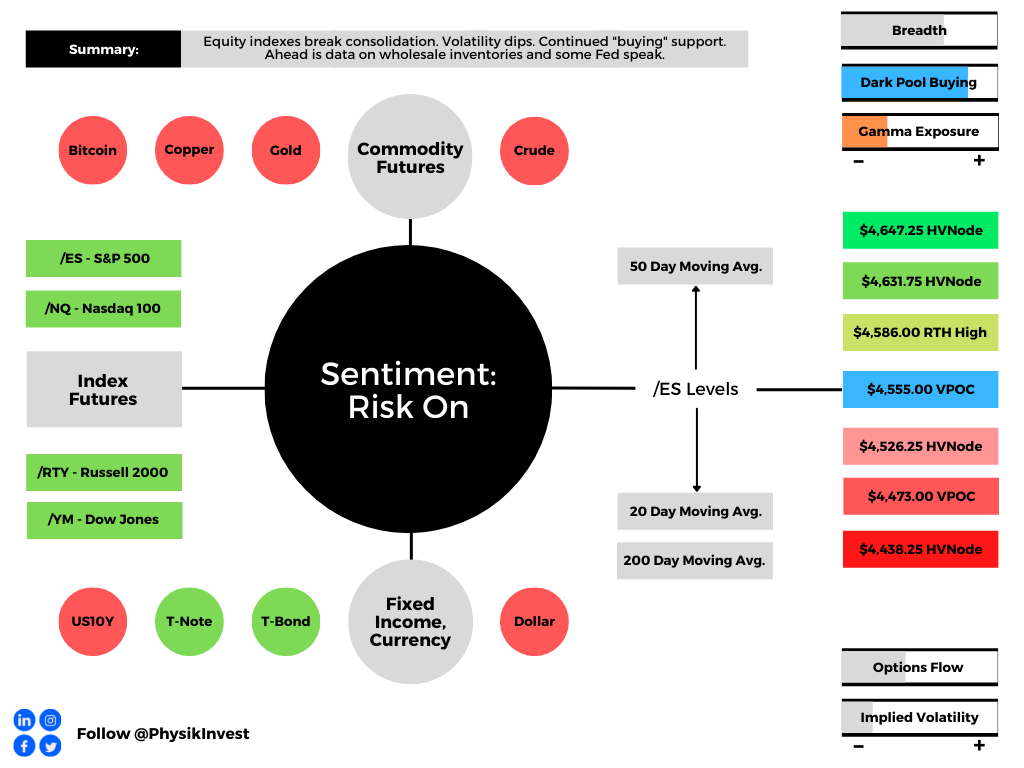
Graphic updated 6:30 AM ET. Sentiment Risk-On if expected /ES open is above the prior day’s range. /ES levels are derived from the profile graphic at the bottom of the following section. Levels may have changed since initially quoted; click here for the latest levels. SqueezeMetrics Dark Pool Index (DIX) and Gamma (GEX) calculations are based on where the prior day’s reading falls with respect to the MAX and MIN of all occurrences available. A higher DIX is bullish. At the same time, the lower the GEX, the more (expected) volatility. Learn the implications of volatility, direction, and moneyness. SHIFT data used for S&P 500 (INDEX: SPX) options activity. Note that options flow is sorted by the call premium spent; if more positive, then more was spent on call options. Breadth reflects a reading of the prior day’s NYSE Advance/Decline indicator. VIX reflects a current reading of the CBOE Volatility Index (INDEX: VIX) from 0-100.
What To Expect
Fundamental: Equity indices resolve higher in the face of hawkishness from the Federal Reserve (Fed) and data showing slowing growth at home and abroad.
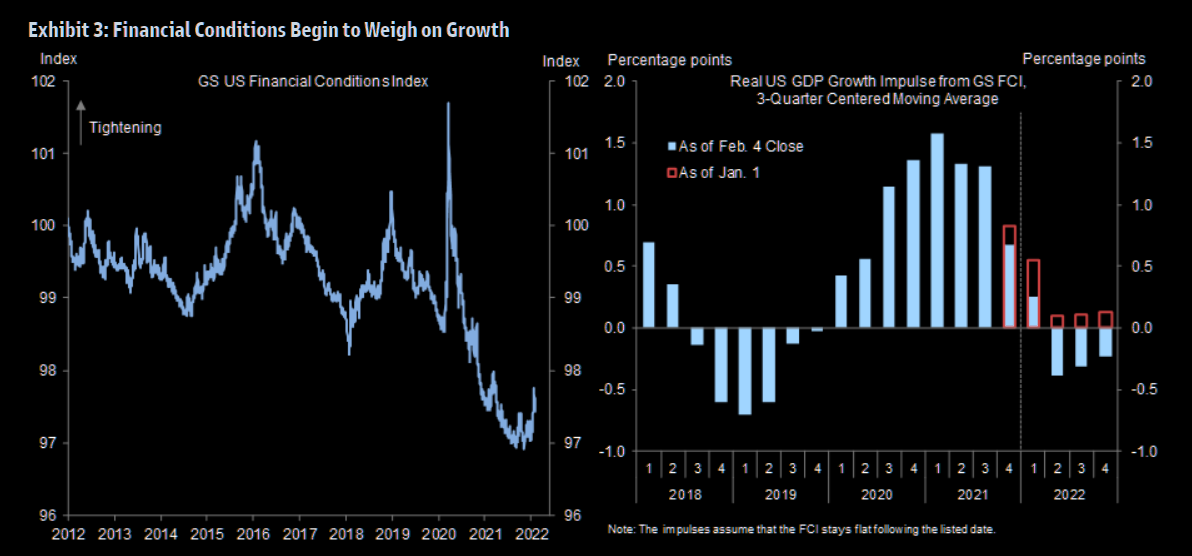
“Fiscal policy is turning more restrictive, the Q4 inventory boost is now behind us, and the financial conditions impulse will go from sharply positive in 2021 to (at least) modestly negative in 2022,” Goldman Sachs Group Inc (NYSE: GS) strategists explain.
“For these reasons, our 2022 GDP forecast of 2¼% on a Q4/Q4 basis is 0.8pp below the latest Bloomberg consensus and 1.8pp below the FOMC’s last published forecast (as of the December meeting).”
Graphic: Via Goldman Sachs. Retrieved through The Market Ear.
At the same time, according to Moody’s Corporation (NYSE: MCO), the Fed has not pushed “against market expectations for three to four rate hikes this year.”
Instead, Chair Jerome Powell “signaled the central bank will have zero tolerance for any upside surprises in inflation.”
To note, though, the consensus expectation – five rate hikes or more – is ahead of itself, according to Andreas Steno Larsen of Heimstaden.
“Direct transfers and fiscal deficits are behind the current inflation spikes,” he explains. “If they were the root causes of inflation, they will also turn into the root causes of disinflation again during H2-2022.”
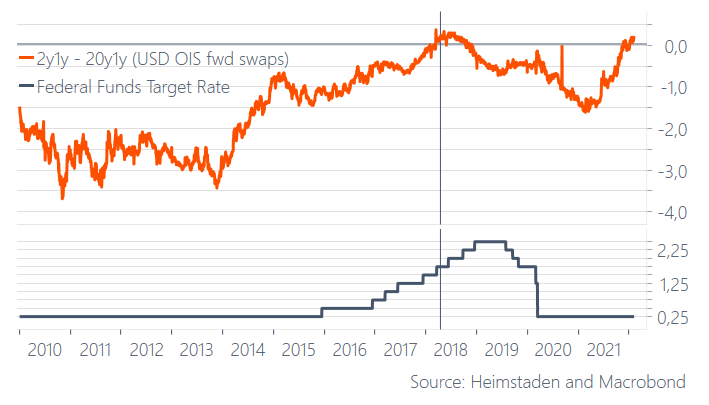
Steno Larsen adds that the 20y1y and 2y1y curve is inverted, “as it was when the 2015-2018 hiking cycle was very mature,” and only three hikes occurred after inversion.
Graphic: “Good luck hiking 6-7 times this year, … 3-4 max,” via Steno Larsen.
The net effect, according to Steno Larsen, is that long bond yields will likely not rise over the next quarters; rate-sensitive technology and innovation products may rebound while cyclical assets may suffer.
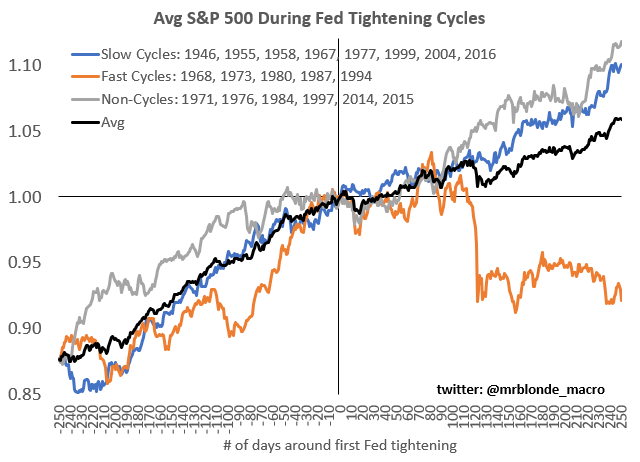
In line with the above comments is the average S&P 500 trend into Fed tightening cycles.
Graphic: Retrieved from Callum Thomas’ Weekly S&P 500 ChartStorm newsletter.
Positioning: Ranges compressed as participants committed capital to bets on lower volatility.
Such bets (expressed via the selling of protection on both sides of the market) left counterparties warehousing the other side (long puts and calls).
In hedging this exposure on a move higher, the counterparties increased +delta exposure is offset via the addition in -delta (sell futures).
In hedging this exposure on a move lower, the counterparties increased -delta exposure is offset via the addition of +delta (buy futures).
Huge record "retail" put buying? Sort of.
Net put buying vs selling you get a different picture (orange)
Last week was the most net put buying since Mar '20 – but as you can see retail tends to be put sellers
Moreover, as (1) participants continue to bet on lower ranges and (2) time and volatility trend to zero for the expiries most open interest is concentrated in, gamma, the sensitivity of options to changes in underlying price (delta) increases.
What that means is that counterparties’ near-the-money exposure to options delta rises and portends increased liquidity (e.g., the counterparty will buy futures into weakness and sell futures into strength).
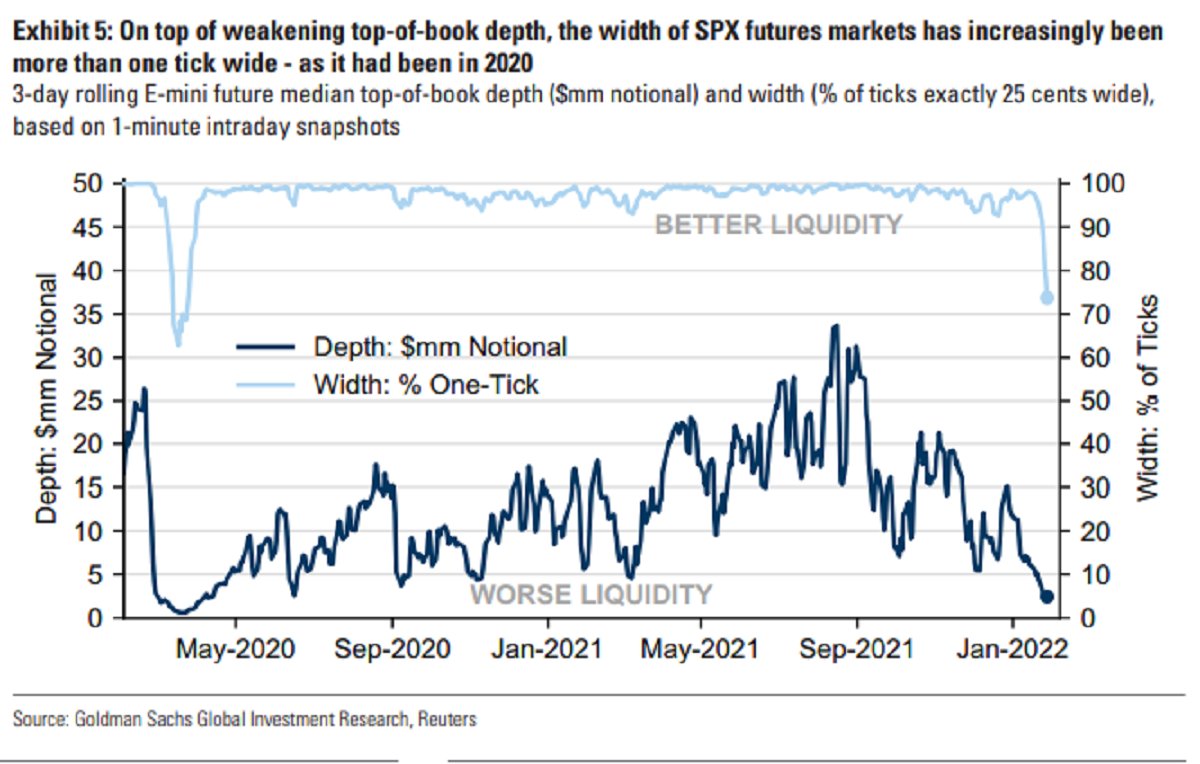
Given a lower liquidity environment, these hedging flows therefore have a bigger impact.
Graphic: Via SpotGamma, “gamma flows increasingly important in a lower liquidity environment. If the counterparty is taking on more exposure to positive gamma, then their addition of liquidity to hedge may suppress ranges.”
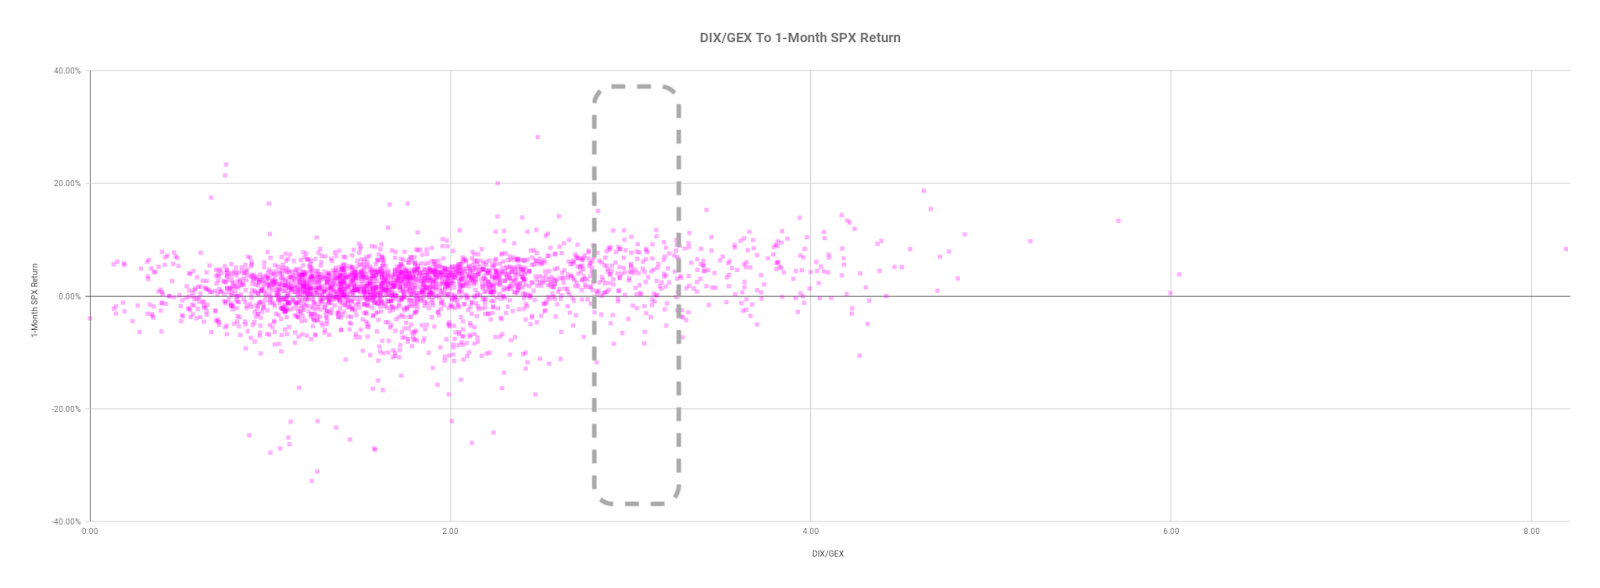
The resolve of this consolidation, coupled with decaying out-of-the-money protection and supportive hedging flows with respect to time (charm) and volatility (vanna), and buying proxies, point to “[m]odest bullishness on the 1-month timeframe.”
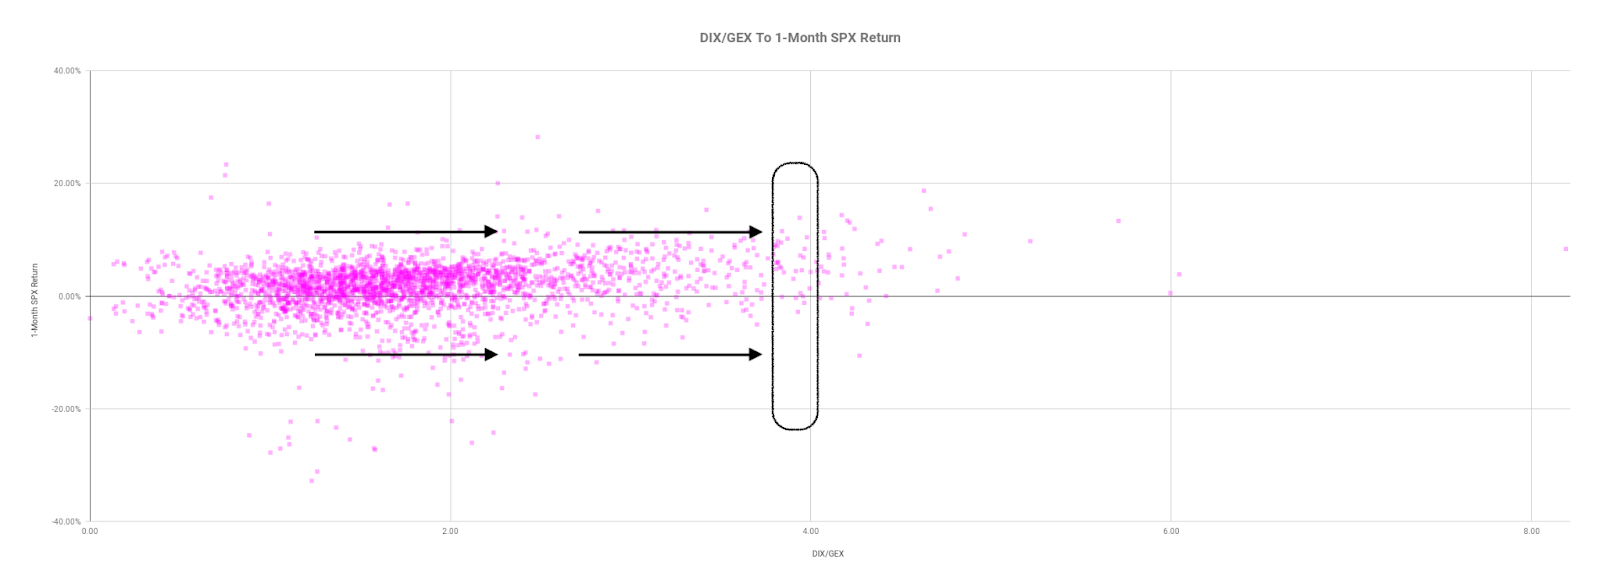
Graphic: Data via SqueezeMetrics. Graph via Physik Invest.
Technical: As of 6:30 AM ET, Wednesday’s regular session (9:30 AM – 4:00 PM ET), in the S&P 500, will likely open in the upper part of a positively skewed overnight inventory, outside of prior-range and -value, suggesting a potential for immediate directional opportunity.
Balance-Break + Gap Scenarios: A change in the market (i.e., the transition from two-time frame trade, or balance, to one-time frame trade, or trend) is occurring.

Monitor for acceptance (i.e., more than 1-hour of trade) outside of the balance area.

Leaving value behind on a gap-fill or failing to fill a gap (i.e., remaining outside of the prior session’s range) is a go-with indicator.

Rejection (i.e., return inside of balance) portends a move to the opposite end of the balance.
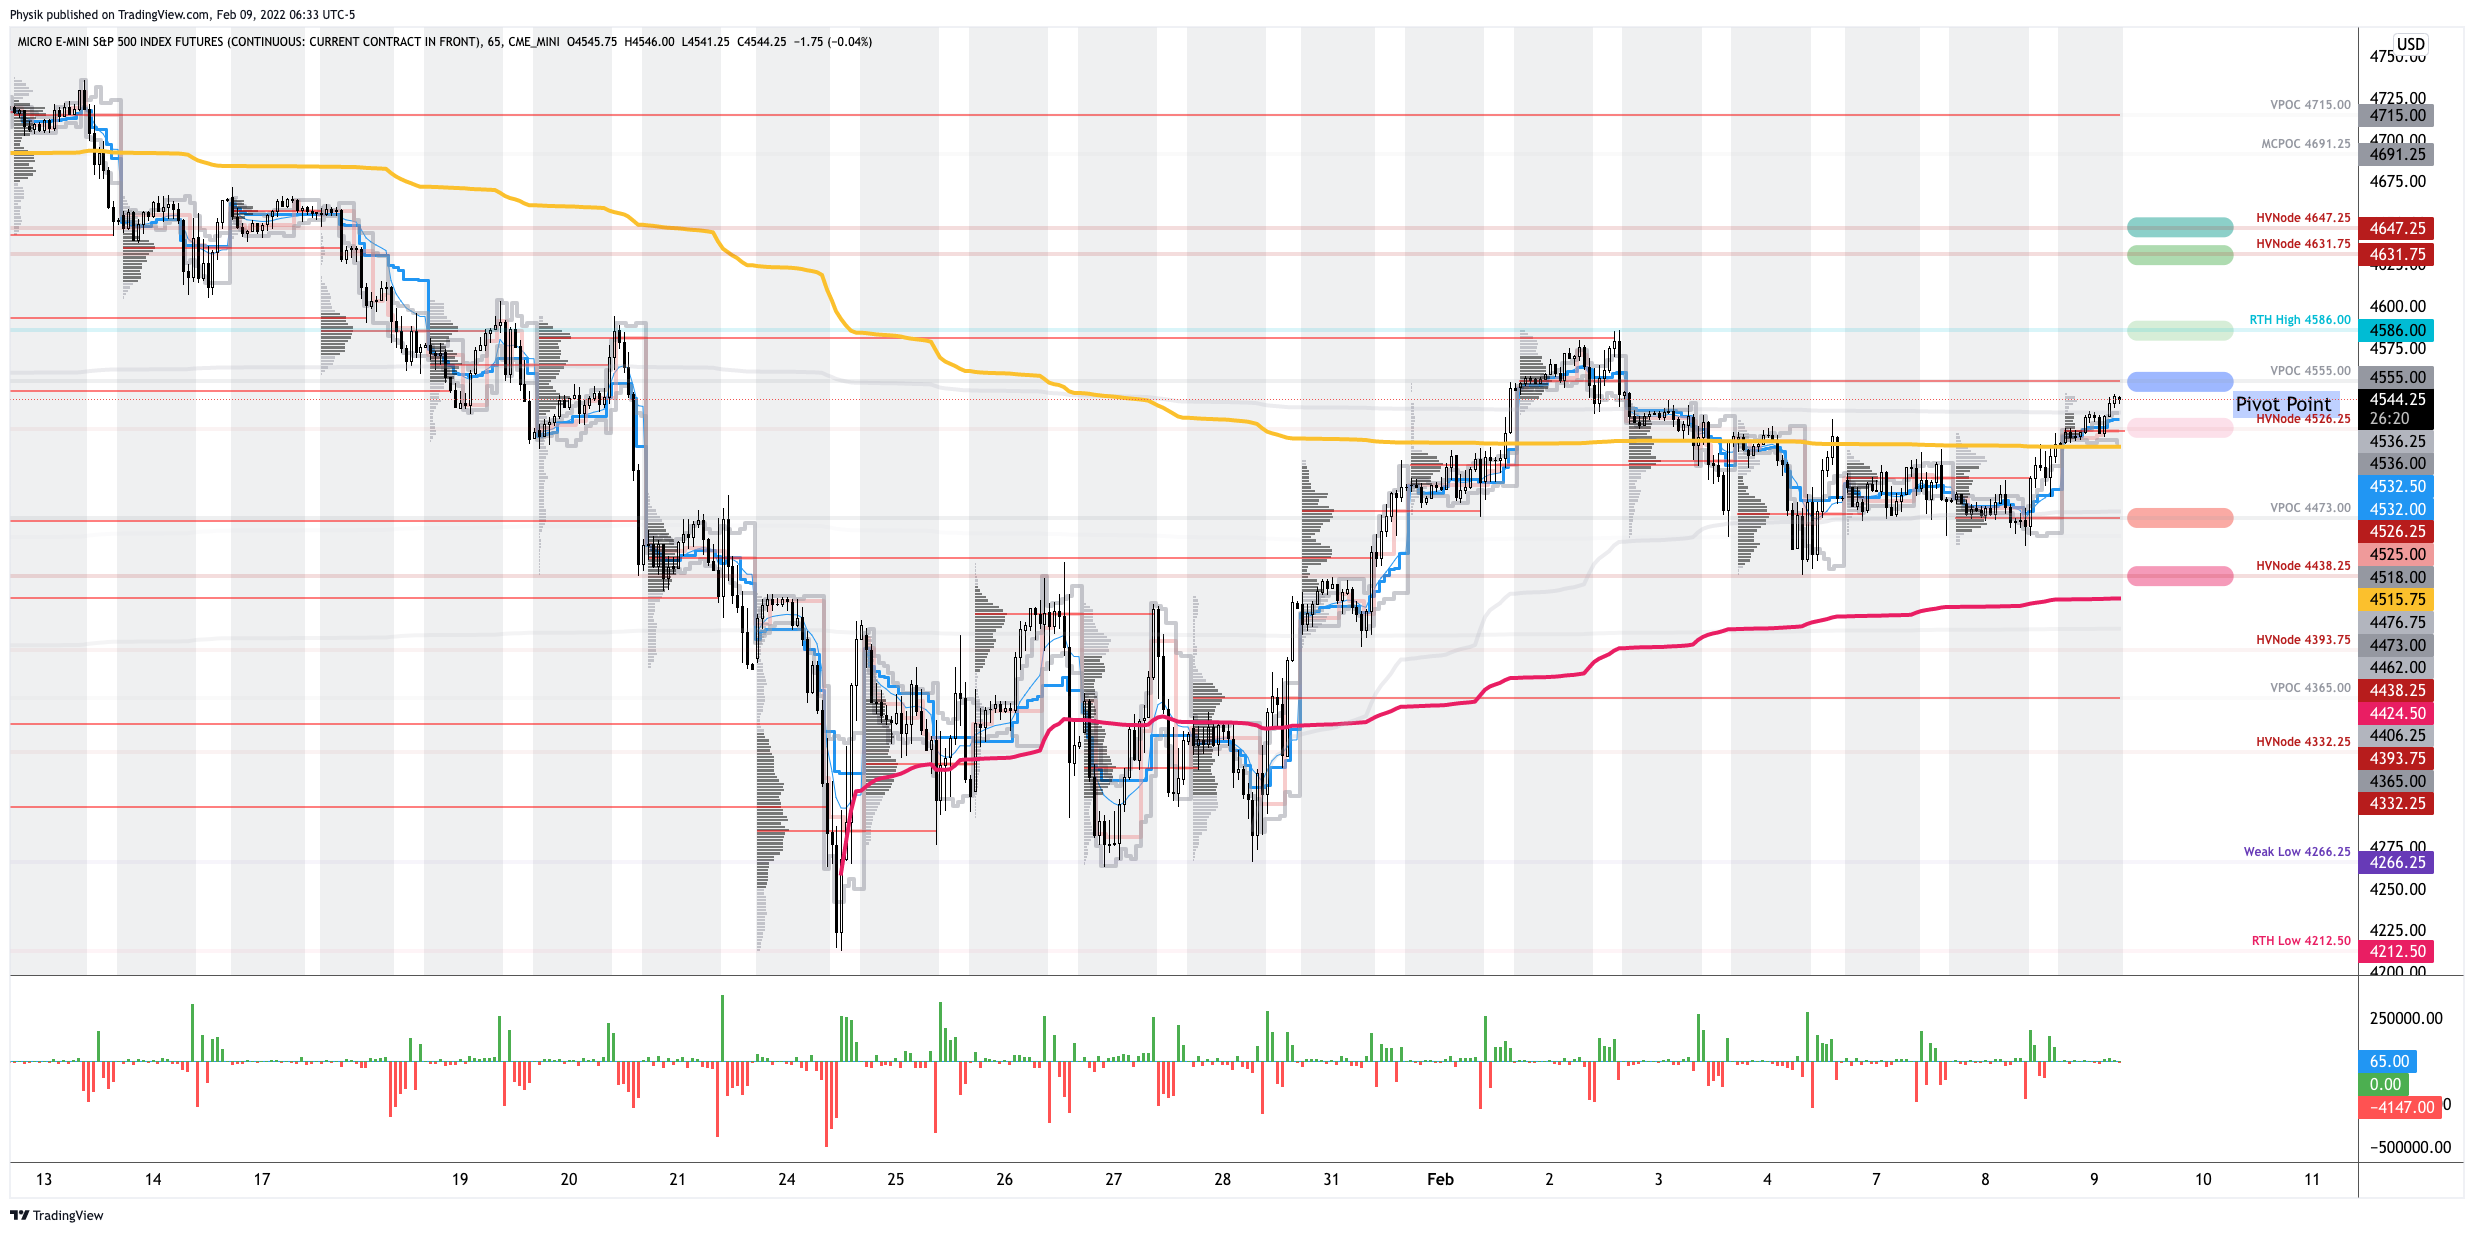
In the best case, the S&P 500 trades higher; activity above the $4,555.00 untested point of control (VPOC) puts in play the $4,586.00 regular trade high (RTH High). Initiative trade beyond the RTH High could reach as high as the $4,631.75 and $4,647.25 HVNode, or higher.
In the worst case, the S&P 500 trades lower; activity below the $4,555.00 VPOC puts in play the $4,526.25 HVNode. Initiative trade beyond the $4,526.25 HVNode could reach as low as the $4,473.00 VPOC and $4,438.25 HVNode, or lower.
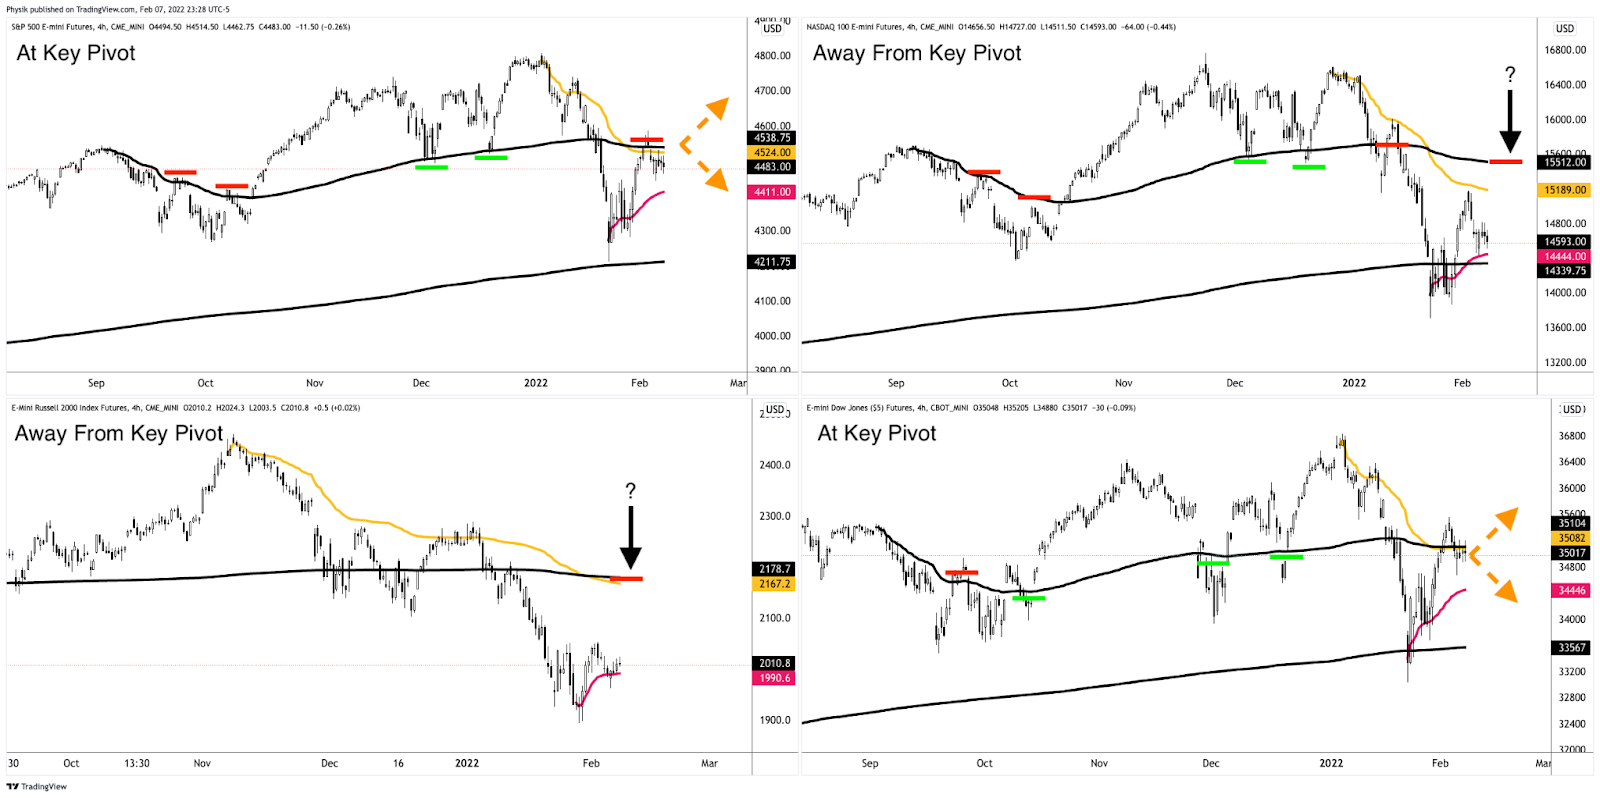
Consideration: All equity index products have resolved tight consolidation’s higher. The Nasdaq 100 and Russell 2000 are the furthest away from clear areas of resistance.
On the other hand, the S&P 500 and Dow Jones Industrial Average have little in the way of higher prices.
Graphic: Updated 2/8/2022. Anchored Volume Weighted Average Price (VWAP) analysis via Physik Invest. Notice Dow Jones Industrial Average (bottom right) and S&P 500 (top left) strength, as well as Nasdaq 100 (top right) and Russell 2000 (bottom left) weakness. Key pivots marked off.
Click here to load today’s key levels into the web-based TradingView charting platform. Note that all levels are derived using the 65-minute timeframe. New links are produced, daily.
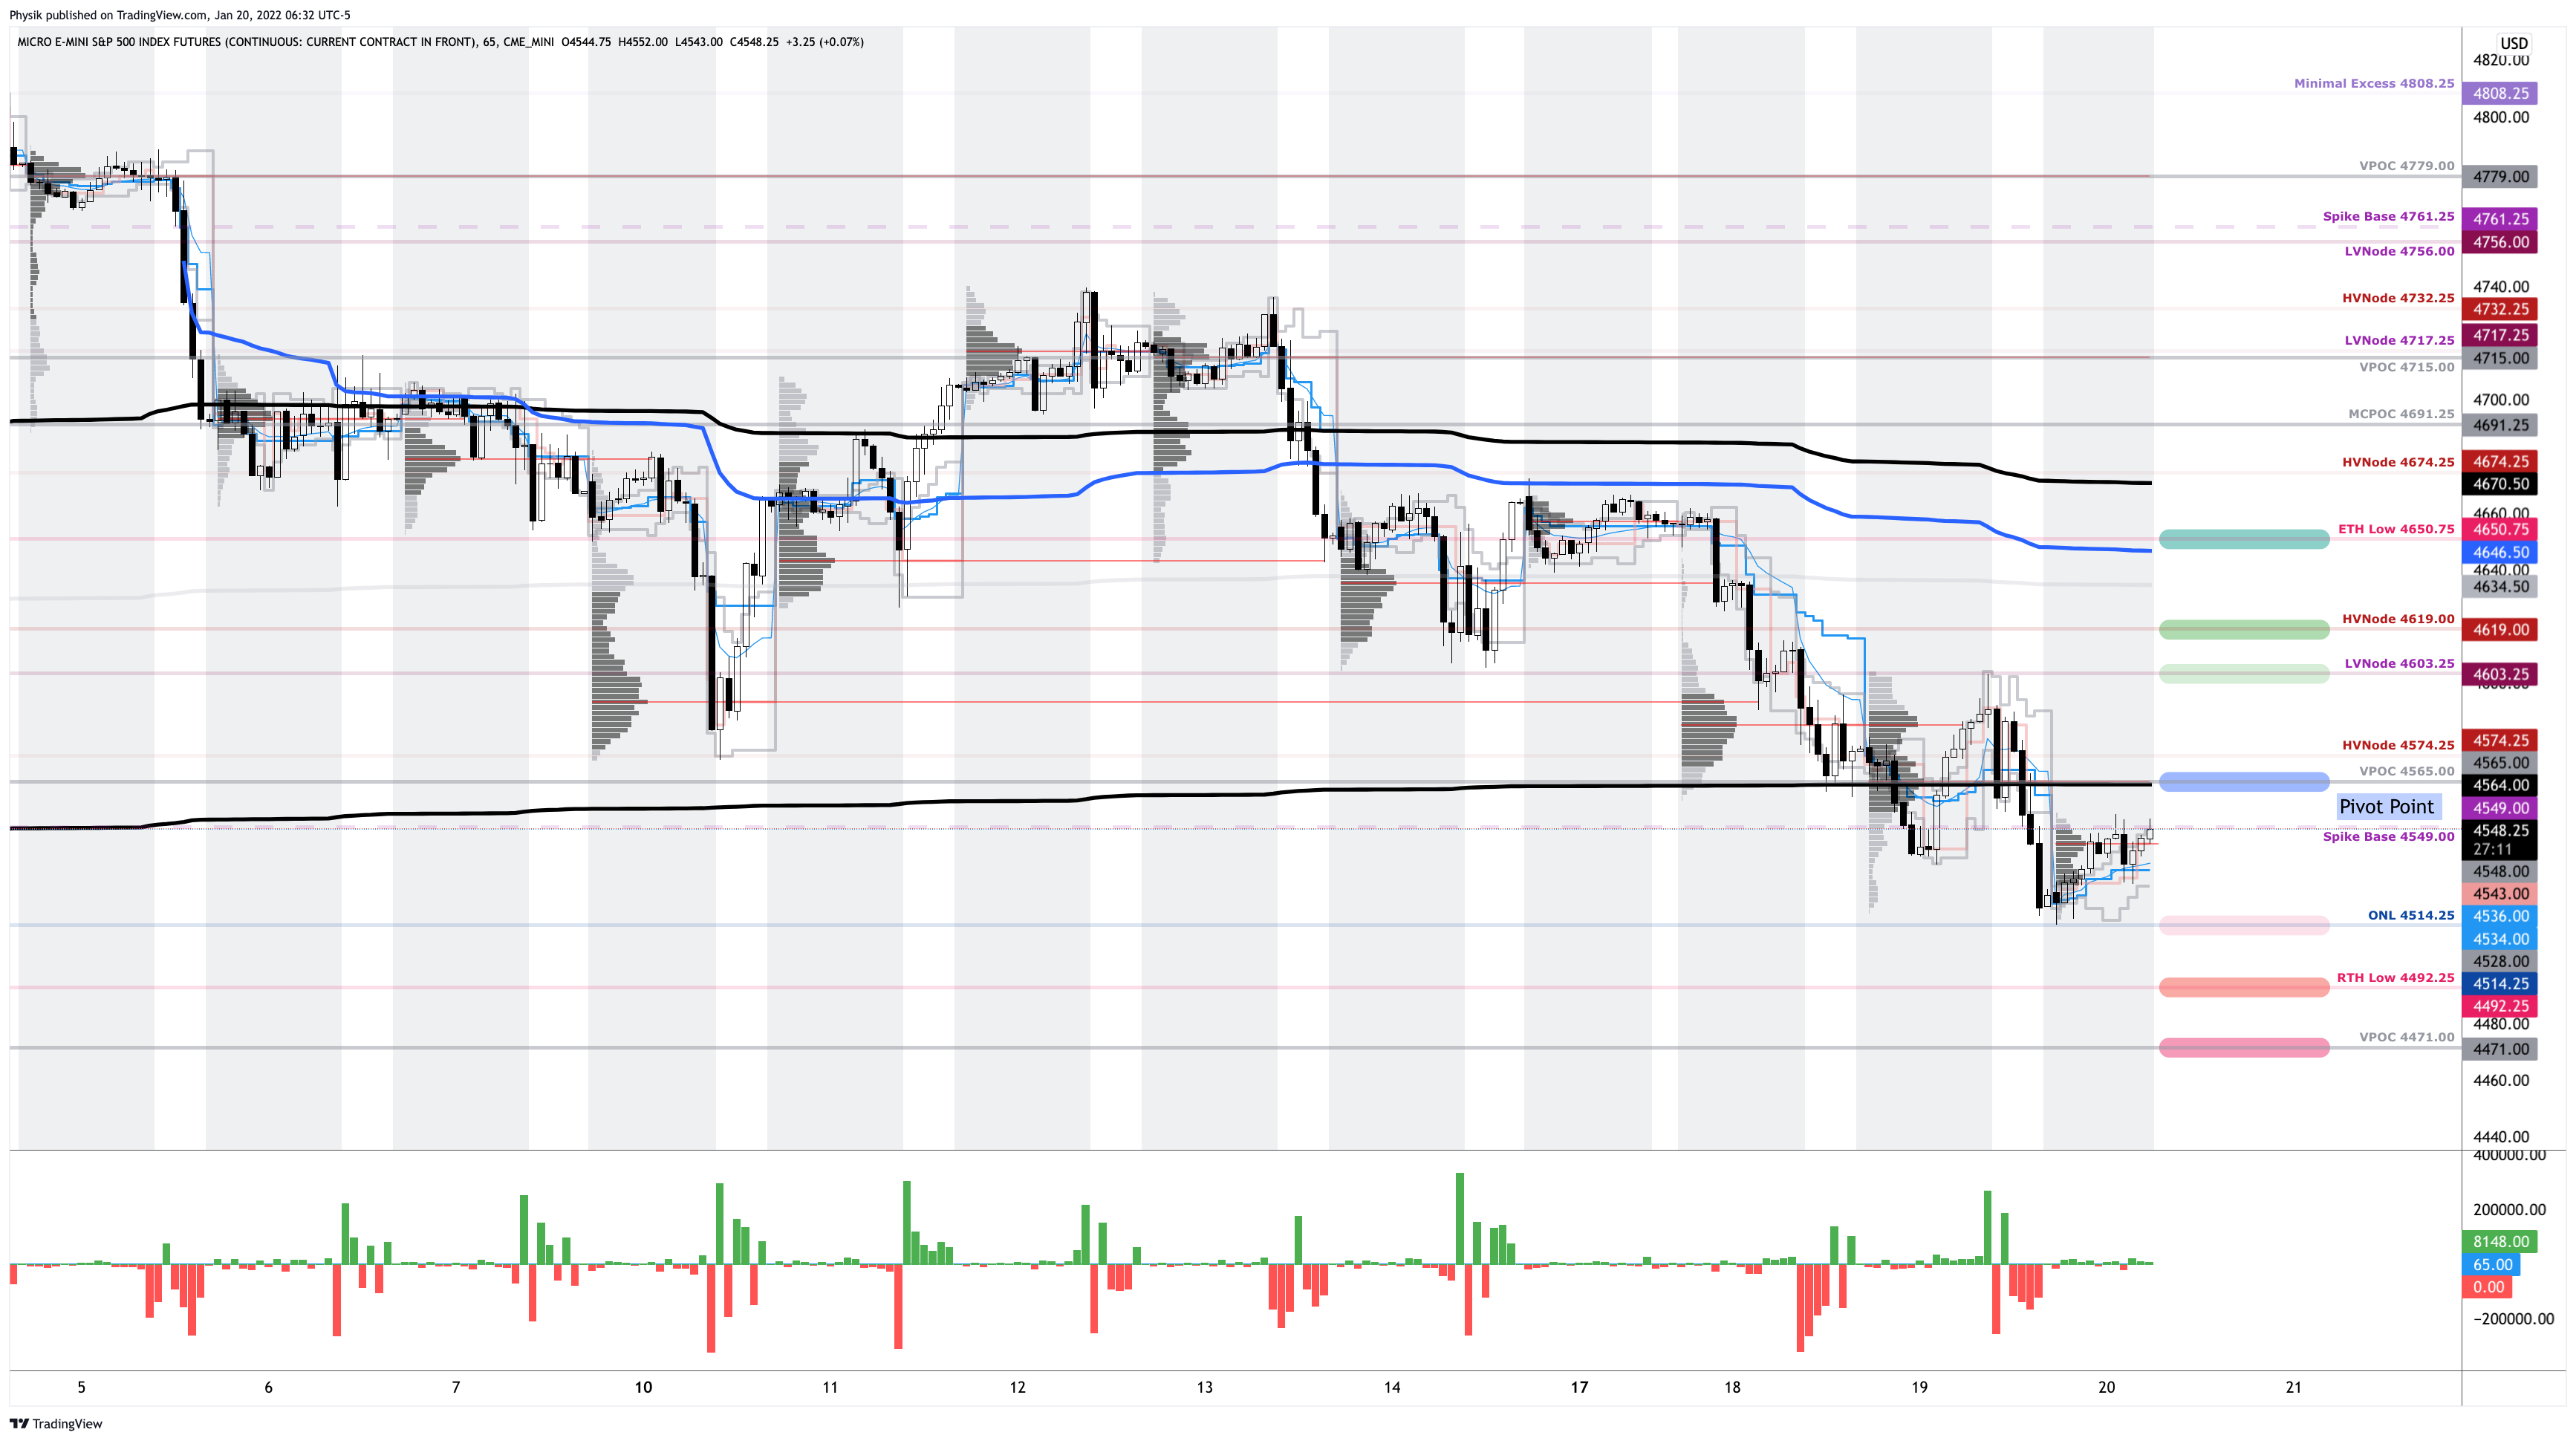
Graphic: 65-minute profile chart of the Micro E-mini S&P 500 Futures.
What People Are Saying
(Not investment advice)
Over the course of the last few weeks you guys have probably noticed my bullish tone. (As I have said before, beware of the vol guys that are always crying that the sky is falling….they are just trying to pitch their own product)
Volume Areas: A structurally sound market will build on areas of high volume (HVNodes). Should the market trend for long periods of time, it will lack sound structure, identified as low volume areas (LVNodes). LVNodes denote directional conviction and ought to offer support on any test.
If participants were to auction and find acceptance into areas of prior low volume (LVNodes), then future discovery ought to be volatile and quick as participants look to HVNodes for favorable entry or exit.
POCs: POCs are valuable as they denote areas where two-sided trade was most prevalent in a prior day session. Participants will respond to future tests of value as they offer favorable entry and exit.
About
After years of self-education, strategy development, mentorship, and trial-and-error, Renato Leonard Capelj began trading full-time and founded Physik Invest to detail his methods, research, and performance in the markets.
Capelj is also a Benzinga finance and technology reporter interviewing the likes of Shark Tank’s Kevin O’Leary, JC2 Ventures’ John Chambers, FTX’s Sam Bankman-Fried, and ARK Invest’s Catherine Wood, as well as a SpotGamma contributor developing insights around impactful options market dynamics.
Disclaimer
Physik Invest does not carry the right to provide advice.
In no way should the materials herein be construed as advice. Derivatives carry a substantial risk of loss. All content is for informational purposes only.
The Daily Brief is a free glimpse into the prevailing fundamental and technical drivers of U.S. equity market products. Join the 200+ that read this report daily, below!
Overnight, equity index futures auctioned upward, into the prior day’s range, after some overnight exploration, lower.
As explained better below, some positioning metrics suggest a bottom (at least near-term) may be in the making.
Ahead is data on jobless claims and manufacturing (8:30 AM ET), as well as home sales (10:00 AM ET).
Graphic updated 6:40 AM ET. Sentiment Neutral if expected /ES open is inside of the prior day’s range. /ES levels are derived from the profile graphic at the bottom of the following section. Levels may have changed since initially quoted; click here for the latest levels. SqueezeMetrics Dark Pool Index (DIX) and Gamma (GEX) calculations are based on where the prior day’s reading falls with respect to the MAX and MIN of all occurrences available. A higher DIX is bullish. At the same time, the lower the GEX, the more (expected) volatility. Learn the implications of volatility, direction, and moneyness. SHIFT data used for S&P 500 (INDEX: SPX) options activity. Note that options flow is sorted by the call premium spent; if more positive, then more was spent on call options. Breadth reflects a reading of the prior day’s NYSE Advance/Decline indicator. VIX reflects a current reading of the CBOE Volatility Index (INDEX: VIX) from 0-100.
What To Expect
Fundamental: The prevailing narrative facing market participants in recent trade is centered around the prospects of contractionary monetary policy in the face of strong economic and earnings growth, as well as cooling inflation while “excess supply” of goods/services builds.
This, as Bloomberg puts it well, “threatens to inject more volatility across a range of assets.”
As a result, the benefits afforded to holders of diversified portfolios are less.
“If current, priced in, inflation and growth expectations are exactly realized we predict that risk premiums on 30-year yields will increase by 15bp and equity risk premium by 30bp,” which would, according to Damped Spring Advisors, “generate a 2% headwind on long bond prices and a 10% headwind for equity prices.”
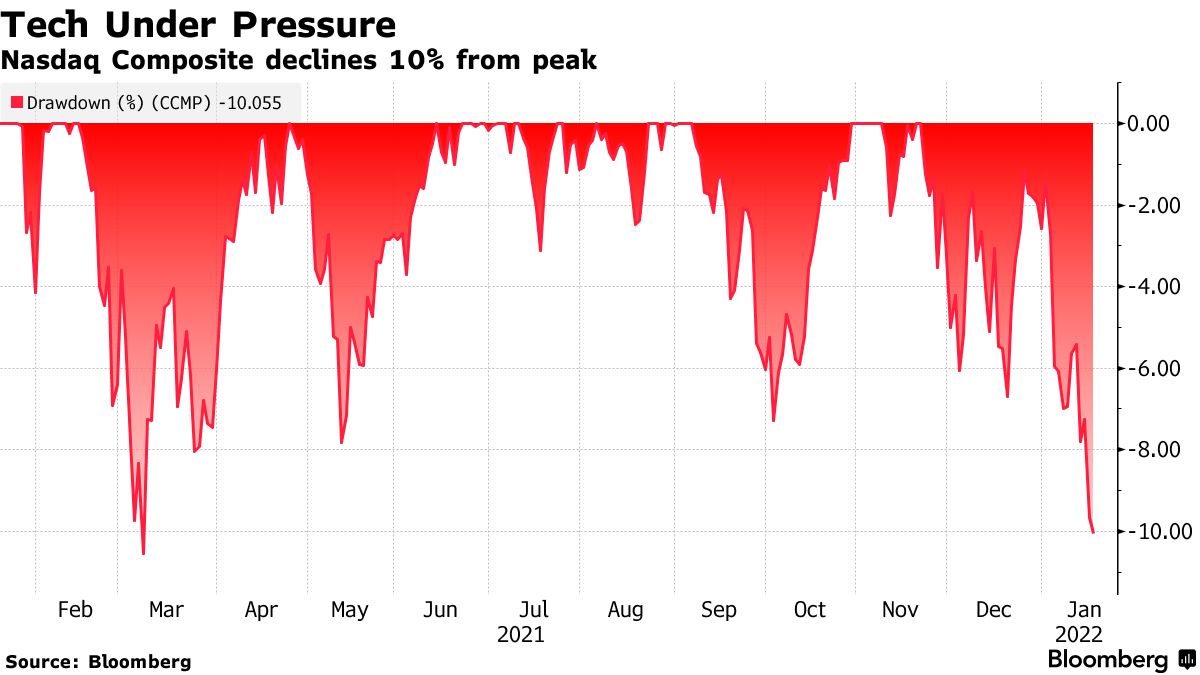
Participants are pricing in these expectations, selling heavy the rate-sensitive products, and pushing the Nasdaq into correction territory, yesterday.
Graphic: Per Bloomberg, “The rout pushed the Nasdaq Composite over the threshold into correction territory.”
“Right now you have people waiting before they go and buy back in,” said Jamie Cox, managing partner at Harris Financial Group.
“You have a Fed meeting coming up, so there’s not going to be a lot of movement anywhere until the Fed meeting is over with. You look around, there’s not a lot of problems in the economy, what you have is just the question of, ‘does all this add up to a faster rate hiking cycle that we anticipate?’ And I don’t think so. I think it’s not likely.”
Moreover, unlike the U.S., counterparts elsewhere, in China and Europe, for example, are not looking to tighten as quickly.
“If major economies slam on the brakes or take a U-turn in their monetary policies, there would be serious negative spillovers,” said Chinese President Xi Jinping.
“They would present challenges to global economic and financial stability, and developing countries would bear the brunt of it.”
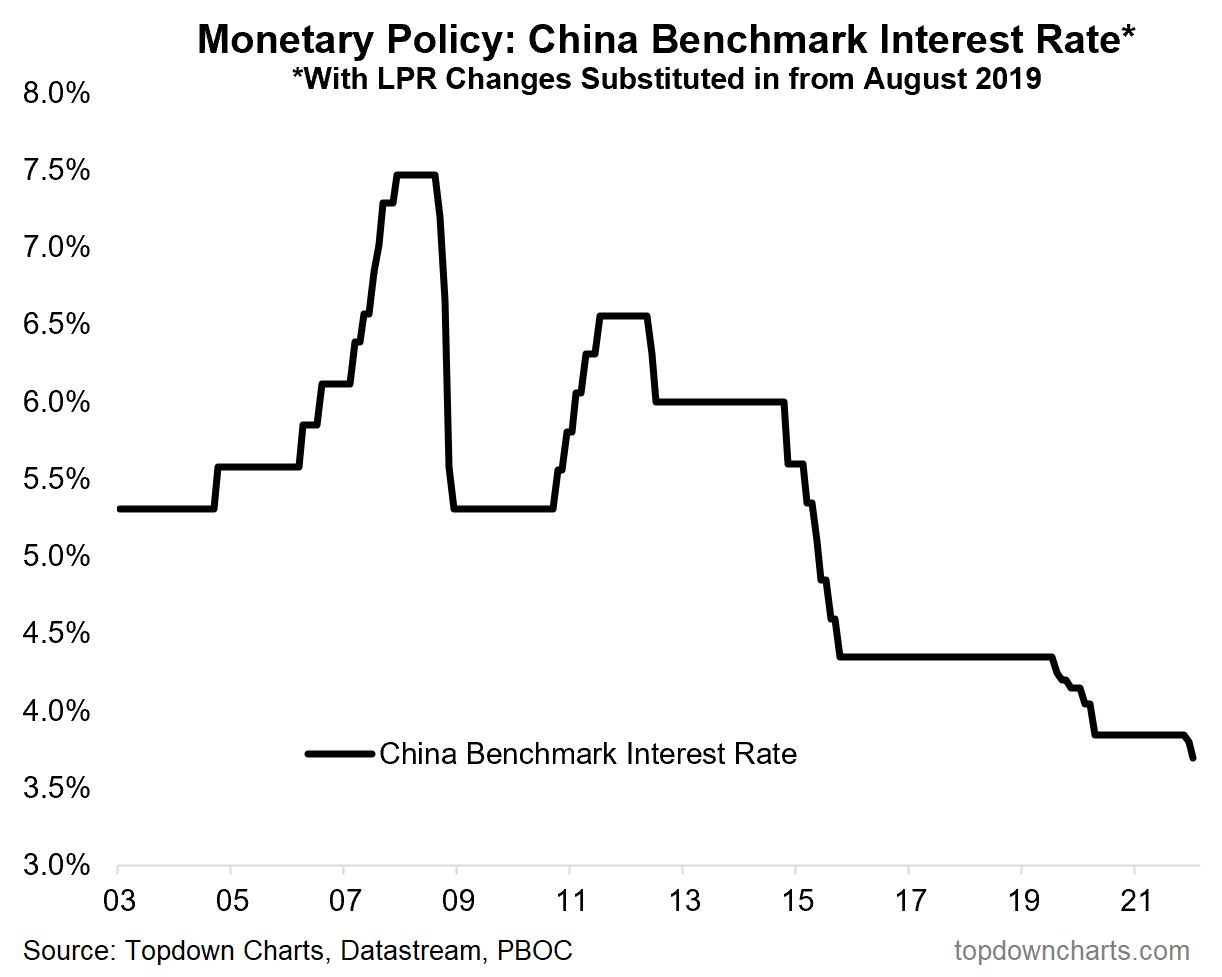
For context, China cut its benchmark interest rate to 3.70% (10 basis points), “cement[ing] the pivot to easing.”
Graphic: Per Topdown Charts, “China cuts benchmark interest rate -10bps to 3.70%. i.e. the 1-year LPR [Loan Prime Rate]. n.b. the PBOC also cut the 5-year loan prime rate by -5bps to 4.6%.”
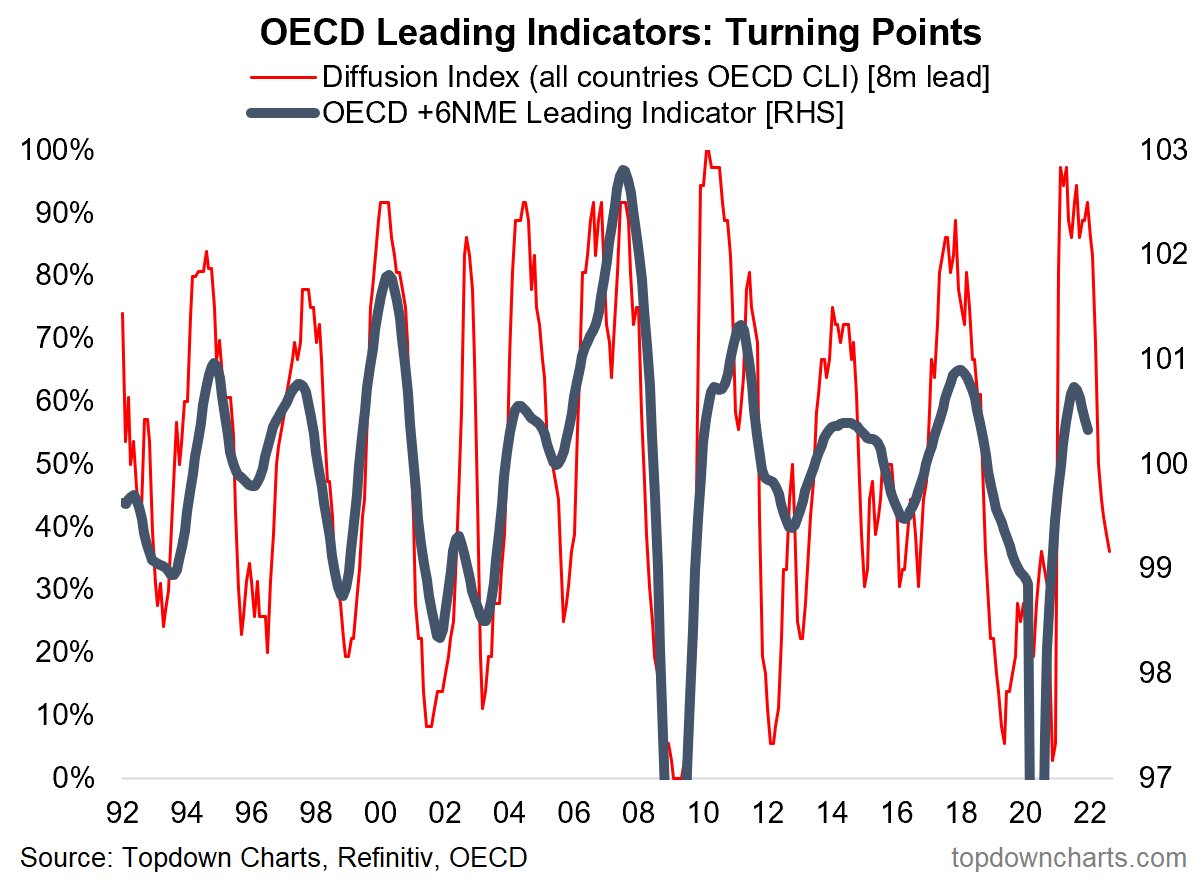
Though this move away from tightening in China is good for assets in that country, emerging markets, and commodities, according to Callum Thomas, an economic slowdown there may foreshadow what is to come in other parts of the world.
Obviously, in saying that plainly, we’re discounting China’s clampdown on its housing and financial sector, but the data seems to suggest the “reopening [and] stimulus-driven global economic rebound may be losing steam headed into 2022.”
Graphic: Per Topdown Charts, OECD leading indicator down sharply from highs.
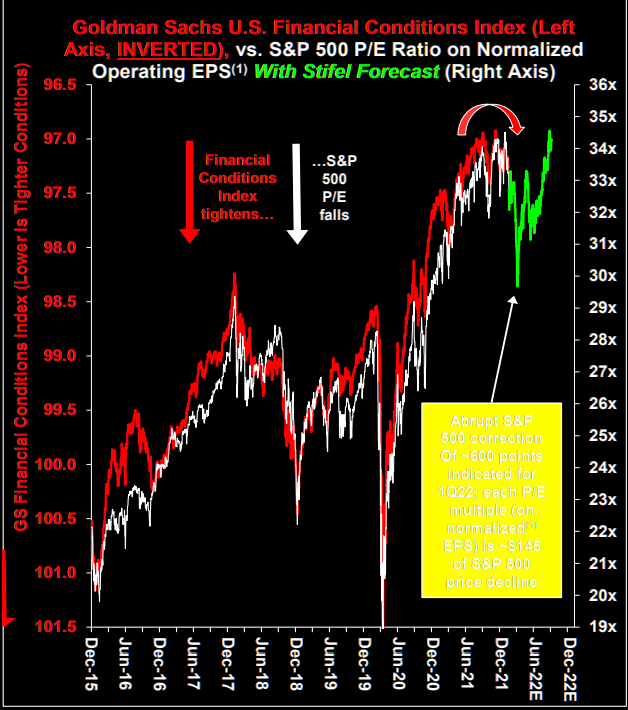
Stifel Financial Corporation’s (NYSE: SF) Barry Bannister provides us with the implications of tighter U.S. financial conditions: a correction down to $4,200.00 in the S&P 500, near-term.
And, with that, post-correction, equities risk the 3rd bubble in 100 years if the “Fed loses its nerve and cancels much of the tightening plan.”
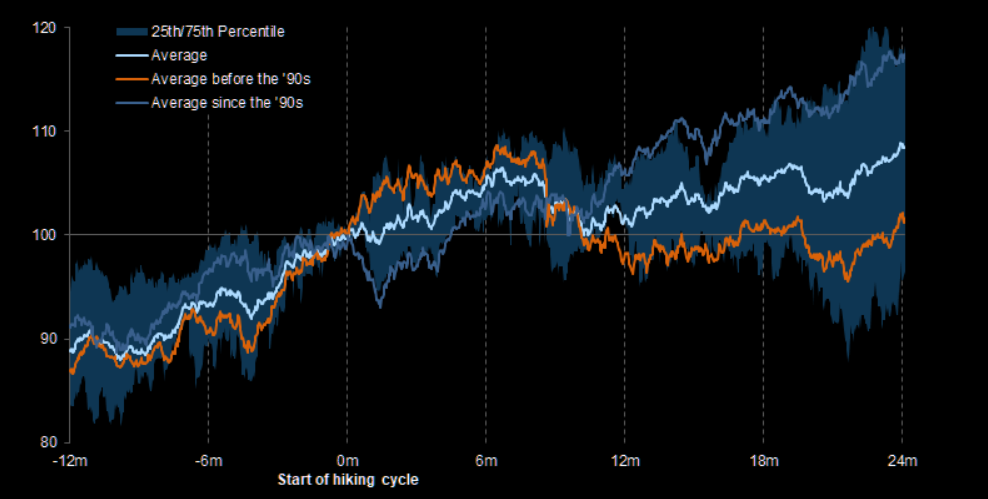
As an aside, to temper some of the bearishness in the above section of the newsletter, here is a chart of S&P 500 returns during Federal Reserve hiking cycles.
Graphic: Via Goldman Sachs Group Inc (NYSE: GS), from The Market Ear.
Positioning: Despite elevated measures of implied volatility like the Cboe Volatility Index (INDEX: VIX), the VIX term structure remains upward sloping, albeit less so than before.
Graphic: VIX term structure shifts higher. The flows associated with hedging protection in the S&P complex ought to pressure the market, should this term structure continue higher.
This is as the unwind of large long-delta positions in heavily weighted index constituents, pre-monthly options expiry (OPEX), alongside demand for downside (put) protection, is finally feeding into the large index products.
Graphic: SpotGamma’s (beta) Hedging Impact Of Real-Time Options (HIRO) indicator suggests Negative options delta trades likely had dealers selling the S&P 500 and Nasdaq 100 ETFs, yesterday.
Moreover, further flattening or inversion of the VIX term structure would clearly coincide with destabilizing demand for protection (as a result of the counterparty supplying protection selling underlying to hedge).
Thus, any expansion in volatility (which could be construed as demand for protection), likely coincides with further weakness.
Notwithstanding, though conditions could worsen, if we take into account options positioning, versus buying pressure (measured via short sales or liquidity provision on the market-making side), metrics remain positively skewed, even more so than before.
Some sort of bottom (at least near-term) may be in the making.
Graphic: Data SqueezeMetrics. Graph via Physik Invest.
Technical: As of 6:40 AM ET, Thursday’s regular session (9:30 AM – 4:00 PM ET), in the S&P 500, will likely open in the upper part of a positively skewed overnight inventory, inside of prior-range and -value, suggesting a limited potential for immediate directional opportunity.
Spike Scenario In Play: Spike’s mark the beginning of a break from value. Spikes higher (lower) are validated by trade at or above (below) the spike base (i.e., the origin of the spike).

The spike base is at $4,549.00. Above bullish. Below bearish.
In the best case, the S&P 500 trades higher; activity above the $4,565.00 untested point of control (VPOC) puts in play the $4,603.25 low volume area (LVNode). Initiative trade beyond the LVNode could reach as high as the $4,619.00 HVNode and $4,650.75 extended trade low (ETH Low), or higher.
In the worst case, the S&P 500 trades lower; activity below the $4,565.00 VPOC puts in play the $4,514.25 overnight low (ONL). Initiative trade beyond the ONL could reach as low as the $4,492.25 regular trade low (RTH Low) and $4,471.00 VPOC, or lower.
Click here to load today’s key levels into the web-based TradingView charting platform. Note that all levels are derived using the 65-minute timeframe. New links are produced, daily.
Graphic: 65-minute profile chart of the Micro E-mini S&P 500 Futures.
Definitions
Overnight Rally Highs (Lows): Typically, there is a low historical probability associated with overnight rally-highs (lows) ending the upside (downside) discovery process.
Volume Areas: A structurally sound market will build on areas of high volume (HVNodes). Should the market trend for long periods of time, it will lack sound structure, identified as low volume areas (LVNodes). LVNodes denote directional conviction and ought to offer support on any test.
If participants were to auction and find acceptance into areas of prior low volume (LVNodes), then future discovery ought to be volatile and quick as participants look to HVNodes for favorable entry or exit.
POCs: POCs are valuable as they denote areas where two-sided trade was most prevalent in a prior day session. Participants will respond to future tests of value as they offer favorable entry and exit.
MCPOCs: POCs are valuable as they denote areas where two-sided trade was most prevalent over numerous day sessions. Participants will respond to future tests of value as they offer favorable entry and exit.
Options Expiration (OPEX): Traditionally, option expiries mark an end to pinning (i.e, the theory that market makers and institutions short options move stocks to the point where the greatest dollar value of contracts will expire) and the reduction dealer gamma exposure.
About
After years of self-education, strategy development, mentorship, and trial-and-error, Renato Leonard Capelj began trading full-time and founded Physik Invest to detail his methods, research, and performance in the markets.
Capelj is also a Benzinga finance and technology reporter interviewing the likes of Shark Tank’s Kevin O’Leary, JC2 Ventures’ John Chambers, FTX’s Sam Bankman-Fried, and ARK Invest’s Catherine Wood, as well as a SpotGamma contributor developing insights around impactful options market dynamics.
Disclaimer
Physik Invest does not carry the right to provide advice.
In no way should the materials herein be construed as advice. Derivatives carry a substantial risk of loss. All content is for informational purposes only.