Categories
Commentary

Take The Money And Run

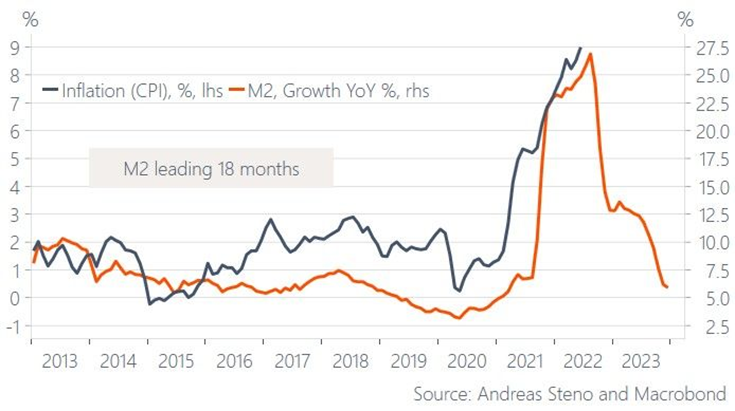
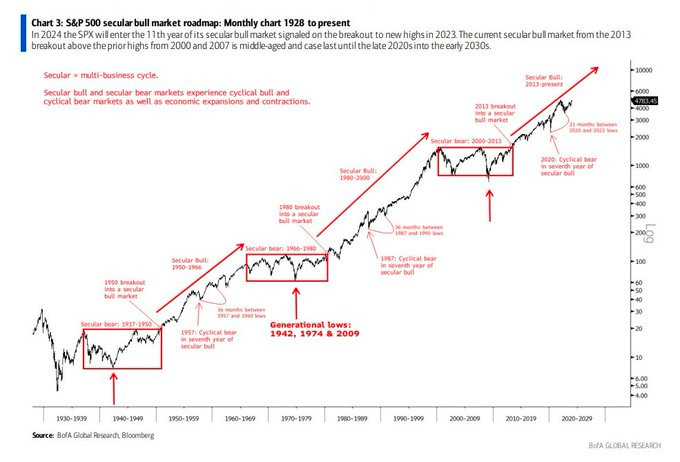
In their Daily Observation, dated January 4, 2000, Bridgewater Associates argued each decade was inclined to be more dissimilar to the preceding one.

“Most people who experienced consistent reinforcement for ten years were inclined to believe that this would continue indefinitely,” the authors Ray Dalio et al. said, pointing to the situation that preceded stock investors’ disappointment in the 1970s, akin to present perceptions. Investors took untimely risks that proved costly. By the late 1970s, influenced by the trauma of inflation, they shifted towards hedge assets.

Graphic: Retrieved from Bloomberg.

The report underscored a significant point: “Thirty years of prosperity and peace created a faith that our problems will be resolved.” Does this sound familiar? Dalio speculates we will soon test the resilience of the existing order and the containment, or lack thereof, of international conflicts. 

Let’s take a step back. What has transpired?

Over many decades, policymakers orchestrated a “growth engine,” nurturing innovation and globalization, inadvertently widening the wealth gap. The urgency to fix disparities, heightened by a pandemic, suggests the next decade will unfold differently, marked by rolling crises.

Inflation & protectionism & conflict, oh my! 

Graphic: Retrieved from TIME. China’s emergence as a global competitor is visualized.

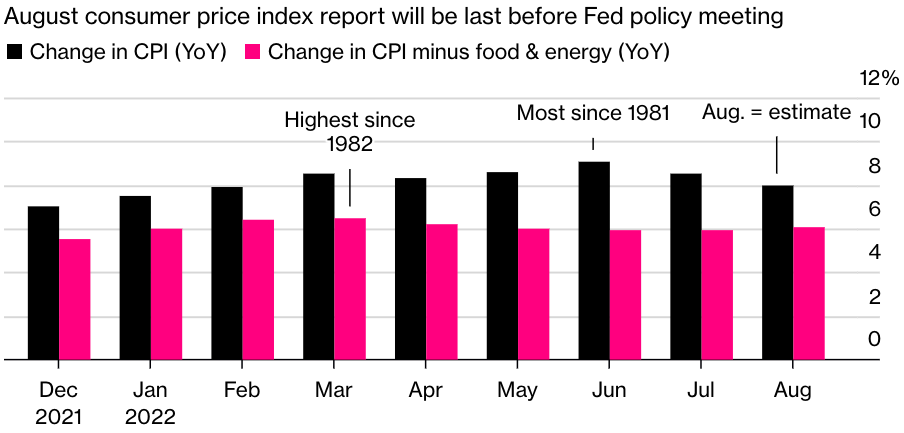
This secular narrative is meticulously explored in our “Climbing A Wall Of Worry” letter. Resolving supply-chain disruptions and commodity deflation helped alleviate overall inflation concerns in the short term. Fiscal boosts, low unemployment, and wage inflation bolstered economic resilience. Pundits are now invoking terms like “soft-landing” and “Goldilocks,” capturing the current sentiment.

Graphic: Retrieved from Bank of America Global Research.

“The picture that market prices are now painting is for inflation to fall to central banks’ targets, for real growth to be moderate, and for central banks to lower interest rates fairly quickly—so the markets are now reflecting a Goldilocks economy,” Dalio says himself. 

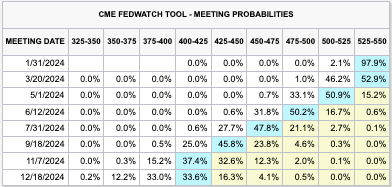
The economic outlook for 2024 seems less impressive despite lingering market support from previous stimulations. Market prices indicate five cuts, reducing the target rate range from 525-550 to 400-425 basis points. Federal Reserve Governor Christopher Waller, who generally holds hawkish views, concurs that “the FOMC will be able to lower the target range for the federal funds rate this year.” However, he cautions against anticipating as many cuts, asserting that, despite noisy data, current policy is appropriate and should persist in exerting downward pressure on demand.

Graphic: Retrieved from CME Group on January 21, 2024.

In a different scenario, where higher real interest rates persist, it would negatively affect the economy. A hard landing would be risked, Fabian Wintersberger believes, leading to a fall in GDP and escalating debt ratios. Regardless of the path, the private sector will likely reduce investment and continue deleveraging for as long as feasible.

Graphic: Retrieved from Simplify Asset Management. High Yield Index Years to Maturity suggests organizations find refinancing or reissuing debt difficult, primarily due to the high costs associated with the risk-free component. This situation is reminiscent of the Global Financial Crisis (GFC), where uncertainty in credit markets hindered entities from refinancing.

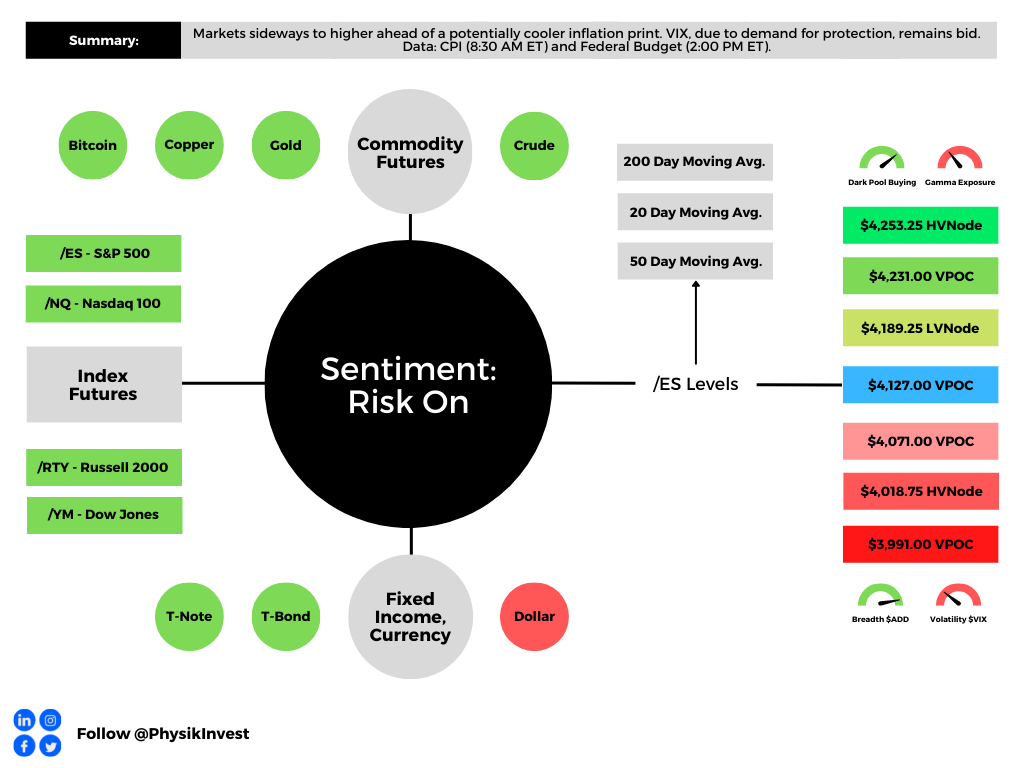
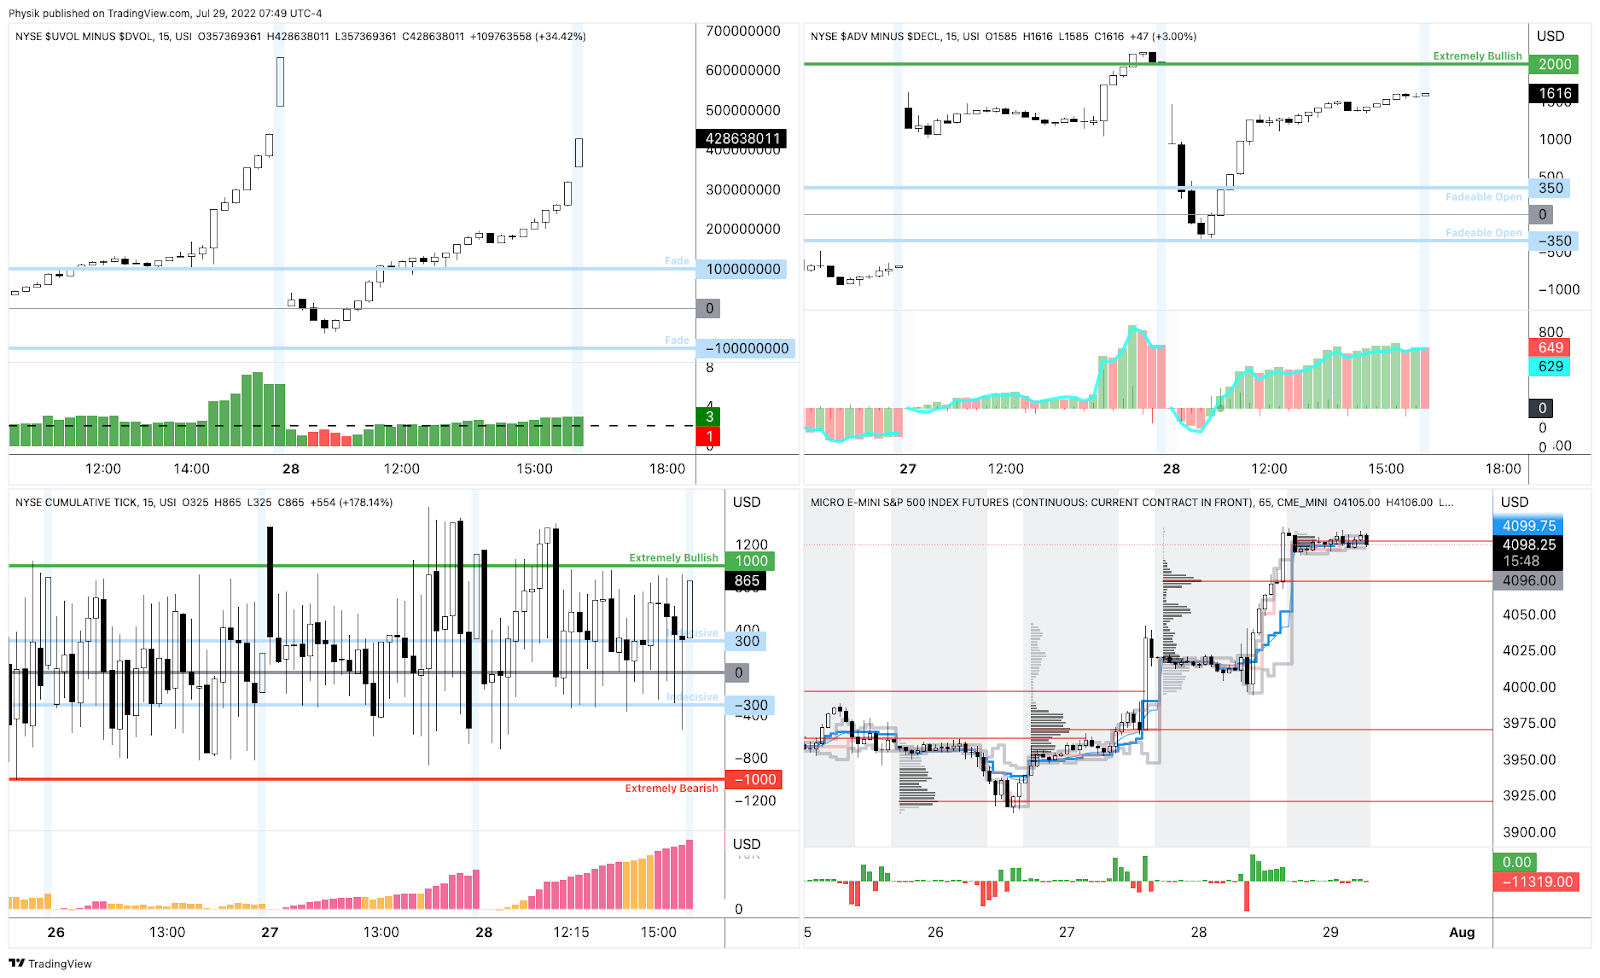
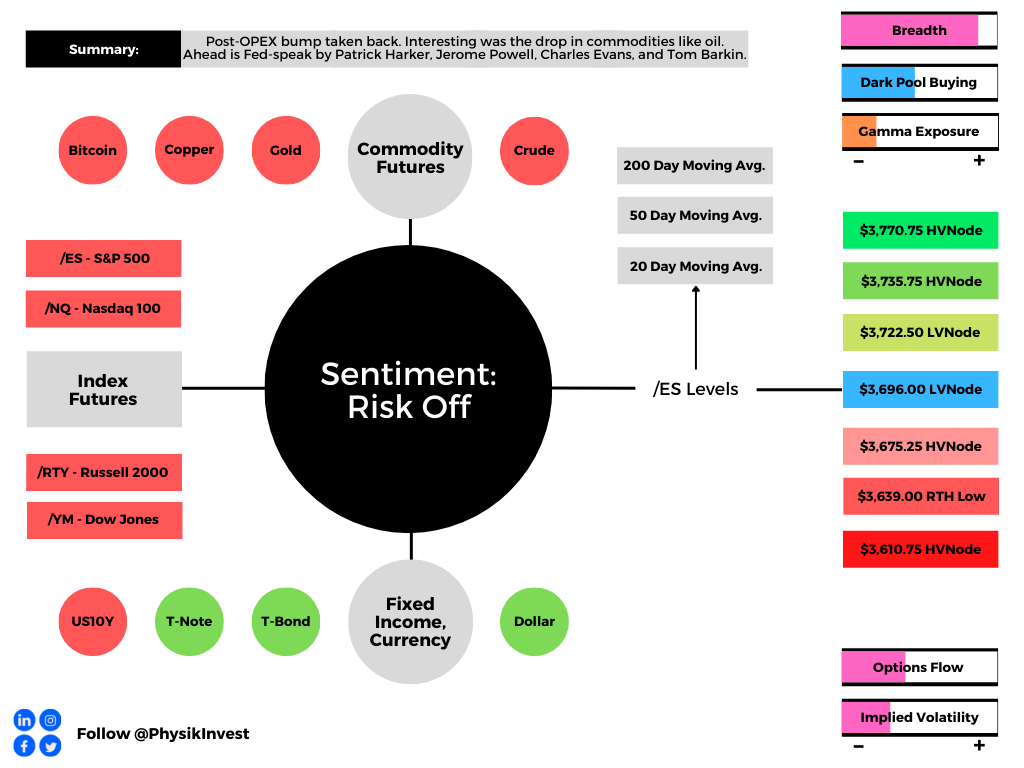
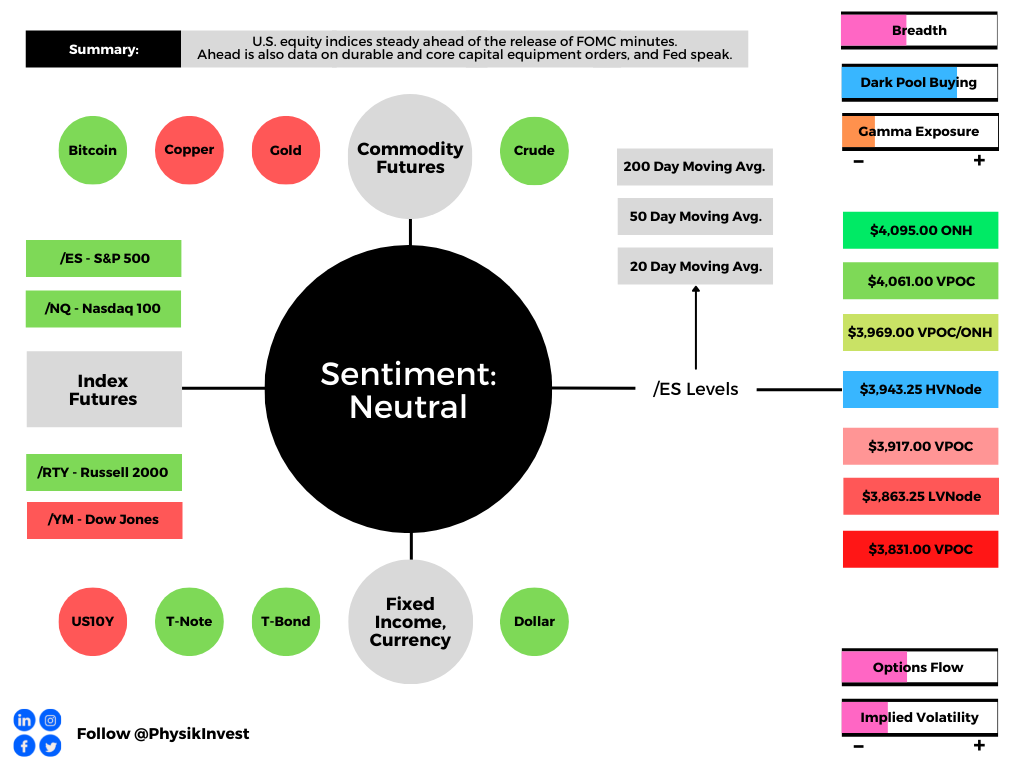
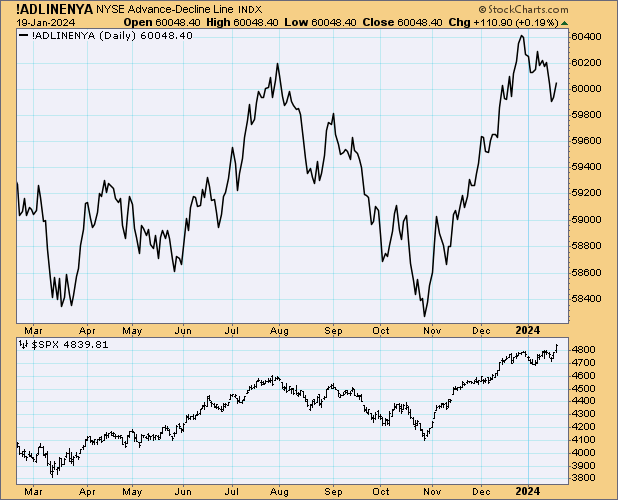
What does all this mean for the stock market? Investors across all time frames are ultra-enthusiastic, bidding products like the S&P 500 to new highs. However, breadth could be more exciting, judging by the Russell 2000 and equal-weighted indexes.

Graphic: Retrieved from marketcharts.com via Callum Thomas.

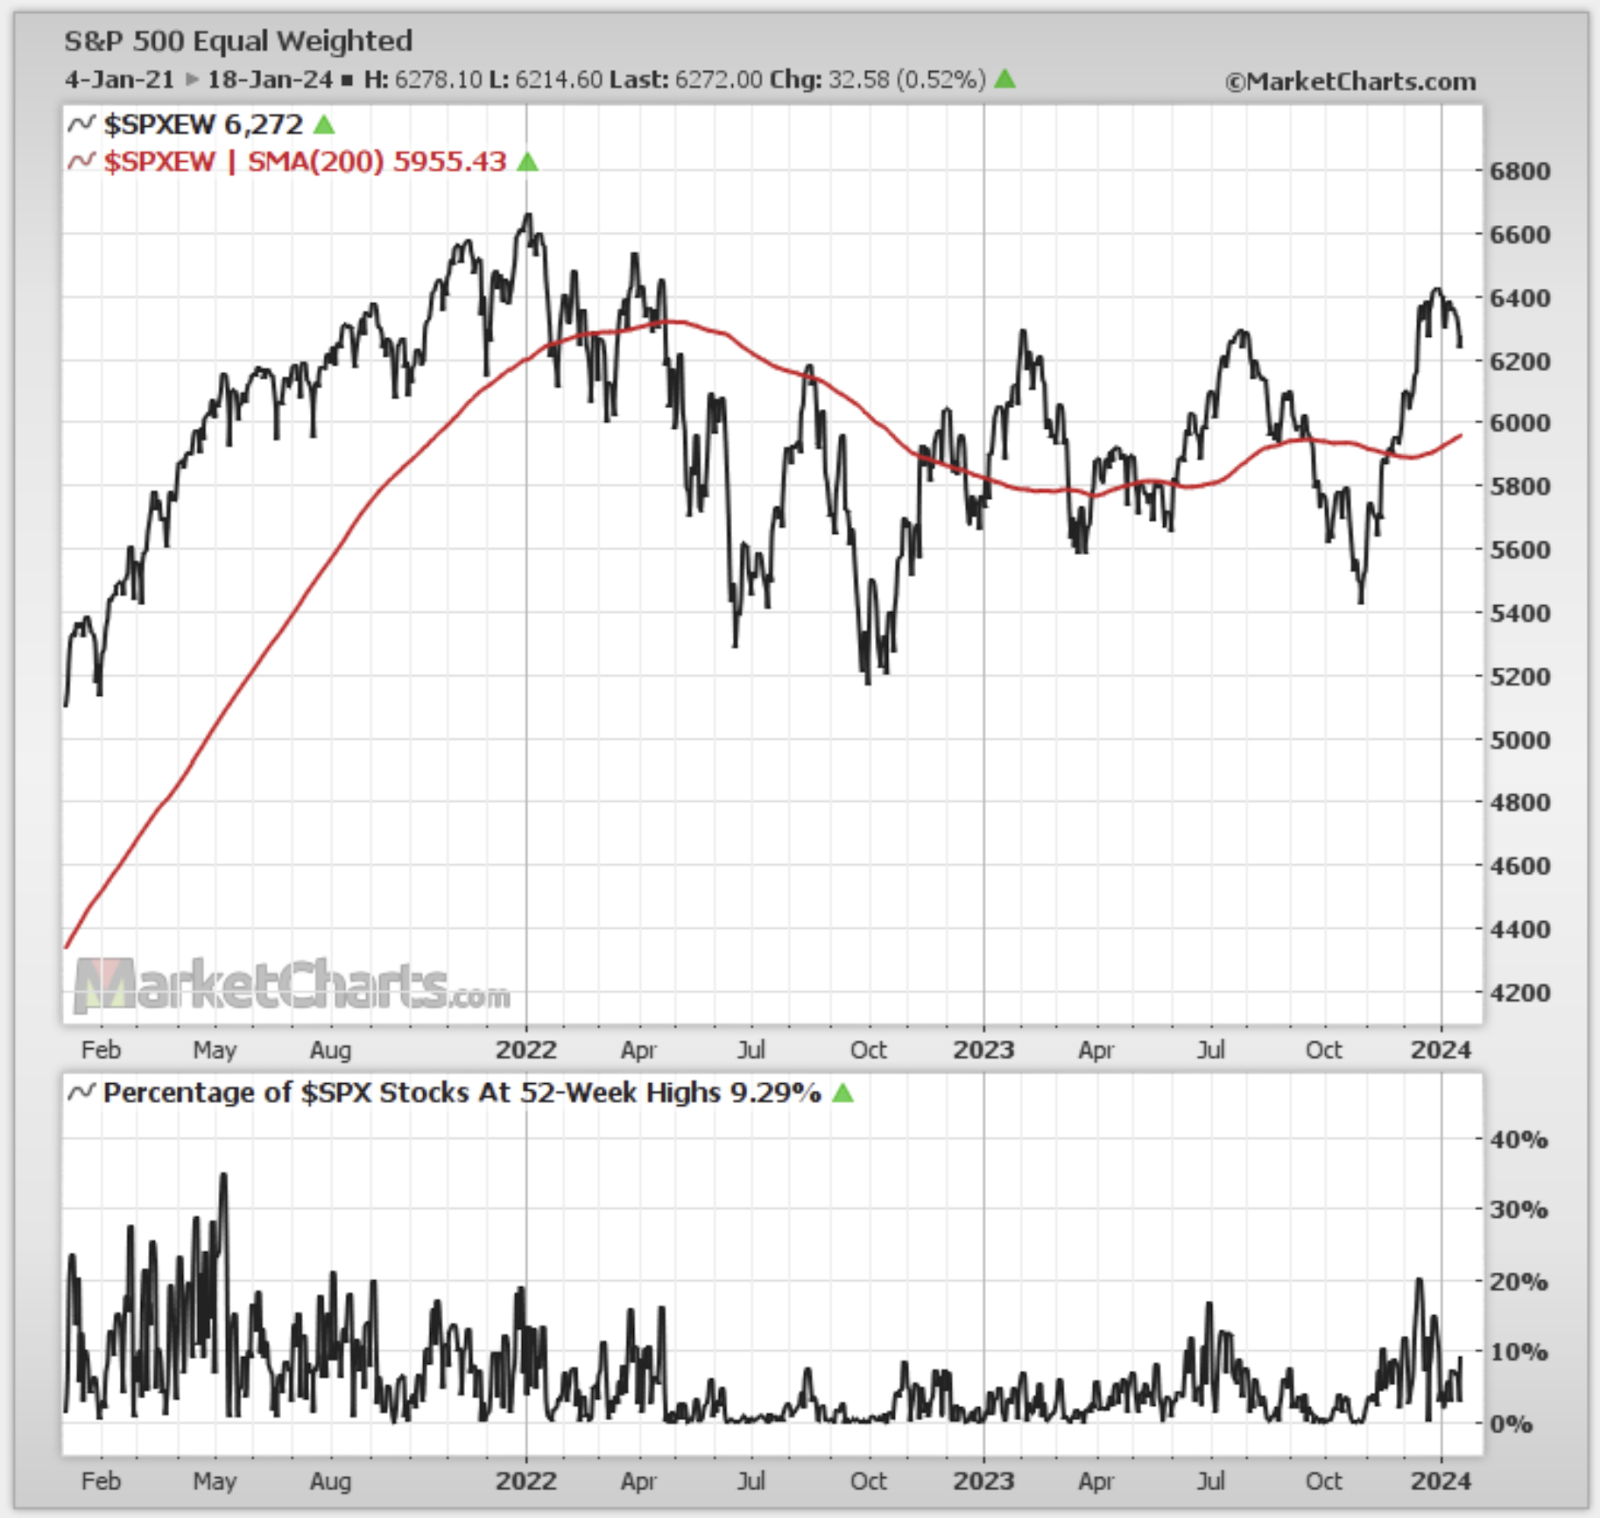
Such is the takeaway when looking at market internals also.

Graphic: Retrieved from StockCharts.com.

So, what’s the story? Bloomberg says, “This isn’t your father’s S&P 500. Don’t worry about valuations.”

Typically, these statements raise promote caution. However, investors seem to see no alternative at the moment. The market is fueled by enthusiastic buying of a handful of stocks “accumulating greater and greater weighting.” While the forward P/E of the equal-weight S&P 500 aligns with pre-pandemic averages, the so-called Magnificent 7, steering the well-known S&P 500 (i.e., the SPX), boasts a higher value at 28.

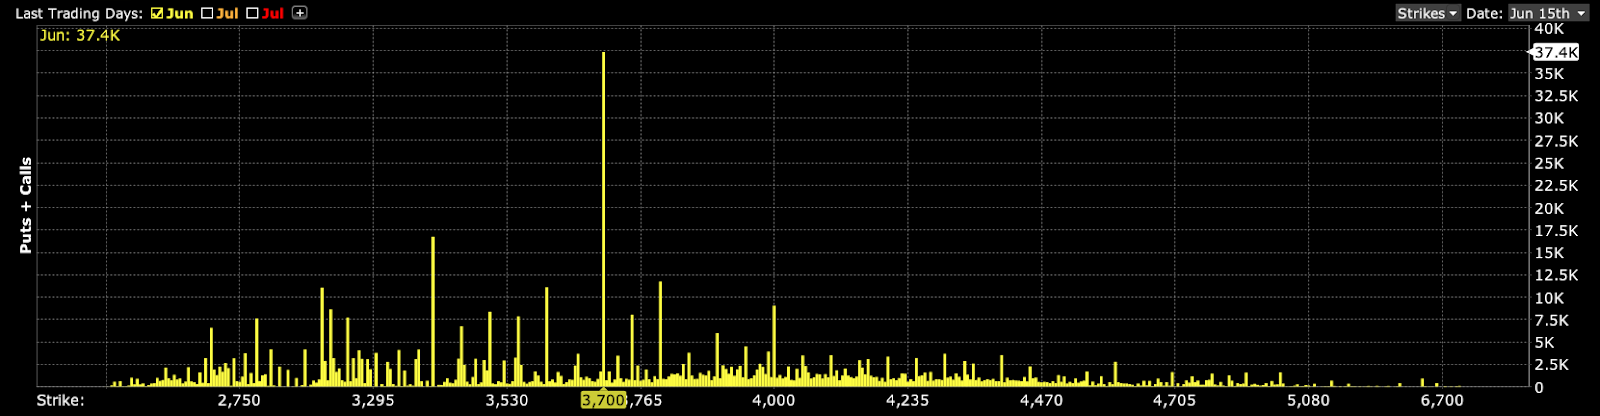
Accordingly, over the shorter term, there are risks, including the market pausing here to “demand some deliverables” and the passage of options expiries last week. 

“The reflexive nature of the market tells us that what we are witnessing here is much more mechanical than anything and probably has nothing to do with what is happening in the real world,” Mott Capital Management’s Michael Kramer discusses.

Graphic: Retrieved from SpotGamma.

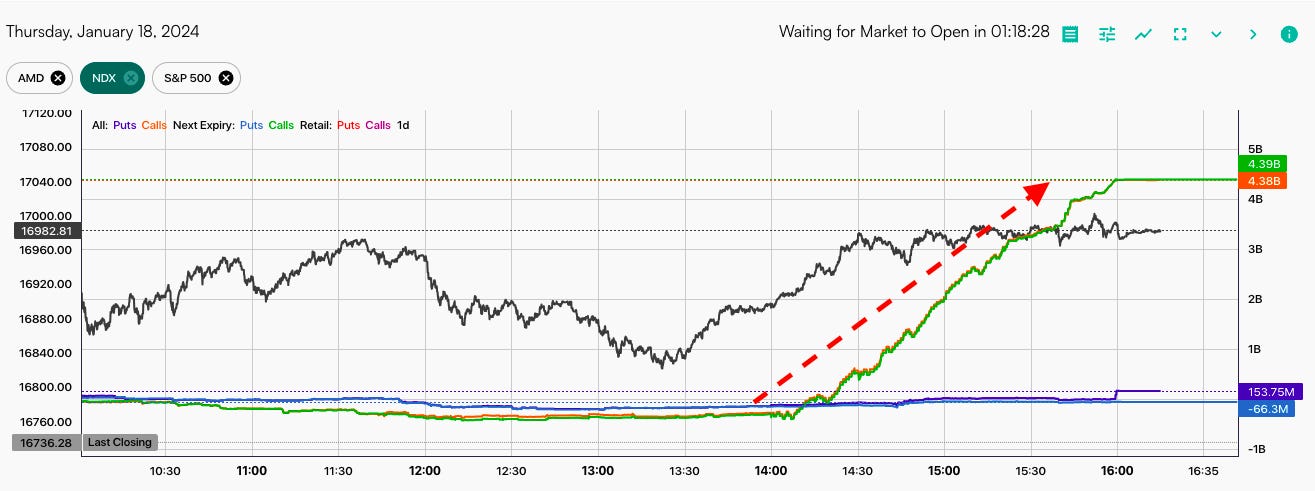
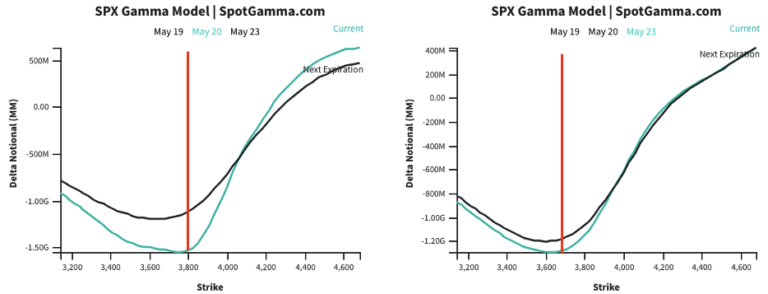
SpotGamma explains there was “rhythmic buying” of options “related to the QYLD Nasdaq BuyWrite ETF, which rolls the Thursday before monthly OPEX.”

Graphic: Retrieved from Bloomberg via Michael Kramer. Notice the amount of call open interest.

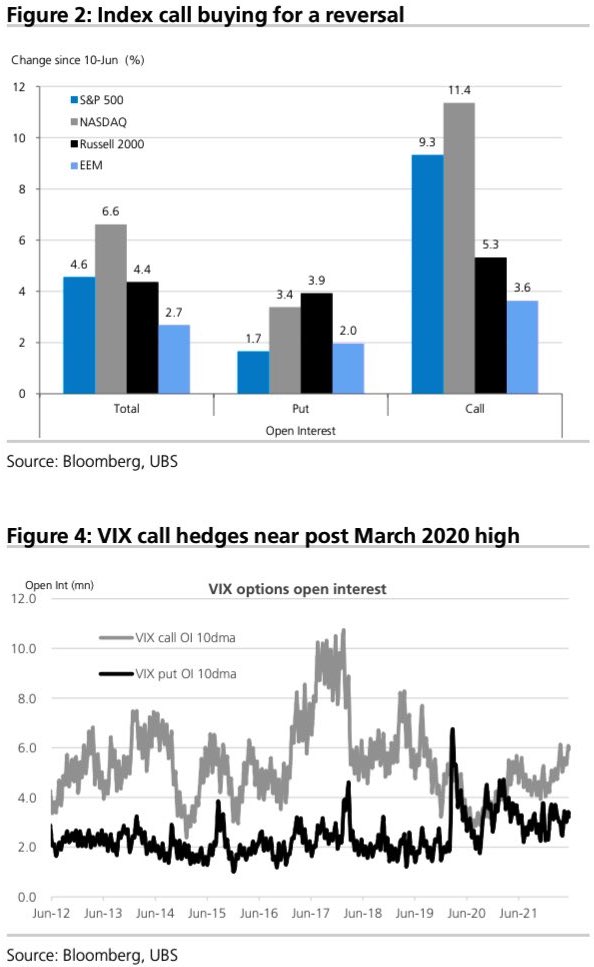
Kramer, aligning with views expressed by individuals such as Cem Karsan from Kai Volatility, anticipates a potential reversal. The premise is based on the assumption that investors owned a substantial share of call options. With a reduction in their quantity and a decrease in the risk they pose to counterparts engaged in hedging through long stocks and futures, there is expected to be diminished “mechanical” support in the subsequent weeks. SpotGamma emphasizes that Monday is the final day for any options expiration effect.

“The structural supply and demand imbalance should end on Friday,” Karsan states. “I would be careful chasing this tech up here, in particular, if we see some weakness going forward like we’ve been talking about.” 

The crucial factor is the amount of “vol supply” emerging from this event, which could counteract “vol demand” (recall that investors often seek protection through options or volatility, the all-encompassing term). This counteraction may postpone weakness, setting the stage for a more significant decline later in Q1, as highlighted by Karsan.

It’s important to note that a substantial market position involves hedging equity with short-call options and long-put options. Options prices may decrease with increased volatility supply, leading to the counterpart’s re-hedging of this position by buying back underlying stock and futures hedges (i.e., if a counterpart is short futures against an SPX long-call and short-put position, they will buy futures to rebalance their delta as implied volatility falls).

Graphic: Retrieved from Nomura Securities International.

“Can that counter the lack of positive flows, the vol buying, and some of the macro liquidity issues,” Karsan asks, acknowledging the pressures linked to asset runoff, Treasury issuances, the diminishing reverse repo, and external events such as the Red Sea attacks, which are perceived as potentially more impactful on supply chains than the global pandemic. In any case, there are increasing prospects of a “February 14 Valentine’s Day Massacre.”

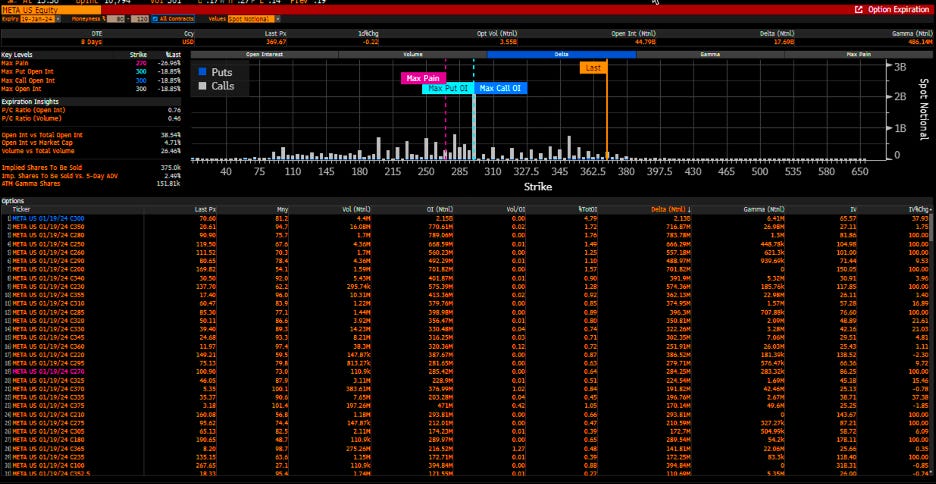
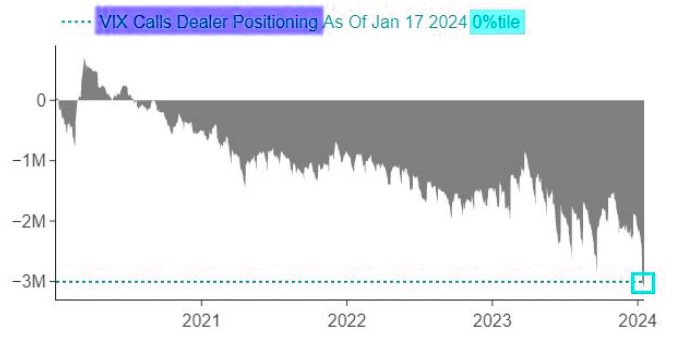
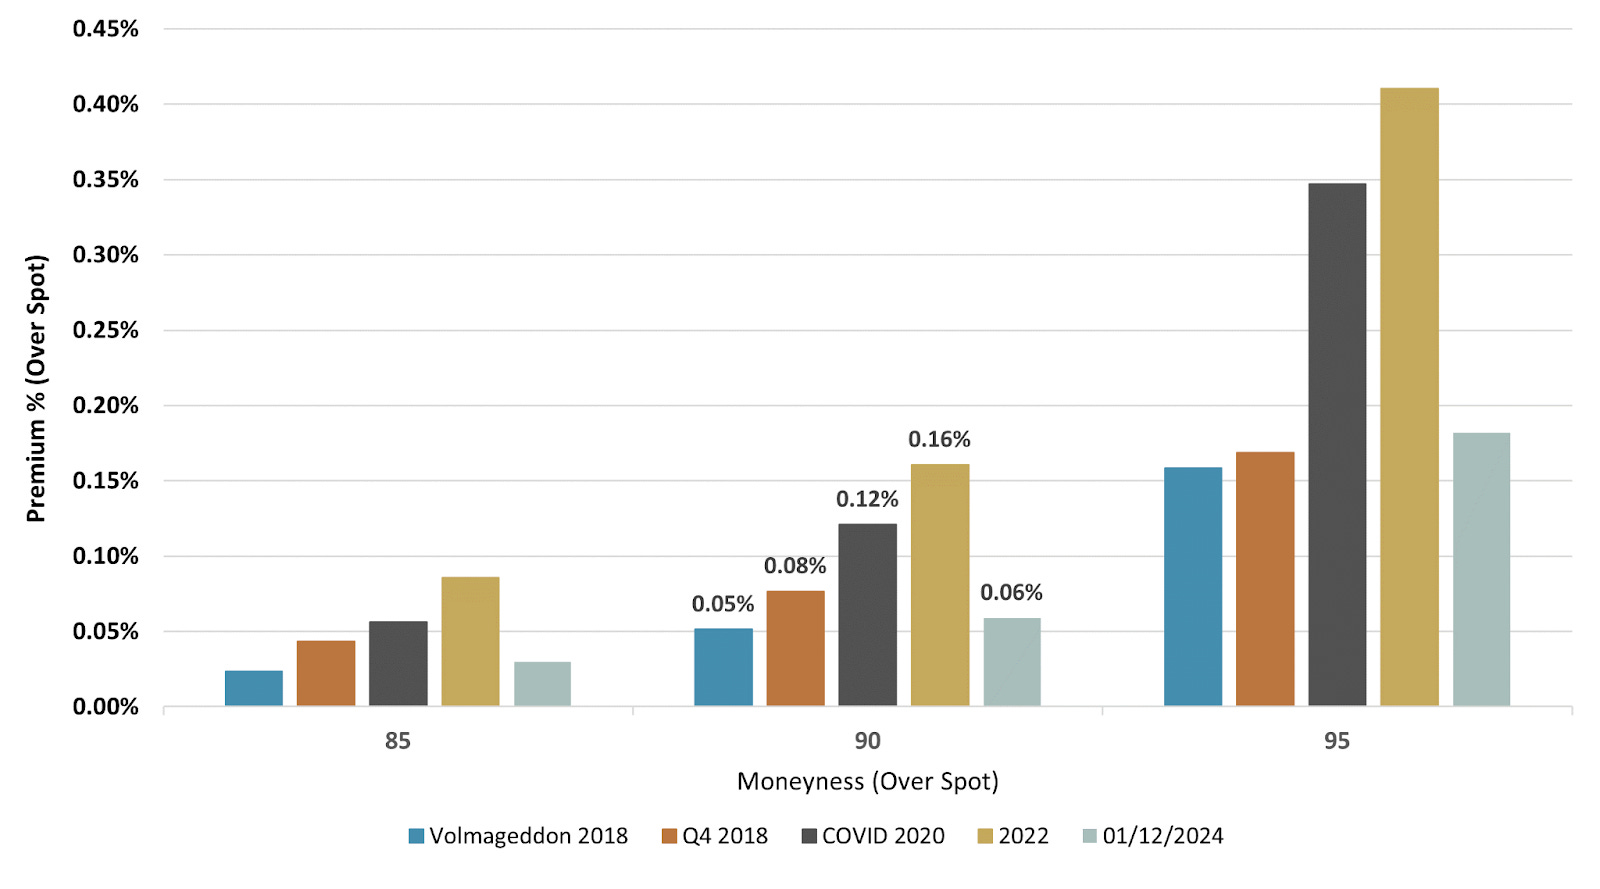
What’s the course of action? According to Simplify Asset Management, considering that far out-of-the-money puts are now priced at half of what they were at the onset of the global pandemic four years ago, hedging at this point is a prudent move. 

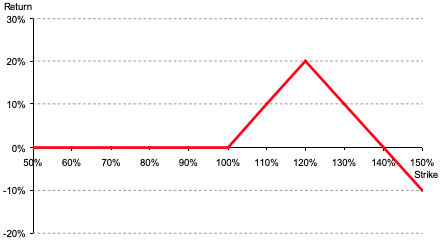
Butterflies in the Nasdaq 100 and S&P 500 present an appealing opportunity. Take, for instance, the 15000/13500/12000 NDX butterfly expiring in the next month or two. It costs between $500 and $1,500 to open. If it’s the shorter-dated one that is in the money today, closing it could yield about a $90,000 credit, excluding changes in implied volatility and the passage of time. The maximum value is $150,000, and the risk is confined to the amount paid at open. Talk about the convexity!

We’ve analyzed this specific trade for you, although in the S&P 500 and without the distant protective put. Given the distinct environment, there is an elevated risk of a volatility increase warranting the acquisition of far-away protection, represented in this instance by the 12000 put.

Graphic: Retrieved from Simplify Asset Management.

Though owning volatility safeguards against a substantial decline, consider the expenses of maintaining that position and the inevitable decline in its value during calm or rising periods. It is “the investment equivalent of death by a thousand cuts.”

“Vol is cheap enough when you go out two or three months, particularly on the call side,” Karsan ends. “Into a rally particularly that should continue to be relatively bid. That doesn’t mean go own one-month vol because that is more uncertain here, right? You will experience a lot of decay if the decline doesn’t happen till February. Right? There is still theta to be had.”

Graphic: Retrieved from Bank of America Global Research.
Categories
Commentary

Daily Brief For September 20, 2022

The daily brief is a free glimpse into the prevailing fundamental and technical drivers of U.S. equity market products. Join the 900+ that read this report daily, below!

Graphic updated 6:20 AM ET. Sentiment Neutral if expected /ES open is inside of the prior day’s range. /ES levels are derived from the profile graphic at the bottom of the following section. Levels may have changed since initially quoted; click here for the latest levels. SqueezeMetrics Dark Pool Index (DIX) and Gamma (GEX) calculations are based on where the prior day’s reading falls with respect to the MAX and MIN of all occurrences available. A higher DIX is bullish. At the same time, the lower the GEX, the more (expected) volatility. Learn the implications of volatility, direction, and moneyness. Breadth reflects a reading of the prior day’s NYSE Advance/Decline indicator. VIX reflects a current reading of the CBOE Volatility Index (INDEX: VIX) from 0-100.

Fundamental

A hot topic over the past sessions is speculation on the Federal Reserve’s (Fed) next steps and the impact those steps may have.

Further, in the news, last night, aside from the prospects of another big hike, was “the biggest annual increase since 1994” in two-year Treasury yields. That’s in part due to recent upside surprises in inflation talked about yesterday and last week.

Graphic: Retrieved from Bloomberg. US Government Bonds 2 YR Yield and Fed Funds.

Per the CME Group Inc’s (NASDAQ: CME) FedWatch Tool, there’s a near-80% chance of a 50 to 75 basis point bump to the target rate, as the Fed looks to stem inflation.

Graphic: Retrieved from CME Group Inc (NASDAQ: CME).

This is all the while the Fed will let their Treasuries mature and, “instead of using the proceeds to buy another Treasury,” they will “buy nothing and reduce their balance sheet,” explained the Damped Spring’s Andy Constan.

Accordingly, “to pay that bond off, the US Treasury has to issue a bond,” and this bond will need to be “bought by the private sector” which has “to sell something to buy the bond, and that starts at the riskiest asset,” like crypto, watches, and cars, for instance.

Let’s unpack this further, below.

The transmission mechanism of quantitative easing (QE) and tightening (QT) is very weak “to economic activity but very strong to financial markets.”

In a detailed explainer, initially quoted in the September 16 letter, we learned “QE creates new reserves on bank balance sheets. The added cushion gives banks … more room to lend or to finance trading activity by hedge funds, … further enhancing market liquidity.”

Therefore, QE (QT) will mildly inflate (deflate) the economy as asset owners are pushed further out (in) on the risk curve. In practice, with QE, owners get pushed from Treasury to corporate bonds, bonds to equities, equities to crypto, and, finally, homes, watches, cars, and beyond.

With QT, as put forth, earlier, the reverse happens.

As Joseph Wang, author of Central Banking 101, said, in short, with QT “consumers have less wealth to spend” and this means that drops in financial markets and the tightening of “financial conditions impact the real economy,” negatively, albeit not as harshly as a rise in interest rates.

Unpacking further, with the Treasury set to increase issuance, thus boosting the government’s checking account, or Treasury General Account (TGA), “the level of reserves in the banking system declines, or the level of RRP could also decline,” Wang added.

This is as all of the above are liabilities to the Fed. Therefore, money comes out of the economy, via a fall in reserves, and this is put into the government’s checking account (TGA boost).

The linked reduction in bank deposits and reserves bolsters “repurchase agreement rates and borrowing benchmarks linked to them,” per Bloomberg. This, then, may play into “an additional tightening of overall financial conditions,” as mentioned, earlier.

Graphic: Via Physik Invest. Data compiled by @jkonopas623. Fed Balance Sheet data, here. Treasury General Account Data, here. Reverse Repo data, here. NL = BS – TGA – RRP.

Here’s a provision.

It’s the case that the Fed believes it needs a certain level of reserves for the proper functioning of the financial system (~$2 trillion). Wang explained that in 2019, banks dumped a lot of their reserves into repo to earn some extra return. 

When QT was about to end, there was less money in their reserves which preceded a spike in rates and a blow-up among those who needed the money the most, as explained here.

Graphic: Retrieved via Bloomberg.

“The Fed saw the system breaking at around 8% GDP and thinks that is where the limit is,” he added. “This suggests, going forward, the Fed is going to have to do something to top up the reserves in the banking system, and they have tools to do that.”

What’s the result, then?

These tools include capping the RRP, “forcing money out into the banking system,” as well as modifying the supplementary leverage ratio (SLR), making it “cheaper for banks to maintain a large balance sheet.”

Together, this, ultimately, may increase “the capacity of banks to make loans [and] create credit, so that is financial easing.”

As Wang said in another work best: These “easing effects may even overwhelm the tightening impact of a marginally longer QT.”

So, what can we expect? 

In terms of timelines, Wang puts forth that economic data will likely prompt a mid-2023 cut in rates, which is in line with what the futures market is pricing.

Graphic: Retrieved from CME Group Inc (NASDAQ: CME).

Before then, traders are pricing nearly 225 to 250 basis points of rate increases. Based on where rates are at, now, some argue the market may still be too expensive.

Graphic: Retrieved from Bloomberg via Michael J. Kramer. “What is amazing is how expensive this market is relative to rates. The spread between the S&P 500 Earnings yield and the 10-Yr nominal rate is at multi-year lows.”

Positioning

We’ve talked about this before but what is expected, after Wednesday’s Fed update, is a move that is “structural,” as Kai Volatility’s Cem Karsan has put it before, and “a function of inevitable rebalancing of dealer inventory post-event.”

“The second move and final resolution, if you wait for it, is usually tied to the incremental effects on liquidity (QE/QT).”

Should participants’ fears with respect to the pace of tightening, for one, be assuaged, then it is likely that the protection demanded heading into the meeting, that’s bidding measures of implied volatility (IVOL), is supplied. This likely provides a boost.

From thereon, markets are more at the whims of macro-type positioning on rising rates and the withdrawal of liquidity.

Technical

As of 6:20 AM ET, Tuesday’s regular session (9:30 AM – 4:00 PM ET), in the S&P 500, is likely to open in the lower part of a negatively skewed overnight inventory, inside of prior-range and -value, suggesting a limited potential for immediate directional opportunity.

In the best case, the S&P 500 trades higher.

Any activity above the $3,909.25 MCPOC puts into play the $3,936.25 ONH. Initiative trade beyond the ONH could reach as high as the $3,964.75 HVNode and $4,001.00 VPOC, or higher.

In the worst case, the S&P 500 trades lower.

Any activity below the $3,909.25 MCPOC puts into play the $3,885.00 VPOC. Initiative trade beyond the VPOC could reach as low as the $3,857.25 and $3,826.25 HVNode, or lower.

Click here to load today’s key levels into the web-based TradingView charting platform. Note that all levels are derived using the 65-minute timeframe. New links are produced, daily.
Graphic: 65-minute profile chart of the Micro E-mini S&P 500 Futures.

Definitions

Volume Areas: A structurally sound market will build on areas of high volume (HVNodes). Should the market trend for long periods of time, it will lack sound structure, identified as low volume areas (LVNodes). LVNodes denote directional conviction and ought to offer support on any test. 

If participants were to auction and find acceptance into areas of prior low volume (LVNodes), then future discovery ought to be volatile and quick as participants look to HVNodes for favorable entry or exit.

POCs: POCs are valuable as they denote areas where two-sided trade was most prevalent in a prior day session. Participants will respond to future tests of value as they offer favorable entry and exit.

MCPOCs: POCs are valuable as they denote areas where two-sided trade was most prevalent over numerous day sessions. Participants will respond to future tests of value as they offer favorable entry and exit.

About

After years of self-education, strategy development, mentorship, and trial-and-error, Renato Leonard Capelj began trading full-time and founded Physik Invest to detail his methods, research, and performance in the markets.

Capelj also develops insights around impactful options market dynamics at SpotGamma and is a Benzinga reporter.

Some of his works include conversations with ARK Invest’s Catherine Wood, investors Kevin O’Leary and John Chambers, FTX’s Sam Bankman-Fried, ex-Bridgewater Associate Andy Constan, Kai Volatility’s Cem Karsan, The Ambrus Group’s Kris Sidial, among many others.

Disclaimer

In no way should the materials herein be construed as advice. Derivatives carry a substantial risk of loss. All content is for informational purposes only.

Categories
Commentary

Daily Brief For September 13, 2022

The daily brief is a free glimpse into the prevailing fundamental and technical drivers of U.S. equity market products. Join the 900+ that read this report daily, below!

Graphic updated 7:45 AM ET. Sentiment Risk-On if expected /ES open is above the prior day’s range. /ES levels are derived from the profile graphic at the bottom of the following section. Levels may have changed since initially quoted; click here for the latest levels. SqueezeMetrics Dark Pool Index (DIX) and Gamma (GEX) calculations are based on where the prior day’s reading falls with respect to the MAX and MIN of all occurrences available. A higher DIX is bullish. At the same time, the lower the GEX, the more (expected) volatility. Learn the implications of volatility, direction, and moneyness. Breadth reflects a reading of the prior day’s NYSE Advance/Decline indicator. VIX reflects a current reading of the CBOE Volatility Index (INDEX: VIX) from 0-100.

Fundamental

Today, traders get inflation updates. These will help drive perceptions regarding monetary policy.

Expected is an 8.1% rise year-over-year (YoY) and 0.1% fall month-over-month (MoM). In July, these numbers were 8.5% and 0.0%, respectively.

Core CPI (which excludes food and energy) is expected to rise by a rate higher than in July, 6.1% YoY and 0.3% MoM, respectively.

Mattering most is core inflation, which the Fed has more control over. If lower than expected, that may warrant some appetite for risk.

Graphic: Retrieved from Bloomberg.

Notwithstanding, prior to July’s release, the average movement in the S&P 500, after CPI, was -1.27%. Still, though, the expectation is that August data will show improvement.

“The market has concluded that both the ECB and even the Fed, despite their protestations otherwise, are both being viewed as data-dependent,” Peter Tchir of Academy Securities said. 

“I cannot see any scenario where the market doesn’t decide that CPI is heading the right direction and … [this] should allow markets to continue to enjoy the strength.”

Graphic: Retrieved from Bloomberg. “Stronger evidence that a wage-price spiral can indeed be avoided came from Monday’s publication of the New York Fed’s latest Survey of Consumer Expectations.”

At this point, in spite of the prospects of inflation continuing to cool, expectations regarding Fed (Federal Reserve) action remain sticky with the fed funds futures pricing a peak in rates of 4%.

Graphic: Retrieved from Bloomberg.

Unchanged, all else equal, this means markets have accounted for the rise in interest rates and their impact on valuations. From hereon, further de-rating is not out of the question, particularly if inflation continues to rise and/or growth fears materialize, as some like Fitch Ratings believe.

Graphic: Retrieved from The Market Ear. Via Morgan Stanley (NYSE: MS). “MS Research thinks the lows for this bear market will likely arrive in the fourth quarter with 3,400 the minimum downside and 3,000 the low if a recession arrives.”

According to Fitch, a decline in corporate profits is likely to speed up in the coming quarters, and this will highlight economic slowing (below-trend GDP growth) that leads to a 2023 recession.

Graphic: Retrieved from Bloomberg, via Bank of America Corporation (NYSE: BAC). “Bank of America … remains ‘fundamentally and patiently bearish.’”

To quote CFO Dive, “Downward revisions to consensus expectations for earnings next year ‘will likely accelerate as monetary tightening continues to reduce inflation and growth slows.’”

Thus far, the economy has shrunk 0.6% in the second quarter, after slumping 1.6% in the first, which is “the common definition of a recession” despite the continued growth of the economy as shown by other metrics like “nonfarm employment, consumer spending, industrial production, and weekly hours worked.”

Positioning

As of 7:45 AM ET, Tuesday’s expected volatility, via the Cboe Volatility Index (INDEX: VIX), sits at ~1.24%. Net gamma exposures increasing may promote some market stability.

It’s the case that there is this trend in demand for equity downside put options protection. This is evidenced by figures of open interest, volume, as well as bid implied volatility (IVOL) metrics like the Cboe Volatility Index (INDEX: VIX).

Graphic: Retrieved from Bloomberg.

“They’re buying protection against a crash at a pace unlike anything the market has ever seen,” said Jason Goepfert, chief research officer at Sundial. This is as Nomura Holdings Inc’s (NYSE: NMR) Charlie McElligott says more traders are taking shots amid “hawkish global central bank escalations,” and tightening measures of liquidity, among other things.

Graphic: Via Physik Invest. Data compiled by @jkonopas623. Fed Balance Sheet data, here. Treasury General Account Data, here. Reverse Repo data, here. NL = BS – TGA – RRP.

Goepfert adds that the “massive hedging activity” feels “unsettling.” That has to do with what the reaction to that protection entails should markets drop lower and IVOL increase, accordingly.

Graphic: Retrieved from SqueezeMetrics. Learn the implications of volatility, direction, and moneyness.

Notwithstanding, should nothing bad happen, the activity, which is structured in soon-to-expire options, will quickly fall out of favor (as will the probability of those options paying out). Liquidity providers, on the other side of those trades, will reduce their negative Delta (short futures and stock) hedges which may further add support to markets.

Graphic: Retrieved from Goldman Sachs Group Inc (NYSE: GS).

The concern is that soon after this big options expiration passes, new fear and demand for protection may feed into another bout of weakness as traders rush to re-protect and liquidity providers add pressure in their hedging, accordingly.

Graphic: Retrieved from Goldman Sachs Group Inc (NYSE: GS).

Technical

As of 7:00 AM ET, Tuesday’s regular session (9:30 AM – 4:00 PM ET), in the S&P 500, is likely to open in the upper part of a positively skewed overnight inventory, outside of prior-range and -value, suggesting a potential for immediate directional opportunity.

In the best case, the S&P 500 trades higher.

Any activity above the $4,127.00 VPOC puts into play the $4,189.25 LVNode. Initiative trade beyond the LVNode could reach as high as the $4,231.00 VPOC and $4,253.25 HVNode, or higher.

In the worst case, the S&P 500 trades lower.

Any activity below the $4,127.00 VPOC puts into play the $4,071.00 VPOC. Initiative trade beyond the VPOC could reach as low as the $4,018.75 HVNode and $3,991.00 VPOC, or lower.

Click here to load today’s key levels into the web-based TradingView charting platform. Note that all levels are derived using the 65-minute timeframe. New links are produced, daily.
Graphic: 65-minute profile chart of the Micro E-mini S&P 500 Futures.

Definitions

Volume Areas: A structurally sound market will build on areas of high volume (HVNodes). Should the market trend for long periods of time, it will lack sound structure, identified as low volume areas (LVNodes). LVNodes denote directional conviction and ought to offer support on any test. 

If participants were to auction and find acceptance into areas of prior low volume (LVNodes), then future discovery ought to be volatile and quick as participants look to HVNodes for favorable entry or exit.

POCs: POCs are valuable as they denote areas where two-sided trade was most prevalent in a prior day session. Participants will respond to future tests of value as they offer favorable entry and exit.

MCPOCs: POCs are valuable as they denote areas where two-sided trade was most prevalent over numerous day sessions. Participants will respond to future tests of value as they offer favorable entry and exit.

About

After years of self-education, strategy development, mentorship, and trial-and-error, Renato Leonard Capelj began trading full-time and founded Physik Invest to detail his methods, research, and performance in the markets.

Capelj also develops insights around impactful options market dynamics at SpotGamma and is a Benzinga reporter.

Some of his works include conversations with ARK Invest’s Catherine Wood, investors Kevin O’Leary and John Chambers, FTX’s Sam Bankman-Fried, ex-Bridgewater Associate Andy Constan, Kai Volatility’s Cem Karsan, The Ambrus Group’s Kris Sidial, among many others.

Disclaimer

In no way should the materials herein be construed as advice. Derivatives carry a substantial risk of loss. All content is for informational purposes only.

Categories
Commentary

Daily Brief For July 29, 2022

The daily brief is a free glimpse into the prevailing fundamental and technical drivers of U.S. equity market products. Join the 600+ that read this report daily, below!

Graphic updated 6:30 AM ET. Sentiment Neutral if expected /ES open is inside of the prior day’s range. /ES levels are derived from the profile graphic at the bottom of the following section. Levels may have changed since initially quoted; click here for the latest levels. SqueezeMetrics Dark Pool Index (DIX) and Gamma (GEX) calculations are based on where the prior day’s reading falls with respect to the MAX and MIN of all occurrences available. A higher DIX is bullish. At the same time, the lower the GEX, the more (expected) volatility. Learn the implications of volatility, direction, and moneyness. Breadth reflects a reading of the prior day’s NYSE Advance/Decline indicator. VIX reflects a current reading of the CBOE Volatility Index (INDEX: VIX) from 0-100.
Updates: Hey, team! I’m offering some updates on the letter and gauging your thoughts, if any.

Been incredibly busy juggling what is, basically, 3 jobs. Here’s a bit about me, if interested. That said, my attention has been elsewhere, to put it simply, so the letters have taken a bit of a hit. Sorry!

The few options I’ve been faced with include (1) lowering the frequency of letters to improve quality and/or (2) continuing pace but increasing simplicity for some time.

I’m aware that many rely on the key levels I provide, daily, as well as some of the narratives and trade ideas often included in the positioning section. Therefore, I’m soliciting feedback and will follow through with the consensus, if any. Have a great weekend!

Fundamental

The Fed’s preferred inflation measure – the personal consumption expenditure deflator (PCE) – is set to update. Per Bloomberg, this measure grew an annualized 7.1% for the second quarter. 

This is on the heels of the Federal Reserve’s (Fed) interest rate hike aimed at reining inflation, as well as data that suggests the “drumbeat of recession” growing louder.

Graphic: Retrieved from Bloomberg. “GDP fell at a 0.9% annualized rate after a 1.6% decline in the first three months of the year []. Personal consumption, the biggest part of the economy, rose at a 1% pace, a deceleration from the prior period.”

Yelena Shulyatyeva and Eliza Winger, economists cited by Bloomberg, comment that the fall in GDP growth “raises the risk that the economy will fall into recession by year-end.”

However, based on the research and expert commentary set forth in past letters, the case is the economy may already be in recession.

Notwithstanding, what’s the impact on equity markets (i.e., now earnings compression)?

It’s the consensus that equity markets endured one of the sharpest de-rates in three decades as participants priced the compression in multiples on the rise in interest rates and flow of capital to capital markets – the quantitative tightening (QT) – component.

For context, beyond raising costs to borrow and innovate, higher interest rates may mean future discounted valuations are lower. Additionally, yield-hungry investors may seek less risky assets, now, given that their yields are more attractive.

Recall that in engaging in practices such as quantitative easing (QE), central banking authorities purchase assets from private sector entities through the creation of central bank reserves. The unwind of this through the QT exercise removes reserves from balance sheets either through asset sales or non-reinvestment of the principal sum of maturing securities.

In less complex terms, the Fed’s purchase of assets depressed their yields forcing investors into risk. Liquidity withdrawal ought to have the opposite effect, amplifying the impact of rate hikes.

Adding, per Joseph Wang, who we’ve quoted in the past, with bank deposits expected to drain ~1T by year-end, the competition for cash forces investors to continue “lower[ing] their selling prices to compete for the cash they want.”

Accordingly, the “Fed will continue to hike interest rates until something breaks,” as explained by Andreas Steno Larsen. In ending forward guidance, “the Fed will rely even more on lagging indicators such as the unemployment rate and the monthly CPI report.”

Graphic: Retrieved from Andreas Steno Larsen. “Most leading indicators for inflation point (seriously) down, while early unemployment indicators are ticking up, but the Fed will not admit to it until risk assets have taken another beating.”

“Once unemployment starts increasing alongside weakening momentum in the inflation reports, it will likely be at least 3-6 months too late to pivot.”

The Eurodollar – which reflects the interest offered on U.S. dollar-denominated deposits at banks outside of the U.S. (i.e., participants’ outlook on interest rates) – curve is inverted and implies rate cuts ahead, “6-7 months from now.”

Given the above, portfolios can “stay away from highly speculative assets, own USD cash, and start allocating towards 5-10y+ government bonds,” as Alfonso Peccatiello explained well.

Context: A stronger dollar, on the tightening of liquidity and credit, as well as increased demand and competition for money, does more to pressure risk and, is an equity headwind. 

Additionally, per Morgan Stanley (NYSE: MS) research, "The simple math on S&P 500 earnings from currency is that for every percentage point increase on a year-on-year basis it’s [] a 0.5 hit to EPS growth.”

Positioning

For the past few sessions, we did much to unpack and understand some of the implications of participants’ market positioning.

In summation, own volatility where the market is likely to not expire. Sell it where the market is likely to expire. Just because implied (IVOL) volatility is at a high starting point does not mean it should be sold, blindly, particularly on the put side, below the market.

Read: Explanations and Applications – Moontower on Gamma.

Technical

As of 6:30 AM ET, Friday’s regular session (9:30 AM – 4:00 PM ET), in the S&P 500, is likely to open in the middle part of a balanced overnight inventory, inside of prior-range and -value, suggesting a limited potential for immediate directional opportunity.

In the best case, the S&P 500 trades higher.

Any activity above the $4,111.00 RTH High puts into play the $4,149.00 VPOC. Initiative trade beyond the $4,149.00 VPOC could reach as high as the $4,164.25 RTH High and $4,189.25 LVNode, or higher.

In the worst case, the S&P 500 trades lower.

Any activity below the $4,111.00 RTH High puts into play the $4,073.00 VPOC. Initiative trade beyond the VPOC could reach as low as the $4,041.25 and $4,015.75 HVNode, or lower.

Click here to load today’s key levels into the web-based TradingView charting platform. Note that all levels are derived using the 65-minute timeframe. New links are produced, daily.
Graphic: 65-minute profile chart of the Micro E-mini S&P 500 Futures.

Considerations: This week’s advance was strong, based on market internals. Given this information, the rally is to not be sold, blindly.

Graphic: Market Internals (Advance/Decline, Up-Volume/Down-Volume, Tick) as Peter Reznicek at ShadowTrader teaches. Though positive, readings were weak and supportive of responsive trade, similar to what market liquidity (via Bookmap) was showing.

Definitions

Volume Areas: A structurally sound market will build on areas of high volume (HVNodes). Should the market trend for long periods of time, it will lack sound structure, identified as low volume areas (LVNodes). LVNodes denote directional conviction and ought to offer support on any test. 

If participants were to auction and find acceptance into areas of prior low volume (LVNodes), then future discovery ought to be volatile and quick as participants look to HVNodes for favorable entry or exit.

POCs: POCs are valuable as they denote areas where two-sided trade was most prevalent in a prior day session. Participants will respond to future tests of value as they offer favorable entry and exit.

MCPOCs: POCs are valuable as they denote areas where two-sided trade was most prevalent over numerous day sessions. Participants will respond to future tests of value as they offer favorable entry and exit.

Volume-Weighted Average Prices (VWAPs): A metric highly regarded by chief investment officers, among other participants, for quality of trade. Additionally, liquidity algorithms are benchmarked and programmed to buy and sell around VWAPs.

About

After years of self-education, strategy development, mentorship, and trial-and-error, Renato Leonard Capelj began trading full-time and founded Physik Invest to detail his methods, research, and performance in the markets.

Capelj also develops insights around impactful options market dynamics at SpotGamma and is a Benzinga reporter.

Some of his works include conversations with ARK Invest’s Catherine Wood, investors Kevin O’Leary and John Chambers, FTX’s Sam Bankman-Fried, ex-Bridgewater Associate Andy Constan, Kai Volatility’s Cem Karsan, The Ambrus Group’s Kris Sidial, among many others. 

Disclaimer

In no way should the materials herein be construed as advice. Derivatives carry a substantial risk of loss. All content is for informational purposes only.

Categories
Commentary

Daily Brief For June 29, 2022

The daily brief is a free glimpse into the prevailing fundamental and technical drivers of U.S. equity market products. Join the 300+ that read this report daily, below!

What Happened

Overnight, equity index futures traded sideways-to-lower, keeping intact the bearish tone from yesterday. Commodities were mixed. Bonds, the dollar, and implied volatility were bid.

At a micro-level, the selling was not similar to that of past market turmoil events. Instead, stocks were sold, but on the back of tame and steady volumes. Adding, the market’s responsiveness to key visual areas may mean that participants with shorter time horizons are more active, pointing to the potential that those with larger horizons are waiting for better entry or more information.

In terms of the news, similar to yesterday, narratives remain uninspiring. The key is that there are signs that inflation may soon turn the corner, as discussed in yesterday morning’s letter. In accordance with that perspective are comments by trader and macro strategist Andy Constan, who this letter’s author spoke with last week and will share insights extracted, below.

Ahead is data on GDP (8:30 AM ET), as well as talks by Federal Reserve (Fed) and European Central Bank (ECB) officials (9:00 AM ET, 11:30 AM ET, and 1:05 PM ET).

Graphic updated 6:40 AM ET. Sentiment Risk-Off if expected /ES open is below the prior day’s range. /ES levels are derived from the profile graphic at the bottom of the following section. Levels may have changed since initially quoted; click here for the latest levels. SqueezeMetrics Dark Pool Index (DIX) and Gamma (GEX) calculations are based on where the prior day’s reading falls with respect to the MAX and MIN of all occurrences available. A higher DIX is bullish. At the same time, the lower the GEX, the more (expected) volatility. Learn the implications of volatility, direction, and moneyness. SHIFT data used for S&P 500 (INDEX: SPX) options activity. Note that options flow is sorted by the call premium spent; if more positive, then more was spent on call options. Breadth reflects a reading of the prior day’s NYSE Advance/Decline indicator. VIX reflects a current reading of the CBOE Volatility Index (INDEX: VIX) from 0-100.

What To Expect

Perspectives: This letter’s objective is to provide salient information one may use in developing a tradeable narrative. Today, we’re taking a different approach and adding some diversity to the format by threading important points from the conversation Physik Invest’s Renato Capelj had with trader and macro strategist Andy Constan, the CEO and CIO of Damped Spring Advisors.

Without further ado, here it is.

The University of Pennsylvania alumnus had his start in finance in the 1980s when he joined Salomon Brothers. There, he excelled quickly and was the “go-to for questions.”

At one point, Salomon tapped Constan for his assistance with the 1987 stock market crash where he learned more about self-reinforcing market strains and how dynamic hedging processes may manifest market volatility.

Constan, later, managed Salomon’s derivatives operations, as well as the sale of those services. He said a lot of his success, in those years, was owed to making “everything systematic” and “operat[ing] with a framework.”

He, then, spent some time at Ray Dalio’s Bridgewater Associates where he was key in the firm’s research on volatility as an asset class. The lesson Bridgewater instilled was to “spend time finding the persistent trade,” parameterizing and executing, accordingly.

The alpha stream from the capture of that systemic edge is an asset itself.

Through the decades of experience, Constan eventually pivoted after recognizing that edges built on top of relative value (RV) – “the capture of inefficiencies generated from some form of concentrated positioning that pushes assets out of whack” – would fail on macro happenings.

Most noteworthy were Constan’s comments on the market’s de-rate

As we’ve talked about in this letter in the past, for decades monetary policies were the go-to instrument for stimulation. This money stocked a technological revolution, bolstered the supply of goods, and, by that token, promoted deflation, which was kept at bay by rising asset prices.

Trends in the geopolitical climate, a focus on fiscal stimulation, as well as supply chokepoints, have stoked goods and services inflation. The commitment to addressing inequality, as well as misallocations of capital through a tightening of liquidity and credit has consequences on the economy and asset prices, which are highly connected given multi-decade trends.

Stemming inflation, via supply-side economics, alone, is folly, as explained in the article. Trends like de-globalization are destructive to prosperity.

“The most destructive things to future prosperity are the tendencies that have developed over the last five years, like Brexit, the border wall, and the war in Ukraine. Comparative advantages, which globalization is essential for, generates uninsured supply chains and now we’re spending money on insurance.”

As the article explains, at its core, prices are set by the equilibrium between the supply and demand for goods. Both are not in line, and the stimulative monetary policies that helped keep the supply-side in check are not on the table, all the while supply chain replication is not adding to production.

Though that’s inflationary, political gridlock is a dampener on the trend.

What about the more pressing matter? Are we in a recession? 

The simple answer is yes, and 2022 is likely to be a 1% total GDP year with a 4% inflation rate. That said, an equity market recovery is not off the table.

We’re in a recession — a period of modestly to significantly below-trend growth — and the fiscal side would have to not force the Fed to do more by having a large spending bill which would hurt markets in a meaningful way.”

On the expression of opinions, Constan’s preferred method is to use defined risk options trades structured around his macro theses two to four months out in maturity. 

If volatility is rich, he will lean on selling credit. If volatility is cheap, he will opt to buy spreads. 

“I want deltas and leverage. My macro indicators give me an edge on price and in the worst case, the loss is limited to 10%, if everything has to go against me all at once. I can be 100% invested and only risk 10%.”

Read Full-Text: Former Bridgewater Associate Talks Recession Odds, Capturing A Macro Edge

Follow Andy Constan on Twitter, here.

Positioning: Little has changed. The volatility that the markets are realizing (RVOL) is high and, at times, in excess of that implied (IVOL). 

To cut to the chase, there’s a “higher starting point” in IVOL, and a still-present right-tail (from the positioning for a bear market rally).

Graphic: Taken by Physik Invest from Interactive Brokers Group Inc (NASDAQ: IBKR) on 6/24/2022. Multi-expiry skew in the Invesco QQQ Trust Series 1 (NASDAQ: QQQ). Notice the v-shape in the shorter maturity and smirk in the longer maturity. Here’s what that means.

Both make it so we may, for zero or no cost, trade short-dated structures with asymmetric payouts.

Read: Trading Volatility, Correlation, Term Structure and Skew by Colin Bennett et al. Originally sourced via Academia.edu.

Graphic: Via Banco Santander SA (NYSE: SAN) research, the return profile, at expiry, of a classic 1×2 (long 1, short 2 further away) ratio spread (the inverse of a back spread).

Technical: As of 6:30 AM ET, Wednesday’s regular session (9:30 AM – 4:00 PM ET), in the S&P 500, will likely open in the lower part of a negatively skewed overnight inventory, outside of prior-range and -value, suggesting a potential for immediate directional opportunity.

In the best case, the S&P 500 trades higher; activity above the $3,821.50 LVNode puts in play the $3,836.25 ONH. Initiative trade beyond the ONH could reach as high as the $3,883.25 LVNode and $3,909.25 MCPOC, or higher.

In the worst case, the S&P 500 trades lower; activity below the $3,821.50 LVNode puts in play the $3,793.25 Ledge. Initiative trade beyond the Ledge could reach as low as the $3,770.75 and $3,735.75 HVNode, or lower.

Click here to load today’s key levels into the web-based TradingView charting platform. Note that all levels are derived using the 65-minute timeframe. New links are produced, daily.
Graphic: 65-minute profile chart of the Micro E-mini S&P 500 Futures.

Considerations: Push-and-pull (responsiveness) near key-technical areas (that are discernable visually on a chart), suggests technically-driven traders with short time horizons are very active. 

Such traders often lack the wherewithal to defend retests and, additionally, the type of trade may be indicative of the other time frame participants waiting for more information to initiate trades.

What People Are Saying

Definitions

Overnight Rally Highs (Lows): Typically, there is a low historical probability associated with overnight rally-highs (lows) ending the upside (downside) discovery process.

Volume Areas: A structurally sound market will build on areas of high volume (HVNodes). Should the market trend for long periods of time, it will lack sound structure, identified as low volume areas (LVNodes). LVNodes denote directional conviction and ought to offer support on any test. 

If participants were to auction and find acceptance into areas of prior low volume (LVNodes), then future discovery ought to be volatile and quick as participants look to HVNodes for favorable entry or exit.

MCPOCs: POCs are valuable as they denote areas where two-sided trade was most prevalent over numerous day sessions. Participants will respond to future tests of value as they offer favorable entry and exit.

Volume-Weighted Average Prices (VWAPs): A metric highly regarded by chief investment officers, among other participants, for quality of trade. Additionally, liquidity algorithms are benchmarked and programmed to buy and sell around VWAPs.

About

After years of self-education, strategy development, mentorship, and trial-and-error, Renato Leonard Capelj began trading full-time and founded Physik Invest to detail his methods, research, and performance in the markets.

Capelj also develops insights around impactful options market dynamics at SpotGamma and is a Benzinga reporter.

Some of his works include conversations with ARK Invest’s Catherine Wood, investors Kevin O’Leary and John Chambers, FTX’s Sam Bankman-Fried, Kai Volatility’s Cem Karsan, The Ambrus Group’s Kris Sidial, among many others.

Disclaimer

In no way should the materials herein be construed as advice. Derivatives carry a substantial risk of loss. All content is for informational purposes only.

Categories
Commentary

Daily Brief For June 28, 2022

The daily brief is a free glimpse into the prevailing fundamental and technical drivers of U.S. equity market products. Join the 300+ that read this report daily, below!

What Happened

Overnight, equity index futures rotated higher, along with commodities. Implied volatility was bid. Bonds were lower. 

In the news were some changes to China’s COVID policies, the European Central Bank’s (ECB) intent to follow its peers and raise interest rates in July by 25 basis points, and the Group of Seven (G-7) leaders are talking about geopolitics and placing limitations on Russia. 

At home, mortgage lenders are turning “desperate” as soaring rates roil their industry. Some are bracing for a 20% reduction in business as 30-year mortgage rates level out below 5.75%.

Pursuant to some of our analyses last week, Scion Asset Management founder Michael Burry suggested a “supply gut at retail is the bullwhip effect.” More on this, later.

Ahead is data on trade in goods (8:30 AM ET), S&P Case-Shiller U.S. home price index (9:00 AM ET), consumer confidence index (10:00 AM ET), as well as updates by Federal Reserve (Fed) members (8:00 AM ET and 12:30 PM ET).

Graphic updated 6:30 AM ET. Sentiment Neutral if expected /ES open is inside of the prior day’s range. /ES levels are derived from the profile graphic at the bottom of the following section. Levels may have changed since initially quoted; click here for the latest levels. SqueezeMetrics Dark Pool Index (DIX) and Gamma (GEX) calculations are based on where the prior day’s reading falls with respect to the MAX and MIN of all occurrences available. A higher DIX is bullish. At the same time, the lower the GEX, the more (expected) volatility. Learn the implications of volatility, direction, and moneyness. SHIFT data used for S&P 500 (INDEX: SPX) options activity. Note that options flow is sorted by the call premium spent; if more positive, then more was spent on call options. Breadth reflects a reading of the prior day’s NYSE Advance/Decline indicator. VIX reflects a current reading of the CBOE Volatility Index (INDEX: VIX) from 0-100.

What To Expect

Fundamental: Though badly timed, last year ARK Invest’s Cathie Wood said inflation would be on its way out due in part to inventory build-ups and their impact on commodity prices.

Graphic: Via Societe Generale SA (OTC: SCGLY).

At the time, she asked whether the velocity of money was depressed given pent-up savings and demand for assets, putting forth disappointing GDP updates (which grew, mostly, on the back of inventories) and slightly negative retail final sales as support for her broader thesis. 

Recall happenings in real estate – the iBuying debacle – late last year. Wood said this: 

“This is unsustainable, … and I’m wondering if even the housing market inflation is going to give way, here.”

Participants were extending moneyness to nonmonetary assets, given monetary policies and an environment of debt and leverage that ultimately cuts into asset price volatility. Ultimately, these trends bolster the risks of carry when volatility does rise and the demand for money pushes deflation, particularly in asset prices.

Read: Daily brief for May 18, 2022.

Graphic: Via the Investment Company Institute. Taken from Joseph Wang. “Investors are selling everything for cash.”

With bank deposits to drain about $1 trillion or so by year-end, that volatility is happening, now, as investors “continue to lower their selling prices to compete for the cash they want.”

Scion Asset Management’s Michael Burry nods at the “supply gut” in retail. Like Wood, he thinks that it is a deflationary pulse that manifests disinflation in consumer prices, prompting the Fed to reverse itself on rates and quantitative tightening (QT).

Read: DC’s Chartbook #16 on the “fundamental evolution in the global money markets.”

Graphic: Via Societe Generale SA (OTC: SCGLY).

That’s as Credit Suisse Group AG’s (NYSE: CS) Zoltan Pozsar, who gained much attention this year on his bold market commentary, said the Fed is likely to change course as it “can only deal with nominal [and] not real chokepoints.” This is as “nominal balance sheet and liquidity trends will, at some point, clash with the realities of a garden variety of supply chain issues.”

Graphic: Via @BarnabeBearBull. “[L]ast week 18 Central Banks tightened their monetary policy (12% of all monitored CBs), including 4 of the top 9. Strongest move in a while.”

Positioning: Incredible is the still-depressed volatility skew we’ve talked about ad nauseam on.

Graphic: Via JPMorgan Chase & Co (NYSE: JPM). Taken from The Market Ear. “Overwriting longs and using the premium to buy downside protection is relatively cheaper now.”

It’s the strong supply of volatility. Participants are hedging, buying into volatility that is closer to current prices, and selling (skew) that which is farther out. 

The counterparts are long that volatility further out, which they may sell into declines, and all of this, together, “results in vol underperformance on market declines,” per Sergei Perfiliev.

Graphic: Via Physik Invest. Taken from TradingView. The top is S&P 500 (INDEX: SPX). The second, from the top, is the Nations SkewDex (INDEX: SDEX), a clearer measure of options skew. The second from the bottom is the Cboe Volatility Index (INDEX: VIX). The bottom is the Cboe VVIX index (INDEX: VVIX), a naive measure of skew.

For that reason, the volatility that the markets are realizing (RVOL) is heightened and, at times, in excess of that implied.

Graphic: Via Goldman Sachs Group Inc (NYSE: GS). Taken from The Market Ear. “SPX 6-month realized volatility is at a level rarely seen outside of major crises; current 6-month implied volatility has been exceeded in just 3 periods since 1940.”

As said, yesterday, given these dynamics, it makes sense to lean toward owning volatility, rather than selling it. A “higher starting point” in IVOL, and a still-present right-tail (from the positioning for a bear market rally), make it so we may position, for less cost, in short-dated structures with asymmetric payouts (call and put side), precisely as we’ve been talking about for half-a-year.

Graphic: Via Pat Hennessy. “[T]he performance of short-dated 1×2 put ratios in SPX this year. Despite being short the tail, the grind lower has been well captured by this trade structure.”

In the near term, from a positioning perspective, the front-running of quarter-end repositioning flow is (and is expected), in part, to add to the equity market upside.

Graphic: Taken by Physik Invest from Interactive Brokers Group Inc (NASDAQ: IBKR) on 6/24/2022. Multi-expiry skew in the Invesco QQQ Trust Series 1 (NASDAQ: QQQ). Notice the v-shape in the shorter maturity and smirk in the longer maturity. Here’s what that means.

Technical: As of 6:30 AM ET, Tuesday’s regular session (9:30 AM – 4:00 PM ET), in the S&P 500, will likely open in the mid-to-upper part of a balanced overnight inventory, inside of prior-range and -value, suggesting a limited potential for immediate directional opportunity.

In the best case, the S&P 500 trades higher; activity above the $3,909.25 MCPOC puts in play the $3,943.25 HVNode. Initiative trade beyond the HVNode could reach as high as the $3,982.75 LVNode and $4,016.25 HVNode, or higher.

In the worst case, the S&P 500 trades lower; activity below the $3,909.25 MCPOC puts in play the $3,885.75 ONL. Initiative trade beyond the ONL could reach as low as the $3,821.50 LVNode and $3,793.25 Ledge, or lower.

Click here to load today’s key levels into the web-based TradingView charting platform. Note that all levels are derived using the 65-minute timeframe. New links are produced, daily.
Graphic: 65-minute profile chart of the Micro E-mini S&P 500 Futures.

Balanced (Two-Timeframe Or Bracket) Trade The Status Quo: Rotational trade that denotes current prices offer favorable entry and exit. 

Balance areas make it easy to spot a change in the market (i.e., the transition from two-time frame trade, or balance, to one-time frame trade, or trend). 

Modus operandi is responsive trade (i.e., fade the edges), rather than initiative trade (i.e., play the break).

Definitions

Overnight Rally Highs (Lows): Typically, there is a low historical probability associated with overnight rally-highs (lows) ending the upside (downside) discovery process.

Volume Areas: A structurally sound market will build on areas of high volume (HVNodes). Should the market trend for long periods of time, it will lack sound structure, identified as low volume areas (LVNodes). LVNodes denote directional conviction and ought to offer support on any test. 

If participants were to auction and find acceptance into areas of prior low volume (LVNodes), then future discovery ought to be volatile and quick as participants look to HVNodes for favorable entry or exit.

MCPOCs: POCs are valuable as they denote areas where two-sided trade was most prevalent over numerous day sessions. Participants will respond to future tests of value as they offer favorable entry and exit.

About

After years of self-education, strategy development, mentorship, and trial-and-error, Renato Leonard Capelj began trading full-time and founded Physik Invest to detail his methods, research, and performance in the markets.

Capelj also develops insights around impactful options market dynamics at SpotGamma and is a Benzinga reporter.

Some of his works include conversations with ARK Invest’s Catherine Wood, investors Kevin O’Leary and John Chambers, FTX’s Sam Bankman-Fried, Kai Volatility’s Cem Karsan, The Ambrus Group’s Kris Sidial, among many others.

Disclaimer

In no way should the materials herein be construed as advice. Derivatives carry a substantial risk of loss. All content is for informational purposes only.

Categories
Commentary

Daily Brief For June 27, 2022

The daily brief is a free glimpse into the prevailing fundamental and technical drivers of U.S. equity market products. Join the 300+ that read this report daily, below!

What Happened

Overnight, equity index and commodity futures were higher while bonds were lower. Volatility measures were bid, too.

In the news is Russia’s default on foreign debts. Quarterly repositioning may bolster attempts higher, per JPMorgan Chase & Co (NYSE: JPM), while Morgan Stanley (NYSE: MS) strategists see the potential for lower with base cases calling for a soft economic landing.

Ahead is data on goods orders (8:30 AM ET) and pending home sales (10:00 AM ET).

Graphic updated 6:30 AM ET. Sentiment Risk-On if expected /ES open is above the prior day’s range. /ES levels are derived from the profile graphic at the bottom of the following section. Levels may have changed since initially quoted; click here for the latest levels. SqueezeMetrics Dark Pool Index (DIX) and Gamma (GEX) calculations are based on where the prior day’s reading falls with respect to the MAX and MIN of all occurrences available. A higher DIX is bullish. At the same time, the lower the GEX, the more (expected) volatility. Learn the implications of volatility, direction, and moneyness. SHIFT data used for S&P 500 (INDEX: SPX) options activity. Note that options flow is sorted by the call premium spent; if more positive, then more was spent on call options. Breadth reflects a reading of the prior day’s NYSE Advance/Decline indicator. VIX reflects a current reading of the CBOE Volatility Index (INDEX: VIX) from 0-100.

What To Expect

Fundamental: Very short, today.

Later this week, I’m excited to share some insights I gleaned from a veteran trader and macro strategist. As a preview, this person thinks that we are in a recession. However, a recovery in equity markets is not off the table with 2022 likely being a 1% total GPD year with 4% inflation.

Stay tuned for that.

Positioning: We’ve been speaking on the demand for protection and the still-strong supply of it lending to tameness in Wall Street’s preferred “fear gauge,” relative to those gauges tracking markets like rates and commodities.

Graphic: Via Bloomberg.

“The current behavior is playing out similar to the 2000-2002 dot-com bear market, with no big sudden shocks but sustained high realized volatility,” explained Talal Dehbi of PrismFP.

Graphic: Via Goldman Sachs Group Inc (NYSE: GS).

Options data and insights platform SqueezeMetrics explained that this is due in part to lower leverage, too.

“Leveraged long S&P lost favor (understandable), and marginal demand for puts went with it. Creeping into net selling territory is ‘smart’ bear market positioning. Short delta, short skew.”

Graphic: Via SqueezeMetrics.

Anyways, noteworthy is the sale of short-dated volatility, and this has played into generally poor performance in skew. In light of that, it makes sense to lean toward owning volatility, rather than selling it.

Graphic: Via TradingView. Taken by Physik Invest. The Cboe VVIX Index (INDEX: VVIX), the expected volatility of the 30-day forward price of the VIX, or the volatility of volatility (a naive but useful measure of skew), was very depressed, too, in comparison to the VIX, itself.

The note to point out, here, is – and this is in accordance with some very recent notes – that a “higher starting point” in IVOL, and a still-present right-tail, makes it so we may position, for less cost, in shorter-dated spread structures with attractive and asymmetric payouts.

Graphic: Taken by Physik Invest from Interactive Brokers Group Inc (NASDAQ: IBKR). Multi-expiry skew in the Invesco QQQ Trust Series 1 (NASDAQ: QQQ). Notice the v-shape in the shorter maturity and smirk in the longer maturity. Here’s what that means.

Heading into the end of the quarter is the expected rollover of large options positions. These are hedges to customer long-equity exposure, which the liquidity providers are short. A front-running of this repositioning flow is (and is expected), in part, to add to the equity market upside.

Graphic: Via SpotGamma. “SPX prices X-axis. Option delta Y-axis. When the factors of implied volatility and time change, hedging ratios change. For instance, if SPX is at $4,700.00 and IV jumps 15% (all else equal), the dealer may sell an additional 0.2 deltas to hedge their exposure to the addition of a positive 0.2 delta. The graphic is for illustrational purposes, only.”

Per SpotGamma, after expiration, “it is more likely the [bearish] tone [all else equal] remains unchanged at least from a positioning perspective,” albeit many metrics appear a tad stretched.

Graphic: Via JPMorgan Chase & Co (NYSE: JPM). Taken from Callum Thomas’ Weekly S&P 500 ChartStorm.

Technical: As of 6:30 AM ET, Monday’s regular session (9:30 AM – 4:00 PM ET), in the S&P 500, will likely open in the middle part of a positively skewed overnight inventory, outside of prior-range and -value, suggesting a potential for immediate directional opportunity.

In the best case, the S&P 500 trades higher; activity above the $3,943.25 HVNode puts in play the $3,982.75 LVNode. Initiative trade beyond the LVNode could reach as high as the $4,016.25 HVNode and $4,055.25 LVNode, or higher.

In the worst case, the S&P 500 trades lower; activity below the $3,943.25 HVNode puts in play the $3,909.25 MCPOC. Initiative trade beyond the $3,909.25 MCPOC could reach as low as the  $3,889.00 VPOC and $3,821.50 LVNode, or lower.

Click here to load today’s key levels into the web-based TradingView charting platform. Note that all levels are derived using the 65-minute timeframe. New links are produced, daily.
Graphic: 65-minute profile chart of the Micro E-mini S&P 500 Futures.

Gap Scenarios In Play: Gaps ought to fill quickly. Should they not, that’s a signal of strength; do not fade. Leaving value behind on a gap-fill or failing to fill a gap (i.e., remaining outside of the prior session’s range) is a go-with indicator.

Auctioning and spending at least 1-hour of trade back in the prior range suggests a lack of conviction; in such a case, do not follow the direction of the most recent initiative activity.

Definitions

A structurally sound market will build on areas of high volume (HVNodes). Should the market trend for long periods of time, it will lack sound structure, identified as low volume areas (LVNodes). LVNodes denote directional conviction and ought to offer support on any test. 

If participants were to auction and find acceptance into areas of prior low volume (LVNodes), then future discovery ought to be volatile and quick as participants look to HVNodes for favorable entry or exit.

Also, MCPOCs are valuable as they denote areas where two-sided trade was most prevalent over numerous day sessions. Participants will respond to future tests of value as they offer favorable entry and exit.

About

After years of self-education, strategy development, mentorship, and trial-and-error, Renato Leonard Capelj began trading full-time and founded Physik Invest to detail his methods, research, and performance in the markets.

Capelj also develops insights around impactful options market dynamics at SpotGamma and is a Benzinga reporter.

Some of his works include conversations with ARK Invest’s Catherine Wood, investors Kevin O’Leary and John Chambers, FTX’s Sam Bankman-Fried, Kai Volatility’s Cem Karsan, The Ambrus Group’s Kris Sidial, among many others.

Disclaimer

In no way should the materials herein be construed as advice. Derivatives carry a substantial risk of loss. All content is for informational purposes only.

Categories
Commentary

Daily Brief For June 22, 2022

The daily brief is a free glimpse into the prevailing fundamental and technical drivers of U.S. equity market products. Join the 300+ that read this report daily, below!

What Happened

Overnight, equity index and commodity futures were sideways to lower all the while bonds and volatility were bid. 

This is after participants, based on metrics included later in the letter, took the advance as an opportunity to sell at higher prices. Demanded was protection, and this bid implied volatility.

Big headlines include China sending warplanes near Taiwan after the U.S. rejected its strait claims. The Taiwanese Foreign Minister Joseph Wu wrote that the threat was “more serious than ever.” This is, also, ahead of Taiwan and U.S. officials talking about arms sales.

In other news, Congress was called on to pass a $0.184 per gallon gasoline tax holiday. Growth in job postings slowed as Q2 GDP forecasts have been revised lower, Chinese manufacturing orders declined by 20-30%, U.K. inflation hit a 40-year record, and sellers of homes are cutting prices in some of the hottest markets while the demand for adjustable-rate mortgages surges.

Ahead, the Federal Reserve’s (Fed) Patrick Harker speaks at 9:00 AM ET. Then, Jerome Powell testifies to the Senate Banking Committee at 9:30 AM ET. Later, Charles Evans speaks at 12:50 PM ET, followed by Harker and Barkin, again, at 1:30 PM ET.

Graphic updated 6:30 AM ET. Sentiment Risk-Off if expected /ES open is below the prior day’s range. /ES levels are derived from the profile graphic at the bottom of the following section. Levels may have changed since initially quoted; click here for the latest levels. SqueezeMetrics Dark Pool Index (DIX) and Gamma (GEX) calculations are based on where the prior day’s reading falls with respect to the MAX and MIN of all occurrences available. A higher DIX is bullish. At the same time, the lower the GEX, the more (expected) volatility. Learn the implications of volatility, direction, and moneyness. SHIFT data used for S&P 500 (INDEX: SPX) options activity. Note that options flow is sorted by the call premium spent; if more positive, then more was spent on call options. Breadth reflects a reading of the prior day’s NYSE Advance/Decline indicator. VIX reflects a current reading of the CBOE Volatility Index (INDEX: VIX) from 0-100.

What To Expect

Fundamental: For what it is worth when it comes to talking of theory and the economy, ARK Invest’s Cathie Wood has been spot on, in many ways.

Somewhat pursuant to our detailed analysis on May 18, 2022, which talked about the impact of reduced liquidity and credit on the real economy and asset prices, Wood explained that the U.S. fell into a recession during the first quarter.

Read: Daily brief for May 18, 2022.

“If massive inventor[ies] bloat real GDP in the second quarter, they will unwind and hurt growth for the rest of the year,” she said. Last year, though badly timed, Wood said that inflation would be on its way out due in part to excess inventory which would be reflected in commodity prices.

Read: Walmart Inc’s (NYSE: WMT) inventory glut to reduce in a “couple of quarters” and how Target Corporation’s (NYSE: TGT) oversupply problem should scare all retailers.

Graphic: Via Bloomberg. “The hot commodities rally is cooling off fast as recession fears again ground and cloud the outlook for demand.”

“If inventories and stock prices are leading indicators for employment and wages, … then fears of cost-push inflation a la 1970’s should disappear during the next six months.”

To put it briefly, as we’ve talked about in the past, the recent market rout is a recession and the direct reflection of the unwind of carry. It is the manifestation of a deflationary shock, and today’s sentiment and reducing demand for goods, among other things, reflect this.

And, with that, after a period during which capital was misallocated, the Fed is not in a position to control price stability “without bringing down the markets,” per Kai Volatility’s Cem Karsan.

Read: Kris Abdelmessih’s Moontower #148 on prevailing macroeconomic perspectives.

In light of these efforts to control price stability, to remain is a continued reach for cash (or bank deposits) and the sale of non-cash assets.

Graphic: Via Redfin Corporation (NASDAQ: RDFN).

“Bonds are not acting as a hedge and appear to be becoming less ‘money’ like due persistent declines in price and elevated rate vol,” as Joseph Wang, who was a trader at the Fed, puts it.

Bank deposits are to drain about $1 trillion or so by year-end, prompting investors to “continue to lower their selling prices to compete for the cash they want.”

Graphic: Per Bloomberg, “[E]very $1 trillion of QT will equate to a decline of roughly 10% in stocks over the next 12 months or so.”

If it provides any solace, per comments by Credit Suisse Group AG’s (NYSE: CS) Zoltan Pozsar, the Fed, which “can only deal with nominal [and] not real chokepoints,” is likely to change course.

This is as “nominal balance sheet and liquidity trends will, at some point, clash with the realities of a garden variety of supply chain issues.”

Likewise, Andreas Steno Larsen explains that bond yields remain governed by demographics, and this is good news for stocks, in general.

“Just look at the growth rate of the working-age population (10 years forward) versus the term premium of US Treasury bonds. The current bond bear market is not standing on structural pillars.”

Graphic: Via Andreas Steno Larsen. “Bond yields remain governed by demographics over the medium-term. Low(er) for longer.”

Positioning: To preface, I encourage everyone to check out the Daily Brief for June 17, 2022.

Moving on. So, last week, we had a large monthly options expiration (OPEX). After this, liquidity providers’ re-hedging flows supported the market.

Over the weekend, into Tuesday’s U.S. close, equities, then, traded higher. The rally, however, was not confidence-inspiring and was indicative of short-covering.

Per SpotGamma’s Hedging Impact of Real-Time Options (HIRO) indicator, participants took the relief rally “as an opportunity to hedge/sell,” as I wrote for SpotGamma, yesterday.

Graphic: SpotGamma’s combined HIRO reading for the S&P 500 (INDEX: SPX) and SPDR S&P 500 ETF Trust (NYSE: SPY). Trade was responsive (i.e., buy dip, sell rip) up until 2:00 PM ET when demand for negative delta (i.e., put buying, call selling) outweighed that for positive delta.

This ultimately showed up in broad measures of implied volatility. As The Ambrus Group’s Kris Sidial said: “[I]n the final hour, spot [and] vol up.”

This plays into decreased odds for a far-reaching rally. Participants are positioned out in strikes that are lower and the activity in those strikes plays into a change in tone with respect to the non-linearity and strength of volatility and skew with respect to linear changes in asset prices.

As Karsan spoke to, last week, the spikes in short-dated -sticky skew – the “first we’ve seen since [the] secular decline began” – hints at a “critical change in dealer positioning.”

“We’re transitioning to a fat left tail, right-based distribution,” Karsan adds

So why does any of this matter?

There still appears to be a heavy supply of options, particularly those with less time to maturity, and skew remains poor-performing (hence comments in prior letters on the benefit of buying into implied skew convexity should volatility reprice).

Graphic: Via Charles Schwab Corporation-owned (NYSE: SCHW) TD Ameritrade’s Thinkorswim. Note historical or realized volatility (RVOL) versus that which is implied (IVOL).

Basically, participants are hedged and volatility remains well-supplied. 

If there was to be forced selling or demand for protection by a greater share of the market in ways not recently seen, then the repricing of the aforementioned structures would be a boon for those who own them.

Graphic: Via Banco Santander SA (NYSE: SAN) research.

Options have a “non-zero second-order price sensitivity (or convexity) to a change in volatility,” as Mohamed Bouzoubaa et al explain well in the book Exotic Options and Hybrids.

“ATM vanillas are [not] convex in the underlying’s price, … but OTM vanillas do have vega convexity … [so], when the holder of an option is long vega convexity, we say she is long vol-of-vol.”

In other words, by owning that protection – e.g., butterfly and back spreads – you are positioned to monetize on a continued non-linear repricing of volatility. The difficult part is cutting the decay of those spreads when nothing happens.

Read: Trading Volatility, Correlation, Term Structure and Skew by Colin Bennett et al. Originally sourced via Academia.edu.

As an aside, despite the bearish tilt in positioning, there has been a notable uptick in index call buying per UBS Group AG (NYSE: UBS), presumably so that participants don’t miss out on a vicious reversal, should one transpire.

Graphic: Via UBS Group AG.

Adding, the “high starting point” in IVOL makes it possible to put on zero- and low-cost bets that deliver asymmetric payouts in case of violent and short-lived reversals. 

Read: Daily Brief for May 13, 2022.

Graphic: Via Banco Santander SA (NYSE: SAN) research, the return profile, at expiry, of a classic 1×2 (long 1, short 2 further away) ratio spread (the inverse of a back spread).

Technical: As of 6:30 AM ET, Wednesday’s regular session (9:30 AM – 4:00 PM ET), in the S&P 500, will likely open in the lower part of a negatively skewed overnight inventory, inside of prior-range and -value, suggesting a limited potential for immediate directional opportunity.

In the best case, the S&P 500 trades higher; activity above the $3,696.00 low volume area (LVNode) puts in play the $3,722.50 LVNode. Initiative trade beyond the LVNodes could reach as high as the $3,735.75 and $3,770.75 high volume areas (HVNodes), or higher.

In the worst case, the S&P 500 trades lower; activity below the $3,696.00 LVNode puts in play the $3,675.25 HVNode. Initiative trade beyond the HVNode could reach as low as the $3,639.00 RTH Low and $3,610.75 HVNode, or lower.

Click here to load today’s key levels into the web-based TradingView charting platform. Note that all levels are derived using the 65-minute timeframe. New links are produced, daily.
Graphic: 65-minute profile chart of the Micro E-mini S&P 500 Futures.

Considerations: Gap scenarios are in play, today.

Gaps ought to fill quickly. Should they not, that’s a signal of strength; do not fade. Leaving value behind on a gap-fill or failing to fill a gap (i.e., remaining outside of the prior session’s range) is a go-with indicator.

Auctioning and spending at least 1-hour of trade back in the prior range suggests a lack of conviction; in such a case, do not follow the direction of the most recent initiative activity.

Definitions

A structurally sound market will build on areas of high volume (HVNodes). Should the market trend for long periods of time, it will lack sound structure, identified as low volume areas (LVNodes). LVNodes denote directional conviction and ought to offer support on any test. 

If participants were to auction and find acceptance into areas of prior low volume (LVNodes), then future discovery ought to be volatile and quick as participants look to HVNodes for favorable entry or exit.

About

After years of self-education, strategy development, mentorship, and trial-and-error, Renato Leonard Capelj began trading full-time and founded Physik Invest to detail his methods, research, and performance in the markets.

Capelj also develops insights around impactful options market dynamics at SpotGamma and is a Benzinga reporter.

Some of his works include conversations with ARK Invest’s Catherine Wood, investors Kevin O’Leary and John Chambers, FTX’s Sam Bankman-Fried, Kai Volatility’s Cem Karsan, The Ambrus Group’s Kris Sidial, among many others.

Disclaimer

In no way should the materials herein be construed as advice. Derivatives carry a substantial risk of loss. All content is for informational purposes only.

Categories
Commentary

Daily Brief For June 16, 2022

The daily brief is a free glimpse into the prevailing fundamental and technical drivers of U.S. equity market products. Join the 300+ that read this report daily, below!

What Happened

Overnight, equity index futures took back the post-Federal Open Market Committee (FOMC) bump. Bonds and most commodity products (less gold) followed suit. 

The Federal Reserve (Fed) admitted to run-away prices and committed to slaying inflation via tougher action. Accordingly, the central bank upped interest rates by 75 basis points. This was the largest increase since 1994 and, as the Fed commented, another 75 basis point hike may be in store at the next meeting in July.

In other news, the Celsius Network (CRYPTO: CEL), a crypto favorite that amassed in excess of $20 billion in assets, froze withdrawals to stop what some say was a potential bank run. Private equity is facing a so-called “crisis of value” given over inflated prices in that market. 

We shall unpack the latter, below, a bit.

Also, U.S. retail sales posted their first drop in five months, the Bank of England raised its rates along with the Swiss central bank which surprised with its first hike since 2007.

This is all the while Goldman Sachs Group Inc’s (NYSE: GS) buyback desk was flooded with volumes about 3 times last year’s daily average. This could be construed as companies viewing the latest selloff as an “opportunity to repurchase shares rather than retrenching.”

Ahead is data on jobless claims, building permits, housing starts, as well as the Philadelphia Fed’s manufacturing index (8:30 AM ET).

Graphic updated 6:30 AM ET. Sentiment Risk-Off if expected /ES open is below the prior day’s range. /ES levels are derived from the profile graphic at the bottom of the following section. Levels may have changed since initially quoted; click here for the latest levels. SqueezeMetrics Dark Pool Index (DIX) and Gamma (GEX) calculations are based on where the prior day’s reading falls with respect to the MAX and MIN of all occurrences available. A higher DIX is bullish. At the same time, the lower the GEX, the more (expected) volatility. Learn the implications of volatility, direction, and moneyness. SHIFT data used for S&P 500 (INDEX: SPX) options activity. Note that options flow is sorted by the call premium spent; if more positive, then more was spent on call options. Breadth reflects a reading of the prior day’s NYSE Advance/Decline indicator. VIX reflects a current reading of the CBOE Volatility Index (INDEX: VIX) from 0-100.

What To Expect

Fundamental: Fed funds rate upped 75 basis points. 

Now, it appears the rate will surpass 3% after the FOMC affirmed its commitment “to returning inflation to its 2% objective.” Participants reacted, pricing in the potential for a rate peak in the range of 4.00-4.75% early-to-mid 2023, after which the easing cycle is to likely take place.

Graphic: Via CME Group Inc’s (NASDAQ: CME) FedWatch Tool.

The overnight rate is expected to peak near 4.23% by mid-2023. This is a given via a quick check of the Eurodollar (FUTURE: /GE) futures curve, a reflection of participants’ outlook on interest rates. The peak of the Fed-rate-hike cycle – terminal rate – is around March 2023 (previously it was June).

For context, the price of /GE reflects the interest offered on U.S. dollar-denominated deposits at banks outside of the U.S. With that, they’re “expressed numerically using 100 minus the implied 3-month U.S. dollar LIBOR interest rate,” per Investopedia. This means that at current March 2023 prices (95.775), this reflects an implied interest rate settlement rate of 4.225%.

Read: The shift from the Eurodollar to SOFR is accelerating as “SOFR adoption cracked 50%.”

Moreover, the FOMC’s forecasts for inflation have moved all the while predictions for 2023 and 2024 have not. 

Graphic: Via FOMC. Taken from Bloomberg.

GDP growth estimates, too, have shifted but with the expectation there still will be growth.

Graphic: Via FOMC. Taken from Bloomberg.

As stated in this morning’s introduction (above), these policy adjustments are inflicting damage on some inflated areas of the market like crypto and private equity.

Recall that prevailing monetary policies made it easier to borrow and make longer-duration bets on ideas with a lot of promise in the future. Central banks, too, underwrote losses of this regime and encouraged continued growth. This had consequences on the real economy and asset prices which rose and kept deflationary pressures at bay.

As well put forth in our May 18, 2022 commentary, the recent market rout is a recession and the direct reflection of the unwind of carry. Capital was “misallocated” and the Fed’s move to control price stability is “completely unreasonable” as they’re not in a position to do it “without bringing down the markets,” per Kai Volatility’s Cem Karsan.

Read: Kris Abdelmessih’s Moontower #148 on prevailing macroeconomic perspectives.

As Lyn Alden of Lyn Alden Investment Strategy put forth, “unfortunately for the Fed, the U.S. economic growth rate is already decelerating” and, to cut inflation, it must reduce demand for goods. Indeed, this is recessionary and is already reflected by slowing retail sales.

Graphic: Via Bloomberg. “As price pressures become more entrenched in the economy, spending will likely ebb either due to higher prices, higher interest rates, or both.”

As Bloomberg explains, spending has shifted and is supported by consumers spending down their savings and leveraging credit cards. 

Read: Klarna’s debt costs rise as buy-now-pay-later sector suffers.

Graphic: Via Bloomberg. This “could be concerning if Americans fail to keep up on payments. That could ultimately mean a slowdown in the pace of inflation-adjusted consumption.”

“If this credit bubble ever pops, it’s going to be the most catastrophic market failure that anyone has ever read about — but let’s hope that doesn’t happen,” Mark Spitznagel, Miami-based Universa’s CIO, said in early June. “We’ve gotten ourselves into a tough spot.” 

Perspectives: “The move in markets prices in more than enough recession risk, and we believe a near-term recession will ultimately be avoided thanks to consumer strength, Covid reopening/recovery, and policy stimulus in China,” JPMorgan Chase & Co’s (NYSE: JPM) Marko Kolanovic and his team said

Positioning: Measures of implied volatility had come in, yesterday, and that was significant in that participants have a lot of exposure to put options.

Graphic: Via SpotGamma’s Hedging Impact of Real-Time Options (HIRO) indicator.

Further, (naively) we see it as liquidity providers being short those puts. As volatility continues to come in, the exposure of those options to direction (delta) compresses. 

As a result, liquidity providers cut some of their negative (static) delta hedges to that positive delta put position.

Graphic: Via SpotGamma. “SPX prices X-axis. Option delta Y-axis. When the factors of implied volatility and time change, hedging ratios change. For instance, if SPX is at $4,700.00 and IV jumps 15% (all else equal), the dealer may sell an additional 0.2 deltas to hedge their exposure to the addition of a positive 0.2 delta. The graphic is for illustrational purposes, only.”

This means that the potential options expiration (OPEX) related bullishness, so to speak, was pulled forward and, now, markets, being markedly lower than they were immediately after the FOMC event, are at risk of trading into (and below) the sizeable interest down below.

Read: Daily Brief for June 15, 2022.

Graphic: Taken by Physik Invest from Interactive Brokers Group Inc (NASDAQ: IBKR). Updated 6/15/2022.

As stated, yesterday, these options, down below, have little time to expiry and, thus, their gamma (options sensitivity to direction) grows rather large, at near-the-money strikes.

Graphic: Text taken from Exotic Options and Hybrids: A Guide to Structuring, Pricing and Trading. 

As the time to expiry narrows, above the strike in question delta decays, and counterparts buy back their static delta hedges. 

As the time to expiry narrows, below the strike in question delta expands and counterparts sell more static delta to hedge.

Graphic: Text taken from Exotic Options and Hybrids: A Guide to Structuring, Pricing and Trading.

This means that if below these high-interest strikes, associated hedging, less any new reach for protection would pressure markets lower. If above, hedging, less new sales of protection, would bolster markets higher.

Ultimately, if lower, all else equal, the June 17 OPEX will coincide with the removal of the in-the-money options exposures in question. This opens a window during which markets may have less pressure to rally against.

Bonus: As SpotGamma explains, “​​[g]iven the supply and demand of volatility, as well as divergences in the volatility that the market realizes and implies from options activity, there’s a case to be made for maintaining positive exposure to direction via long volatility.”

Read: Trading Volatility, Correlation, Term Structure and Skew by Colin Bennett et al. Originally sourced via Academia.edu.

Graphic: Taken by Physik Invest from Interactive Brokers Group Inc (NASDAQ: IBKR). The divergence in volatility implied (IVOL) by participants’ options activity, versus that which the market realizes (RVOL) resurfaced on June 15, 2022, in the Nasdaq 100 (INDEX: NDX).

Technical: As of 6:30 AM ET, Thursday’s regular session (9:30 AM – 4:00 PM ET), in the S&P 500, will likely open in the lower part of a negatively skewed overnight inventory, outside of prior-range and -value, suggesting a potential for immediate directional opportunity.

In the best case, the S&P 500 trades higher; activity above the $3,688.75 HVNode puts in play the $3,727.75 HVNode. Initiative trade beyond the $3,727.75 HVNode could reach as high as the $3,773.25 HVNode and $3,808.50 HVNode, or higher.

In the worst case, the S&P 500 trades lower; activity below the $3,688.75 HVNode puts in play the $3,664.25 HVNode. Initiative trade beyond the $3,664.25 HVNode could reach as low as the $3,610.75 HVNode and $3,587.25 LVNode, or lower.

Click here to load today’s key levels into the web-based TradingView charting platform. Note that all levels are derived using the 65-minute timeframe. New links are produced, daily.
Graphic: 65-minute profile chart of the Micro E-mini S&P 500 Futures.

What People Are Saying

Definitions

Should the market trend for long periods of time, it will lack sound structure, identified as low volume areas (LVNodes). LVNodes denote directional conviction and ought to offer support on any test. 

If participants were to auction and find acceptance into areas of prior low volume (LVNodes), then future discovery ought to be volatile and quick as participants look to HVNodes for favorable entry or exit.

About

After years of self-education, strategy development, mentorship, and trial-and-error, Renato Leonard Capelj began trading full-time and founded Physik Invest to detail his methods, research, and performance in the markets.

Capelj also develops insights around impactful options market dynamics at SpotGamma and is a Benzinga reporter.

Some of his works include conversations with ARK Invest’s Catherine Wood, investors Kevin O’Leary and John Chambers, FTX’s Sam Bankman-Fried, Kai Volatility’s Cem Karsan, The Ambrus Group’s Kris Sidial, among many others.

Disclaimer

In no way should the materials herein be construed as advice. Derivatives carry a substantial risk of loss. All content is for informational purposes only.

Categories
Commentary

Daily Brief For May 25, 2022

The daily brief is a free glimpse into the prevailing fundamental and technical drivers of U.S. equity market products. Join the 300+ that read this report daily, below!

What Happened

Overnight, equity index futures were steady alongside commodities and bonds. This is ahead of the release of minutes from a Federal Reserve (Fed) policy meeting. 

In the news were advertising and social media firms. Snap Inc (NYSE: SNAP) warned of slower growth and deterioration in the macro-environment. Its peers Meta Platforms Inc (NASDAQ: FB), Alphabet Inc (NASDAQ: GOOGL), and Twitter Inc (NYSE: TWTR) also saw weakness.

China’s COVID Zero commitment likely nudges it off a path to achieve economic targets “by a large margin for the first time ever,” as Bloomberg explains

This is as China and Russia have conducted one of their largest joint air drills “to send their own political, economic and military message to the international community,” much of which is at Davos, Switzerland doing thought exercises.

In a recent podcast, Pippa Malmgren, who is a former White House adviser and economist, well said, particularly in reference to some of the tension abroad, that “autocracy is not working well,” and “[y]ou go to war because … you have a domestic objective.”

Thought it was interesting. Give it a listen, here.

And, finally, Michael Burry of the “Big Short” sent a cryptic tweet alluding to what is likely the risk of another financial collapse. 

Moreover, ahead is data on durable goods and core capital equipment orders (8:30 AM ET). Later, the Fed publishes the minutes of its last policy meeting (2:00 PM ET).

Graphic updated 6:10 AM ET. Sentiment Neutral if expected /ES open is inside of the prior day’s range. /ES levels are derived from the profile graphic at the bottom of the following section. Levels may have changed since initially quoted; click here for the latest levels. SqueezeMetrics Dark Pool Index (DIX) and Gamma (GEX) calculations are based on where the prior day’s reading falls with respect to the MAX and MIN of all occurrences available. A higher DIX is bullish. At the same time, the lower the GEX, the more (expected) volatility. Learn the implications of volatility, direction, and moneyness. SHIFT data used for S&P 500 (INDEX: SPX) options activity. Note that options flow is sorted by the call premium spent; if more positive, then more was spent on call options. Breadth reflects a reading of the prior day’s NYSE Advance/Decline indicator. VIX reflects a current reading of the CBOE Volatility Index (INDEX: VIX) from 0-100.

What To Expect

Fundamental: The Fed will issue policy meeting minutes that may provide clarity with respect to its intent to hike and reduce the size of its balance sheet.

In focus, per ex-Fed insider Ellen Meade, is “the rate path, the expected economic conditions, and what policymakers want to see from the data before they slow the pace of tightening.”

“The minutes may tell us they see the tightening in conditions this time around as greater than in earlier cycles. If that’s the case, then they may judge that they don’t need to raise the funds rate by as much this time around.”

Graphic: Via Morgan Stanley (NYSE: MS) research.

John Authers notes, however, that “inflation tends to move in waves” and it doesn’t, usually, “plateau and stay there.”

Graphic: Via Bloomberg.

“That suggests that even though the focus is already shifting to whether there is evidence of a growth slowdown,” he added, in a statement echoed by Meade who is betting on slower “GDP growth, below its longer-run rate, and a rise in the unemployment rate, perhaps to its longer-run median rate or slightly above.”

Graphic: Via Bloomberg.

Pursuant to those last remarks, the Fed’s Raphael Bostic is already floating a pause to rate hikes near September if inflation falls more than expected over the summer.

As Diane Swonk of Grant Thorton explains, “Policy works with a lag. The Fed wants to catch up but not outrun the market in its effort to tighten credit market conditions.”

Graphic: Via Bloomberg.

Futures First analyst Rishi Mishra, who is also the author of the “On Another Note” newsletter, suggests the Federal Open Market Committee may, rather, hone in on monthly changes with annual inflation still elevated.

“This brings down inflation expectations into a range where the Fed feels comfortable about de-anchoring risks,” Mishra said.

Graphic: Via JPMorgan Chase & Co (NYSE: JPM). Taken from Bloomberg. Though, potentially, “premature,” JPM’s model tracking the S&P 500, credit spreads and yield curve implies a 40% chance of a recession.

JPM’s Marko Kolanovic adds: “We have gone from a situation where both stocks and bonds were sold on the back of de-leveraging, to a situation where bonds rallied as stocks fell, nudging stock/bond correlations toward a more normal (negative) level.”

“We do indeed think this is where things could be gradually heading, but we acknowledge this is not likely to play out in a linear way.”

Graphic: Via @MrBlonde_macro. “Stock/bond correlation negative over the last 10 days. Some ‘normalization’ in cross-market relationships can be a source of relief.” The flip happened with 10-year yields at or above 3%.

Positioning: In yesterday’s in-depth write-up, we talked about the underperformance of implied volatility (IVOL), relative to that which is realized (RVOL).

Dennis Davitt of Millbank Dartmoor Portsmouth had explained that the “RVOL of the underlying S&P 500 is above 27% … with IVOL of options trading between 24%-27%,” which translates to a VIX at 30%.

Graphic: Via Goldman Sachs Group Inc (NYSE: GS). Taken from The Market Ear.

So, essentially, it makes more sense to have exposure to underlying markets, synthetically (i.e., own options). 

This, though, merits a bit more clarification (as I do not want it to be construed as if I was buying, systemically, bets on the downside). The opposite, actually.

Moreover, this was stated in the context of a market that is “(1) stretched and (2) near a critical inflection which we see at $3,700.00 SPX,” per SpotGamma. Separately, investors are bidding “skew on the call side” amid their “fear of missing on the upside.”

That’s when it makes sense to buy closer to at-the-money (ATM) and sell farther from ATM, or out-of-the-money (OTM). For instance, a margin intensive but low cost call +1 [ATM] x -2 [OTM] ratio spread

Note, however, that width and timing are everything. Too much time or too narrow may result in asymmetric losses when the demand for upside bets further out in price and time bids the skew that you’re short, relative to the at-the-money volatility you own. 

I’m willing to talk through this via email, if interested. Ping me at renato@physikinvest.com. I’m mindful that if I do post actual trade ideas, people may take them without knowing how to size and manage them, accordingly. Big yikes!

Goldman validates this thesis: “Even though the VIX’s reaction to recent spot downside has been mild, its high starting point leaves vol high overall, and we like strategies with a short volatility bias, including put selling and 1×2 call spread overlays.”

Graphic: Via Banco Santander SA (NYSE: SAN) research, the return profile, at expiry, of a classic 1×2 (long 1, short 2 further away) ratio spread.

Further, though SpotGamma assigns an edge to lower prices until the June FOMC and OPEX, “markets (which are already ‘fully loaded’ with puts) [are likely] pressured by liquidity providers’ hedging [at most] down to $3,700.00,” the area where that added pressure from hedging cools.

Graphic: Via SpotGamma.

Technical: As of 6:15 AM ET, Wednesday’s regular session (9:30 AM – 4:00 PM ET), in the S&P 500, will likely open in the lower part of a balanced overnight inventory, just inside of prior-range and -value, suggesting a limited potential for immediate directional opportunity.

In the best case, the S&P 500 trades higher; activity above the $3,943.25 HVNode puts in play the $3,969.00 ONH. Initiative trade beyond the ONH could reach as high as the $4,061.00 VPOC and $4,095.00 ONH, or higher.

In the worst case, the S&P 500 trades lower; activity below the $3,943.25 HVNode puts in play the $3,917.00 VPOC. Initiative trade beyond the VPOC could reach as low as the $3,863.25 LVNode and $3,831.00 VPOC, or lower.

Click here to load today’s key levels into the web-based TradingView charting platform. Note that all levels are derived using the 65-minute timeframe. New links are produced, daily.
Graphic: 65-minute profile chart of the Micro E-mini S&P 500 Futures.

Considerations: Push-and-pull, as well as responsiveness near key-technical areas (discernable visually on a chart), suggests technically-driven traders with shorter time horizons are very active.

Such traders often lack the wherewithal to defend retests.

Large participants (who often move by committee) seldom respond to key technical inflections. It is their activity that often results in poor reliability of our technical levels.

Sometimes, the better trade is to wait for the larger participants’ entry and use the expansion of the range as a confirmation of a new trend.

Catalysts to consider include the release of Federal Open Market Committee (FOMC) minutes, Wednesday.

Definitions

Overnight Highs And Lows (ONH and ONL): Typically, there is a low historical probability associated with overnight rally-highs (lows) ending the upside (downside) discovery process.

Volume Areas: A structurally sound market will build on areas of high volume (HVNodes). Should the market trend for long periods of time, it will lack sound structure, identified as low volume areas (LVNodes). LVNodes denote directional conviction and ought to offer support on any test. 

If participants were to auction and find acceptance into areas of prior low volume (LVNodes), then future discovery ought to be volatile and quick as participants look to HVNodes for favorable entry or exit.

POCs: POCs are valuable as they denote areas where two-sided trade was most prevalent in a prior day session. Participants will respond to future value tests as they offer favorable entry and exit.

About

After years of self-education, strategy development, mentorship, and trial-and-error, Renato Leonard Capelj began trading full-time and founded Physik Invest to detail his methods, research, and performance in the markets.

Capelj also develops insights around impactful options market dynamics at SpotGamma and is a Benzinga reporter.

Some of his works include conversations with ARK Invest’s Catherine Wood, investors Kevin O’Leary and John Chambers, FTX’s Sam Bankman-Fried, Kai Volatility’s Cem Karsan, The Ambrus Group’s Kris Sidial, among many others.

Disclaimer

In no way should the materials herein be construed as advice. Derivatives carry a substantial risk of loss. All content is for informational purposes only.