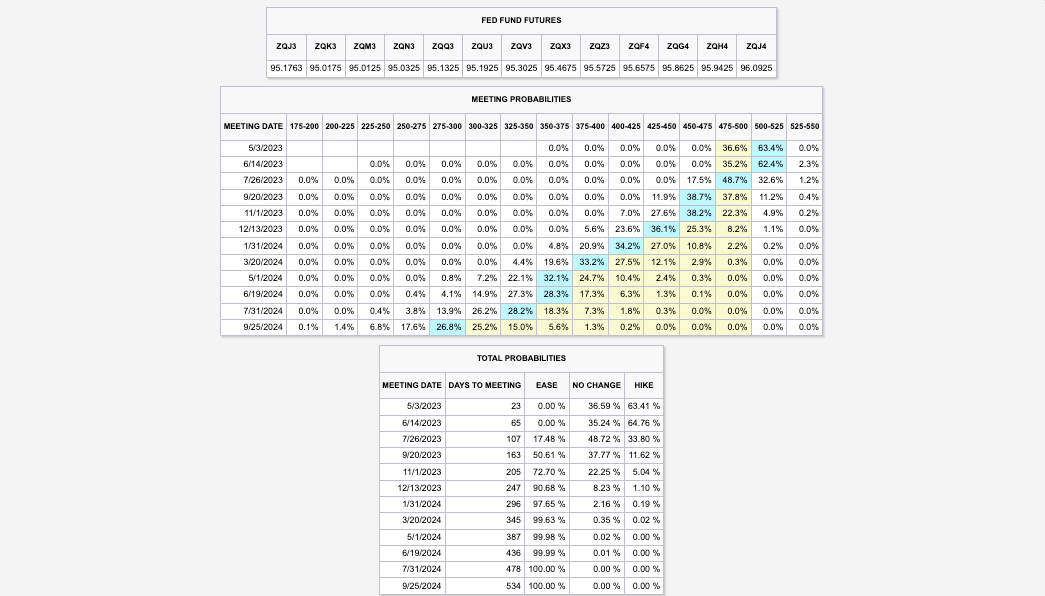
US payroll data has increased the possibility of a rate hike by the Federal Reserve or Fed in early May, leading to higher rates and affecting those who expected a pause or pivot through poorly performing yield curve steepener trades. The market expects the Fed to raise its target rate to 5.00-5.25% and keep it there through mid-year.
Graphic: Retrieved from CME Group Inc’s (NASDAQ: CME) FedWatch Tool.
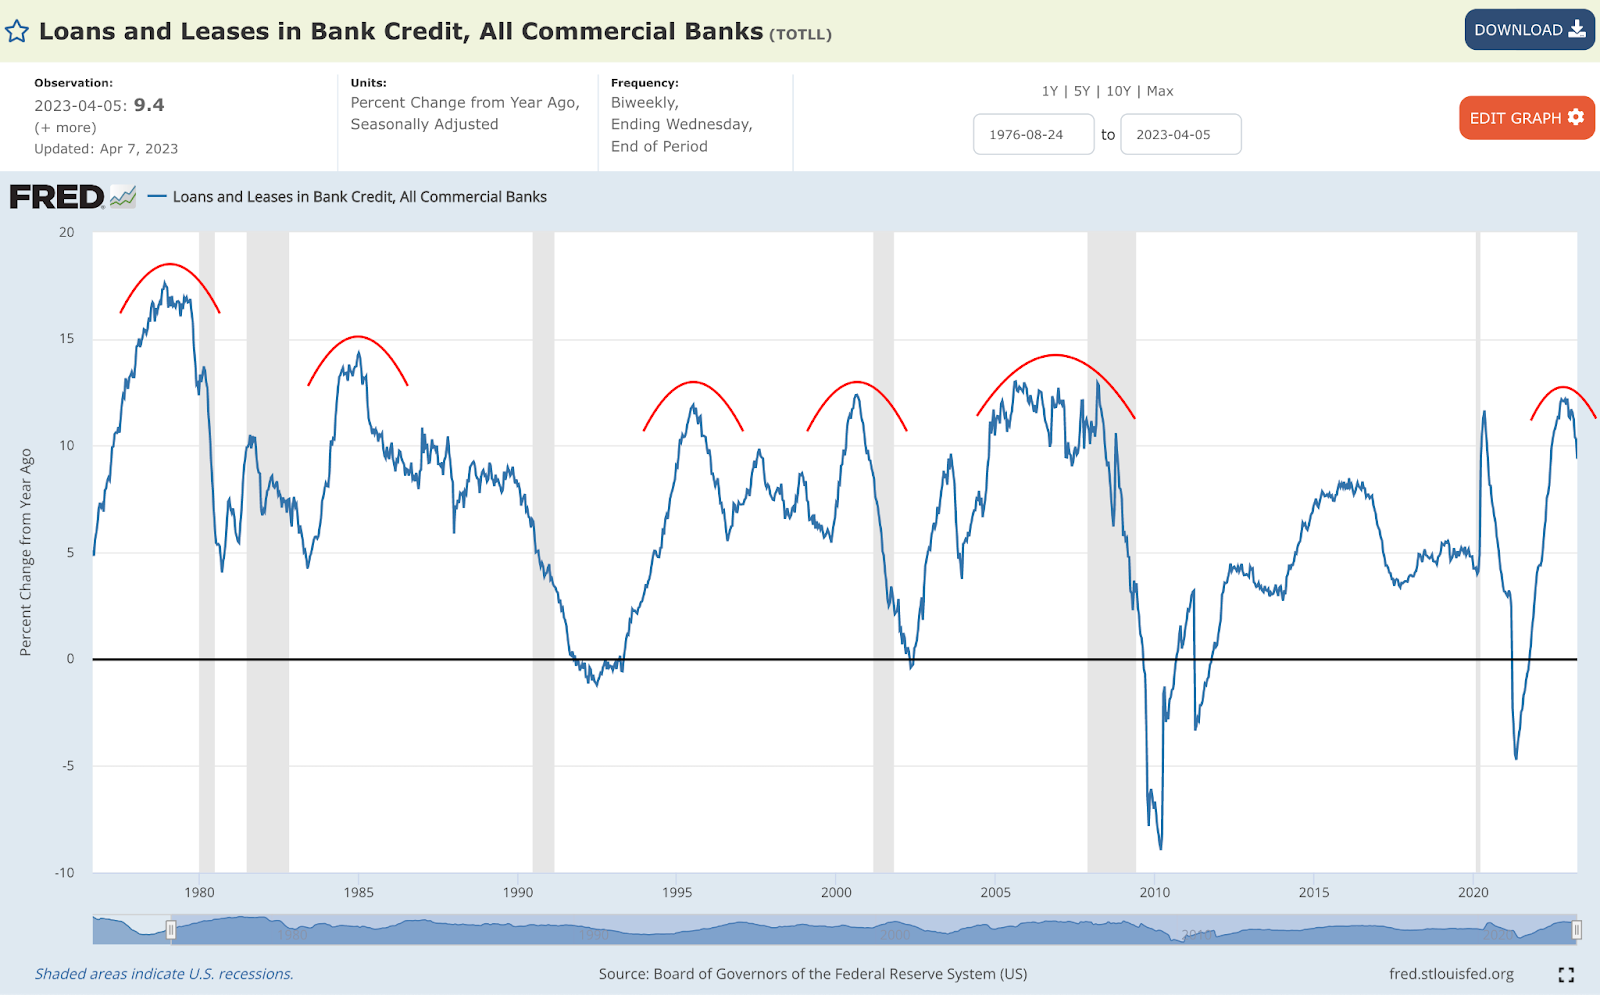
There is more to the pressure than just yields. Surveys indicate a drop in profits for sensitive areas of the equity market, such as technology and banks; as soon as the labor market starts softening, a credit crunch is expected to accelerate by some.
Graphic: Retrieved from the St. Louis Fed via Cubic Analytics.
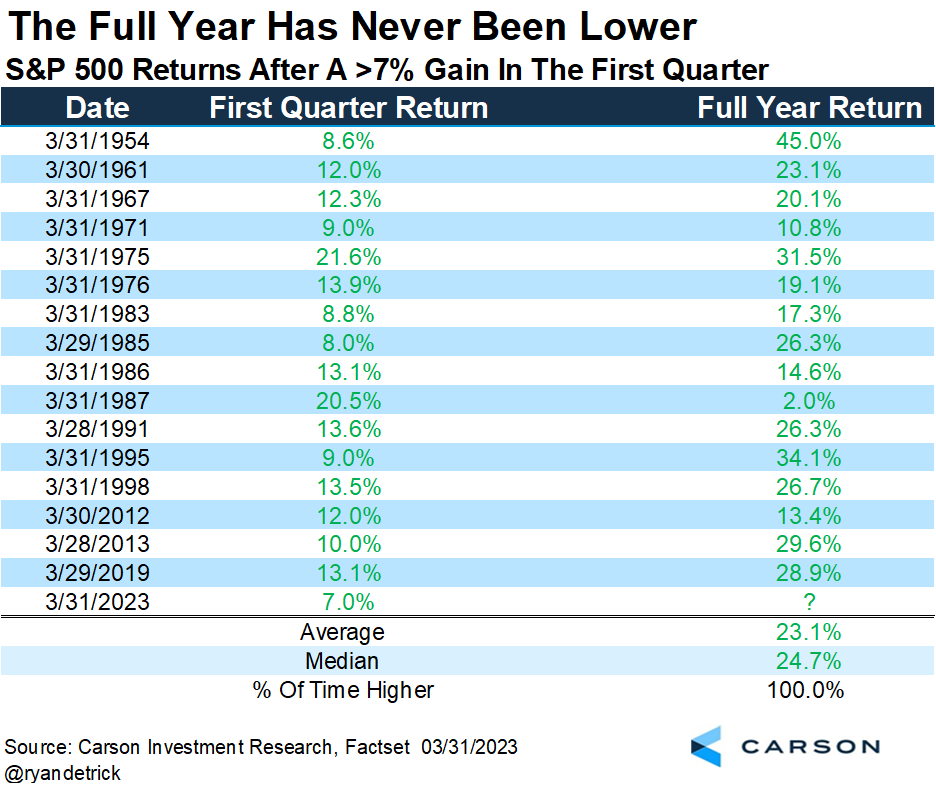
Despite the turbulence from earnings, data suggests the S&P 500 (INDEX: SPX) may perform well through year-end. Historically, the full-year return was always positive when the S&P 500 had a positive first quarter. However, there have been exceptions, says Callum Thomas, quoting data gathered by Ryan Detrick.
Graphic: Retrieved from Ryan Detrick via Callum Thomas’ Weekly S&P 500 ChartStorm.
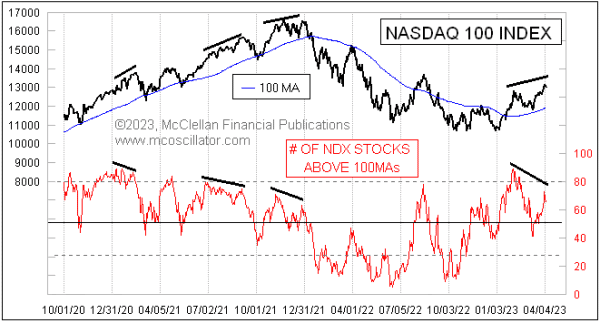
Peeking beneath the hood, only a few (primarily rate-sensitive) stocks have bolstered recent index strength; many components are not participating in the rally, which could be a harbinger of potential post-earnings weaknesses.
Graphic: Retrieved from McClellan Financial Publications.
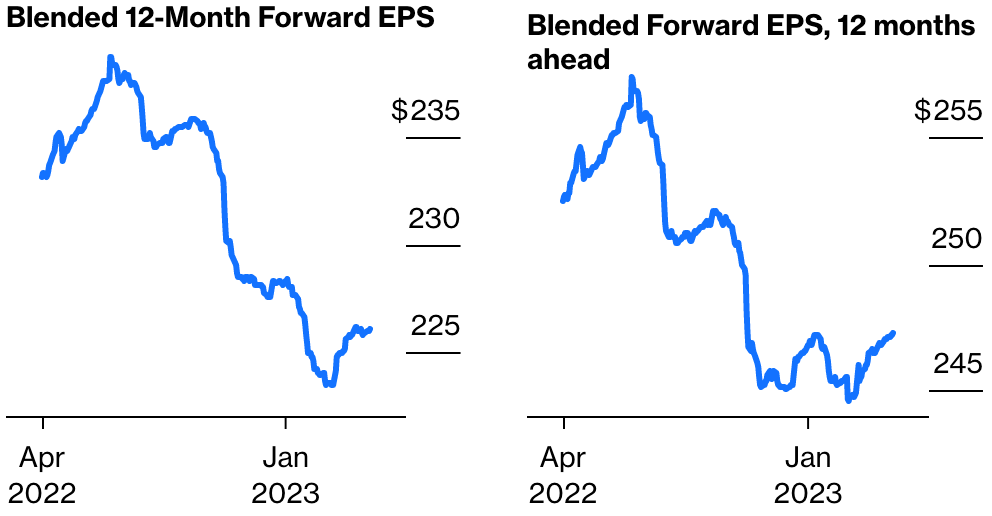
Notwithstanding, if rates continue to fall, so do borrowing costs; falling inflation cuts pressures on input cost; rising unemployment helps keep labor costs under control, Bloomberg reports. The forecasts (not surveys) actually show earnings holding up better than the narrative suggests.
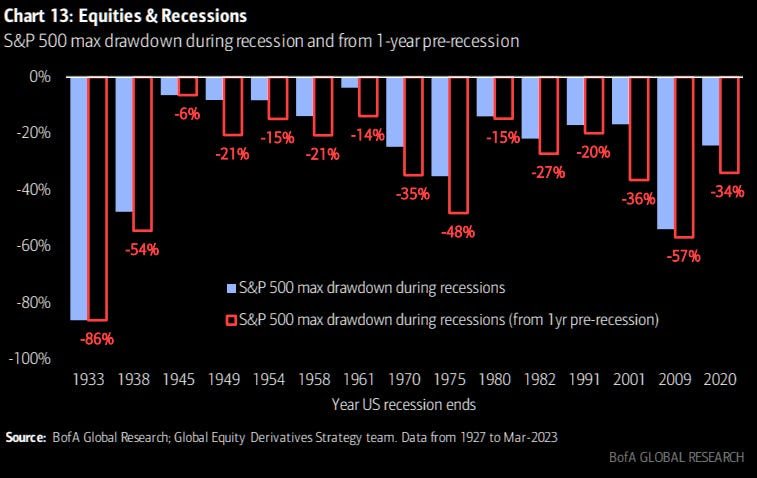
So what, then? In an annual report, JPMorgan Chase & Co (NYSE: JPM) concludes that if “we have higher inflation for longer, the Fed may be forced to increase rates higher than people expect despite the recent bank crisis.” Compounding the rate hikes is quantitative tightening or QT, the process of a central bank reducing the amount of money it has injected into an economy by selling bonds or other financial assets, which “may have ongoing impacts that might, over time, be another force, pushing longer-term rates higher than currently envisioned.” The net effect, though insights gleaned from the curve may be muddied due to the scale of recent interventions, is an “inverted yield curve [implying] we are going into a recession” and lower credit creation because, as Sergei Perfiliev well puts it, “if capital ends with the Fed, it is dead – it has left the economy and the banking system.”
Graphic: Retrieved from Bank of America Corporation (NYSE: BAC) via TheMarketEar.
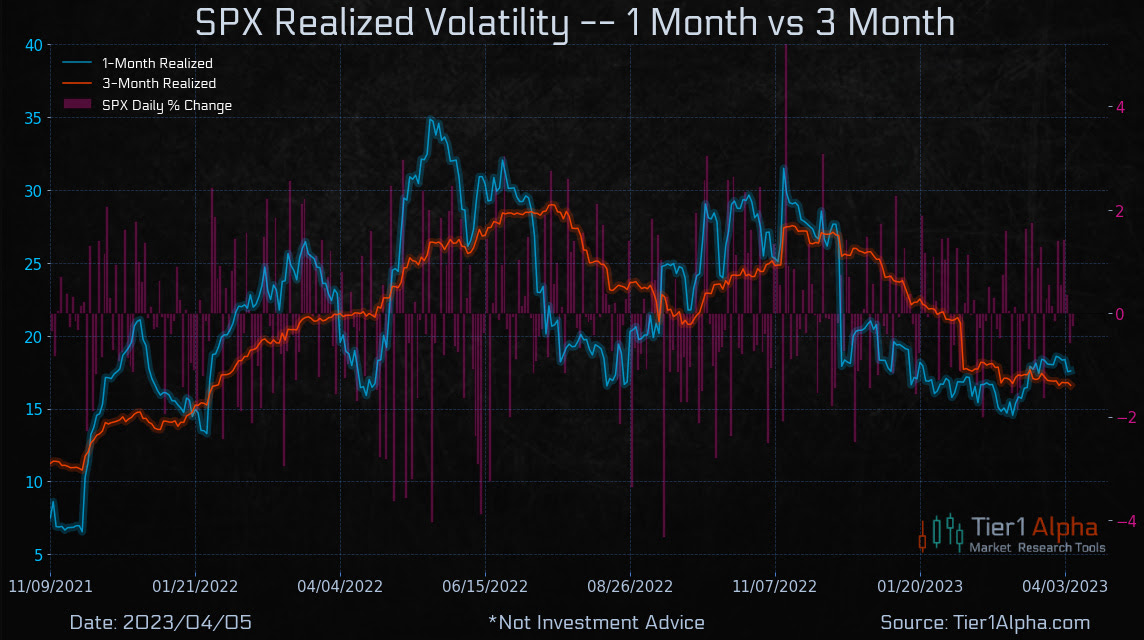
How do we position ourselves, given all these narratives? Equity volatility implied (IVOL) and realized (RVOL) decreased. This may continue to be a booster. In fact, “if markets remain within a +/-1.5% range, a drop in volatility could trigger significant buying activity from the vol-control space, with up to $14 billion in notional flows hitting the tape, creating a favorable environment for equities,” says Tier1Alpha.
So, positioning-wise, stocks could trade up into a “more combustible” state where “volatility is sticky into a rally,” as Kai Volatility’s Cem Karsan said would happen.
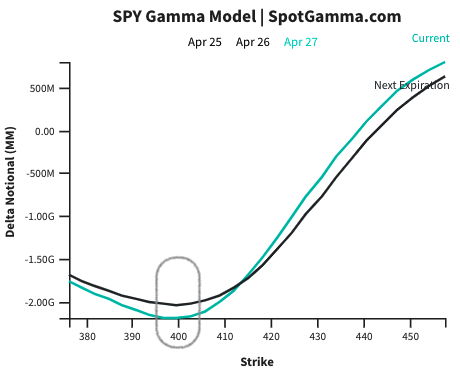
SpotGamma confirms that, based on current positioning, SPX IVOL is projected to move up as the underlying index moves up; there are likely many people chasing the rally with long calls, “creating a swelling of call skew.”
In this environment, very wide call ratio spread structures discussed in past letters may continue to do well. We can use the profits from those call structures to cut the cost of our bets on the equity market downside and lower interest rates.
Graphic: Retrieved from SpotGamma’s Weekend Note.
About
Welcome to the Daily Brief by Physik Invest, a soon-to-launch research, consulting, trading, and asset management solutions provider. Learn about our origin story here, and consider subscribing for daily updates on the critical contexts that could lend to future market movement.
Separately, please don’t use this free letter as advice; all content is for informational purposes, and derivatives carry a substantial risk of loss. At this time, Capelj and Physik Invest, non-professional advisors, will never solicit others for capital or collect fees and disbursements. Separately, you may view this letter’s content calendar at this link.
Welcome to the Daily Brief by Physik Invest, a soon-to-launch research, consulting, trading, and asset management solutions provider. Learn about our origin story here, and consider subscribing for daily updates on the critical contexts that could lend to future market movement.
Tomorrow’s Good Friday, and some markets, including the US’s equity market, will be closed. The Treasury market will remain open, albeit for less time, and may enable traders to price the impacts of coming releases, including non-farm payrolls (NFP). The consensus is that the US added 235,000 jobs in March, with the unemployment rate expected to remain steady at 3.50%. Higher for longer, then? We shall see.
Moreover, the big news is that the trend in mortgage rates, followed closely in the US, continues to be down. US 30-year fixed mortgage rates fell for a fourth-straight week, though applications to buy and refinance a home declined for the first time in a month. However, borrowing costs remain generally high and housing inventory low, keeping a cap on homebuying activity.
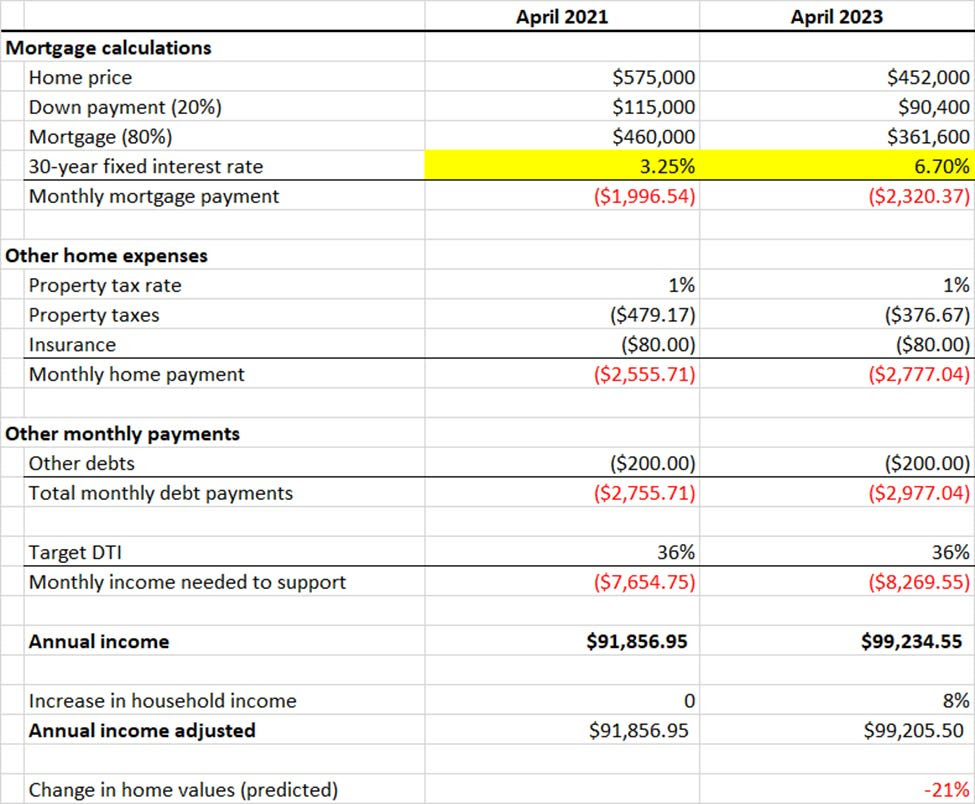
Notwithstanding, as explained by Akash Kanojia, for the housing market to “clear” on today’s affordability, home prices need to fall by about 20.00%.
To explain, typically, banks use a debt-to-income ratio to determine how much they will lend to a borrower to buy a house. Adding, they could enforce a limit of 80% on the purchase price of the house, and the remaining 20.00% is paid in cash by the borrower as a down payment.
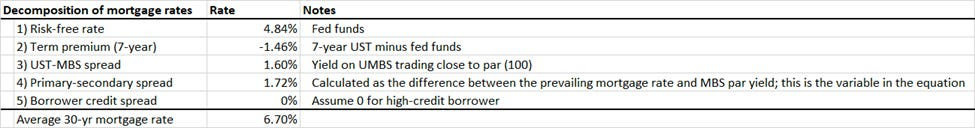
Mortgage rates comprise the short-term risk-free rate, term premium, the Treasury-MBS spread, the primary-secondary spread, and a credit spread based on the borrower’s creditworthiness. Any of these numbers changing can influence a borrower’s final payment to the lender.
Graphic: Retrieved from Negative Convexity.
An analysis starting with a home price in 2021 of $575,000.00 and a borrower whose income was $92,000.00, and adjusting all for inflation and movements in rates, the decrease in home values to boost affordability is 21.00%.
Graphic: Retrieved from Negative Convexity. “To do this analysis, I started with a home price in April 2021[1]($575,000) and figured out how much annual income a borrower would have needed at that time to buy the house (~$92,000). I then adjusted the annual income up by 8% for 2023, extrapolating from this, resulting in a person that would have earned ~$92,000 earning $99,205 today. Then I calculated how much house a person earning $99,205 can afford today at a mortgage rate of 6.70% ($452,000). Divide the two, and you get a decrease of 21%.”
A worst-case scenario is that the fed funds rate rises further to quell inflation. If the fed funds rate were to rise to 6.00-6.25%, matching the latest annualized CPI print, and “the market realizes the Fed is not going to cut, and the curve (e.g., 3m-7y UST) steepens to historical norms (~150 basis points long-term average), barring changes in the MBS spread, primary-secondary spread, and credit charges, this produces a ~40.00% decline in home prices.
Graphic: Retrieved from Negative Convexity.
Consequently, as the economy slows and layoffs increase, as we’re starting to see, it will negatively affect housing demand and affordability due to income stability and growth. On the bright side, inflation destroys the nominal value of debt, Kanojia says. Assuming wages keep up, buyers in hot markets may be spared if they can withhold from selling at market-clearing prices, Kanojia ends.
On a note about the doom and gloom (i.e., economy slowing and layoffs increasing, as well as yield curve steepening), JPMorgan Chase & Co’s (NYSE: JPM) Jamie Dimon says the following:
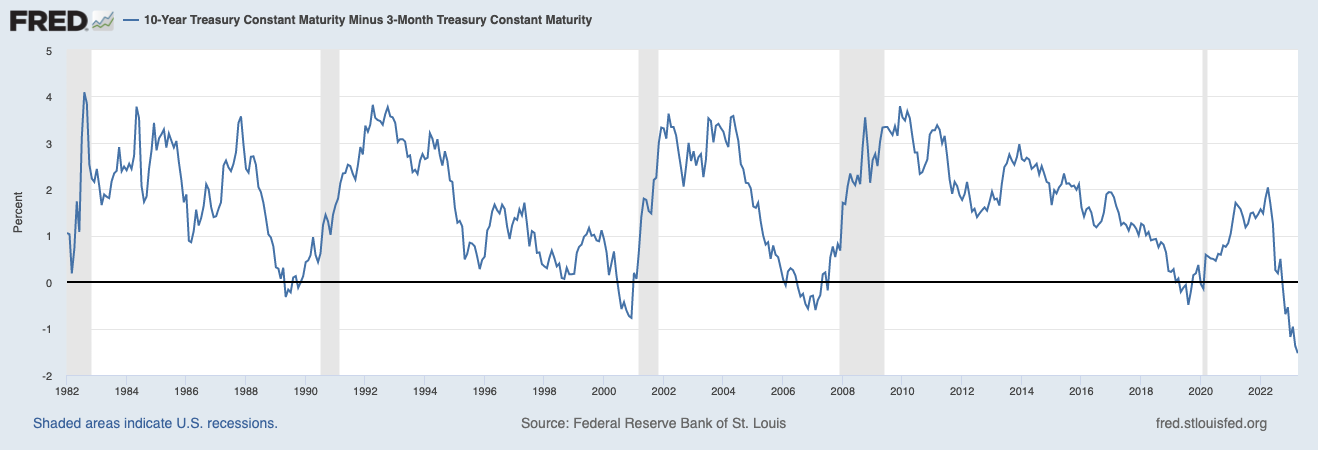
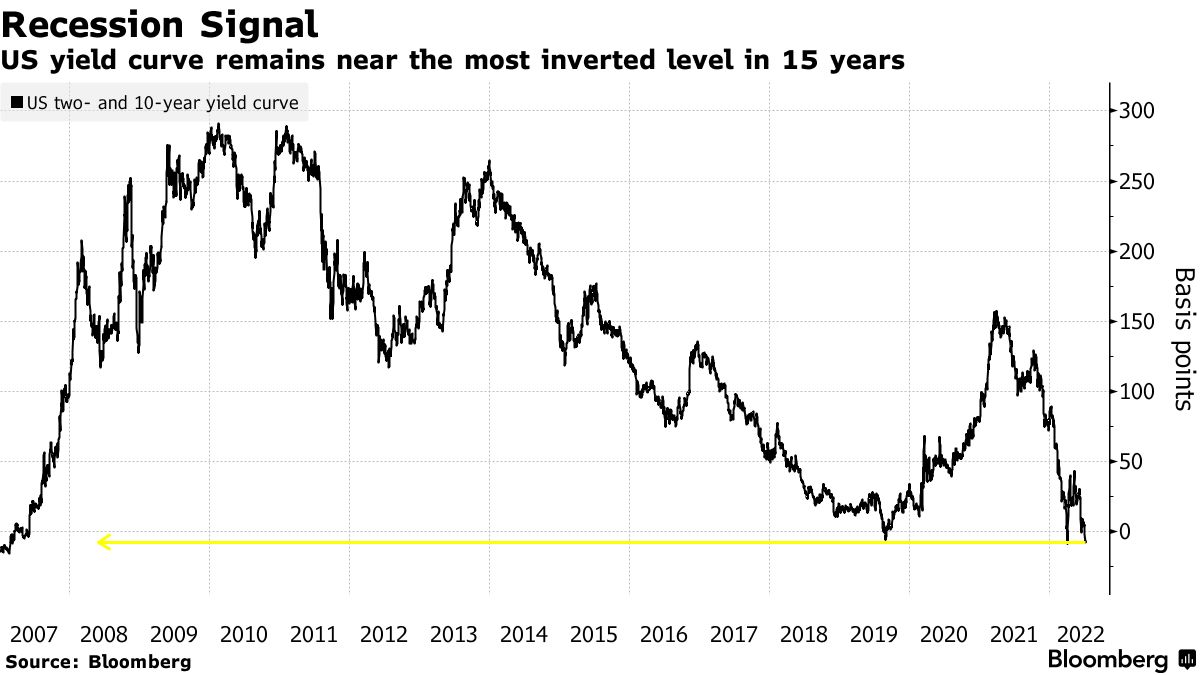
Today’s inverted yield curve implies that we are going into a recession. As someone once said, an inverted yield curve like this is ‘eight for eight’ in predicting a recession in the next 12 months. However, it may not be true this time because of the enormous effect of QT. As previously stated, longer-term rates are not necessarily controlled by central banks, and it is possible that the inversion we see today is still driven by prior QE and not the dramatic change in supply and demand that is going to take place in the future.
Dimon, the CEO of JPM, says that a graph showing the yields on bonds of different maturities is inverted, meaning that the yields on shorter-term bonds are higher than the yields on longer-term bonds. An inverted yield curve has often been a reliable indicator of an upcoming recession; it reflects investor demands for higher returns on short-term investments and expectations that short-term rates will fall in the future, which happens when the central bank cuts rates in response to a weak economy.
In other words, the conditions around the yield curve inversion are different this time.
Graphic: Retrieved from the Federal Reserve Bank of St. Louis. A normal yield curve is upward-sloping, meaning long-term interest rates are higher than short-term rates; investors demand a higher return for tying up their money for a longer period; the spread between the 10-year and 3-month treasury yield is positive.
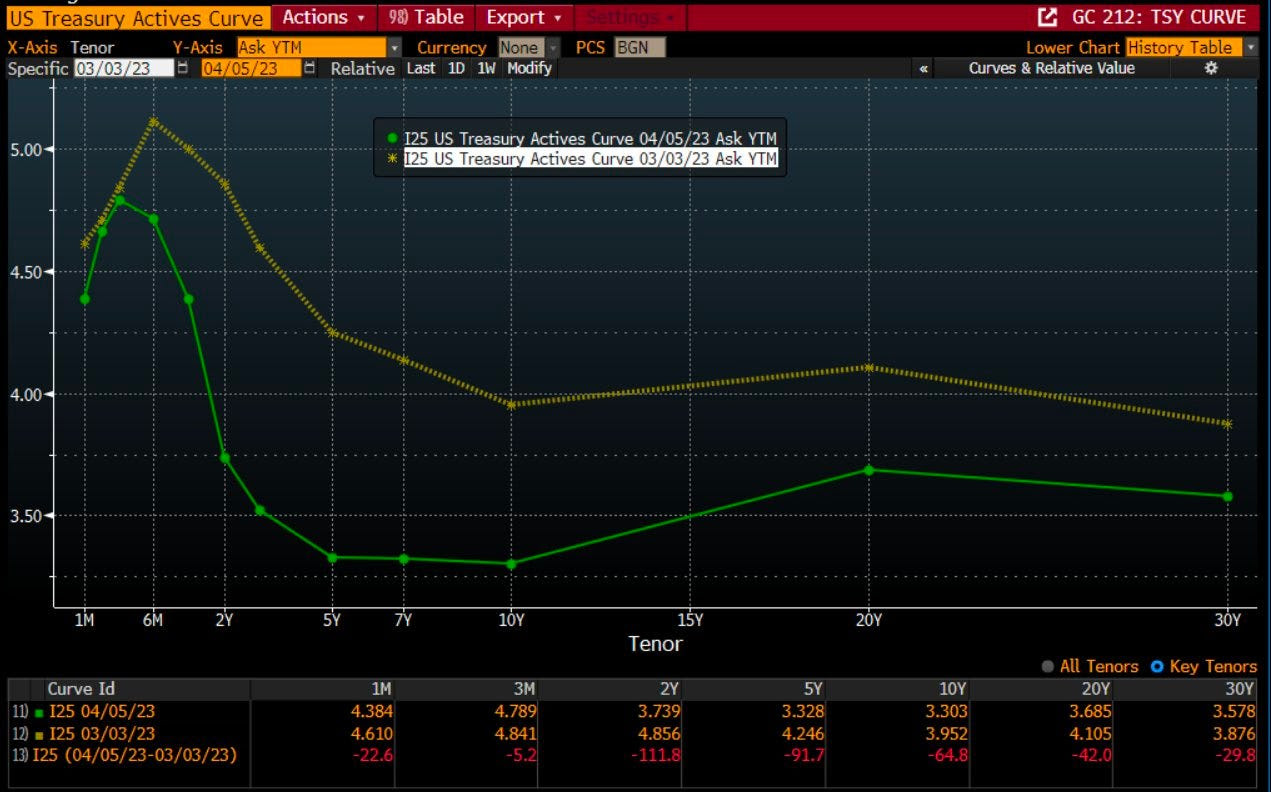
Further, a peek at the bond market shows cuts priced within six months.
Graphic: Retrieved from Bloomberg via @TheBondFreak.
Same thing with the Secured Overnight Financing Rate (SOFR) market, developed by the Federal Reserve to replace LIBOR, which was phased out due to manipulation concerns, among other things, as a benchmark interest rate.
Unlike LIBOR, which is based on unsecured lending transactions between banks, SOFR is based on actual transactions in the overnight repurchase agreement (repo) market, which makes it a more reliable benchmark. Consequently, the shift from the Eurodollar (FUTURE: /GE), used to intervene in support of the dollar and other currencies and allow lenders to lock in rates, to SOFR has accelerated, too.
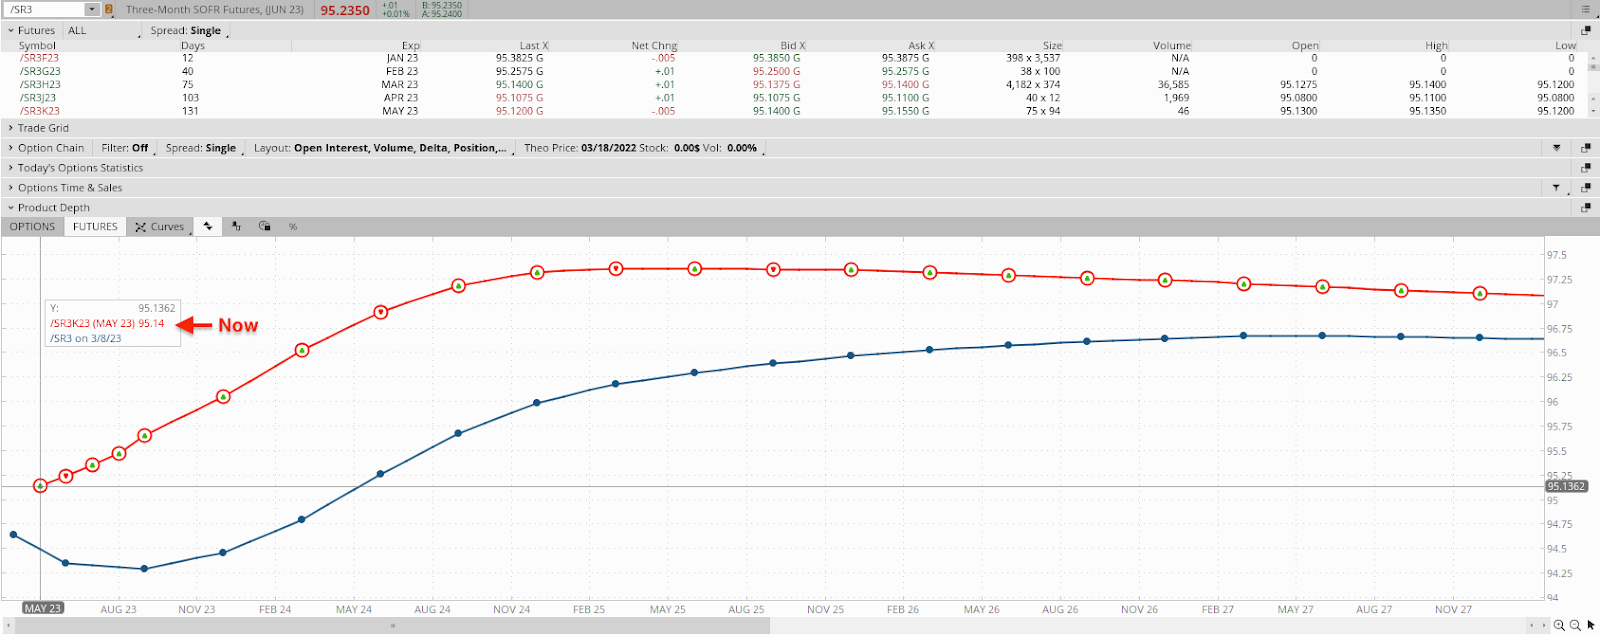
As stated yesterday, options activity in the SOFR market was centered around the 95.00 strikes. To calculate the implied interest rate using the value of the 3-month SOFR future, we can use the following formula:
Implied interest rate = 100 – future price; the implied interest rate calculated using the 3-month SOFR future is an annualized rate.
For example, if the current value of the 3-month SOFR future is 95.00, the implied interest rate would be 100.00 – 95.00 = 5.00%.
Graphic: Via Charles Schwab Corporation’s (NYSE: SCHW) thinkorswim platform. The three-month SOFR (FUTURE: /SR3) curve implies a 4.86% terminal rate today, followed by easing into year-end.
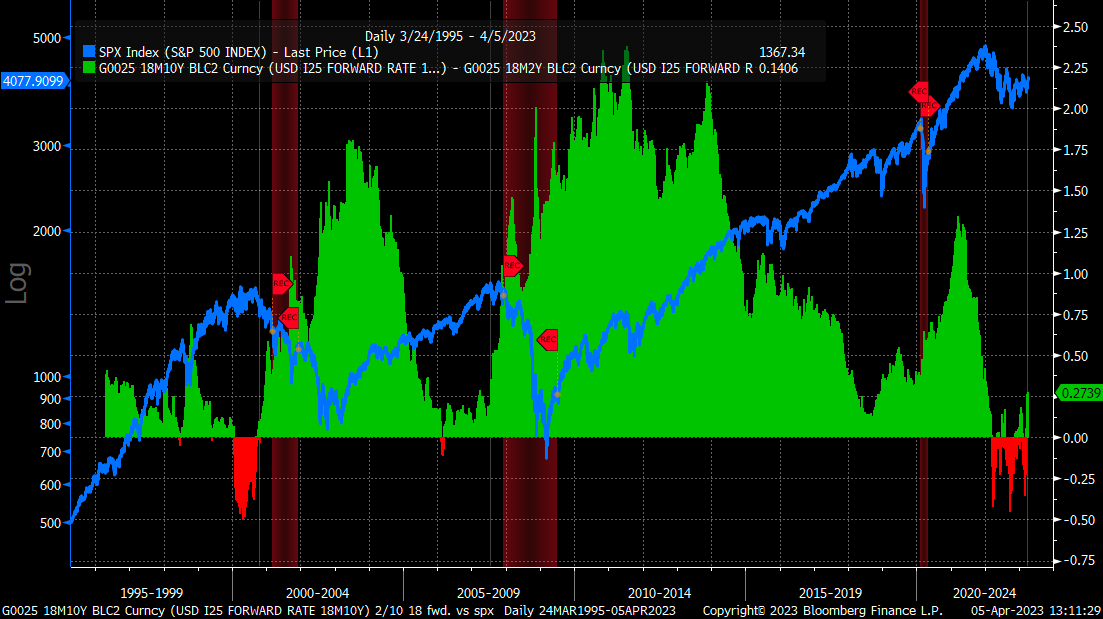
The S&P 500 (INDEX: SPX) has not bottomed based on these conditions. 3Fourteen Research concludes that the SPX has never bottomed during a Fed hike cycle, which one is still ongoing; typically, forward earnings stabilize and turn higher 3-6 months after a market bottom, which hasn’t happened; the 2-10 yield curve has never remained inverted six months after a major bear market bottom.
Graphic: Retrieved from Bloomberg via @MichaelMOTTCM.
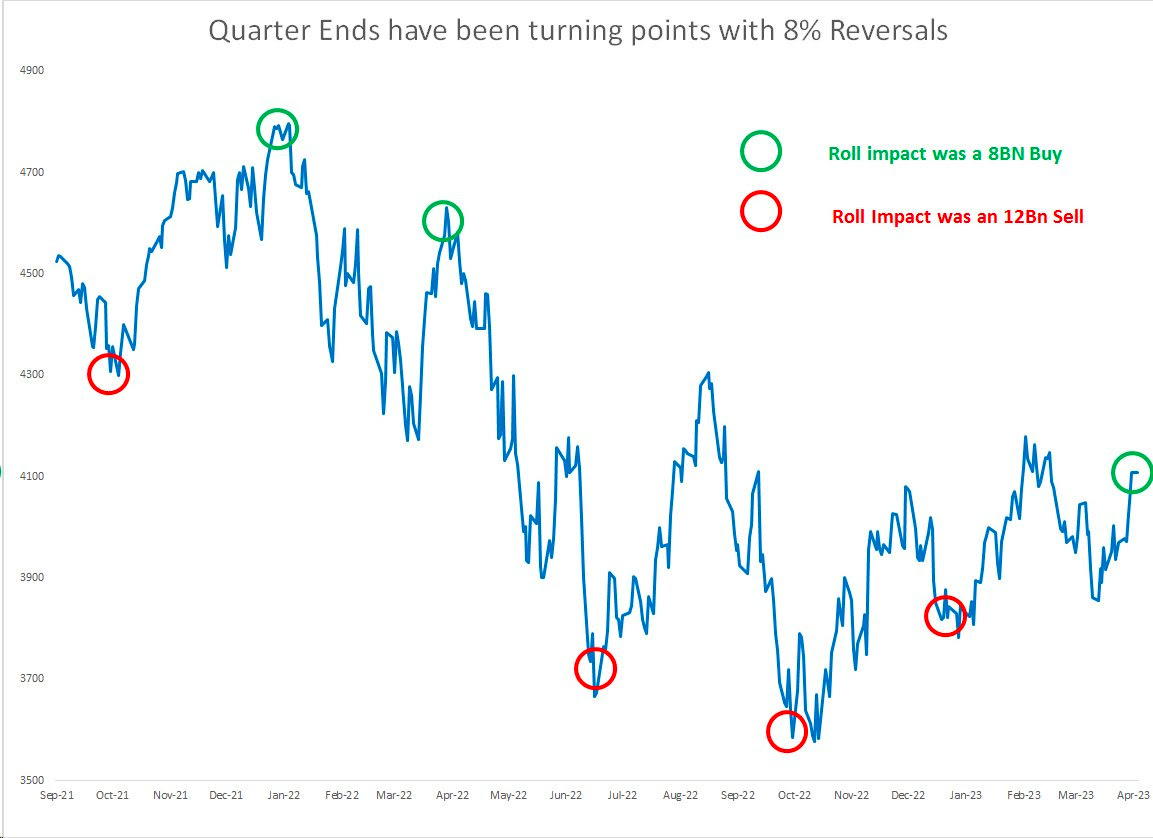
Notwithstanding all the doom and gloom, we explained in past letters that markets would likely remain strong through month-end March.
Graphic: Retrieved from Damped Spring Advisors’ Andy Constan. “6 of the last 6 quarters, the quarter end flow has resulted in a spike or dip and a subsequent 8%+ reversal.”
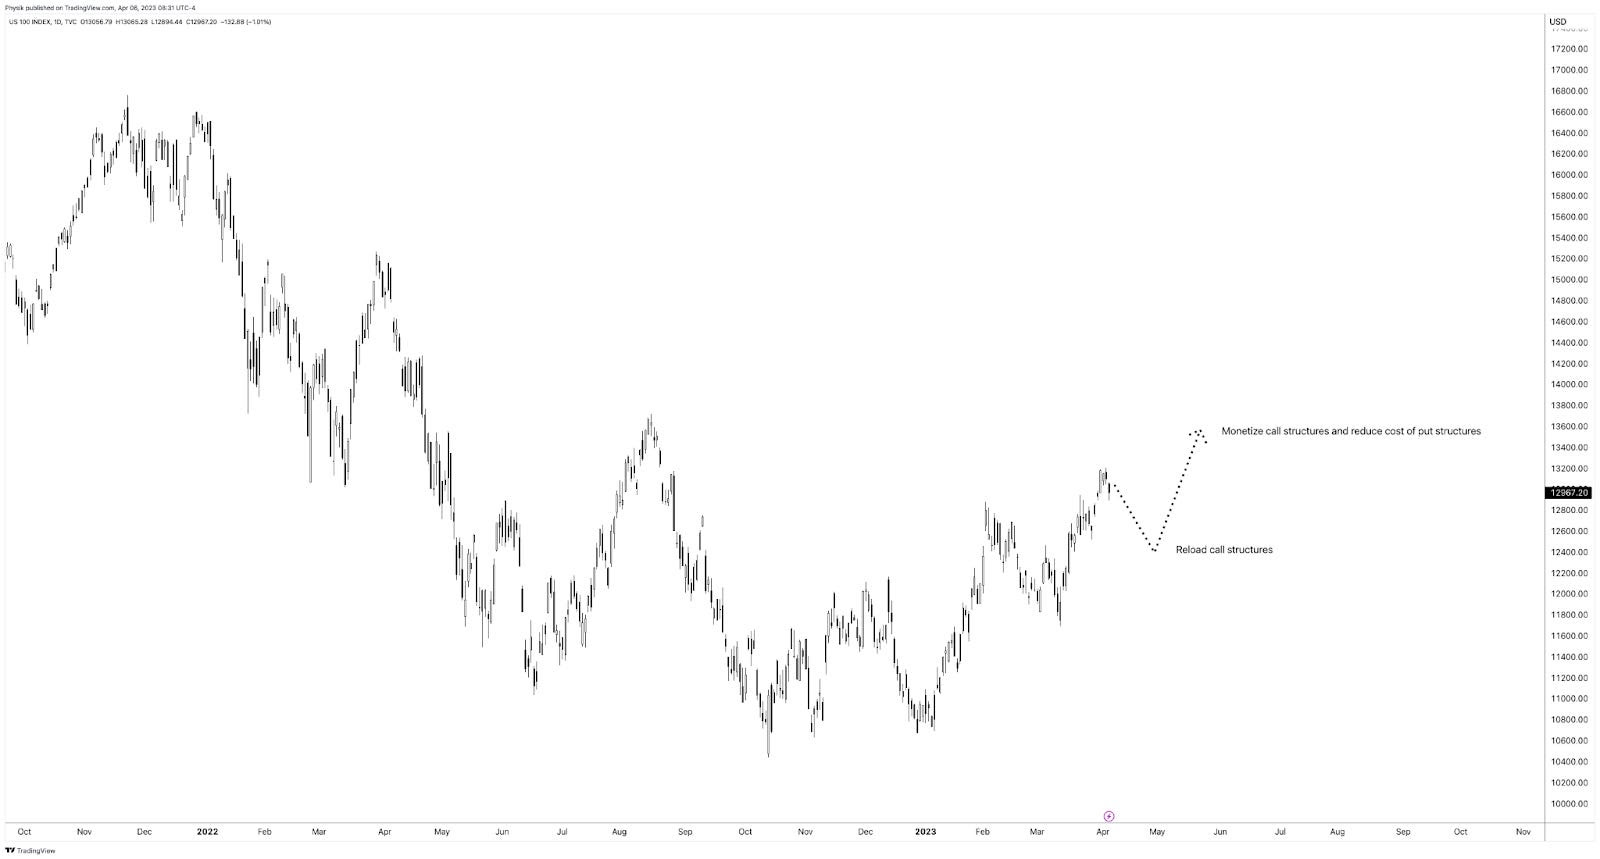
Accordingly, it made a lot of sense to own low- or no-cost call options structures in products like the Nasdaq 100 (INDEX: NDX), where many participants were caught offsides and bidding call volatility in response to the dramatic reversal; the reach for the right tail reduced the cost of ratio call spreads, making them the go-to structures.
It may make sense to re-load in similar call structures on pullbacks while using any proceeds or profits from those structures to reduce the cost of owning fixed-risk and less costly put structures (e.g., vertical) that may enable us to participate in equity market downside, as well as bet on lower rates in the future using call options structures on the /SR3 to express that opinion.
Graphic: Retrieved from TradingView via Physik Invest.
Disclaimer
Don’t use this free letter as advice; all content is for informational purposes, and derivatives carry a substantial risk of loss. At this time, Capelj and Physik Invest, non-professional advisors, will never solicit others for capital or collect fees and disbursements. Separately, you may view this letter’s content calendar at this link.
Welcome to the Daily Brief by Physik Invest. Learn about our origin story here, and consider subscribing for free daily updates on the most important market updates.
We keep recent letters brief as a lengthy one is still being written. Thank you for being so patient.
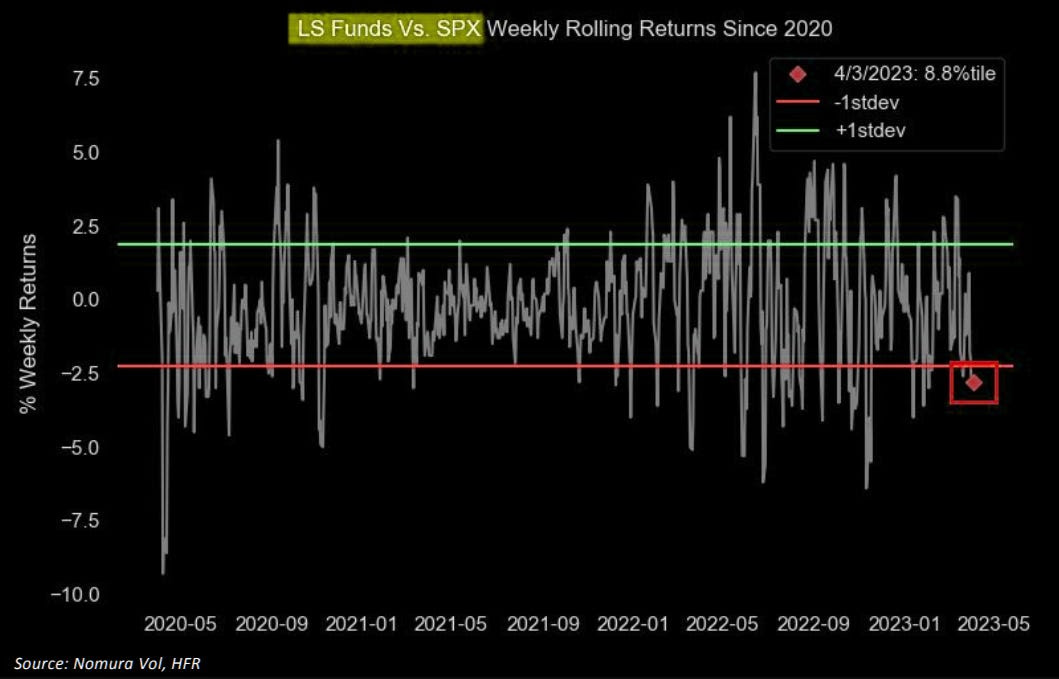
The Job Openings and Labor Turnover Survey showed a decrease in job vacancies and a tightening of the labor market; vacancies per job-seeker have reduced by 20%, and workers are in a weaker position to bargain.
Accordingly, rate expectations dropped ahead of the next Federal Open Market Committee meeting; traders are bidding up the price of equities.
Graphic: Retrieved from Noura Holdings Inc (NYSE: NMR) via The Market Ear. “Long/short vs SPX rolling returns shows you the pain. Nomura’s quant guru McElligott weighs in: ‘…all of last year’s Equities Alpha was in your ‘Short’ books, which were loaded with ‘Expensive / High Multiple / Low Quality / Un-Profitable’ Growth…but that’s now the stuff that is exploding higher on the violent Rates reset LOWER.”
Federal Reserve President Loretta Mester maintained that the benchmark rate should move and stay above 5% to control inflation, adding that no rate cuts may happen this year, barring a significant change in price pressures. Mester said inflation is on its way out – price growth is likely to drop to 3.75% this year and reach 2% by 2025 – and the banking system is sound, though policymakers are ready to respond to new stresses.
A peek at the Secured Overnight Financing Rate or SOFR market shows activity or the consensus centered at the 95.00 options strike (~5%). Per Bloomberg, large positions include a June 95.00/96.00 1×2 call spread, a June 95.75/95.50/95.25/95.00 put condor, and 95.00/94.75/94.50 put flies in both September and December tenors.
From a positioning perspective, this letter maintains the idea of starting to monetizecall structures and rolling profits into fixed-risk bear put spreads. However, given the potential for an underwhelming selloff or “grinding de-leveraging,” keep those debits you pay in check!
To end, the upcoming non-farm payrolls or NFP reportsandinflation figures will provide crucial data on the state of the economy.
Graphic: Retrieved from Damped Spring Advisors’ Andy Constan. “6 of the last 6 quarters, the quarter end flow has resulted in a spike or dip and a subsequent 8%+ reversal.”
Disclaimer
Don’t use this free letter as advice; all content is for informational purposes, and derivatives carry a substantial risk of loss. At this time, Capelj and Physik Invest, non-professional advisors, will never solicit others for capital or collect fees and disbursements. Separately, you may view this letter’s content calendar at this link.
Physik Invest’s Daily Brief is read free by thousands of subscribers. Join this community to learn about the fundamental and technical drivers of markets.
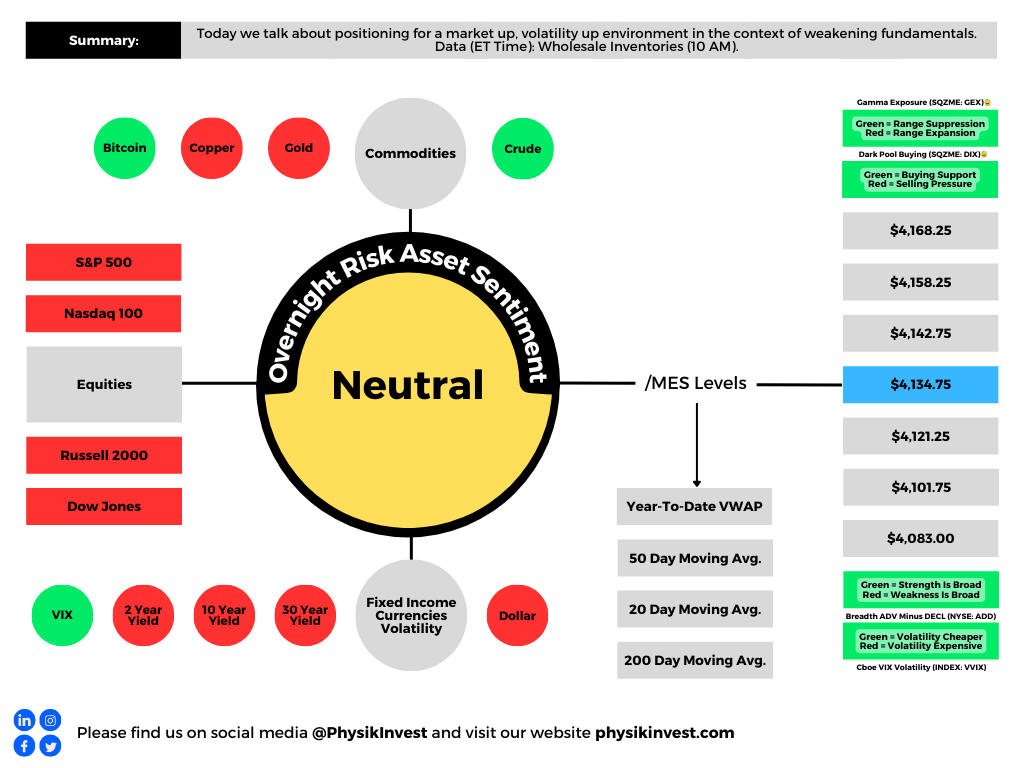
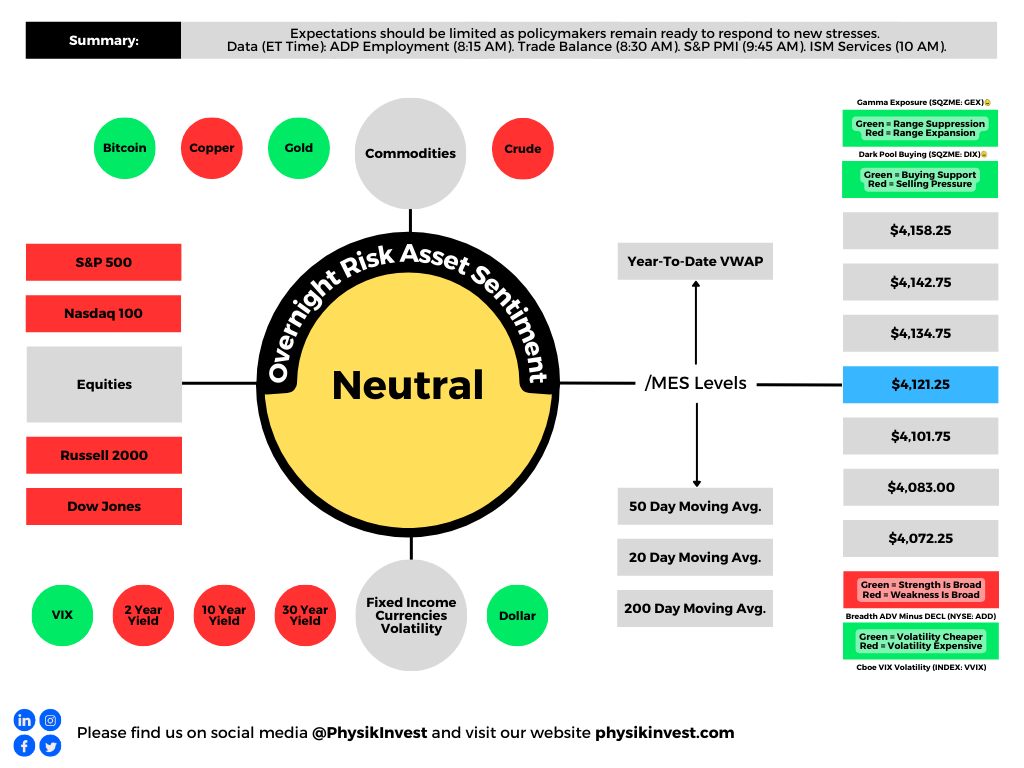
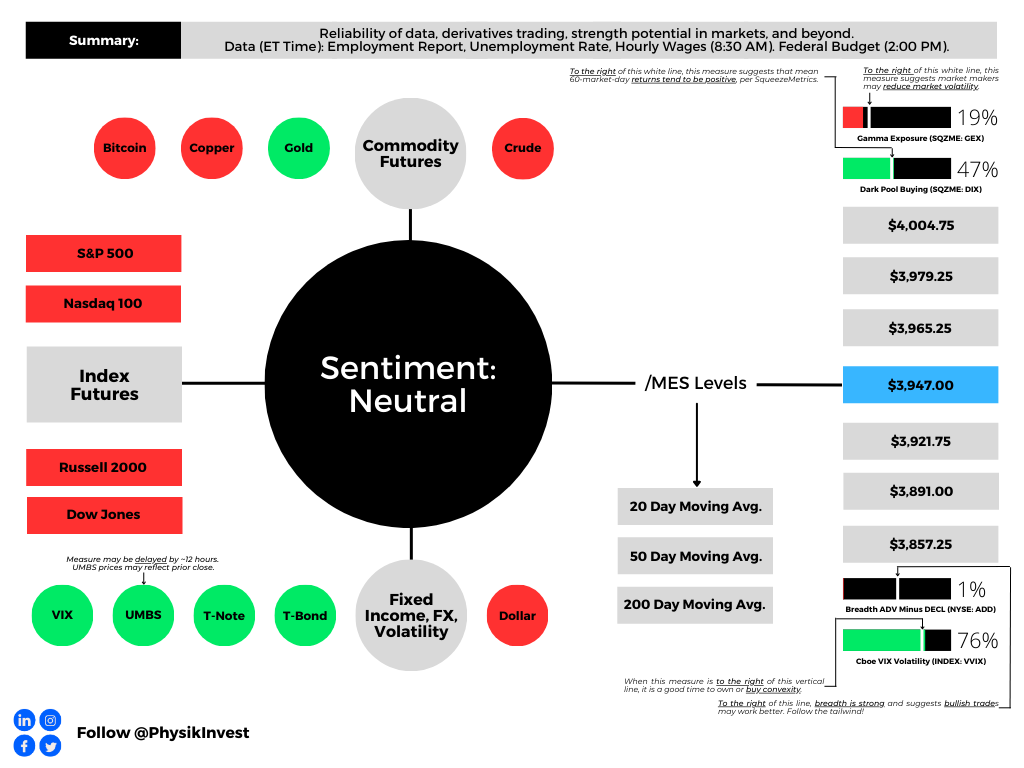
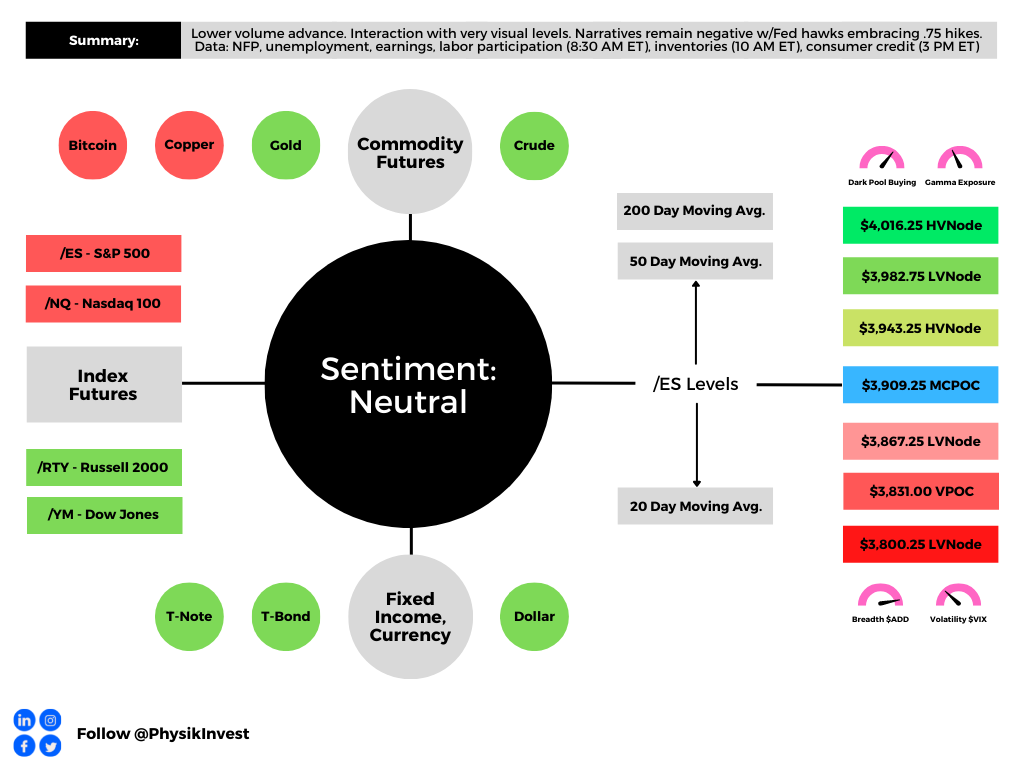
Graphic updated 7:15 AM ET. Sentiment Risk-Off if expected /MES open is below the prior day’s range. /MES levels are derived from the profile graphic at the bottom of this letter. Click here for the latest levels. SqueezeMetrics Dark Pool Index (DIX) and Gamma (GEX) with the latter calculated based on where the prior day’s reading falls with respect to the MAX and MIN of all occurrences available. A higher DIX is bullish. The lower the GEX, the more (expected) volatility. Click to learn the implications of volatility, direction, and moneyness. Breadth reflects a reading of the prior day’s NYSE Advance/Decline indicator. The CBOE VIX Volatility Index (INDEX: VVIX) reflects the attractiveness of owning volatility. UMBS prices via MND. Click here for the economic calendar.
Administrative
Yesterday’s newsletter put forth the writer’s discussion with Simplify’s Mike Green, fresh after he spoke at Exchange Miami. The letter covered a lot, albeit in a messy way, given some unforeseen obligations. Today, we clarify those narratives for you. Hopefully, you enjoy it, and take care!
Fundamental
In summary, Simplify’s Michael Green trades 60/40-looking portfolios on macroeconomic signals while using derivative exposures to reduce volatility and amplify profit potential (e.g., responding to economic data in real-time by trading options on the CME Group Inc’s [NASDAQ: CME] Eurodollar [FUTURE: /GE], a tool to express views on future interest rates).
His conversation with your letter writer covered a variety of topics including the reliability of data and what that means for his active management, derivatives trading, strength potential in markets, as well as what he’s optimistic about. Here’s what you need to know.
1 – Green explains that his preferred macro guides for decision-making are unclear. He explains that traditional adjustments “ranging from seasonality to the birth-death models used in smoothing employment reports” are in question, and he jokes that developed market data sets are approaching emerging market data sets in terms of quality.
2 – Green reflects on 2022 noting options, colloquially referred to as volatility, were a big underperformer. “One-year variance swaps or implied volatility on an at-the-money S&P 500 put option would trade somewhere in the neighborhood of 25 to 30%,” he explains. “That implies a level of daily price movement that is difficult to achieve.”
Having learned their lesson, in 2023 investors swapped long-dated volatility exposures for ones with bounded risk (e.g., Bear Put Spread) and less time to expiry (e.g., 0 DTE).
Graphic: Retrieved from Goldman Sachs Group Inc (NYSE: GS).
Though both may leave counterparties with less risk, if news shocks the market far one way, market movements may become exaggerated when investors, and counterparties accordingly, scramble to adjust their risk.
Major Wall Street players and clearing houses have, too, just announced an investigation into the risks such activity poses as well.
One options trader is making a monster bet on market volatility exploding into the summer months.
Up until now, however, the activity has manifested a push-and-pull, mean-reverting-type action; investors lean short volatility in the morning and long volatility in the afternoon which, combined, tends to mute price action.
Graphic: Retrieved from Bank of America Corporation (NYSE: BAC).
Say one morning an “investor sells call options and a dealer receives them,” Green puts forth as an example. “The dealer will hedge their long call position by selling futures which will pressure the market and result in the options prices collapsing in value.”
To re-hedge falling options prices, “dealers have to buy back their futures exposure and this pushes the markets upward. This is the pattern that’s been playing out over and over again. It’s weakness in the morning followed by strength in the afternoon.”
Though this is a very smart exposure to have, Green says volatility that’s longer-dated is cheap and, when an eventual shock occurs, its payout may more than justify its cost, particularly as the outlook for equities, bonds, and commodities further blurs.
Graphic: Retrieved from Goldman Sachs Group Inc (NYSE: GS) via The Market Ear.
3 – Despite still-robust appearing economic data, Green sees clear signs the economy is starting to deteriorate.
Graphic: Retrieved from Bloomberg. “If the unemployment data this week is very strong then you’ve got 50 basis points back on the table,” explained Bob Michele, the chief investment officer of JPMorgan Asset Management. “But that is a pretty high hurdle to get to once you’ve down-shifted to 25 basis points.”
“We’re seeing cracks in bubbles like commercial real estate” and risk assets including crypto, presently maintained by a lack of inventory or supply that’s tied up in the bankruptcy proceedings of FTX (CRYPT0: FTT) and Voyager Digital Ltd (ex-OTC: VYGVF), of all things.
Graphic: Retrieved from JPMorgan Chase & Co (NYSE: JPM) via The Market Ear. “Excess liquidity is being withdrawn at an accelerating pace.”
“The question is whether higher interest rates ultimately drive a fraction of the market into distress with forced transactions,” Green wonders, pointing to the likes of Blackstone Inc (NYSE: BX) and Brookfield Corp (NYSE: BN) handing in keys to properties. “It takes one person being in distress to set a new clearing price which, in turn, changes valuations for everybody, and makes it more difficult to qualify for things like mortgages.”
So $SVIB has $200b in assets, of which $116 are securities. About $80b of that are high quality liquid assets that could be sold or repo'd for cash. Looks good until.. pic.twitter.com/SmX1JqLg9E
4 – Looking forward, over the short-term at least, Green says inflation is likely to trend higher for longer, particularly with monetary policy inspiring fiscal action and sparking off geopolitics.
“The world’s growing materially slower and manufacturing capacity, which is spreading around the world, requires labor and investment, which could be inflationary in the short-run,” Green puts forth. Traditionally, “lower rates and costs enable added capacity and a predictable rebound in consumption. However, we’re driving a stake through the vampire’s heart, now, and … there’s the multiplier effect driving fiscal policy, too.”
Graphic: Retrieved from CME Group Inc’s (NASDAQ: CME) FedWatch Tool. The terminal (peak) rate sits at 5.50-5.75%.
5 – In response to uncertainty, investors can park cash in Treasury bonds, as well as allocate some capital to volatility “to introduce a degree of convexity,” risking only the premium paid. Alternatively, investors can take a more optimistic long view and position in innovations like artificial intelligence or next-generation energy production.
Graphic: Retrieved from Goldman Sachs Group Inc (NYSE: GS) via The Market Ear. Investors are not concerned with tail risk.
“I’m optimistic about human innovation and the rise of AI, … as well as higher energy prices creating the impetus for tremendous innovations in energy generation that have the potential to lift us out of this period of perceived scarcity if we allow ourselves to embrace it.”
Technical
As of 8:00 AM ET, Friday’s regular session (9:30 AM – 4:00 PM ET), in the S&P 500, is likely to open in the upper part of a negatively skewed overnight inventory, outside of the prior day’s range, suggesting a potential for immediate directional opportunity.
The S&P 500 pivot for today is $3,947.00.
Key levels to the upside include $3,965.25, $3,979.25, and $4,004.75.
Key levels to the downside include $3,921.75, $3,891.00, and $3,857.25.
Disclaimer: Click here to load the updated key levels via the web-based TradingView platform. New links are produced daily. Quoted levels likely hold barring an exogenous development.
Graphic: 65-minute profile chart of the Micro E-mini S&P 500 Futures (bottom middle) and market internals as taught by Peter Reznicek.
Definitions
Volume Areas: Markets will build on areas of high-volume (HVNodes). Should the market trend for a period of time, this will be identified by a low-volume area (LVNodes). The LVNodes denote directional conviction and ought to offer support on any test.
If participants auction and find acceptance in an area of a prior LVNode, then future discovery ought to be volatile and quick as participants look to the nearest HVNodes for more favorable entry or exit.
POCs: Areas where two-sided trade was most prevalent in a prior day session. Participants will respond to future tests of value as they offer favorable entry and exit.
MCPOCs: Denote areas where two-sided trade was most prevalent over numerous sessions. Participants will respond to future tests of value as they offer favorable entry and exit.
About
The author, Renato Leonard Capelj, spends the bulk of his time at Physik Invest, an entity through which he invests and publishes free daily analyses to thousands of subscribers. The analyses offer him and his subscribers a way to stay on the right side of the market.
You may view this letter’s content calendar at this link.
Disclaimer
Do not construe this newsletter as advice. All content is for informational purposes. Capelj and Physik Invest manage their own capital and will not solicit others for it.
The daily brief is a free glimpse into the prevailing fundamental and technical drivers of U.S. equity market products. Join the 850+ that read this report daily, below!
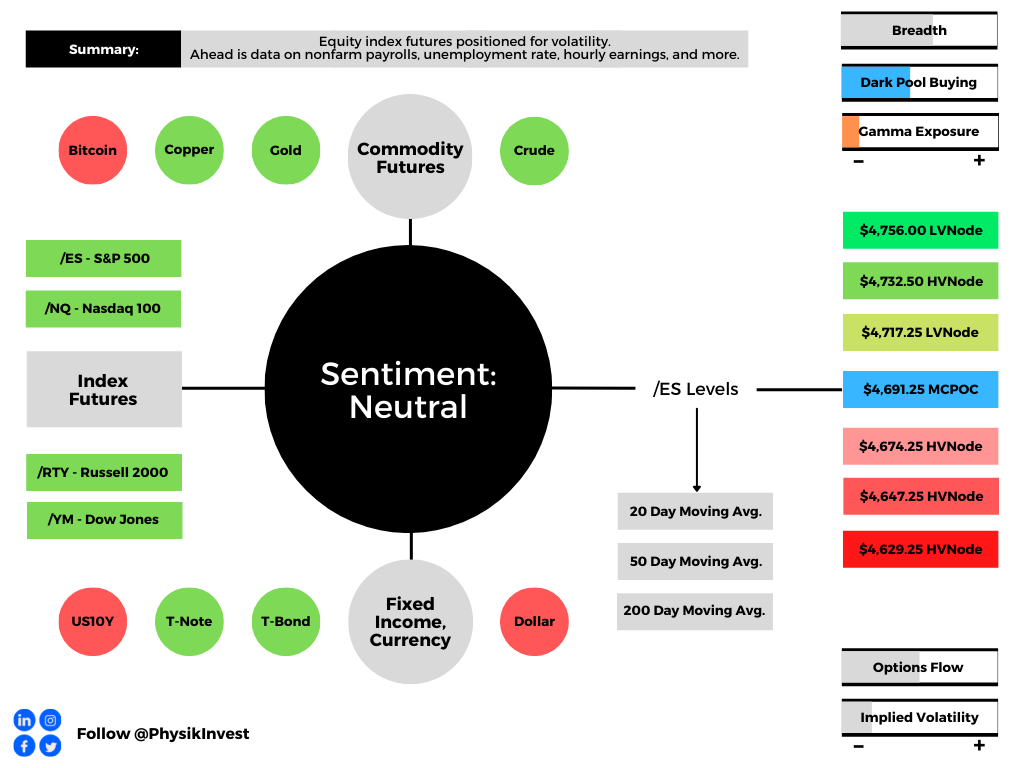
Graphic updated 8:00 AM ET. Sentiment Neutral if expected /ES open is inside of the prior day’s range. /ES levels are derived from the profile graphic at the bottom of the following section. Levels may have changed since initially quoted; click here for the latest levels. SqueezeMetrics Dark Pool Index (DIX) and Gamma (GEX) calculations are based on where the prior day’s reading falls with respect to the MAX and MIN of all occurrences available. A higher DIX is bullish. At the same time, the lower the GEX, the more (expected) volatility. Learn the implications of volatility, direction, and moneyness. Breadth reflects a reading of the prior day’s NYSE Advance/Decline indicator. VIX reflects a current reading of the CBOE Volatility Index (INDEX: VIX) from 0-100.
Fundamental
Hey team – your letter writer is a tad rushed, today! Therefore, expect a shorter letter today and more in-depth letters next week. Thanks!
I refer you to the September 1 letter [HERE] for depth into some fundamental market contexts, the August 30 letter [HERE] for a recap of big trades we structured, as well as the reasons we had to take them off, which we dissected a bit on August 31 [HERE] and September 1 [HERE].
Next week, we’ll likely go through a case study to understand what went right and wrong, as well as what could have been done better.
For today, the big item to watch for is the US jobs report. This may “tip the scales toward a third jumbo-sized Federal Reserve hike in interest rates later this month,” according to Bloomberg.
The consensus number is a 298,000 gain in August payrolls and steady 3.5% unemployment.
With that, Chris Zaccarelli of Independent Advisor Alliance explained that “a strong jobs report will be a reason for a market selloff on Friday.” If worse, markets may do the opposite.
Technical
As of 8:00 AM ET, Friday’s regular session (9:30 AM – 4:00 PM ET), in the S&P 500, is likely to open in the middle part of a balanced overnight inventory, just inside of prior-range and -value, suggesting a limited potential for immediate directional opportunity.
In the best case, the S&P 500 trades higher.
Any activity above the $3,987.00 VPOC puts into play the $4,018.75 HVNode. Initiative trade beyond the HVNode could reach as high as the $4,064.00 RTH High and $4,107.00 VPOC, or higher.
In the worst case, the S&P 500 trades lower.
Any activity below the $3,987.00 VPOC puts into play the $3,943.25 HVNode. Initiative trade beyond the HVNode could reach as low as the $3,909.25 MCPOC and $3,867.25 LVNode, or lower.
Click here to load today’s key levels into the web-based TradingView charting platform. Note that all levels are derived using the 65-minute timeframe. New links are produced, daily.
Graphic: 65-minute profile chart of the Micro E-mini S&P 500 Futures.
Definitions
Volume Areas: A structurally sound market will build on areas of high volume (HVNodes). Should the market trend for long periods of time, it will lack sound structure, identified as low volume areas (LVNodes). LVNodes denote directional conviction and ought to offer support on any test.
If participants were to auction and find acceptance into areas of prior low volume (LVNodes), then future discovery ought to be volatile and quick as participants look to HVNodes for favorable entry or exit.
POCs: POCs are valuable as they denote areas where two-sided trade was most prevalent in a prior day session. Participants will respond to future tests of value as they offer favorable entry and exit.
MCPOCs: POCs are valuable as they denote areas where two-sided trade was most prevalent over numerous day sessions. Participants will respond to future tests of value as they offer favorable entry and exit.
About
After years of self-education, strategy development, mentorship, and trial-and-error, Renato Leonard Capelj began trading full-time and founded Physik Invest to detail his methods, research, and performance in the markets.
Capelj also develops insights around impactful options market dynamics at SpotGamma and is a Benzinga reporter.
In no way should the materials herein be construed as advice. Derivatives carry a substantial risk of loss. All content is for informational purposes only.
The daily brief is a free glimpse into the prevailing fundamental and technical drivers of U.S. equity market products. Join the 300+ that read this report daily, below!
Graphic updated 6:30 AM ET. Sentiment Neutral if expected /ES open is inside of the prior day’s range. /ES levels are derived from the profile graphic at the bottom of the following section. Levels may have changed since initially quoted; click here for the latest levels. SqueezeMetrics Dark Pool Index (DIX) and Gamma (GEX) calculations are based on where the prior day’s reading falls with respect to the MAX and MIN of all occurrences available. A higher DIX is bullish. At the same time, the lower the GEX, the more (expected) volatility. Learn the implications of volatility, direction, and moneyness. Breadth reflects a reading of the prior day’s NYSE Advance/Decline indicator. VIX reflects a current reading of the CBOE Volatility Index (INDEX: VIX) from 0-100.
Fundamental
A light few letters after what it seems were like weeks of heavy content to discuss.
Further, prices at the pump are falling on an “unseasonal” drop in consumption, all the while the biggest bulls have tempered their outlooks on the market citing inflation and the implications of geopolitical tensions.
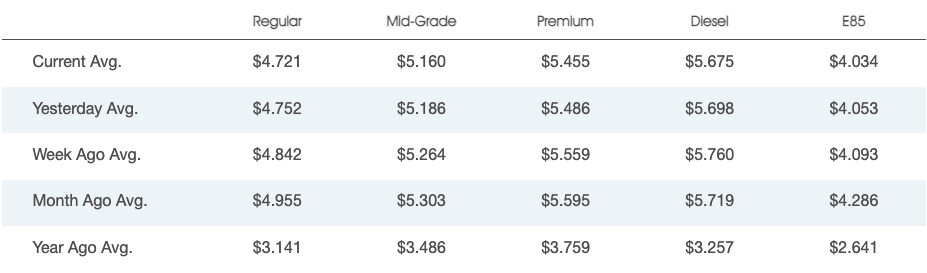
Graphic: National average gas prices posted by AAA.
An overseas slowdown affecting China likely solicits stimulus. Reported was China’s Ministry of Finance considering the sale of special bonds with proceeds used to pay for infrastructure and boost a slowed economy increasingly in the clear from Covid.
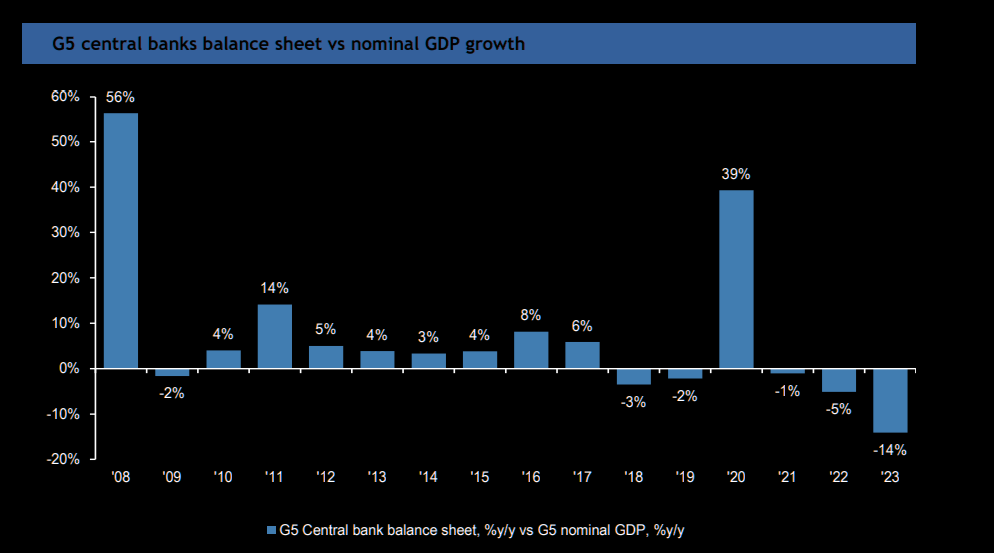
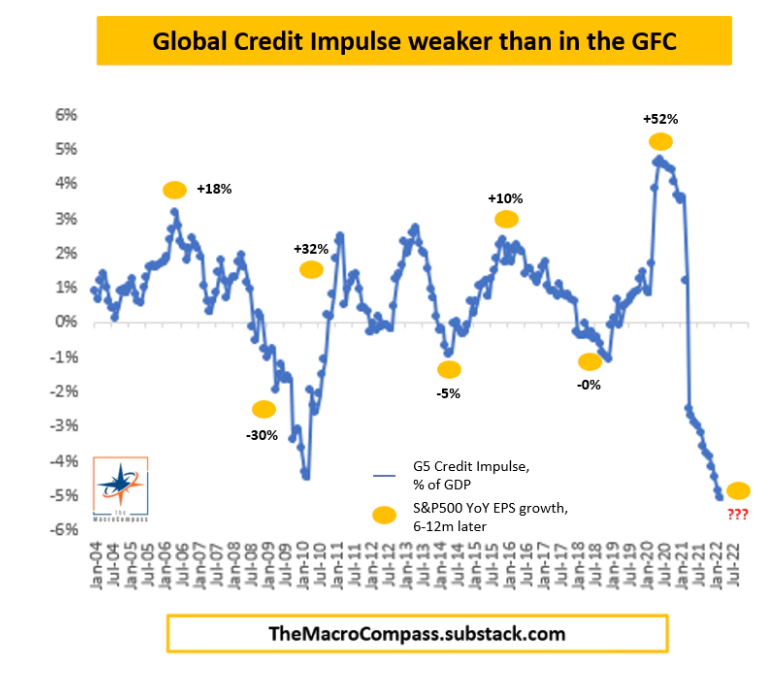
Graphic: Shared by Alfonso Peccatiello. “the pace of real-economy money printing (not bank reserves…) going on in the 5 largest economies in the world. It’s a good leading indicator for economic growth & the performance of several asset classes. It just printed below the GFC lows.”
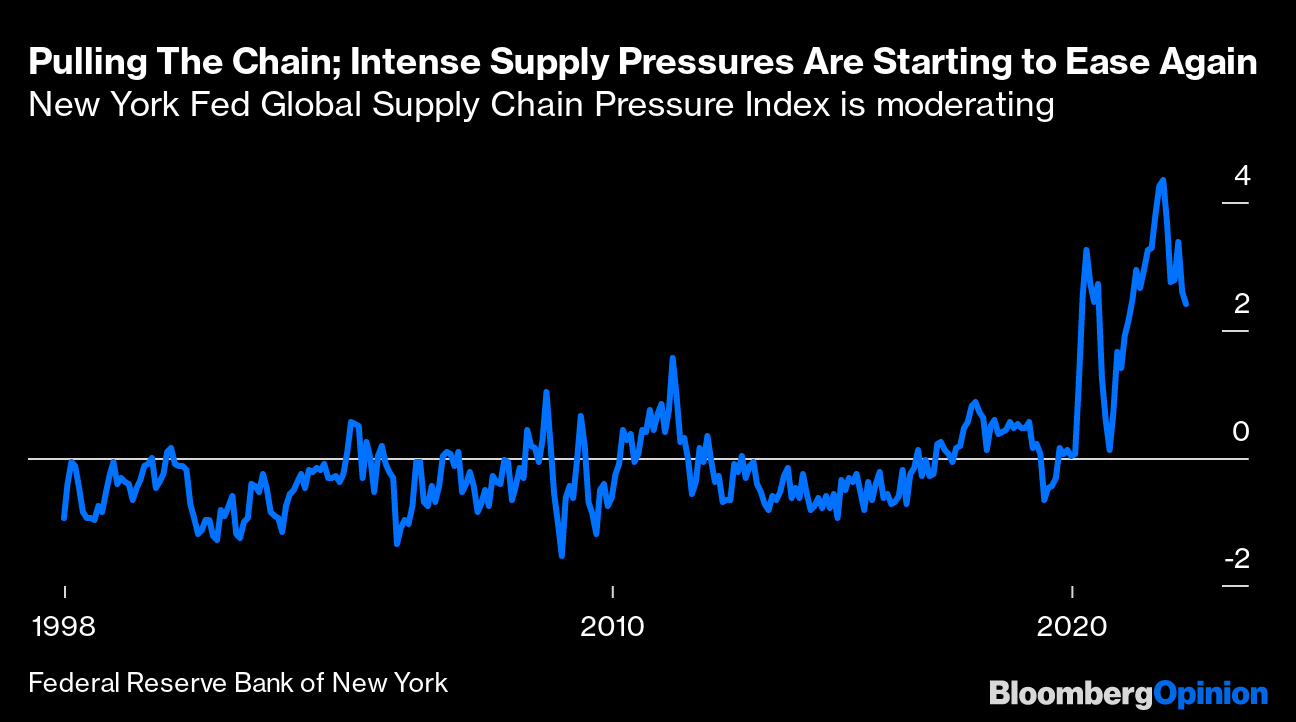
Moreover, as talked about yesterday, inflation may have peaked. Inventories are pointing to a looming supply gut.
Accordingly, the Federal Reserve (Fed), just as it was slow to end stimulus late last year and early this year, maybe slow in moderating its efforts to de-stimulate.
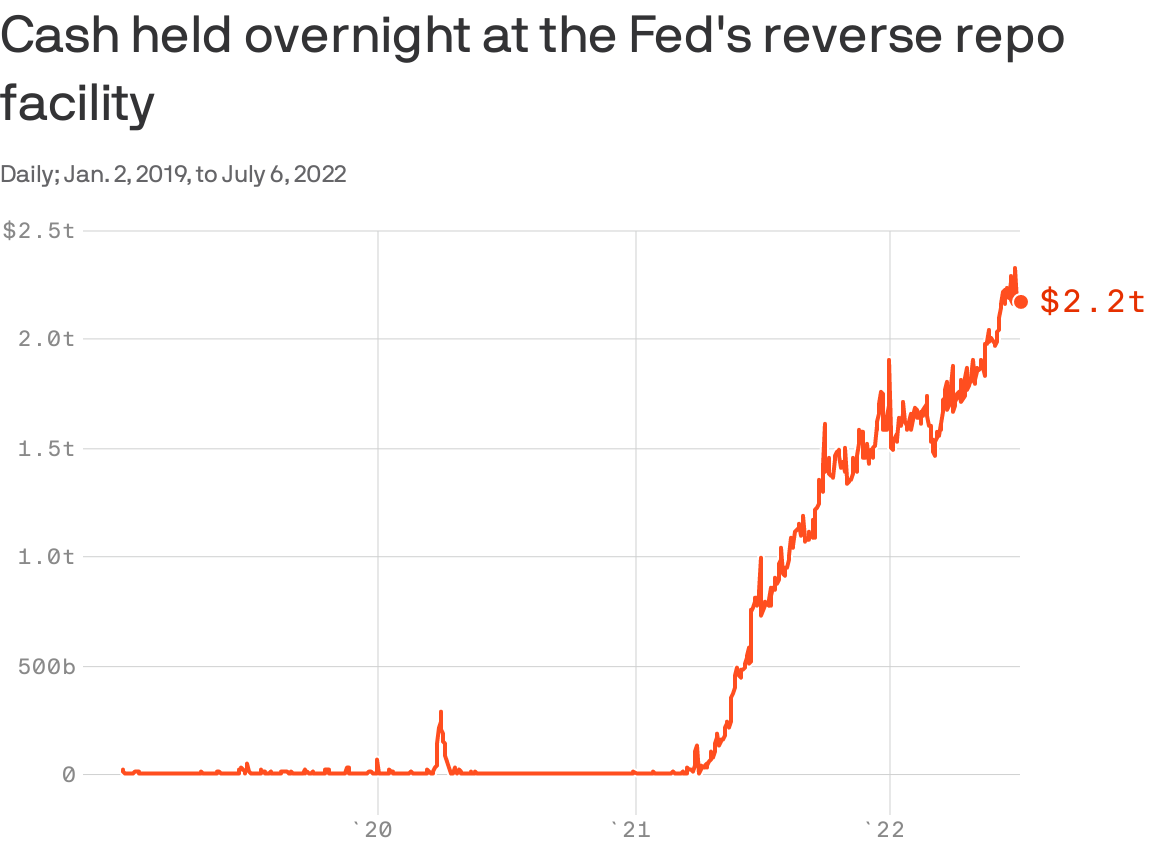
Graphic: Retrieved from Axios. “The glut of cash being parked at the Fed is reflective of policies that have already run their course, especially with quantitative tightening underway.” But, “it’s a representation of how much too far the Fed went in easing,” says Thomas Simon, an economist at Jefferies Financial Group (NYSE: JEF).
Minutes from the last Federal Open Market Committee (FOMC) meeting revealed a rate hike up to 75 basis points in July would be appropriate, per Moody’s Corporation (NYSE: MCO).
A strong jobs report would likely prompt the Fed “to raise rates even more aggressively as they pursue their goal to raise the unemployment rate,” explains Bryce Doty of Sit Fixed Income.
“As [the Fed] seek[s] to destroy demand, they are also destroying supply. As a result, inflation will persist longer and the economy will be even worse.”
This is pursuant to calls by the Credit Suisse Group AG’s (NYSE: CS) Zoltan Pozsar who put forth, earlier this year, that the “Fed is pursuing demand destruction through negative wealth effects,” as the “central banks can only deal with nominal [and] not real chokepoints.”
Graphic: Via JPMorgan Chase & Co (NYSE: JPM). Taken from The Market Ear. “A stronger dollar, lower equity prices, and higher mortgage rates will weigh on demand growth [and] Over time weaker output demand should lead to weaker labor demand Don’t fight the Fed as this is what Fed wants (slower growth).”
Ultimately, the “risk of recession, whether it is real or merely implied by an inversion of the yield curve, won’t deter the Fed from hiking rates higher faster or from injecting more volatility to build up negative wealth effects.”
“Rallies could beget more forceful pushback from the Fed – the new game.”
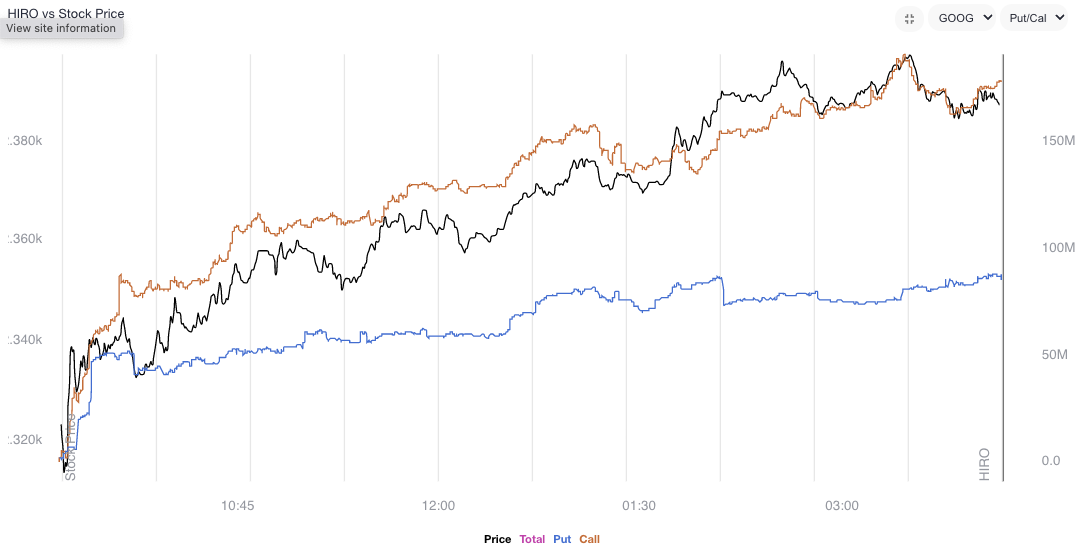
Data shows net gamma exposure increasing which may increasingly feed into smaller ranges and a positive drift amid shorter-dated volatility sales and a pick up in call demand, particularly in some of the larger index weights.
Graphic: Via SpotGamma’s Hedging Impact of Real-Time Options (HIRO) indicator for Alphabet Inc (NASDAQ: GOOG) (NASDAQ: GOOGL). Rising orange and blue lines point to call buying and put selling, both of which have bullish implications.
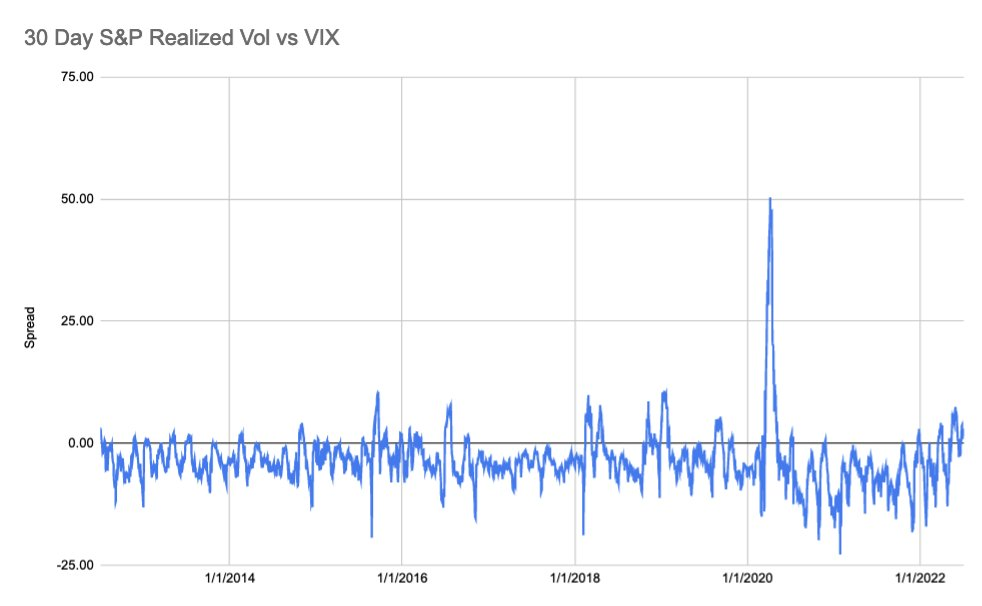
The creep in volatility realized (RVOL), versus that which is implied (IVOL), coupled with “a flattening in the downside fixed strike skew, while the upside wings [are] more smiley,” per JPMorgan Chase & Co (NYSE: JPM), makes it so we can put on more complex structures.
Graphic: Via S&P Global Inc (NYSE: SPGI). As explained by SpotGamma, “30-day realized SPX volatility is now trading above the VIX, something that generally shows after major selloffs wherein IV “premium” needs to reset to calmer/higher equity markets.”
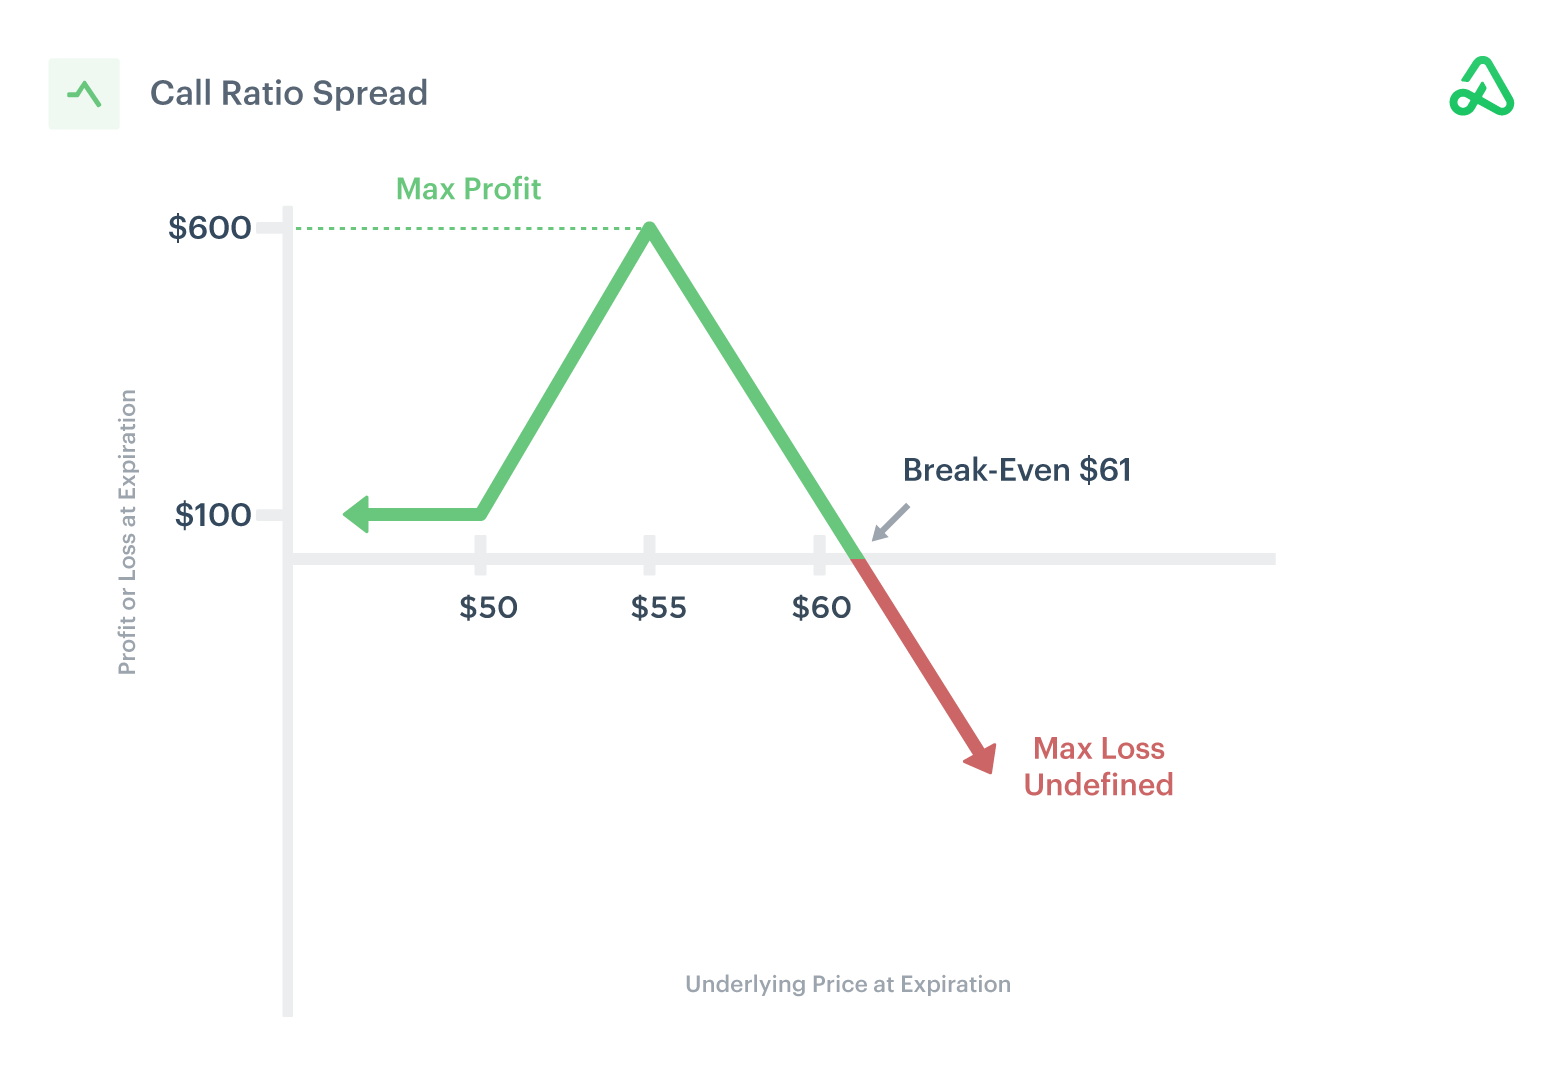
For instance, ratio spreads continue to work well for low- or no-cost exposure to the upside.
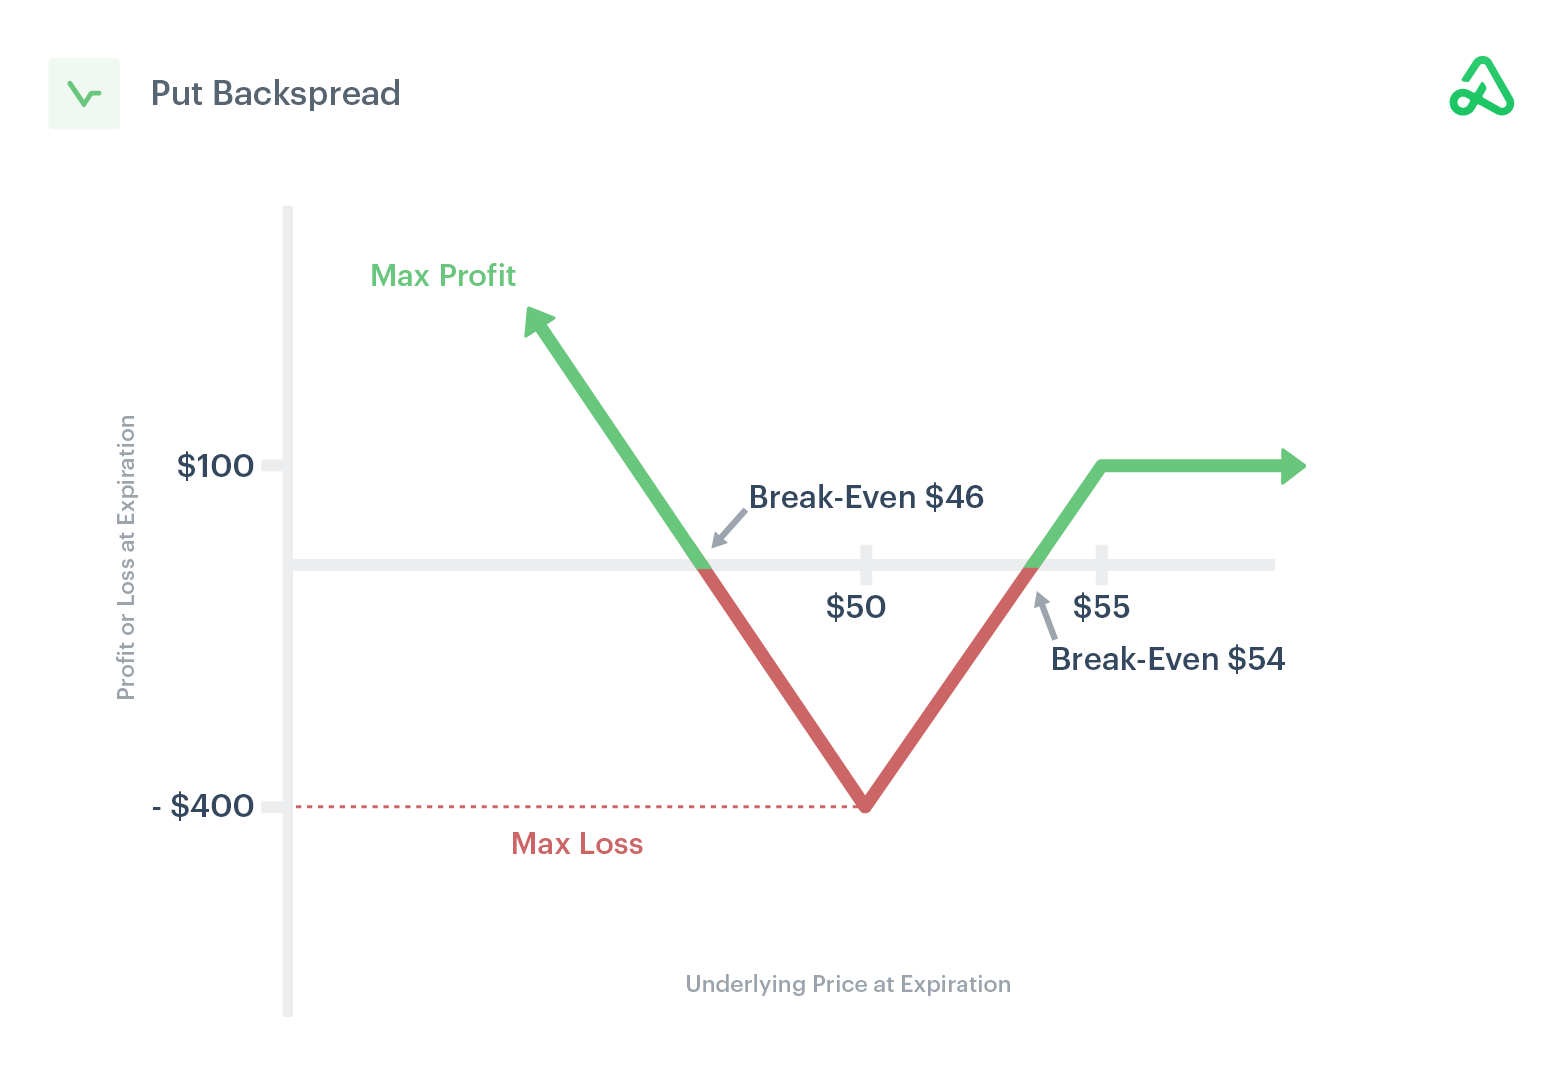
Likewise, if one thought volatility, though at a high starting point particularly at the money (ATM), was due for a repricing, they would look for exposure to the downside via something such as an inverse ratio (or backspread).
This is as the ATMs, unlike those further out of the money (OTM), are less convex in vega.
As of 6:30 AM ET, Friday’s regular session (9:30 AM – 4:00 PM ET), in the S&P 500, is likely to open in the upper part of a negatively skewed overnight inventory, inside of prior-range and -value, suggesting a limited potential for immediate directional opportunity.
In the best case, the S&P 500 trades higher.
Any activity above the $3,909.25 MCPOC puts into play the $3,943.25 HVNode. Initiative trade beyond the HVNode could reach as high as the $3,982.75 LVNode and $4,016.25 HVNode, or higher.
In the worst case, the S&P 500 trades lower.
Any activity below the $3,909.25 MCPOC puts into play the $3,867.25 LVNode. Initiative trade beyond the LVNode could reach as low as the $3,831.00 VPOC and $3,800.25 LVNode, or lower.
Click here to load today’s key levels into the web-based TradingView charting platform. Note that all levels are derived using the 65-minute timeframe. New links are produced, daily.
Graphic: 65-minute profile chart of the Micro E-mini S&P 500 Futures.
Considerations: Responsiveness near key-technical areas (that are discernable visually on a chart), suggests technically-driven traders with short time horizons are very active.
Such traders often lack the wherewithal to defend retests and, additionally, the type of trade may be indicative of the other time frame participants waiting for more information to initiate trades.
Definitions
Volume Areas: A structurally sound market will build on areas of high volume (HVNodes). Should the market trend for long periods of time, it will lack sound structure, identified as low volume areas (LVNodes). LVNodes denote directional conviction and ought to offer support on any test.
If participants were to auction and find acceptance into areas of prior low volume (LVNodes), then future discovery ought to be volatile and quick as participants look to HVNodes for favorable entry or exit.
POCs: POCs are valuable as they denote areas where two-sided trade was most prevalent in a prior day session. Participants will respond to future tests of value as they offer favorable entry and exit.
MCPOCs: POCs are valuable as they denote areas where two-sided trade was most prevalent over numerous day sessions. Participants will respond to future tests of value as they offer favorable entry and exit.
Volume-Weighted Average Prices (VWAPs): A metric highly regarded by chief investment officers, among other participants, for quality of trade. Additionally, liquidity algorithms are benchmarked and programmed to buy and sell around VWAPs.
About
After years of self-education, strategy development, mentorship, and trial-and-error, Renato Leonard Capelj began trading full-time and founded Physik Invest to detail his methods, research, and performance in the markets.
Capelj also develops insights around impactful options market dynamics at SpotGamma and is a Benzinga reporter.
In no way should the materials herein be construed as advice. Derivatives carry a substantial risk of loss. All content is for informational purposes only.
The Daily Brief is a free glimpse into the prevailing fundamental and technical drivers of U.S. equity market products. Join the 200+ that read this report daily, below!
Overnight, equity index futures auctioned weak, inside of the prior day’s large trading range.
Yesterday, the equity indexes, bonds, and crypto (which many saw as a hedge against equities) were sold, aggressively. The selling came one day after the Federal Reserve hiked 0.50 basis points and outlined its balance sheet reduction timeline.
Notable was ten-year Treasury yields breaking the 3.00% barrier.
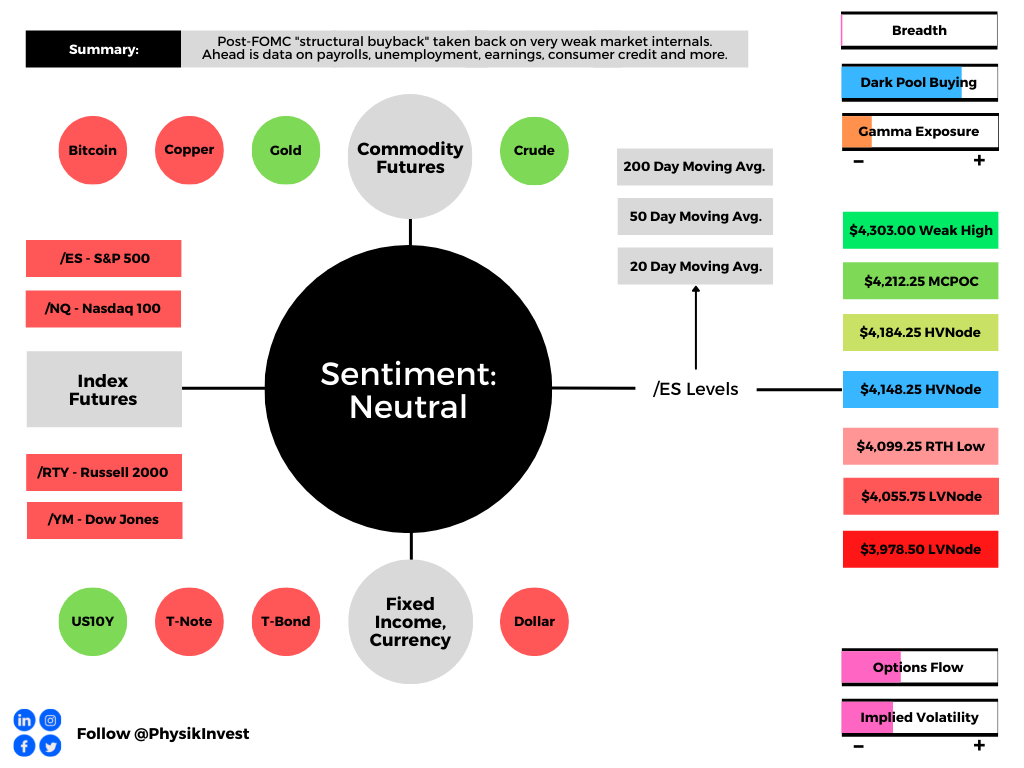
Despite a more dovish tone (i.e., Fed assuaging participants of a 0.75 basis point hike in the coming meetings), the near-vertical price rise (which we discussed was a function of “structural buyback” in yesterday’s morning letter) was taken back in a fire sale across all sectors.
Today is data on nonfarm payrolls, unemployment rates, average hourly earnings, and labor force participation (8:30 AM ET). Later, consumer credit data is released (3:00 PM ET).
Speaking today is the Fed’s John Williams (9:15 AM ET), Raphael Bostic (3:20 PM ET), James Bullard and Chris Waller (7:15 PM ET), as well as Mary Daly (8:00 PM ET).
Graphic updated 6:45 AM ET. Sentiment Neutral if expected /ES open is inside of the prior day’s range. /ES levels are derived from the profile graphic at the bottom of the following section. Levels may have changed since initially quoted; click here for the latest levels. SqueezeMetrics Dark Pool Index (DIX) and Gamma (GEX) calculations are based on where the prior day’s reading falls with respect to the MAX and MIN of all occurrences available. A higher DIX is bullish. At the same time, the lower the GEX, the more (expected) volatility. Learn the implications of volatility, direction, and moneyness. SHIFT data used for S&P 500 (INDEX: SPX) options activity. Note that options flow is sorted by the call premium spent; if more positive, then more was spent on call options. Breadth reflects a reading of the prior day’s NYSE Advance/Decline indicator. VIX reflects a current reading of the CBOE Volatility Index (INDEX: VIX) from 0-100.
What To Expect
Positioning: In yesterday’s detailed letter, we talked about the implications of participants’ hedging heading into and after the Federal Open Market Committee (FOMC) event.
Mainly, markets were stretched and participants were demanding protection in size. As said:
“Barring a worst-case scenario, if markets do not perform to the downside (i.e., do not trade lower), those highly-priced (often very short-dated) bets on direction will quickly decay, and hedging flows with respect to time and volatility may bolster sharp rallies.”
After that “structural buyback,” as Kai Volatility’s Cem Karsan explained clearly, it was highly likely the bear trend would hold. Participants not shifting their bets on direction (via options) to higher prices, further out in time, further suggested very little change in sentiment.
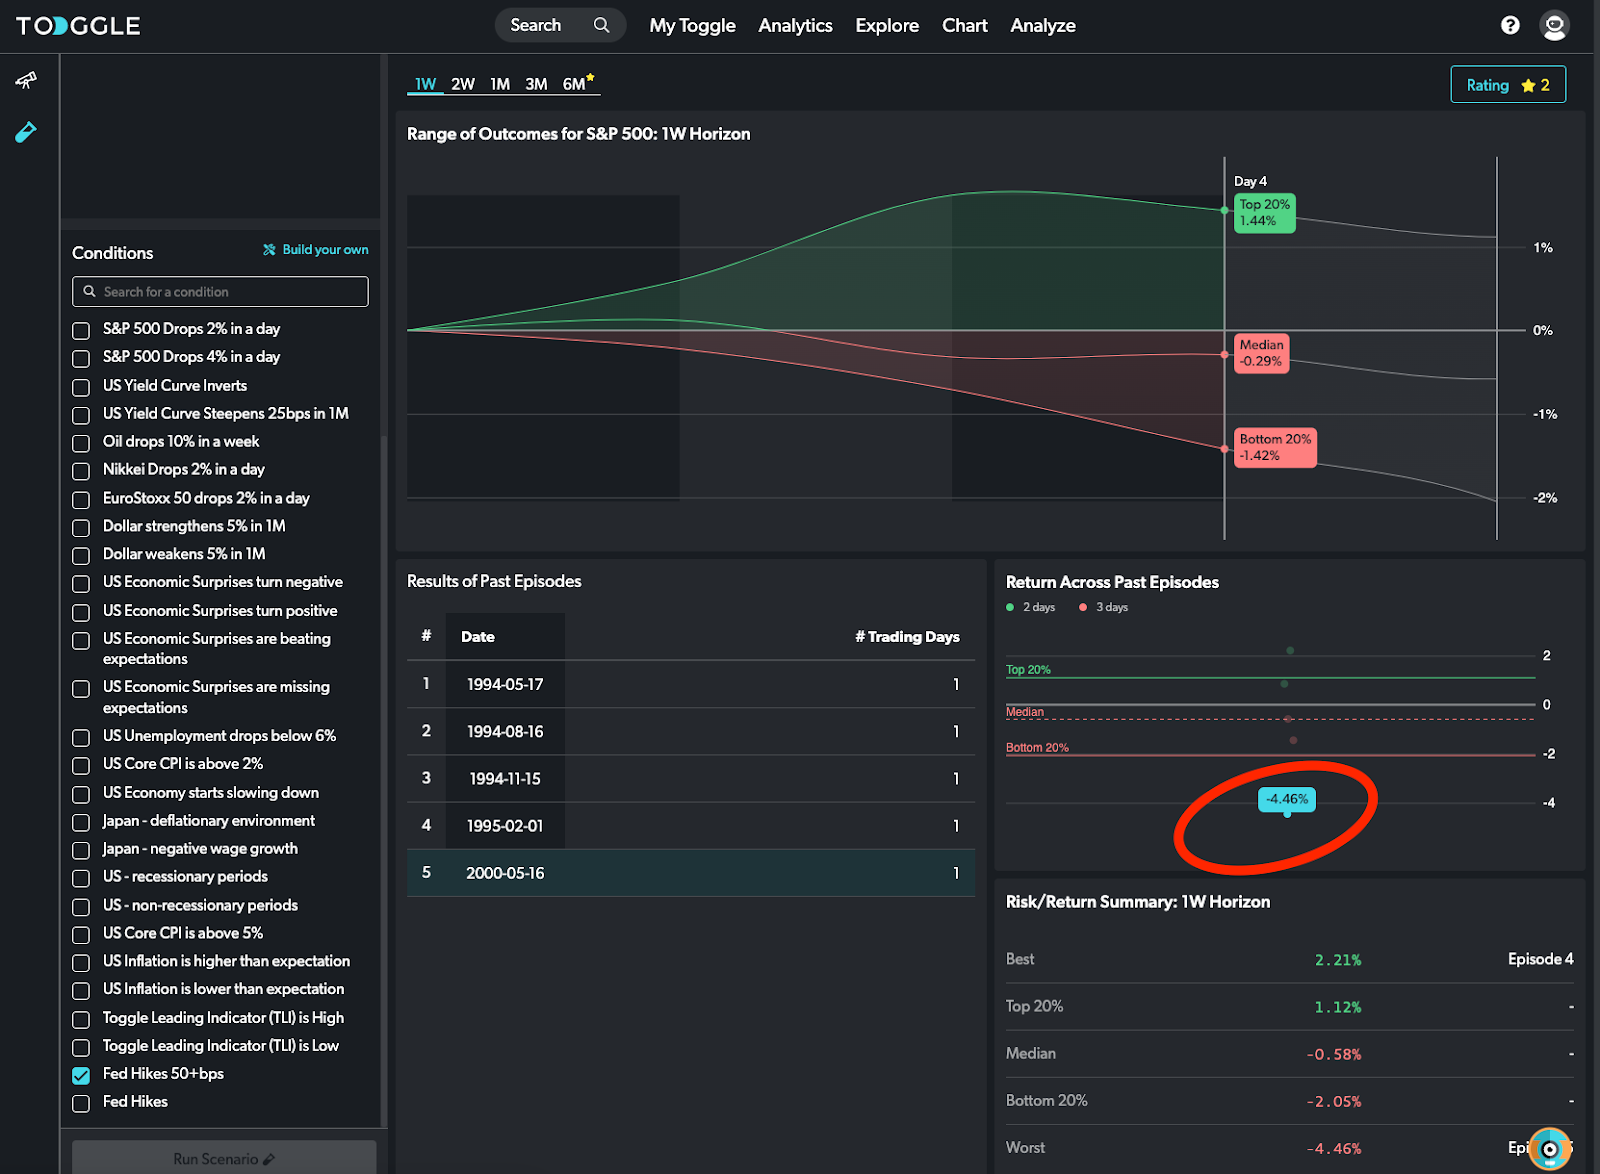
Toggle, which is an AI and machine learning research firm tracking 35,000 securities globally, sent us, yesterday, their post-Fed analysis. According to them, “during the first week after the Fed’s 50 bps hike markets broadly headed lower.”
“In fact, 1 in 5 times the drop reached more than 5%.”
Graphic: Via Toggle.
The firm’s CEO and founder – Jan Szilagyi – said, in response to the market action that “market bulls should root for stocks to go down first.”
That’s actually a powerful statement. For markets to break (rally), they sometimes need to rally (break). Said another way, at times the market is stretched. Sellers (buyers) are either too short (or too long), if we will.
In order to trade lower, for instance, that short inventory (which in and of itself is a support mechanism as it is a bunch of buy orders sitting at lower prices) must be cleared (i.e., covered).
After that support is removed, the market can succumb to whatever fundamental weaknesses it was trying to price in.
In this case, “the incremental effects on liquidity (QE/QT),” as Karsan says.
Moreover, what’s interesting, and this is something others have picked up on, is the difference between the level of volatility that is realized and implied by activity in the derivatives market.
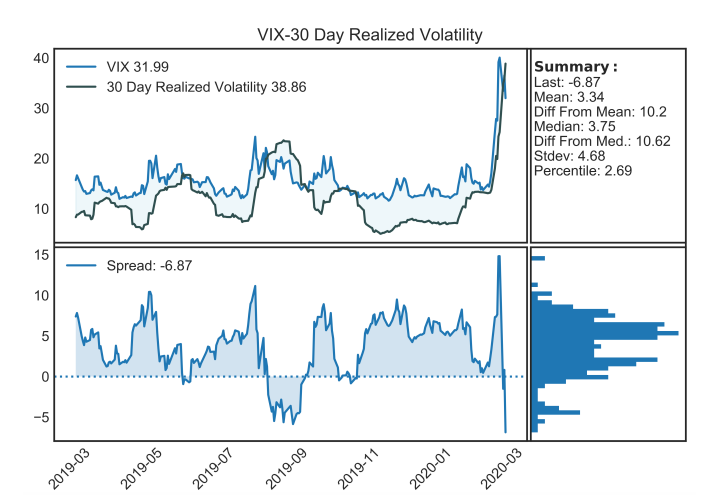
Another time we saw such divergences was during the 2020 Coronacrisis sell-off.
Graphic: Via @HalfersPower. On March 2, 2020, “VIX-30 day realized vol go from 99 percentile yesterday to inverted and 9 percentile today lol. (left vs. right).
Let’s unpack. So, the Cboe Volatility Index (INDEX: VIX), as described by Cboe Global Markets Inc (BATS: CBOE), is a “constant, 30-day expected volatility of the U.S. stock market, derived from real-time, mid-quote prices of S&P 500 Index (INDEX: SPX) call and put options.”
Essentially, to make it simple, VIX is the equity market’s pricing of risk or insurance and it has a strong inverse relationship with the SPX. If SPX is lower, the VIX higher, basically.
Then, just as we have metrics to measure the change in an option’s sensitivity to the underlying direction (delta) or gamma, we have the sensitivity of an option to changes in volatility (vega) or volga.
Volga has different names. Vomma. The convexity of vega (i.e., change in vega based on change in volatility implied by market participants’ activity). The volatility of volatility. And so on.
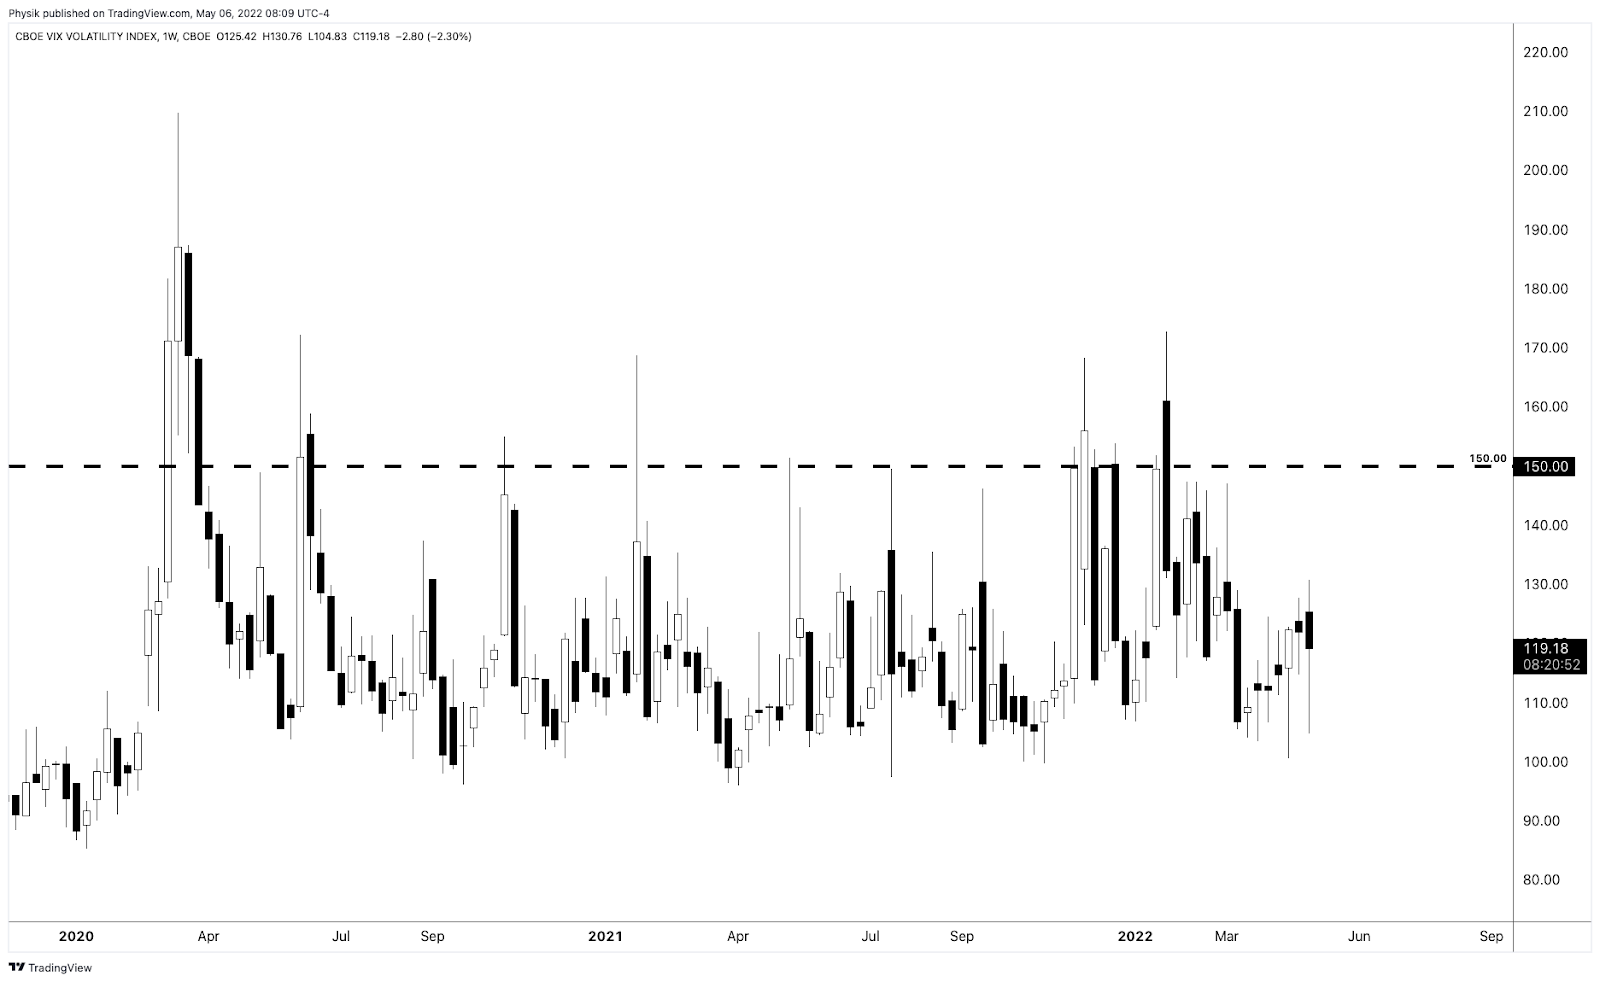
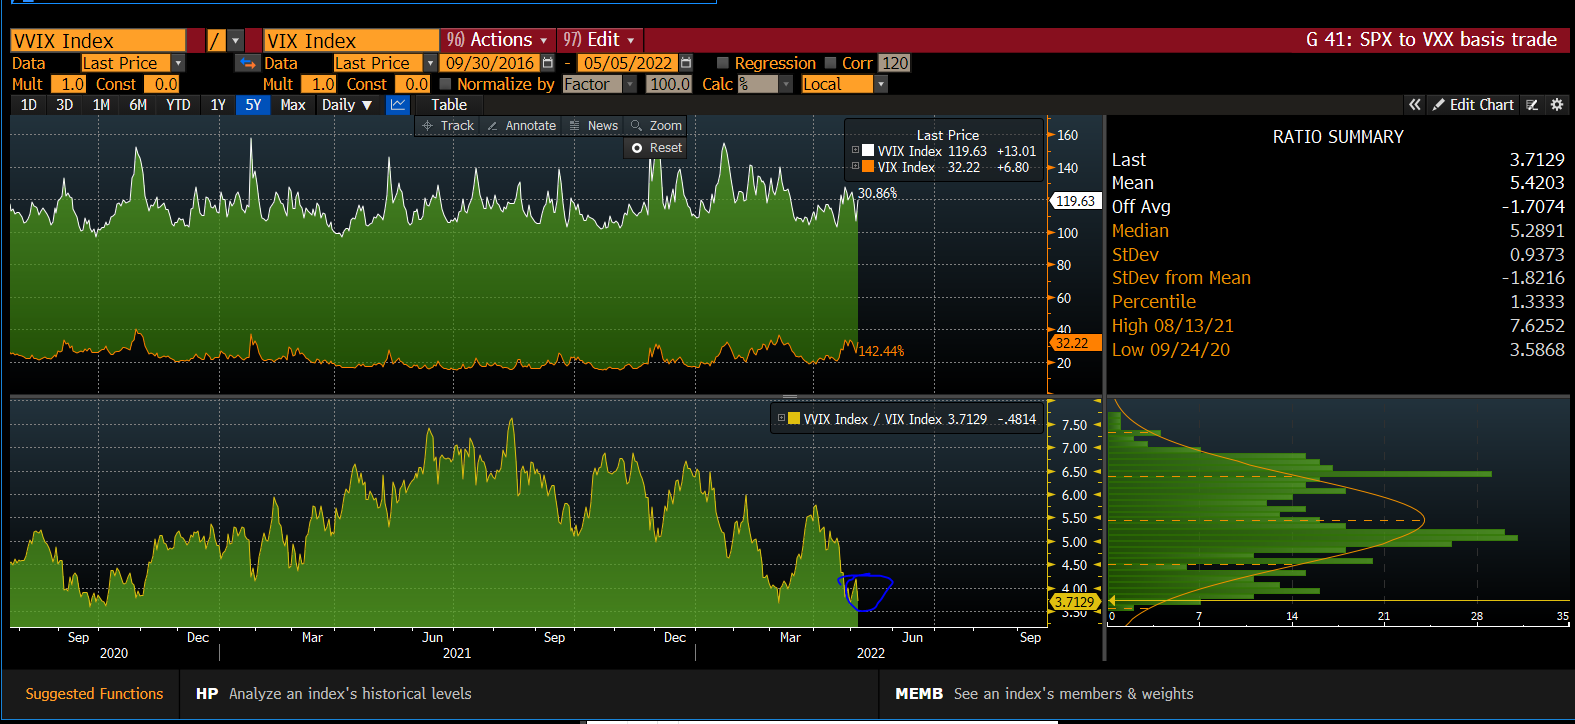
The volatility of volatility can naively be measured through the Cboe VVIX Index (INDEX: VVIX) which, according to Cboe, “represents a volatility of volatility in the sense that it measures the expected volatility of the 30-day forward price of VIX.”
Historically, the gauge has a mean somewhere beneath 100 and a high correlation with the VIX at times of heightened stress (e.g., Coronacrisis).
Graphic: The VVIX via Physik Invest.
What’s going on is there is really negative sentiment and emotion, both of which are playing into market weaknesses and realized volatility. However, that realized volatility is not priced in.
In other words, the volatility of volatility – VVIX – is low relative to the volatility realized (and implied) and that, as I take it, essentially means that the market is not pricing up protection.
Graphic: Via The Ambrus Group’s Kris Sidial. “Trotting out the good old VVIX/VIX (trader heuristic) to compare SPX skew to VIX Vol. Negative sentiment but lack of fear continues.”
Why does this matter? Well, when you think there is to be an outsized move, relative to what is priced, you buy options (positive exposure to gamma) so that you may have gains that are potentially amplified in case of directional movement.
You also buy can buy options for positive exposure to volga. This is so that you may have gains that are potentially amplified in case of movement (repricing) in implied volatility.
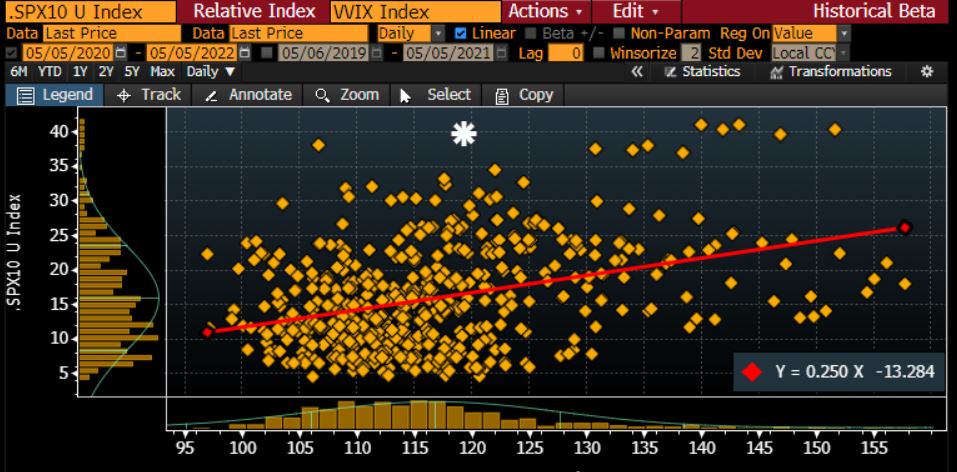
Graphic: Via @Alpha_Ex_LLC. “Here’s 10-day realized vs VVIX on a scatter. The ‘white star’ is 40 realized but only 117 VVIX. When realized this high, VVIX typically closer to 150.”
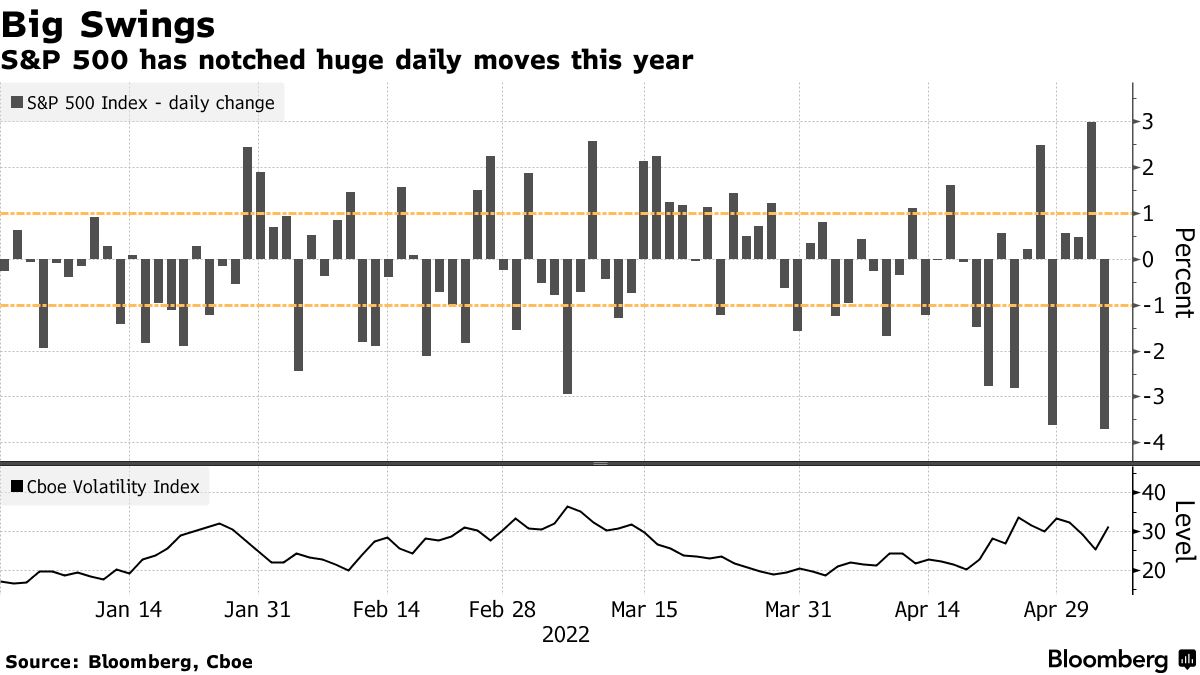
With back-to-back daily price changes sometimes in excess of 2%, this essentially suggests to us the potential for the pricing of equity market risk to “catch up.”
Graphic: Via Bloomberg. The realized volatility for the SPX versus the VIX.
Per SpotGamma, much of this has to do with market participants being “well-hedged.”
“From an options perspective, participants would have to demand en masse protection (buy puts, sell calls) for liquidity providers to further take from market liquidity (sell into weakness) and that volatility skew to, essentially, blowout (e.g., Corona crisis, Meme mania, and the like).”
The Ambrus Group’s Kris Sidial, who felt that the liquidation was likely large desks de-risking their book, explains, well, too:
“Vol is mainly used as a source of hedging. We are coming off of a big FOMC meeting where vol was slightly elevated. Think about this for a second, although SPX had a nasty day today, we are still right where we were at Tuesday… what does that tell you?”
“That means there wasn’t really a NEED to rehedge that same exposure. Volatility didn’t compress much after FOMC and when the market gave it all back it brought us right back to where we started. Put yourself in the shoes of an institution.”
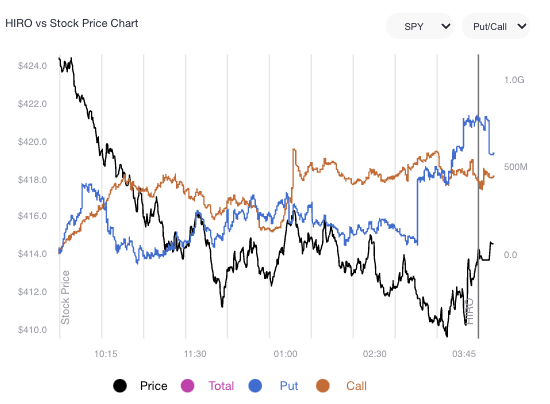
Graphic: SpotGamma’s Hedging Impact of Real-Time Options Indicator (HIRO) for SPY shows light put selling and call buying. Participants are (likely) hedged and are not demanding protection in size amid lower prices.
Pursuant to those remarks, SpotGamma sees markets reaching a lower limit near the $4,000.00 SPX area. At that juncture, the rate at which liquidity providers add pressure in their hedging activities flattens as they, too, have hedges.
Graphic: Via SpotGamma. Updated April 27, 2022.
“In turn, dealers may be able to advantageously reduce delta hedging (sell less), and supply markets with more liquidity (buy more stock). This could serve to reduce volatility.”
So, what do you do with this information? The idea is that volatility implied may reprice to reflect what is realized. In such a case, you’d want positive exposure to volga (i.e., don’t sell volatility).
This is more of a view on volatility rather than direction, at this juncture.
Directionally speaking, the returns distribution is skewed positive. This is from an overlay of proxies for buying and naive gamma exposure.
Here’s one model using similar data we often look at in this letter.
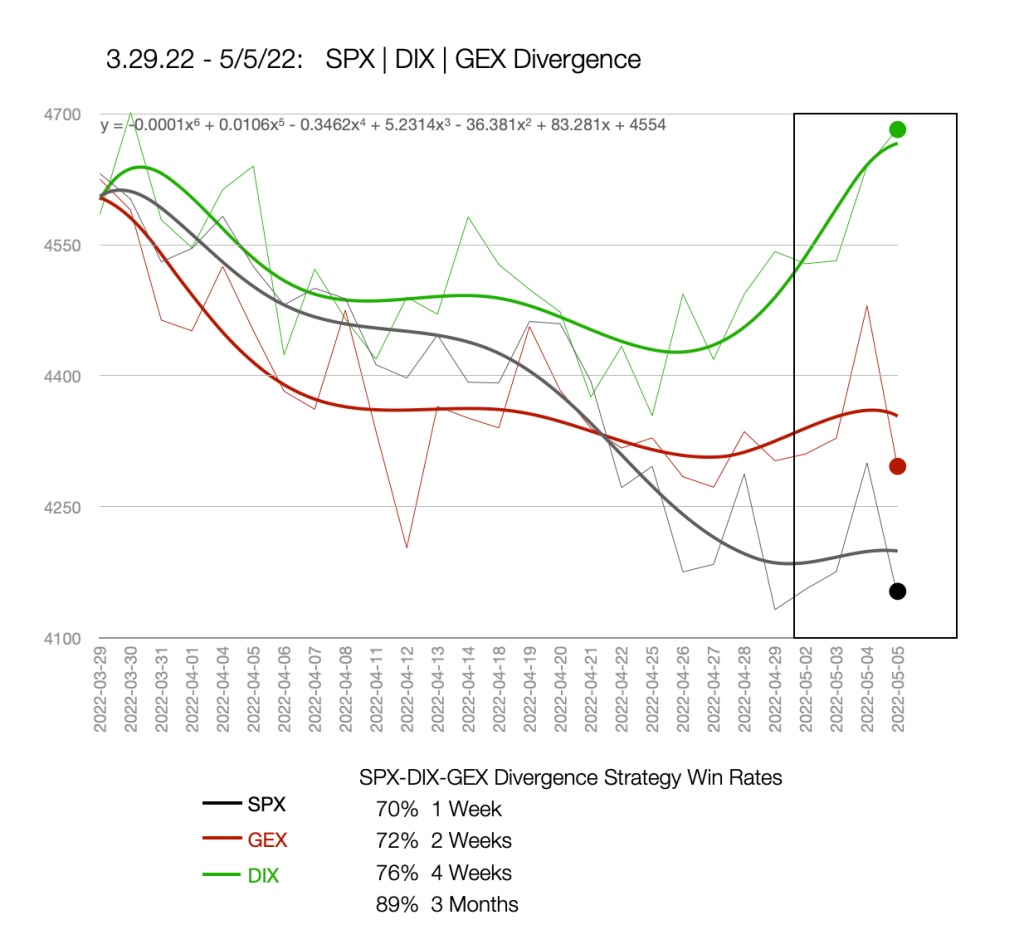
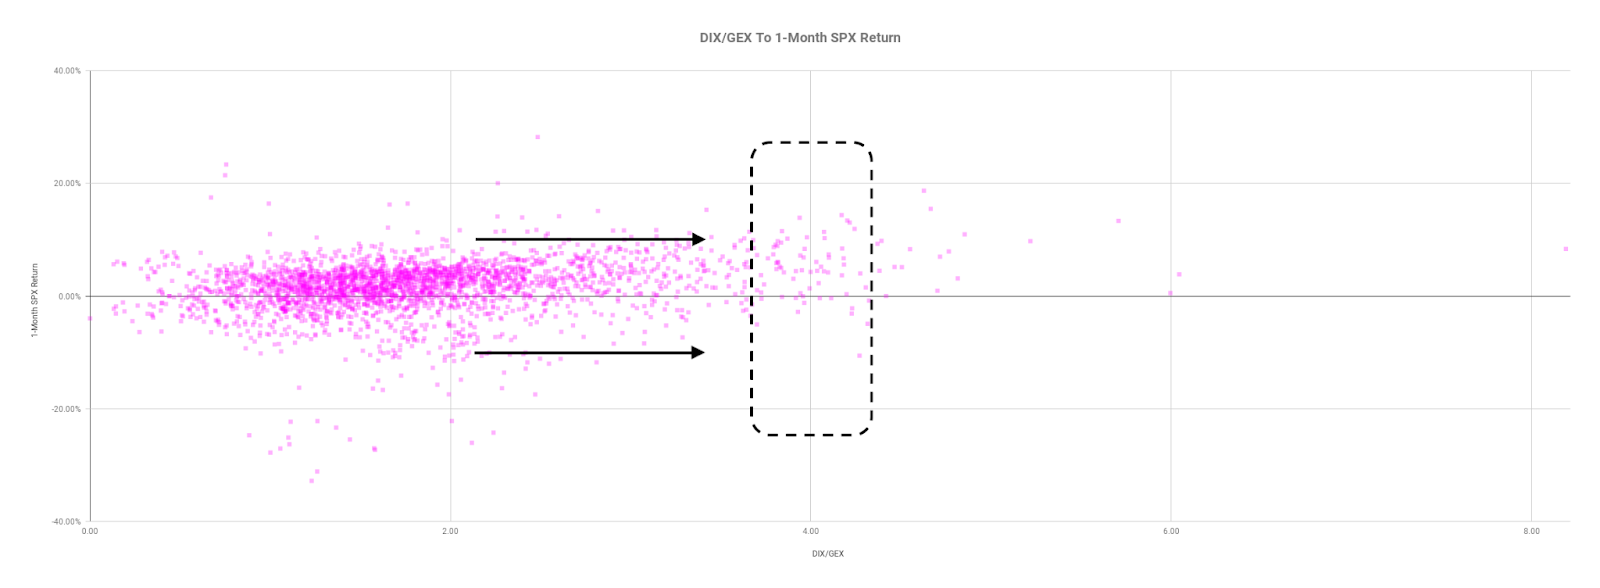
Graphic: Via nextSignals. “When SPX and [gamma exposure] nosedive after an extended selloff while dark pools’ buying sharply diverges to the upside … buy the S&P 500.”
Technical: As of 6:45 AM ET, Friday’s regular session (9:30 AM – 4:00 PM ET), in the S&P 500, will likely open in the middle part of a negatively skewed overnight inventory, inside of prior-range and -value, suggesting a limited potential for immediate directional opportunity.
In the best case, the S&P 500 trades higher; activity above the $4,148.25 high volume area (HVNode) puts in play the $4,184.25 HVNode. Initiative trade beyond the $4,184.25 HVNode could reach as high as the $4,212.25 micro composite point of control (MCPOC) and $4,303.00 weak high (obvious breakout level), or higher.
In the worst case, the S&P 500 trades lower; activity below the $4,148.25 HVNode puts in play the $4,099.25 regular trade low (RTH Low). Initiative trade beyond the RTH Low could reach as low as the $4,055.75 low volume area (LVNode) and $3,978.50 LVNode, or lower.
Click here to load today’s key levels into the web-based TradingView charting platform. Note that all levels are derived using the 65-minute timeframe. New links are produced, daily.
Graphic: 65-minute profile chart of the Micro E-mini S&P 500 Futures.
Definitions
Overnight Rally Highs (Lows): Typically, there is a low historical probability associated with overnight rally-highs (lows) ending the upside (downside) discovery process.
Volume Areas: A structurally sound market will build on areas of high volume (HVNodes). Should the market trend for long periods of time, it will lack sound structure, identified as low volume areas (LVNodes). LVNodes denote directional conviction and ought to offer support on any test.
If participants were to auction and find acceptance into areas of prior low volume (LVNodes), then future discovery ought to be volatile and quick as participants look to HVNodes for favorable entry or exit.
POCs: POCs are valuable as they denote areas where two-sided trade was most prevalent in a prior day session. Participants will respond to future tests of value as they offer favorable entry and exit.
Volume-Weighted Average Prices (VWAPs): A metric highly regarded by chief investment officers, among other participants, for quality of trade. Additionally, liquidity algorithms are benchmarked and programmed to buy and sell around VWAPs.
About
After years of self-education, strategy development, mentorship, and trial-and-error, Renato Leonard Capelj began trading full-time and founded Physik Invest to detail his methods, research, and performance in the markets.
Capelj also develops insights around impactful options market dynamics at SpotGamma and is a Benzinga reporter.
In no way should the materials herein be construed as advice. Derivatives carry a substantial risk of loss. All content is for informational purposes only.
The Daily Brief is a free glimpse into the prevailing fundamental and technical drivers of U.S. equity market products. Join the 200+ that read this report daily, below!
Overnight, equity index futures auctioned sideways to higher after their late-day liquidation and break from a multi-day consolidation area on technical factors (e.g., options expirations) among other things, potentially, like the increase in personal consumption expenditures.
Broadly speaking, the narrative that investors are showing some concern over the economic outlook, with respect to geopolitical tension and monetary policy, continues to emanate.
U.S. high-grade bonds shed over 5%, booking the worst quarterly performance since the ‘80s. This is as recession risks have risen more than two-fold.
Notwithstanding, the Federal Reserve’s (Fed) favorite yield curve metric remains steep; per a Bloomberg commentary, “the gap between the three-month bill rates and 10-year yields is the ‘most useful term spread for forecasting recessions,’ … [and] it currently stands at 186 basis points, versus negative 2 basis points on 2s10s.”
In terms of news, the U.K. will join the U.S. in releasing oil from its reserves to lower prices and reduce its reliance on external partners. This helped ease futures calendar spreads on oil, Reuters’ John Kemp said in a newsletter to followers; the “six-month spread [narrowing] to a backwardation of $9 per barrel, the lowest since before Russia’s invasion of Ukraine.”
Ahead is data on nonfarm payrolls, the unemployment rate and average hourly earnings, as well as labor-force participation (8:30 AM ET). Thereafter, the Chicago Fed’s Charles Evans is scheduled to speak (9:05 AM ET).
Later is Markit manufacturing PMI (9:45 AM ET), as well as ISM manufacturing index and consumer spending data (10:00 AM ET).
Graphic updated 6:30 AM ET. Sentiment Neutral if expected /ES open is inside of the prior day’s range. /ES levels are derived from the profile graphic at the bottom of the following section. Levels may have changed since initially quoted; click here for the latest levels. SqueezeMetrics Dark Pool Index (DIX) and Gamma (GEX) calculations are based on where the prior day’s reading falls with respect to the MAX and MIN of all occurrences available. A higher DIX is bullish. At the same time, the lower the GEX, the more (expected) volatility. Learn the implications of volatility, direction, and moneyness. SHIFT data used for S&P 500 (INDEX: SPX) options activity. Note that options flow is sorted by the call premium spent; if more positive, then more was spent on call options. Breadth reflects a reading of the prior day’s NYSE Advance/Decline indicator. VIX reflects a current reading of the CBOE Volatility Index (INDEX: VIX) from 0-100.
What To Expect
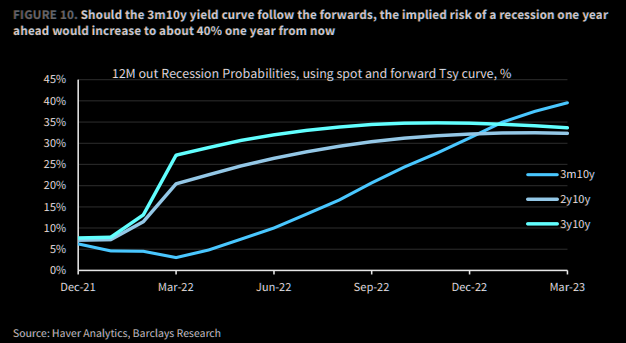
Fundamental: The S&P 500 bagged its first quarterly loss in two years as recession probabilities, implied by some yield curves, have risen.
Graphic: Via Barclays. Taken from The Market Ear. “[T]he 1y ahead recession probability implied by the 3m10y curve rises to about 40% a year from now (so for an early 2024 recession), slightly higher than implied by other curves.”
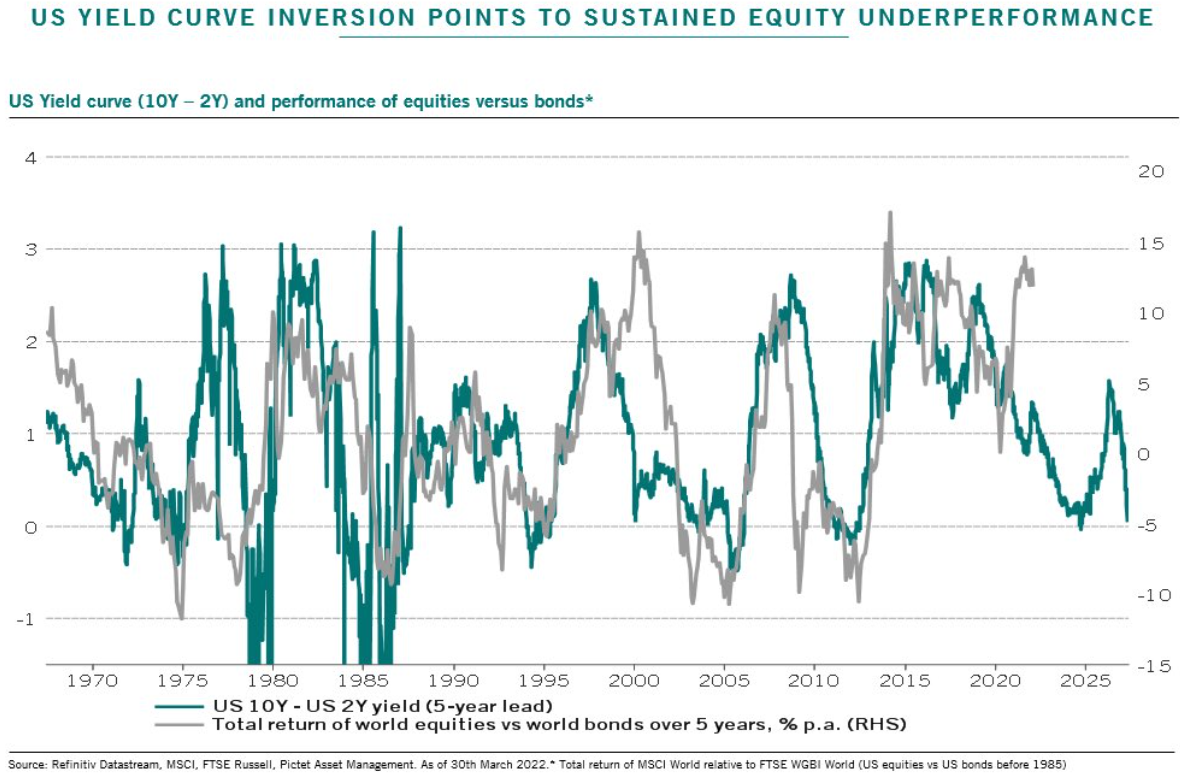
This is as the stock performance, relative to bonds against the lagged spread of 10- and 2-year bond yields, is expected to be weak, according to insights by Pictet Asset Management.
Graphic; Via Pictet Asset Management Ltd. Taken from Bloomberg. “On this basis, stocks’ great outperformance this quarter may end up looking like a head-fake.”
Pictet’s narrative further validates some of the theses shared by institutions like Brevan Howard Asset Management, which is having one of its best years, Morgan Stanley (NYSE: MS), Goldman Sachs Group Inc (NYSE: GS), and Bank of America Corporation (NYSE: BAC).
Adding to the prospects for weaker earnings amid higher costs, among other things, some of these institutions see the potential for the Fed’s terminal rate to reach between 3% and 3.25%.
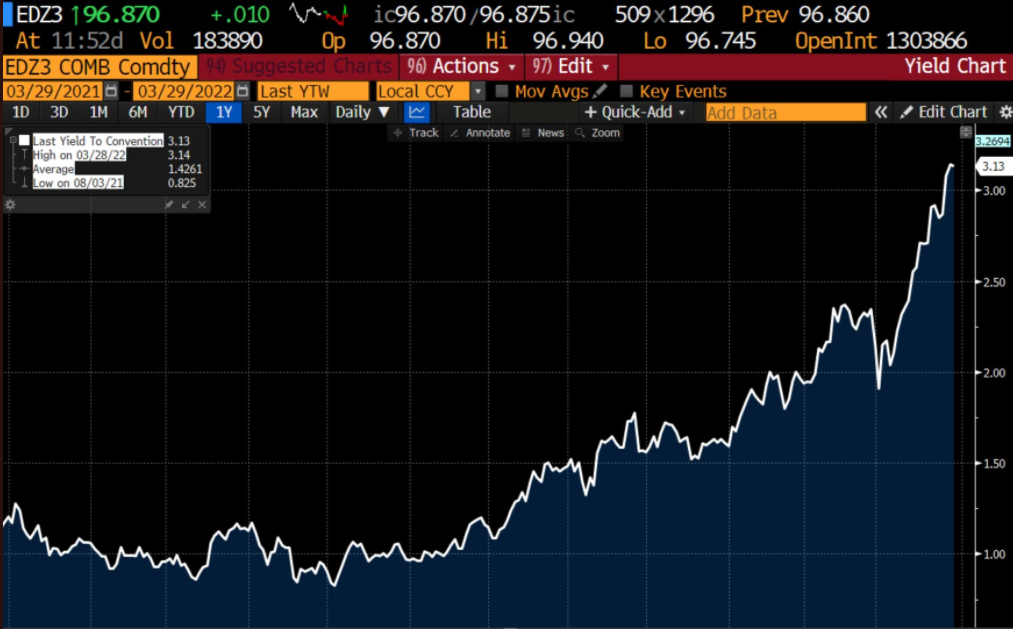
Graphic: Via Andreas Steno Larsen. “The Fed is now priced to hike to levels above 3% by Dec-2023, … which is the main reason why we have seen a sell-off in all assets with an intensive duration profile over the past 12-15 months … [and has] duration intensive assets … starting to look attractive again from a risk/reward perspective.”
This would hit valuations as higher yields both reduce the present value of future earnings and “hurt those carrying the highest leverage,” potentially playing into a slowdown or recession.
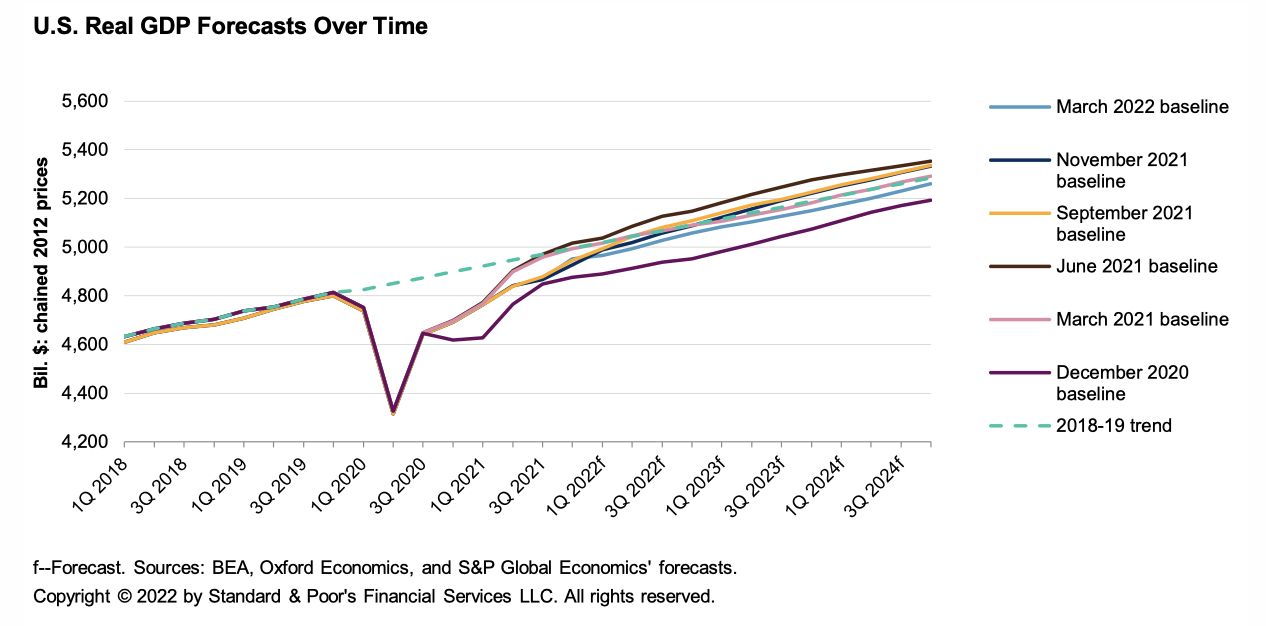
Graphic: Via S&P Global Inc (NYSE: SPGI) “expects the economic damage [of geopolitics and pricing pressures] to lower U.S. GDP growth to 3.2% this year, matching its preliminary forecast in early March but a full 70 bps lower than its November forecast of 3.9%.”
“Now rates volatility can drive growth volatility and that actually becomes a vicious cycle between the two,” said Christian Mueller-Glissmann of Goldman Sachs.
“That’s a big difference to the last cycle where growth volatility drove rates volatility.”
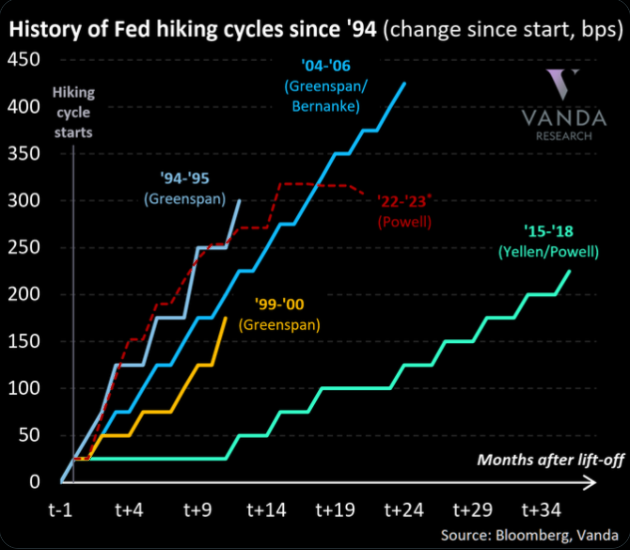
Graphic: Via Vanda. Taken from The Market Ear. “The bond market is pricing the 2022 cycle to be remarkably fast. Macro Alf: ‘Remember: sharp changes in borrowing conditions often cause non-linear reactions in a highly leveraged system.’”
However, this is as the dominance of rate-sensitive tech stocks is set to shrink next year amid sector reclassifications, as well as still-stimulative policy and beats of economic expectations that may feed into earnings surprises, later.
JPMorgan’s Marko Kolanoivc explains that (1) “both equity and credit markets have historically fared well at the start of monetary tightening cycles,” (2) “the real policy rate is extremely negative and thus stimulative,” and (3) “not all central banks are tightening.”
Morgan Stanley’s Michael Wilson vehemently disagrees suggesting the recent equity market turnaround “was nothing more than a vicious bear market rally,” and offers participants a clear opportunity to sell at better prices.
Taking all of the above comments and perspectives together, one thing is for certain: this period in history is like no other. It makes sense to pick a timeframe and stick with it.
Positioning: In the past weeks, according to JPMorgan Chase & Co’s Nikolaos Panigirtzoglou, the supportive “rebalancing flows away from bonds into equities” are no more and, therefore, equities are subject to increased vulnerabilities “if bond yields continue to rise.”
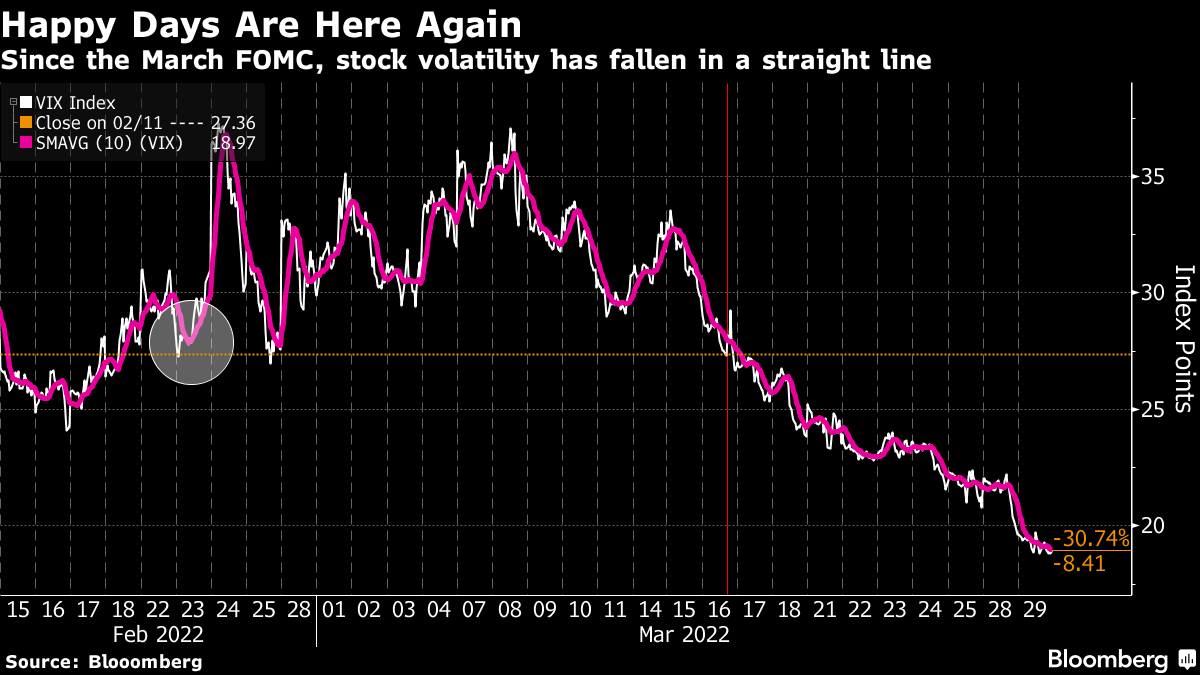
This is after measures of equity implied volatility were crushed heading through the mid-March FOMC and monthly options expiry (OPEX) events, and the options hedging impact of this, at least, was very supportive, as we’ve talked about many times in this newsletter.
Graphic: Via Bloomberg. “The CBOE-VIX index, measuring stock volatility from the options market, unsurprisingly spiked immediately after Russia’s attack. It reached another high three weeks ago. Then the VIX started to fall, and in the two weeks since the Fed unveiled its first rate hike in years, the decline has been almost linear. The ‘fear gauge,’ as it is often known, is now significantly lower than it was a week before the invasion, when markets were priced on the assumption that there would be no war.”
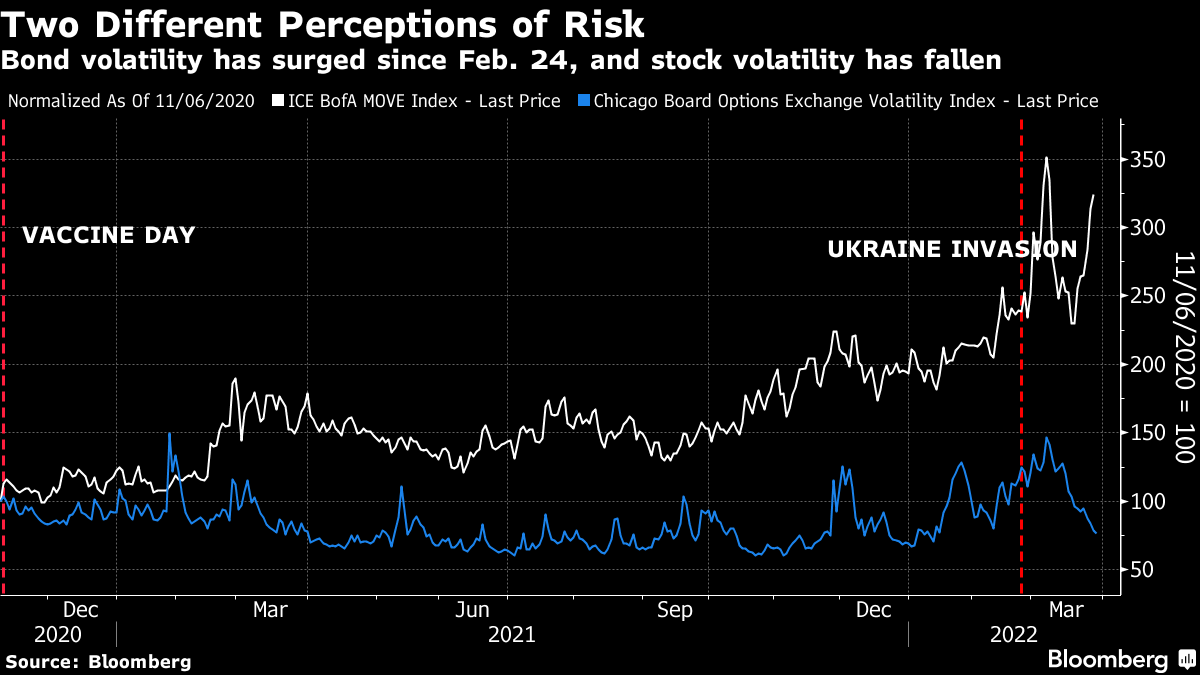
On the contrary, measures of volatility for other assets, like the Merrill Lynch Options Volatility Estimate (INDEX: MOVE), a useful measure of bond market sentiment, are doing the opposite.
We discussed early last month, what we saw was an increased supply of equity market volatility, as a potential reason for some of these divergences.
As Bloomberg’s John Authers explained well, it, too, could have been “an aggressive central bank” that prompted a move out of bonds and into equities, and subdued target-date fund rebalancing flows which usually sell stocks and buy bonds.
“[I]t looks as though the contradictions that had built up in the market over the last two years, and in the decade before that, are being put under extreme stress by the double whammy of a newly aggressive Federal Reserve, and the worst geopolitical shock in decades,” Authers adds.
Still, realized volatility continues to trend down which ought to force those (e.g., computer-driven traders) who position (and size equity exposure) based on underlying volatility to load up, again.
Nomura Holdings Inc’s (NYSE: NMR) Charlie McElligott explains that “volatility-targeting funds and trend-following commodity trading advisers, purchased” billions of equity futures which bolstered the price rise of the last weeks.
From a positioning versus buying support perspective, the forward returns distribution is skewed positive but not by a lot; a lot of the supportive options exposure is rolling-off and this could free up (i.e., unpin) indexes for the next leg up or down.
Graphic: SpotGamma’s Hedging Impact of Real-Time Options Indicator shows negative delta trade in the S&P 500 SPY ETF, and this pressured the underlying index.
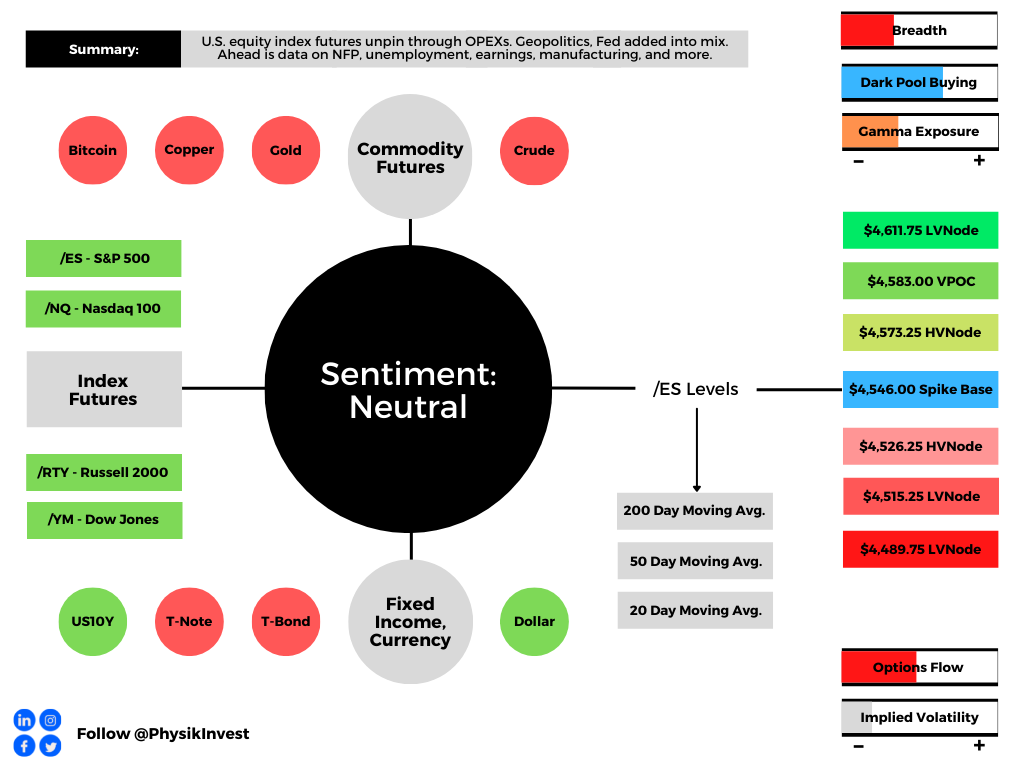
Technical: As of 6:30 AM ET, Friday’s regular session (9:30 AM – 4:00 PM ET), in the S&P 500, will likely open in the upper part of a positively skewed overnight inventory, inside of prior-range and -value, suggesting a limited potential for immediate directional opportunity.
In the best case, the S&P 500 trades higher; activity above the $4,546.00 spike base puts in play the $4,573.25 high volume area (HVNode). Initiative trade beyond the HVNode could reach as high as the $4,583.00 untested point of control (VPOC) and $4,611.75 low volume area (LVNode), or higher.
In the worst case, the S&P 500 trades lower; activity below the $4,546.00 spike base puts in play the $4,526.25 HVNode. Initiative trade beyond the HVNode could reach as low as the $4,515.25 and $4,489.75 LVNodes, or lower.
Considerations: A change in the market (i.e., the transition from two-time frame trade, or balance, to one-time frame trade, or trend) occurred.
Continue to monitor for acceptance outside of the balance area. Rejection (i.e., return inside of balance) portends a move to the opposite end of the balance. See the below graphic for more.
Click here to load today’s key levels into the web-based TradingView charting platform. Note that all levels are derived using the 65-minute timeframe. New links are produced, daily.
Graphic: 65-minute profile chart of the Micro E-mini S&P 500 Futures.
What People Are Saying
Disclaimer: This thread is not from an institutional vol mandate perspective, it will be more from a prop trader perspective
Contrary to what fintwit parades, losses are part of the game and drawdowns are very normal in trading.
Volume Areas: A structurally sound market will build on areas of high volume (HVNodes). Should the market trend for long periods of time, it will lack sound structure, identified as low volume areas (LVNodes). LVNodes denote directional conviction and ought to offer support on any test.
If participants were to auction and find acceptance into areas of prior low volume (LVNodes), then future discovery ought to be volatile and quick as participants look to HVNodes for favorable entry or exit.
Gamma: Gamma is the sensitivity of an option to changes in the underlying price. Dealers that take the other side of options trades hedge their exposure to risk by buying and selling the underlying. When dealers are short-gamma, they hedge by buying into strength and selling into weakness. When dealers are long-gamma, they hedge by selling into strength and buying into weakness. The former exacerbates volatility. The latter calms volatility.
POCs: POCs are valuable as they denote areas where two-sided trade was most prevalent in a prior day session. Participants will respond to future tests of value as they offer favorable entry and exit.
Options Expiration (OPEX): Marks change in dealer gamma exposure.
Volume-Weighted Average Prices (VWAPs): A metric highly regarded by chief investment officers, among other participants, for quality of trade. Additionally, liquidity algorithms are benchmarked and programmed to buy and sell around VWAPs.
About
After years of self-education, strategy development, mentorship, and trial-and-error, Renato Leonard Capelj began trading full-time and founded Physik Invest to detail his methods, research, and performance in the markets.
Capelj also develops insights around impactful options market dynamics at SpotGamma and is a Benzinga reporter.
In no way should the materials herein be construed as advice. Derivatives carry a substantial risk of loss. All content is for informational purposes only.
Editor’s Note: The Daily Brief is a free glimpse into the prevailing fundamental and technical drivers of U.S. equity market products. Join the 200+ that read this report daily, below!
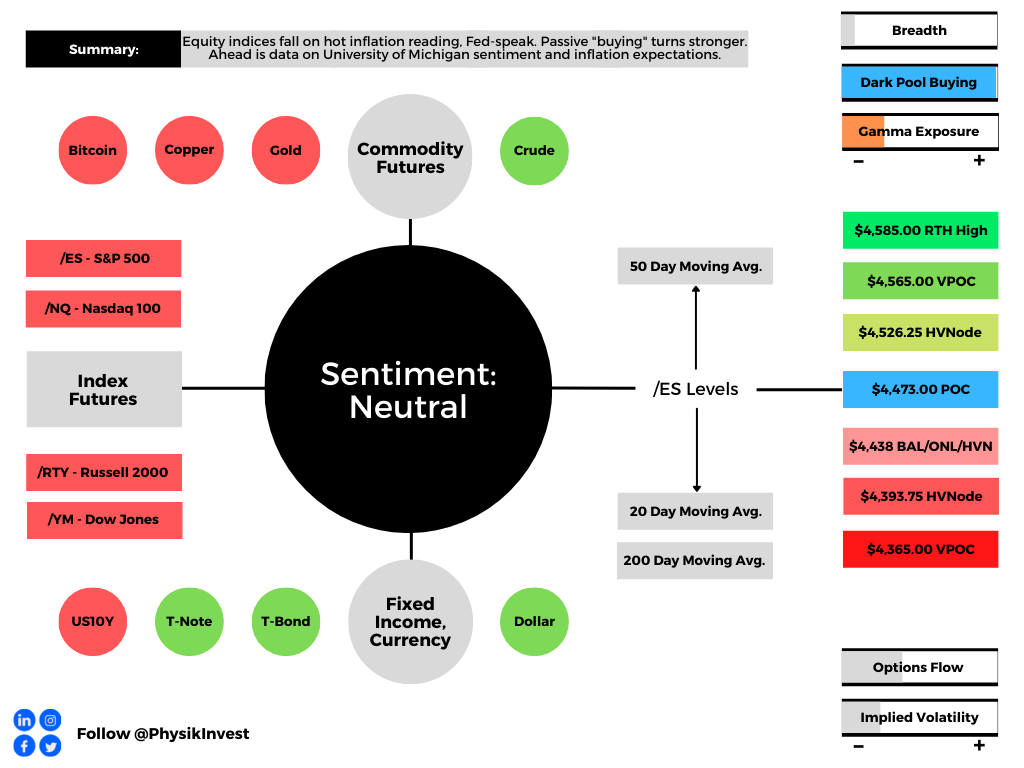
Overnight, equity index futures continued lower after the hottest inflation reading in decades and hawkish (i.e., favoring contractionary policy) Fed-speak by St. Louis Fed Chair James Bullard.
Ahead is data on University of Michigan sentiment and inflation expectations (10:00 AM ET).
Graphic updated 6:30 AM ET. Sentiment Risk-Off if expected /ES open is below the prior day’s range. /ES levels are derived from the profile graphic at the bottom of the following section. Levels may have changed since initially quoted; click here for the latest levels. SqueezeMetrics Dark Pool Index (DIX) and Gamma (GEX) calculations are based on where the prior day’s reading falls with respect to the MAX and MIN of all occurrences available. A higher DIX is bullish. At the same time, the lower the GEX, the more (expected) volatility. Learn the implications of volatility, direction, and moneyness. SHIFT data used for S&P 500 (INDEX: SPX) options activity. Note that options flow is sorted by the call premium spent; if more positive, then more was spent on call options. Breadth reflects a reading of the prior day’s NYSE Advance/Decline indicator. VIX reflects a current reading of the CBOE Volatility Index (INDEX: VIX) from 0-100.
What To Expect
Fundamental: Bonds and equities were sold, yesterday.
This is after the hottest inflation reading in four decades and comments by the Fed’s Bullard that the central bank should hike rates by 100 basis points over the next three meetings.
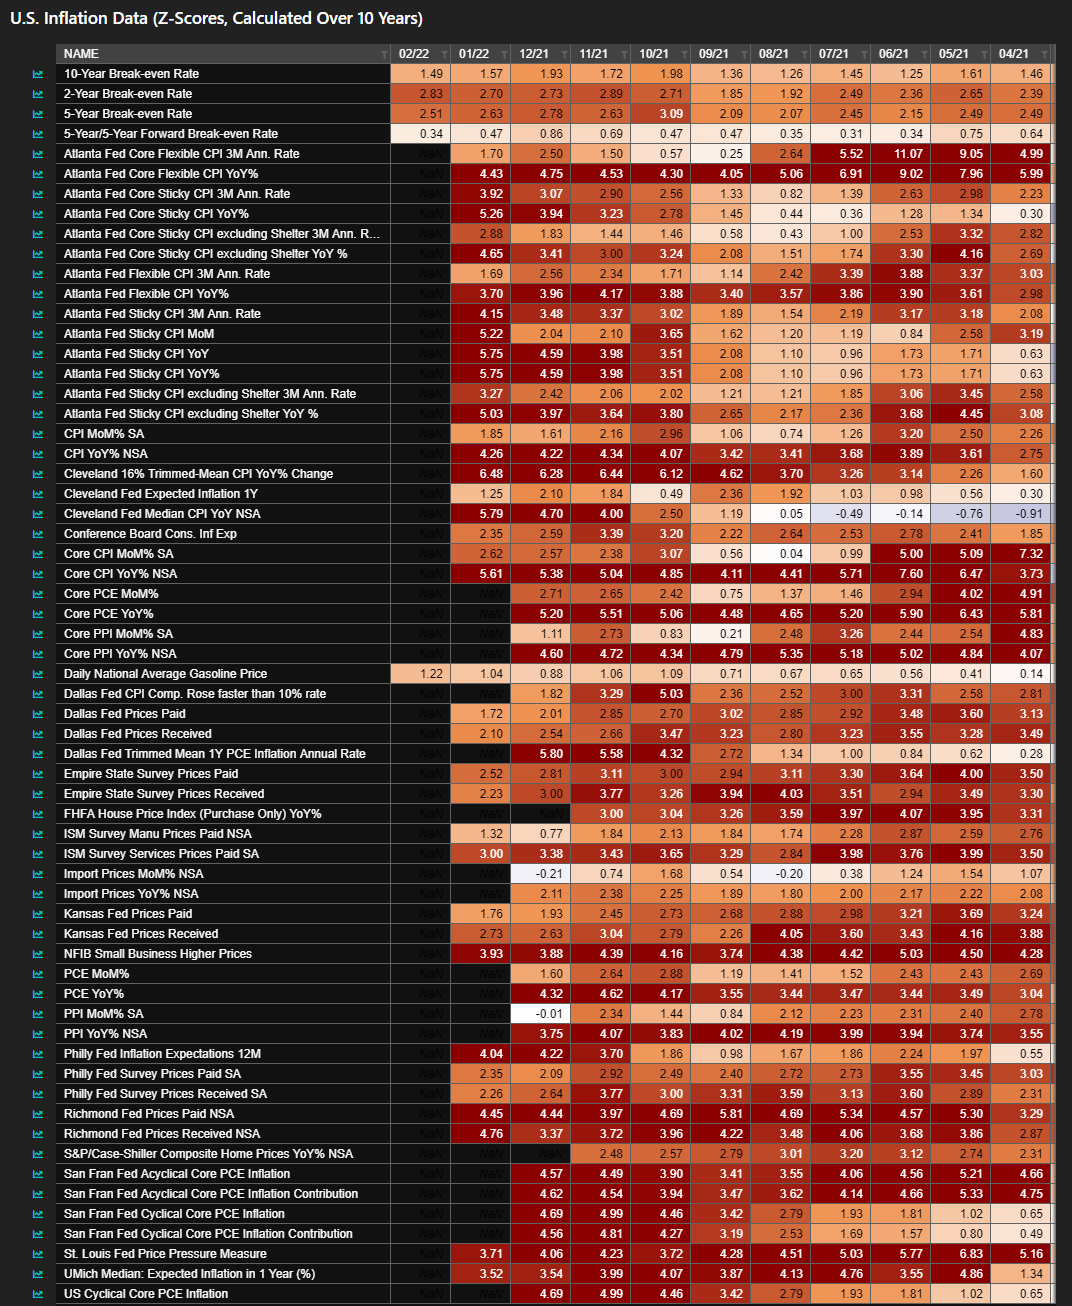
Graphic: Via Bloomberg, “This is a heat map produced by the Bloomberg ECAN function, and it shows every indicator relevant to U.S. inflation now well above its recent mean.”
“Bullard’s plan involves spreading the increases over three meetings, shrinking the Fed’s balance sheet starting in the second quarter and then deciding on the path of rates in the second half based on updated data,” Bloomberg explained.
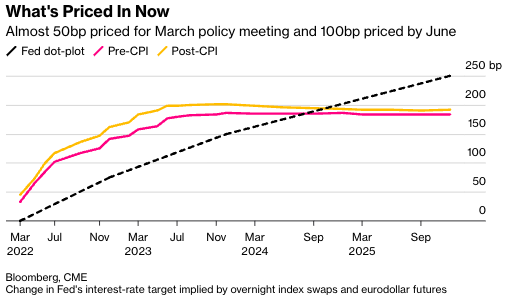
“Markets boosted bets on rate hikes, pricing a full percentage-point increase over three meetings, which would require the first 50 basis-point increase since 2000 unless a move was made between Fed meetings.”
Further, though this FOMC participant’s more hawkish tilt differs from what the entire committee has committed to, so long as “the market expects it, … the odds of a 50bp hike in March or May are higher.”
This trend in expectations has been worsening with each major macroeconomic event in 2022. The Fed’s Minutes, FOMC meeting, Nonfarm Payrolls, and CPI have all played a part in the disruption of long-term trends in yields which has a negative impact on valuations, to put simply.
Though earnings growth may offset the negative valuation impact of higher rates, as discussed in detail days ago, the yield curve – e.g., spread between 10- and 2-year – is on its way toward an inversion, as is the yield curve measure involving overnight index swaps (OIS).
For context, per Reuters, an “OIS transaction involves exchanging an overnight rate such as the federal funds rate for a fixed one. For instance, in a U.S. 2-year OIS swap, one party to the transaction receives a fixed two-year rate in exchange for paying the fed funds rate daily over the next two years.”
The OIS market is also a reflection of traders’ expectations for rates. An inversion (which may signal the expectation of aggressive action against inflation that could also stifle economic growth) previously occurred in July 2018. Months later, markets sold and the Fed cut rates.
Per Alfonso Peccatiello, the former head of a $20 billion investment portfolio and author of The Macro Compass: The inversion of the OIS curve may worsen a downturn in the economy as short-term refinancing credit becomes more expensive and markets price weaker long-term growth.
The OIS curve is “a cleaner indication of yield curve inversions,” Peccatiello added.
Positioning: Bonds down. Equities down. What the heck?
This newsletter has talked about this dynamic in the past and will borrow from that, below.
In short, over the past 40 or so years, monetary policy was used as a crutch to support the economy. This promoted deflation, innovation, and the subsequent rise in valuations.
With rates near zero and lifting, that’s a headwind; coupled with participants’ increased exposure to rate and equity market risk, which can play into cross-market hedging and de-leveraging cascades, 60/40 turns into somewhat of a poor hedge.
Why? Higher rates have the potential to decrease the present value of future earnings, making stocks, especially those that are high growth, less attractive.
According to a note published by Andy Constan of Damped Spring Advisors, “The lack of additional liquidity provided by Fed purchase will also remove a damper for the market and the economy keeping asset volatility well bid, while also causing asset diversification benefit to fall, generating rising portfolio volatility and the risk demanded to hold assets.”
“Now, with the Fed poised to hike interest rates to combat raging inflation, the bond-stock relationship could be upended,” Bloomberg explains.
“At stake are trillions of dollars that are managed at risk parity funds, balanced mutual funds, and pension funds that follow the framework of 60/40 asset allocation.”
Why mention any of this? Well, it forces us to look elsewhere for protection.
In this case, the growing asset class of volatility, so to speak, is that protection. Investors are aware of both the protective and speculative efficiency afforded to them by options and that is the primary reason option volumes are so comparable to stock volumes, now.
Notwithstanding, with option volumes higher, related hedging flows can represent an increased share of volume in underlying stocks. Therefore, the correlation of stock moves, versus options activity, is more pronounced.
To put it simply, we can look to the options market for clues on where to next, for lack of better phrasing. So, let’s do that!
Heading into Thursday’s session, participants were committing capital to bets on lower volatility.
The counterparties to this short volatility trade were long; if the market were to trade higher (lower), they would sell (buy) futures against increased (decreased) positive delta exposure.
Graphic: A rudimentary example of what is involved in hedging a long call option.
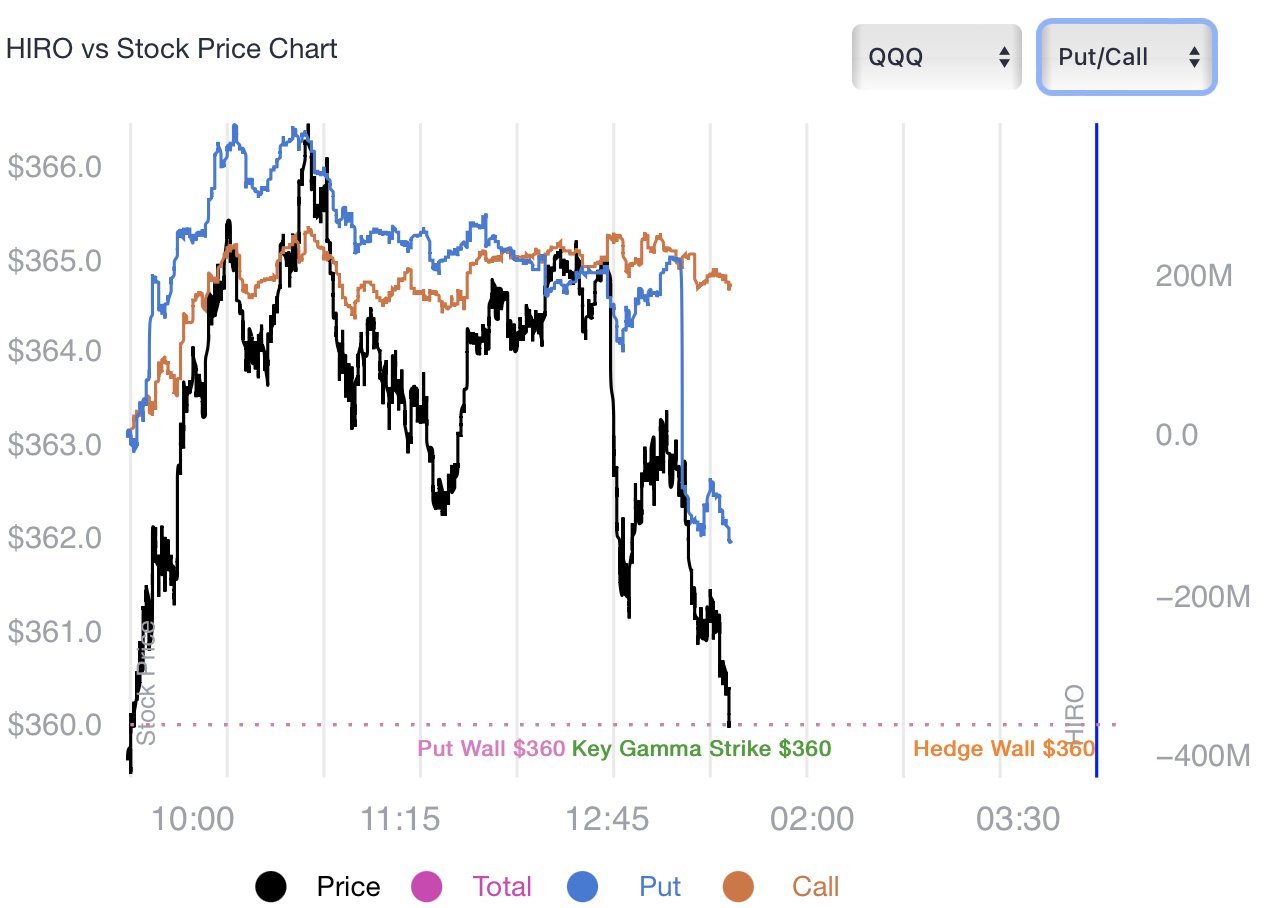
However, Thursday’s post-CPI trade disrupted the balance of trade; lower prices and demand for protection, in the face of lower levels of “on-screen liquidity,” solicited dealer selling to hedge increased exposure to the positive delta from demanded short-dated, highly convex options.
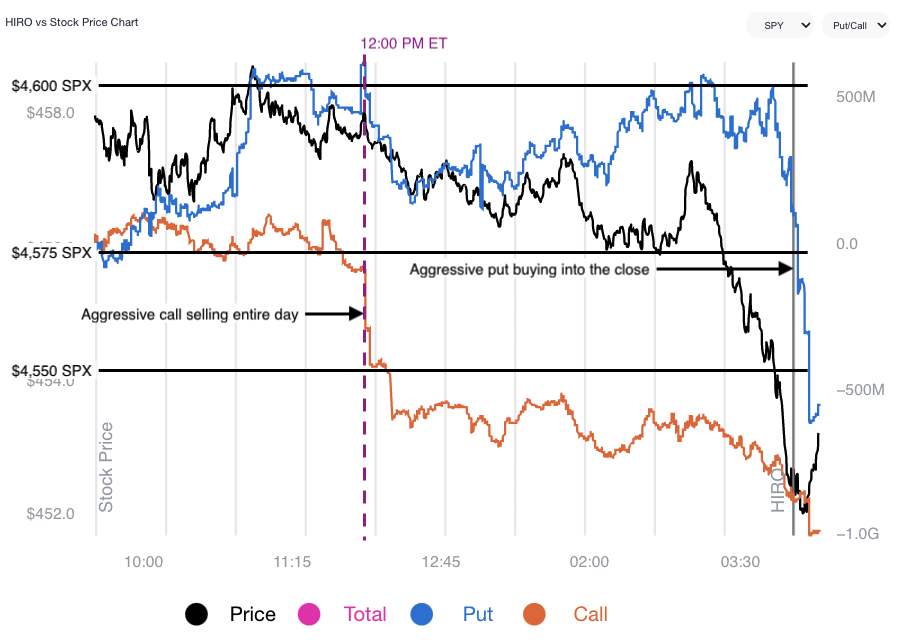
Graphic: SpotGamma’s Hedging Impact of Real-Time Options (HIRO) indicator; “customers bought put options (a negative delta trade) leaving dealers short (a positive delta trade).”
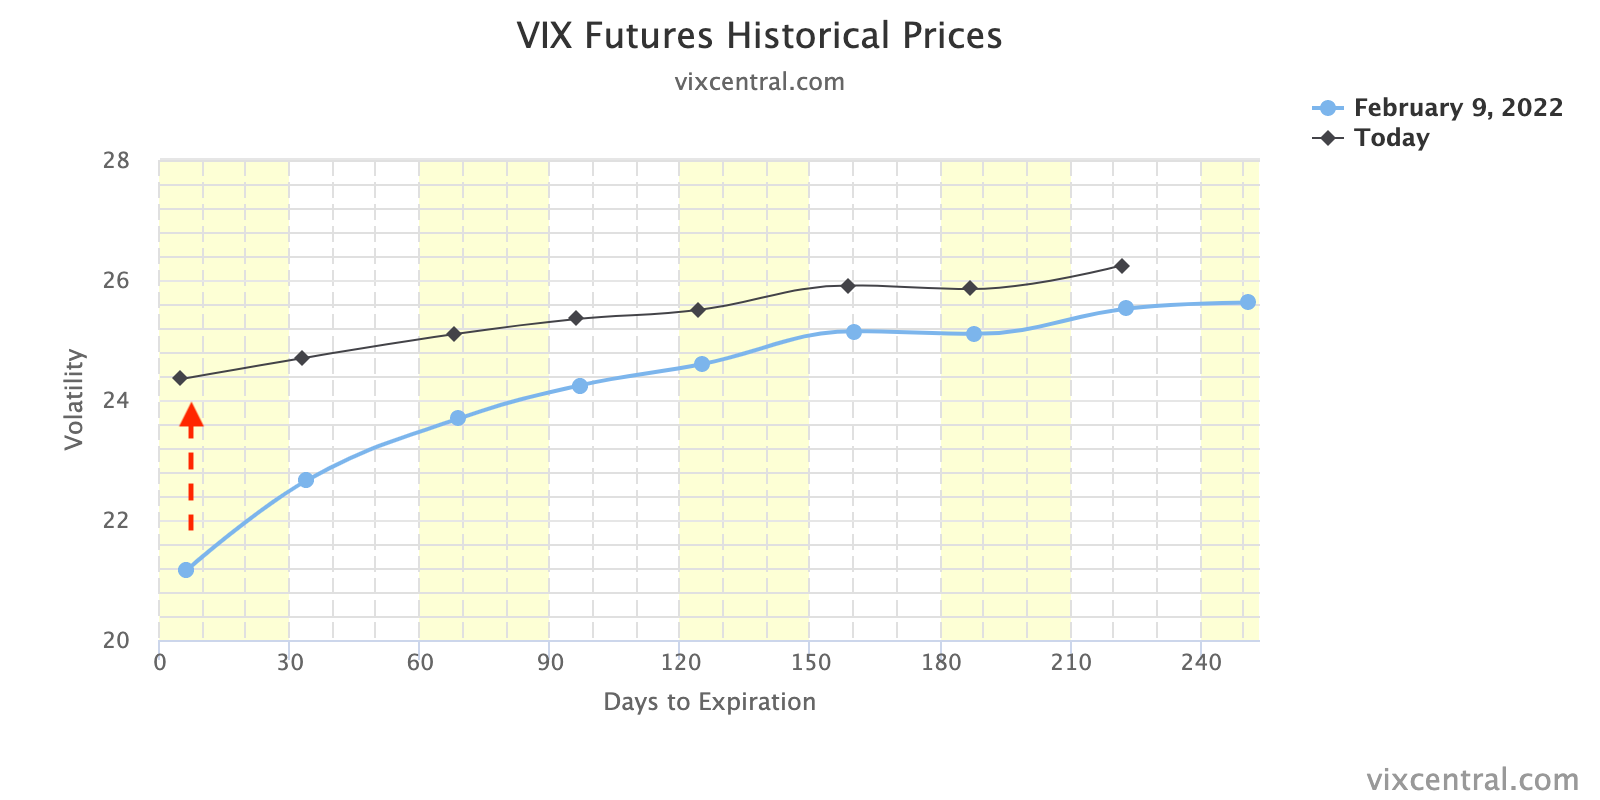
The demand for shorter-dated protection is better visualized by the VIX term structure which shifted markedly at the front-end, yesterday.
Graphic: VIX term structure shifts higher (dramatically at the front-end).
As direction (delta) and volatility (vega) are inputs to the pricing of options, lower prices and higher volatility (a reflection of fear and demand for protection) will mark options higher. Hedging pressures will exacerbate weakness, as a result of real selling (as talked about above), at the index and single-stock level.
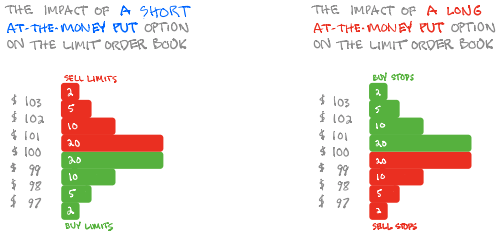
Graphic: SqueezeMetrics details the implications of customer activity in the options market, on the underlying’s order book.
Taking into account options positioning, versus buying pressure (measured via short sales or liquidity provision on the market-making side), positioning metrics remain positively skewed.
Graphic: Data SqueezeMetrics. Graph via Physik Invest.
To conclude, the dip lower and demand for protection could serve to prime the market for upside (when volatility starts to compress again and counterparties unwind hedges thus supporting any attempt higher). All eyes are on next week’s monthly options expiration (OPEX). We will discuss the implications of this, later.
Technical: As of 6:30 AM ET, Friday’s regular session (9:30 AM – 4:00 PM ET), in the S&P 500, will likely open in the middle-to-lower part of a negatively skewed overnight inventory, inside of prior-range and -value, suggesting a limited potential for immediate directional opportunity.
In the best case, the S&P 500 trades higher; activity above the $4,473.00 point of control (POC) puts in play the $4,526.25 high volume area (HVNode). Initiative trade beyond the HVNode could reach as high as the $4,565.00 untested POC (VPOC) and $4,585.00 regular trade high (RTH High), or higher.
In the worst case, the S&P 500 trades lower; activity below the $4,473.00 POC puts in play the key response area at $4,438.75 (BAL/ONL/HVNode). Initiative trade beyond the key response area could reach as low as the $4,393.75 HVNode and $4,365.00 VPOC, or lower.
Click here to load today’s key levels into the web-based TradingView charting platform. Note that all levels are derived using the 65-minute timeframe. New links are produced, daily.
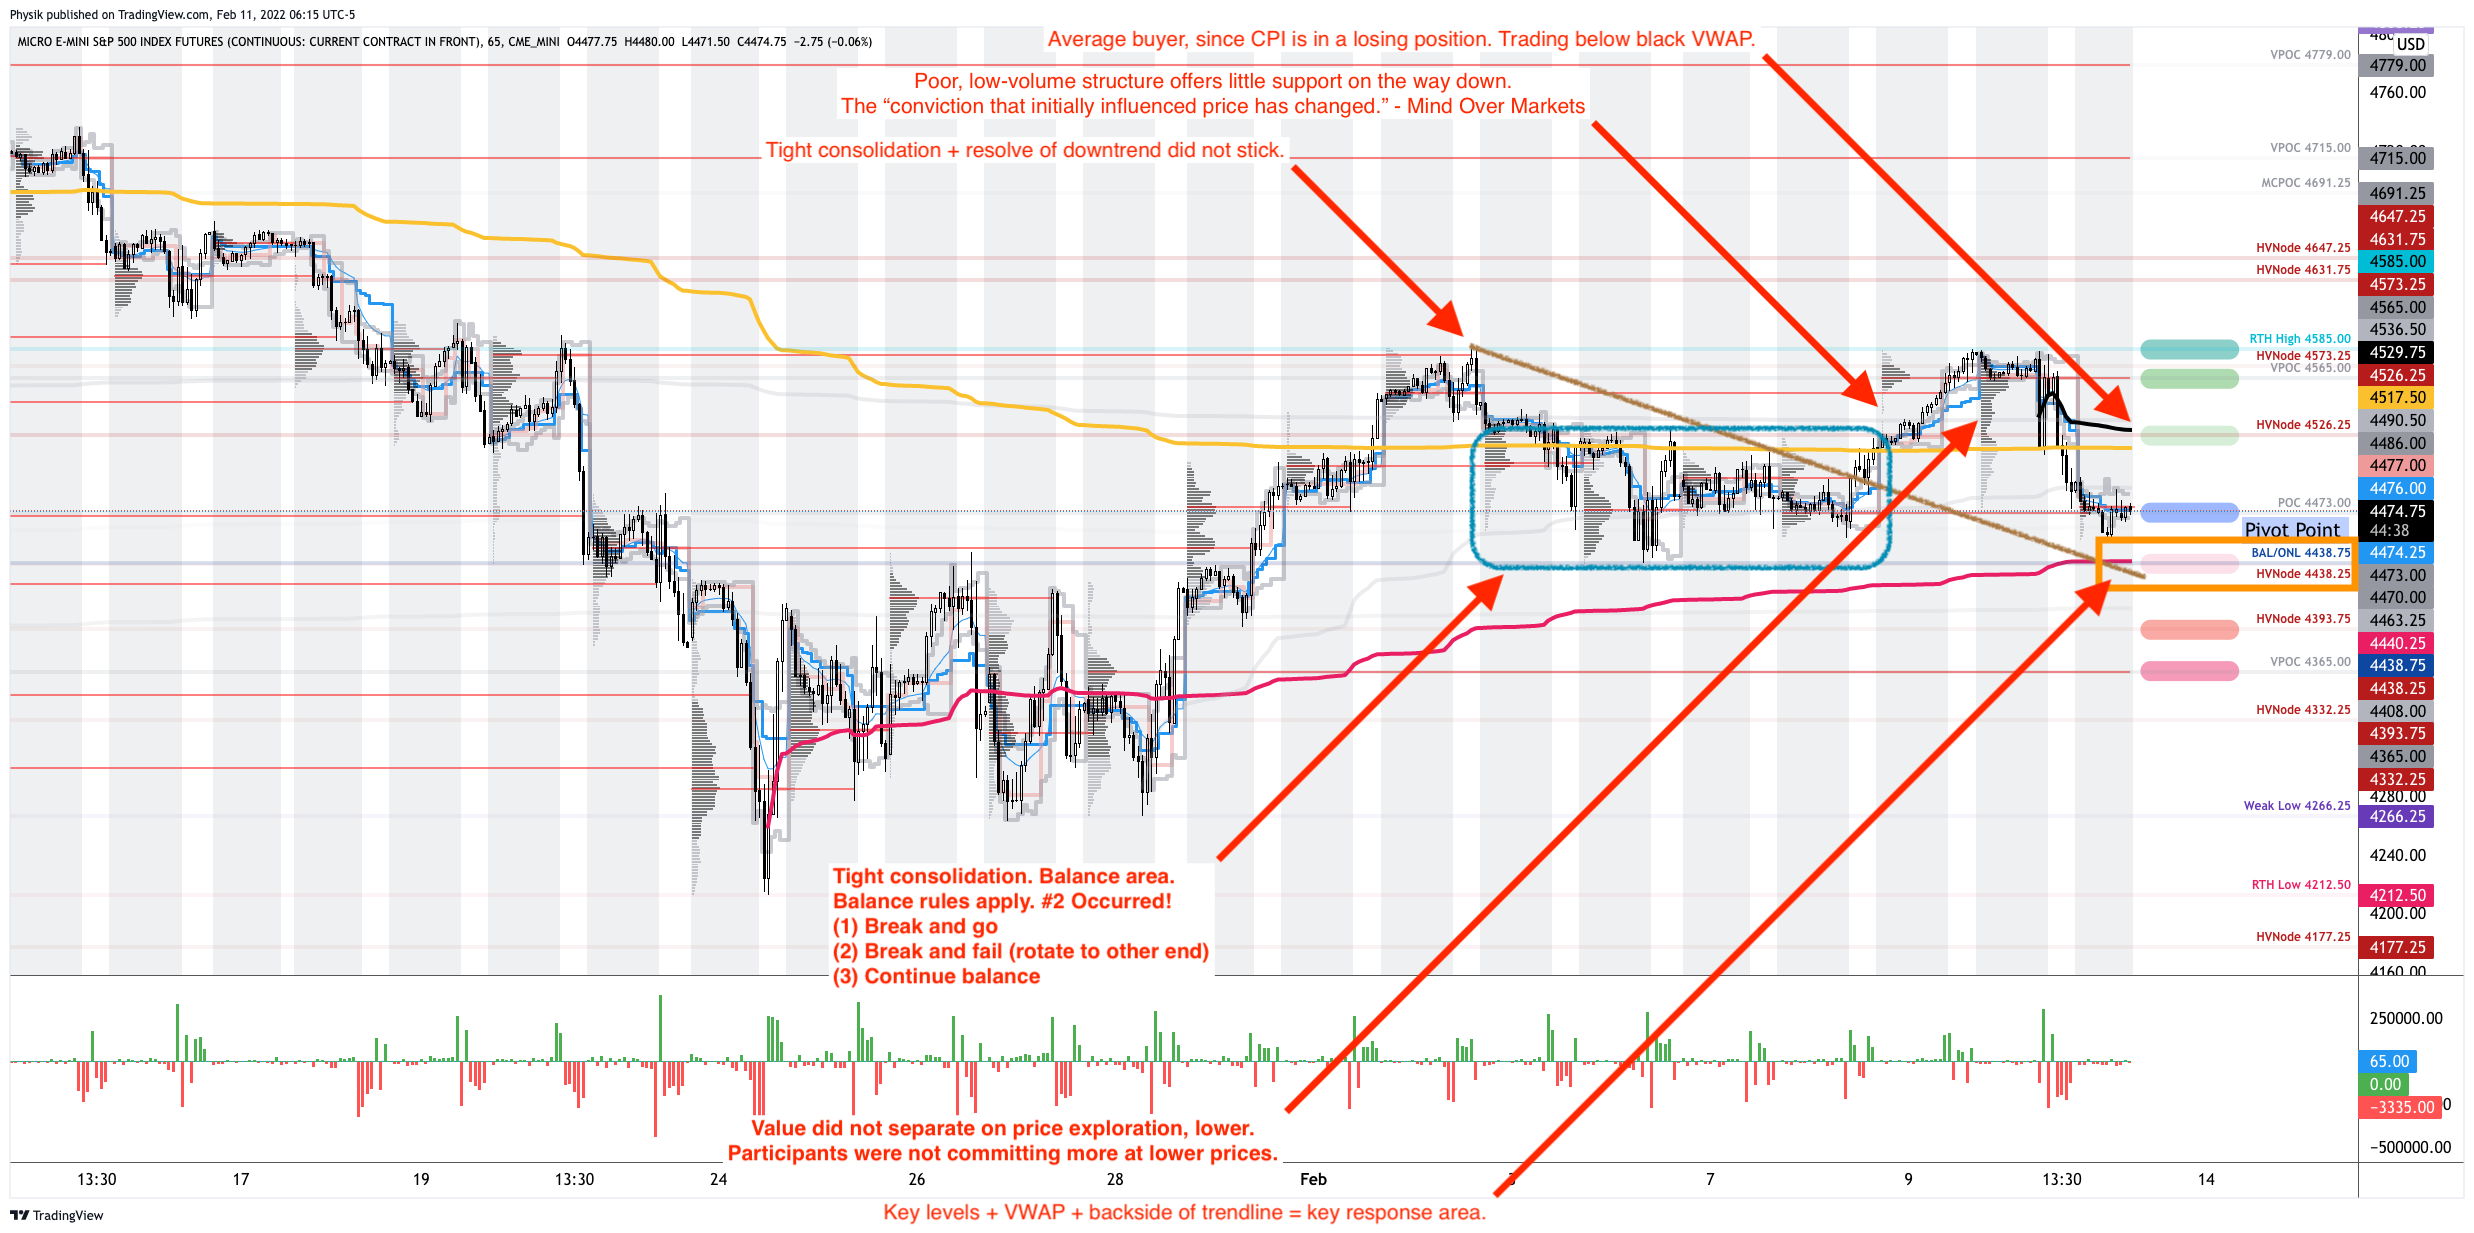
Graphic: 65-minute profile chart of the Micro E-mini S&P 500 Futures.
Definitions
Overnight Rally Highs (Lows): Typically, there is a low historical probability associated with overnight rally-highs (lows) ending the upside (downside) discovery process.
Volume Areas: A structurally sound market will build on areas of high volume (HVNodes). Should the market trend for long periods of time, it will lack sound structure, identified as low volume areas (LVNodes). LVNodes denote directional conviction and ought to offer support on any test.
If participants were to auction and find acceptance into areas of prior low volume (LVNodes), then future discovery ought to be volatile and quick as participants look to HVNodes for favorable entry or exit.
POCs: POCs are valuable as they denote areas where two-sided trade was most prevalent in a prior day session. Participants will respond to future tests of value as they offer favorable entry and exit.
Options Expiration (OPEX): Traditionally, option expiries mark an end to trend or pinning (i.e, the theory that market makers and institutions short options move stocks to the point where the greatest dollar value of contracts will expire) and the reset in dealer gamma exposure.
Volume-Weighted Average Prices (VWAPs): A metric highly regarded by chief investment officers, among other participants, for quality of trade. Additionally, liquidity algorithms are benchmarked and programmed to buy and sell around VWAPs.
About
After years of self-education, strategy development, mentorship, and trial-and-error, Renato Leonard Capelj began trading full-time and founded Physik Invest to detail his methods, research, and performance in the markets.
Capelj is also a Benzinga finance and technology reporter interviewing the likes of Shark Tank’s Kevin O’Leary, JC2 Ventures’ John Chambers, FTX’s Sam Bankman-Fried, and ARK Invest’s Catherine Wood, as well as a SpotGamma contributor developing insights around impactful options market dynamics.
Disclaimer
Physik Invest does not carry the right to provide advice.
In no way should the materials herein be construed as advice. Derivatives carry a substantial risk of loss. All content is for informational purposes only.
The Daily Brief is a free glimpse into the prevailing fundamental and technical drivers of U.S. equity market products. Join the 200+ that read this report daily, below!
Equity index futures auctioned sideways, mostly, ahead of important economic releases such as data on Nonfarm payrolls, the unemployment rate, and average hourly earnings (8:30 AM ET), as well as Fed-speak (10:00 AM and 12:15 PM ET), and consumer credit data (3:00 PM ET).
Graphic updated 6:30 AM ET. Sentiment Neutral if expected /ES open is inside of the prior day’s range. /ES levels are derived from the profile graphic at the bottom of the following section. Levels may have changed since initially quoted; click here for the latest levels. SqueezeMetrics Dark Pool Index (DIX) and Gamma (GEX) calculations are based on where the prior day’s reading falls with respect to the MAX and MIN of all occurrences available. A higher DIX is bullish. At the same time, the lower the GEX, the more (expected) volatility. Learn the implications of volatility, direction, and moneyness. SHIFT data used for S&P 500 (INDEX: SPX) options activity. Note that options flow is sorted by the call premium spent; if more positive, then more was spent on call options. Breadth reflects a reading of the prior day’s NYSE Advance/Decline indicator. VIX reflects a current reading of the CBOE Volatility Index (INDEX: VIX) from 0-100.
What To Expect
Fundamental: Participants will receive further clarity around payrolls data.
According to Bloomberg, the expectation is that Friday’s jobs report ought to show the addition of about 450,000 workers, last month.
“[T]he so-called whisper number has already jumped to 500,000,” in light of this “Wednesday’s consensus-busting ADP Research Institute data that showed U.S. companies added the most jobs in seven months.”
This is all the while major equity indices are down on the week, “fueled by one of the most intense bouts of selling by professional speculators since the financial crisis.”
Per Goldman Sachs Group Inc (NYSE: GS) prime broker data, the sale of highly valued growth stocks reached levels not seen in more than 10 years. Selling worsened after minutes to the Federal Reserve’s last policy meeting pointed to faster hikes and balance sheet normalization.
As higher rates are to fend off inflation, they, too, have the potential to decrease the present value of future earnings making stocks (especially high growth) less attractive.
“A strong [payrolls] print will see the market factor in hikes/quantitative tightening even earlier,” strategists at Mizuho International Plc said. “We’d therefore prefer to be positioned for more equity downside, and for higher yields.”
Fresh in my mind is a conversation I had with Karan Sood, CEO and Managing Director, Head of Product Development at Cboe Vest Financial LLC, regarding his firm’s packaged options and volatility targeting strategies that help investors manage their portfolio volatility.
Moreover, over the past 40 or so years, monetary policy was used as a crutch to support the economy. This promoted deflation, innovation, and the subsequent rise in valuations.
“Bonds have been giving you really good returns because interest rates have been going down since the 1970s when they peaked at about 11%,” Sood explained to me.
“That’s changing now; we’re at the zero bound, and it’s unlikely that will be as a strong of a tailwind. Worse, it could be a headwind if interest rates start to rise.”
As a result of this dynamic, coupled with participants’ increased exposure to rate and equity market risk which can play into cross-market hedging and de-leveraging cascades, 60/40 can be somewhat of a poor hedge.
“Now, with the Fed poised to hike interest rates to combat raging inflation, the bond-stock relationship could be upended,” Bloomberg explains.
“At stake are trillions of dollars that are managed at risk parity funds, balanced mutual funds, and pension funds that follow the framework of 60/40 asset allocation.”
Graphic: Via Bloomberg.
Why mention any of this? Well, it forces us to look elsewhere for protection.
In this case, the growing asset class of volatility, so to speak, is that protection. Investors are aware of both the protective and speculative efficiency afforded to them by options and that is the primary reason option volumes are so comparable to stock volumes, now.
Notwithstanding, with option volumes higher, related hedging flows can represent an increased share of volume in underlying stocks. Therefore, the correlation of stock moves, versus options activity, is more pronounced.
To put it simply, we can look to the options market for clues on where to next, for lack of better phrasing. So, let’s do that!
Wednesday’s session unwound some of the single-stock bullishness (in stocks like Tesla) that fed into the S&P 500, itself; an expansion in volatility coincided with the demand for downside (put) protection and supply of upside (call) protection.
Conditions settled, Thursday. Though positioning metrics had little to offer in terms of predicting movement, implied volatility remained heightened and many products did not expand range.
All else equal, higher implied volatility marks up options delta (exposure to direction).
Knowing that demand for downside protection coincides with customers indirectly taking liquidity and destabilizing the market as the participant short the put will sell underlying to neutralize risk, participants ought to keep their eye out on whether implied volatility expands or contracts.
Graphic: SqueezeMetrics details the implications of customer activity in the options market, on the underlying’s order book.
Higher implied volatility, higher delta, more selling. Hedging pressures will exacerbate weakness, as a result of real selling (as talked about above), at the index and single-stock level.
Graphic: The “Biggest tail risk to SPX isn’t any macro data/virus/war but its own options market.”
Taking into account options positioning, versus buying pressure (measured via short sales or liquidity provision on the market-making side), positioning metrics remain positively skewed, even more so than before.
Graphic: Data SqueezeMetrics. Graph via Physik Invest.
As stated yesterday, though the dip lower and demand for protection may serve to prime the market for upside (when volatility starts to compress again and counterparties unwind hedges thus supporting any attempt higher), markets will tend toward instability so long as volatility is heightened and the market remains in short-gamma territory.
Technical: As of 6:30 AM ET, Friday’s regular session (9:30 AM – 4:00 PM ET), in the S&P 500, will likely open in the middle part of a balanced overnight inventory, inside of prior-range and -value, suggesting a limited potential for immediate directional opportunity.
Spike Scenario In Play: Spike’s mark the beginning of a break from value. Spikes higher (lower) are validated by trade at or above (below) the spike base (i.e., the origin of the spike).

Spike base is at $4,761.25. Above, bullish. Below, bearish.
In the best case, the S&P 500 trades higher; activity above the $4,691.25 micro composite point of control (MCPOC) puts in play the $4,717.25 low volume area (LVNode). Initiative trade beyond the LVNode could reach as high as the $4,732.50 high volume area (HVNode) and $4,756.00 LVNode, or higher.
In the worst case, the S&P 500 trades lower; activity below the $4,691.25 MCPOC puts in play the $4,674.25 HVNode. Initiative trade beyond the latter could reach as low as the $4,647.25 and $4,629.25 HVNode, or lower.
Click here to load today’s key levels into the web-based TradingView charting platform. Note that all levels are derived using the 65-minute timeframe. New links are produced, daily.
Graphic: 65-minute profile chart of the Micro E-mini S&P 500 Futures.
What People Are Saying
Summary of near term outlook 1. Economic growth expectations are rising 2. High CPI print is discounted 3. Earnings will slay 4. Actual real drivers of risk premiums are supportive 5. Covid will peak or has 6. Options influence supportive Today 🥁 of QT is opportunity Net BTFD
Please find the results of my interview with the options flow master @bennpeifert for Top Traders Unplugged below. Thanks Benn! 06 Volatility Series: Finding True Value in the World of Volatility ft. Benn Eifert — January 5th, 2021 – Top Traders Unplugged https://t.co/8aNJjhBcTJ
Volume Areas: A structurally sound market will build on areas of high volume (HVNodes). Should the market trend for long periods of time, it will lack sound structure, identified as low volume areas (LVNodes). LVNodes denote directional conviction and ought to offer support on any test.
If participants were to auction and find acceptance into areas of prior low volume (LVNodes), then future discovery ought to be volatile and quick as participants look to HVNodes for favorable entry or exit.
DIX: For every buyer is a seller (usually a market maker). Using DIX — which is derived from short sales (i.e., liquidity provision on the market-making side) — we can measure buying pressure.
Gamma: Gamma is the sensitivity of an option to changes in the underlying price. Dealers that take the other side of options trades hedge their exposure to risk by buying and selling the underlying. When dealers are short-gamma, they hedge by buying into strength and selling into weakness. When dealers are long-gamma, they hedge by selling into strength and buying into weakness. The former exacerbates volatility. The latter calms volatility.
Vanna: The rate at which the delta of an option changes with respect to volatility.
Charm: The rate at which the delta of an option changes with respect to time.
Options: If an option buyer was short (long) stock, he or she would buy a call (put) to hedge upside (downside) exposure. Option buyers can also use options as an efficient way to gain directional exposure.
POCs: POCs are valuable as they denote areas where two-sided trade was most prevalent in a prior day session. Participants will respond to future tests of value as they offer favorable entry and exit.
MCPOCs: POCs are valuable as they denote areas where two-sided trade was most prevalent over numerous day sessions. Participants will respond to future tests of value as they offer favorable entry and exit.
About
After years of self-education, strategy development, mentorship, and trial-and-error, Renato Leonard Capelj began trading full-time and founded Physik Invest to detail his methods, research, and performance in the markets.
Capelj is also a Benzinga finance and technology reporter interviewing the likes of Shark Tank’s Kevin O’Leary, JC2 Ventures’ John Chambers, FTX’s Sam Bankman-Fried, and ARK Invest’s Catherine Wood, as well as a SpotGamma contributor developing insights around impactful options market dynamics.
Disclaimer
Physik Invest does not carry the right to provide advice.
In no way should the materials herein be construed as advice. Derivatives carry a substantial risk of loss. All content is for informational purposes only.