Photo: By Alan Stoddard. Taken on January 11,2018.
Hey, all! I hope you had a great weekend. Today, we dive into what’s driving markets and what the near future may look like. On Monday, we will do deeper dives like this. Friday, we’ll try for recaps. Trade ideas are coming soon via monthly research, which will look similar to this linked document.
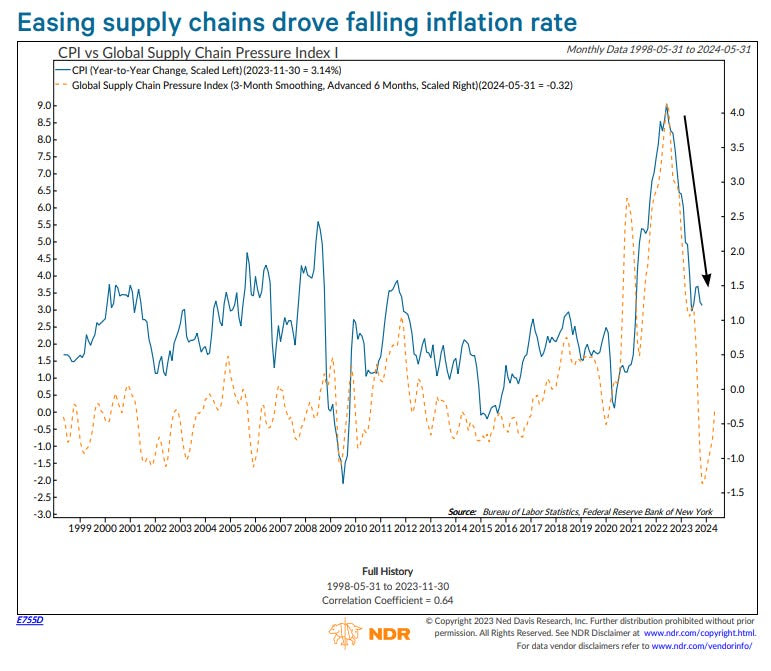
Market momentum slowed with bumps in economic and inflation data last week, yet the trend of economic resilience and declining inflation persists. Anticipation looms over a potential shift in the Federal Reserve’s approach, with traders awaiting Tuesday for insights from Governor Christopher Waller regarding the possibility of a decrease in interest rates.
CrossBorder Capital remarks the economy may avoid recession, attributing this to economic measures adjusted for distortion—an increase in adjusted yields points to a mild recovery in business activity later in the year.
Graphic: Retrieved from CrossBorder Capital. Based on the mortgage curve, they calculate a 10-year Treasury yield 110 basis points higher. A steeper curve implies easier monetary conditions.
Former open markets trader Joseph Wang maintains cautious optimism, foreseeing cuts, albeit less aggressive than the market prices. However, Cem Karsan from Kai Volatility suggests that if anticipated stock struggles and declines reach 10% or more, more decisive, politically motivated actions may be taken ahead of the election.
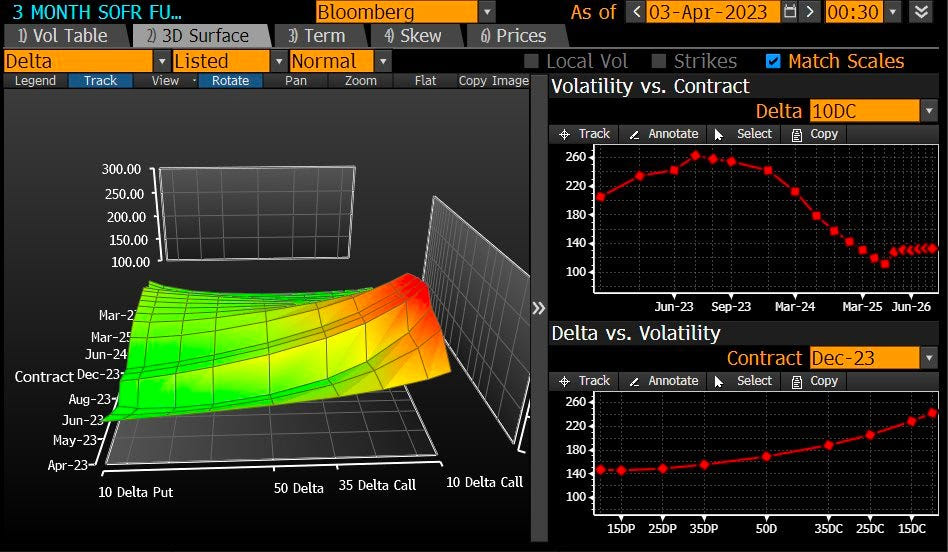
Graphic: Retrieved from Bloomberg via Joseph Wang. The SOFR term structure provides insights into the market’s expectations for short-term interest rates over various time horizons.
In any case, injecting money into a healthy economy is bullish. That being so, Goldman Sachs foresees the S&P 500 reaching 4,950 to 5,050 by 2025. Wang, emphasizing the potential benefits of both monetary and fiscal stimulus, notes deficit spending ultimately triggers an increase in both yields and risk assets like stocks.
Cryptocurrencies may also benefit, with some anticipating the approval of a bitcoin exchange-traded fund to invigorate a bullish trend akin to the impact of State Street’s Gold Trust on the gold market. However, not all share this optimism, including Tom McClellan, who parallels a situation in 1974 when investors bid up gold prices in anticipation of Americans regaining the right to own gold, only to witness a decline of 41% in prices by August 1976.
Whether higher rates persist or not, specific forces are at play that are unlikely to destabilize the market markedly. Elevated rates give rise to an increased demand for what is termed “one-sided and risky positioning,” elongating the market cycle and reducing short-term volatility through mechanical interventions. This artificial stability sends misleading signals, fostering even more interest in this type of trading. Karsan aptly dubs it the “sumomarket,” echoing Amy Wu Silverman of RBC Capital Markets’ insight that such strategies aren’t indefinite and may sour.
We hedge when we can, not when we must! Traditional reliance on bonds falls short in a landscape where correlations have transformed. During the subdued realized and implied volatility, traders protect against pullbacks, particularly during or after the earnings season, by buying Cboe VIX call options.
In the realm of alternatives, the choice depends on your timeframe and view on price trajectories. We gave explanations last year, revealing options like allocating principal to less risky assets such as box spreads utilized as collateral for margin-intensive trades. For those eyeing the short-term downside, ultra-wide butterflies—equidistant or slightly broken—emerge as a consideration. Contrastingly, if it were 2022, cheaper ratio spreads would be preferred due to the subdued tendencies of implied volatility. However, with “over-positioning into short volatility,” that may no longer be the case.
Photo: By Glenn Halog. Taken on September 17, 2012.
Hey, all! I hope you had a great weekend. We’re sticking to our promise, as shared on Substack. Today, we dive into what’s driving markets and what the near future may look like. Generally speaking, on Monday, we will do deeper dives like this. Friday, we will do recaps. Trade ideas are coming soon via monthly research, which will look similar to this linked document.
That’s a take hot enough to grab your attention, isn’t it? We digress. It’s been a couple of years since central banks began tightening. With it being this late in the economic cycle, the effects of contractionary monetary policy should be felt, right? Well, not as you imagined heading into last year. The economy is strong, and inflation was better managed than anticipated.
Is it that the economy is less sensitive to monetary policy? Citadel’s Kenneth Griffin states that monetary tightening struggles to offset fiscal stimulus. Jerome Powell, Chair of the Federal Reserve, has had his mission to engineer a soft landing complicated. “Whether it is the Inflation Reduction Act or other programs that have increased spending, we keep stimulating the economy out of DC.”
Graphic: Retrieved from Global Financial Data via Meb Faber Research.
That’s the outlook envisioned by some, including Cem Karsan of Kai Volatility. In his analysis, this policy divergence traces back to the era of easy money spanning decades—instances like the Federal Reserve buying long-term bonds, reducing their yields, and steering investors towards riskier assets. A “growth engine” resulted, as Karsan describes it, driving innovation and globalization, accompanied by low inflation and occasional deflation.
The bulk of the stimulus predominantly benefiting the top echelons—corporations focused on profit generation through cost-cutting and expanding market share—contributed to a widening gap between the privileged and the less privileged (i.e., the wealth effect and labor competing globally with other labor and technology). If the current emphasis is on populist fiscal measures (such as increasing the velocity of money by directly injecting funds into the hands of the public and, consequently, into the economy) to address inequality and enhance the average person’s spending capacity, this could be the catalyst for sparking inflation and the potential for elevated yields for years to come.
Photo: By Glenn Halog. Taken on September 17, 2012. View on Flickr here.
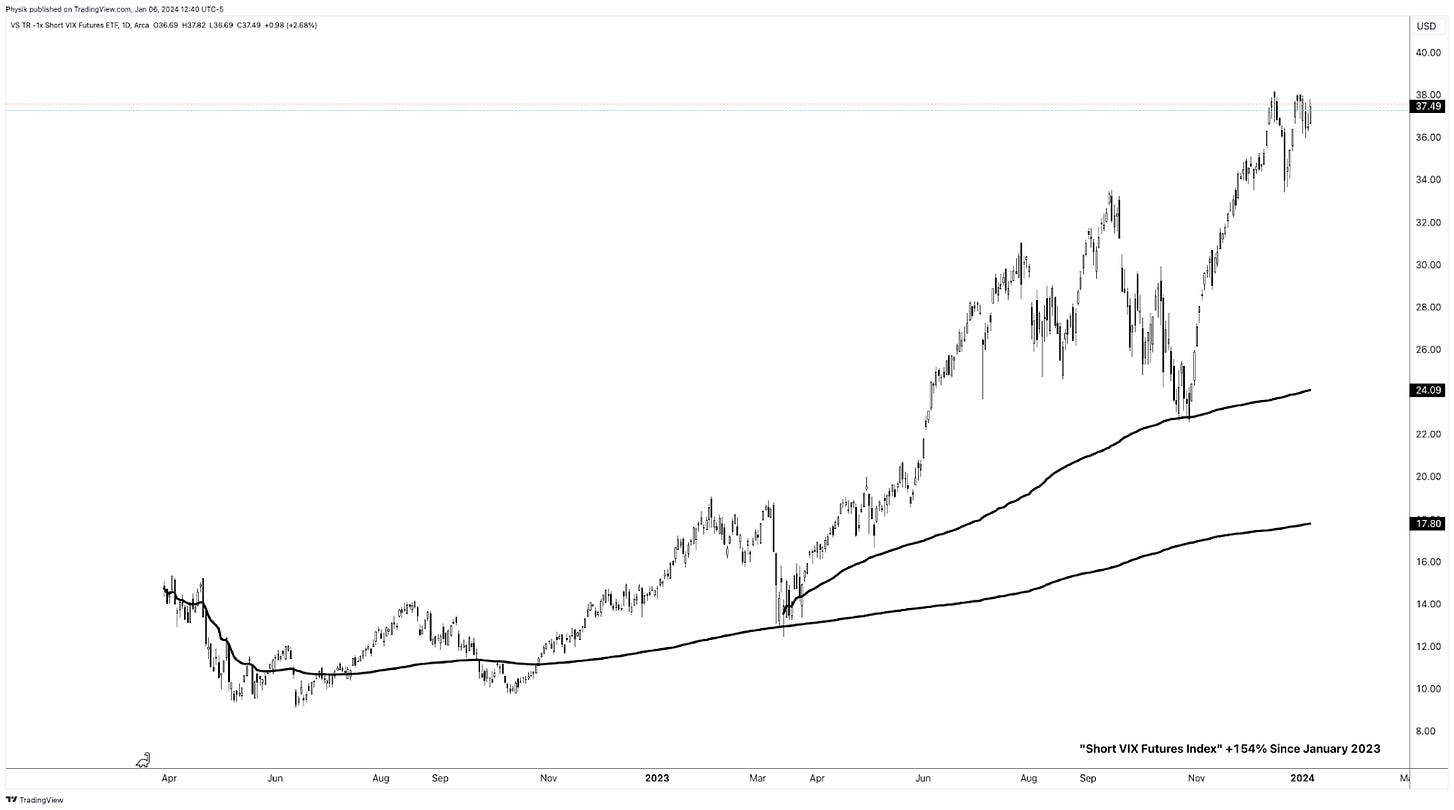
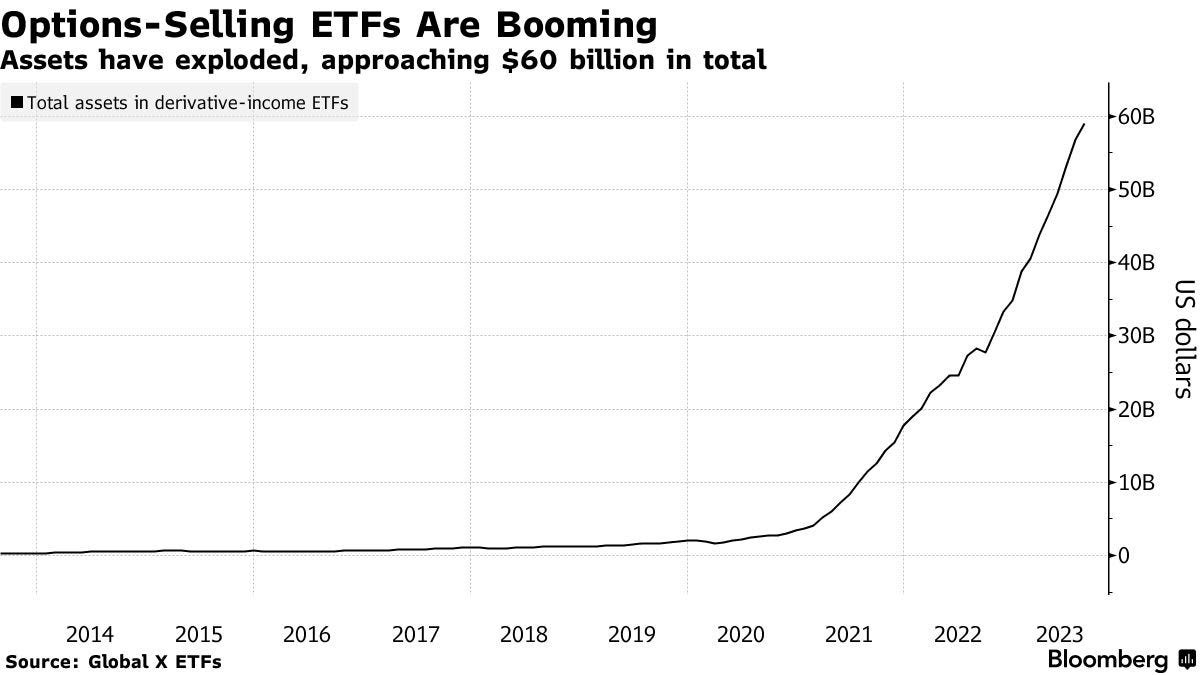
It’s a new era, and as Karsan points out, the tail is getting thicker, indicating a shift towards one-sided and risky positioning. Why is that so? Individuals are hedging the above realities, turning to Treasuries (used as collateral) and short equity options or volatility (the all-encompassing term) to enhance returns.
Graphic: Retrieved from TradingView. Pictured is the short VIX Futures ETF.
“If you remember 2017, right before we got into Volmageddon in February 2018, the volatility environment smelled similar to right now,” Amy Wu Silverman, head of derivatives strategy at RBC Capital Markets, shared with Bloomberg. “It works until it doesn’t.”
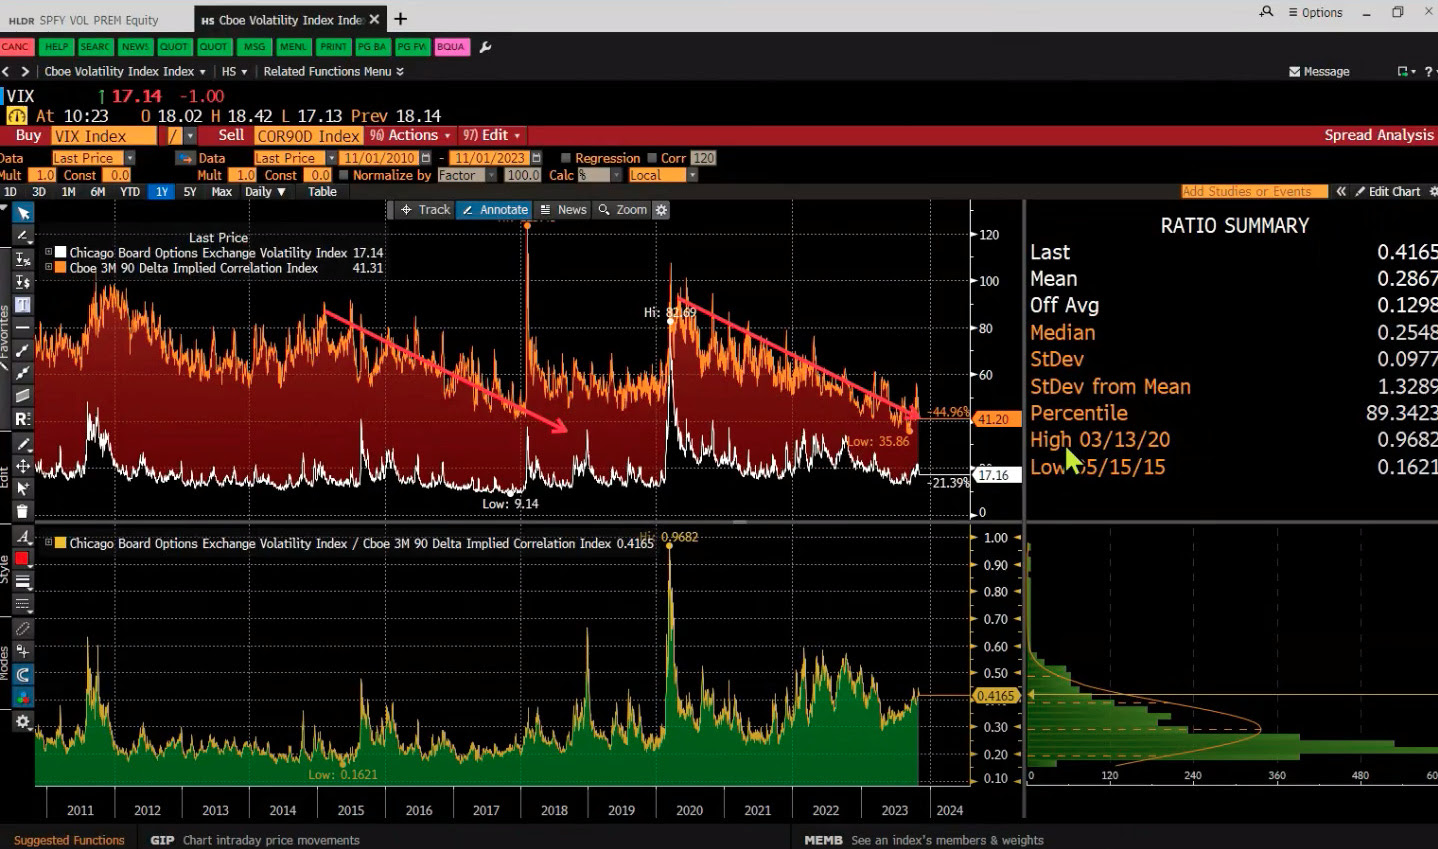
Graphic: Retrieved from Bloomberg via Simplify Asset Management’s Michael Green. Implied correlation for a 90 Delta call or 10 Delta put. Given the current volatility level, the implied correlation is lower than expected, indicating potential market vulnerability or “deeply unhealthy” conditions.
Kris Sidial from The Ambrus Group explains highly responsive spot-vol beta results. For example, we see quick fluctuations in volatility measures like the Cboe’s Volatility Index or VIX. He adds it’s a crowding of the dispersion trade, where participants shift from underperforming longer-dated options to shorter-dated ones for purposes like hedging, directional trading, and yield enhancement. This activity supports and stabilizes the indexes while the individual components underneath occasionally fluctuate pretty drastically. The only way to reconcile these fluctuations is through a decrease in correlation.
This environment is reminiscent of the 1999 to 2000 period, mentioned by Michael Green from Simplify Asset Management during a pre-event call for a Benzinga appearance. Despite the costliness of growth stocks in the late nineties, they still managed to double and triple.
In this scenario, the go-to trade of stocks and bonds (e.g., 60/40) may be less effective. Instead, at least over the short term, one could own long-term call options while selling stocks. Why? Karsan says that volatility “pinning leads to a momentum factor” that sustains itself. As yields rise, more liquidity flows into alternatives like structured products. With index volatility subdued and at a lower limit, positive flows persist until more significant market trends take over.
Graphic: Retrieved from Danny Kirsch of Piper Sandler. On December 18, the S&P 500’s price and SPX’s $4,800 strike option volatility were up.
Looking ahead to 2024, Fabian Wintersberger predicts a higher stock market, dismissing concerns of a second wave of inflation in 2024. The changes in the money supply typically impact the broader economy with an 18-month lag, implying projected rate cuts in 2024 may not affect inflation until 2025 or 2026.
“It seems that the Fed’s and the ECB’s projections are too high, and inflation might turn into deflation in the second half of 2024.” Otherwise, we’re likely in the seventh or eighth inning because higher real yields are starting to come through the economy, Griffin states, noting the Federal Reserve will likely make it clear they will get near a 2% rate in time, stabilizing as best they can employment and prices.
Graphic: Retrieved from Bloomberg. A recent quarterly refunding announcement spurred a rally in bonds and equities. Generally, a weak dollar and lower rates ease financial conditions. That’s good for stocks.
“[Jerome Powell] had a horrible hand to play. We’ve had the pandemic supply chain shocks and massive fiscal stimulus. And he’s supposed to try to achieve price stability. That’s a no-win scenario.”
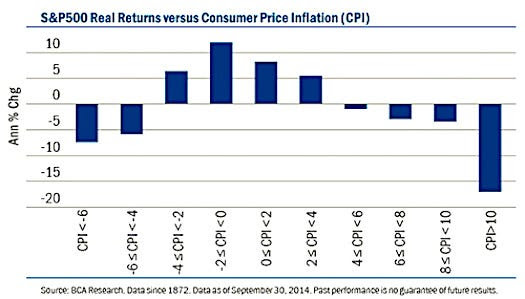
Graphic: Retrieved from BCA Research.
As interest rates decline, the discussed structured product trades and dispersion flows might slow or reverse. The question arises: will the diminishing volatility supply compound challenges arising from weakened macro liquidity, potentially outweighing the anticipated benefits of interest rate cuts and stimulative fiscal measures? We’re working on unraveling this.
While euphoria seems scarce and fragility is not prominently signaled, as Sidial points out, the telltale signs will come as an “explosion” of convexity in the 3-, 5-, and 7-day terms of the volatility structure, as noted by Karsan. Until these signs emerge, former open markets desk trader Joseph Wang suggests cautious optimism, advocating for bullishness amid digestion in terms of time or price.
Graphic: “The market averages three 5% corrections a year,” explains Jay Woods of Freedom Capital Markets, who foresees a touch of ~$4,600 in the S&P 500 ($460 SPY) as a likely scenario. “It isn’t abnormal.”
Welcome to the Daily Brief by Physik Invest, a soon-to-launch research, consulting, trading, and asset management solutions provider. Learn about our origin story here, and consider subscribing for daily updates on the critical contexts that could lend to future market movement. Take care, and let’s dig in.
Markets are mixed with equities under light pressure following OPEC+’s surprise oil production cut. It’s likely that Saudi Arabia “realized they were getting played [on the Strategic Petroleum Reserve refill] and took matters into their own hands,” some say.
As a recap, on Friday, measures of inflation abated. Though these measures remain high and support the context for rates to stay high, markets responded positively.
Expectations of interest rate cuts have been pulled forward based on markets like SOFR, correlated to existing money market rates, where traders’ demand for call options (i.e., bet on rates falling) reveals the fear of a heavy rate-cutting cycle.
Graphic: Retrieved from Bloomberg via @countdraghula.
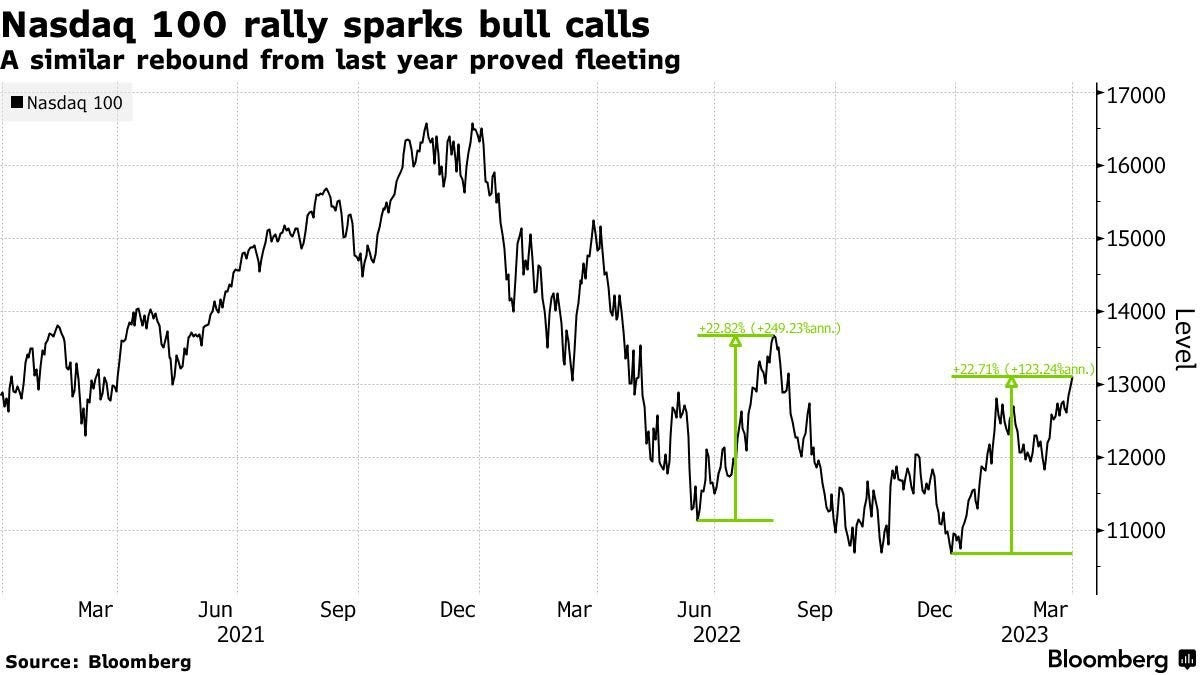
The S&P 500 (INDEX: SPX) closed above $4,100.00 for the first time in months. Many quickly wrote about new bull markets blooming in previously depressed market areas most sensitive to monetary policymakers’ policymaking.
Recall, however, that during the dot-com bust, the Nasdaq 100 (INDEX: NDX) rallied ~20% numerous times before an actual bull market was born. Experts think the same thing is happening; the rally, partly driven by monetary policy expectations and the removal/monetization of downside protection, particularly in markets where traders were most concerned about a de-rate and volatility, is probably in its later stages.
The marginal benefit of any further volatility compression is far less than the cost one may incur by volatility expanding; “there isn’t much juice left to squeeze,” SpotGamma adds, and though short-biased volatility trades (e.g., sell options) could work for a bit longer, the risks remain, as explained on Friday. Rolling profits from the initially low- or no-cost call options structures we discussed last week into fixed-risk debit equity put options structures seem attractive. More to come. Hope you liked the new format!
Disclaimer
Please don’t use this free letter as advice; all content is for informational purposes, and derivatives carry a substantial risk of loss. At this time, Capelj and Physik Invest, non-professional advisors, will never solicit others for capital or collect fees and disbursements. Separately, you may view this letter’s content calendar at this link.
Physik Invest’s Daily Brief is read free by thousands of subscribers. Join this community to learn about the fundamental and technical drivers of markets.
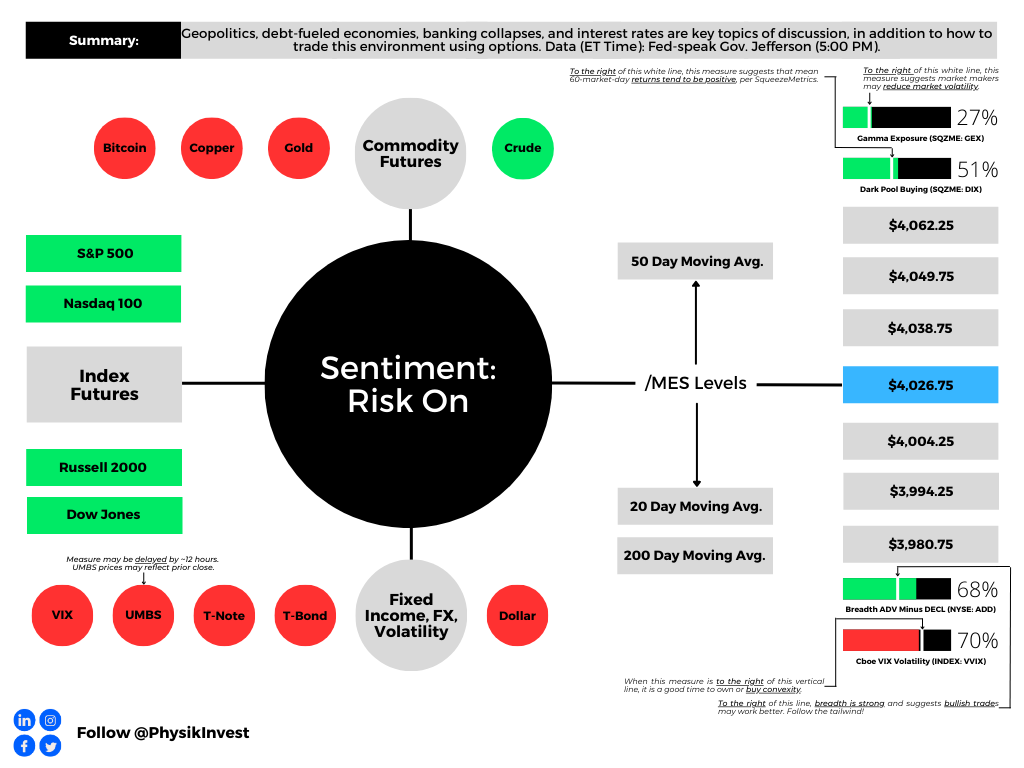
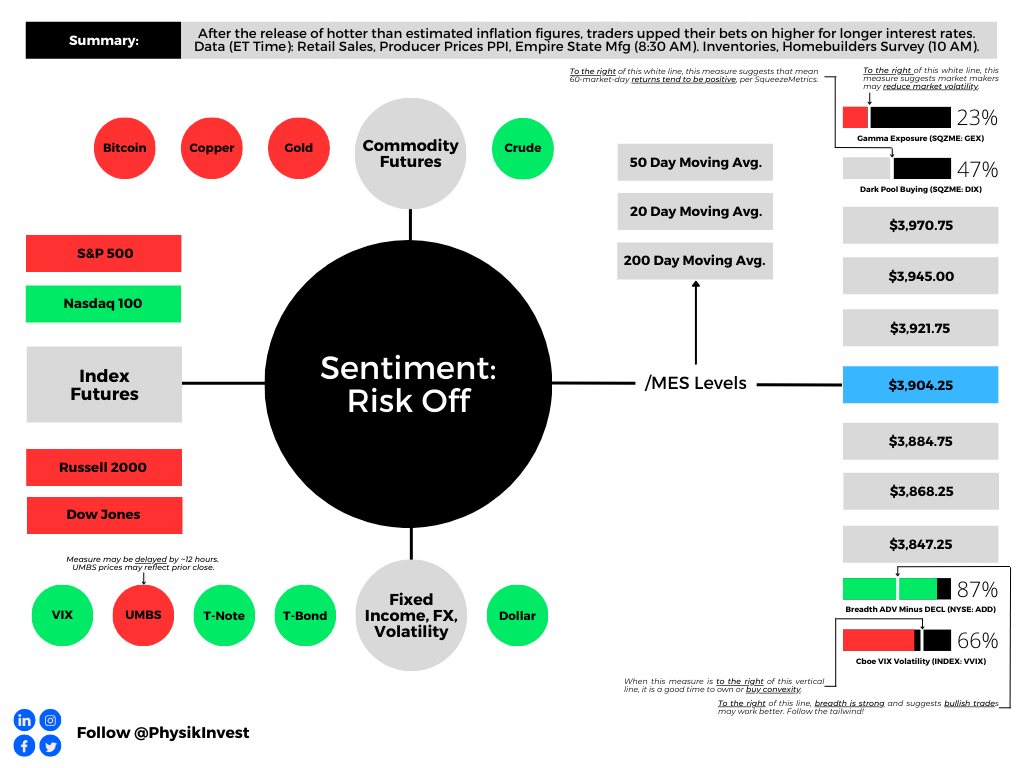
Graphic updated 9:10 AM ET. Sentiment Risk-On if expected /MES open is above the prior day’s range. /MES levels are derived from the profile graphic at the bottom of this letter. Click here for the latest levels. SqueezeMetrics Dark Pool Index (DIX) and Gamma (GEX) with the latter calculated based on where the prior day’s reading falls with respect to the MAX and MIN of all occurrences available. A higher DIX is bullish. The lower the GEX, the more (expected) volatility. Click to learn the implications of volatility, direction, and moneyness. Breadth reflects a reading of the prior day’s NYSE Advance/Decline indicator. The CBOE VIX Volatility Index (INDEX: VVIX) reflects the attractiveness of owning volatility. UMBS prices via MND. Click here for the economic calendar.
Administrative
Sorry for the delay. Please read through the positioning section. Have a great Monday!
As always, if there are holes or unclear language. We will fix this in the next letters.
Fundamental
On 3/22, we mentioned news of Russia wanting to adopt the yuan for settlements.
Putin: We are in favor of using the Chinese yuan for settlements between Russia and the countries of Asia, Africa, and Latin America. I am confident that these forms of settlement in yuan will develop between Russian partners and their counterparts in third countries. pic.twitter.com/Mnw1WfjW4Y
And, with that, publications covering these East alliances use some tough language. One Bloomberg article notes China and Russia “roll[ing] back US power and alliances … [to] create a multipolar world … [and] diminish the reach of democratic values, so autocratic forms of government are secure and even supreme.”
Let’s rewind a bit to understand why all the toughness and fear.
If the US dollar's global supremacy erodes, America will face a reckoning like none before.
Recall Chinese President Xi Jinping speaking with Saudi and GCC leaders. Here is our 1/4 summary takeaway:
Graphic: Retrieved from Physik Invest’s Daily Brief for January 4, 2023.
Essentially, those remarks confirm the East is hedging sanctions risk. Reliance on the West is falling, and this inevitably will present “non-linear shocks” (i.e., “inflation mess caused by geopolitics, resource nationalism, and BRICS”) monetary policymakers are not equipped to handle. So, are the markets at risk?
President Xi to President Putin:
“Change that hasn’t happened in 100 years is coming and we are driving this change together.”
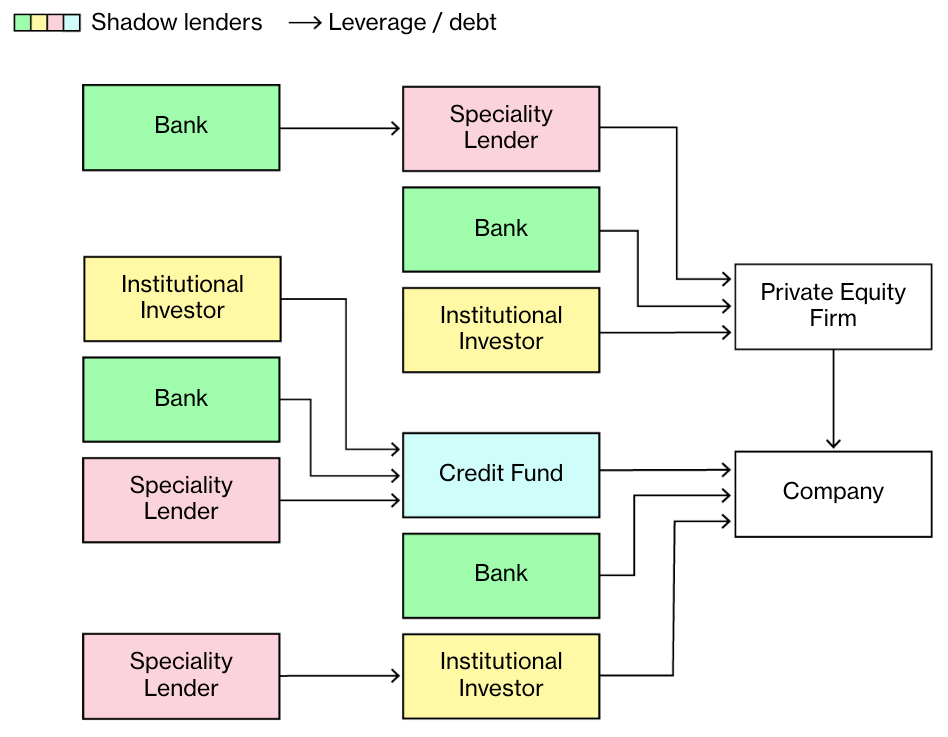
This most recent meeting between China and Russia increases the risks of unwinding the “debt-fueled economy in the US,” FT’s Rana Foroohar confirms, as we wrote in the Daily Brief for 1/4. Further, this is a threat to “hidden leverage and opaqueness.” That means the markets are at risk. Let’s explain more.
With the encumbrance of commodities, among other initiatives, these nations’ weight in currency baskets may rise and keep “inflation from slowing.” If that happens, future rate expectations are off. Additionally, “the US dollar and Treasury securities will likely be dealing with issues they never had to deal with before: less demand, not more; more competition, not less,” we quoted Zoltan Pozsar (ex-Credit Suisse) saying on 1/5.
The markets most responsive to this are public, as we saw with 2022’s de-rate. In 2023 and beyond, added liquidation-type risks lie in the private markets. This will have knock-on effects.
The likes of The Ambrus Group’s Kris Sidial mentioned to your newsletter writer in a Benzinga interview that private market investors’ raising of cash to meet capital calls could prompt sales of their more liquid public market holdings. This is a major risk Sidial noted he was watching, in addition to some risks in the derivatives markets.
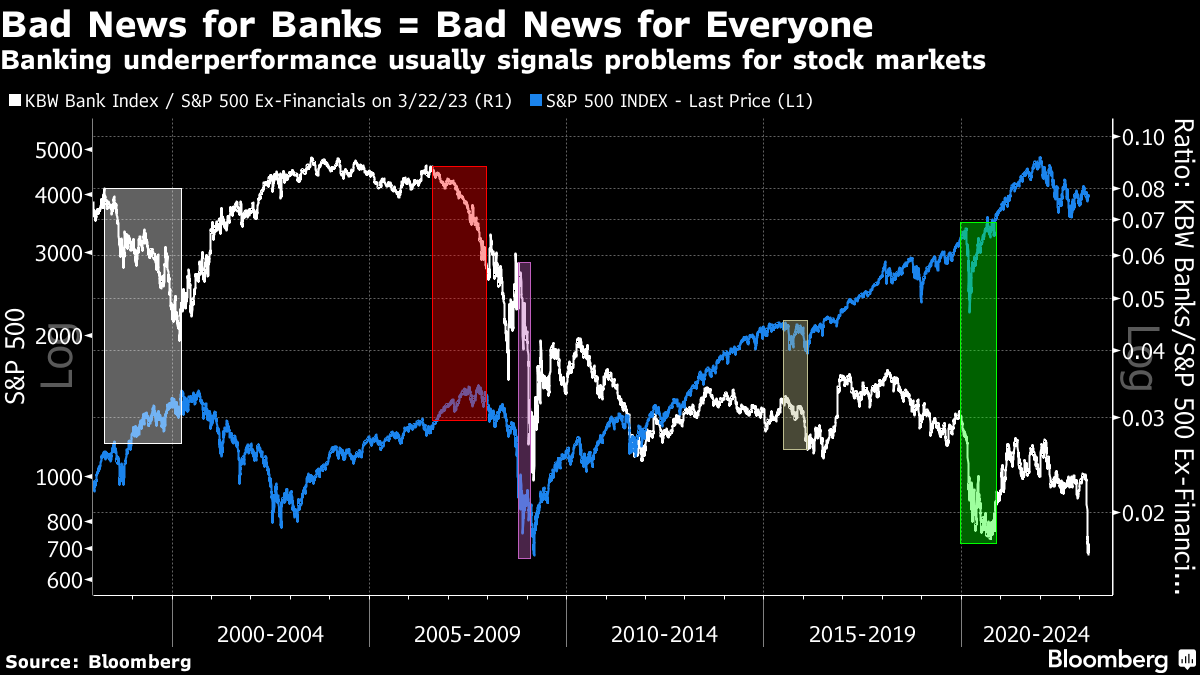
At the same time, Eric Basmajian believes the “banking crisis will cause a tightening of money and credit.” This will further solidify the “broader business cycle and corporate profit recession.”
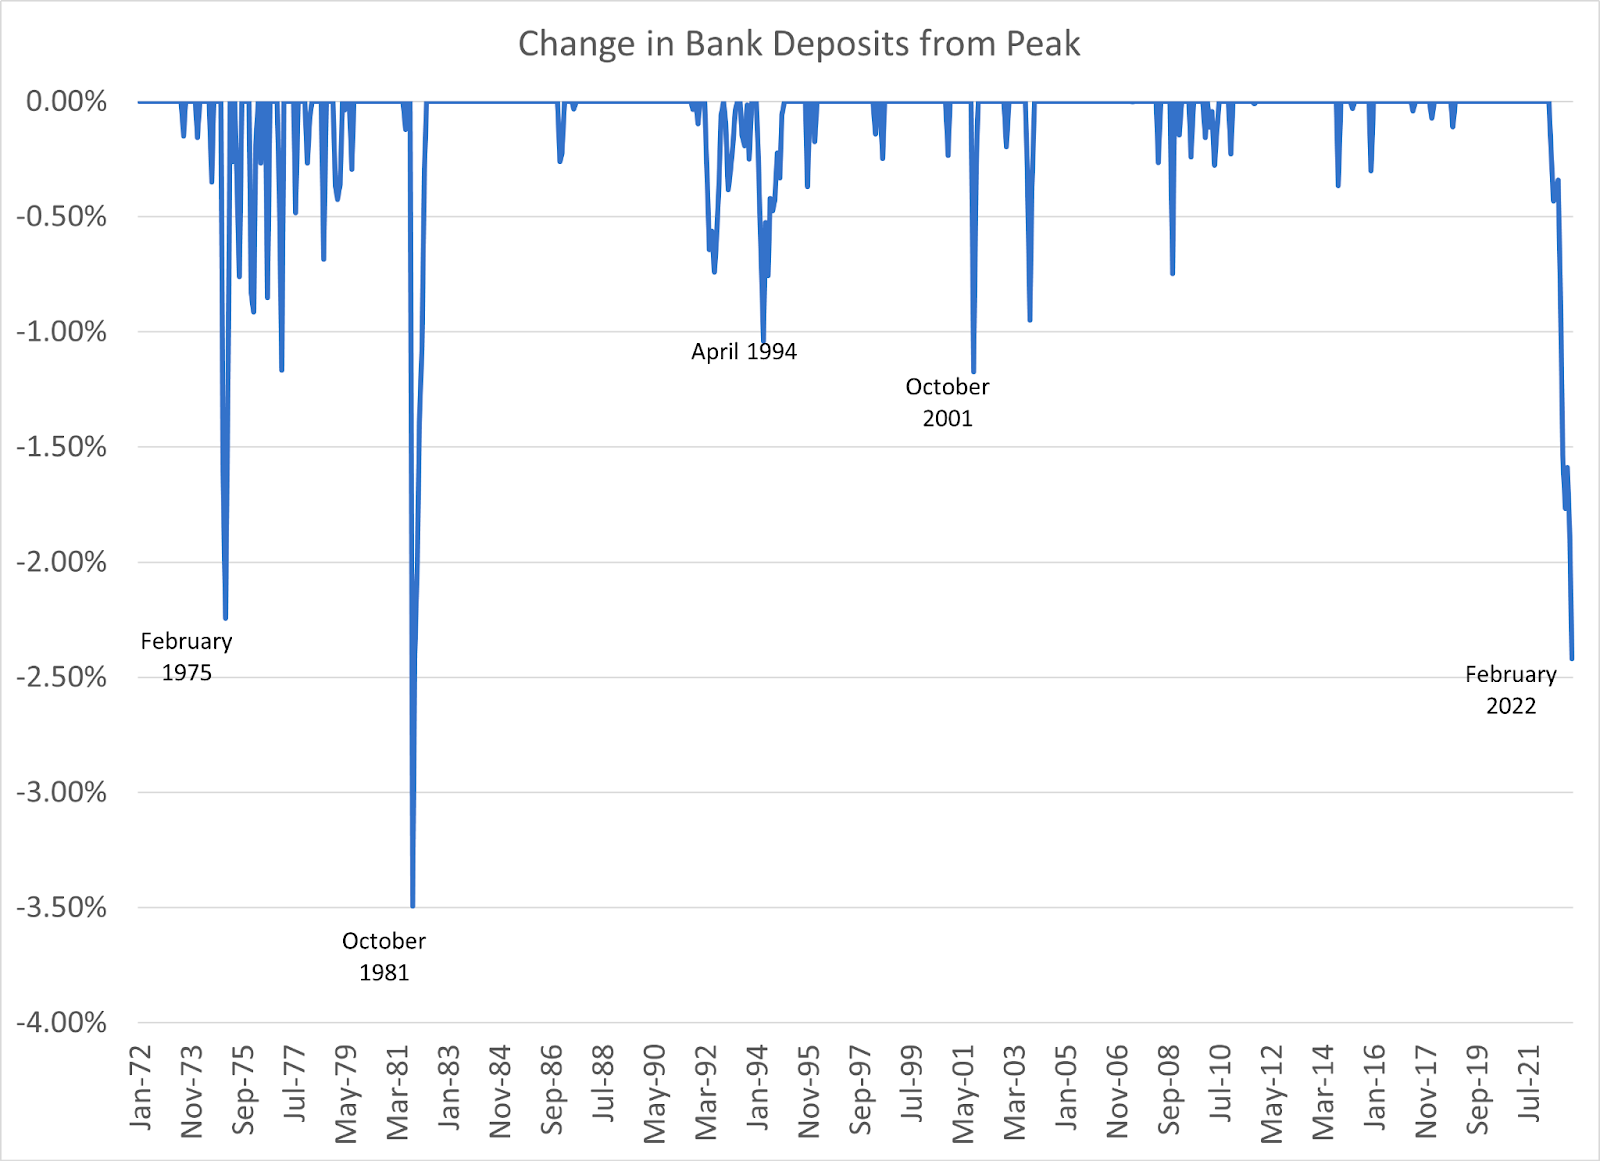
Graphic: Retrieved from Bloomberg. Per John Authers, “the combination of deeply troubled banks and strong performance for the rest of the stock market cannot persist much longer.”
Positioning
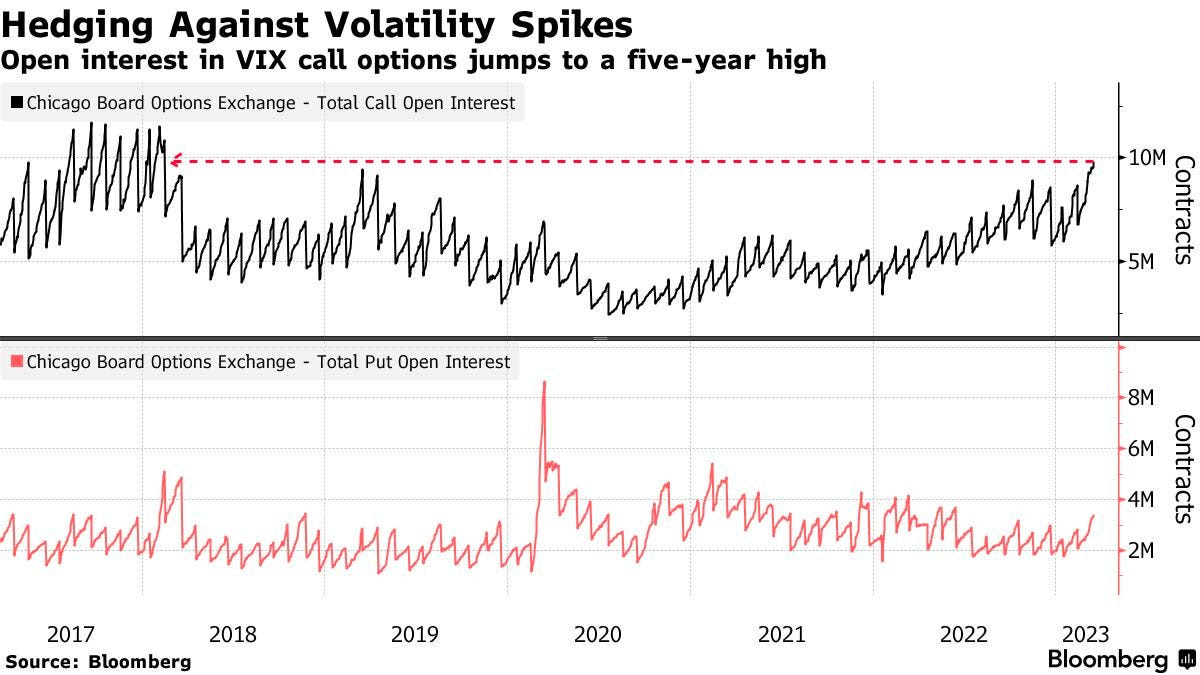
Sidial’s well positioned to take advantage of the realization of these risks. In January, he explained that measures like the Cboe VIX Volatility Index (INDEX: VVIX) were low. This suggested, “we can get cheap exposure to convexity while a lot of people are worried.” In an update to Bloomberg, Sidial said The Ambrus Group’s tail-risk strategy (which Sidial has explained to us before) has performed well as the VIX index has risen, a sign of traders hedging concerns about “some contagion hitting and their portfolios being destroyed on that.”
“We have seen an increase in tail hedging,” added Chris Murphy of Susquehanna International Group. “We have continued to see call buying in the VIX since the bank turmoil began.” The caveat, though, is that realized volatility or RVOL, not just implied volatility or IVOL (i.e., that which is implied by traders’ supply and demand of options), must shift and stay higher for those options to maintain their values, which may be difficult according to Kai Volatility’s Cem Karsan.
Though Karsan thinks markets will likely see RVOL come back in a big way, he thinks policymakers’ intervention will be stimulative short-term as it reverses a lot of the quantitative tightening or QT (i.e., flow of capital out of capital markets). Stimulation will be compounded by the continued unwinding of hedging strategies in previously depressed products like the Nasdaq 100 (INDEX: NDX). What do we mean by this?
Recall that traders’ closure and/or monetization of put protection results in options counterparties buying back their short stock and/or futures hedges. Therefore, before any downside is realized, the market may trade into a far “more combustible” position.
Consequently, look for low- and zero-cost call structures (e.g., ratio spreads) to play the upside while opportunistically using higher prices and elevated volatility skew to put on bear put spreads (i.e., buy put and sell another put at a lower strike price) for cheaper prices.
Consider following and supporting us on social media:
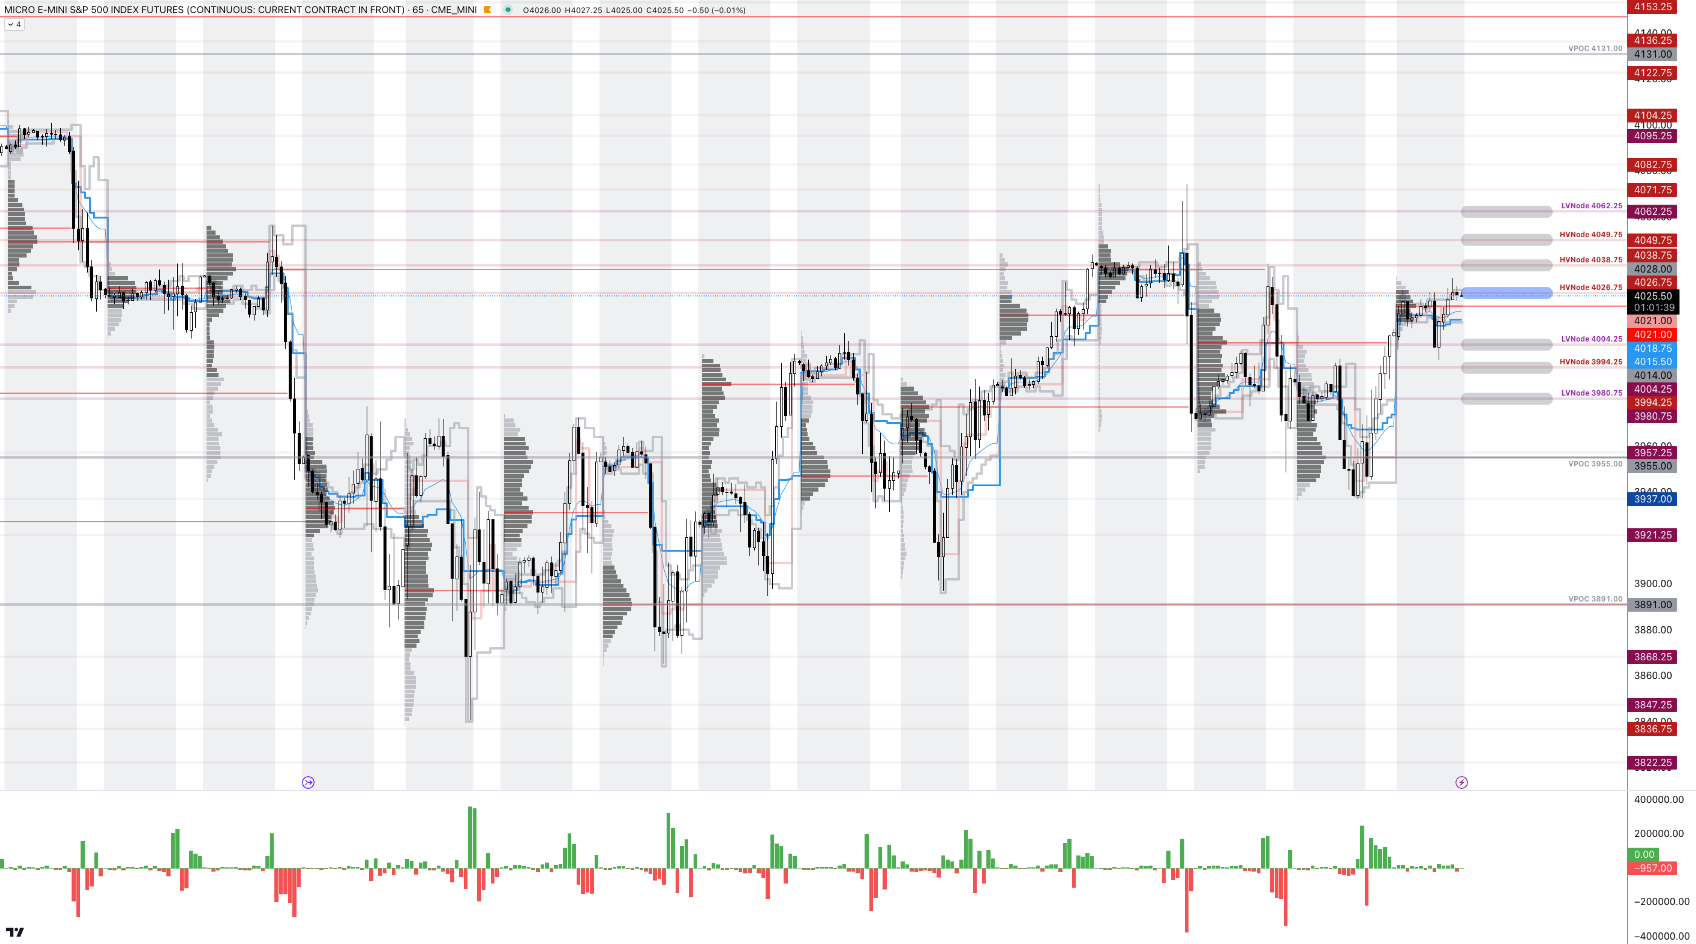
As of 9:10 AM ET, Monday’s regular session (9:30 AM – 4:00 PM ET), in the S&P 500, is likely to open in the upper part of a positively skewed overnight inventory, outside of the prior day’s range, suggesting a potential for immediate directional opportunity.
The S&P 500 pivot for today is $4,026.75.
Key levels to the upside include $4,038.75, $4,049.75, and $4,062.25.
Key levels to the downside include $4,004.25, $3,994.25, and $3,980.75.
Disclaimer: Click here to load the updated key levels via the web-based TradingView platform. New links are produced daily. Quoted levels likely hold barring an exogenous development.
Graphic: 65-minute profile chart of the Micro E-mini S&P 500 Futures.
Definitions
Volume Areas: Markets will build on areas of high-volume (HVNodes). Should the market trend for some time, this will be identified by a low-volume area (LVNodes). The LVNodes denote directional conviction and ought to offer support on any test.
If participants auction and find acceptance in an area of a prior LVNode, then future discovery ought to be volatile and quick as participants look to the nearest HVNodes for more favorable entry or exit.
About
The author, Renato Leonard Capelj, spends the bulk of his time at Physik Invest, an entity through which he invests and publishes free daily analyses to thousands of subscribers. The analyses offer him and his subscribers a way to stay on the right side of the market.
You may view this letter’s content calendar at this link.
Disclaimer
Do not construe this newsletter as advice. All content is for informational purposes. Capelj and Physik Invest manage their own capital and will not solicit others for it.
Physik Invest’s Daily Brief is read free by thousands of subscribers. Join this community to learn about the fundamental and technical drivers of markets.
Graphic updated 6:15 AM ET. Sentiment Risk-Off if expected /MES open is below the prior day’s range. /MES levels are derived from the profile graphic at the bottom of this letter. Click here for the latest levels. SqueezeMetrics Dark Pool Index (DIX) and Gamma (GEX) with the latter calculated based on where the prior day’s reading falls with respect to the MAX and MIN of all occurrences available. A higher DIX is bullish. The lower the GEX, the more (expected) volatility. Click to learn the implications of volatility, direction, and moneyness. Breadth reflects a reading of the prior day’s NYSE Advance/Decline indicator. The CBOE VIX Volatility Index (INDEX: VVIX) reflects the attractiveness of owning volatility. UMBS prices via MND. Click here for the economic calendar.
Administrative
As indicated yesterday, through the end-of-this week, newsletters may be shorter due to the letter writer’s commitments. Therefore, please read the Daily Brief for March 14, if you haven’t already, for a big discussion on bond and equity market volatility, as well as the odds of the market falling apart or rising, and positioning contexts that support that movement. If there are any incomplete statements below, we shall complete them in the coming letters. We’re laying it all out for awareness. Take care!
Fundamental
Headline inflation via CPI (Consumer Price Index) fell most on energy and core goods while shelter, food, and services inflation continues to be sticky. Core prices continue to be high, risking “inflationary psychology [] becoming ingrained,” Bloomberg’s John Authers explains.
“There’s nothing in this report to suggest that inflation is defeated already,” explained Authers. “Not to raise the fed funds rate next week, with median inflation above 7%, would be a sign of panic,” and an acknowledgment of uncertainties with regard to the banking system, as talked about in the Daily Brief on March 14.
To note, however, contagion appears contained, despite Moody’s Corporation (NYSE: MCO) cutting its outlook for the banking system to negative from stable, and placing lenders including First Republic Bank (NYSE: FRC) on a downgrade review.
JPMorgan Chase & Co’s (NYSE: JPM) Marko Kolanovic did cut his equity allocation warning that not all carry trades, something this letter has talked about numerous times before (i.e., borrow at a low rate and invest in something that provides higher return), can be bailed out. Kolanovic appears worried about commercial real estate, which Simplify Asset Management’s Michael Green just told your letter writer is in a bubble that “we’re seeing crack,” finally.
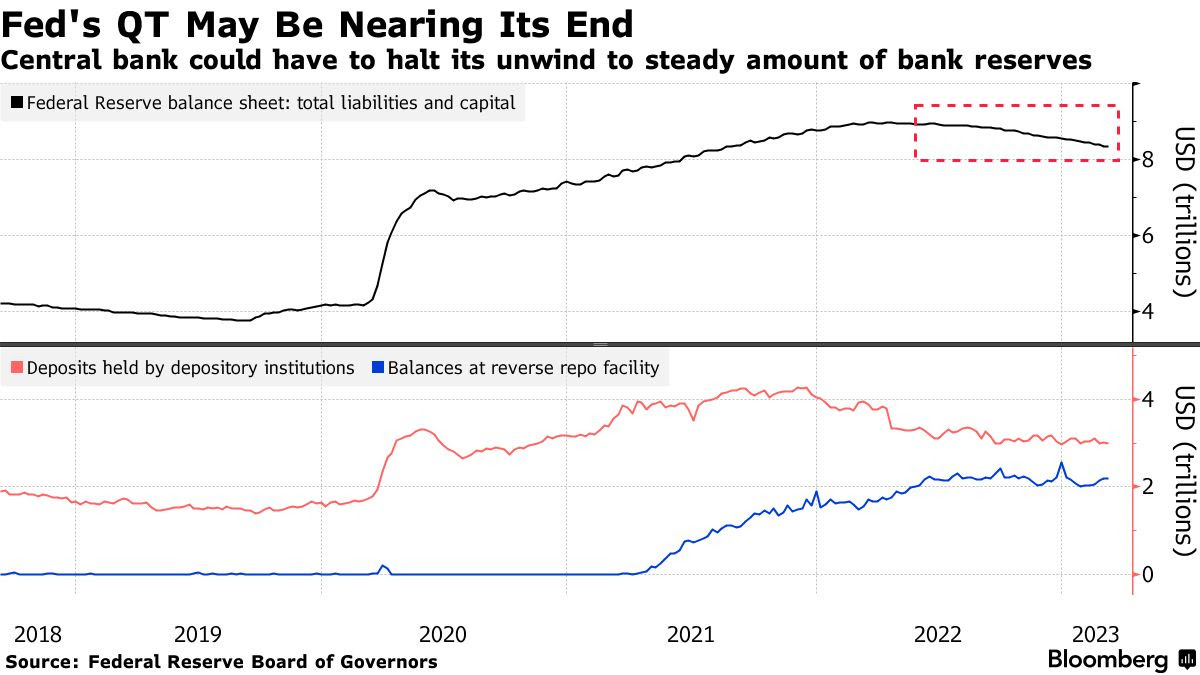
Graphic: Retrieved from Bloomberg. The Federal Reserve’s new Bank Term Funding Program or BTFP is “QE in another name – assets will grow on the Fed balance sheet which will increase reserves.” Recall that QE is the flow of capital into capital markets while QT is the opposite. Q is for quantitative while E is for easing and T is for tightening.
Anyways, following yesterday’s CPI, traders price higher odds of a 25 basis point hike which puts the terminal or peak fed funds rate at 4.75-5.00%. Following this spring, factoring potential inflation plateau and financial system uncertainties, traders foresee the Fed easing. By year-end, traders expect rates to fall down to 3.75-4.00%. Recall that at the beginning of last week, there were no expectations of easing in 2023. Also, traders thought the Fed would raise as high as 5.50-5.75%.
Mortgage rates, determined by changes in the price of mortgage-backed securities or MBSs, fell too.
ARK Invest’s Cathie Wood, who your letter writer had the honor of interviewing in person for Benzinga articles, thinks we’re on the cusp of the “roaring twenties” as inflation “is likely to surprise on the low side of expectations” with the banking crisis also leading to “bad deflation.”
“Today, five major innovation platforms are evolving at the same time – multiomics sequencing, robotics, energy storage, artificial intelligence, and blockchain technology, all of which are converging,” she elaborates.
“Once the Fed stops looking backward at CPI inflation and starts addressing the deflationary banking crisis that a 19-fold increase in short rates and an inverted yield have caused, we would not be surprised to see a return to the Roaring Twenties.”
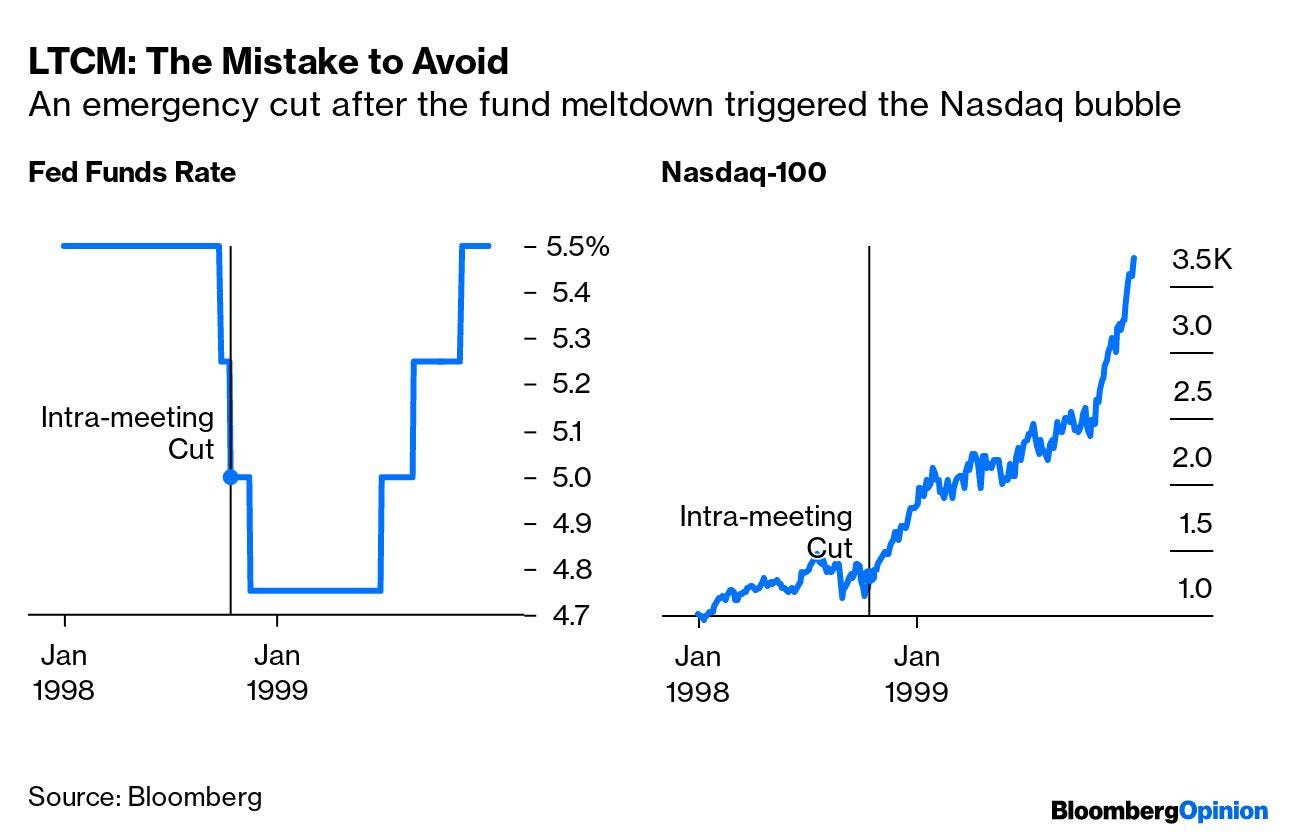
Graphic: Retrieved from Bloomberg.
On the backward-looking measures quote in the above paragraph, former Fed trader Joseph Wang notes that the Fed and central banks, in general, are aware segments of the market may break, but that won’t discourage them from tightening further.
“As the BOE saved the gilt market through purchases and kept tightening, so the Fed can save banks and keep tightening.”
Positioning
Tuesday’s letter said that following important events like CPI, the compression of wound implied volatility or IVOL, coupled with the nearing large options expirations (OpEx), sets the market up for potential short bursts of strength into the end of the month and next month.
That’s along the lines of what is happening. The S&P 500 rose mechanically after the release of CPI yesterday. Later, though the index succumbed, internally speaking the market remained strong through end-of-day, hence some short bursts boosted by some short-dated options activities, also.
As explained, yesterday, the recent re-grossing theme appears intact. Any further compression of wound IVOL and the passage of options expirations (OpEx) could support equities as month-end approaches. Though it may be too early to position for strength, one may consider it the way it was explained in the Daily Brief on March 14.
Technical
As of 6:15 AM ET, Wednesday’s regular session (9:30 AM – 4:00 PM ET), in the S&P 500, is likely to open in the middle part of a negatively skewed overnight inventory, inside of the prior day’s range, suggesting a limited potential for immediate directional opportunity.
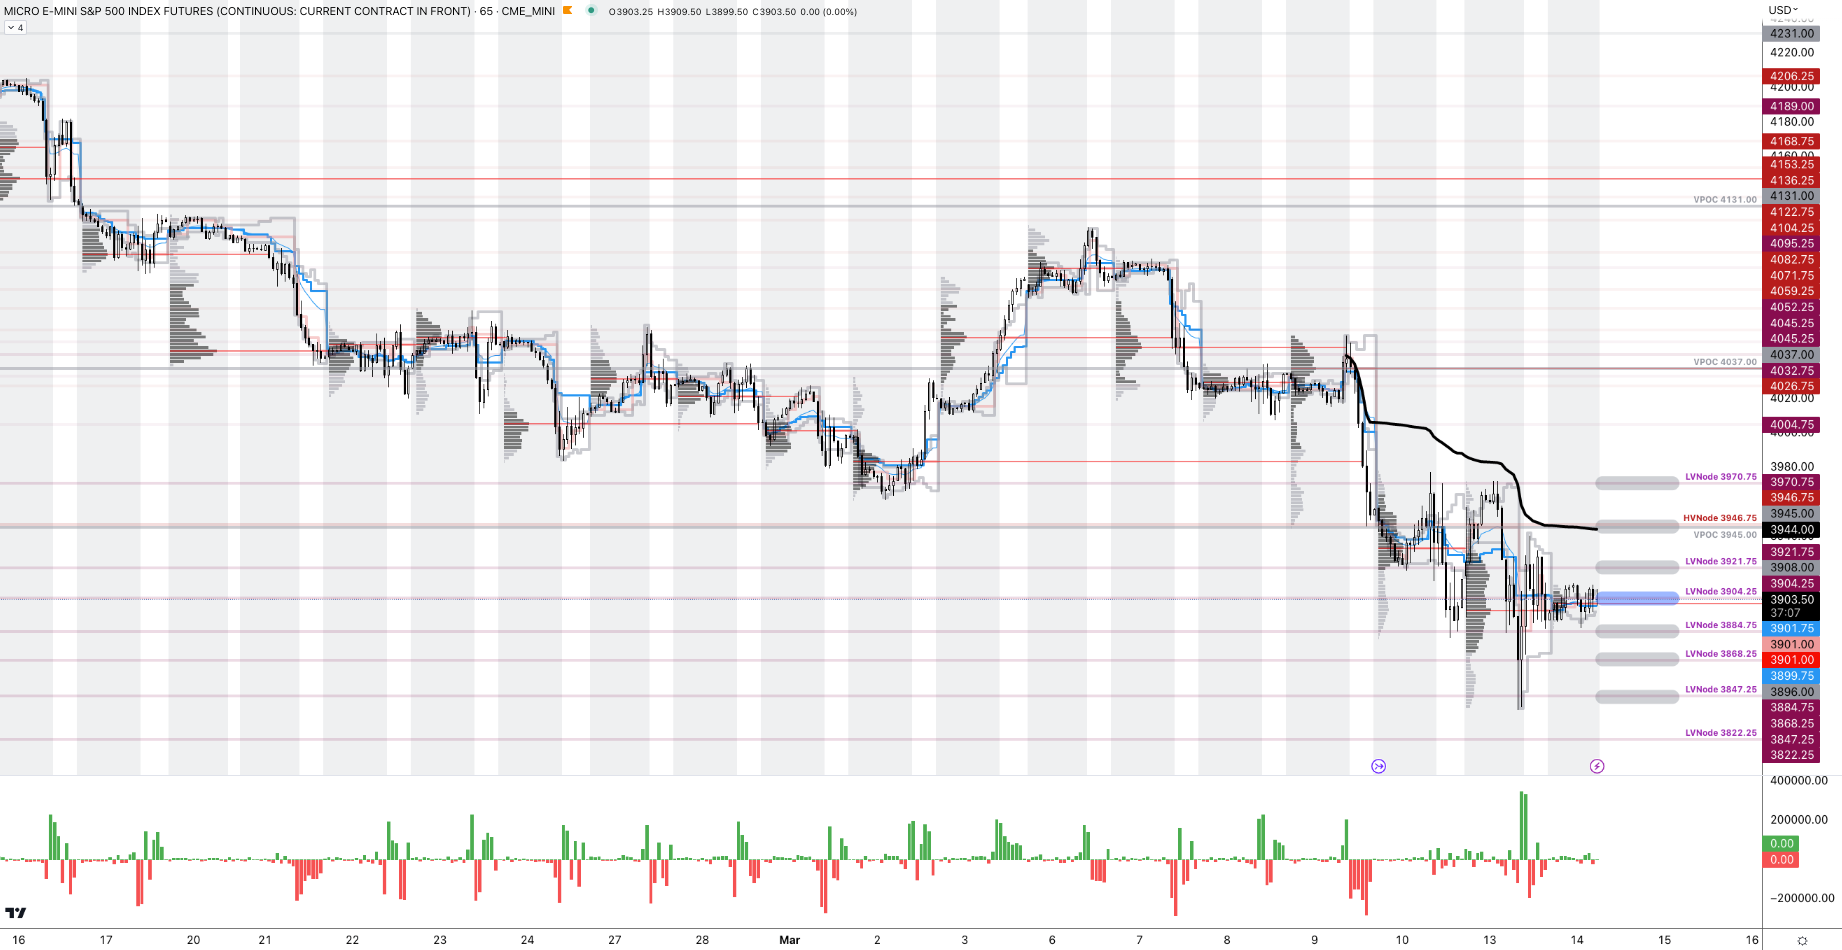
The S&P 500 pivot for today is $3,904.25.
Key levels to the upside include $3,921.75, $3,945.00, and $3,970.75.
Key levels to the downside include $3,884.75, $3,868.25, and $3,847.25.
Disclaimer: Click here to load the updated key levels via the web-based TradingView platform. New links are produced daily. Quoted levels likely hold barring an exogenous development.
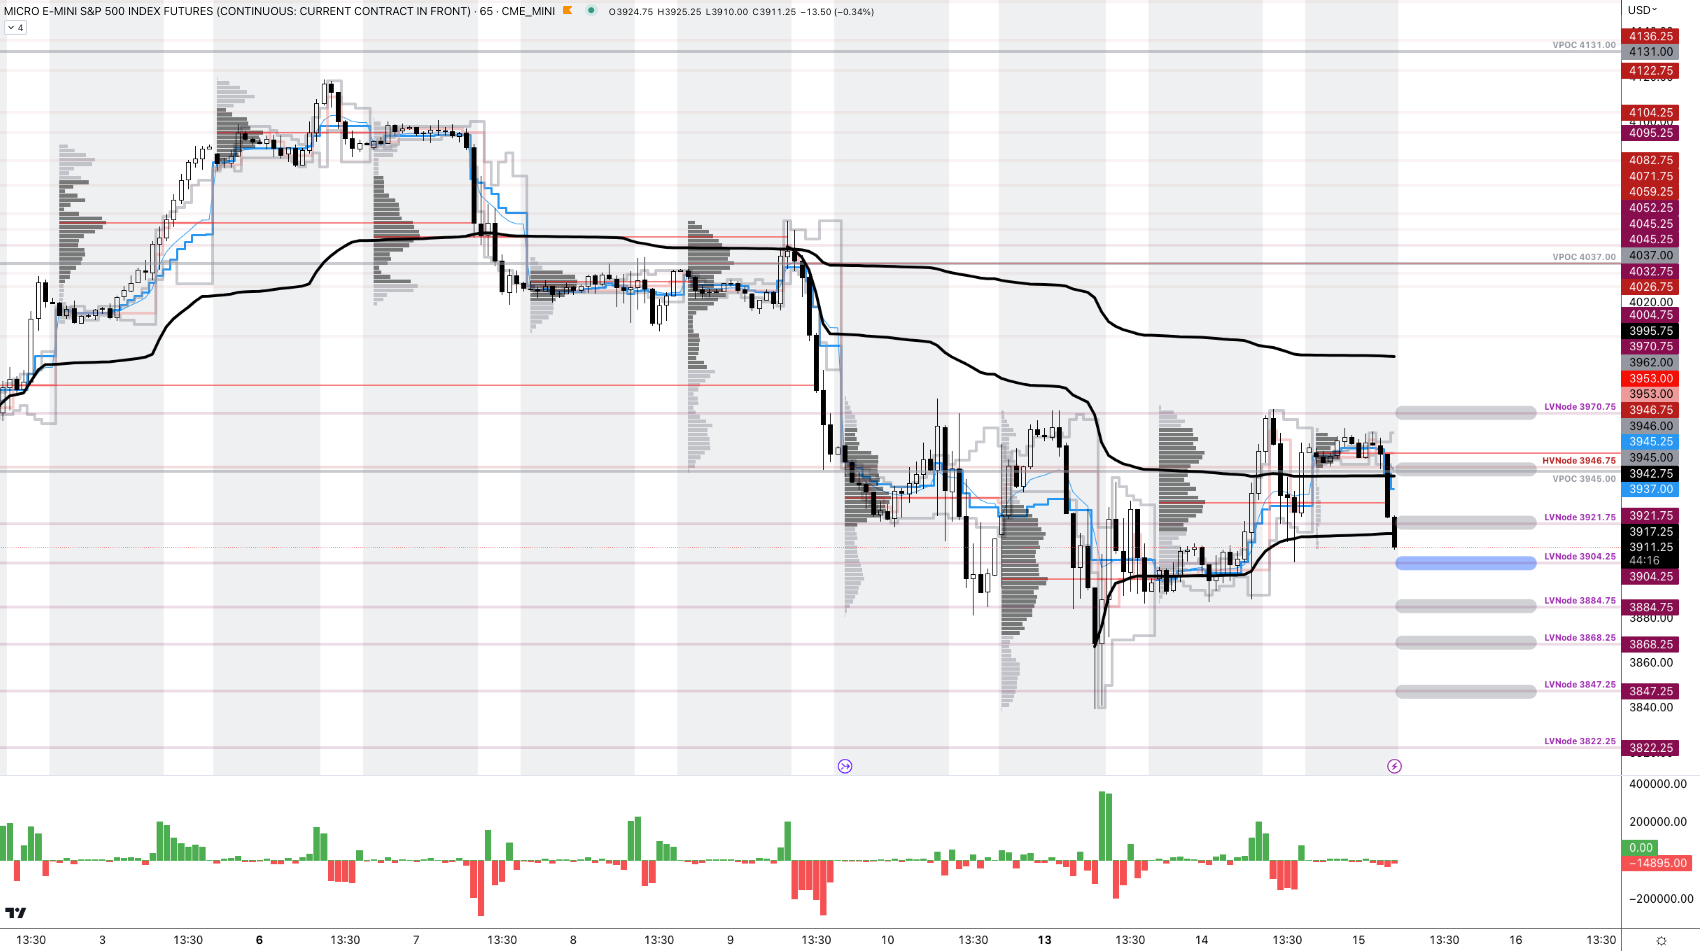
Graphic: 65-minute profile chart of the Micro E-mini S&P 500 Futures.
Definitions
Volume Areas: Markets will build on areas of high-volume (HVNodes). Should the market trend for a period of time, this will be identified by a low-volume area (LVNodes). The LVNodes denote directional conviction and ought to offer support on any test.
If participants auction and find acceptance in an area of a prior LVNode, then future discovery ought to be volatile and quick as participants look to the nearest HVNodes for more favorable entry or exit.
POCs: Areas where two-sided trade was most prevalent in a prior day session. Participants will respond to future tests of value as they offer favorable entry and exit.
Volume-Weighted Average Prices (VWAPs): A metric highly regarded by chief investment officers, among other participants, for quality of trade. Additionally, liquidity algorithms are benchmarked and programmed to buy and sell around VWAPs.
About
The author, Renato Leonard Capelj, spends the bulk of his time at Physik Invest, an entity through which he invests and publishes free daily analyses to thousands of subscribers. The analyses offer him and his subscribers a way to stay on the right side of the market.
You may view this letter’s content calendar at this link.
Disclaimer
Do not construe this newsletter as advice. All content is for informational purposes. Capelj and Physik Invest manage their own capital and will not solicit others for it.
Physik Invest’s Daily Brief is read free by thousands of subscribers. Join this community to learn about the fundamental and technical drivers of markets.
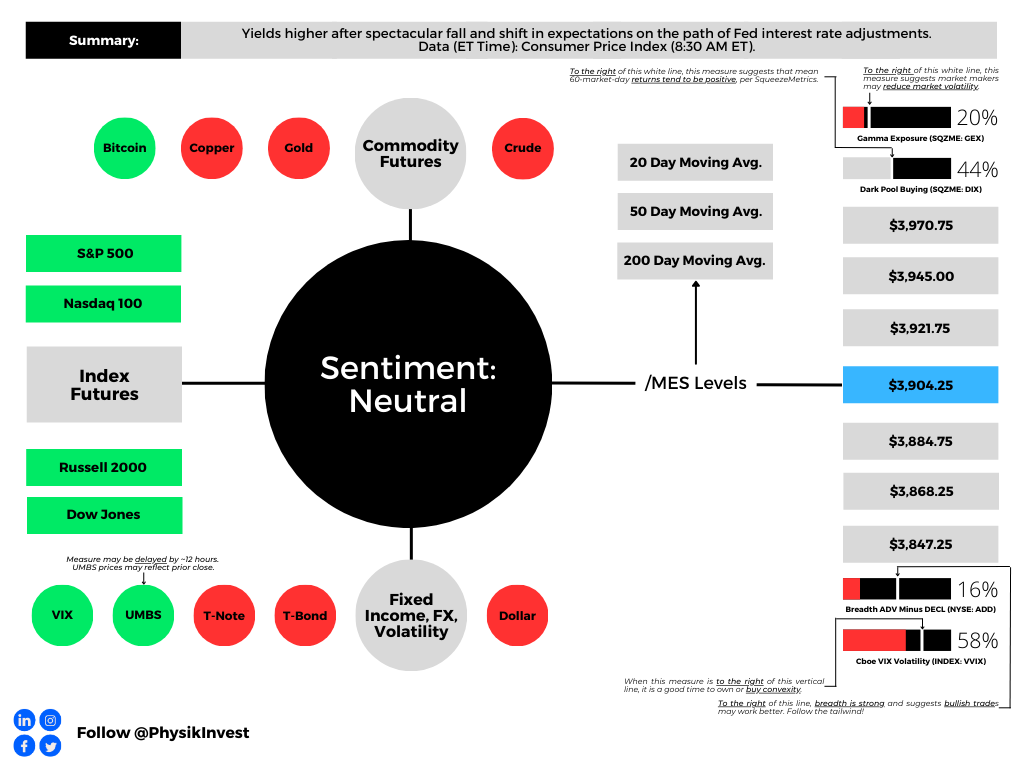
Graphic updated 6:30 AM ET. Sentiment Neutral if expected /MES open is inside of the prior day’s range. /MES levels are derived from the profile graphic at the bottom of this letter. Click here for the latest levels. SqueezeMetrics Dark Pool Index (DIX) and Gamma (GEX) with the latter calculated based on where the prior day’s reading falls with respect to the MAX and MIN of all occurrences available. A higher DIX is bullish. The lower the GEX, the more (expected) volatility. Click to learn the implications of volatility, direction, and moneyness. Breadth reflects a reading of the prior day’s NYSE Advance/Decline indicator. The CBOE VIX Volatility Index (INDEX: VVIX) reflects the attractiveness of owning volatility. UMBS prices via MND. Click here for the economic calendar.
Administrative
A long(er) letter, today. Through the end-of-this week, newsletters may be shorter due to the letter writer’s commitments. Take care!
Fundamental
Yesterday’s letter focused on the SVB Financial Group (NASDAQ: SIVB) failure, albeit with an optimistic tone. In short, the bank could not make good on fast accelerating withdrawals. Read more here.
According to one TechCrunch article, the likes of Founders Fund “reportedly advised their portfolio companies … to withdraw their money, … [and], if everybody is telling each other that SVB is in trouble, that will be a challenge,” as it was.
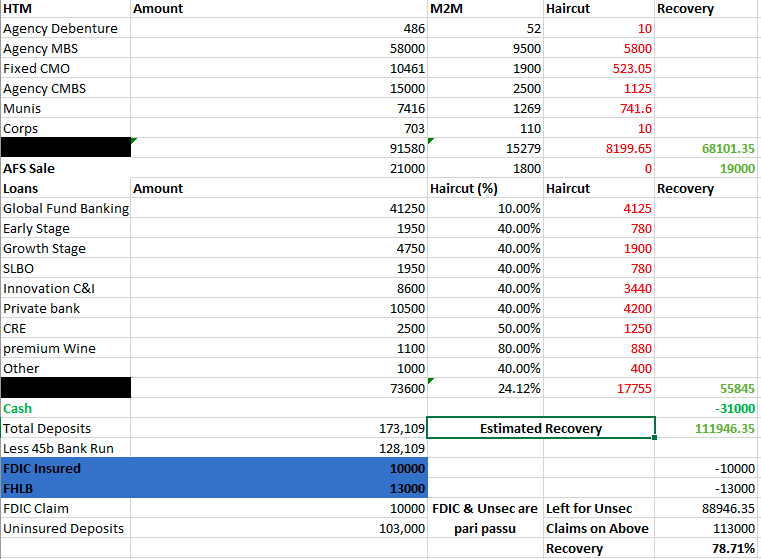
Graphic: Retrieved from @Citrini7. In the worst-case scenario, it was likely that uninsured depositors at SIVB would have received $0.80 on each dollar barring a bailout.
Authorities later put forth emergency measures guaranteeing all deposits. The effort shored up confidence in the banking system and markets strengthened, though some regional names such as First Republic Bank (NYSE: FRC) continued trading weak. In FRC’s case, the Federal Reserve’s (Fed) new bailout facility does not help. As former Fed trader Joseph Wang explains, “you need Treasuries and Agency MBS to tap the facility, and [FRC] barely owns any.”
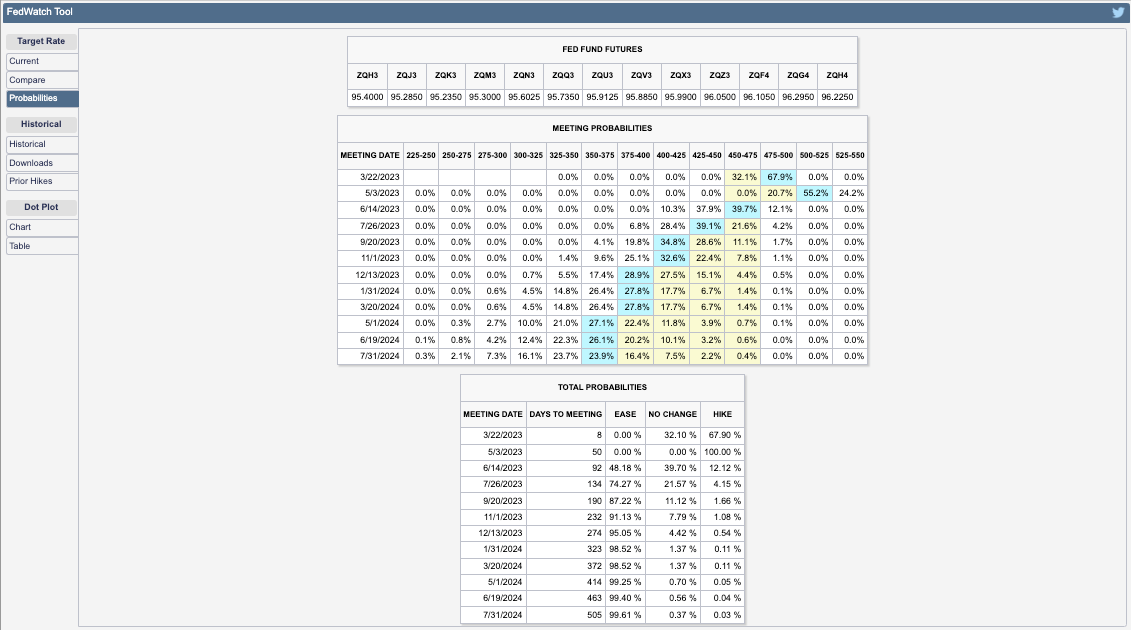
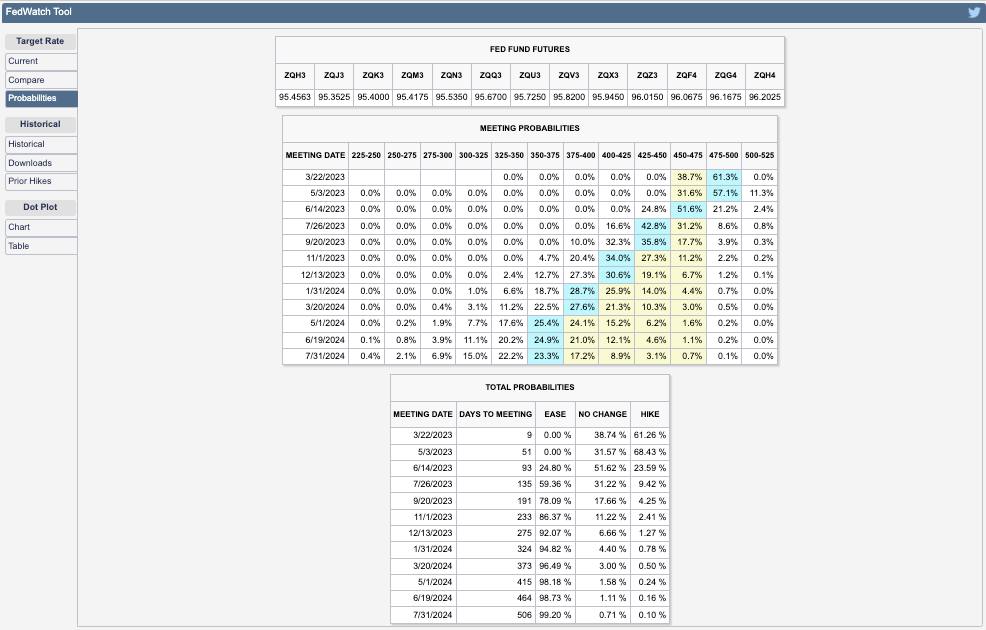
Anyways, as yesterday’s letter briefly mentioned, expectations on the path of Fed Funds shifted. Traders put the terminal/peak rate at 5.00-5.25%, down from 5.50-5.75%, while pricing cuts after spring. Previously, no cuts were expected in 2023.
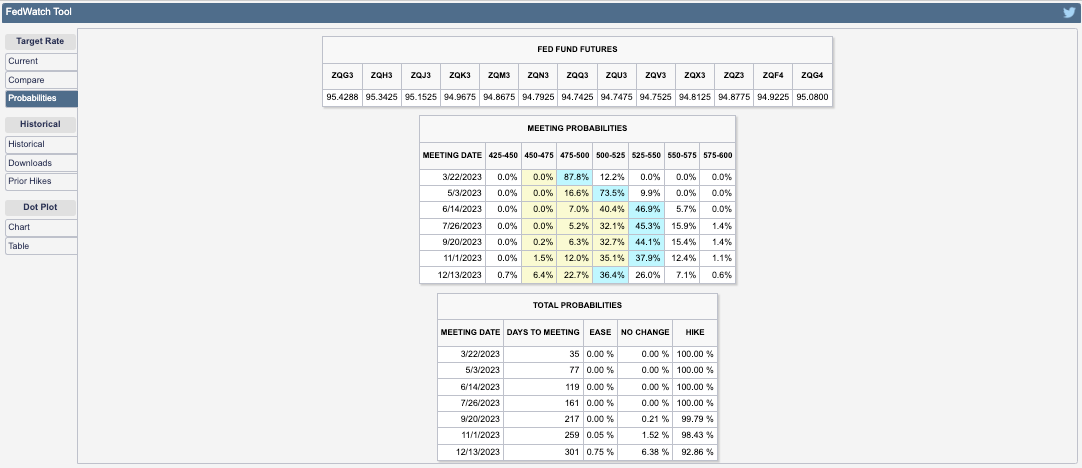
Graphic: Retrieved from CME Group Inc’s (NASDAQ: CME) FedWatch Tool.
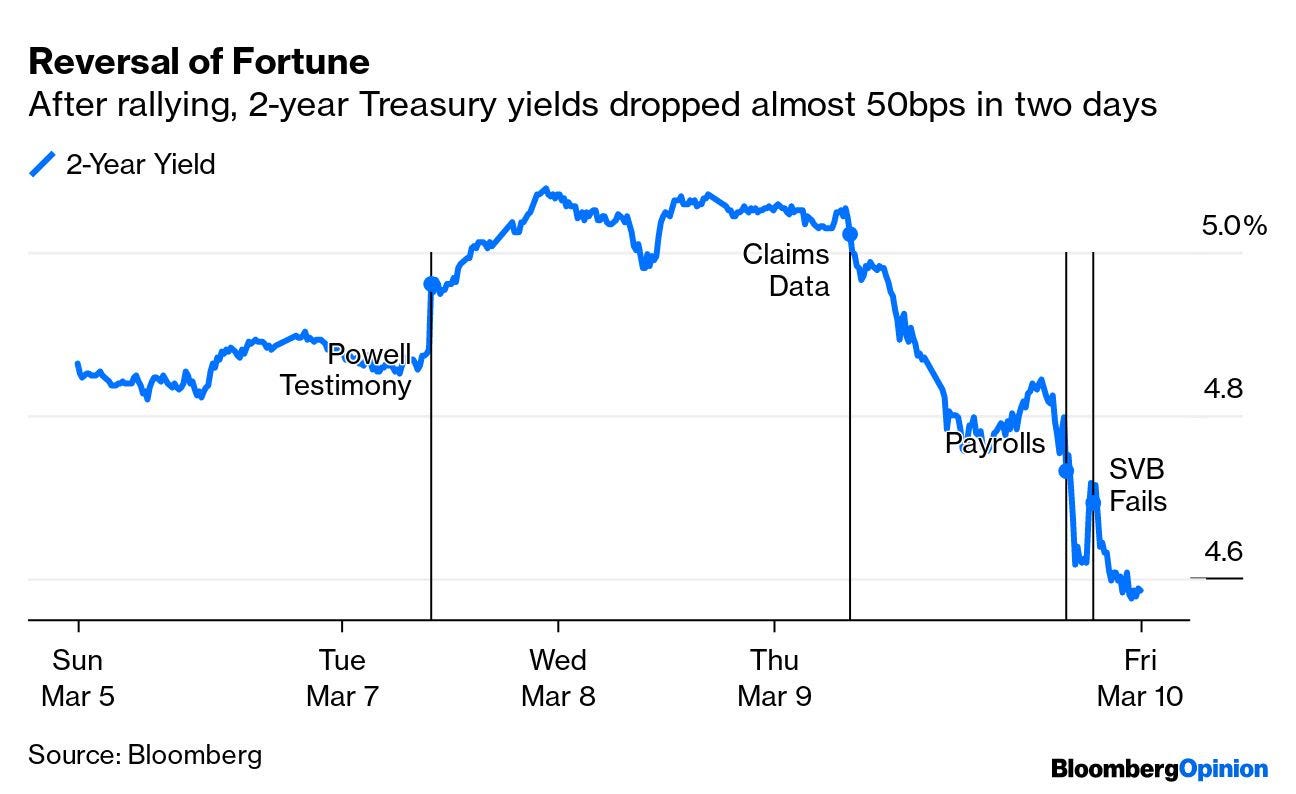
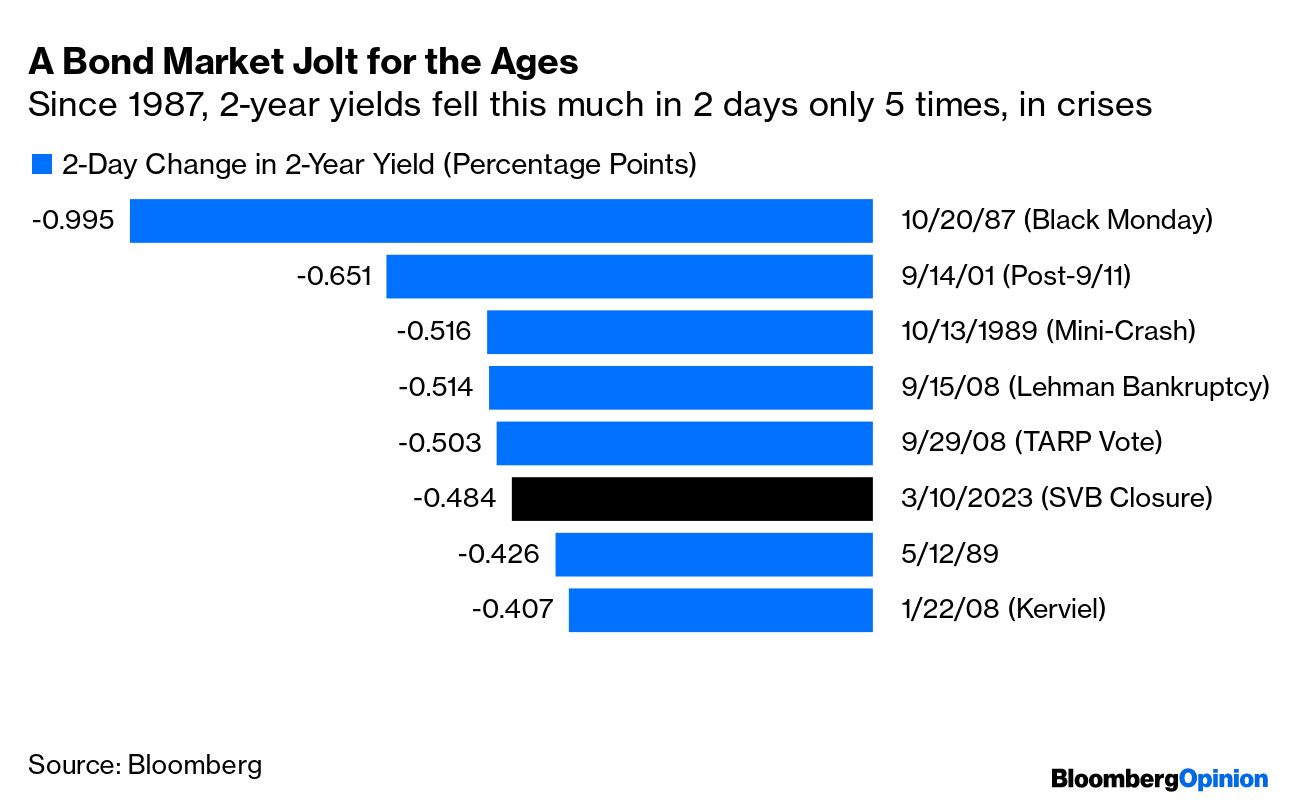
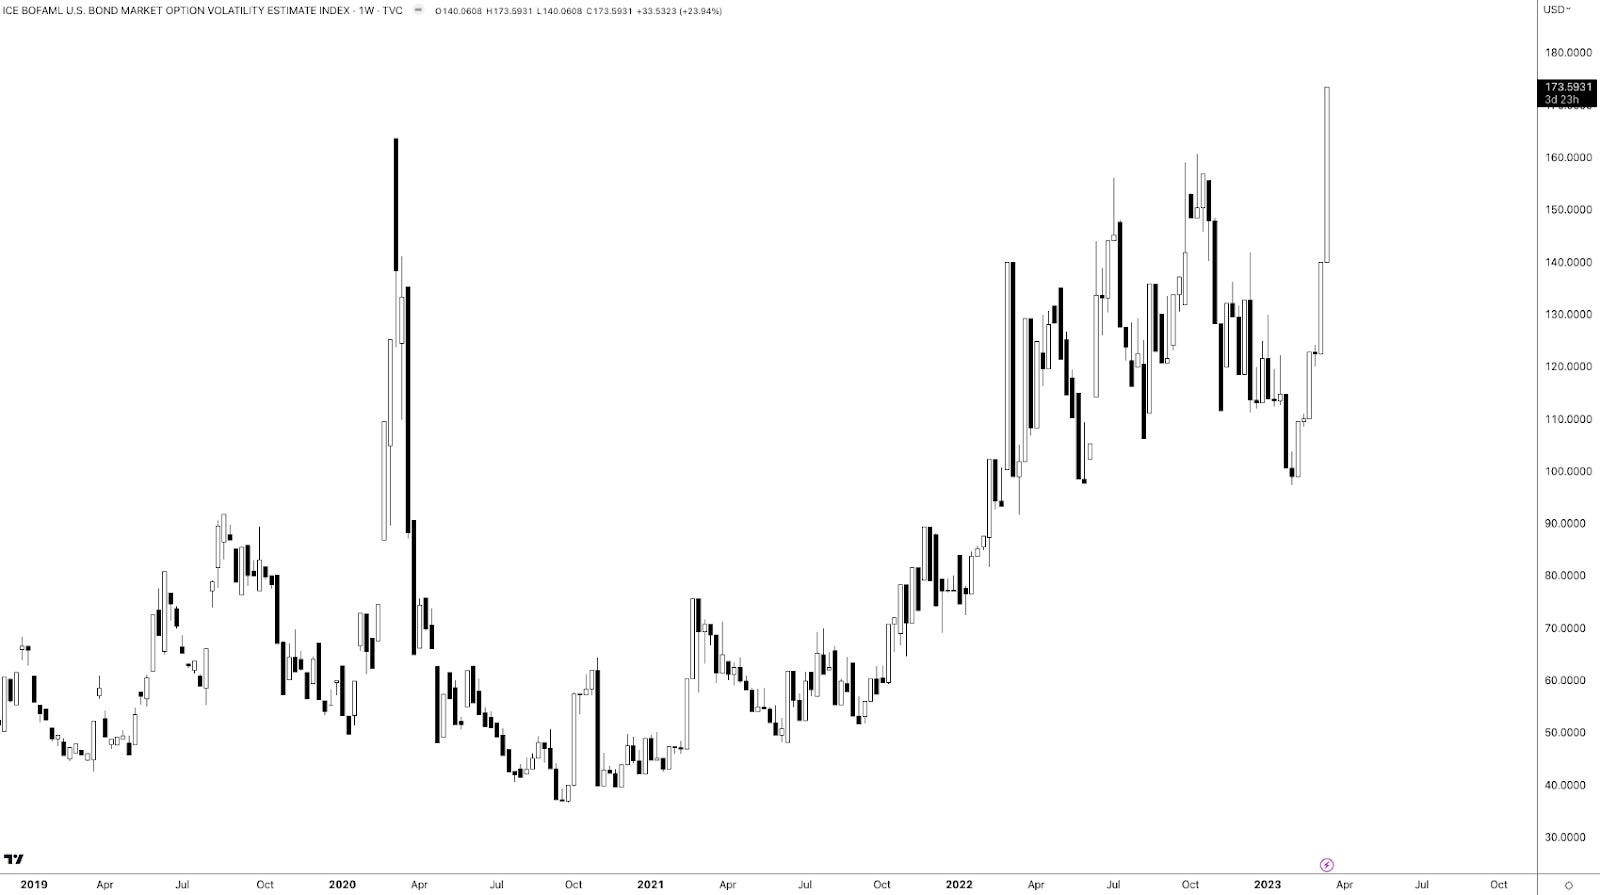
Measures of US Treasury yield volatility implied by options (i.e., bets or hedges on or against market movement) adjusted higher, accordingly. This is often a harbinger of equity market volatility.
Graphic: Merrill Lynch Option Volatility Estimate retrieved from TradingView
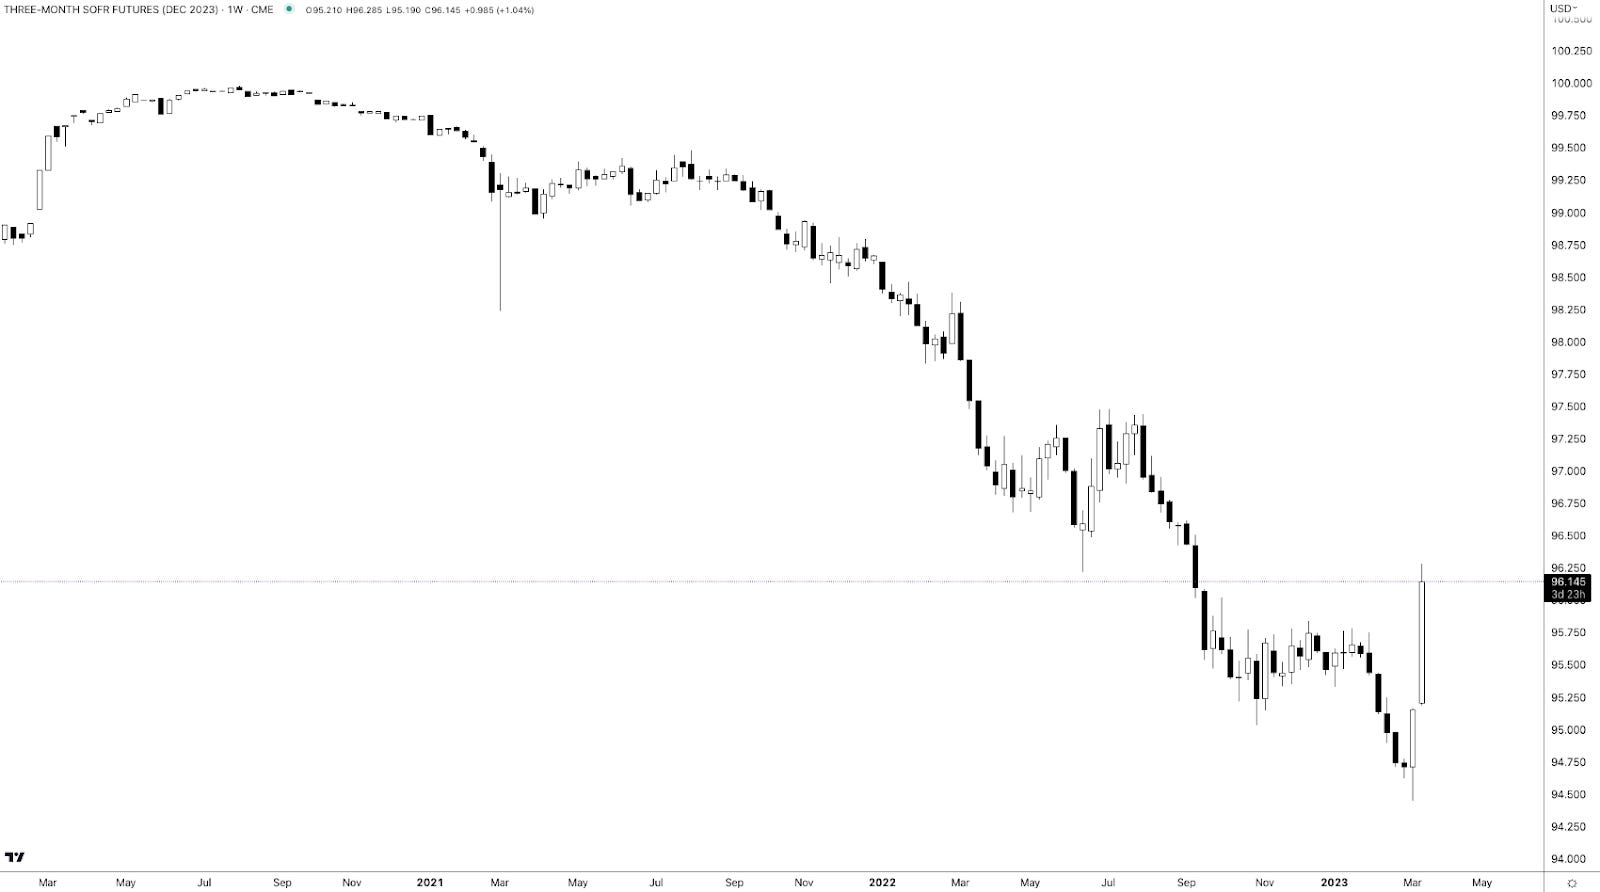
Call options on the three-month Secured Overnight Financing Rate (FUTURE: SOFR) future (i.e., bets on interest rates falling in the future) paid handsomely.
For instance, bull call spreads that expire in December 2023 (e.g., BUY +1 VERTICAL /SR3Z23:XCME 1/2500 DEC 23 /SR3Z23:XCME 96/97 CALL @.0375) increased in value by about 650.00% to $0.33 (i.e., $750.00 per contract).
Graphic: Retrieved via TradingView. Three-month SOFR Future (December 2023). When SOFR is at a lower (higher) number, the market is pricing an increase (decrease) in interest rates. Participants put the December 2023 SOFR rate at 100-96.145 = 3.855%.
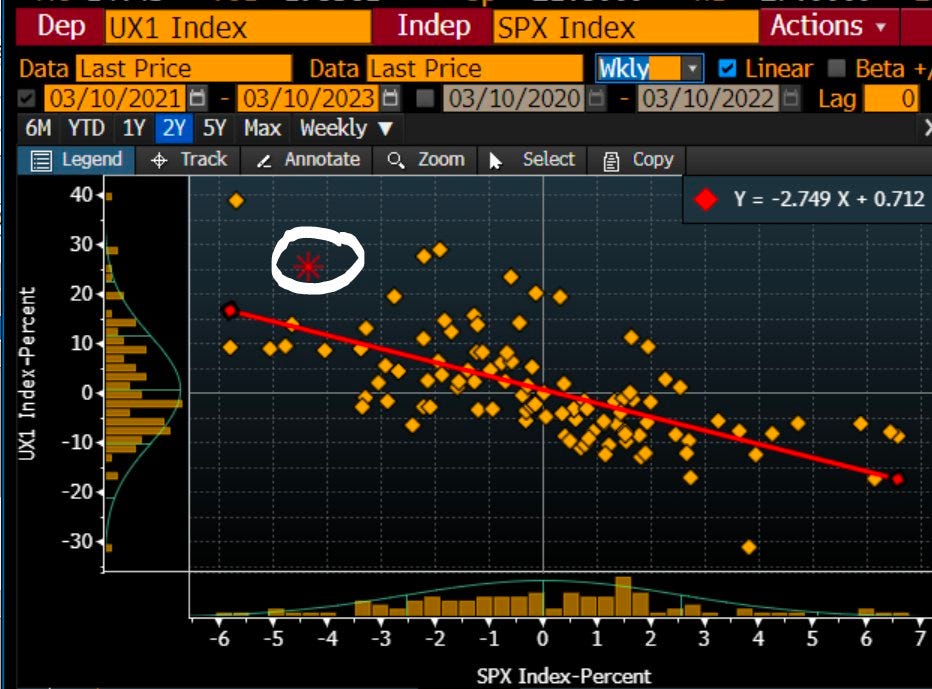
In the equity space, some readers may have caught some commentary on spot-vol beta in the VIX complex strengthening like we have not seen in a while, a nod to the harbinger of equity market volatility remark a few paragraphs higher.
Recommended Readings:
Read: The Ambrus Group’s Kris Sidial on two major risks investors should watch out for in 2023. In short, volatility’s sensitivity to underlying prices (spot-vol beta) was low, and Sidial cast blame, in part, on commodity trading advisors and strong volatility supply.
Read: Simplify Asset Management’s Michael Green on using option and bond overlays to hedge big uncertainties facing markets. Following 2022, investors swapped poor-performing long-dated volatility exposures for ones with bounded risk and less time to expiry, hence the increase in 0 DTE trading.
Graphic: Retrieved from Piper Sandler’s (NYSE: PIPR) Danny Kirsch.
This spot-vol beta remark suggests that (at least some of) the volatility in rates, as well as certain small pockets of the equity and crypto market, manifested demand for crash protection in the S&P 500, “which feeds back into VIX,” one explanation put well.
Graphic: Retrieved from Piper Sandler’s (NYSE: PIPR) Danny Kirsch. “[Last] week finally got a bit of explosiveness in VIX as fixed strike volatility got bid. This is VIX generic front month future and move in SPX. Last time it really “paid” to have VIX upside was Jan of 2022 (point in upper left corner).”
Notwithstanding, for these options to keep their value and continue to perform well, realized volatility (RVOL) must pick up substantially, which is not likely.
Unlimited’s Bob Elliott comments: “the bond market is pricing a broad-based credit crunch, … [and though] it’s not crazy for the Fed to slow down here given the current uncertainty,” odds are financial problems are contained and the Fed moves forward with its mission to get (and keep) inflation down.
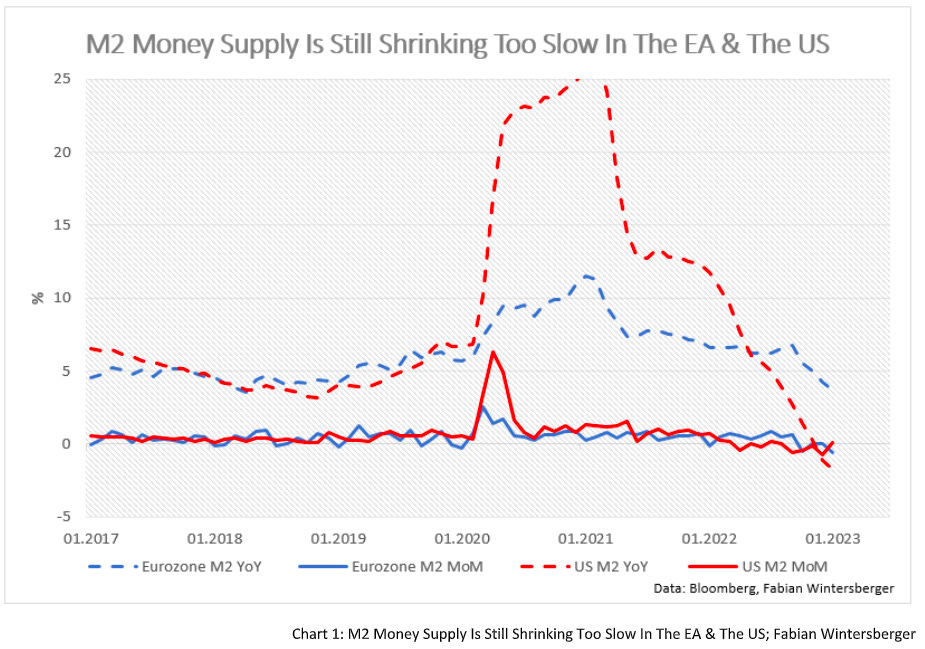
Graphic: Retrieved from Fabian Wintersberger. Just as the “monetary expansion supported the rise in equity and bond prices in January.”
Consequently, “the pricing of Dec23s and 5yr BEIs makes no sense,” Elliott adds. This means the example SOFR trade above is/was ripe for some monetization, and equity volatility must be dealt with carefully (i.e., price movements must be higher than they are now which would be difficult given that authorities/Fed do not want liquidations).
In support of siding with the less extreme take, we paraphrase Kai Volatility’s Cem Karsan who says that for years prior to the 2007-2008 turmoil, macro tourists were calling for a crash.
For markets to crumble, there would have to be an exogenous event far greater in implications than what just transpired with SIVB over the weekend. With odds that such turmoil doesn’t happen soon, coupled with participants easing up on their long-equity exposure (i.e., selling stock and not needing to hedge, hence the statement that owning equity volatility must be dealt with carefully), RVOL is likely to stay contained. That’s not to say that this volatility observed in the rates market can’t persist. It’s also not to say that markets can’t continue to trade lower (in fact, with interest rates rising and processes like quantitative tightening challenging bank liquidity, there is less incentive for investors to reside in lower-yielding equities). It just means that, barring some exogenous event, the market remains intact.
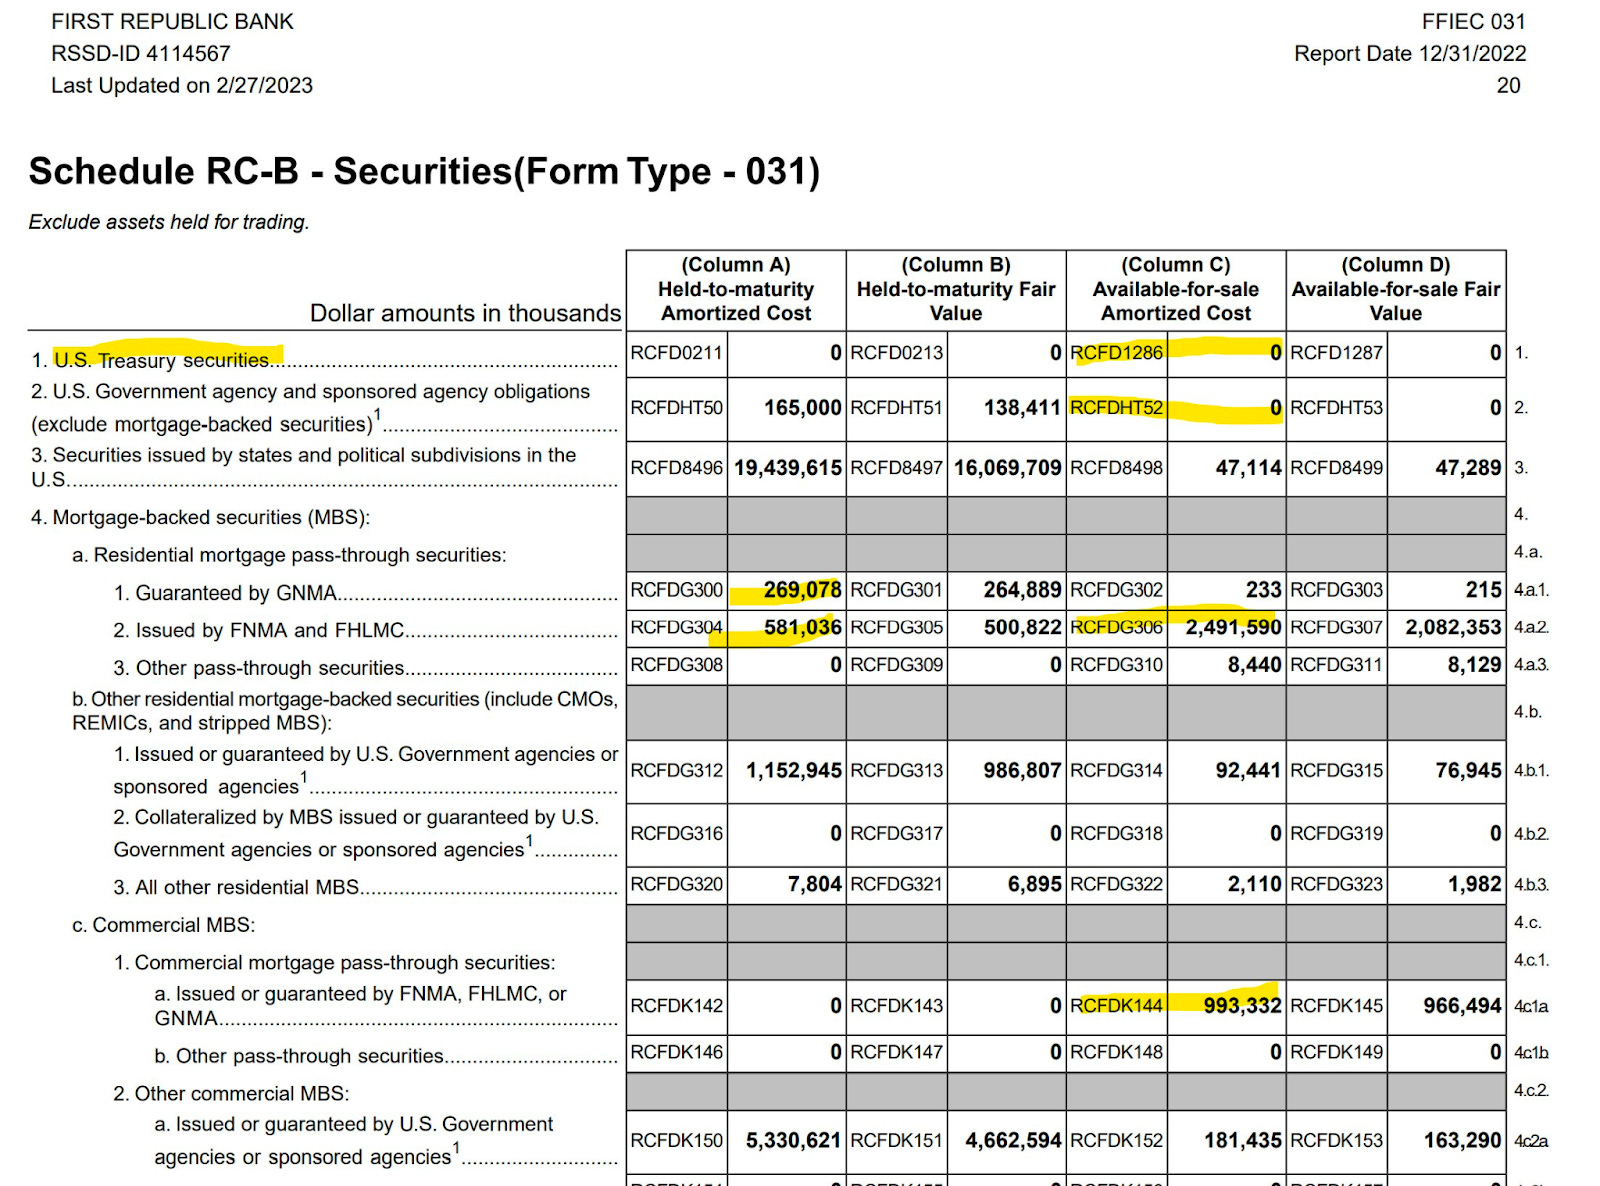
Graphic: Retrieved from Jack Farley. “Silicon Valley Bank owns >$80 Billion of Mortgage-Backed Securities (MBS), a market that is ‘more prone to bouts of volatility’ because ‘small investors & leveraged funds have become the main buyers’ as the Fed & banks step away from market, according to Dec 2022 BIS report.”
Positioning
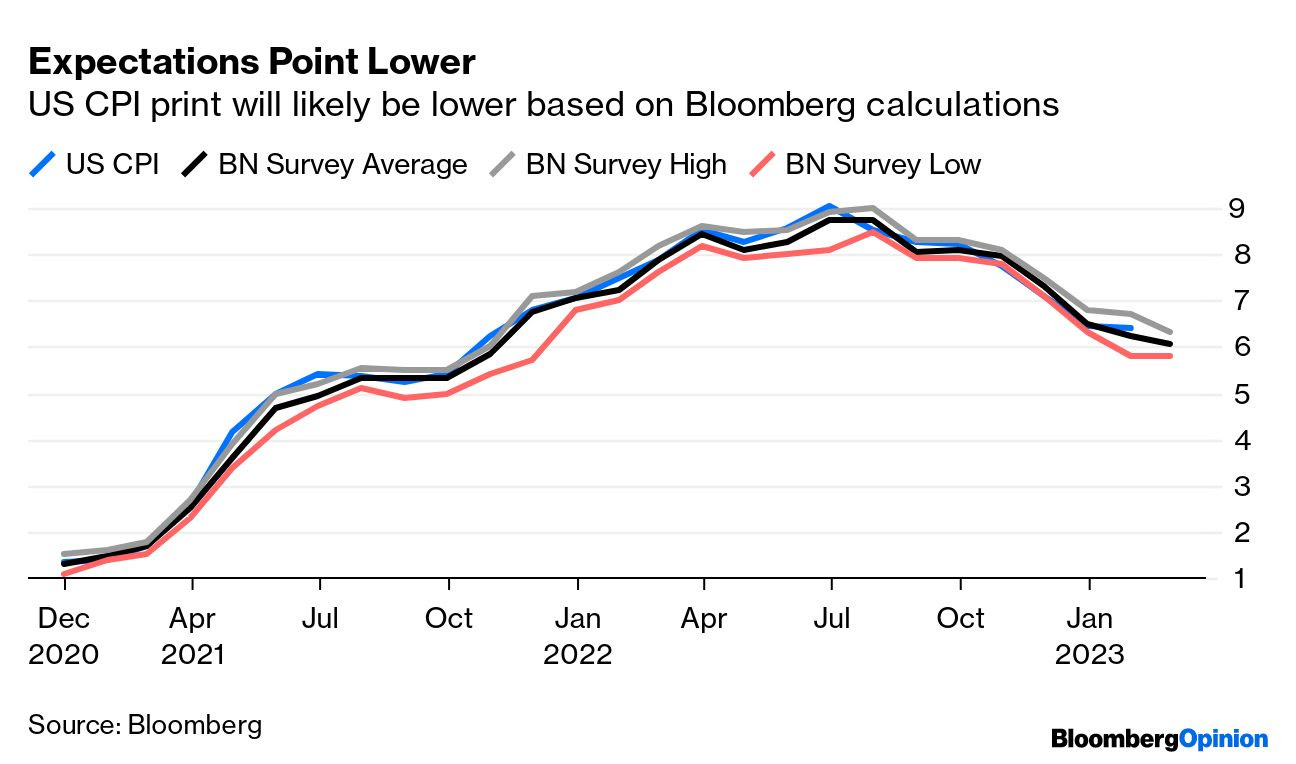
Following important events like the release of the Consumer Price Index (CPI) today, the compression of implied volatility or IVOL, coupled with the nearing of big options expirations (OpEx), sets the market up for potential short bursts of strength heading into the end of the month and next month.
Graphic: Retrieved from Bloomberg. Inflation has been well within forecasts.
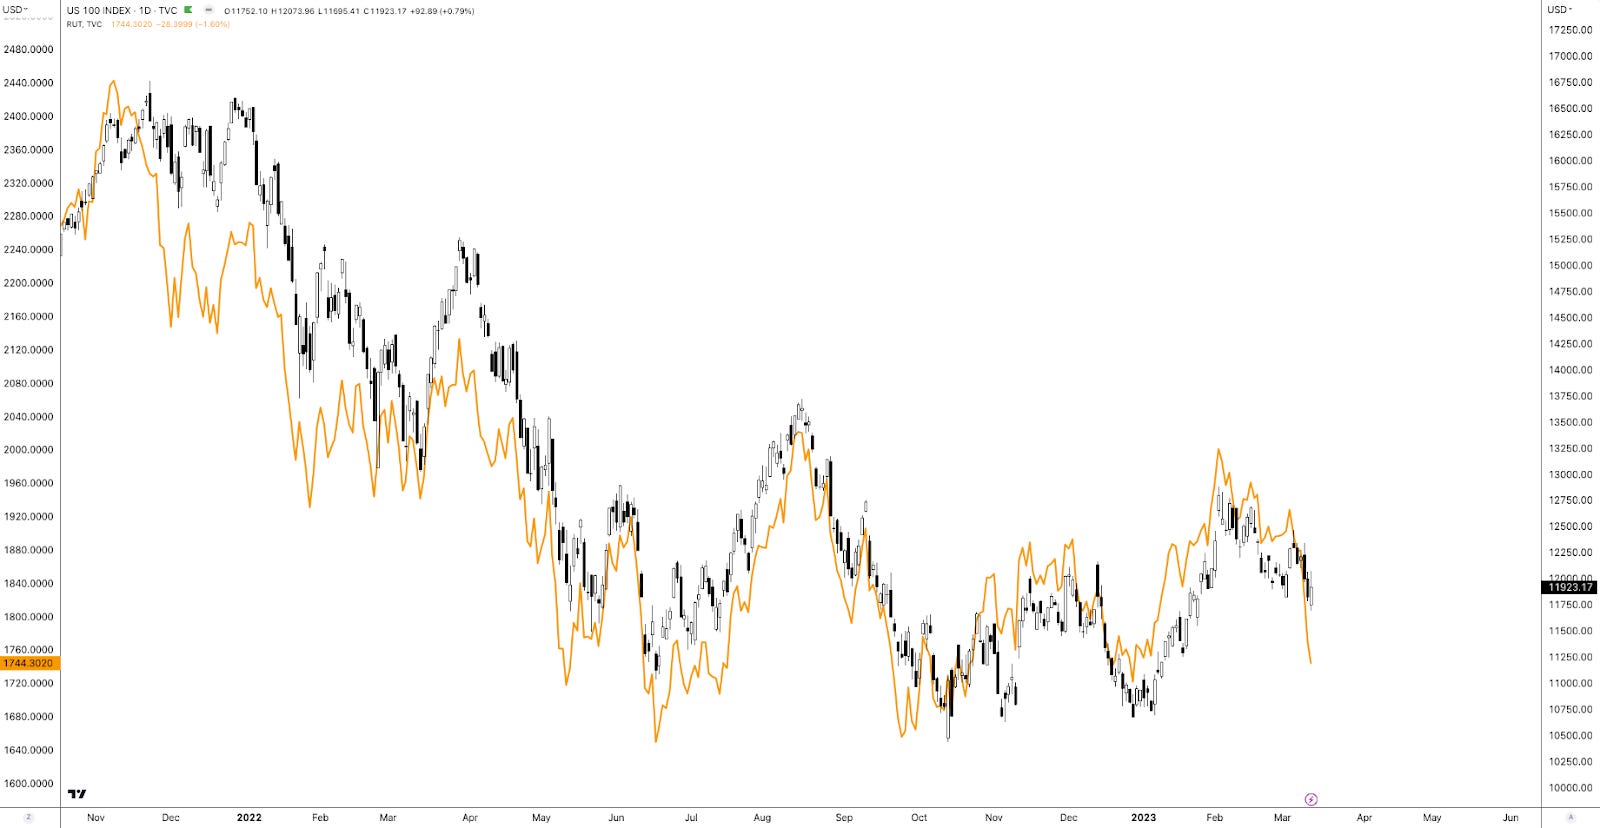
A quick comparison of the Russell 2000 (INDEX: RUT) and Nasdaq 100 (INDEX: NDX) suggests this options-induced strength may help keep the recent re-grossing theme intact. The compression of wound IVOL and passage of OpEx, coupled with the still-live re-grossing theme, may put a floor under equities.
Graphic: Retrieved from TradingView. Orange = RUT. Candles = NDX. Note the weakness in RUT. Note the strength of the Nasdaq relative to the Russell.
To play, one could place a portion of their cash in money market funds or T-bill ETFs or box spreads, for instance, while allocating another portion to leverage potential by way of some call options structures that use one or more short options to help bring down the cost of a long option that is closer to current market prices (e.g., a bull call spread or short ratio call spread). To note, based on options prices as of this writing, it may be too early to enter call structures (i.e., too expensive given the context).
DEFINED OUTCOME INVESTING
-Worried about the prospects of the 60/40 portfolio? -Looking for a strategy that takes advantage of higher interest rates? -Tired of market timing?
A 🧵on how to use exchange-traded options + U.S. Treasurys to define your risk today, for tomorrow.
As of 6:30 AM ET, Tuesday’s regular session (9:30 AM – 4:00 PM ET), in the S&P 500, is likely to open in the middle part of a balanced overnight inventory, inside of the prior day’s range, suggesting a limited potential for immediate directional opportunity.
The S&P 500 pivot for today is $3,904.25.
Key levels to the upside include $3,921.75, $3,945.00, and $3,970.75.
Key levels to the downside include $3,884.75, $3,868.25, and $3,847.25.
Disclaimer: Click here to load the updated key levels via the web-based TradingView platform. New links are produced daily. Quoted levels likely hold barring an exogenous development.
Graphic: 65-minute profile chart of the Micro E-mini S&P 500 Futures.
Definitions
Volume Areas: Markets will build on areas of high-volume (HVNodes). Should the market trend for a period of time, this will be identified by a low-volume area (LVNodes). The LVNodes denote directional conviction and ought to offer support on any test.
If participants auction and find acceptance in an area of a prior LVNode, then future discovery ought to be volatile and quick as participants look to the nearest HVNodes for more favorable entry or exit.
POCs: Areas where two-sided trade was most prevalent in a prior day session. Participants will respond to future tests of value as they offer favorable entry and exit.
Volume-Weighted Average Prices (VWAPs): A metric highly regarded by chief investment officers, among other participants, for quality of trade. Additionally, liquidity algorithms are benchmarked and programmed to buy and sell around VWAPs.
About
The author, Renato Leonard Capelj, spends the bulk of his time at Physik Invest, an entity through which he invests and publishes free daily analyses to thousands of subscribers. The analyses offer him and his subscribers a way to stay on the right side of the market.
You may view this letter’s content calendar at this link.
Disclaimer
Do not construe this newsletter as advice. All content is for informational purposes. Capelj and Physik Invest manage their own capital and will not solicit others for it.
Physik Invest’s Daily Brief is read free by thousands of subscribers. Join this community to learn about the fundamental and technical drivers of markets.
Graphic updated 6:40 AM ET. Sentiment Neutral if expected /MES open is inside of the prior day’s range./MES levels are derived from the profile graphic at the bottom of this letter. Click here for the latest levels. SqueezeMetrics Dark Pool Index (DIX) and Gamma (GEX) with the latter calculated based on where the prior day’s reading falls with respect to the MAX and MIN of all occurrences available. A higher DIX is bullish. The lower the GEX, the more (expected) volatility. Click to learn the implications of volatility, direction, and moneyness. Breadth reflects a reading of the prior day’s NYSE Advance/Decline indicator. The CBOE VIX Volatility Index (INDEX: VVIX) reflects the attractiveness of owning volatility. UMBS prices via MND. Click here for the economic calendar.
Administrative
Please check out Friday’s Daily Brief on the letter writer’s discussion with Simplify’s Michael Green. In that letter, we unpacked a variety of topics including the reliability of data, what this means for active management, derivatives trading, strength potential in markets, and things to be optimistic about.
Regarding today’s letter, we shall take a less pessimistic view of the events that have transpired over the past few days involving the likes of Silvergate Capital Corporation (NYSE: SI) and SVB Financial Group (NASDAQ: SIVB). This too shall pass.
Fundamental
The pandemic stimulus had SIVB taking in “cash deposits as a combination of PPP loans, equity investments in VC and cash from new issues (including SPACS),” says Simplify’s Michael Green who your letter writer spoke to for a Benzinga article. SIVB took these deposits and invested them into longer-dated bonds. At the time, these bonds were yielding 1% or so. SIVB “borrowed short (deposits) and lent long.”
Eventually, monetary policy tightened.
SIVB’s client base, many of who were “money-losing VC startups” drew on cash. With interest rates rising and losses on SIVB’s bond portfolio growing, the bank decided to “designate the securities as ‘held-to-maturity’ where mark-to-market losses would not flow through the income statement.”
Graphic: Retrieved from Bloomberg.
With this HTM designation, the SIVB no longer had to hedge interest rate exposure. Unfortunately, with the rapid pace of interest rate increases, SIVB’s unhedged bond portfolio fell sharply in value while withdrawals continued to increase.
Graphic: Retrieved from Michael Green of Simplify Asset Management.
Green summarizes it well: “With deposits cratering, SVB is forced to begin selling the HTM portfolio to obtain liquidity. This action will push the unrealized losses from the HTM portfolio onto the income statement and impair SVB’s equity. Hence the need to raise equity capital.”
Moreover, as news of capital raises spread, and given that most depositors’ accounts were valued in excess of the FDIC’s insurance limits, withdrawals accelerated further.
“Roughly 25% of total deposits” flowed out. “There is no bank that can survive this,” Green put forth. The risk with SIVB was fear/panic and contagion; the depositors have employees to pay and their business to conduct (e.g., Circle minting and redemption of USDC, a major source of collateral in the crypto-verse).
YOU SHOULD BE ABSOLUTELY TERRIFIED RIGHT NOW — THAT IS THE PROPER REACTION TO A BANK RUN & CONTAGION @POTUS & @SecYellen MUST GET ON TV TOMORROW AND GUARANTEE ALL DEPOSITS UP TO $10M OR THIS WILL SPIRAL INTO CHAOS
Consequently, SIVB entered receivership and the FDIC sought buyers. If the latter were to fail, the FDIC would have sold off SIVB’s assets to make good on deposits.
And, in another case, authorities could safeguard or guarantee uninsured deposits with a new deposit insurance fund banks pay into (i.e., not a cost to taxpayers or a bailout). And, that’s basically what the authorities decided to do.
On Sunday, authorities announced emergency measures to guarantee all deposits of SIVB and shore up confidence in the US banking system.
Per a Wall Street Journal article, the government’s bank-deposit insurance fund will cover all deposits, rather than the measly $250,000.00. Additionally, any losses to the fund would be “recovered in a special assessment on banks and the US taxpayers wouldn’t bear any losses.” The Federal Reserve, in separate statements, said it would make additional funds available to banks through the “Bank Term Funding Program” which offers loans up to a year out with Treasuries and mortgage-backed securities, among other assets owned by banks, pledged as collateral. In short, the program signals banks don’t have to liquidate securities and realize losses to raise cash.
“Many of those securities have fallen in value as the Fed has raised interest rates,” the WSJ adds. “The terms would allow banks to borrow at 100 cents on the dollar for securities trading potentially well below that value, potentially putting the government at risk of losses incurred by banks. Critics said the move would essentially offer a backdoor subsidy to bank investors and management for failing to properly manage interest-rate risks.”
“The new facility provides cheap and under-secured loans – the exact opposite of good central banking,” former Fed trader Joseph Wang explains. “A bank can take collateral trading at $0.90 and borrow a $1.00 from the facility at below market rates.” This suggests the “Administration has decided to socialize the banking sector.”
The turmoil has muddied the outlook on interest rates. Higher for longer was the case heading into the end of last week. Traders now think the terminal/peak rate sits at 4.75-5.00%. Following the spring timeframe, traders think the Fed starts to ease.
Graphic: Retrieved from CME Group Inc’s (NASDAQ: CME) FedWatch Tool.
Technical
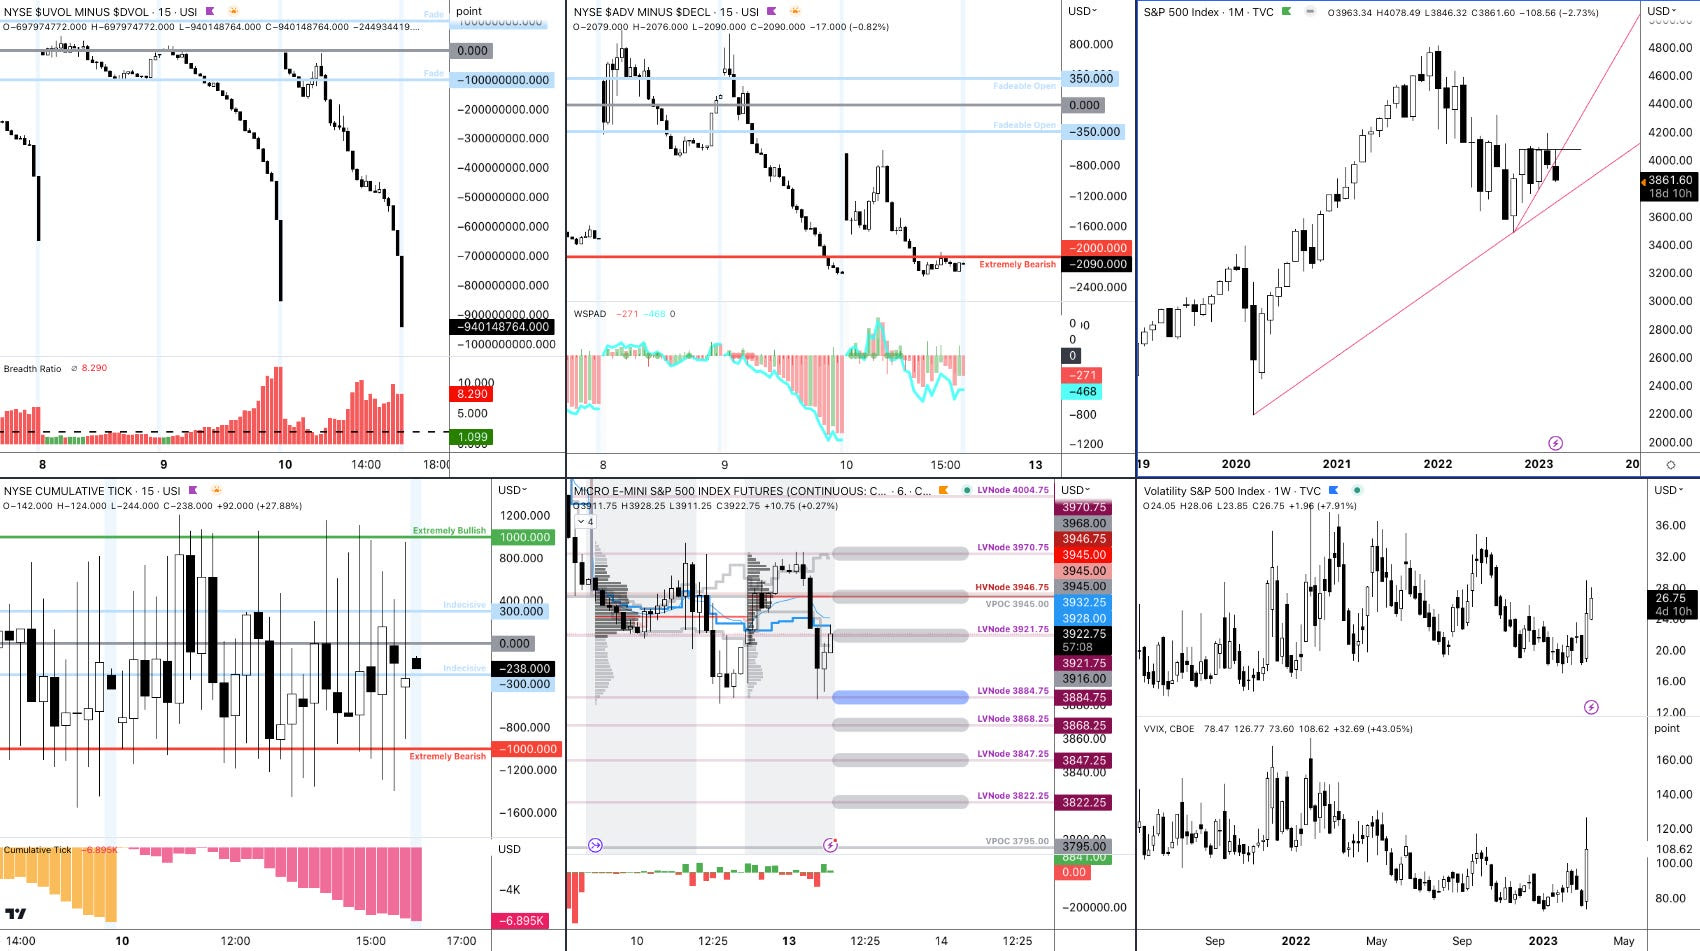
As of 6:40 AM ET, Monday’s regular session (9:30 AM – 4:00 PM ET), in the S&P 500, is likely to open in the lower part of a balanced overnight inventory, inside of the prior day’s range, suggesting a limited potential for immediate directional opportunity.
The S&P 500 pivot for today is $3,884.75.
Key levels to the upside include $3,921.75, $3,945.00, and $3,970.75.
Key levels to the downside include $3,868.25, $3,847.25, and $3,822.25.
Disclaimer: Click here to load the updated key levels via the web-based TradingView platform. New links are produced daily. Quoted levels likely hold barring an exogenous development.
Graphic: 65-minute profile chart of the Micro E-mini S&P 500 Futures (bottom middle).
Definitions
Volume Areas: Markets will build on areas of high-volume (HVNodes). Should the market trend for a period of time, this will be identified by a low-volume area (LVNodes). The LVNodes denote directional conviction and ought to offer support on any test.
If participants auction and find acceptance in an area of a prior LVNode, then future discovery ought to be volatile and quick as participants look to the nearest HVNodes for more favorable entry or exit.
POCs: Areas where two-sided trade was most prevalent in a prior day session. Participants will respond to future tests of value as they offer favorable entry and exit.
About
The author, Renato Leonard Capelj, spends the bulk of his time at Physik Invest, an entity through which he invests and publishes free daily analyses to thousands of subscribers. The analyses offer him and his subscribers a way to stay on the right side of the market.
You may view this letter’s content calendar at this link.
Disclaimer
Do not construe this newsletter as advice. All content is for informational purposes. Capelj and Physik Invest manage their own capital and will not solicit others for it.
Physik Invest’s Daily Brief is read free by thousands of subscribers. Join this community to learn about the fundamental and technical drivers of markets.
Graphic updated 7:15 AM ET. Sentiment Risk-Off if expected /MES open is below the prior day’s range. /MES levels are derived from the profile graphic at the bottom of this letter. Click here for the latest levels. SqueezeMetrics Dark Pool Index (DIX) and Gamma (GEX) with the latter calculated based on where the prior day’s reading falls with respect to the MAX and MIN of all occurrences available. A higher DIX is bullish. The lower the GEX, the more (expected) volatility. Click to learn the implications of volatility, direction, and moneyness. Breadth reflects a reading of the prior day’s NYSE Advance/Decline indicator. The CBOE VIX Volatility Index (INDEX: VVIX) reflects the attractiveness of owning volatility. UMBS prices via MND. Click here for the economic calendar.
Administrative
Yesterday’s newsletter put forth the writer’s discussion with Simplify’s Mike Green, fresh after he spoke at Exchange Miami. The letter covered a lot, albeit in a messy way, given some unforeseen obligations. Today, we clarify those narratives for you. Hopefully, you enjoy it, and take care!
Fundamental
In summary, Simplify’s Michael Green trades 60/40-looking portfolios on macroeconomic signals while using derivative exposures to reduce volatility and amplify profit potential (e.g., responding to economic data in real-time by trading options on the CME Group Inc’s [NASDAQ: CME] Eurodollar [FUTURE: /GE], a tool to express views on future interest rates).
His conversation with your letter writer covered a variety of topics including the reliability of data and what that means for his active management, derivatives trading, strength potential in markets, as well as what he’s optimistic about. Here’s what you need to know.
1 – Green explains that his preferred macro guides for decision-making are unclear. He explains that traditional adjustments “ranging from seasonality to the birth-death models used in smoothing employment reports” are in question, and he jokes that developed market data sets are approaching emerging market data sets in terms of quality.
2 – Green reflects on 2022 noting options, colloquially referred to as volatility, were a big underperformer. “One-year variance swaps or implied volatility on an at-the-money S&P 500 put option would trade somewhere in the neighborhood of 25 to 30%,” he explains. “That implies a level of daily price movement that is difficult to achieve.”
Having learned their lesson, in 2023 investors swapped long-dated volatility exposures for ones with bounded risk (e.g., Bear Put Spread) and less time to expiry (e.g., 0 DTE).
Graphic: Retrieved from Goldman Sachs Group Inc (NYSE: GS).
Though both may leave counterparties with less risk, if news shocks the market far one way, market movements may become exaggerated when investors, and counterparties accordingly, scramble to adjust their risk.
Major Wall Street players and clearing houses have, too, just announced an investigation into the risks such activity poses as well.
One options trader is making a monster bet on market volatility exploding into the summer months.
Up until now, however, the activity has manifested a push-and-pull, mean-reverting-type action; investors lean short volatility in the morning and long volatility in the afternoon which, combined, tends to mute price action.
Graphic: Retrieved from Bank of America Corporation (NYSE: BAC).
Say one morning an “investor sells call options and a dealer receives them,” Green puts forth as an example. “The dealer will hedge their long call position by selling futures which will pressure the market and result in the options prices collapsing in value.”
To re-hedge falling options prices, “dealers have to buy back their futures exposure and this pushes the markets upward. This is the pattern that’s been playing out over and over again. It’s weakness in the morning followed by strength in the afternoon.”
Though this is a very smart exposure to have, Green says volatility that’s longer-dated is cheap and, when an eventual shock occurs, its payout may more than justify its cost, particularly as the outlook for equities, bonds, and commodities further blurs.
Graphic: Retrieved from Goldman Sachs Group Inc (NYSE: GS) via The Market Ear.
3 – Despite still-robust appearing economic data, Green sees clear signs the economy is starting to deteriorate.
Graphic: Retrieved from Bloomberg. “If the unemployment data this week is very strong then you’ve got 50 basis points back on the table,” explained Bob Michele, the chief investment officer of JPMorgan Asset Management. “But that is a pretty high hurdle to get to once you’ve down-shifted to 25 basis points.”
“We’re seeing cracks in bubbles like commercial real estate” and risk assets including crypto, presently maintained by a lack of inventory or supply that’s tied up in the bankruptcy proceedings of FTX (CRYPT0: FTT) and Voyager Digital Ltd (ex-OTC: VYGVF), of all things.
Graphic: Retrieved from JPMorgan Chase & Co (NYSE: JPM) via The Market Ear. “Excess liquidity is being withdrawn at an accelerating pace.”
“The question is whether higher interest rates ultimately drive a fraction of the market into distress with forced transactions,” Green wonders, pointing to the likes of Blackstone Inc (NYSE: BX) and Brookfield Corp (NYSE: BN) handing in keys to properties. “It takes one person being in distress to set a new clearing price which, in turn, changes valuations for everybody, and makes it more difficult to qualify for things like mortgages.”
So $SVIB has $200b in assets, of which $116 are securities. About $80b of that are high quality liquid assets that could be sold or repo'd for cash. Looks good until.. pic.twitter.com/SmX1JqLg9E
4 – Looking forward, over the short-term at least, Green says inflation is likely to trend higher for longer, particularly with monetary policy inspiring fiscal action and sparking off geopolitics.
“The world’s growing materially slower and manufacturing capacity, which is spreading around the world, requires labor and investment, which could be inflationary in the short-run,” Green puts forth. Traditionally, “lower rates and costs enable added capacity and a predictable rebound in consumption. However, we’re driving a stake through the vampire’s heart, now, and … there’s the multiplier effect driving fiscal policy, too.”
Graphic: Retrieved from CME Group Inc’s (NASDAQ: CME) FedWatch Tool. The terminal (peak) rate sits at 5.50-5.75%.
5 – In response to uncertainty, investors can park cash in Treasury bonds, as well as allocate some capital to volatility “to introduce a degree of convexity,” risking only the premium paid. Alternatively, investors can take a more optimistic long view and position in innovations like artificial intelligence or next-generation energy production.
Graphic: Retrieved from Goldman Sachs Group Inc (NYSE: GS) via The Market Ear. Investors are not concerned with tail risk.
“I’m optimistic about human innovation and the rise of AI, … as well as higher energy prices creating the impetus for tremendous innovations in energy generation that have the potential to lift us out of this period of perceived scarcity if we allow ourselves to embrace it.”
Technical
As of 8:00 AM ET, Friday’s regular session (9:30 AM – 4:00 PM ET), in the S&P 500, is likely to open in the upper part of a negatively skewed overnight inventory, outside of the prior day’s range, suggesting a potential for immediate directional opportunity.
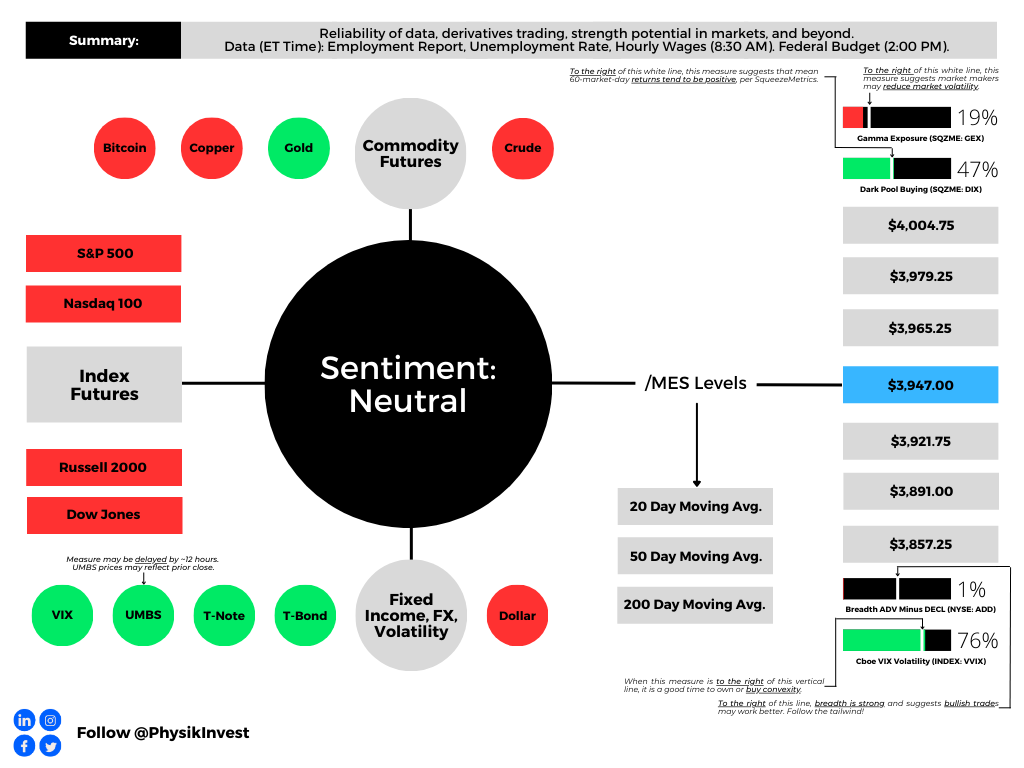
The S&P 500 pivot for today is $3,947.00.
Key levels to the upside include $3,965.25, $3,979.25, and $4,004.75.
Key levels to the downside include $3,921.75, $3,891.00, and $3,857.25.
Disclaimer: Click here to load the updated key levels via the web-based TradingView platform. New links are produced daily. Quoted levels likely hold barring an exogenous development.
Graphic: 65-minute profile chart of the Micro E-mini S&P 500 Futures (bottom middle) and market internals as taught by Peter Reznicek.
Definitions
Volume Areas: Markets will build on areas of high-volume (HVNodes). Should the market trend for a period of time, this will be identified by a low-volume area (LVNodes). The LVNodes denote directional conviction and ought to offer support on any test.
If participants auction and find acceptance in an area of a prior LVNode, then future discovery ought to be volatile and quick as participants look to the nearest HVNodes for more favorable entry or exit.
POCs: Areas where two-sided trade was most prevalent in a prior day session. Participants will respond to future tests of value as they offer favorable entry and exit.
MCPOCs: Denote areas where two-sided trade was most prevalent over numerous sessions. Participants will respond to future tests of value as they offer favorable entry and exit.
About
The author, Renato Leonard Capelj, spends the bulk of his time at Physik Invest, an entity through which he invests and publishes free daily analyses to thousands of subscribers. The analyses offer him and his subscribers a way to stay on the right side of the market.
You may view this letter’s content calendar at this link.
Disclaimer
Do not construe this newsletter as advice. All content is for informational purposes. Capelj and Physik Invest manage their own capital and will not solicit others for it.
Physik Invest’s Daily Brief is read by thousands of subscribers. You, too, can join this community to learn about the fundamental and technical drivers of markets.
Graphic updated 8:30 AM ET. Sentiment Neutral if expected /ES open is inside of the prior day’s range. /ES levels are derived from the profile graphic at the bottom of this letter. Click here for the latest levels. SqueezeMetrics Dark Pool Index (DIX) and Gamma (GEX) with the latter calculated based on where the prior day’s reading falls with respect to the MAX and MIN of all occurrences available. A higher DIX is bullish. At the same time, the lower the GEX, the more (expected) volatility. Click to learn the implications of volatility, direction, and moneyness. Breadth reflects a reading of the prior day’s NYSE Advance/Decline indicator. The CBOE VIX Volatility Index (INDEX: VVIX) reflects the attractiveness of owning volatility. UMBS price via MND. Click here for the calendar.
Fundamental
Consumer price updates (CPI) have traders pricing (even) higher rates for longer.
Yesterday’s data showed goods deflation is underway while services inflation persists. Per Unlimited’s Bob Elliott, “the picture of inflation for the Fed today is considerably less sanguine than at the last meeting.”
Graphic: Retrieved from @VincentDeluard. “The most important indices are the prices of wage-intensive services: haircuts, childcare, dentists, lawyers. With the exception of garages (crazy inflation), they all converge towards 6.5 – 7% YoY and 0.4%-0.5% MoM. That is the true long-term inflation.”
This new data confirms the hawkishness expressed by the Federal Reserve’s (Fed) Jerome Powell last week. US Treasury interest rates shifted higher, accordingly.
CME Group Inc’s (NASDAQ: CME) FedWatch Tool places the terminal rate at 5.25-5.50%, up from 5.00-5.25% on Tuesday before the CPI release. Easing is set to happen this year still in the November-December timeframe.
Graphic: Retrieved from CME Group Inc’s (NASDAQ: CME) website.
Recall “a higher interest rate environment implies a more potent” monetary tightening and heavier flow of capital out of capital markets (i.e., quantitative tightening or QT), to quote former Fed trader Joseph Wang.
The pressure from the sale of assets (e.g., USTs, MBSs) will increase interest rates and move yield-seeking market participants out of risk, hence the expectation that pressure persists on equities in 2023.
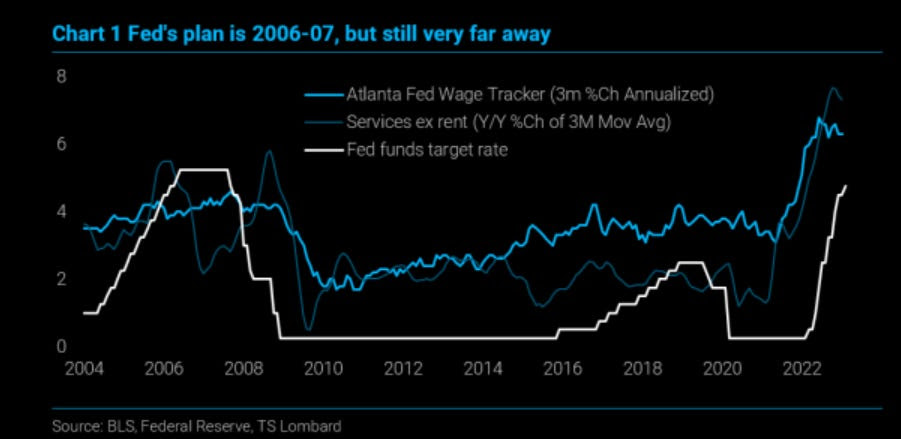
Graphic: Retrieved from TS Lombard. “Without a recession, the disinflation from the 2021 slowdown ends sometime soon, setting up for a re-acceleration later this year. Not to 8%, but high enough for the Fed to rue its choice of slowing rate hikes when it did.”
In other words, processes like QT manifest themselves as less demand for assets. Per Fabian Wintersberger, central bankers must “recycle bonds into the markets on an unprecedented scale, which could easily lead tolower bond prices/higher yields” causing a “reflux of capital to safe-haven assets, like treasuries.”
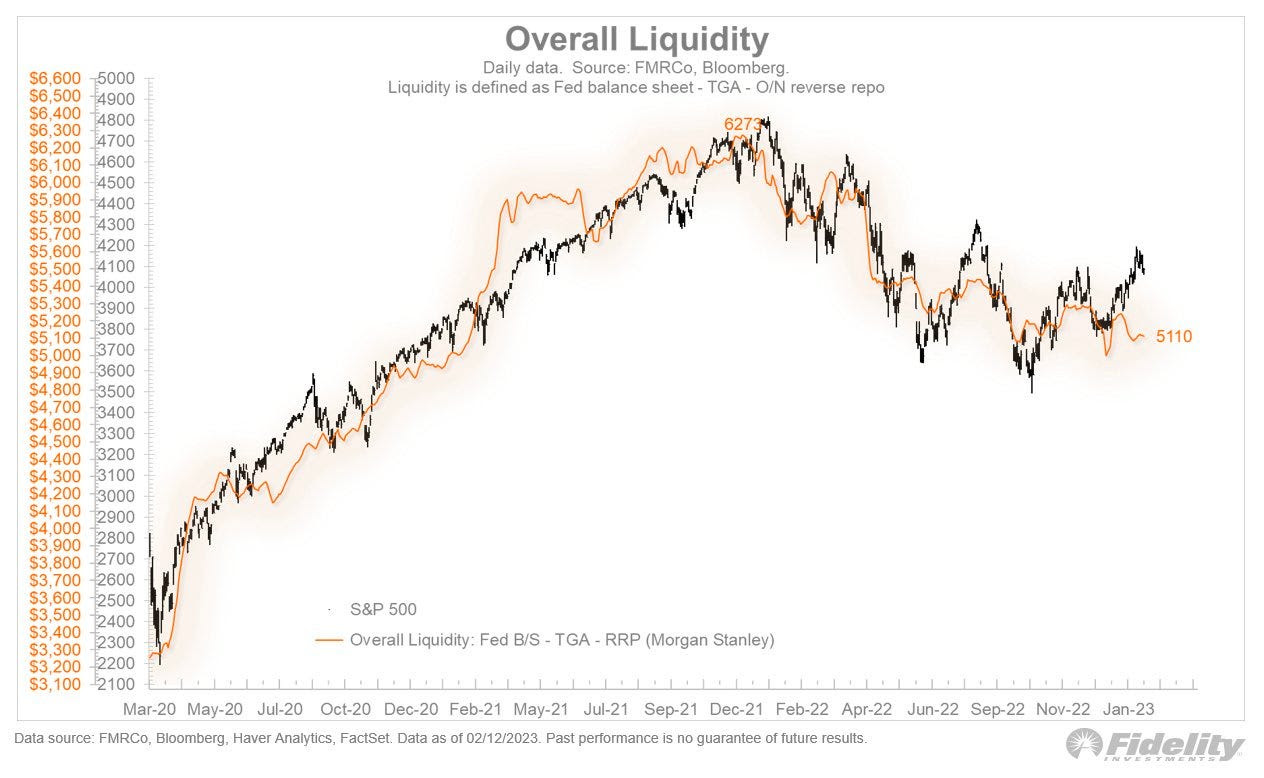
Graphic: Retrieved from Fidelity Investments. “The recent rally in stocks deviated from liquidity conditions, which have held steady but have not improved. This is just one reason to question whether there is an adequate foundation to support a new bull market.”
You can produce the above chart yourself. Fed Balance Sheet data, here. Treasury General Account Data, here. Reverse Repo data, here. NL = BS – TGA – RRP.
Moreover, the above chart which this letter has produced for you in the past and some would say is naive, shows so-called net liquidity.
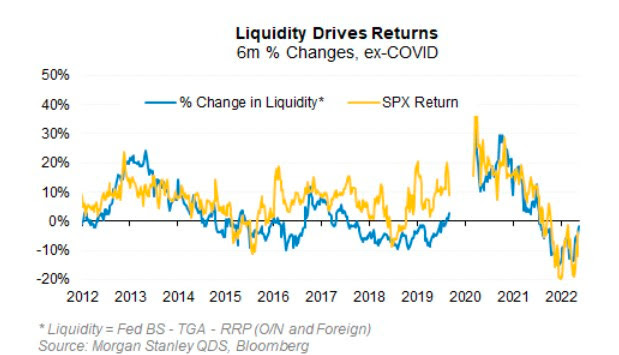
But, according to Morgan Stanley (NYSE: MS), the correlation between net liquidity and the S&P 500 (INDEX: SPX), over the past ten years is about ~0.70 and explains more than half of the movement in price-earings multiples over the past decade.
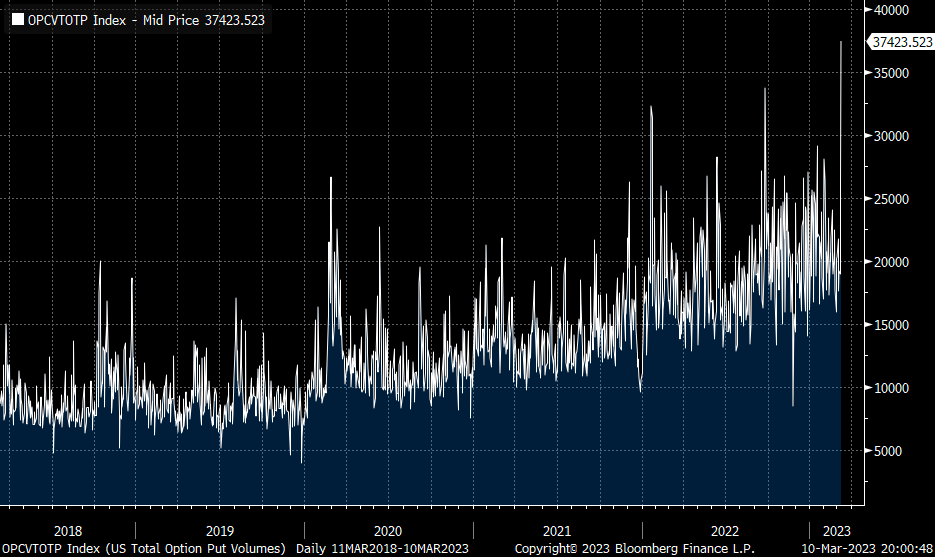
After CPI, there was short-lived relief, as this letter expected. Following CPI, weakness surfaced and measures of traders’ activity in options markets showed a bearish tilt.
Big trades that fired off include the purchase of put options expiring in March on the S&P 500 and call options expiring in May on the Cboe Volatility Index (INDEX: VIX).
The net effect is pressure on the indexes that remain well-supported and compressed heading into big options expirations (OpEx) this week, after which the door may open to enable them to move freely and in sync with their constituents, some of which, like Alphabet Inc (NASDAQ: GOOGL) (NASDAQ: GOOG), are trading rather weak.
Graphic: Retrieved from Tier1Alpha. “With implied correlation having fallen back to levels not seen since 2021, it’s notable that realized comovement shows no such improvement and instead sits near record highs. Whether this presages a violent snapback is unknowable, but certainly the conditions are in place.”
To explain, after OpEx, counterparty exposure to positive gamma (i.e., positive exposure to movement hedged in a way that reduces movement) will decline and “leave markets more at the whim of macro-type repositioning”; counterparties will do less to disrupt and more to bolster (i.e., add to movement). For how to trade (or how these events impact trades), see this case study by Physik Invest.
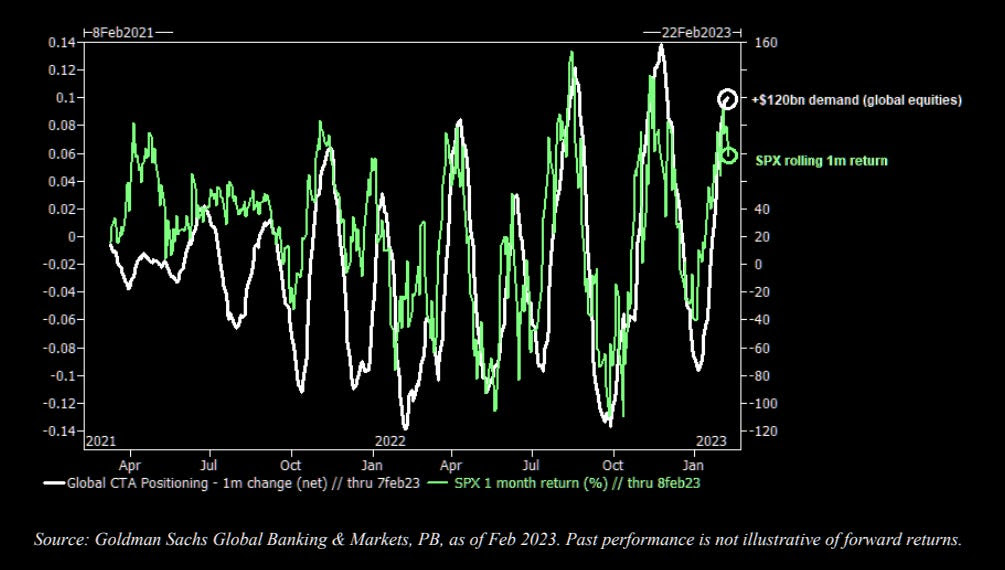
Should there be a large break lower, then “convexity could become an issue,” The Market Ear explained in a statement quoting Goldman Sachs Group Inc (NYSE: GS). “Inflecting CTA flow could translate to an approximately 20% sell-off in US equities over a month in a down-tape scenario.”
Graphic: Retrieved from Goldman Sachs Group Inc (NYSE: GS).
Technical
As of 7:30 AM ET, Wednesday’s regular session (9:30 AM – 4:00 PM ET), in the S&P 500, is likely to open in the lower part of a negatively skewed overnight inventory, inside of the prior day’s range, suggesting a limited potential for immediate directional opportunity.
The S&P 500 pivot for today is $4,136.25.
Key levels to the upside include $4,147.00, $4,159.00, and $4,168.75.
Key levels to the downside include $4,122.75, $4,104.25, and $4,083.75.
Disclaimer: Click here to load the updated key levels via the web-based TradingView platform. New links are produced daily. Quoted levels likely hold barring an exogenous development.
Graphic: 65-minute profile chart of the Micro E-mini S&P 500 Futures.
Definitions
Volume Areas: Markets will build on areas of high-volume (HVNodes). Should the market trend for a period of time, this will be identified by a low-volume area (LVNodes). The LVNodes denote directional conviction and ought to offer support on any test.
If participants auction and find acceptance in an area of a prior LVNode, then future discovery ought to be volatile and quick as participants look to the nearest HVNodes for more favorable entry or exit.
POCs: Areas where two-sided trade was most prevalent in a prior day session. Participants will respond to future tests of value as they offer favorable entry and exit.
About
The author, Renato Leonard Capelj, works in finance and journalism.
Capelj spends the bulk of his time at Physik Invest, an entity through which he invests and publishes free daily analyses to thousands of subscribers. The analyses offer him and his subscribers a way to stay on the right side of the market. Separately, Capelj is an options analyst at SpotGamma and an accredited journalist.
Physik Invest’s Daily Brief is read by thousands of subscribers. You, too, can join this community to learn about the fundamental and technical drivers of markets.
Graphic updated 8:05 AM ET. Sentiment Risk-On if expected /ES open is above the prior day’s range. Click here for the latest levels. SqueezeMetrics Dark Pool Index (DIX) and Gamma (GEX) with the latter calculated based on where the prior day’s reading falls with respect to the MAX and MIN of all occurrences available. A higher DIX is bullish. At the same time, the lower the GEX, the more (expected) volatility. Click to learn the implications of volatility, direction, and moneyness. Breadth reflects a reading of the prior day’s NYSE Advance/Decline indicator. The CBOE VIX Volatility Index (INDEX: VVIX) reflects the attractiveness of owning volatility. UMBS price via MND. Click here for the calendar.
Fundamental
Companies are slowing price increases,
The Transcript, quoting earnings calls, shared with subscribers. Notwithstanding, consumer spending still reads strong. Mastercard Inc (NYSE: MA) measured ~9% growth in spending last month, and this points to the presence of inflation in the system that needs to be worked out.
Consequently, Federal Reserve (Fed) officials maintain that “more needs to be done”, and this is evident in traders’ guesses as to where rates peak (i.e., terminal rate), and when the eventual reduction in rates is set to occur (i.e., easing).
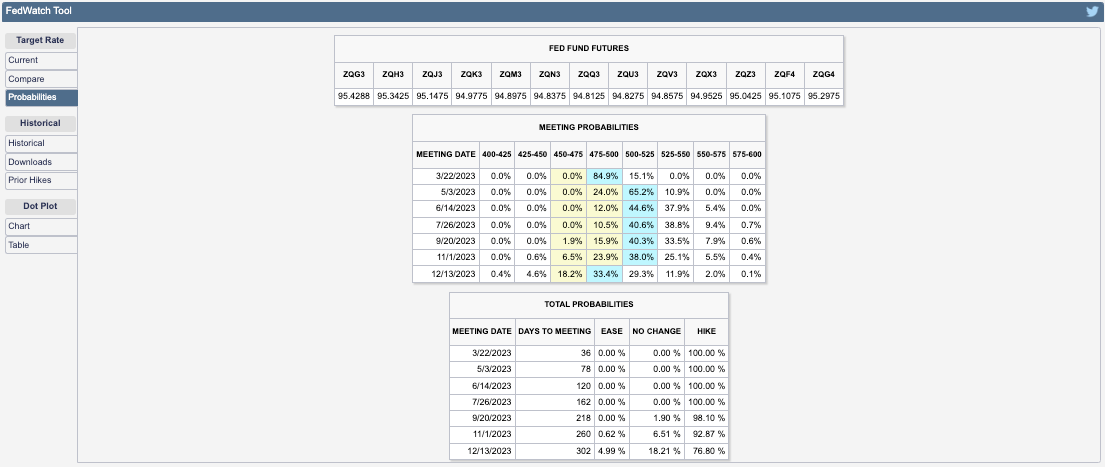
The free CME Group Inc (NASDAQ: CME) FedWatch Tool shows rates peaking in the 5.00-5.25% range through November. Then, in December, traders price a move back to the 4.75-5.00% range where we are now.
Graphic: Retrieved from CME Group Inc’s (NASDAQ: CME) Fedwatch Tool.
This is the pricing is in anticipation of rising consumer prices; the Consumer Price Index (CPI) due at 8:30 AM ET, is set to rise 0.5% in January, the most in a few months. Core CPI, which matters a lot to the Fed, is set to advance by about 0.4%.
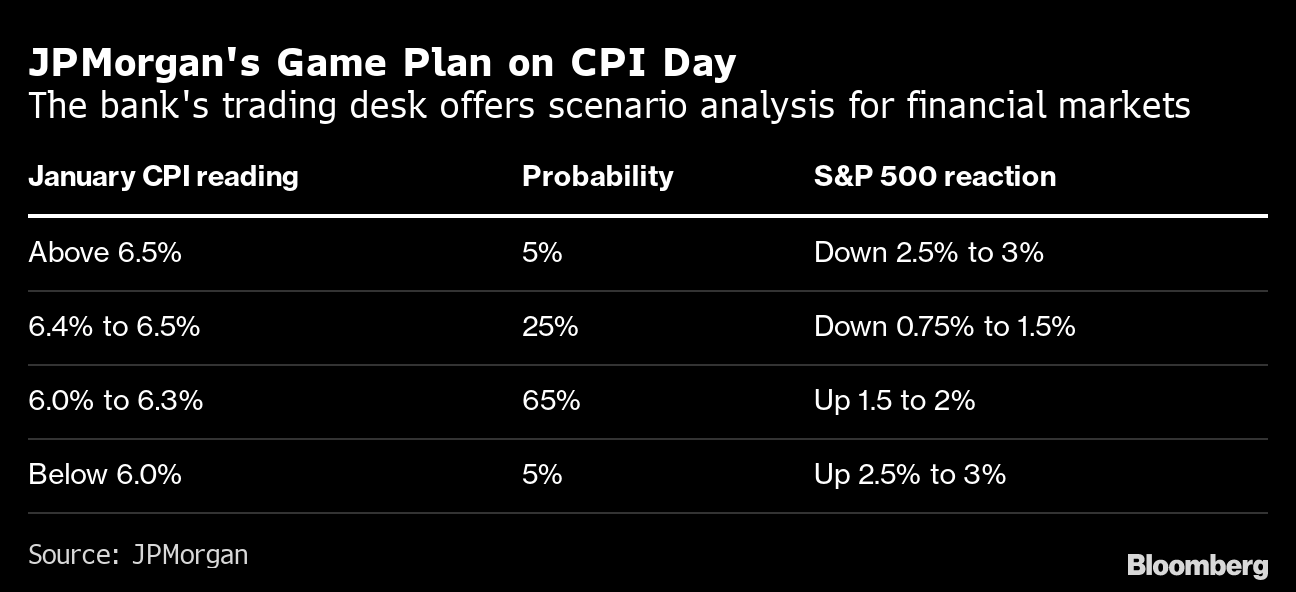
JPMorgan Chase & Co (NYSE: JPM) thinks that “data close to estimates would be treated as confirming a continued cooling in inflation, which would imply a fall for bond yields and the dollar, while tech shares would lead an advance for US stocks.”
“But, anyequitygains are likely to fade, [JPM] warned, ‘once investors shift attention to a relatively slower pace of disinflation than the previous two months, where each CPI print saw a decrease of 60 basis points.’”
So in-line CPI, coupled with a strong January jobs report, will “corroborate recent comments from Fed officials that further interest-rate hikes are likely forthcoming,” Bloomberg adds. In a post by Joseph Wang, a former Fed trader, “a higher interest rate environment implies a more potent [quantiative tightening or] QT.”
“The Fed’s aggressive hikes have yet to reach the bulk of bank deposits, which is the foundational financial asset for many households. These deeply negative real yields may be extending the portfolio rebalancing impact of QE. Some households have escaped financial repression by moving into Treasury bills or money market funds, but that is not the only refuge. The perceived return of risk assets likely remains high for many, as the memory of the 2021 boom is still fresh.” Further, a “sizable yield upgrade being forced onto the market may indicate a more impactful QT.”
QT, to put it simply, is the flow of capital out of capital markets. Higher rates for longer and more QT arenot good for risk assets. Though money is flowing from other parts of the world, which, in part, has bolstered buying of assets over the past months, accelerating “QT shifts the composition of financial assets towards those that better reflect the Fed’s restrictive stance.”
Positioning
In the post-CPI expirations, implied volatility (IVOL), a demonstration of traders’ fears and demands for protection, is wound and is likely to serve as a catalyst for a fast move after CPI. Should fears be assuaged (i.e., barring the unexpected), wound volatility is likely to compress and this may result in a short-term market boost.
However, the sale and expiry of protection, after CPI and particularly the coming options expiration (OpEx), is likely to put the market in a precarious position.
According to SpotGamma, “current positioning, a result of re-grossing over the past weeks and months, has boosted dealer exposure to positive gamma.” This means counterparties (i.e., dealers) make money when the market moves and hedge in a manner that reduces volatility, “hence more rangebound trade as we have seen.”
Following OpEx, counterparty exposure to positive gamma will decline and “leave markets more at the whim of macro-type repositioning” which counterparties will do less to disrupt and more to bolster (i.e., add to movement).
Therefore, as SpotGamma summarizes, “[b]e prepared for potential relief immediately after CPI. However, across a longer time horizon, there is potential for weakness and that weakness may be exacerbated by dealer hedging.”
Technical
As of 7:15 AM ET, Tuesday’s regular session (9:30 AM – 4:00 PM ET), in the S&P 500, is likely to open in the upper part of a balanced overnight inventory, outside of the prior day’s range, suggesting a potential for immediate directional opportunity.
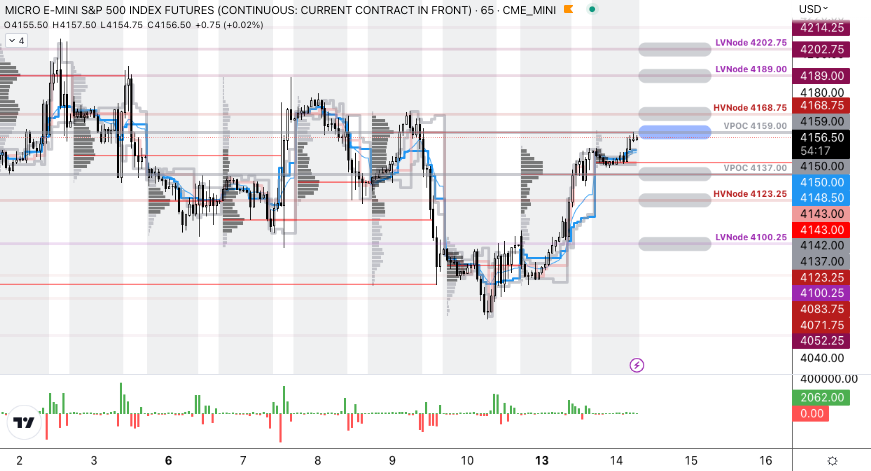
The S&P 500 pivot for today is $4,159.00.
Key levels to the upside include $4,168.75, $4,189.00, and $4,202.75.
Key levels to the downside include $4,137.00, $4,123.25, and $4,100.25.
Disclaimer: Click here to load the updated key levels via the web-based TradingView platform. New links are produced daily. Quoted levels likely hold barring an exogenous development.
Graphic: 65-minute profile chart of the Micro E-mini S&P 500 Futures.
Definitions
Volume Areas: Markets will build on areas of high-volume (HVNodes). Should the market trend for a period of time, this will be identified by a low-volume area (LVNodes). The LVNodes denote directional conviction and ought to offer support on any test.
If participants auction and find acceptance in an area of a prior LVNode, then future discovery ought to be volatile and quick as participants look to the nearest HVNodes for more favorable entry or exit.
POCs: Areas where two-sided trade was most prevalent in a prior day session. Participants will respond to future tests of value as they offer favorable entry and exit.
About
The author, Renato Leonard Capelj, works in finance and journalism.
Capelj spends the bulk of his time at Physik Invest, an entity through which he invests and publishes free daily analyses to thousands of subscribers. The analyses offer him and his subscribers a way to stay on the right side of the market. Separately, Capelj is an options analyst at SpotGamma and an accredited journalist.