Physik Invest’s Daily Brief is read free by thousands of subscribers. Join this community to learn about the fundamental and technical drivers of markets.

Fundamental
Some big ideas/themes to mull as we leg into this week’s letters. Have a great day!
Investors are facing a big adjustment as a consequence of post-pandemic geopolitics and the race for control of physical things. Typical responses, like adjusting demands structurally to meet supply, are no longer optimal. Bailouts and zero-interest policies are what entered us into this cycle of inflation and geopolitical instability. What’s more optimal are fiscally-funded policies.
“The outcome of [quantitative easing or QE] was obvious and inevitable,” economist Dr. Pippa Malmgren explained in a letter. “The decline of interest rates to nothing and the return of inflation … destabilize[d] emerging markets and cause[d] governments to race for control over supply chains of food and energy.” As Credit Suisse Group’s (NYSE: CS) Zoltan Pozsar said in December, “whoever encumbers commodities and controls the factories rules inflation, whoever rules inflation controls interest rates, and whoever controls interest rates controls the level of the stock market and financial wealth more generally.”
Accordingly, policymakers’ new way to push cash into the economy is defense spending. Malmgren explained that this new fiscally funded QE if we will, is not subject to audits and falls under the guise of “civilian tech” innovation which “we are seeing the results of” in the air, space, and sea. Take, for instance, headlines on undersea internet cable and gas line disruptions, as well as the likes of Amazon Inc (NASDAQ: AMZN) and Starlink heading to space to provide satellite-based WiFi (which can be used for “strategic support” during operations), and China pulling satellites out of orbit.
“[W]e cannot see what’s going on in the graveyard of space,” Malmgren added, noting that the 200-foot balloons drifting over the West reveal the US is “already at war” and knocks the notion leaders “could be at war without the public needing to know about it.” China understands what Malmgren called leverage ratios. Flyovers with jets may work in Taiwan but not in the US. It “would invite an overwhelming response, … [while] balloons seem so innocuous,” just as the Japanese Sky Lanterns appeared during WWII, Malmgren detailed in another letter. In the Sky Lantern case, though many of the balloons “were found unexploded,” some blew; one took out power to “the very nuclear reactor that happened to generate the plutonium that would later be used in the Nagasaki nuclear bomb.”
Perhaps the Chinese balloons are intended to deliver payloads and, “like in the 1940s, we are already at such an advanced stage of confrontation amongst the superpowers that the job of the military is not so much to respond to the balloons as it is to prevent public panic.” As validation, one may look to the very little alarm over military activities in the Pacific, as well as “China and the US … trying to move on from the [balloon] dispute,” Bloomberg reported last week.
“It is as if the Western military establishment learned a great lesson from having underestimated President Putin” who just suspended the New START treaty with the US. Now, with reports that China is readying for an attack on Taiwan by 2027, the US “has shifted from holding exercises to engaging in mission rehearsals … [which] increase confidence in the twenty-year-olds who will be actually conducting warfighting.”
Anyways, a product of “The Invisible War,” as Malmgren calls it, is this painful divorce and will intensify the decoupling after the world hit a “limit of economic integration in 2006 or 2007,” Noah Smith put in a recent letter. With estimates that two years of global GDP growth could be wiped by a decoupling, Smith added, “we should be thinking about how to shape the next wave of globalization in a way that encourages global economic growth while also providing security to ourselves and our allies.” Malmgren ends: “The markets won’t like all this.”
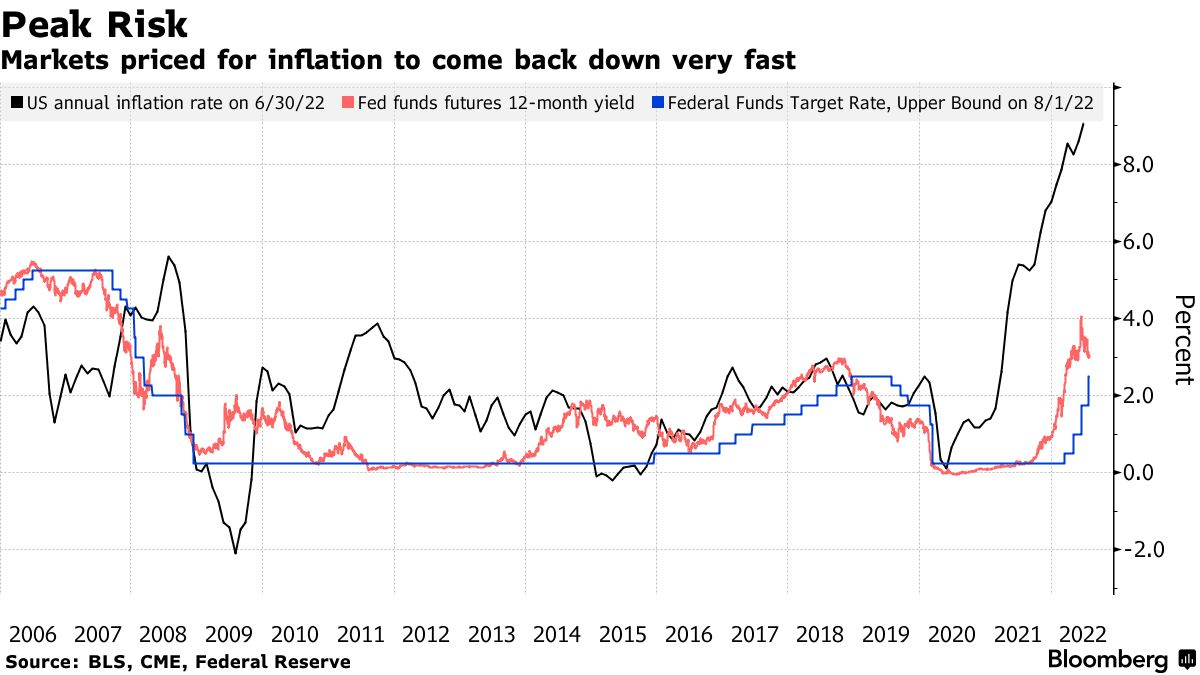
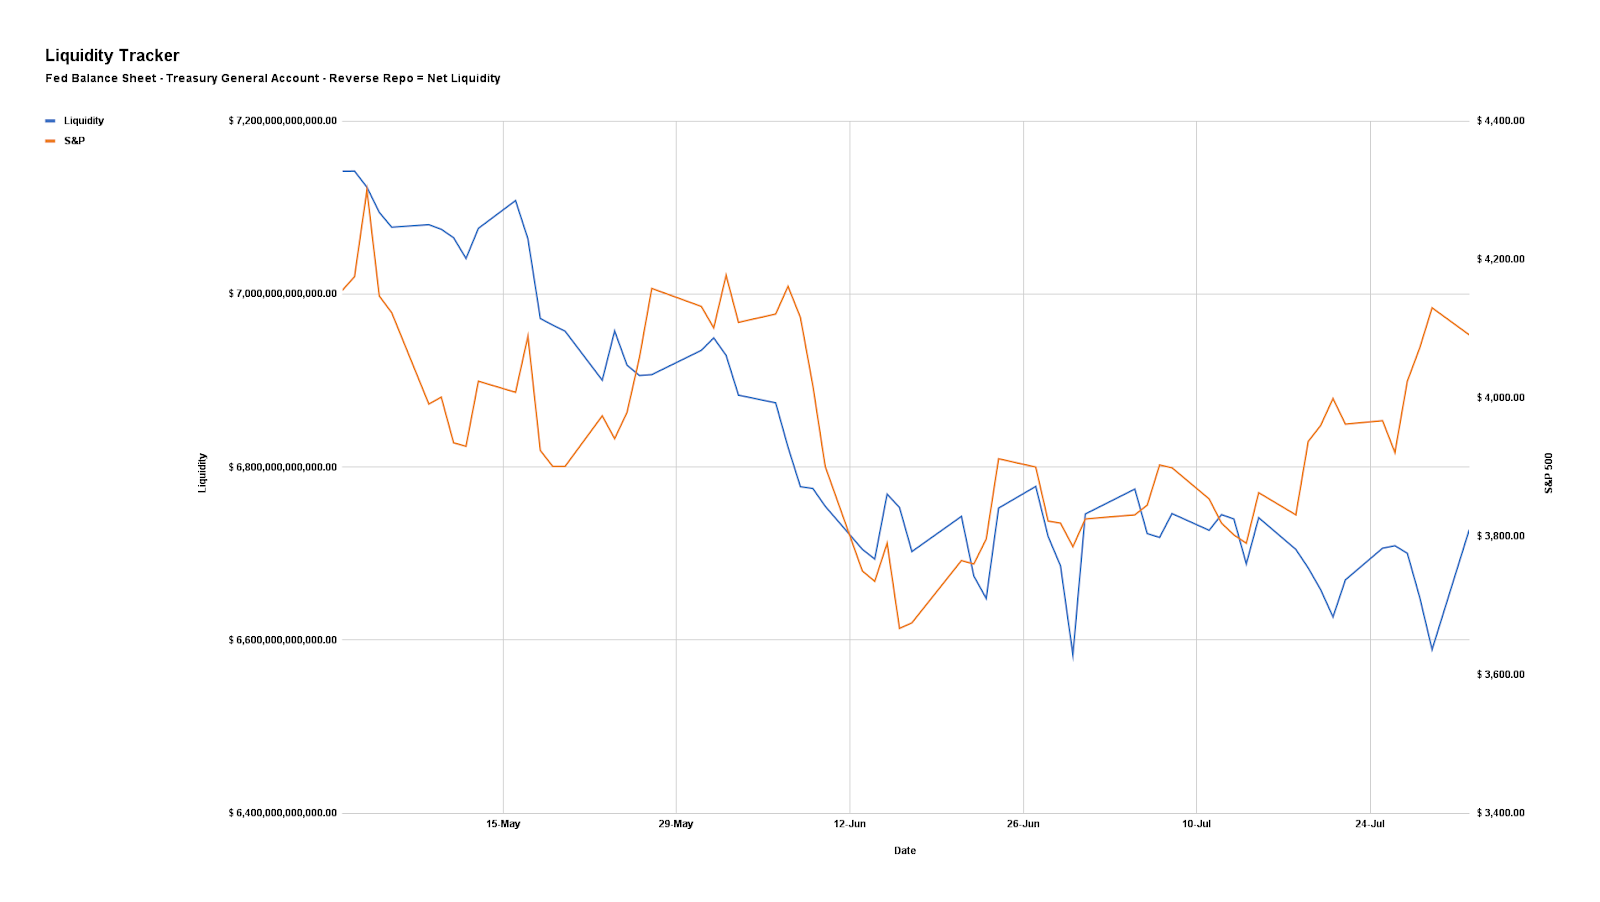
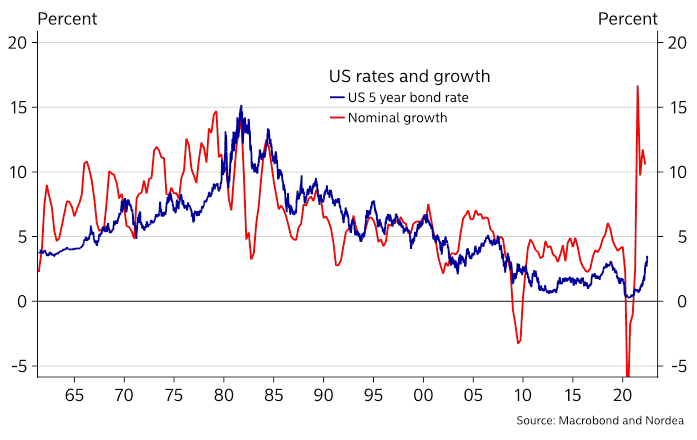
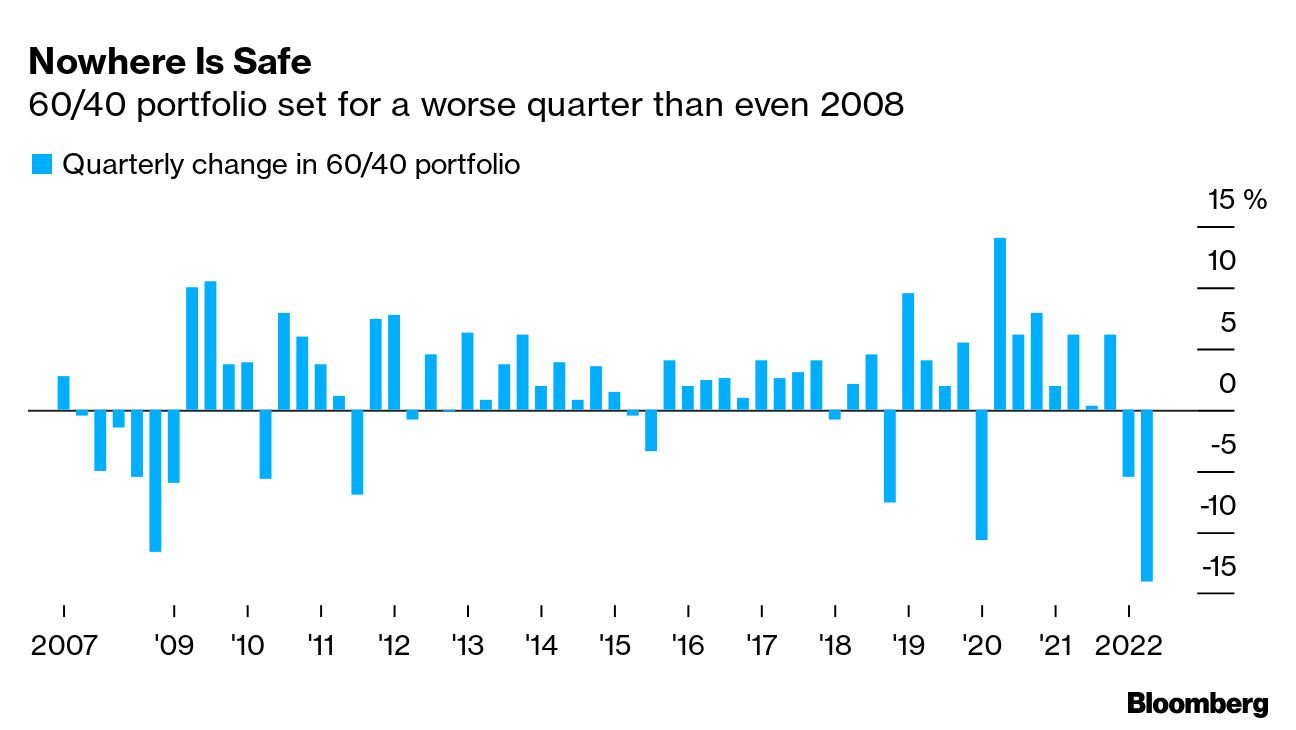
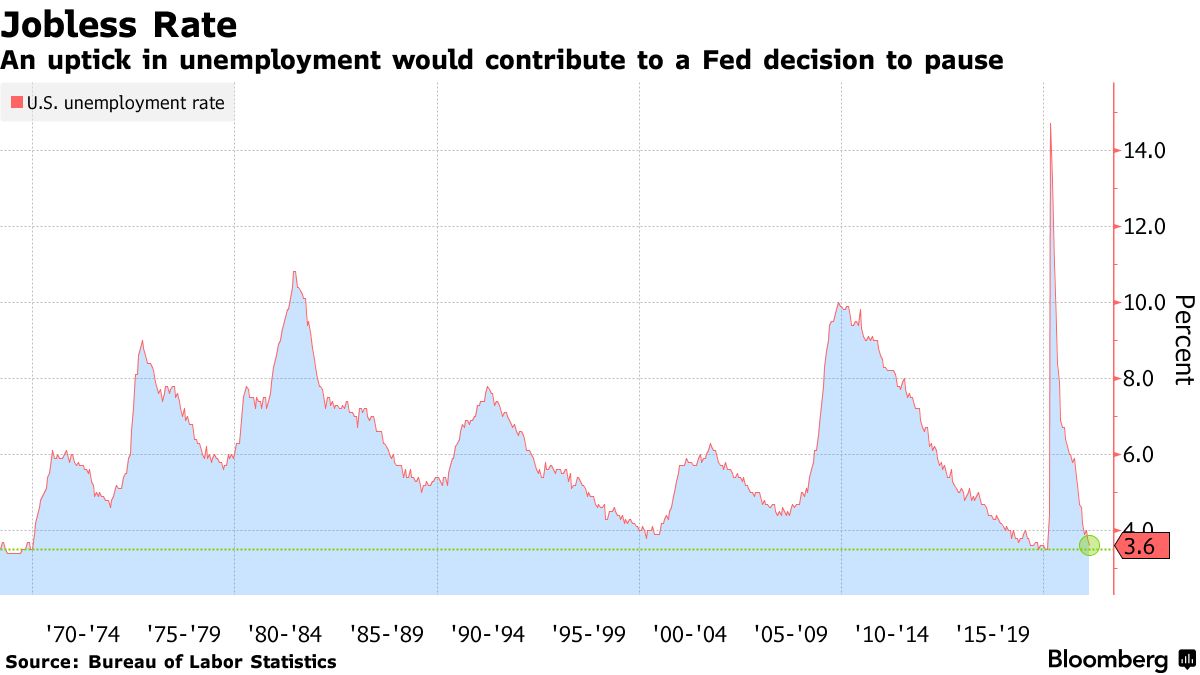
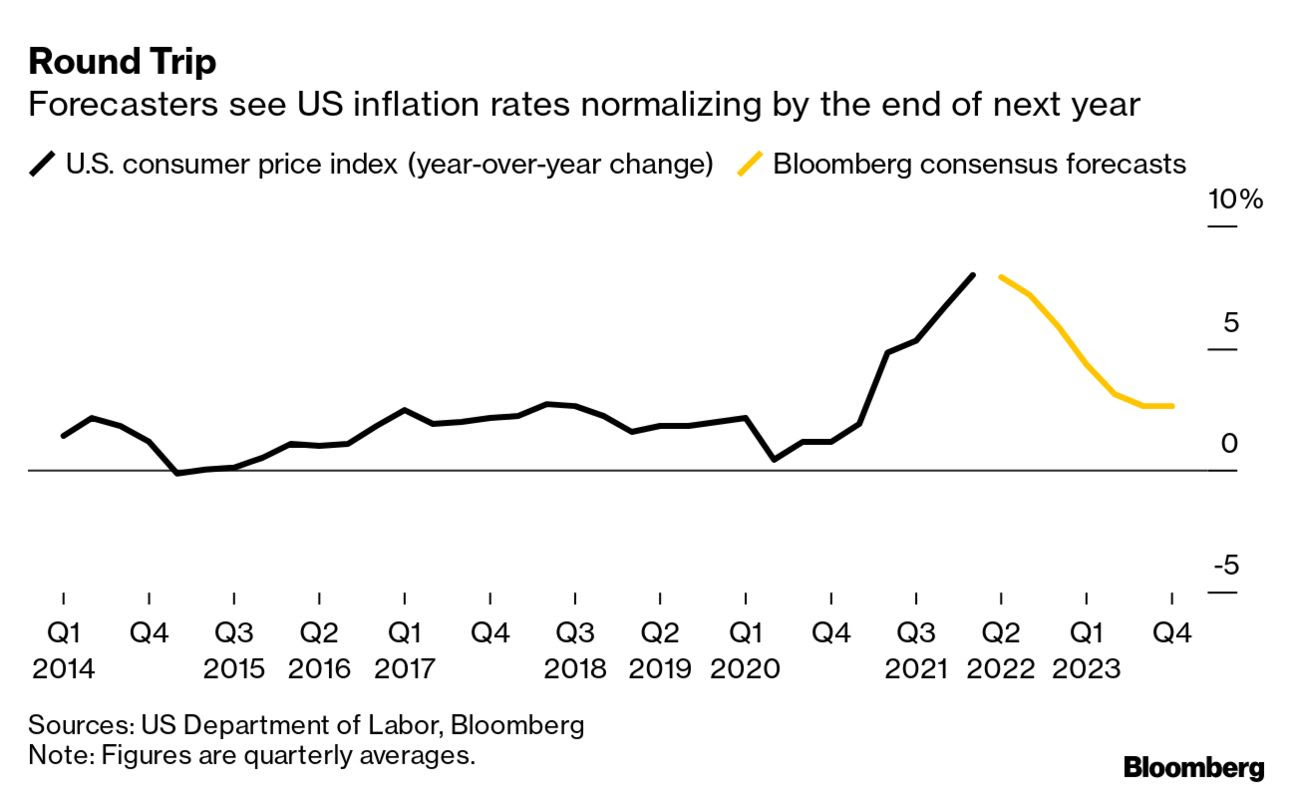
Though there may be a dip in inflation in the interim resulting in a pivot and relief in markets, the prospects of inflation resurfacing, potentially with vengeance, are up, and this has negative implications on traditional portfolio constructions as this letter started with, today. Therefore, investors should consider adding exposure to cash, bonds, and commodities, as this letter quoted Pozsar explaining before.
Technical
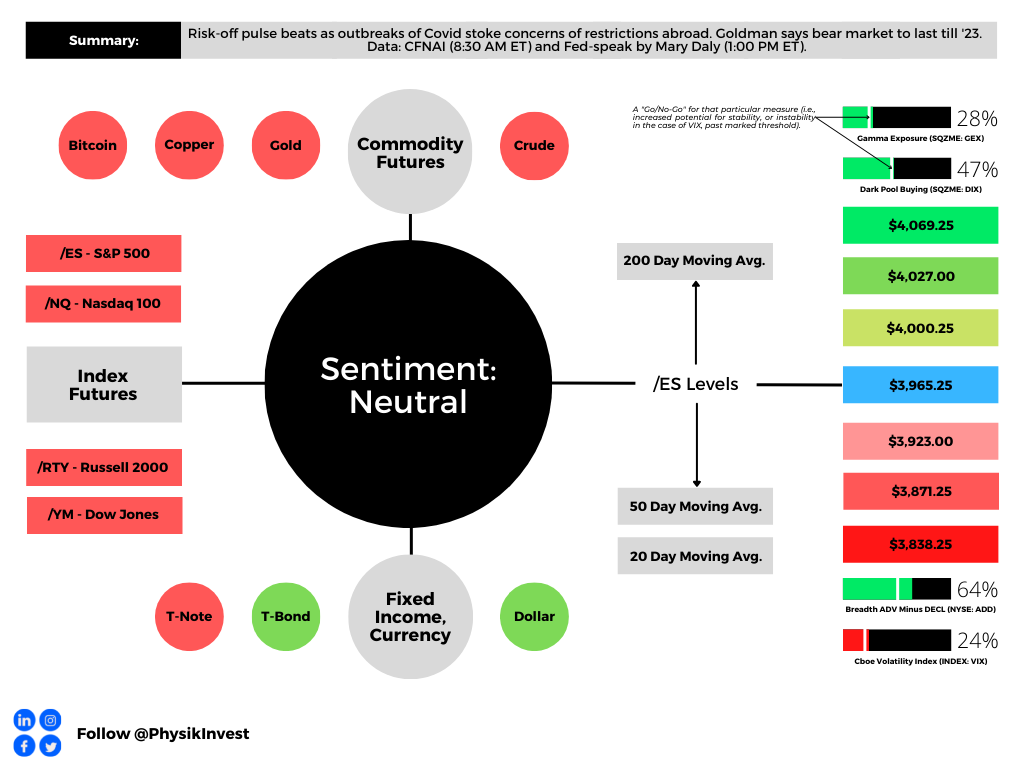
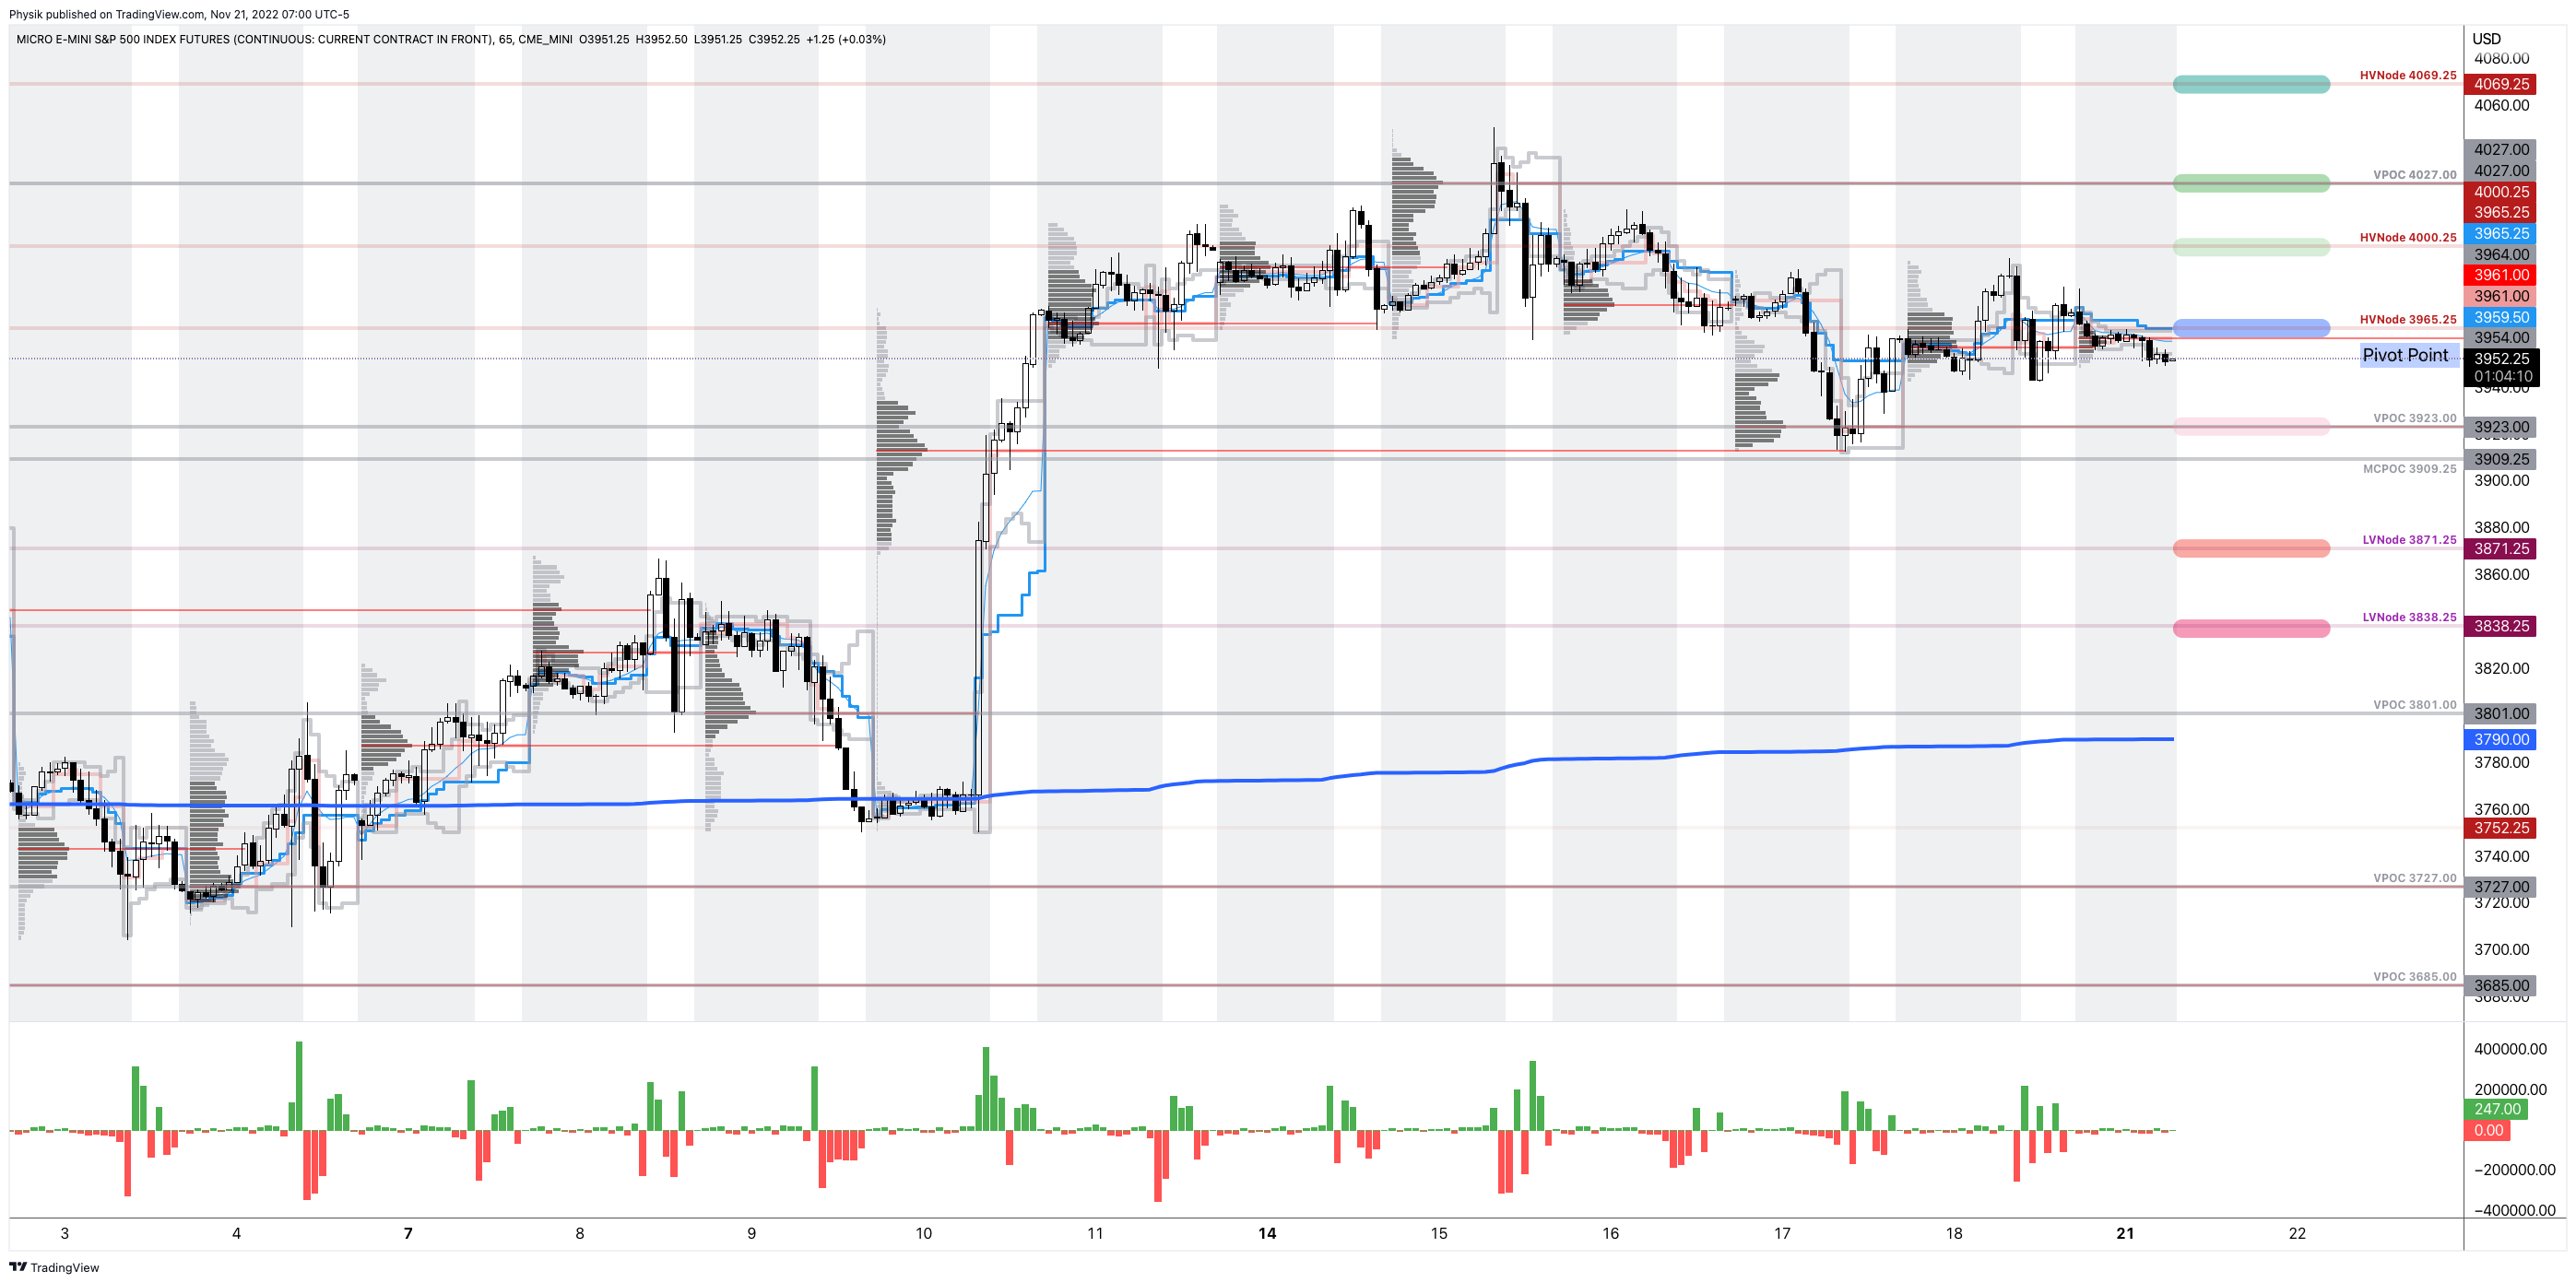
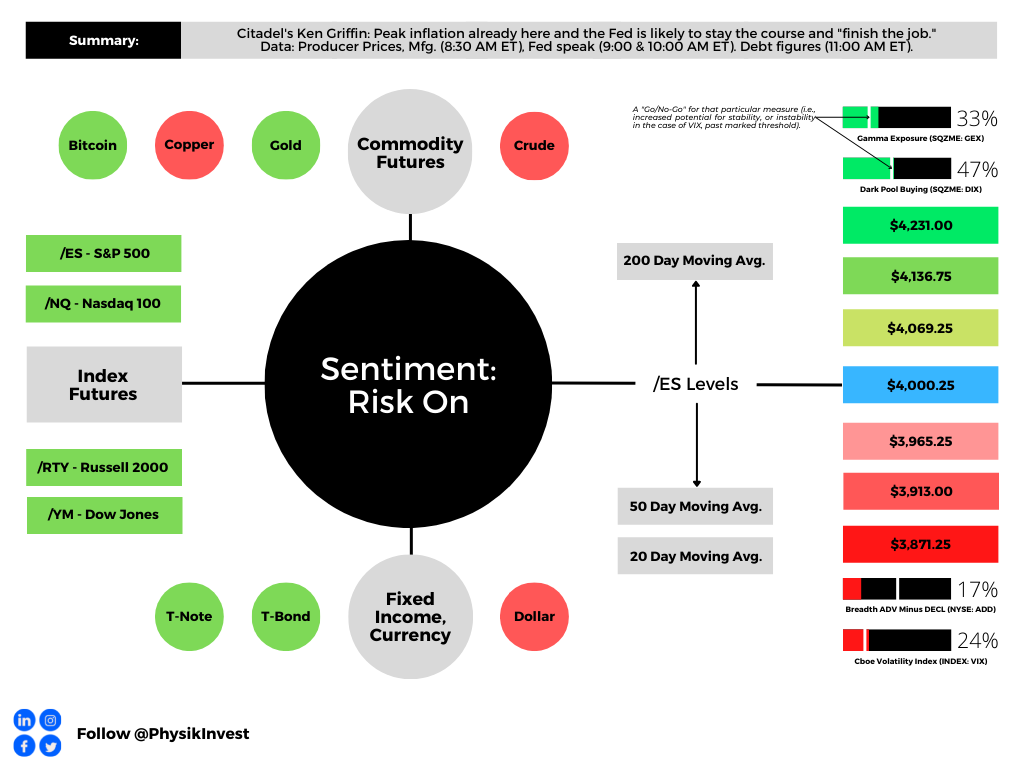
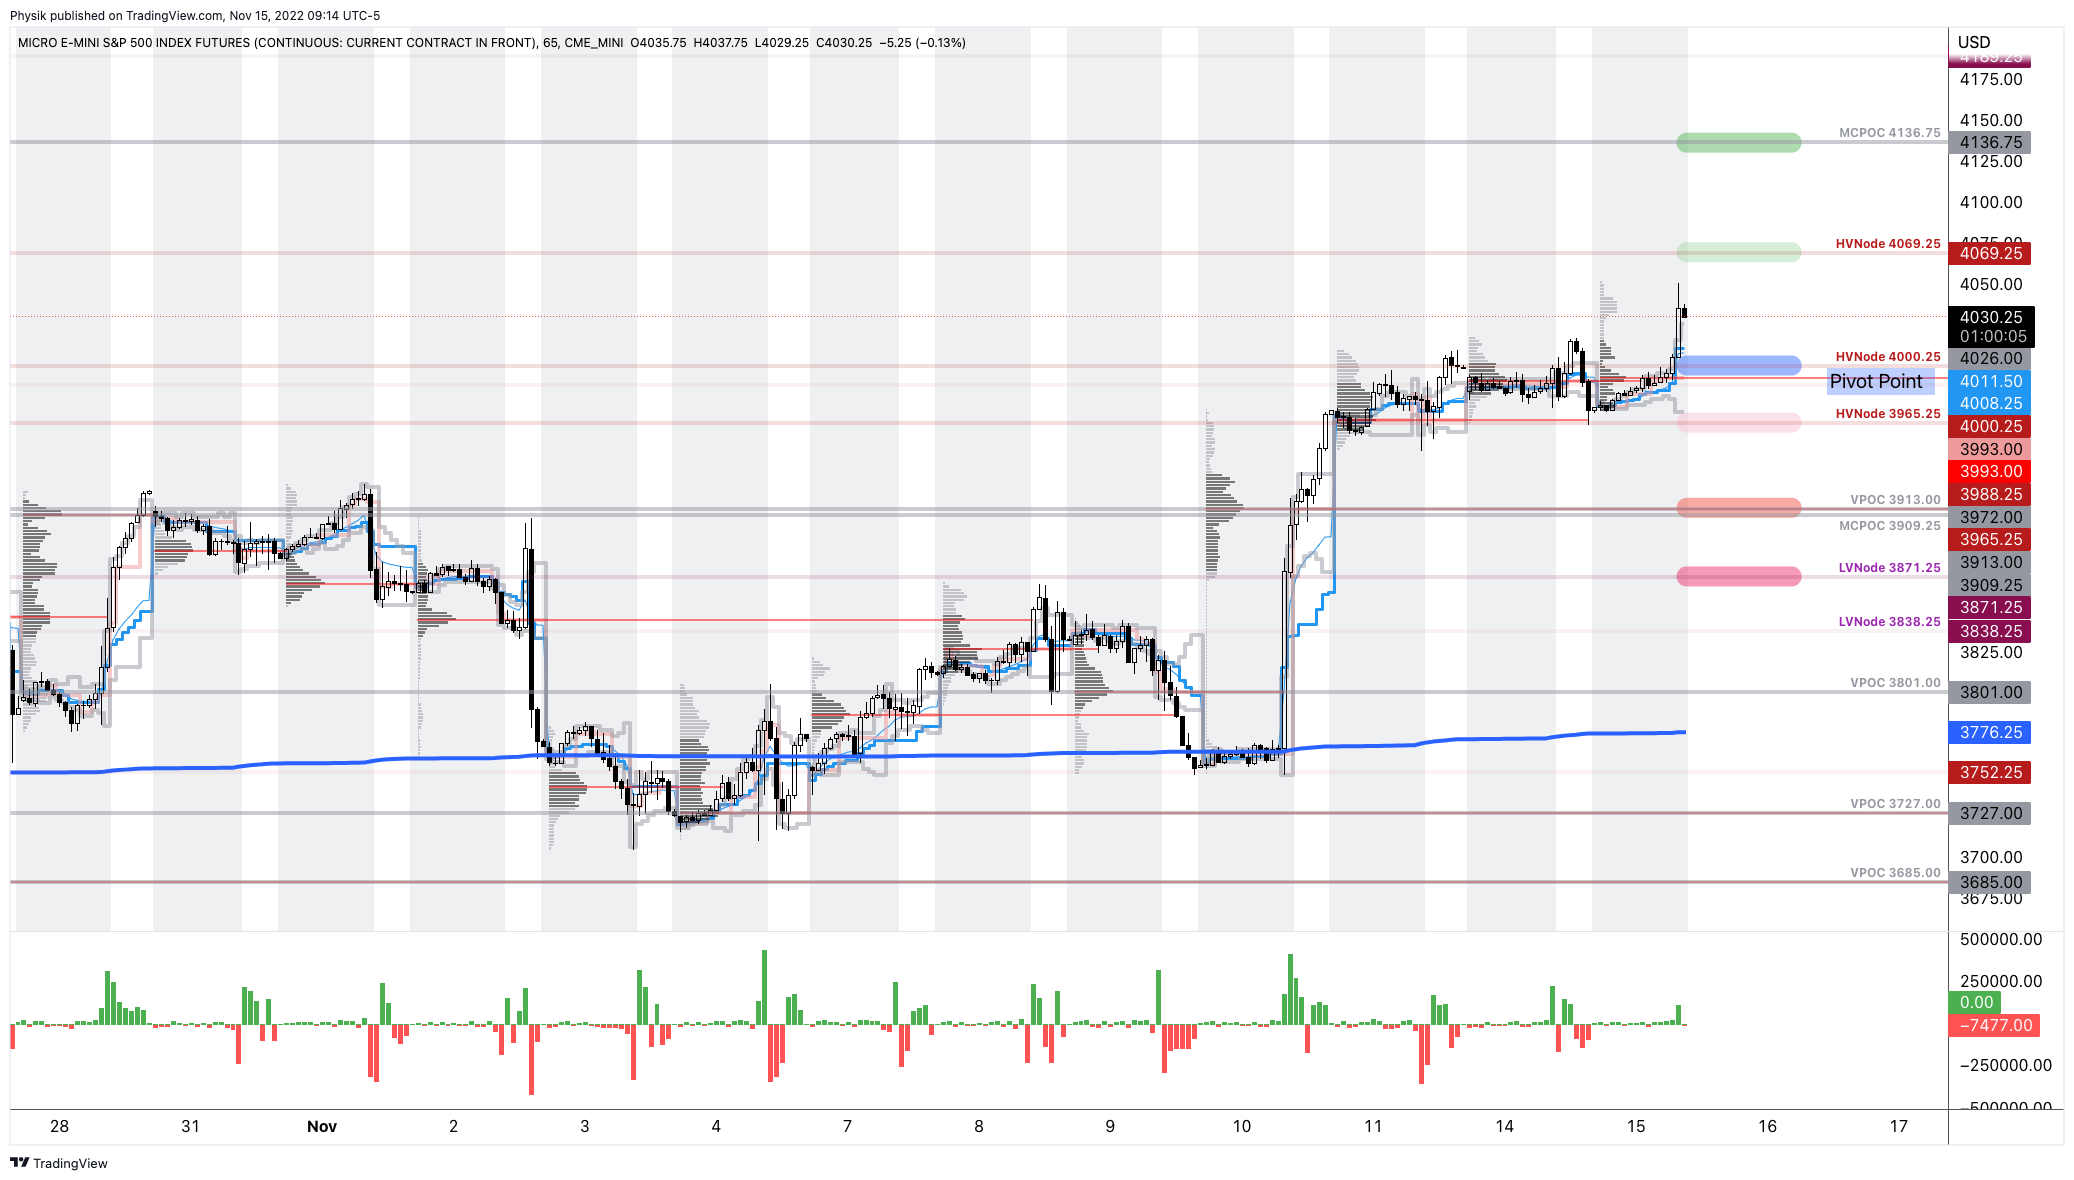
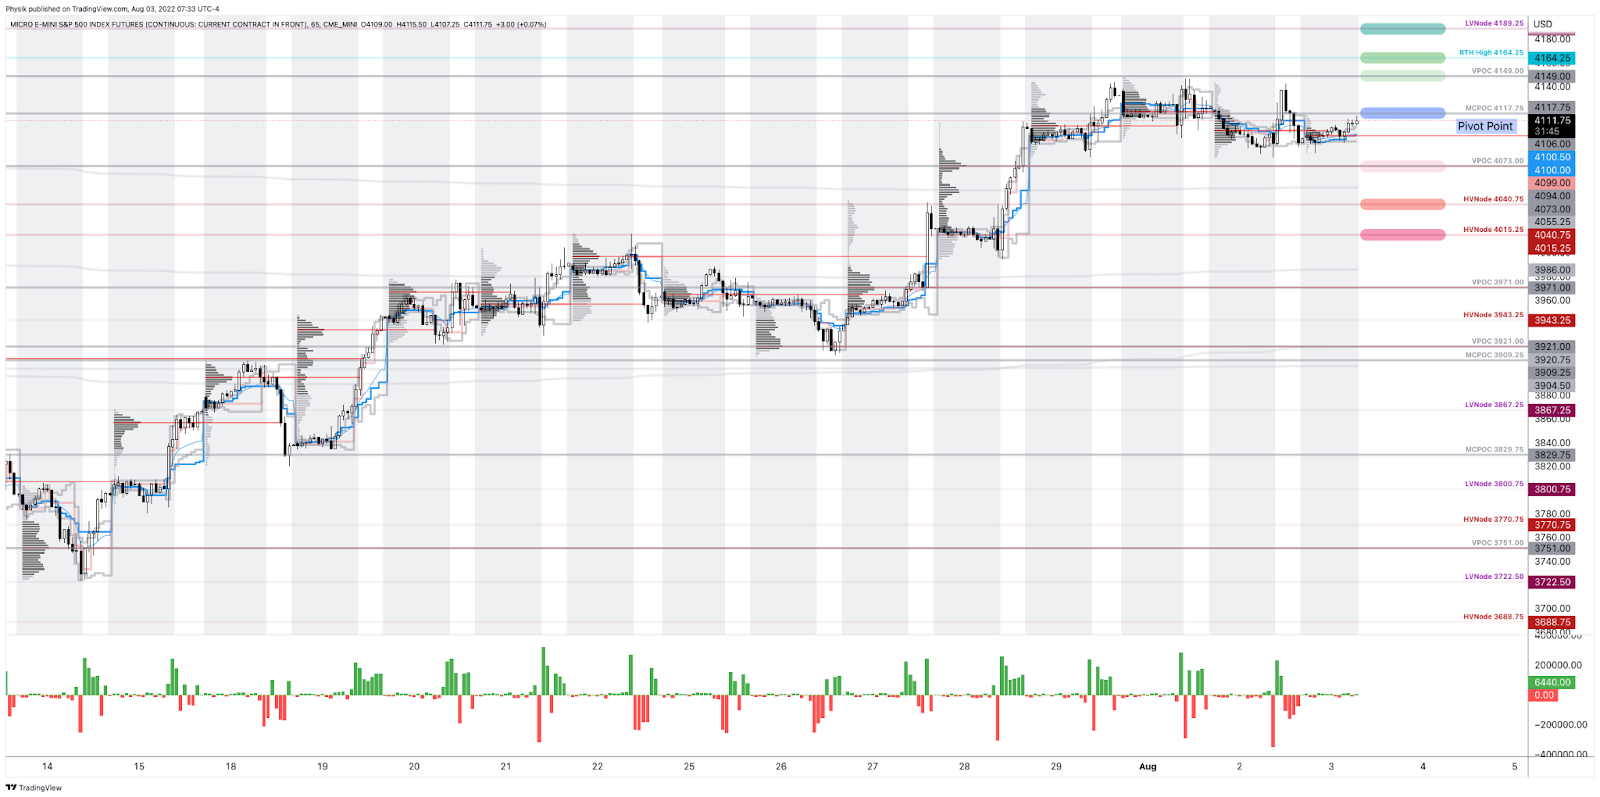
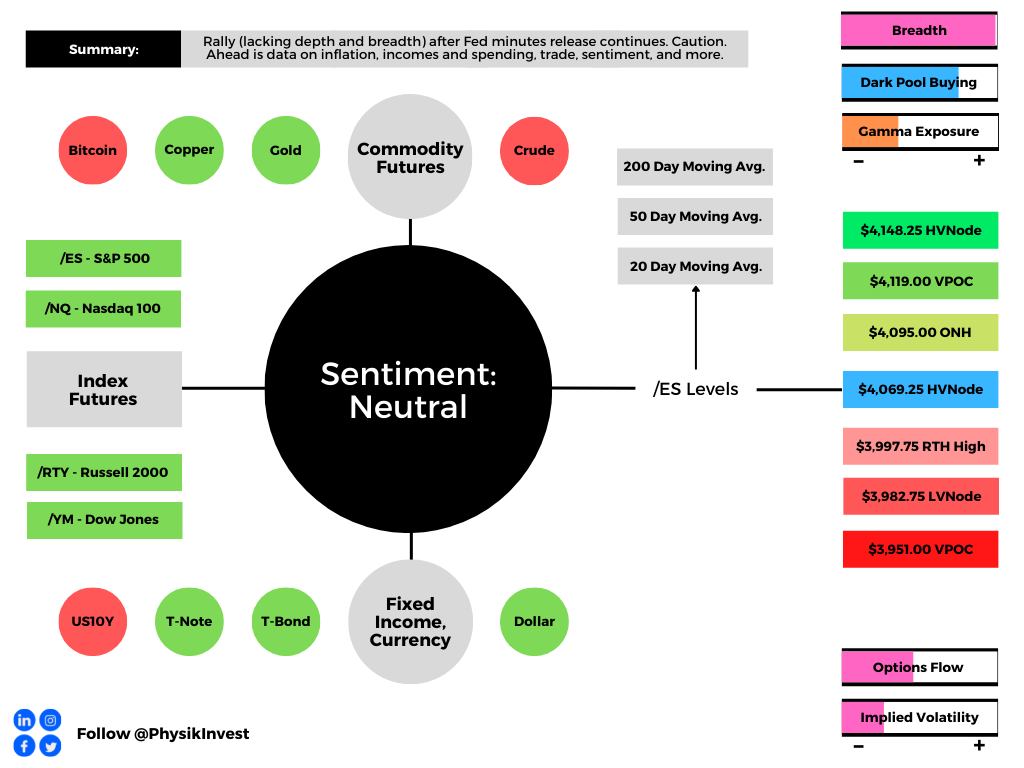
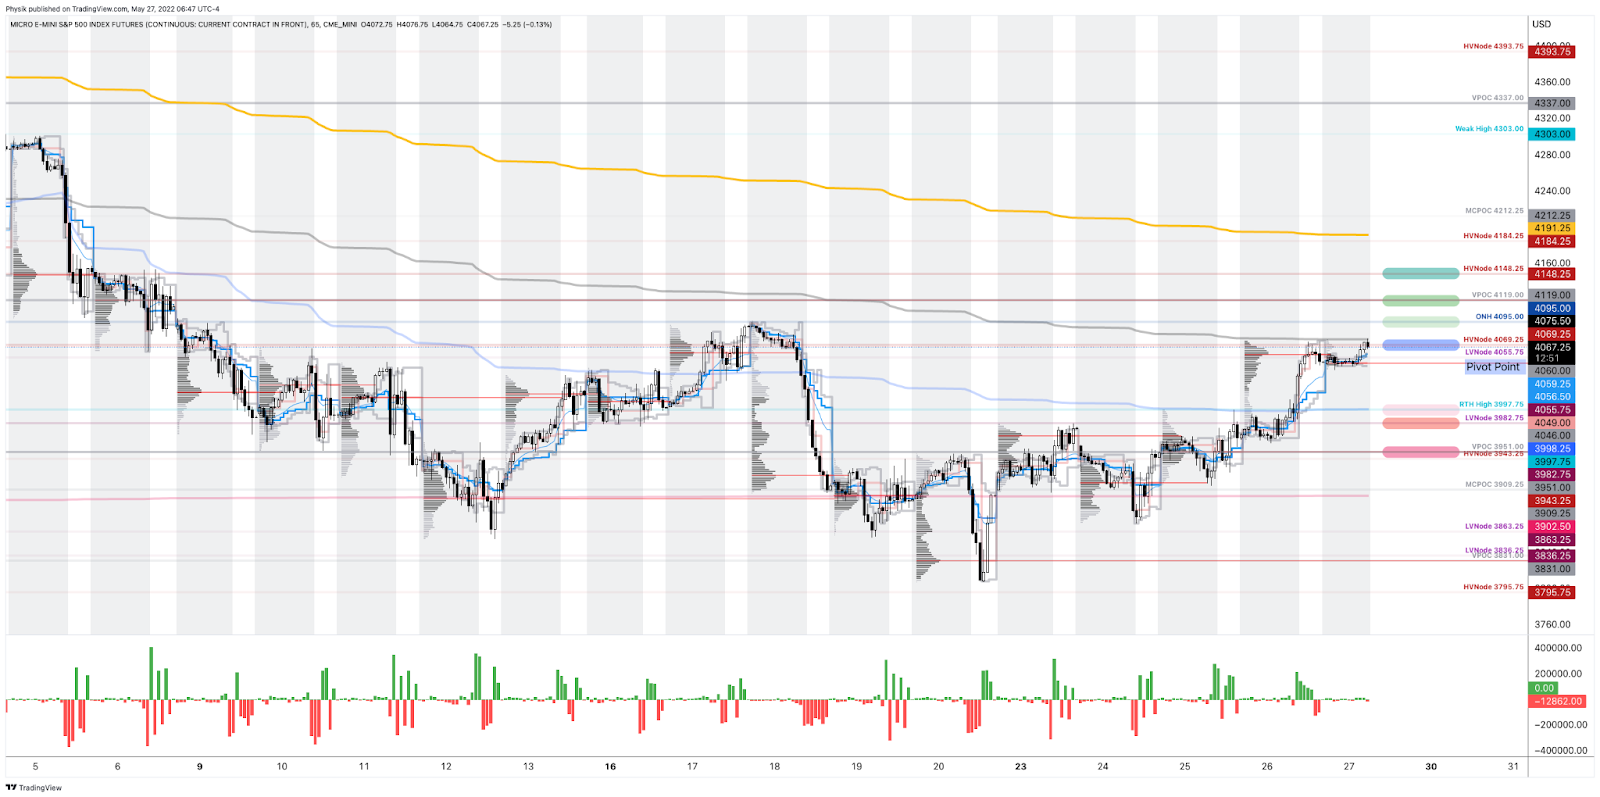
As of 9:00 AM ET, Tuesday’s regular session (9:30 AM – 4:00 PM ET), in the S&P 500, is likely to open in the lower part of a negatively skewed overnight inventory, outside of the prior day’s range, suggesting a potential for immediate directional opportunity.
The S&P 500 pivot for today is $4,052.25.
Key levels to the upside include $4,071.75, $4,083.75, and $4,104.25.
Key levels to the downside include $4,034.75, $4,015.75, and $3,998.25.
Disclaimer: Click here to load the updated key levels via the web-based TradingView platform. New links are produced daily. Quoted levels likely hold barring an exogenous development.

Definitions
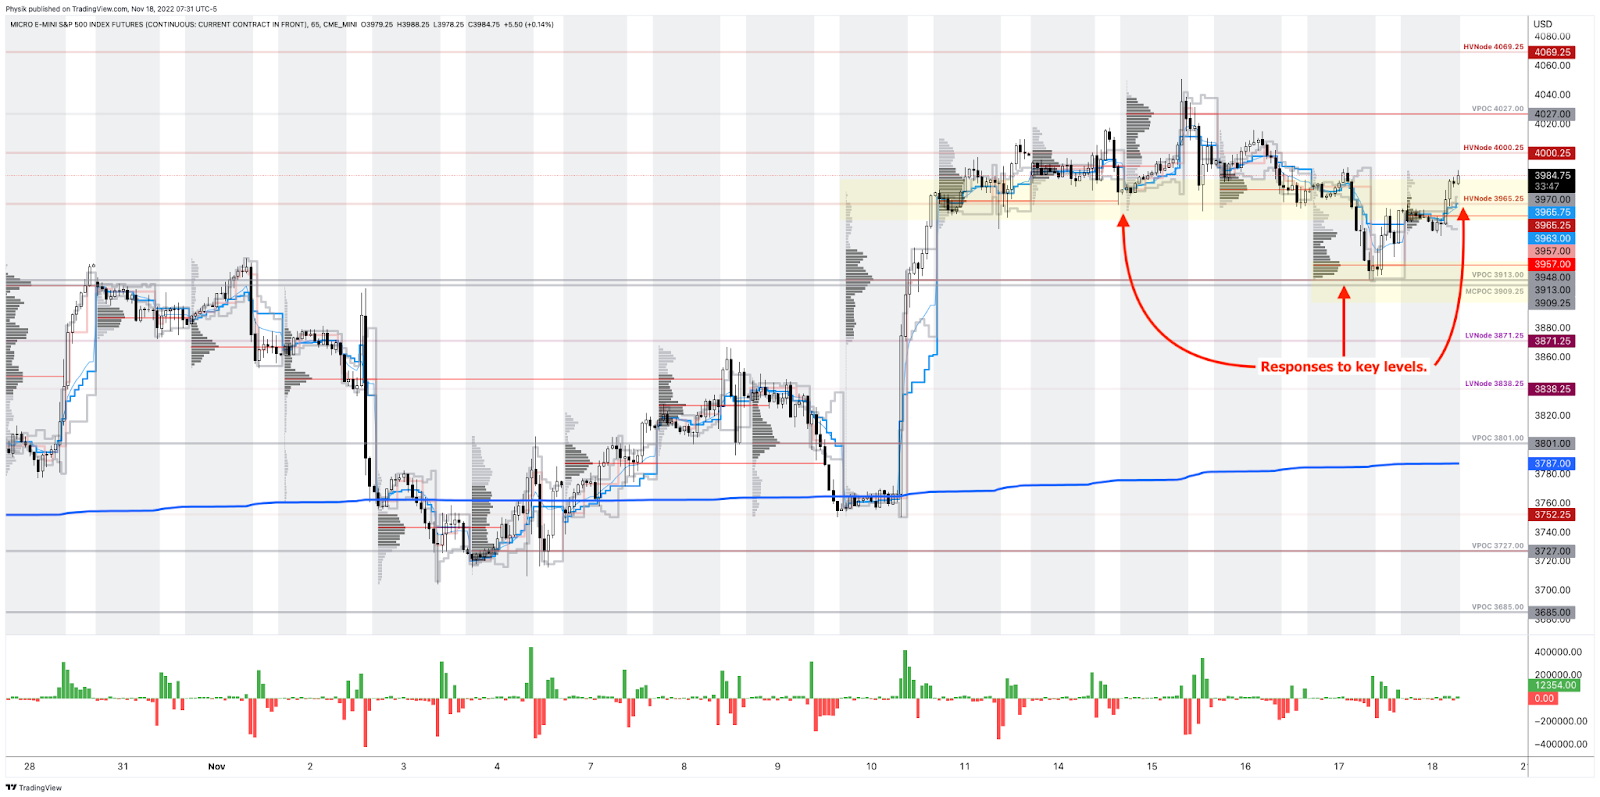
Volume Areas: Markets will build on areas of high-volume (HVNodes). Should the market trend for a period of time, this will be identified by a low-volume area (LVNodes). The LVNodes denote directional conviction and ought to offer support on any test.
If participants auction and find acceptance in an area of a prior LVNode, then future discovery ought to be volatile and quick as participants look to the nearest HVNodes for more favorable entry or exit.
About
The author, Renato Leonard Capelj, works in finance and journalism.
Capelj spends the bulk of his time at Physik Invest, an entity through which he invests and publishes free daily analyses to thousands of subscribers. The analyses offer him and his subscribers a way to stay on the right side of the market. Separately, Capelj is an options analyst at SpotGamma and an accredited journalist.
Capelj’s past works include conversations with investor Kevin O’Leary, ARK Invest’s Catherine Wood, FTX’s Sam Bankman-Fried, North Dakota Governor Doug Burgum, Lithuania’s Minister of Economy and Innovation Aušrinė Armonaitė, former Cisco chairman and CEO John Chambers, and persons at the Clinton Global Initiative.
Connect
Direct queries to renato@physikinvest.com. Find Physik Invest on Twitter, LinkedIn, Facebook, and Instagram. Find Capelj on Twitter, LinkedIn, and Instagram. Only follow the verified profiles.
Calendar
You may view this letter’s content calendar at this link.
Disclaimer
Do not construe this newsletter as advice. All content is for informational purposes. Capelj and Physik Invest manage their own capital and will not solicit others for it.