Categories
Commentary

Reversion To The Meme

Good Morning! I hope you had a great weekend and enjoy today’s letter. I would be so honored if you could comment and/or share this post. Cheers!

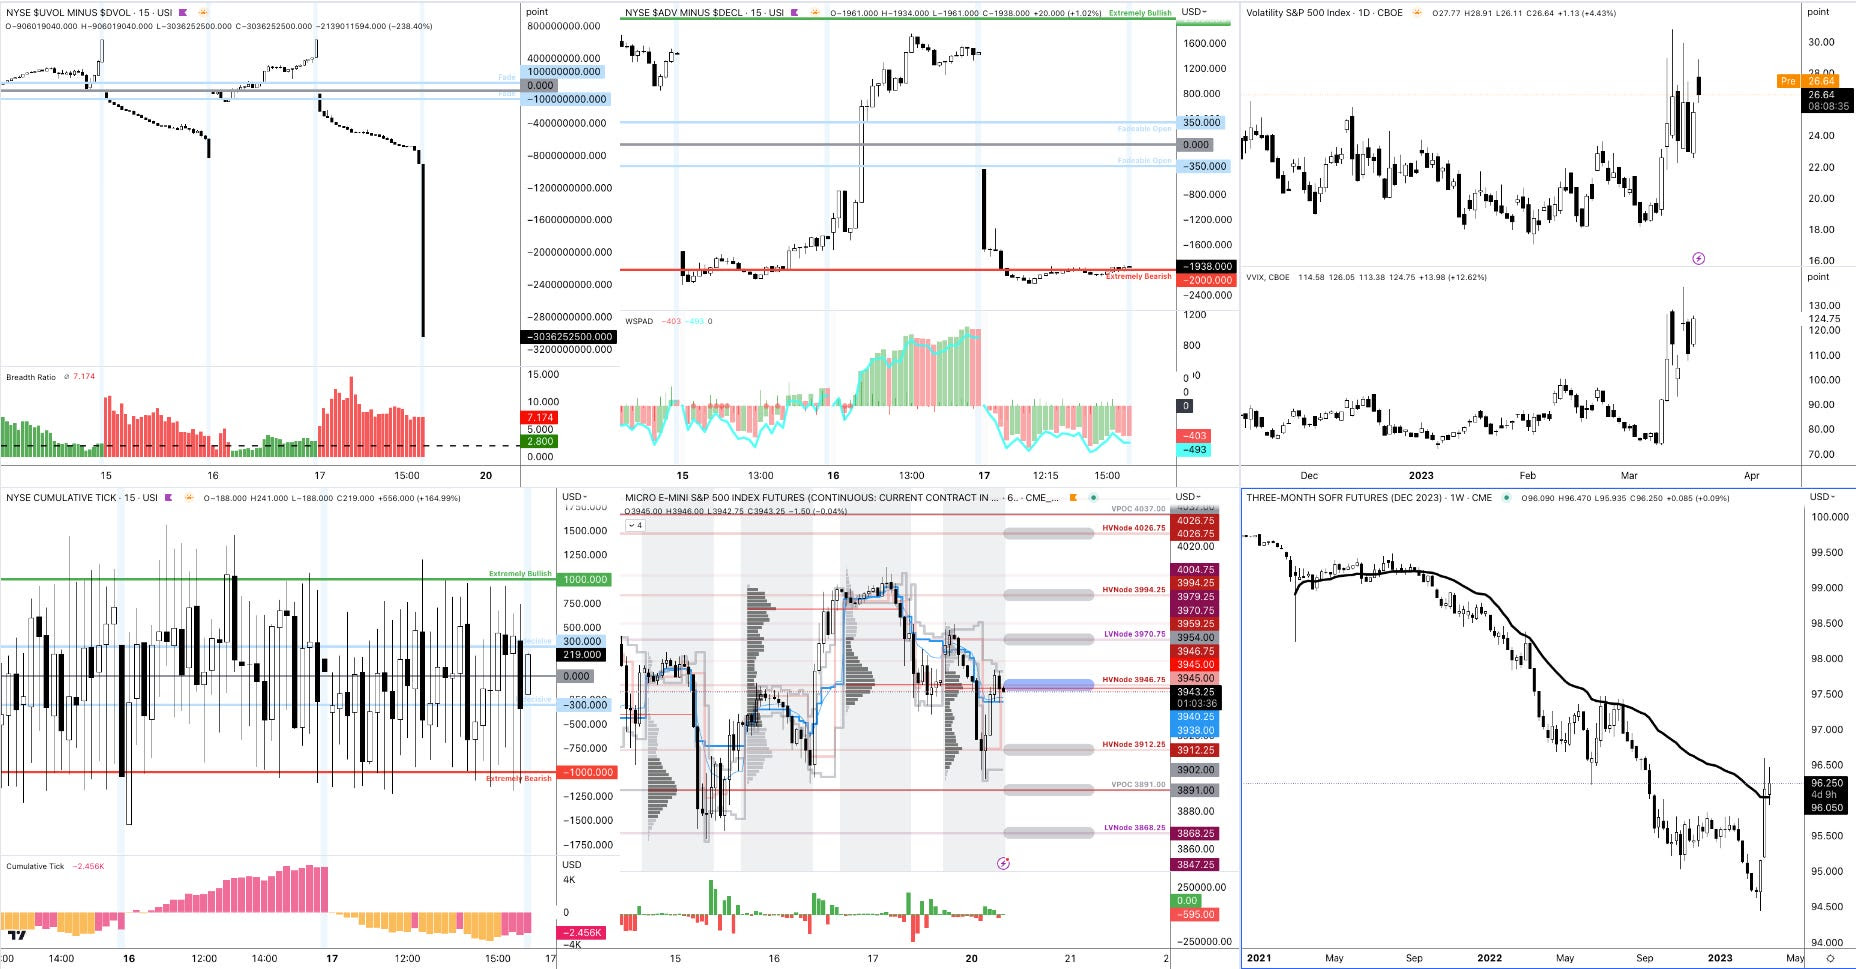
After a period of taking the stairs up, markets took the elevator down last week. Through Tuesday, the S&P 500 fell over 2.5% on a Consumer Price Index (CPI) print, which signaled higher-than-expected inflation. Internally, the selling was heavy.

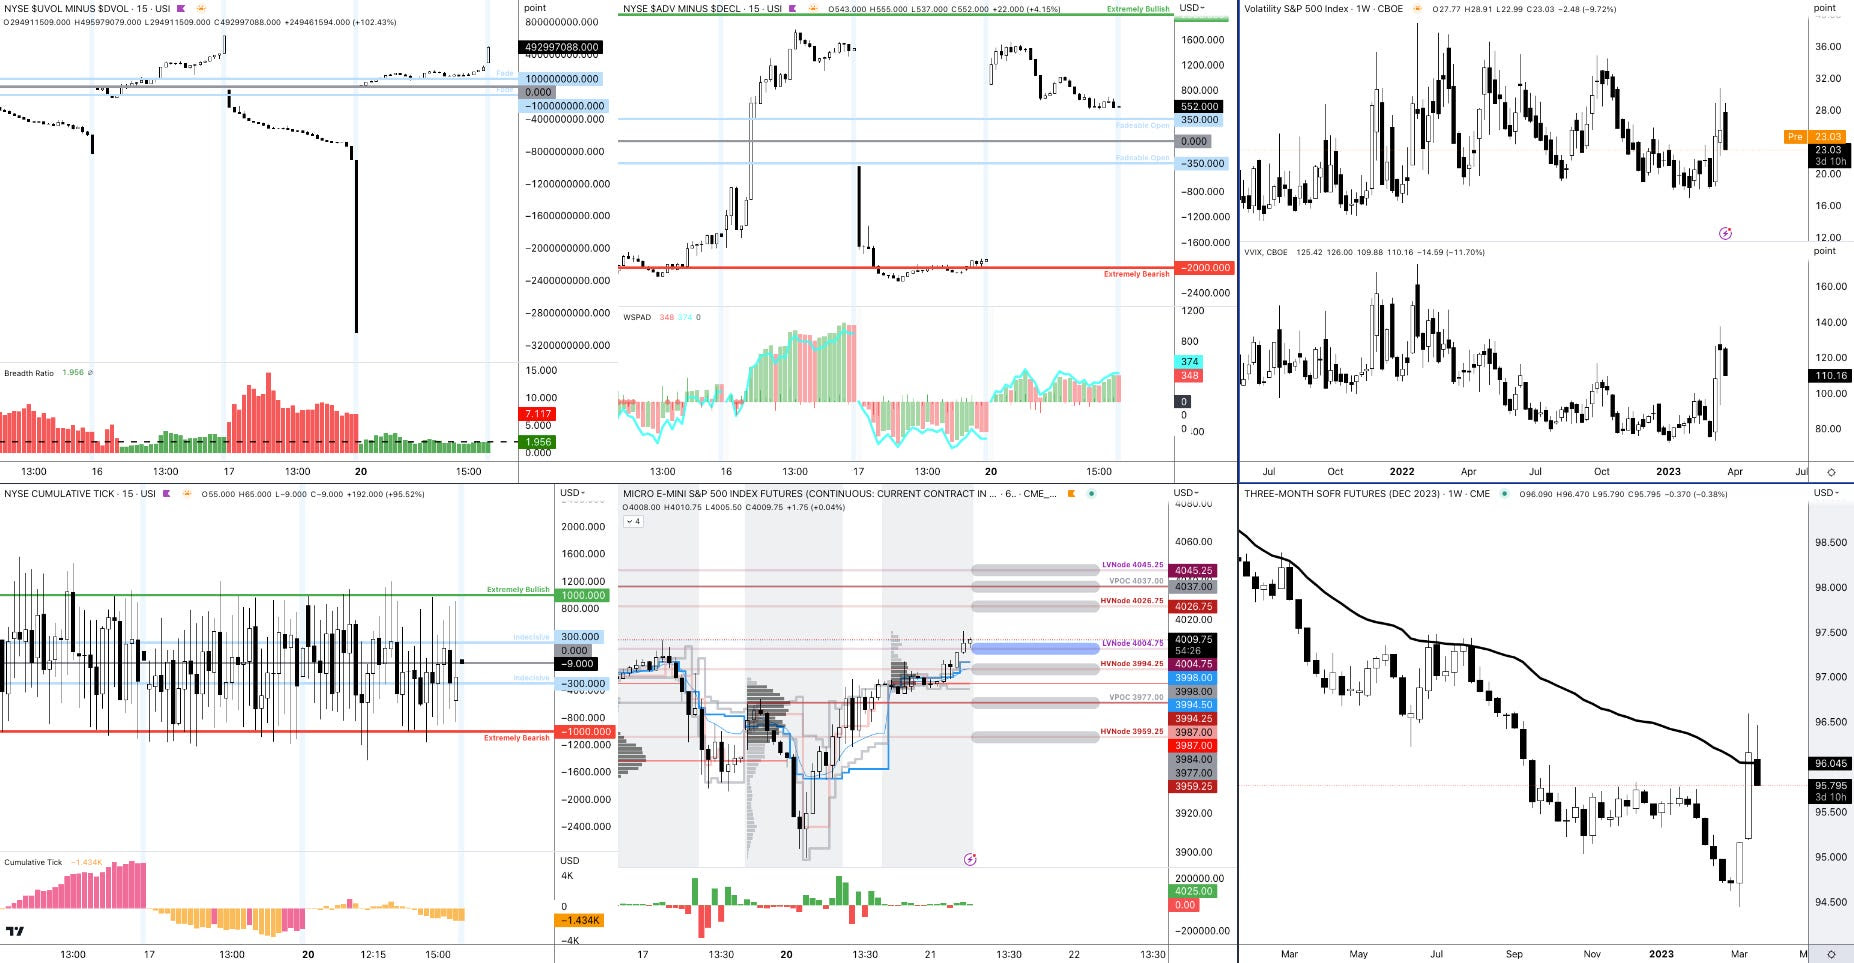
Graphic: Retrieved from TradingView. Market Internals as taught by Shadowtrader’s Peter Reznicek.

Additionally, options were repriced in a big way.
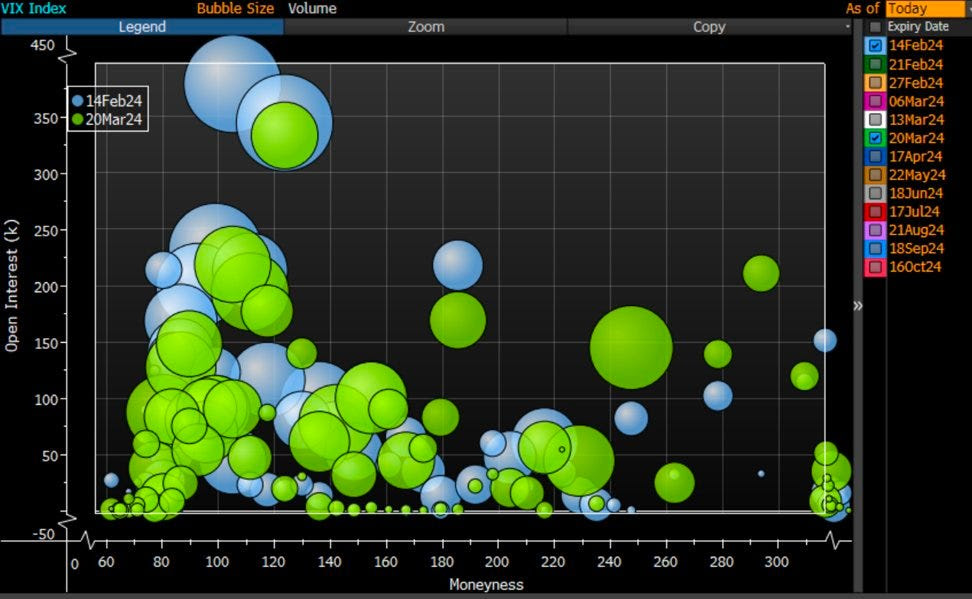
Graphic: Retrieved from Bloomberg via Options Insight.

Let’s digress. 

Recall that options implied volatility is a measure of the market’s expectation of the future volatility of an underlying asset, as reflected by the supply and demand of options themselves. Higher implied volatility indicates more significant expected price fluctuations.

Options implied volatility skew refers to the unevenness in implied volatility levels across different strike prices. Steep, smile-looking, or v-shaped volatility skew reflects a scenario where increased market volatility disproportionately impacts farther away strike options due to (expected) losses from more frequent delta rebalancing in a moving market. Options traders assign higher implied volatility to those farther away strike options to compensate for increased risk/cost, often enabling savvy traders to exploit these variations to reduce their hedging costs.

Moreover, before last week’s drop, the S&P 500’s implied volatility skew was subdued, as indicated by the grey-shaded area below. Tuesday’s decline coincided with increased options trading activity and demand, leading to a notable upward shift in skew. Distant S&P 500 put options experienced significant increases in implied volatility (see the below grey line moving away from the shaded area).

Graphic: Retrieved from SpotGamma. Volatility skew for S&P 500 options expiring March 15, 2024.

Though skew remains elevated, broader implied volatility measures, such as the Cboe Volatility Index or VIX, declined as rapidly as markets rallied in the days following Tuesday’s downturn.

What’s happening?

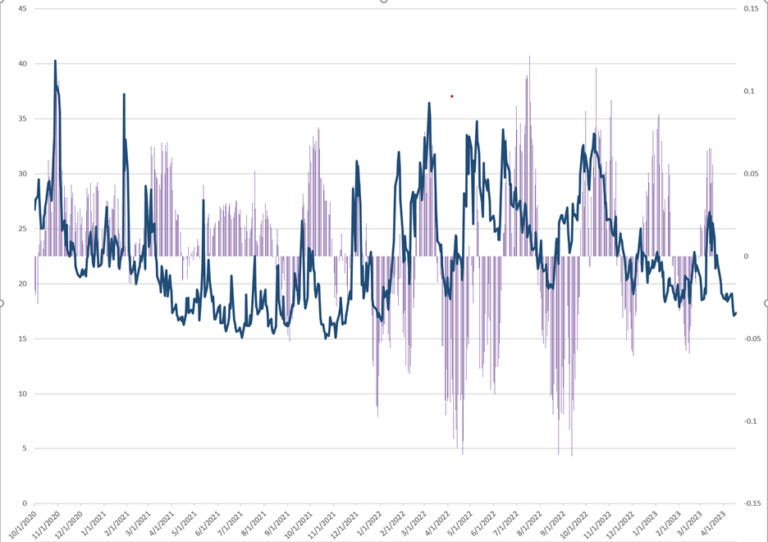
Despite further negative economic indicators, such as hot producer prices or weaker retail sales and manufacturing output, markets surged strongly, closing the week almost unchanged. Beyond significant investor inflows into stocks, totaling approximately $16 billion on Wednesday, according to Bank of America Corporation, analysis of S&P options positioning revealed mechanical demand for the S&P 500, as highlighted by SqueezeMetrics. Higher implied volatility strengthened an automatic buying mechanism, supporting markets.
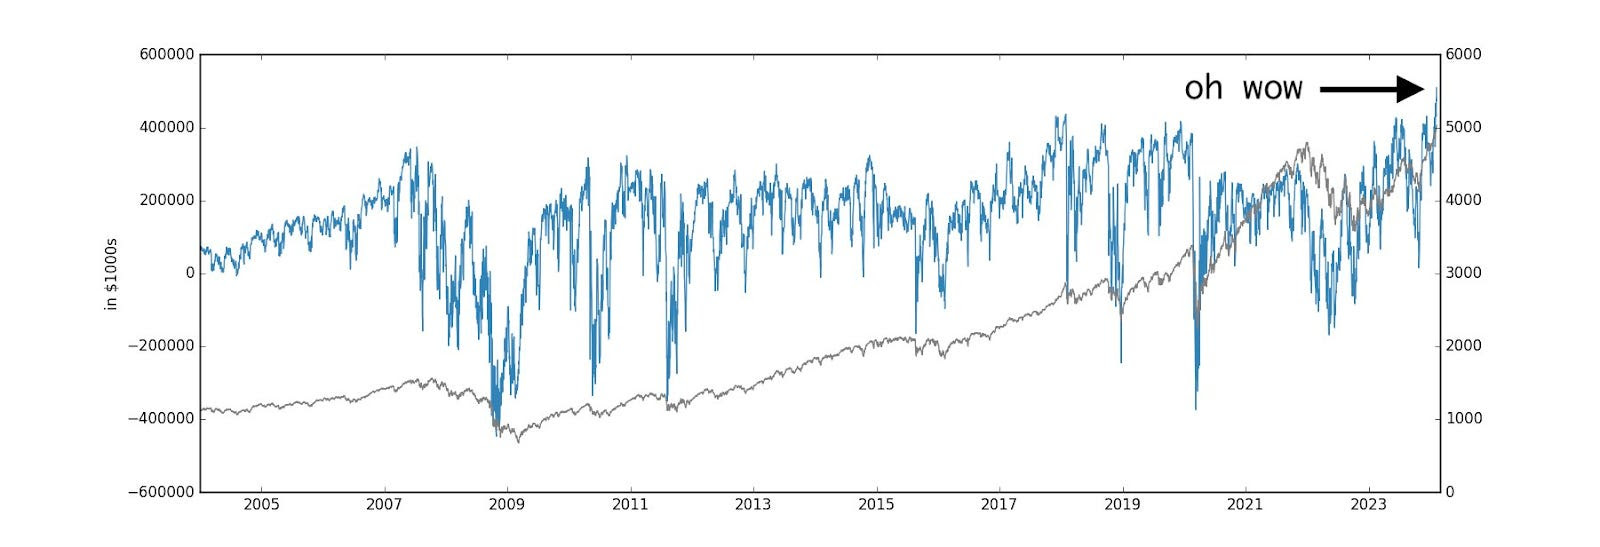
Graphic: Retrieved from SqueezeMetrics. Dealer S&P 500 Vanna Exposure or VEX.

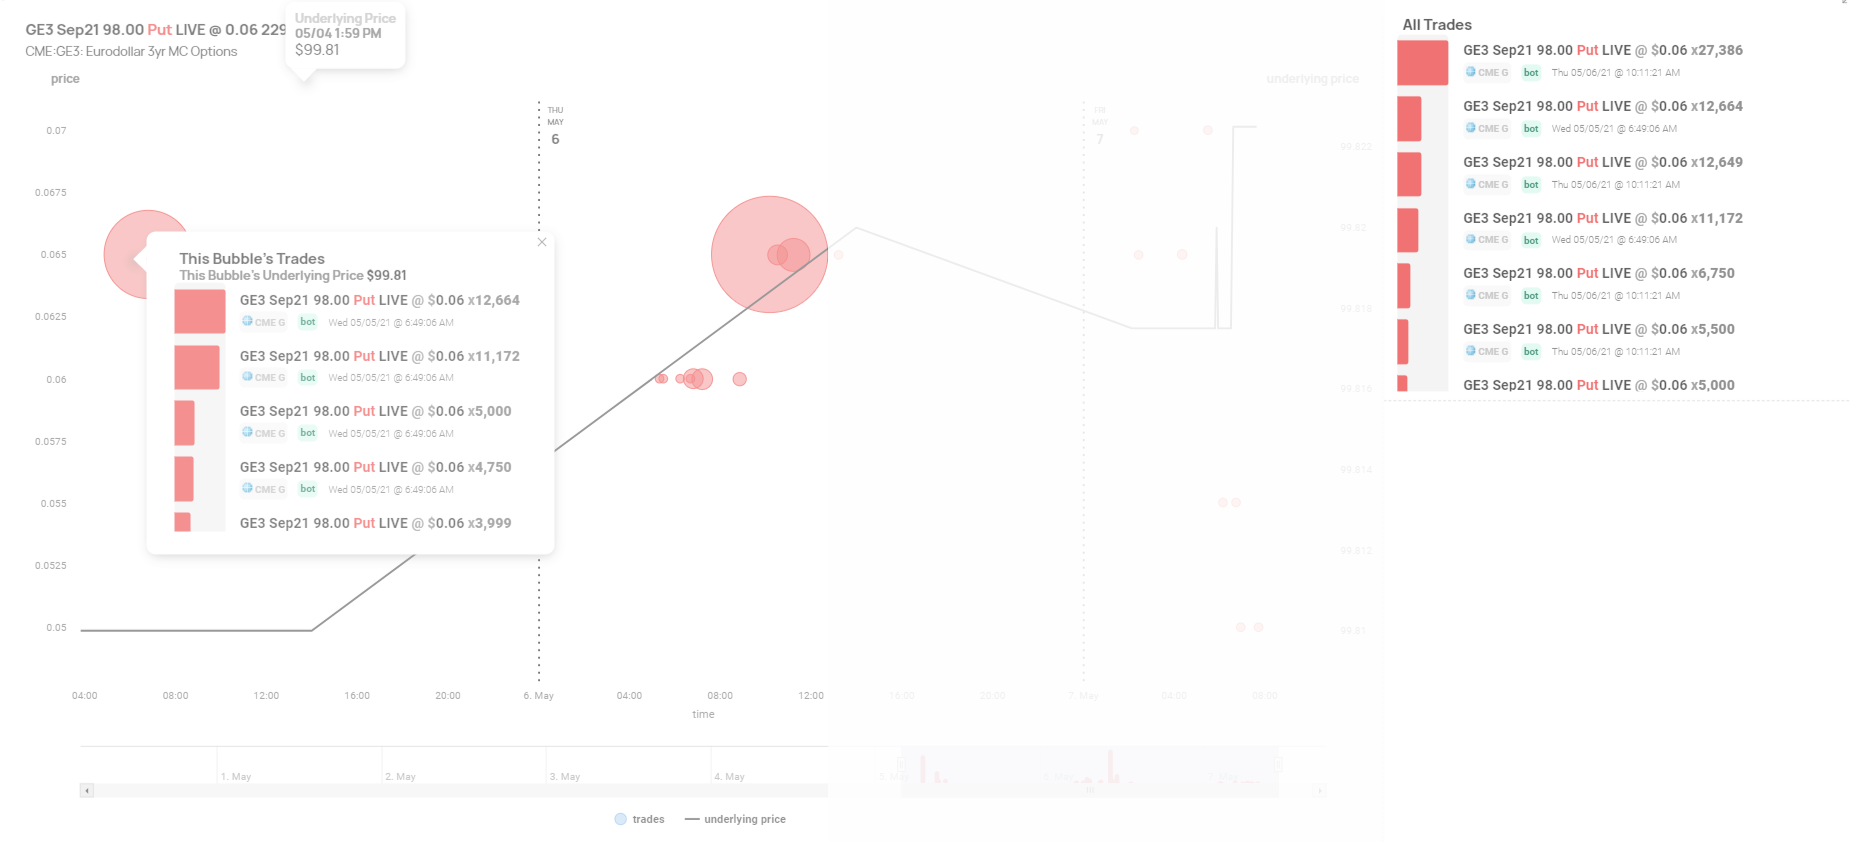
This phenomenon is partially attributed to the significant options selling discussed in our recent newsletters, acknowledging the warnings issued by Cem Karsan of Kai Volatility and Kris Sidial of The Ambrus Group. Essentially, there’s been a rush among options sellers to enter into sizable positions, exemplified by the substantial options selling activity observed last week. UBS Group highlighted the persistence of this concerning toxic flow, noting aggressive trader actions, such as the sale of “70K of Thursday expiry 4120 puts at 0.05 on Wednesday.”

Graphic: Retrieved from Goldman Sachs Group Inc.

The estimated risk profile of this position is provided below (please allow for a margin of error of a day or two due to expiry). Essentially, it’s unfavorable, with the option seller at risk of losing much money if the market drops or implied volatility increases. Please be aware that we’re assessing this position independently, without knowledge of the option seller’s overall portfolio, including potential risk offsets from other positions they may hold.

Graphic: Retrieved from TD Ameritrade’s thinkorswim platform using the Analyze function.

Customers favoring such positive delta “short skew” positions prompt dealers on the other side to assume a negative delta (i.e., make money if the market is lower or implied volatility is higher) “long skew” or “long options” position, which they may manage through the sale of put options or the purchase of call options, underlying stock shares, or futures for hedging purposes. For a deeper understanding of these mechanisms, refer to SqueezeMetrics’ paper, “The Implied Order Book.”

Graphic: Retrieved from SqueezeMetrics.

This all happened during a seasonally weak period. We’ll go past the positioning side of things in a moment, so bear with me, but you can see the drop-off in options deltas following mid-February below.
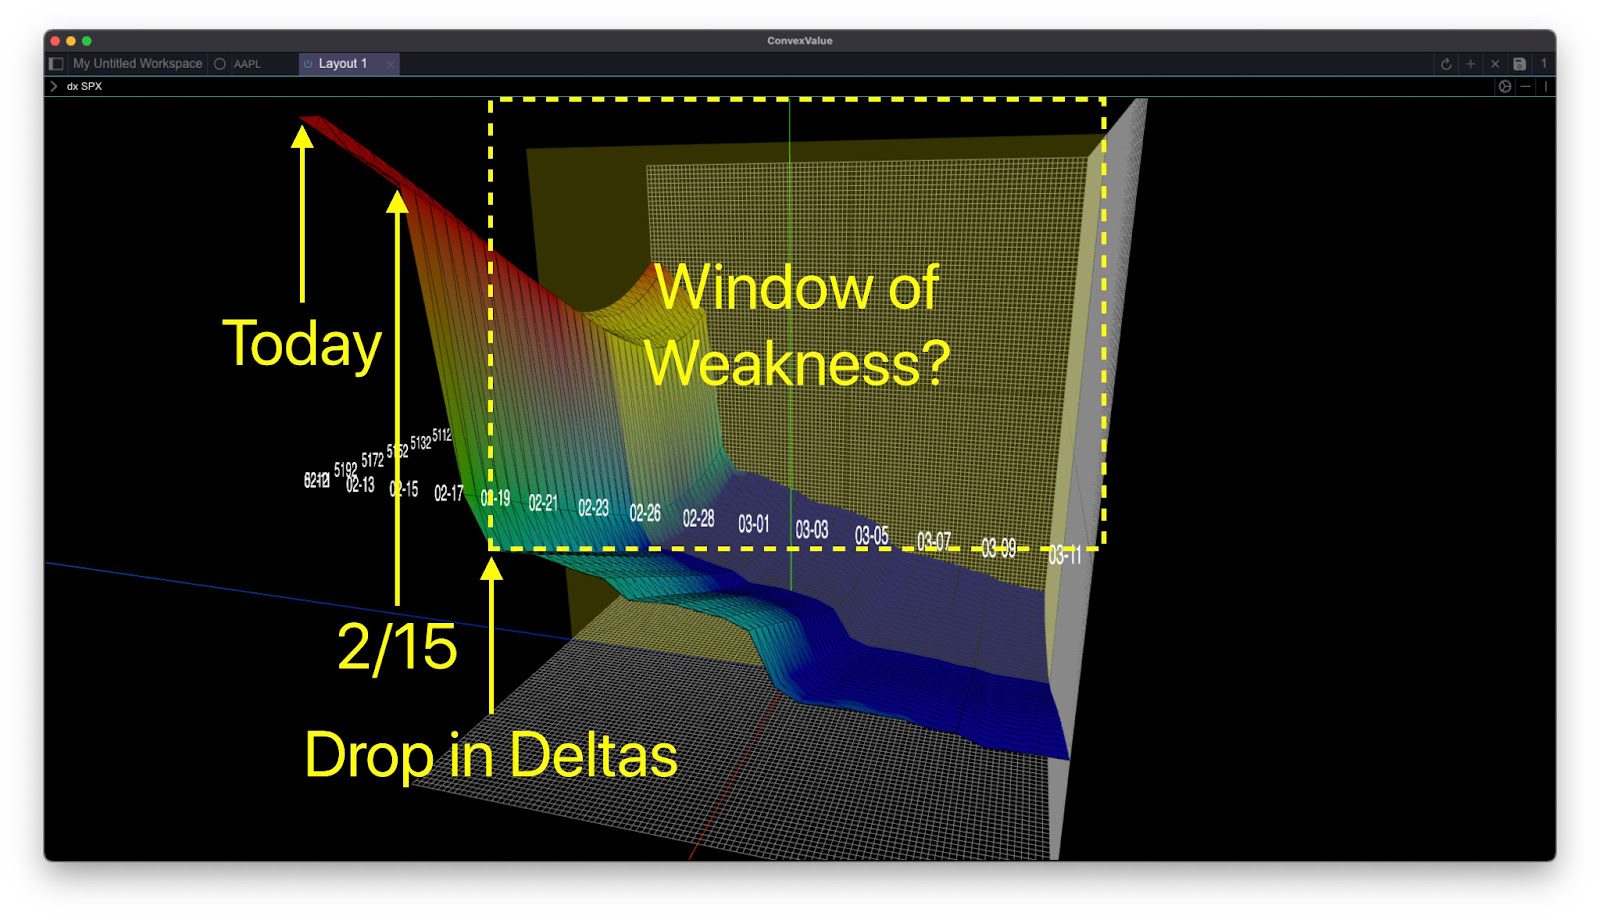
Graphic: Retrieved from ConvexValue.

In essence, despite the anticipated reduction in options-based support, which Cem Karsan describes as a “window of non-strength” or a scenario conducive to increased volatility, the market’s reaction to Tuesday’s drop stemmed volatility. Observing these dynamics in real-time, here’s how we responded.

Graphic: Retrieved from Goldman Sachs Group Inc.

We had proactively positioned ourselves for a potentially weaker February, capitalizing on overlooked hedge opportunities outlined in recent newsletters—specifically, put spreads like butterflies. Others did similar, with Nomura Americas Cross-Asset Macro Strategist Charlie McElligott noting increased buying of put butterfly spreads in recent weeks (please see our late January and early February letters).

Depending on their setup (including the distance between strikes, the distance from the spot price, and the expiration timeframe), these spreads were positioned to profit from market declines. When the drop occurred, the unbalanced, very far out-of-the-money structures were priced to be closed at a small debit loss when the skew elevated substantially. Utilizing real-time analysis, we concluded it was opportune to increase our exposure to these far out-of-the-money units, capitalizing on the surge in implied volatility while cashing in on the closer spreads priced for a credit profit.

Graphic: Retrieved from Goldman Sachs Group Inc.

As markets recovered, we closed the recently initiated riskier spreads, freeing up buying power for opportunities elsewhere, such as in NVIDIA Corporation (NASDAQ: NVDA) and Super Micro Computer Inc (NASDAQ: SMCI), where a significant volatility skew, driven by heightened call options trading, enabled us to generate credit from short-dated spread trades.

By Friday’s end, we achieved one of our most successful weeks of the year, boosting our confidence and reinforcing our patience with underperforming trades, like the put butterfly hedges. PAY-tience!

Graphic: Retrieved from TD Ameritrade’s thinkorswim platform.

What motivated our actions? Let’s elaborate.

Tactically, we favor owning options to express our opinions efficiently selling options further out to reduce costs. Occasionally, we will utilize a ratio, such as selling two options for every one purchased. For those less experienced, simplicity often proves effective. Consider straightforward approaches like purchasing a wide put vertical, entailing buying a put, and selling a put at some greater distance. Depending on your position, the returns may come in at multiples of each unit of risk undertaken.

Furthermore, the speculative trading and crowded positions in equities (as previously discussed in this and prior newsletters), along with the persistent volatility skew (as indicated by the yellow line compared to the grey line below), imply that hedging strategies (such as owning longer-dated calls and selling stock/futures as a combination, or using put option spread strategies to hedge shares) may continue to be appealing.
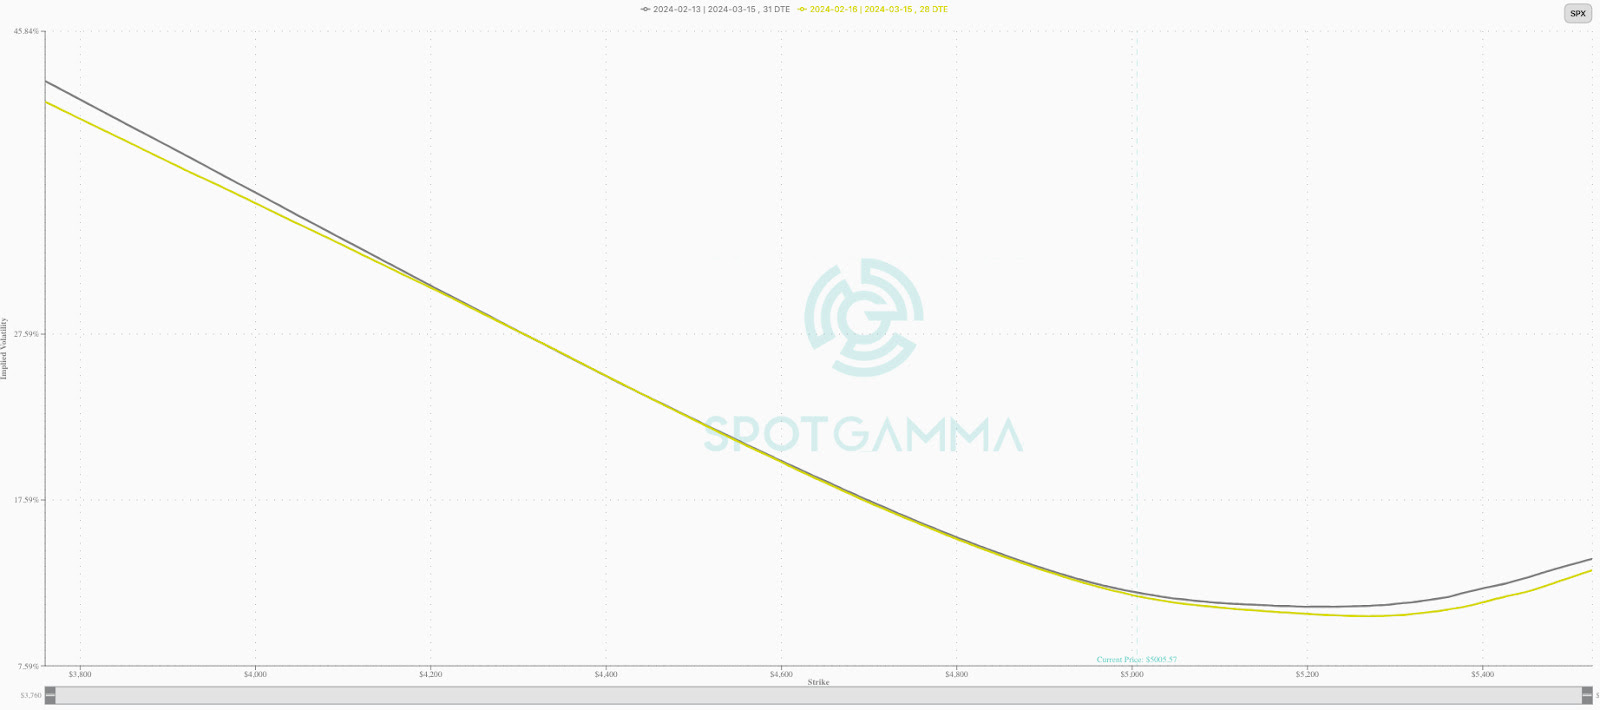
Graphic: Retrieved from SpotGamma. Volatility skew for S&P 500 options expiring March 15, 2024.

In terms of what to hedge, as highlighted by Fallacy Alarm, mid-February traditionally signals local market peaks due to significant cash injections followed by selling pressure to cover tax obligations. Additionally, a dilemma presents itself: should the focus be on combating inflation or stimulating growth? Presently, the data would dissuade anticipated rate cuts, though such actions might be contemplated if the Personal Consumption Expenditure, a key metric, points to lower price increases, particularly in services. Current interest rate projections suggest a bimodal scenario with a low probability of sudden rate declines.
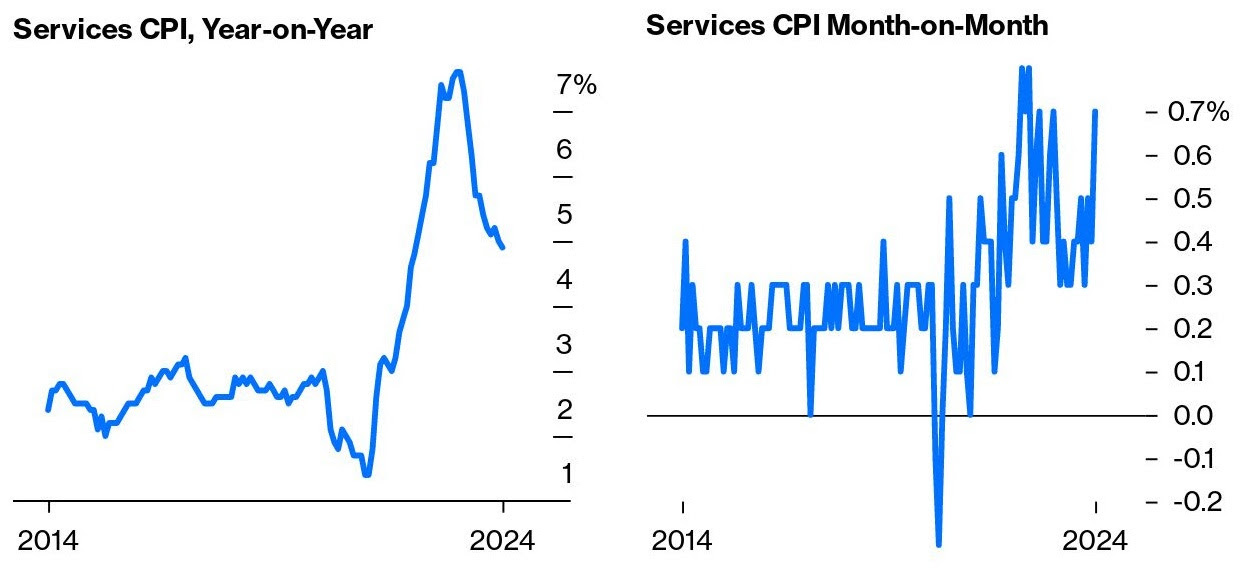
Graphic: Retrieved from Bloomberg.

As further context, John Authers of Bloomberg says there remains a risk of overheating or a scenario where the economy remains robust, eventually forcing the Federal Reserve (Fed) to tighten policies until it precipitates a recession. This is in disagreement with TS Lombard. They question whether the Fed’s current stance is overly restrictive, while Bob Elliott of Unlimited Funds suggests that rates may decrease in response to slowing growth. Eventually, the persistent inflation stemming from structural factors could prompt subsequent rate hikes driven by increased funding needs.
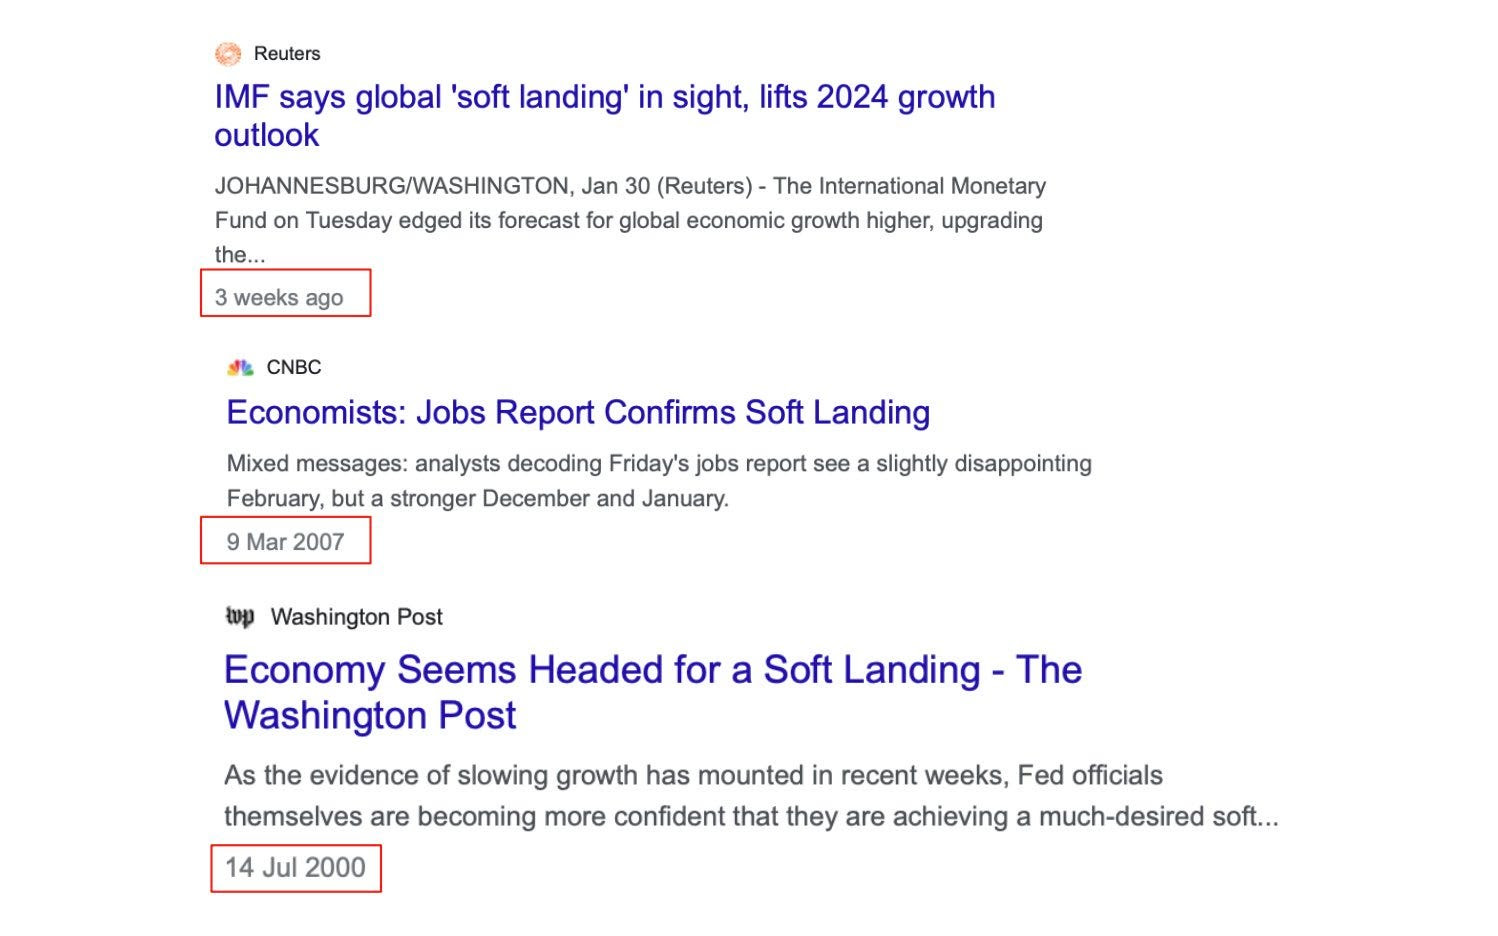
Graphic: Retrieved from Sven Henrich.

Traders must remain vigilant, adopting strategic approaches to hedge exuberance and so-called windows of non-strength. Should there be “a stronger catalyst than a telegraphed CPI print,” says Kris Sidial, then “both tails and skew are likely to perform well,” with any rally, given the short-volatility, likely to unsettle positioning, leading dealers to boost momentum and whipsaw. In other words, much lower or higher markets, coupled with more demand for puts or calls respectively, means dealers take on more short volatility risk, which they adjust for by repricing options higher and hedging with underlying asset sales (in the case of puts) or purchases (in the case of calls).

Graphic: Retrieved from Bank of America Corporation.

In conclusion, we remain mindful that it’s an election year, which could lead to heightened monetary and fiscal support in response to any weaknesses. While we maintain a positive outlook over the long term, we’re less optimistic in the short term.

This week, our attention is directed toward protecting our cash by rolling our remaining S&P 500 box spreads (acting as synthetic T-bills without impacting our buying power). We aim to secure these interest rates, keep a close watch on high-performing assets like silver, and replenish our long put skew (i.e., purchasing put spreads) in equities to hedge against potential vulnerabilities ahead. Following earnings announcements, we may resume engagement with companies such as Nvidia.

Graphic: Example of trade structuring. Retrieved from Physik Invest. This does not accurately represent this newsletter writer’s position. However, it is close. Note that one may own stock on top of this and view positions in aggregate.

If you’re wondering what’s up with the newsletter formatting over the past weeks, we are trying stuff. Let us know what you like and don’t like. Cheers, and have a good week! And, finally, if you can, share!

The cover photo was retrieved from a RidgeHaven Capital post on Seeking Alpha.

Categories
Commentary

Take The Money And Run

In their Daily Observation, dated January 4, 2000, Bridgewater Associates argued each decade was inclined to be more dissimilar to the preceding one.

“Most people who experienced consistent reinforcement for ten years were inclined to believe that this would continue indefinitely,” the authors Ray Dalio et al. said, pointing to the situation that preceded stock investors’ disappointment in the 1970s, akin to present perceptions. Investors took untimely risks that proved costly. By the late 1970s, influenced by the trauma of inflation, they shifted towards hedge assets.

Graphic: Retrieved from Bloomberg.

The report underscored a significant point: “Thirty years of prosperity and peace created a faith that our problems will be resolved.” Does this sound familiar? Dalio speculates we will soon test the resilience of the existing order and the containment, or lack thereof, of international conflicts. 

Let’s take a step back. What has transpired?

Over many decades, policymakers orchestrated a “growth engine,” nurturing innovation and globalization, inadvertently widening the wealth gap. The urgency to fix disparities, heightened by a pandemic, suggests the next decade will unfold differently, marked by rolling crises.

Inflation & protectionism & conflict, oh my! 

Graphic: Retrieved from TIME. China’s emergence as a global competitor is visualized.

This secular narrative is meticulously explored in our “Climbing A Wall Of Worry” letter. Resolving supply-chain disruptions and commodity deflation helped alleviate overall inflation concerns in the short term. Fiscal boosts, low unemployment, and wage inflation bolstered economic resilience. Pundits are now invoking terms like “soft-landing” and “Goldilocks,” capturing the current sentiment.

Graphic: Retrieved from Bank of America Global Research.

“The picture that market prices are now painting is for inflation to fall to central banks’ targets, for real growth to be moderate, and for central banks to lower interest rates fairly quickly—so the markets are now reflecting a Goldilocks economy,” Dalio says himself. 

The economic outlook for 2024 seems less impressive despite lingering market support from previous stimulations. Market prices indicate five cuts, reducing the target rate range from 525-550 to 400-425 basis points. Federal Reserve Governor Christopher Waller, who generally holds hawkish views, concurs that “the FOMC will be able to lower the target range for the federal funds rate this year.” However, he cautions against anticipating as many cuts, asserting that, despite noisy data, current policy is appropriate and should persist in exerting downward pressure on demand.

Graphic: Retrieved from CME Group on January 21, 2024.

In a different scenario, where higher real interest rates persist, it would negatively affect the economy. A hard landing would be risked, Fabian Wintersberger believes, leading to a fall in GDP and escalating debt ratios. Regardless of the path, the private sector will likely reduce investment and continue deleveraging for as long as feasible.

Graphic: Retrieved from Simplify Asset Management. High Yield Index Years to Maturity suggests organizations find refinancing or reissuing debt difficult, primarily due to the high costs associated with the risk-free component. This situation is reminiscent of the Global Financial Crisis (GFC), where uncertainty in credit markets hindered entities from refinancing.

What does all this mean for the stock market? Investors across all time frames are ultra-enthusiastic, bidding products like the S&P 500 to new highs. However, breadth could be more exciting, judging by the Russell 2000 and equal-weighted indexes.

Graphic: Retrieved from marketcharts.com via Callum Thomas.

Such is the takeaway when looking at market internals also.

Graphic: Retrieved from StockCharts.com.

So, what’s the story? Bloomberg says, “This isn’t your father’s S&P 500. Don’t worry about valuations.”

Typically, these statements raise promote caution. However, investors seem to see no alternative at the moment. The market is fueled by enthusiastic buying of a handful of stocks “accumulating greater and greater weighting.” While the forward P/E of the equal-weight S&P 500 aligns with pre-pandemic averages, the so-called Magnificent 7, steering the well-known S&P 500 (i.e., the SPX), boasts a higher value at 28.

Accordingly, over the shorter term, there are risks, including the market pausing here to “demand some deliverables” and the passage of options expiries last week. 

“The reflexive nature of the market tells us that what we are witnessing here is much more mechanical than anything and probably has nothing to do with what is happening in the real world,” Mott Capital Management’s Michael Kramer discusses.

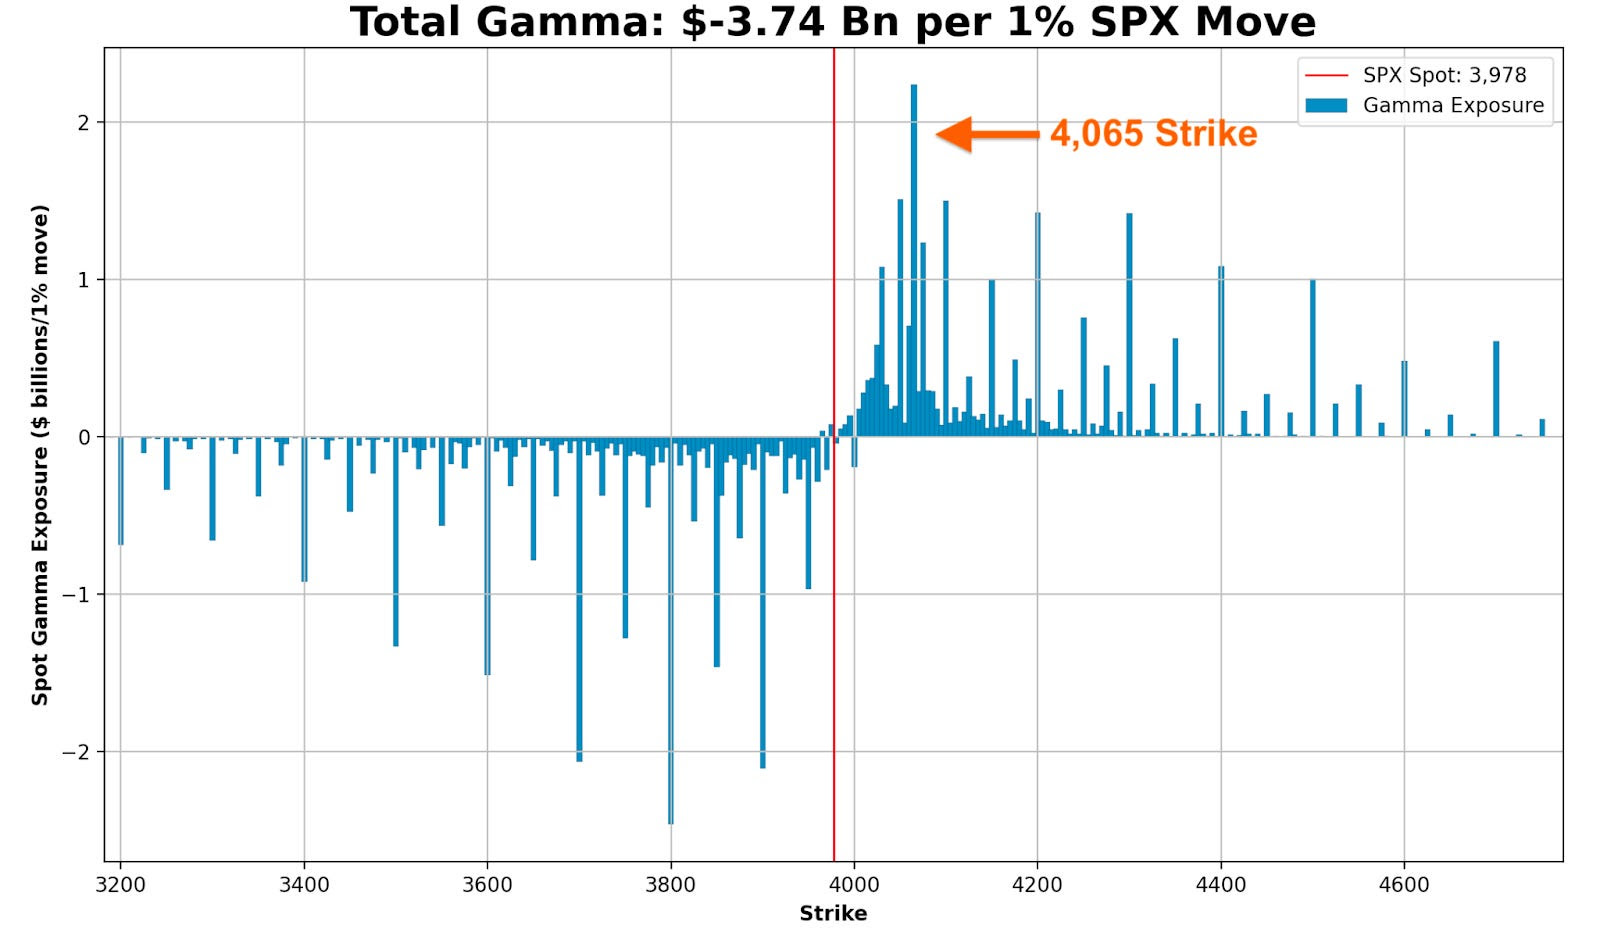
Graphic: Retrieved from SpotGamma.

SpotGamma explains there was “rhythmic buying” of options “related to the QYLD Nasdaq BuyWrite ETF, which rolls the Thursday before monthly OPEX.”

Graphic: Retrieved from Bloomberg via Michael Kramer. Notice the amount of call open interest.

Kramer, aligning with views expressed by individuals such as Cem Karsan from Kai Volatility, anticipates a potential reversal. The premise is based on the assumption that investors owned a substantial share of call options. With a reduction in their quantity and a decrease in the risk they pose to counterparts engaged in hedging through long stocks and futures, there is expected to be diminished “mechanical” support in the subsequent weeks. SpotGamma emphasizes that Monday is the final day for any options expiration effect.

“The structural supply and demand imbalance should end on Friday,” Karsan states. “I would be careful chasing this tech up here, in particular, if we see some weakness going forward like we’ve been talking about.” 

The crucial factor is the amount of “vol supply” emerging from this event, which could counteract “vol demand” (recall that investors often seek protection through options or volatility, the all-encompassing term). This counteraction may postpone weakness, setting the stage for a more significant decline later in Q1, as highlighted by Karsan.

It’s important to note that a substantial market position involves hedging equity with short-call options and long-put options. Options prices may decrease with increased volatility supply, leading to the counterpart’s re-hedging of this position by buying back underlying stock and futures hedges (i.e., if a counterpart is short futures against an SPX long-call and short-put position, they will buy futures to rebalance their delta as implied volatility falls).

Graphic: Retrieved from Nomura Securities International.

“Can that counter the lack of positive flows, the vol buying, and some of the macro liquidity issues,” Karsan asks, acknowledging the pressures linked to asset runoff, Treasury issuances, the diminishing reverse repo, and external events such as the Red Sea attacks, which are perceived as potentially more impactful on supply chains than the global pandemic. In any case, there are increasing prospects of a “February 14 Valentine’s Day Massacre.”

What’s the course of action? According to Simplify Asset Management, considering that far out-of-the-money puts are now priced at half of what they were at the onset of the global pandemic four years ago, hedging at this point is a prudent move. 

Butterflies in the Nasdaq 100 and S&P 500 present an appealing opportunity. Take, for instance, the 15000/13500/12000 NDX butterfly expiring in the next month or two. It costs between $500 and $1,500 to open. If it’s the shorter-dated one that is in the money today, closing it could yield about a $90,000 credit, excluding changes in implied volatility and the passage of time. The maximum value is $150,000, and the risk is confined to the amount paid at open. Talk about the convexity!

We’ve analyzed this specific trade for you, although in the S&P 500 and without the distant protective put. Given the distinct environment, there is an elevated risk of a volatility increase warranting the acquisition of far-away protection, represented in this instance by the 12000 put.

Graphic: Retrieved from Simplify Asset Management.

Though owning volatility safeguards against a substantial decline, consider the expenses of maintaining that position and the inevitable decline in its value during calm or rising periods. It is “the investment equivalent of death by a thousand cuts.”

“Vol is cheap enough when you go out two or three months, particularly on the call side,” Karsan ends. “Into a rally particularly that should continue to be relatively bid. That doesn’t mean go own one-month vol because that is more uncertain here, right? You will experience a lot of decay if the decline doesn’t happen till February. Right? There is still theta to be had.”

Graphic: Retrieved from Bank of America Global Research.
Categories
Commentary

Daily Brief For April 24, 2023

LOAD LEVELS ON TRADINGVIEW BY CLICKING HERE.

Short letter today. Got to catch a flight!

Last week, we discussed the recent response to the bank issues cutting risks for the S&P 500 (INDEX: SPX). Volatility and correlations fell as time passed, and this helped contain the market. Though last week’s options expiration (OpEx) may free markets up, we maintain that the SPX may stay contained longer before it weakens.

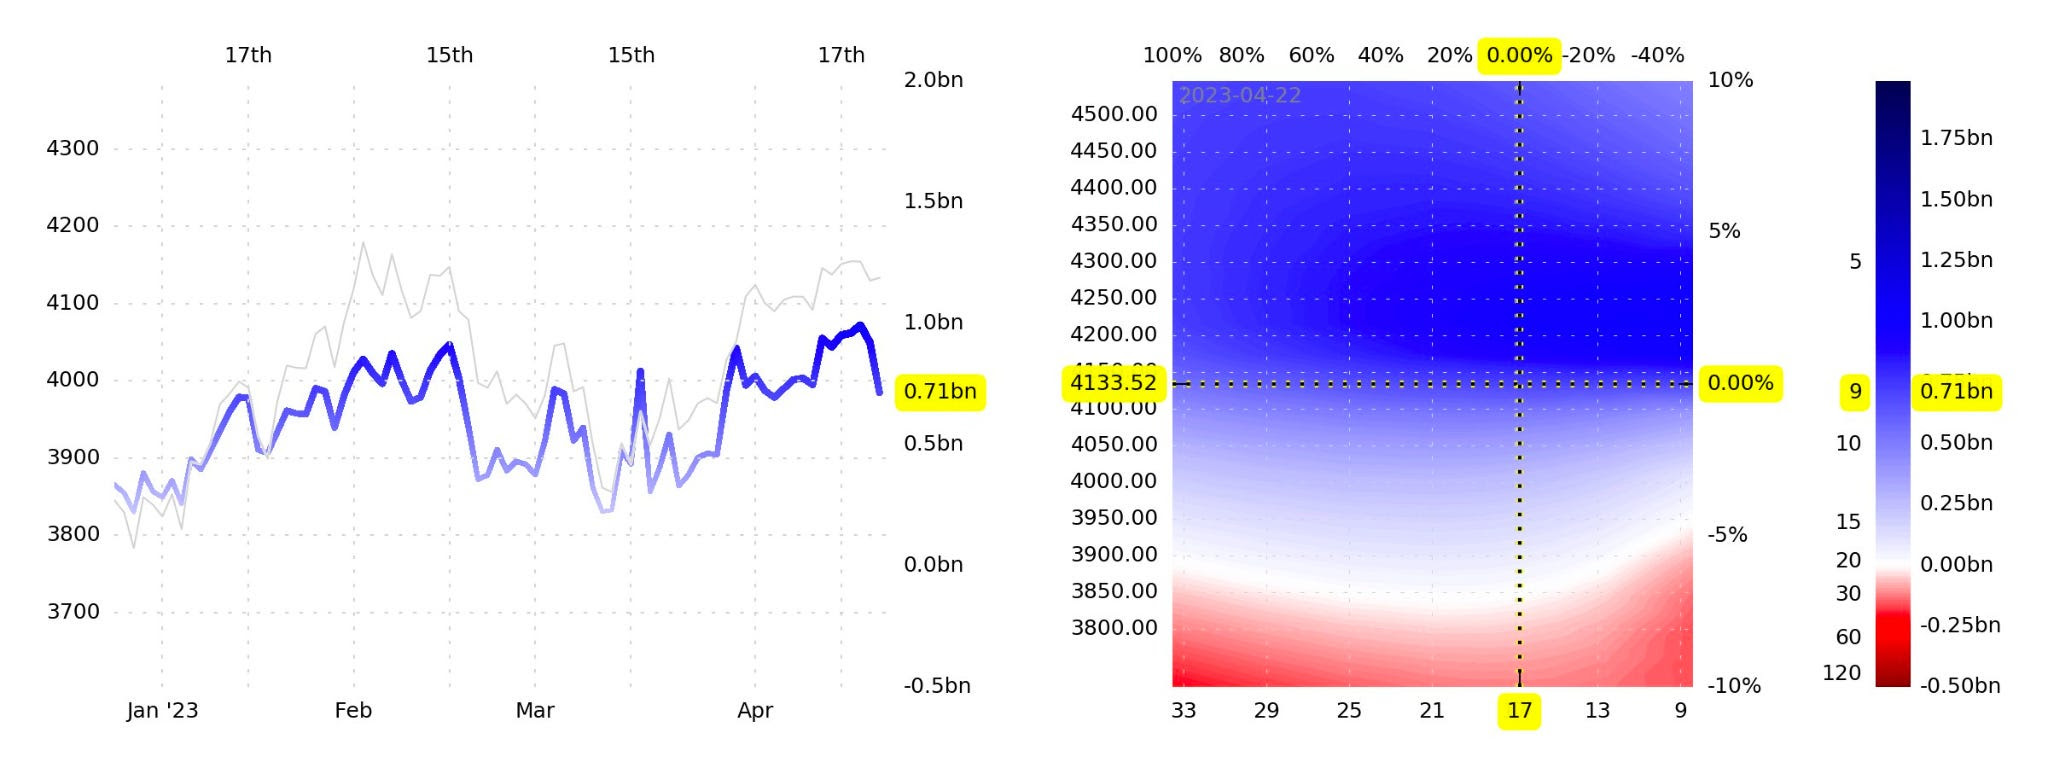
Graphic: Retrieved from SqueezeMetrics. “Monthly OpEx just shaved off nearly $300mm per point in SPX dealer gamma exposure. That means index liquidity has lost quite a bit of depth going into next week.”

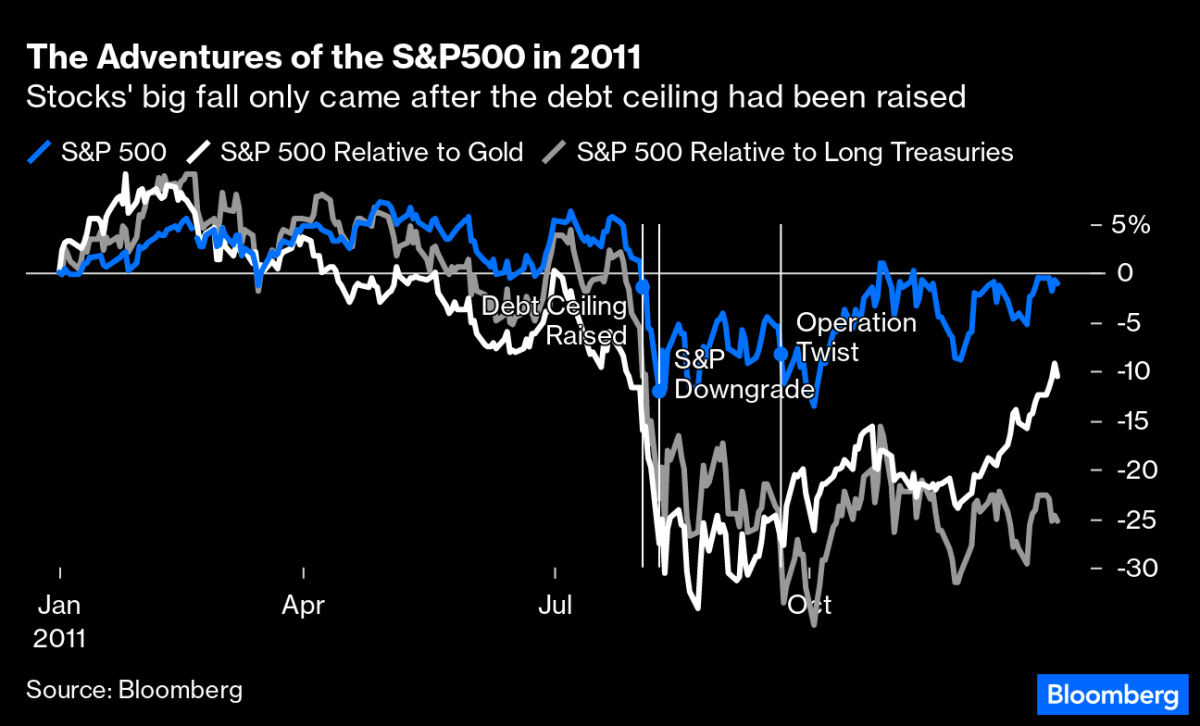
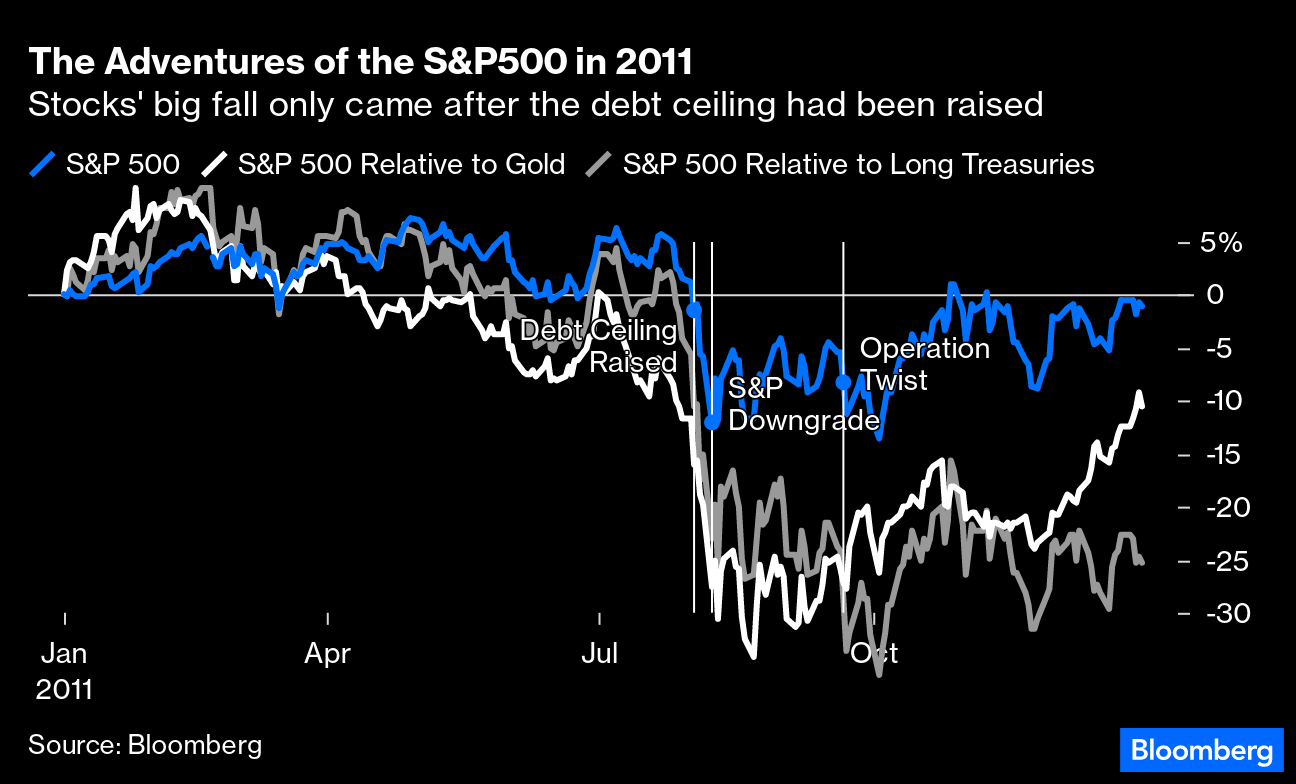
Catalysts for weakness include falling earnings growth and a debt-ceiling crisis that’s driven T-bill yields lower from surging demand; a failure by Congress to raise the limit on how much the government can borrow may disrupt funding markets, WSJ reports.

Graphic: Retrieved from Bloomberg.

Let’s limit our expectations and focus on low- or zero-cost call structures (e.g., bull call ratio) monetized to finance longer-dated put structures (e.g., bear put vertical) while allocating a chunk of our portfolio to near-risk-free yield-harvesting structures (e.g., box spread), mainly if you are a portfolio margin trader.

As I explained to a subscriber over the weekend, for boxes, the greatest possible loss across a range of prices is negligible. Hence, buying power is unaffected in trading a box. Consequently, using portfolio margin and trading boxes, you have more buying power to allocate to other trades that are margin (and not debit) intensive, such as synthetic long stock (i.e., purchase ATM call and sell ATM put). Using options, among other derivatives, enables us to stack returns on each other.

Here’s one example.

We can trade box spreads expiring at the end of June. We buy the $4,000/$5,000 call spread for $22,365.00 and simultaneously buy the $5,000/$4,000 put spread for $76,620. This trade costs $98,985.00, and by lending this amount (on April 21, 2023), you will receive $1,015.00 upon maturity. Yes, you will have $99,000.00 cash tied up, but you should be able to use $99,000.00 in buying power in other trades if you have that portfolio margin component which is so important.

If this action-oriented letter is valuable to you, consider sharing it with others.

See you later!


About

Welcome to the Daily Brief by Physik Invest, a soon-to-launch research, consulting, trading, and asset management solutions provider. Learn about our origin story here, and consider subscribing for daily updates on the critical contexts that could lend to future market movement.

Separately, please don’t use this free letter as advice; all content is for informational purposes, and derivatives carry a substantial risk of loss. At this time, Capelj and Physik Invest, non-professional advisors, will never solicit others for capital or collect fees and disbursements. Separately, you may view this letter’s content calendar at this link.

Categories
Commentary

Daily Brief For April 18, 2023

LOAD LEVELS ON TRADINGVIEW BY CLICKING HERE.

Bank of America Corporation (NYSE: BAC) sees allocations to equities versus bonds falling. That’s amid recession fears. Per EPB, “the cyclical economy has just started to shed jobs today, and leading indicators signal the recession is likely underway.”

“To get advanced warning of recessions, you must look at the construction and manufacturing sectors, even though these two sectors are only 13% of the labor market,” EPB adds, noting traditional indicators’ weakening predictability is not so great to ignore the insight. “It’s clear that the composition of traditional leading indicators remains appropriate, and thus, the current resounding recessionary signal should not be ignored.”

BAC strategist Michael Hartnett said, though, that this “consensus lust for recession” must soon be satisfied. Otherwise, the “pain trade” would be even higher yields and stocks; the S&P 500 (INDEX: SPX) is enjoying an accelerated rally which Jefferies Financial Group (NYSE: JEF) strategists think portends a period of flatness, now, over the coming weeks …

Graphic: Retrieved from Jefferies Financial Group (NYSE: JEF) via The Market Ear.

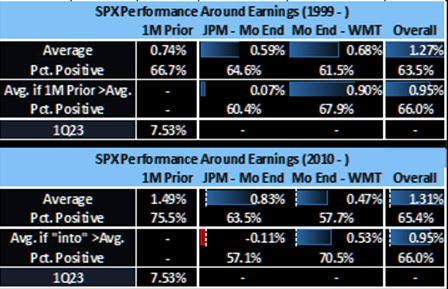
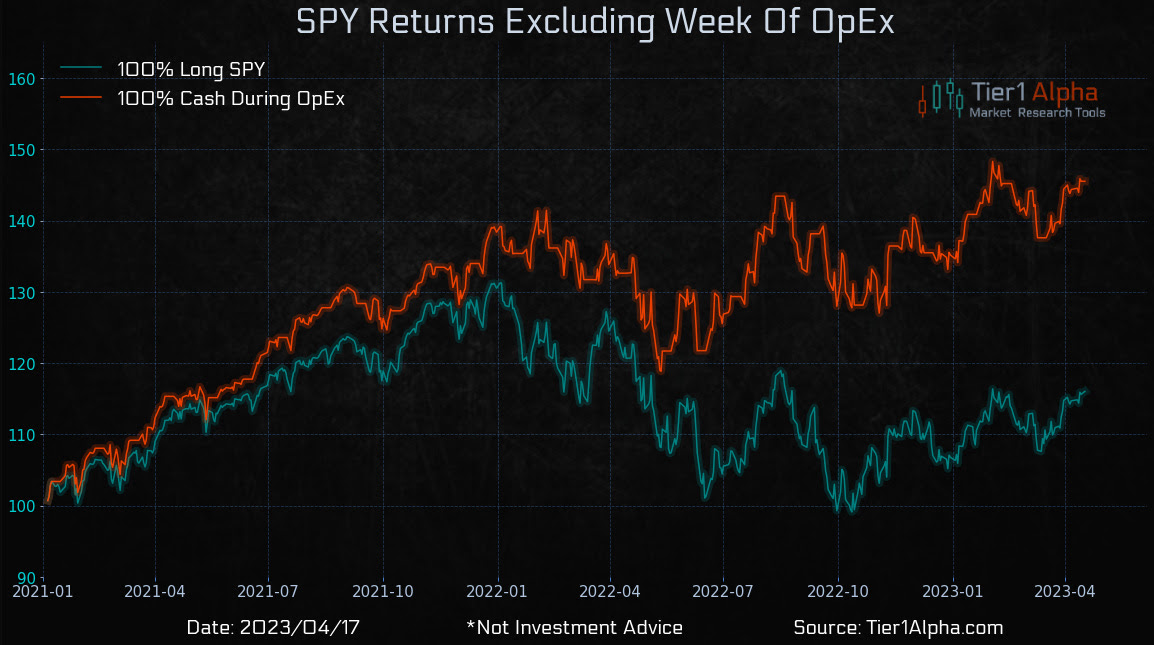
… and through options expiration (OpEx), typically a poor performance period for the SPX.

Displaying
Graphic: Retrieved from Tier1Alpha. 
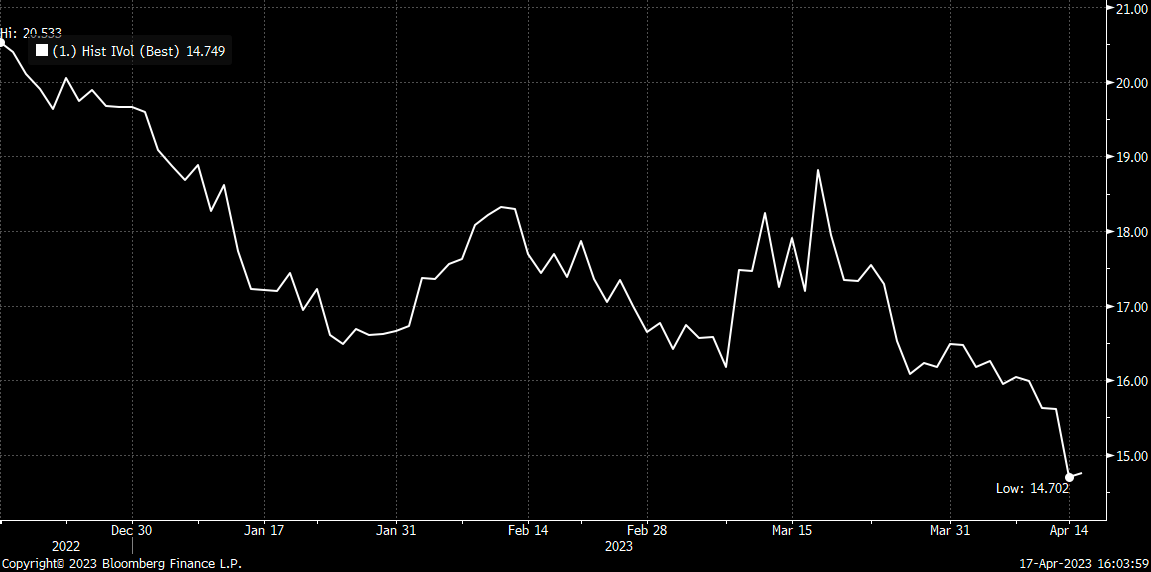
Beyond the uninspiring fundamentals, the positioning contexts are supportive. Recall our letters published earlier this year. If the market consolidated and failed to break substantially, then falling implied volatility (IVOL) and time passing would bolster markets and, potentially, help build a platform for a rally into mid-year. A check of fixed-strike and top-line measures of IVOL like the Cboe Volatility Index or VIX confirms options activities are keeping markets intact.

Graphic: Retrieved from Danny Kirsch of Piper Sandler (NYSE: PIPR). “SPX May $4,150.00 call volatility, the lack of realized volatility weighing on the market. Volatility low, not cheap.”

Beyond the rotation into shorter-dated options, just one of the factors exacerbating the decimation of longer-dated volatility, traders’ consensus is that markets won’t move a lot and/or they don’t need to hedge over longer time horizons; traders want punchier exposure to realized volatility (RVOL), and that they can get through shorter-dated options that have more gamma (i.e., exposure to changes in movement), not vega (i.e., exposure to changes in implied volatility).

Graphic: Retrieved from Goldman Sachs Group Inc (NYSE: GS) via Bloomberg.

Consequently, counterparties may be less dangerous to accelerating movement in either direction; hence, the growing likelihood of a period of flatness.

Graphic: Retrieved from SpotGamma.

“Despite the collapse in the 1-month realized volatility, we suspect most vol control funds have scaled into using their longer-term realized vols, which by design, lead to less aggressive rebalancing flows,” Tier1Alpha says. “For example, the 3-month rVol, which is currently driving our model, was essentially unchanged yesterday, which means volatility targets were maintained, and very little additional rebalancing had to occur. So even with the decline in the 1-month vol, overall risk exposure remained the same.”

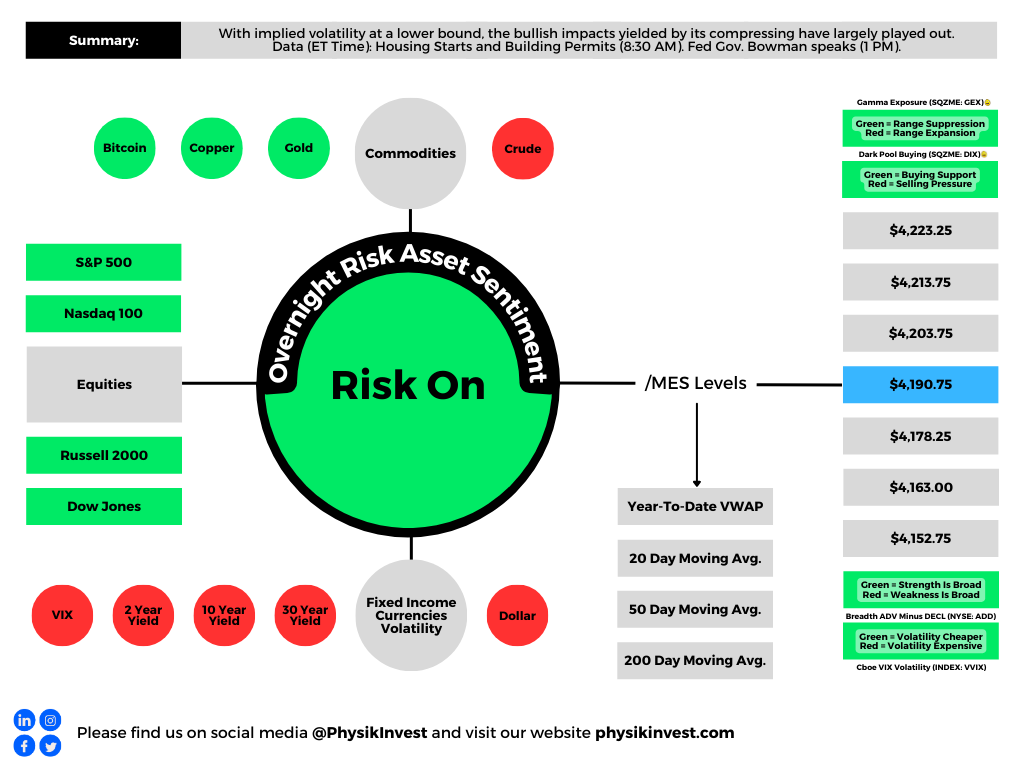
With IVOL at a lower bound, the bullish impacts yielded by its compressing have largely played out. There may be more to be gained by movements higher in IVOL, in addition to the expiry of many call options this OpEx. By owning protection, particularly far from current prices, you are positioned to monetize on the market downside and non-linear repricings of volatility, as this letter has discussed in recent history. The caveat is that volatility can cluster and revert for longer; hence, your structure matters.

“I am concerned that VIX is underpricing the series of events that we know to expect over the coming weeks,” says Interactive Brokers Group Inc’s (NASDAQ: IBKR) Steve Sosnick. “While there is now an 88% implied likelihood of a 25 basis point hike, the likely path of any potential future hikes and assumed cuts should be more clarified at the meeting and in its aftermath.  And oh, has anyone ever heard the expression “sell in May and go away?”

Graphic: Retrieved from Interactive Brokers Group Inc (NASDAQ: IBKR).

With call skews far up meaningfully steep in some products, still-present low- and zero-cost call structures this letter has talked about in the past remain attractive. If the market falls apart, your costs are low, and losses are minimal. If markets move higher into a “more combustible” position, wherein “volatility is sticky into a rally,” you may monetize your call structures and roll some of those profits into bear put spreads (i.e., buy put and sell another at a lower strike). An alternative option is neutral. Own something such as a T-bill or box spread (i.e., buy call and sell put at one strike and sell call and buy put at another higher strike). Some boxes are yielding upwards of 5.4% as of yesterday’s close.

To end, though the short-dated options activity may prompt cascading events in market downturns, the main issue is the reduced use of longer-dated options; a supply and demand imbalance likely resolves itself with an implied volatility repricing of a great size where longer-dated options outperform those that are shorter-dated.

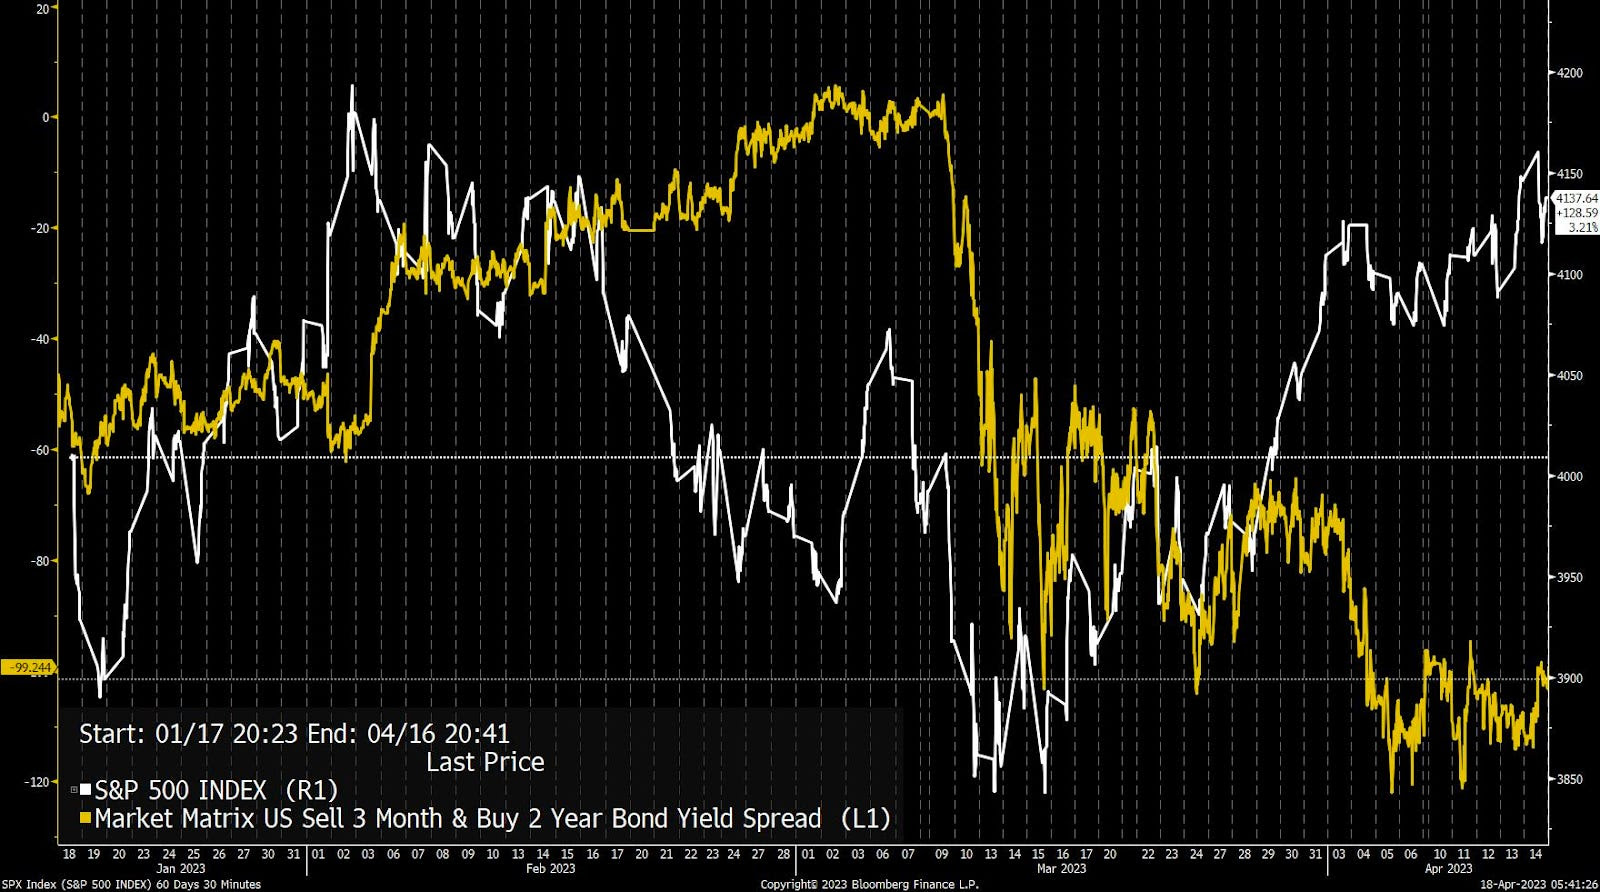
Our locking in of rates or using the profits of call structures to position for a potential IVOL repricing, particularly in the back half of the year when dealer positioning is less clear, buybacks are to fall off of a cliff, rates may fall, and the boost from short-covering has played its course, is an attractive proposition given the context.

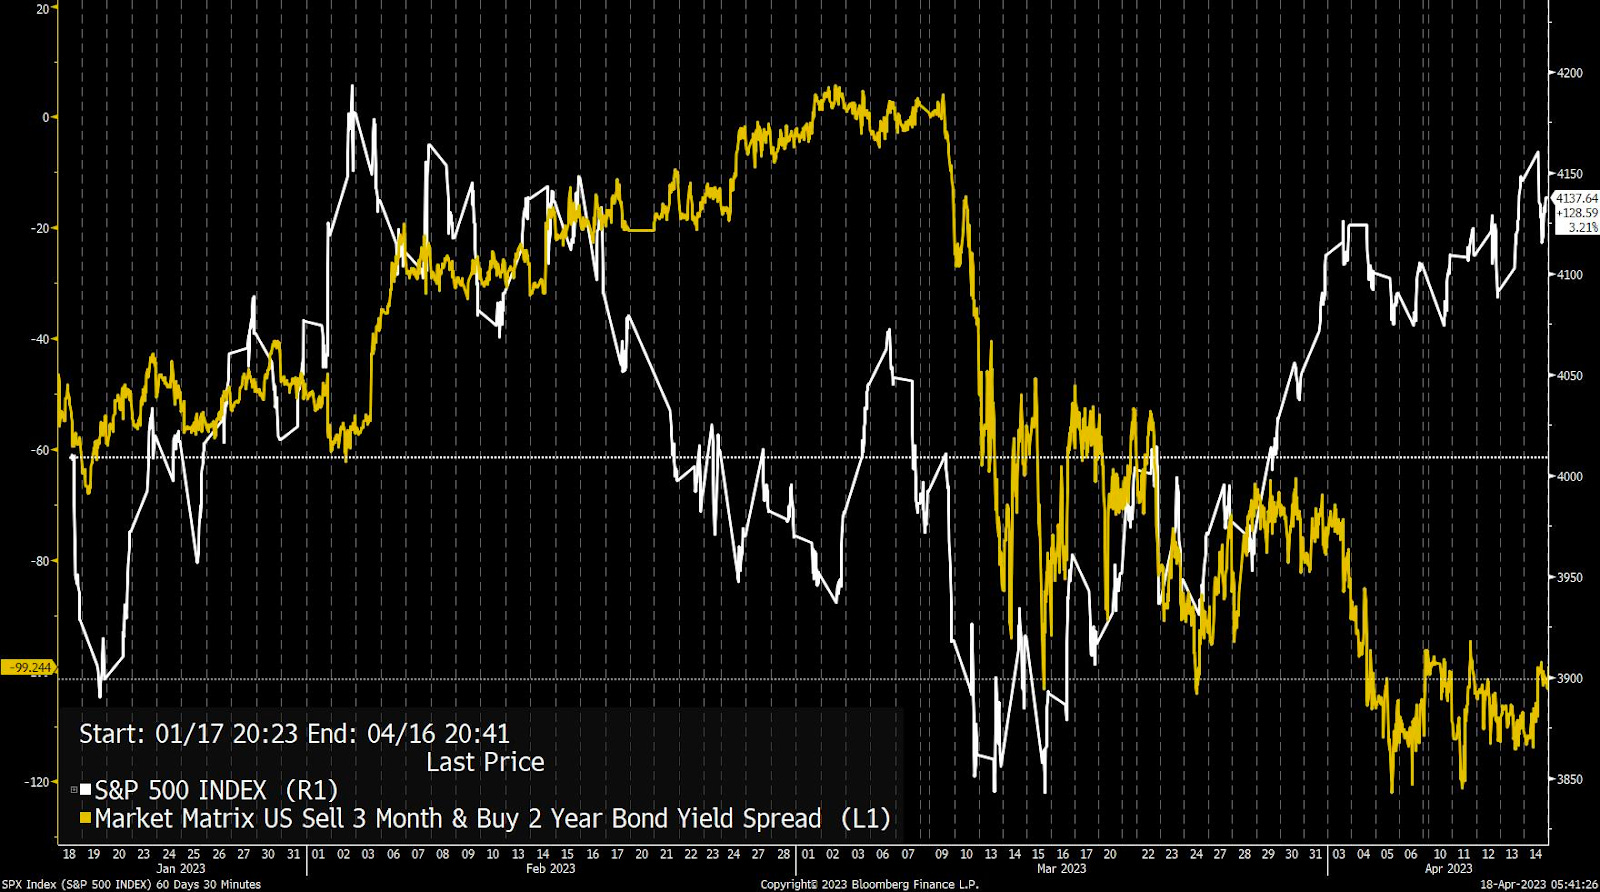
Graphic: Retrieved from Bloomberg. “The S&P 500 (white line) is well above its levels from early March, while the yield on the 3m-2y spread remains in a deep inversion, signifying meaningful expectations of cuts in the months ahead.”

About

Welcome to the Daily Brief by Physik Invest, a soon-to-launch research, consulting, trading, and asset management solutions provider. Learn about our origin story here, and consider subscribing for daily updates on the critical contexts that could lend to future market movement.

Separately, please don’t use this free letter as advice; all content is for informational purposes, and derivatives carry a substantial risk of loss. At this time, Capelj and Physik Invest, non-professional advisors, will never solicit others for capital or collect fees and disbursements. Separately, you may view this letter’s content calendar at this link.

Categories
Commentary

Daily Brief For March 31, 2023

Intrigued about what moves markets and economies and how that can impact your financial wellness? Subscribe to this free newsletter below!

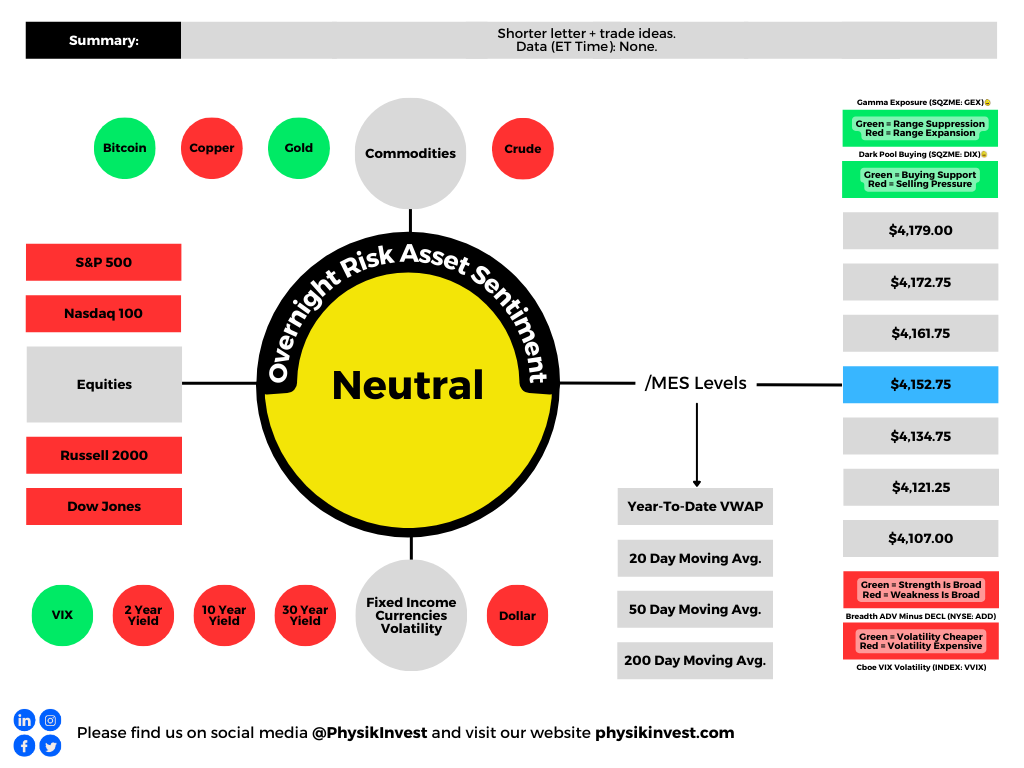
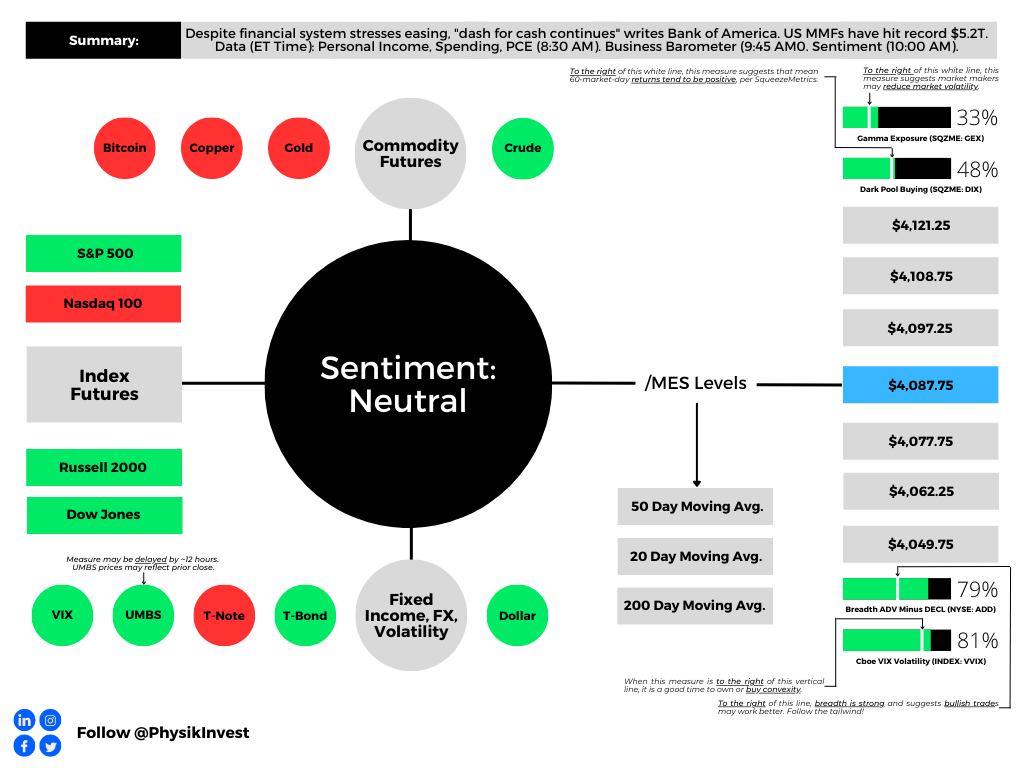
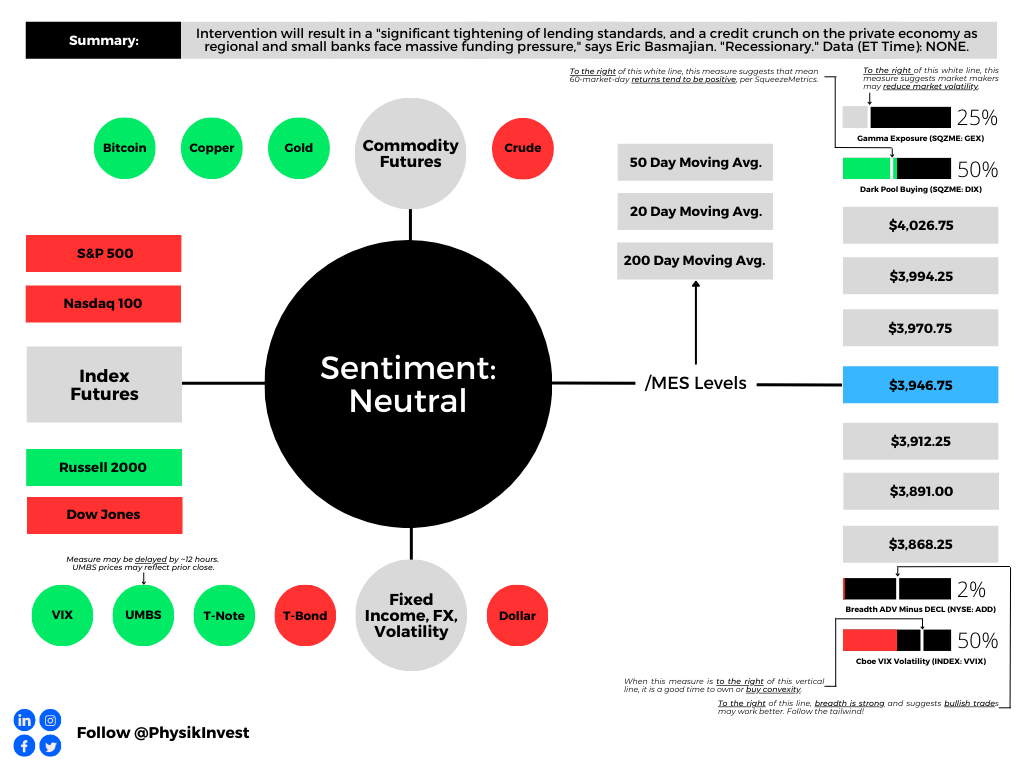
Graphic updated 8:00 AM ET. Sentiment Neutral if expected /MES open is inside of the prior day’s range. /MES levels are derived from the profile graphic at the bottom of this letter. Click here for the latest levels. SqueezeMetrics Dark Pool Index (DIX) and Gamma (GEX) with the latter calculated based on where the prior day’s reading falls with respect to the MAX and MIN of all occurrences available. A higher DIX is bullish. The lower the GEX, the more (expected) volatility. Click to learn the implications of volatility, direction, and moneyness. Breadth reflects a reading of the prior day’s NYSE Advance/Decline indicator. The CBOE VIX Volatility Index (INDEX: VVIX) reflects the attractiveness of owning volatility. UMBS prices via MNDClick here for the economic calendar.

Administrative

Keeping it brief for today. Enjoy your Friday. Be opportunistic and watch your risk.

Positioning

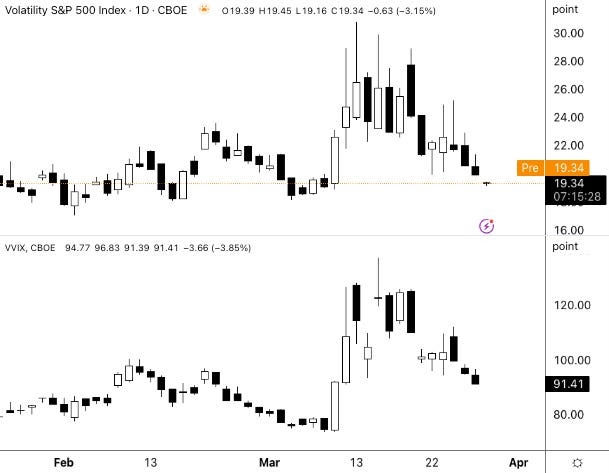
For days prior, top-line measures of implied volatility or IVOL like the Cboe Volatility Index (INDEX: VIX) fell, as did the Cboe VIX Volatility Index (INDEX: VVIX), the latter which is a way to gauge the expensiveness of IVOL or convexity. It was, in part, the resolution of a recent liquidity crisis that prompted this to happen. Under the hood, volatility skew told a different story; traders were hedging against tail outcomes. 

Graphic: Retrieved from Sergei Perfiliev.

Even so, this hedging and volatility skew behavior did little to boost the pricing of most spread structures above and below the market we analyzed. The non-stickiness of IVOL into this rally may have been detrimental to the more expensive call options structures, as we expected; hence, our consistent belief that structures should be kept at low- or no-cost.

The environment changed yesterday, however. Both top- and bottom-line measures of IVOL were sticky into equity market strength. This was observed via the pricing of spread structures (e.g., verticals and back- and ratio-spreads) structured above and below the market. The stickiness of volatility seemed to impact most the put side of the market. Some savvy traders may have been able to build spread structures below the market at a lesser cost potentially.

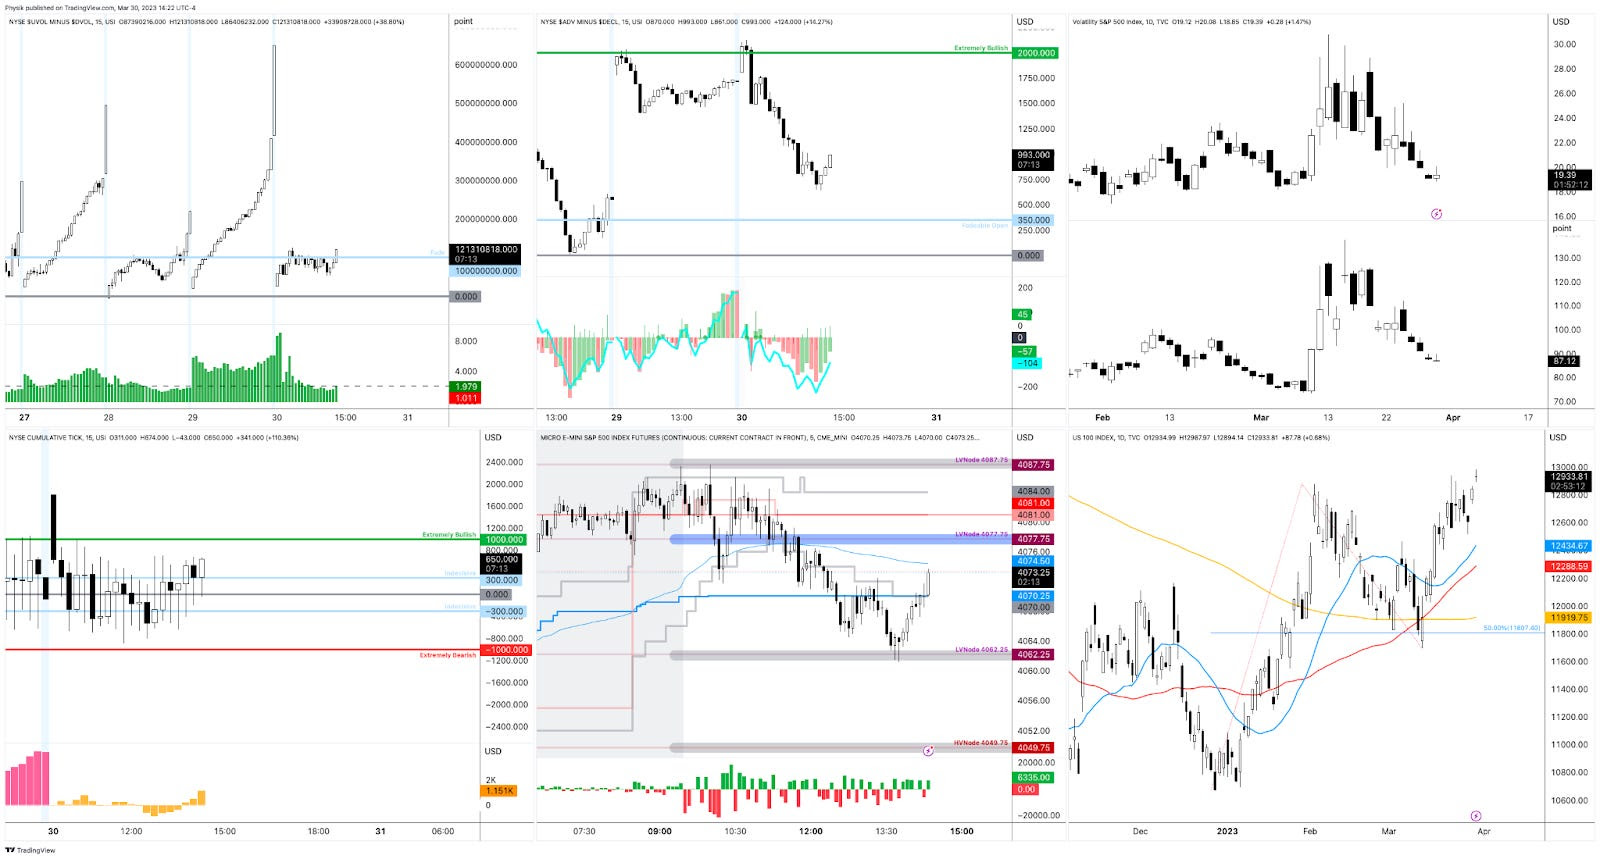
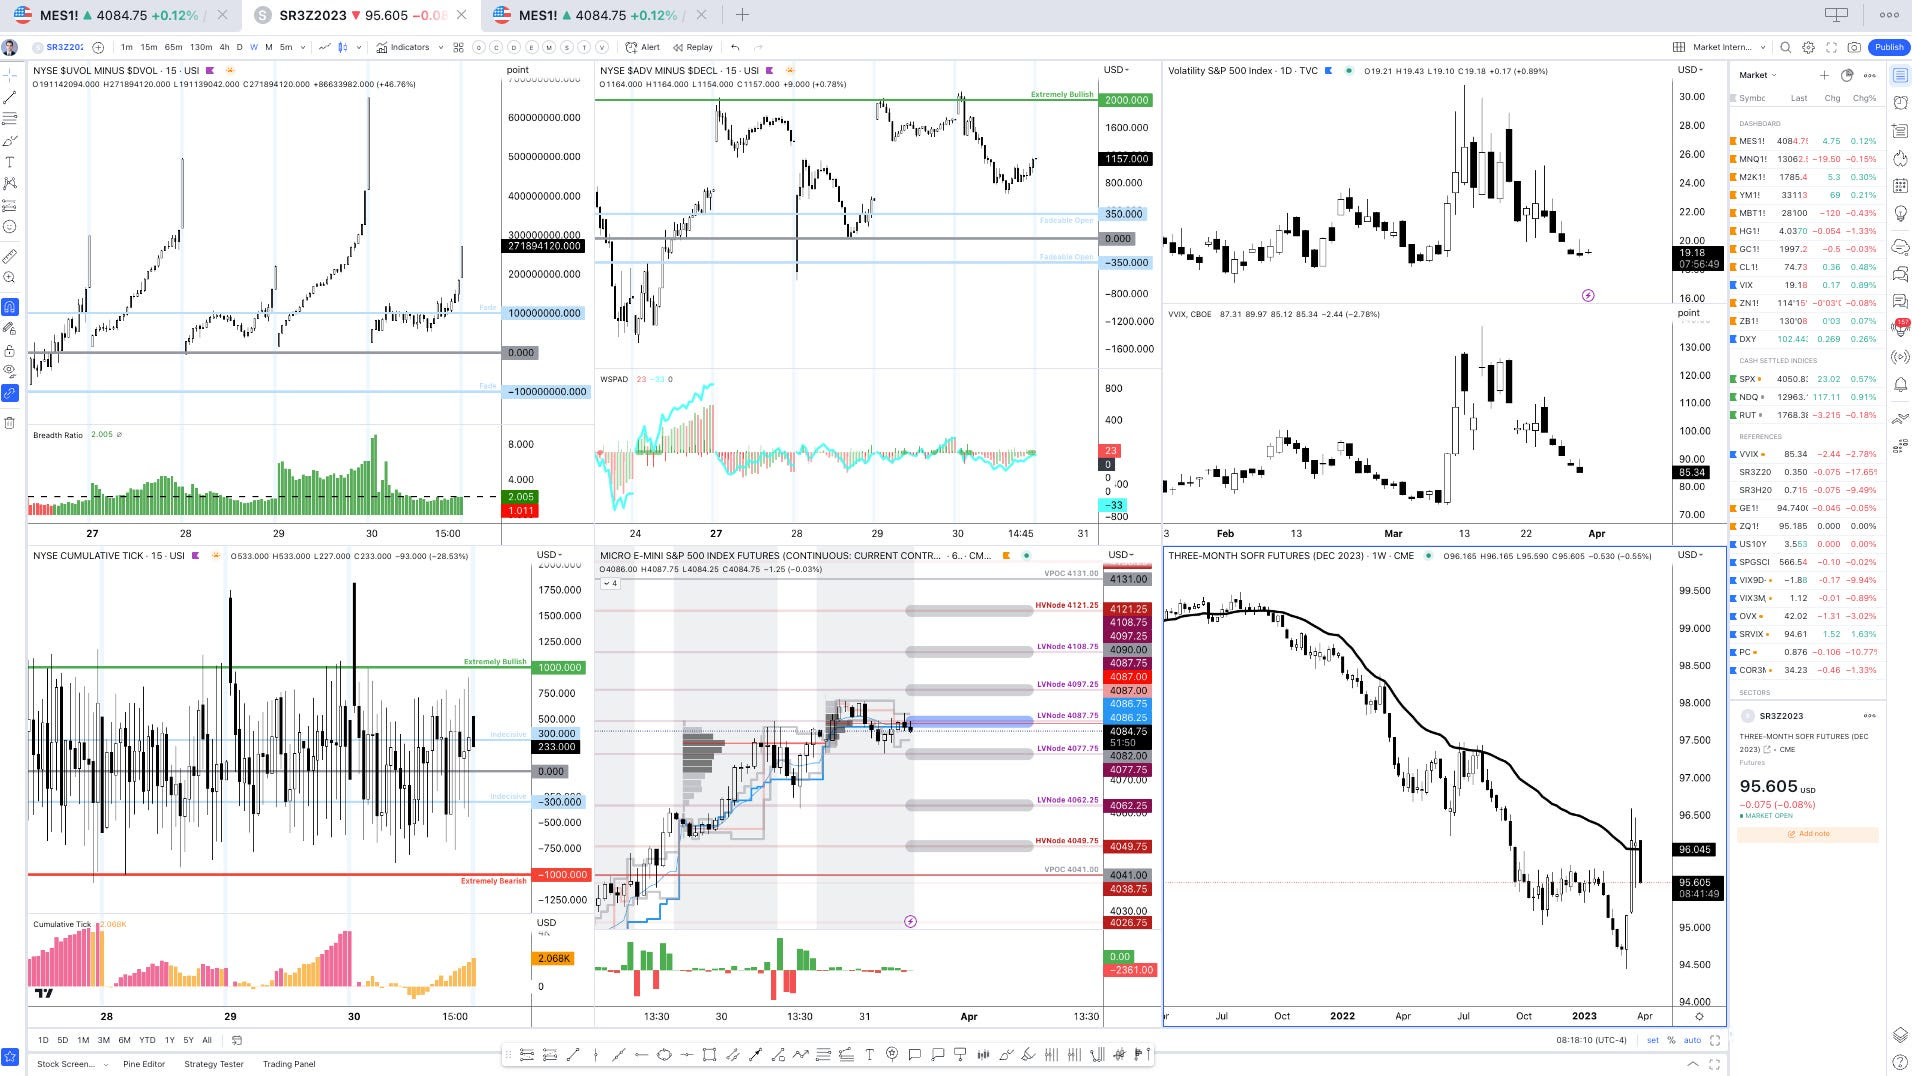
As an aside, some may have observed how well our levels have been working. For instance, as shown below (middle bottom), yesterday’s Daily Brief levels marked the session high and low for the Micro E-mini S&P 500 Index (FUTURE: /MES).

Graphic: Retrieved from TradingView.

Commentators online have rightly pointed out the build-up of short-dated options exposures near current market prices. In short, this activity, and its potential hedging, help promote mean-reversion and responsiveness at our volume profile-derived key levels, which often overlap with centers of significant options activity, as we see. Particularly after the quarterly options expiry (OpEx), this activity’s ability to contain markets will ease; markets will yield to fundamental strengths or weaknesses. Based on top-line measures of breadth and IVOL, “there isn’t much juice left to squeeze,” SpotGamma says. From an options positioning perspective, for volatility to reprice lower and solicit re-hedging that boosts the market, “we need a change in [the] volatility regime (i.e., soft landing, bank crisis resolved, etc.),” SpotGamma adds. The likelihood of that happening is low; some expect the Federal Reserve (Fed) to stick to its original message and continue to tighten and withdraw liquidity. So, blindly selling options (colloquially referred to as volatility) in this environment is dangerous.

Graphic: Retrieved from Bloomberg’s Joe Weisenthal.

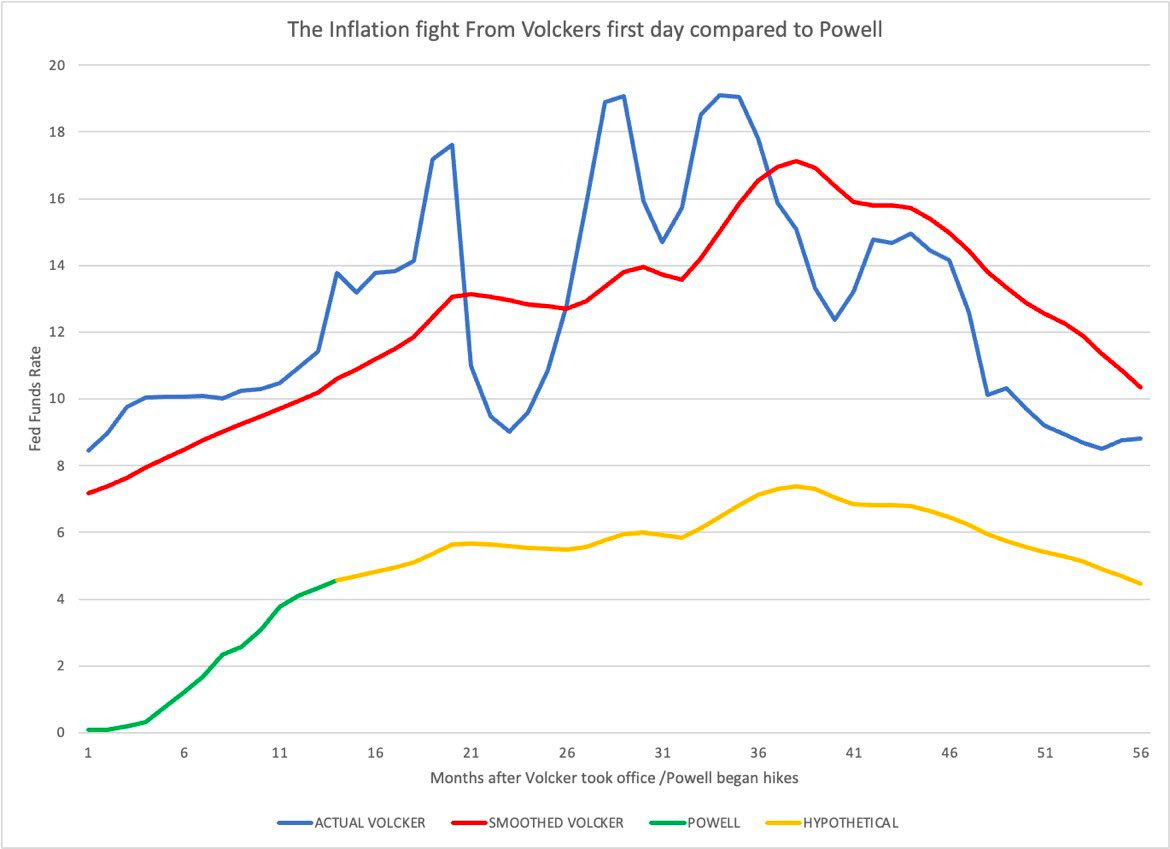
Damped Spring’s Andy Constan overlays past and present inflation fights. What if?

Graphic: Retrieved from Andy Constan of Damped Spring Advisors.

Technical

As of 8:00 AM ET, Friday’s regular session (9:30 AM – 4:00 PM ET) in the S&P 500 will likely open in the middle part of a balanced overnight inventory, inside of the prior day’s range, suggesting a limited potential for immediate directional opportunity.

The S&P 500 pivot for today is $4,087.75. 

Key levels to the upside include $4,097.25, $4,108.75, and $4,121.25.

Key levels to the downside include $4,077.75, $4,062.25, and $4,049.75.

Disclaimer: Click here to load the updated key levels via the web-based TradingView platform. New links are produced daily. Quoted levels likely hold, barring an exogenous development.

Graphic: 65-minute profile chart of the Micro E-mini S&P 500 Futures (bottom middle).

About

The author, Renato Leonard Capelj, spends the bulk of his time at Physik Invest, an entity through which he invests and publishes free daily analyses to thousands of subscribers. The analyses offer him and his subscribers a way to stay on the right side of the market. 

Separately, Capelj is an accredited journalist with past works, including interviews with investor Kevin O’Leary, ARK Invest’s Catherine Wood, FTX’s Sam Bankman-Fried, North Dakota Governor Doug Burgum, Lithuania’s Minister of Economy and Innovation Aušrinė Armonaitė, former Cisco chairman and CEO John Chambers, and persons at the Clinton Global Initiative.

Connect

Direct queries to renato@physikinvest.com. Find Physik Invest on TwitterLinkedInFacebook, and Instagram. Find Capelj on TwitterLinkedIn, and Instagram. Only follow the verified profiles.

Calendar

You may view this letter’s content calendar at this link.

Disclaimer

Do not construe this newsletter as advice; all content is for informational purposes, and derivatives carry a substantial risk of loss. Capelj and Physik Invest, non-professional advisors, will never solicit others for capital or collect fees and disbursements for their work.

Categories
Commentary

Daily Brief For March 29, 2023

Physik Invest’s Daily Brief is a free newsletter sent to thousands of subscribers daily. Intrigued about what moves markets and how that can impact your financial wellness? Subscribe below.

Graphic updated 7:00 AM ET. Sentiment Risk-On if expected /MES open is above the prior day’s range. Click here for the latest levels. /MES levels are derived from the profile graphic at the bottom of this letter. SqueezeMetrics Dark Pool Index (DIX) and Gamma (GEX) with the latter calculated based on where the prior day’s reading falls with respect to the MAX and MIN of all occurrences available. A higher DIX is bullish. The lower the GEX, the more (expected) volatility. Click to learn the implications of volatility, direction, and moneyness. Breadth reflects a reading of the prior day’s NYSE Advance/Decline indicator. The CBOE VIX Volatility Index (INDEX: VVIX) reflects the attractiveness of owning volatility. UMBS prices via MNDClick here for the economic calendar.

Administrative

The newsletter format needs to evolve a bit. Feedback is welcomed! If you are looking for the link to the daily chart, see the caption below the graphic above. Take care!

Positioning

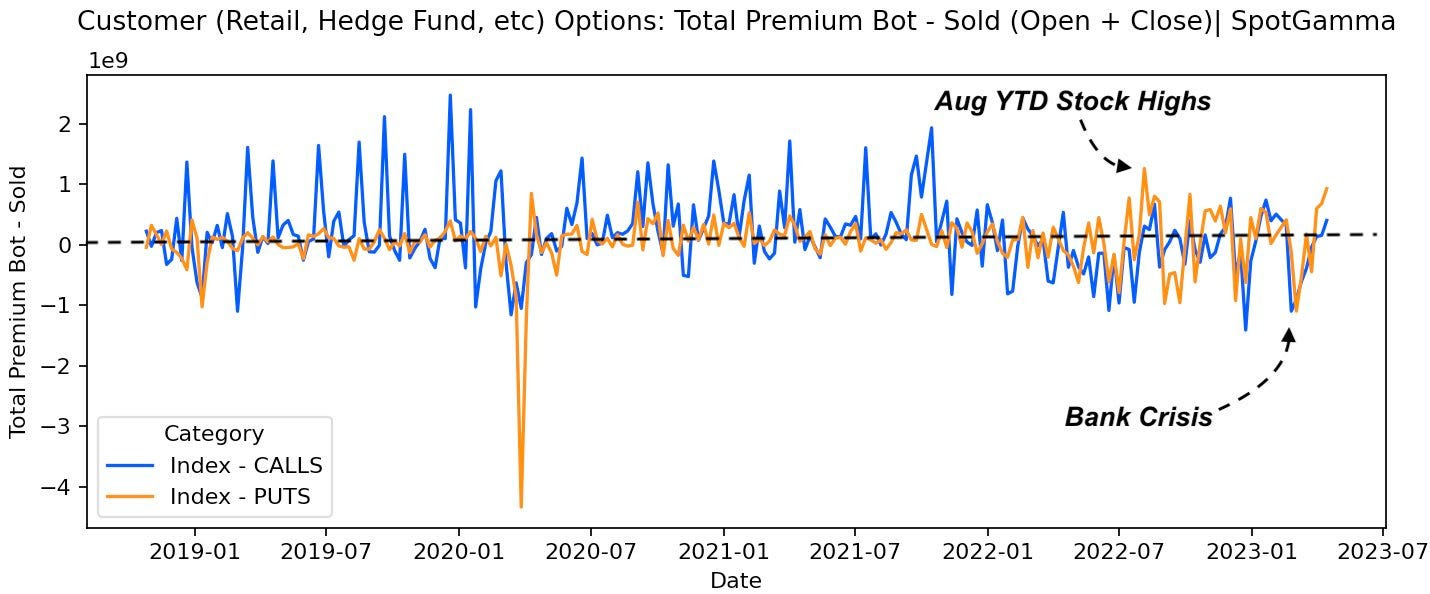
Fear of contagion prompted demands for protection. Measures of implied volatility or IVOL rose, and consequently, these demands for protection pressured markets.

Since then, fear has ebbed.

Read: Black Swan Funds Have A Moment As Investors Hedge Market Doom

Graphic: Retrieved from TradingView.

Previously, this letter explained for protection to keep its value, there would have to be a shift higher in realized volatility or RVOL. Well, RVOL did not come back in a big way at the index level, as many expected.

Thus, the positive effects of the bank-related stimulation and traders’ pulling forward their timeline for easing were compounded by the unwinding of hedging strategies. 

Read: MBA Data Shows Rate Decline Helped Boost Home-Purchase Applications

Graphic: Retrieved from Bloomberg via SpotGamma. “This drop in 5-day realized vol (orange) is pretty sharp, given it occurred from such a low relative level. ‘Can’t short it, don’t want to buy it.’ This vol decline comes as SPX put open interest was cleared with March OPEX, and big VIX call interest expired last week.”

Previously depressed products like the Nasdaq 100 or NDX, which are generally very sensitive to monetary tightening, have performed well.

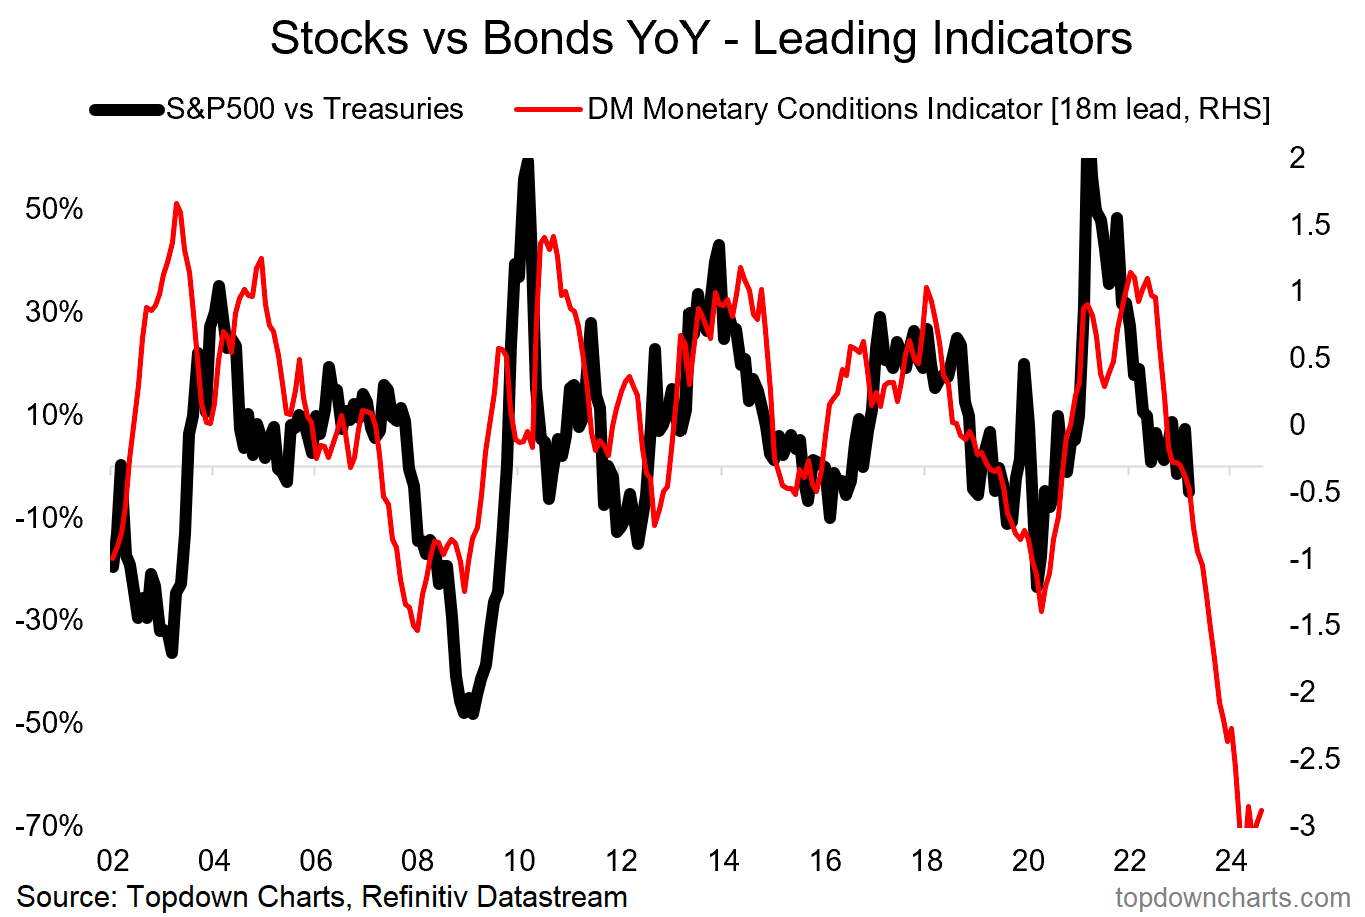
Graphic: Retrieved from Callum Thomas’ Topdown Charts.

As we near month-end, there is a quarterly derivatives expiry. Above current S&P 500 or SPX levels is a significant concentration of soon-to-roll-off open interest held short by investors. This means the counterparties are dynamically hedging a call they own; they’re selling strength and buying weakness, albeit in a less and less meaningful way, as those options near this expiration and their probability of paying out (i.e., delta or exposure to direction) falls.

Graphic: Retrieved from Sergei Perfiliev.

Some would allege that volatility compression and time decay would have solicited a more meaningful response from options counterparties at those strike prices above; the absence of downside follow-through had traders supplying previously demanded downside put protection and catalyzing a rally. However, there are not many things for the market to rally on, and so much time has passed that the charm effects (i.e., the impact of time passing on an options delta) have lessened dramatically, some explain.

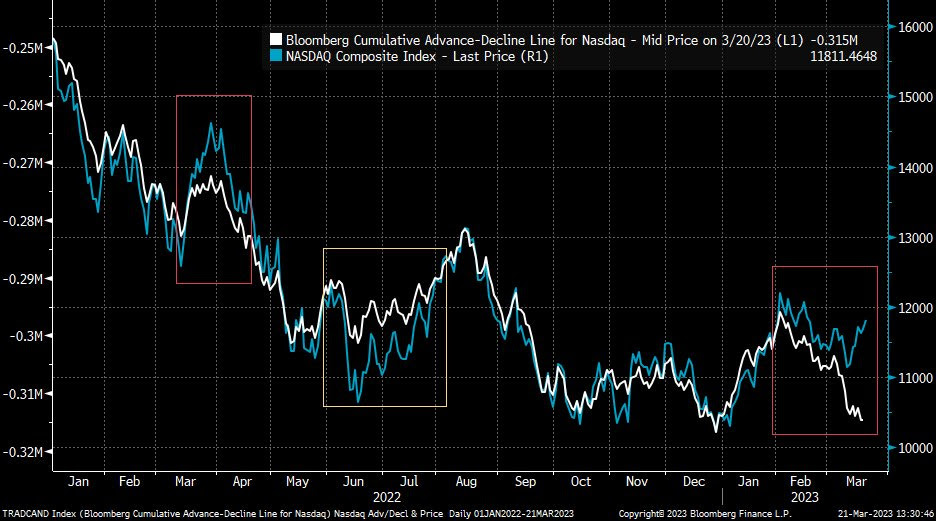
Graphic: Retrieved from Bloomberg via Liz Young. “The Nasdaq’s Cumulative Advance-Decline line has parted ways with index direction in recent days. In other words, the index has rallied despite weak breadth (more stocks falling than rising), the two lines are likely to find their way back together somehow…”

Therefore, it’s probably likely that the market remains contained through month-end. After, movement may increase. This letter acknowledged RVOL might come back in a big way, particularly with the bank intervention doing more to thwart credit creation.

The caveat is that markets can trade spiritedly for far longer. There is a potential for the markets to move into a far “more combustible” position. With call skews far up meaningfully steep, still-present low- and zero-cost call structures this letter has talked about in the past remain attractive.

Graphic: Retrieved from Charles Schwab Corporation-owned (NYSE: SCHW) thinkorswim.

If the market falls apart, your costs are low, and losses are minimal. If markets move higher into that “more combustible” position, wherein “volatility is sticky into a rally,” you may monetize your call structures and roll some of those profits into bear put spreads (i.e., buy put and sell another at a lower strike).

Daily Brief | February 17, 2023

The signs of a “more combustible situation” would likely show when “volatility is sticky into a rally,” explains Kai Volatility’s Cem Karsan. To gauge combustibility, look to the options market. 

Remember, calls trade at a lower IVOL than puts. As the market trades higher, it slides to a lower IVOL, reflected by broad IVOL measures. If broad IVOL measures are sticky/bid, “that’s an easy way to say that fixed-strike volatility is coming up and, if that can happen for days, that can unpin volatility and create a situation where dealers themselves are no longer [own] a ton of volatility; they start thinning out on volatility themselves, and that creates a more combustible situation.” 

To explain the “thinning out” part of the last paragraph, recall participants often opt to own equity and downside (put) protection financed, in part, with sales of upside (call) protection. More demand for calls will result in counterparties taking on more exposure against movement (i.e., negative gamma) hedged via purchases of the underlying. Once that exposure expires and/or decays, that dealer-based support will be withdrawn. If the assumption is that equity markets are expensive now, then, after another rally, there may be more room to fall, all else equal (a simplistic way to look at this), hence the increased precariousness and combustibility.

Read: Buy-Or-Rent Premium Is Highest Since 2006 Housing Bubble

Graphic: Retrieved from Callum Thomas’ Topdown charts.

About

The author, Renato Leonard Capelj, spends the bulk of his time at Physik Invest, an entity through which he invests and publishes free daily analyses to thousands of subscribers. The analyses offer him and his subscribers a way to stay on the right side of the market. 

Separately, Capelj is an accredited journalist with past works, including interviews with investor Kevin O’Leary, ARK Invest’s Catherine Wood, FTX’s Sam Bankman-Fried, North Dakota Governor Doug Burgum, Lithuania’s Minister of Economy and Innovation Aušrinė Armonaitė, former Cisco chairman and CEO John Chambers, and persons at the Clinton Global Initiative.

Connect

Direct queries to renato@physikinvest.com. Find Physik Invest on Twitter, LinkedIn, Facebook, and Instagram. Find Capelj on Twitter, LinkedIn, and Instagram. Only follow the verified profiles.

Calendar

You may view this letter’s content calendar at this link.

Disclaimer

Do not construe this newsletter as advice; all content is for informational purposes. Capelj and Physik Invest are non-professional advisors managing their own capital. They will never openly solicit others for capital or manage others’ capital to collect fees and disbursements.

Categories
Commentary

Daily Brief For March 28, 2023

Physik Invest’s Daily Brief is read free by thousands of subscribers. Join this community to learn about the fundamental and technical drivers of markets.

Graphic updated 7:00 AM ET. Sentiment Neutral if expected /MES open is inside of the prior day’s range. /MES levels are derived from the profile graphic at the bottom of this letter. Click here for the latest levels. SqueezeMetrics Dark Pool Index (DIX) and Gamma (GEX) with the latter calculated based on where the prior day’s reading falls with respect to the MAX and MIN of all occurrences available. A higher DIX is bullish. The lower the GEX, the more (expected) volatility. Click to learn the implications of volatility, direction, and moneyness. Breadth reflects a reading of the prior day’s NYSE Advance/Decline indicator. The CBOE VIX Volatility Index (INDEX: VVIX) reflects the attractiveness of owning volatility. UMBS prices via MNDClick here for the economic calendar.

Administrative

Time for something inspiring! Separate from his work at Physik Invest, founder Renato Leonard Capelj is a journalist interviewing global leaders in business, government, and finance. In his desire to learn and apply the methods of those others who are far more experienced, Capelj has a long list of interviews you may find helpful in strengthening your understanding of markets. Check out some recent ones!

March 10, 2023: Portfolio Manager Prefers Option, Bond Overlays To Hedge Big Uncertainty Facing Markets

Capelj spoke with Simplify Asset Management’s Michael Green about cutting investors’ portfolio volatility while amplifying profit potential.

In response to uncertainty, Green says investors can park cash in short-term near-risk-free bonds yielding 5% or more, as well as allocate some capital to volatility “to introduce a degree of convexity,” risking only the premium paid. Alternatively, investors can take a more optimistic long view and position in innovations like artificial intelligence or next-generation energy production.

January 8, 2023: Two Major Risks Investors Should Watch Out For In 2023

Capelj spoke with The Ambrus Group’s Kris Sidial about his market perspectives.

Naive measures like the VVIX, which is the volatility of the VIX or the volatility of the S&P 500’s volatility, are printing at levels last seen in 2017, Sidial explains, noting this would suggest “we can get cheap exposure to convexity while a lot of people are worried.”

“Even if inflation continues, the rate at which it rises won’t be the same. Due to this, CTA exposures likely will not perform as well as they did in 2022, and that’s why you may see more opportunities in the volatility space.”

June 28, 2022: Former Bridgewater Associate Andy Constan Talks Recession Odds, Capturing A Macro Edge

Capelj spoke with Damped Spring Advisors’ Andy Constan about what investors should focus on and how he creates trades that lose him less money.

Constan’s trades are constructed around two- to four-month time horizons and are structured long and short using defined-risk options trades like debit or credit spreads, depending on whether volatility is cheap or expensive.

I want deltas and leverage. My macro indicators give me an edge on price and in the worst case, the loss is limited to 10%, if everything has to go against me all at once. I can be 100% invested and only risk 10%.”

May 16, 2022: 42 Macro’s Darius Dale On His Wall Street Story, The Markets: ‘This Is Not The Financial Crisis’

Capelj spoke with 42 Macro’s Darius Dale about his Wall Street story and perspectives on life and markets.

“We’re tracking at an above-potential level of output in terms of the growth rate of output. We’re also slowing and the pace of that deceleration is likely to pick up steam in the coming quarters.”

By 2023, that process is likely to “catalyze pressure on asset markets through the lens of corporate earnings and valuations you assign to a lower level of growth.”

July 22, 2021: ShadowTrader’s Peter Reznicek On His Early Days, Tips For Success And Evolution

Capelj spoke with ShadowTrader’s Peter Reznicek about his start, perspectives, success tips, and visions for the future.

Reznicek recalled two turning points in his trading career.

The first was learning from expert floor traders involved with the thinkorswim team.

“That was really the genesis of where I started to learn the broken-wing butterflyratio spread and things like that,” he shared.

Floor traders, according to Reznicek, had low capital requirements. As a result, they could put on strategies like the 1×2 ratio — a debit spread with an extra short option — for a low cost.

(See parts 12, and 3 of ShadowTrader’s how-to series on ratio spreads.)

“On the floor, it is either go big or go home,” he chuckled, remarking that ratio spreads were the way of the casino. “You either get rich or they take your house. So, why would you put on any other spread?”

The next big turning point was Jim Dalton, who’s been a member of the Chicago Board of Trade, as well as a member of the Chicago Board Options Exchange (CBOE) and senior executive vice president of the CBOE during its formative years.

“I’m still in touch with him on a regular basis and I consider him a friend,” Reznicek said in a discussion on Dalton’s works like Mind Over Markets and Markets in Profile, as well as his use of WindoTrader Market Profile software. “I went to Chicago twice to see him teach live … and I came home from those seminars with five, six, 10 pages of notes. The nuances of profile continue to mold me.”

July 26, 2021: Kai Volatility’s Cem Karsan Unpacks Implications Of Fed Taper, Shift To Fiscal Policy And More

Capelj spoke with Kai Volatility Advisors’ Cem Karsan about the implications of record valuations and the growth of derivatives markets on policy, the economy, and financial markets.

“It’s not a coincidence that the mid-February to mid-March 2020 downturn literally started the day after February expiration and ended the day of March quarterly expiration. These derivatives are incredibly embedded in how the tail reacts and there’s not enough liquidity, given the leverage, if the Fed were to taper.”

July 13, 2021: Ambrus Group CIO On Taking Advantage Of Volatility Dislocations

Capelj spoke with The Ambrus Group’s Kris Sidial to understand how to capitalize on volatility dislocations.

Unlike standard tail-risk funds which systematically buy equity puts, Ambrus’ approach is bespoke, cutting down on negative dynamics like decay with respect to time.

Given dislocations across single stock skew, term structure, and volatility risk premium, Ambrus will position itself in options with less time to maturity, buying protection up to six weeks out.

“The market will underestimate the distribution,” Sidial said in a conversation on Ambrus’ internal models that spot positional imbalances to determine who is off-sides and in what single asset. “We’re buying things that have happened before and we’re looking for it to carry a heavier beta when the sell-off happens.”

So, by analyzing flow, as well as using internal models to assess the probabilities of deleveraging in a risk-off event, Ambrus is able to venture into individual stocks where there may be excess fragility; “I know if stock XYZ goes down five percent, it’s going to go down 10% because this fund needs to deleverage.”

To aid the cost to carry, Ambrus utilizes defined-risk, short-volatility, absolute return strategies.

“I’m basically giving you a free put on the market – with a ton of convexity – with something that offers a payout that’s just more than a regular put,” Sidial summarized. “If the market doesn’t do anything, and we do an amazing job, we’re flat and you made money on all your long-only equity exposure.”

“You had a free hedge the entire time.”

February 1, 2021: Volatility Arbitrage Trader Talks GameStop, Market Microstructure, Regulation

Capelj spoke with The Ambrus Group’s Kris Sidial about the meme stock debacle of 2021.

“You have distressed debt hedge funds that focus on shorting these types of companies. Melvin Capital is the one that is singled out due to the media, but they aren’t the only ones.”

Market participants added to the crash-up dynamics. Retail investors aggressively bought stock and short-term call options, while institutional investors further took advantage of the momentum and dislocations.

“You have this dynamic in the derivatives market where there is a gamma squeeze when people are buying way far out-of-the-money calls, and dealers reflexively have to hedge off their risk,” Sidial said.

“It causes a cascading reaction, moving the stock price up because dealers are short calls and they have to buy stock when the delta moves a specific way.”

The participation in the stock on the institutional side has not received much attention, he said. 

“We’ve noticed that some of the flow is more institutional,” he said in reference to activity on the level two and three order books, which are electronic lists of buy and sell orders for a particular security.

“You have certain prop guys and other hedge funds that understand what’s going on, and they’re trying to take advantage of it, as well.”

This institutional activity disrupted traditional correlations and caused shares of distressed debt assets like GameStop, BlackBerry Ltd, and AMC Entertainment Holdings Inc to trade in-line with each other.

“This was not some WallStreetBet user, … if you look at how some of these things were moving premarket, you would see GME drop like 2%, BB’s best bid would drop and AMC’s best bid would drop. That’s an algo.”

The takeaway: although the WallStreetBets crowd is getting most of the blame, institutions are also at fault for the volatility.

Technical

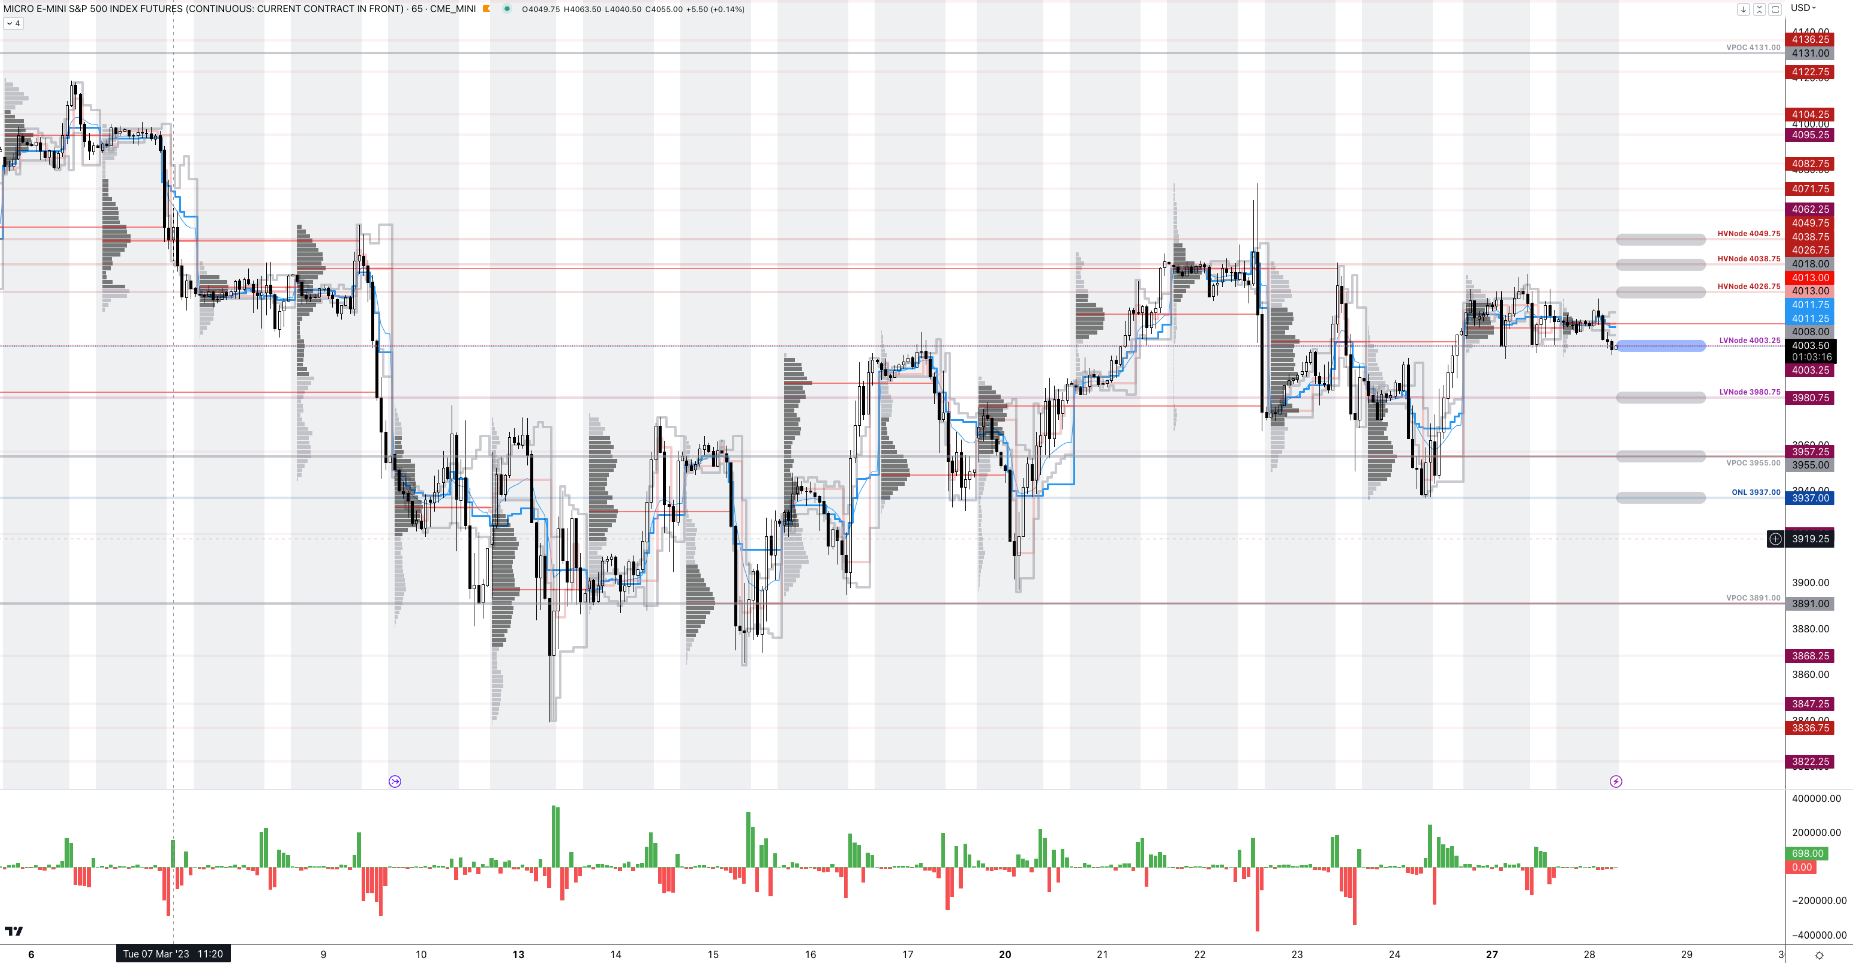
As of 7:00 AM ET, Tuesday’s regular session (9:30 AM – 4:00 PM ET) in the S&P 500 will likely open in the lower part of a balanced overnight inventory, inside the prior day’s range, suggesting a limited potential for immediate directional opportunity.

The S&P 500 pivot for today is $4,003.25. 

Key levels to the upside include $4,026.75, $4,038.75, and $4,049.75.

Key levels to the downside include $3,980.75, $3,955.00, and $3,937.00.

Disclaimer: Click here to load the updated key levels via the web-based TradingView platform. New links are produced daily. Quoted levels likely hold, barring an exogenous development.

Graphic: 65-minute profile chart of the Micro E-mini S&P 500 Futures.

Definitions

Overnight Rally Highs (Lows): Typically, there is a low historical probability associated with overnight rally-highs (lows) ending the upside (downside) discovery process.

Volume Areas: Markets will build on areas of high-volume (HVNodes). Should the market trend for some time, this will be identified by a low-volume area (LVNodes). The LVNodes denote directional conviction and ought to offer support on any test.

If participants auction and find acceptance in an area of a prior LVNode, then future discovery ought to be volatile and quick as participants look to the nearest HVNodes for more favorable entry or exit.

POCs: Areas where two-sided trade was most prevalent in a prior day session. Participants will respond to future value tests as they offer favorable entry and exit.


Definitions

Volume Areas: Markets will build on areas of high-volume (HVNodes). Should the market trend for some time, this will be identified by a low-volume area (LVNodes). The LVNodes denote directional conviction and ought to offer support on any test.

If participants auction and find acceptance in an area of a prior LVNode, then future discovery ought to be volatile and quick as participants look to the nearest HVNodes for more favorable entry or exit.


About

The author, Renato Leonard Capelj, spends the bulk of his time at Physik Invest, an entity through which he invests and publishes free daily analyses to thousands of subscribers. The analyses offer him and his subscribers a way to stay on the right side of the market. 

Separately, Capelj is an accredited journalist with past works including interviews with investor Kevin O’Leary, ARK Invest’s Catherine Wood, FTX’s Sam Bankman-Fried, North Dakota Governor Doug Burgum, Lithuania’s Minister of Economy and Innovation Aušrinė Armonaitė, former Cisco chairman and CEO John Chambers, and persons at the Clinton Global Initiative.

Connect

Direct queries to renato@physikinvest.com. Find Physik Invest on TwitterLinkedInFacebook, and Instagram. Find Capelj on TwitterLinkedIn, and Instagram. Only follow the verified profiles.

Calendar

You may view this letter’s content calendar at this link.

Disclaimer

Do not construe this newsletter as advice. All content is for informational purposes. Capelj and Physik Invest manage their own capital and will not solicit others for it.

Categories
Methodology

Successful Traders’ Tips To Beat The Markets

Separate from his work at Physik Invest, founder Renato Leonard Capelj is an accredited journalist interviewing prestigious global leaders in business, government, and finance.

In his desire to learn and apply the methods of those others who are far more experienced, Capelj has a long list of interviews you may find helpful in strengthening your understanding of markets.

March 10, 2023: Portfolio Manager Prefers Option, Bond Overlays To Hedge Big Uncertainty Facing Markets

Capelj spoke with Simplify Asset Management’s Michael Green about cutting investors’ portfolio volatility while amplifying profit potential.

In response to uncertainty, Green says investors can park cash in short-term near-risk-free bonds yielding 5% or more, as well as allocate some capital to volatility “to introduce a degree of convexity,” risking only the premium paid. Alternatively, investors can take a more optimistic long view and position in innovations like artificial intelligence or next-generation energy production.

Michael Green of Simplify Asset Management

January 8, 2023: Two Major Risks Investors Should Watch Out For In 2023

Capelj spoke with The Ambrus Group’s Kris Sidial about his market perspectives.

Naive measures like the VVIX, which is the volatility of the VIX or the volatility of the S&P 500’s volatility, are printing at levels last seen in 2017, Sidial explains, noting this would suggest “we can get cheap exposure to convexity while a lot of people are worried.”

“Even if inflation continues, the rate at which it rises won’t be the same. Due to this, CTA exposures likely will not perform as well as they did in 2022, and that’s why you may see more opportunities in the volatility space.”

Kris Sidial of The Ambrus Group

June 28, 2022: Former Bridgewater Associate Andy Constan Talks Recession Odds, Capturing A Macro Edge

Capelj spoke with Damped Spring Advisors’ Andy Constan about what investors should focus on and how he creates trades that lose him less money.

Constan’s trades are constructed around two- to four-month time horizons and are structured long and short using defined-risk options trades like debit or credit spreads, depending on whether volatility is cheap or expensive.

I want deltas and leverage. My macro indicators give me an edge on price and in the worst case, the loss is limited to 10%, if everything has to go against me all at once. I can be 100% invested and only risk 10%.”

Andy Constan of Damped Spring Advisors

May 16, 2022: 42 Macro’s Darius Dale On His Wall Street Story, The Markets: ‘This Is Not The Financial Crisis’

Capelj spoke with 42 Macro’s Darius Dale about his Wall Street story and perspectives on life and markets.

“We’re tracking at an above-potential level of output in terms of the growth rate of output. We’re also slowing and the pace of that deceleration is likely to pick up steam in the coming quarters.”

By 2023, that process is likely to “catalyze pressure on asset markets through the lens of corporate earnings and valuations you assign to a lower level of growth.”

Darius Dale of 42 Macro

July 22, 2021: ShadowTrader’s Peter Reznicek On His Early Days, Tips For Success And Evolution

Capelj spoke with ShadowTrader’s Peter Reznicek about his start, perspectives, success tips, and visions for the future.

Reznicek recalled two turning points in his trading career.

The first was learning from expert floor traders involved with the thinkorswim team.

“That was really the genesis of where I started to learn the broken-wing butterflyratio spread and things like that,” he shared.

Floor traders, according to Reznicek, had low capital requirements. As a result, they could put on strategies like the 1×2 ratio — a debit spread with an extra short option — for a low cost.

(See parts 12, and 3 of ShadowTrader’s how-to series on ratio spreads.)

“On the floor, it is either go big or go home,” he chuckled, remarking that ratio spreads were the way of the casino. “You either get rich or they take your house. So, why would you put on any other spread?”

The next big turning point was Jim Dalton, who’s been a member of the Chicago Board of Trade, as well as a member of the Chicago Board Options Exchange (CBOE) and senior executive vice president of the CBOE during its formative years.

“I’m still in touch with him on a regular basis and I consider him a friend,” Reznicek said in a discussion on Dalton’s works like Mind Over Markets and Markets in Profile, as well as his use of WindoTrader Market Profile software. “I went to Chicago twice to see him teach live … and I came home from those seminars with five, six, 10 pages of notes. The nuances of profile continue to mold me.”

Peter Reznicek of ShadowTrader

July 26, 2021: Kai Volatility’s Cem Karsan Unpacks Implications Of Fed Taper, Shift To Fiscal Policy And More

Capelj spoke with Kai Volatility Advisors’ Cem Karsan about the implications of record valuations and the growth of derivatives markets on policy, the economy, and financial markets.

“It’s not a coincidence that the mid-February to mid-March 2020 downturn literally started the day after February expiration and ended the day of March quarterly expiration. These derivatives are incredibly embedded in how the tail reacts and there’s not enough liquidity, given the leverage, if the Fed were to taper.”

Cem Karsan of Kai Volatility Advisors

July 13, 2021: Ambrus Group CIO On Taking Advantage Of Volatility Dislocations

Capelj spoke with The Ambrus Group’s Kris Sidial to understand how to capitalize on volatility dislocations.

Unlike standard tail-risk funds which systematically buy equity puts, Ambrus’ approach is bespoke, cutting down on negative dynamics like decay with respect to time.

Given dislocations across single stock skew, term structure, and volatility risk premium, Ambrus will position itself in options with less time to maturity, buying protection up to six weeks out.

“The market will underestimate the distribution,” Sidial said in a conversation on Ambrus’ internal models that spot positional imbalances to determine who is off-sides and in what single asset. “We’re buying things that have happened before and we’re looking for it to carry a heavier beta when the sell-off happens.”

So, by analyzing flow, as well as using internal models to assess the probabilities of deleveraging in a risk-off event, Ambrus is able to venture into individual stocks where there may be excess fragility; “I know if stock XYZ goes down five percent, it’s going to go down 10% because this fund needs to deleverage.”

To aid the cost to carry, Ambrus utilizes defined-risk, short-volatility, absolute return strategies.

“I’m basically giving you a free put on the market – with a ton of convexity – with something that offers a payout that’s just more than a regular put,” Sidial summarized. “If the market doesn’t do anything, and we do an amazing job, we’re flat and you made money on all your long-only equity exposure.”

“You had a free hedge the entire time.”

Kris Sidial of The Ambrus Group

February 1, 2021: Volatility Arbitrage Trader Talks GameStop, Market Microstructure, Regulation

Capelj spoke with The Ambrus Group’s Kris Sidial about the meme stock debacle of 2021.

“You have distressed debt hedge funds that focus on shorting these types of companies. Melvin Capital is the one that is singled out due to the media, but they aren’t the only ones.”

Market participants added to the crash-up dynamics. Retail investors aggressively bought stock and short-term call options, while institutional investors further took advantage of the momentum and dislocations.

“You have this dynamic in the derivatives market where there is a gamma squeeze when people are buying way far out-of-the-money calls, and dealers reflexively have to hedge off their risk,” Sidial said.

“It causes a cascading reaction, moving the stock price up because dealers are short calls and they have to buy stock when the delta moves a specific way.”

The participation in the stock on the institutional side has not received much attention, he said. 

“We’ve noticed that some of the flow is more institutional,” he said in reference to activity on the level two and three order books, which are electronic lists of buy and sell orders for a particular security.

“You have certain prop guys and other hedge funds that understand what’s going on, and they’re trying to take advantage of it, as well.”

This institutional activity disrupted traditional correlations and caused shares of distressed debt assets like GameStop, BlackBerry Ltd, and AMC Entertainment Holdings Inc to trade in-line with each other.

“This was not some WallStreetBet user, … if you look at how some of these things were moving premarket, you would see GME drop like 2%, BB’s best bid would drop and AMC’s best bid would drop. That’s an algo.”

The takeaway: although the WallStreetBets crowd is getting most of the blame, institutions are also at fault for the volatility.

Kris Sidial of The Ambrus Group
Categories
Commentary

Daily Brief For March 21, 2023

Physik Invest’s Daily Brief is read free by thousands of subscribers. Join this community to learn about the fundamental and technical drivers of markets.

Graphic updated 7:00 AM ET. Sentiment Risk-On if expected /MES open is above the prior day’s range. /MES levels are derived from the profile graphic at the bottom of this letter. Click here for the latest levels. SqueezeMetrics Dark Pool Index (DIX) and Gamma (GEX) with the latter calculated based on where the prior day’s reading falls with respect to the MAX and MIN of all occurrences available. A higher DIX is bullish. The lower the GEX, the more (expected) volatility. Click to learn the implications of volatility, direction, and moneyness. Breadth reflects a reading of the prior day’s NYSE Advance/Decline indicator. The CBOE VIX Volatility Index (INDEX: VVIX) reflects the attractiveness of owning volatility. UMBS prices via MNDClick here for the economic calendar.

Administrative

Not all doom and gloom. Make sure to read to the end!

Fundamental

In the Daily Brief for 3/20, we summarized the financial industry and policymaker responses that would turn asset fire sales into managed, orderly asset sales. 

Graphic: Retrieved from Sergei Perfiliev.

The net result of the intervention would be a reduction in credit creation, a tightening of financial conditions, as well as a slowing of the economy and inflation while, potentially, setting “a dangerous precedent that simply encourage[s] future irresponsible behavior” (e.g., risky lending/borrowing), the House Freedom Caucus put eloquently. Basically, the fear is in policymakers underwriting the losses of prevailing carry-type strategies and setting the stage for an even bigger unwind or so-called “Minsky moment,” the “sudden crash of markets and economies that are hooked on debt,” Bloomberg reports

The likes of Elon Musk express fear, too!

A systemic credit event is among strategists’ biggest fear, indeed. A Bank of America Corporation (NYSE: BAC) survey shows a credit event happening on the heels of a US shadow banking, corporate debt, and developed-market real-estate collapse. Recall this letter writer’s conversation with Simplify Asset Management’s Michael Green who said he sees “cracks in bubbles like commercial real estate” already appearing, too.

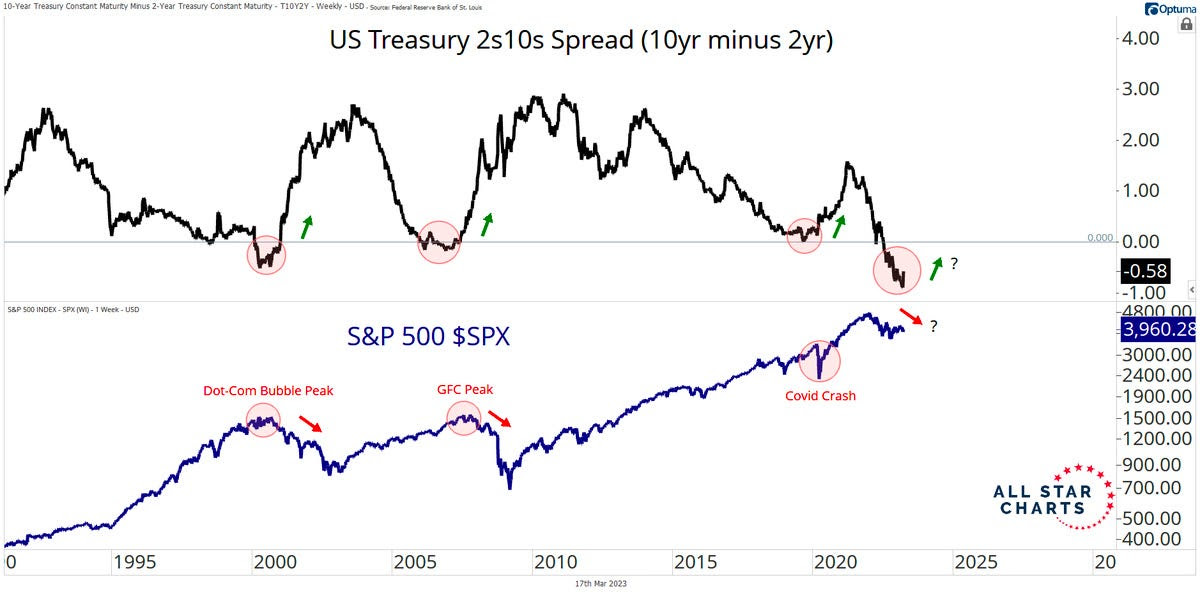
Bloomberg adds that JPMorgan Chase & Co (NYSE: JPM) strategists think the inverted yield curve signals recession and the stocks are likely nearing their high point.

Graphic: Retrieved from Callum Thomas’ Weekly S&P 500 ChartStorm.

JPM adds that market lows won’t occur until interest rate cuts ensue.

Graphic: Retrieved from BNP Paribas ADR (OTC: BNPQY).

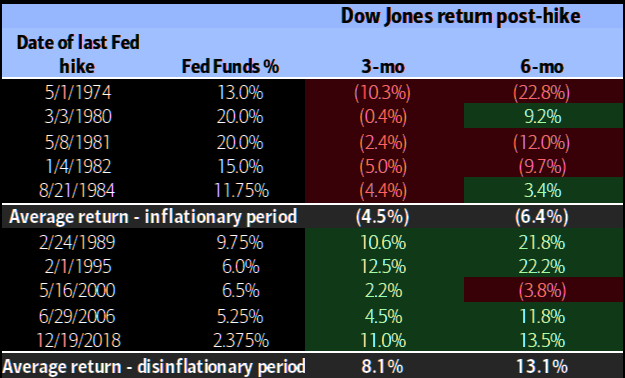
Recall 3/20’s letter citing BAC research that finds selling markets on the last Fed rate hike is a good strategy. The “Minsky moment” comment/fear has others at JPM adding that investors should sell into relief bounces.

Graphic: Retrieved from Bank of American Corporation (NYSE: BAC) via The Market Ear.

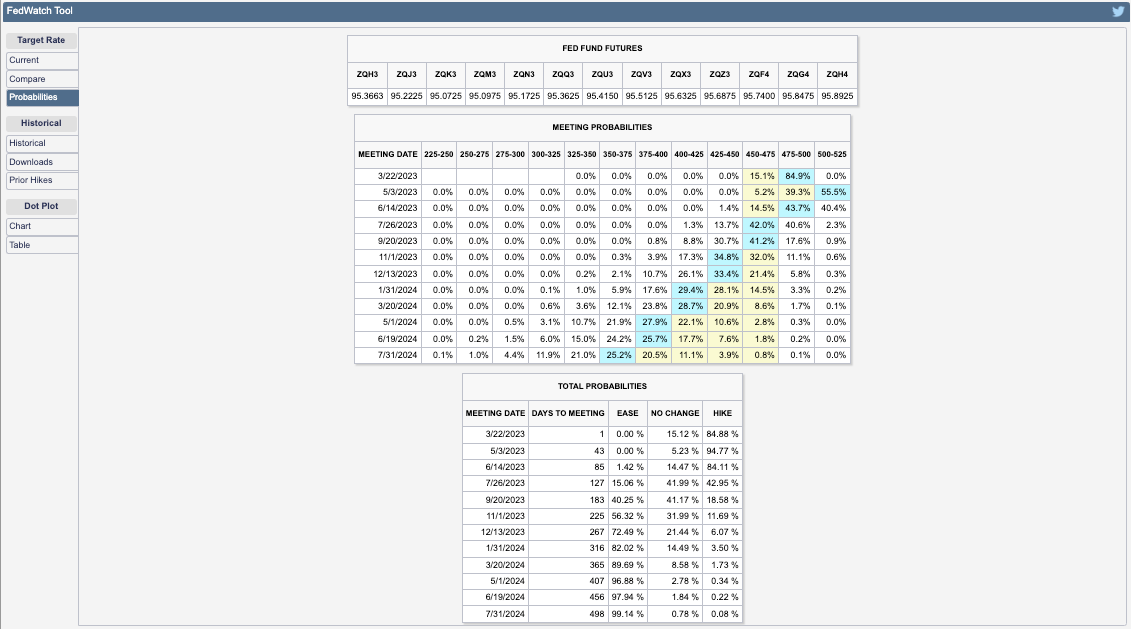
Most participants foresee rates continuing to rise by at least 25 basis points, per the CME Group Inc’s (NASDAQ: CME) FedWatch Tool. Following Wednesday’s (expected) hike, the path forward appears uncertain. Yesterday, the terminal/peak rate was at 4.75-5.00%. Today, the peak has shifted higher to 5.00-5.25%.

Graphic: Retrieved from CME Group Inc (NASDAQ: CME).

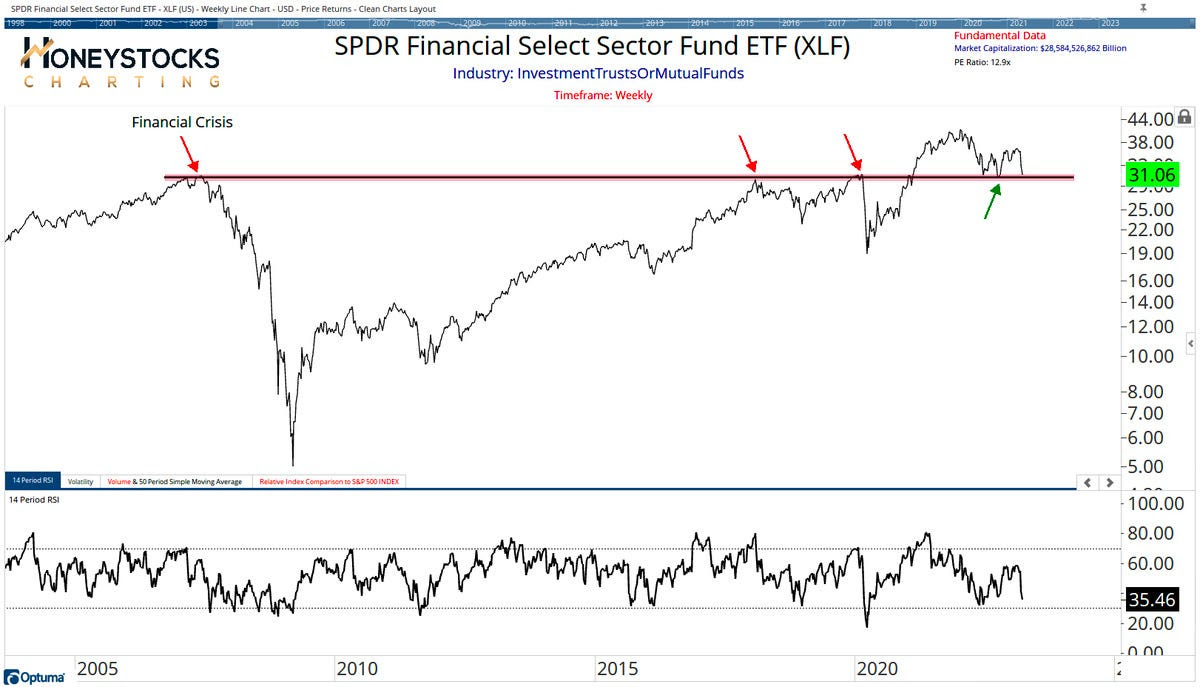
Financials look ready to fall off a cliff, to add. If they do, the whole market likely goes.

Graphic: Retrieved from Callum Thomas’ Weekly S&P 500 ChartStorm.

Positioning

We keep referring back to our Daily Briefs published last week (e.g., 3/13 and 3/14). In those letters, we talked about the growing concern about markets enduring some exogenous shocks. 

We opted to take the less extreme side since policymakers’ response was likely to stem (or push into the future) turmoil. Additionally, with participants easing up on their long-equity exposure, equity markets were likely to stay contained, relative to bond markets where the lack of liquidity is an issue, some believe. Anyways, following important events including inflation updates (i.e., CPI) and derivatives expiries, short bursts of strength (particularly in some of the previously depressed products such as the Nasdaq 100 or NDX, as explained 3/17) were likely to ensue heading into the end of this month and next month. Additionally, certain rates trades via options we set forth on 3/14 were ripe for monetization, too.

Rotating into a money market or T-bill fund or box spreads, while allocating some remaining cash to leverage potential by way of some call options structures, appeared attractive. While the T-bill or box spread exposures did not budge much, call options structures as proposed on 3/14 worked (and are likely to continue to work) rather well. The monetization of the rate structures discussed on 3/14 was timely, also.

The potential for coming events including the Federal Reserve’s (Fed) interest rate decision on Wednesday 3/22 to assuage participants’ fears of slowing may, accordingly, prompt fears of missing out on the upside, Bloomberg reports. A response may be FOMO-type demand for call options exposures, coupled with CTAs further “raising their equity exposure” on trend signals and lower volatility, boosting markets into a “more combustible” state as explained on 2/17. This fear of missing out is visible in options volatility skew; traders are hedging those tail outcomes.

Technical

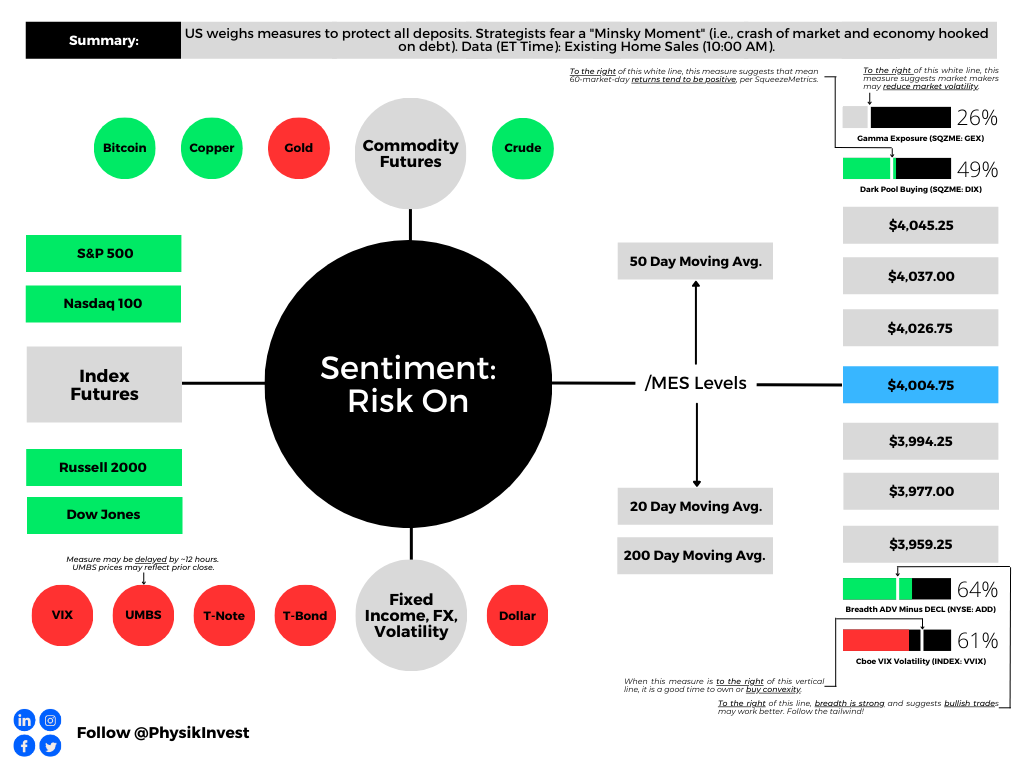
As of 7:00 AM ET, Tuesday’s regular session (9:30 AM – 4:00 PM ET), in the S&P 500, is likely to open in the upper part of a positively skewed overnight inventory, outside of the prior day’s range, suggesting a potential for immediate directional opportunity.

The S&P 500 pivot for today is $4,004.75. 

Key levels to the upside include $4,026.75, $4,037.00, and $4,045.25.

Key levels to the downside include $3,994.25, $3,977.00, and $3,959.25.

Disclaimer: Click here to load the updated key levels via the web-based TradingView platform. New links are produced daily. Quoted levels likely hold barring an exogenous development.

Graphic: 65-minute profile chart of the Micro E-mini S&P 500 Futures.

Definitions

Volume Areas: Markets will build on areas of high-volume (HVNodes). Should the market trend for a period of time, this will be identified by a low-volume area (LVNodes). The LVNodes denote directional conviction and ought to offer support on any test.

If participants auction and find acceptance in an area of a prior LVNode, then future discovery ought to be volatile and quick as participants look to the nearest HVNodes for more favorable entry or exit.

POCs: Areas where two-sided trade was most prevalent in a prior day session. Participants will respond to future tests of value as they offer favorable entry and exit.

Options Expiration (OPEX): Reduction in dealer Gamma exposure. There may be an increase in volatility after the removal of large options positions and associated hedging.

Volume-Weighted Average Prices (VWAPs): A metric highly regarded by chief investment officers, among other participants, for quality of trade. Additionally, liquidity algorithms are benchmarked and programmed to buy and sell around VWAPs.


About

The author, Renato Leonard Capelj, spends the bulk of his time at Physik Invest, an entity through which he invests and publishes free daily analyses to thousands of subscribers. The analyses offer him and his subscribers a way to stay on the right side of the market. 

Separately, Capelj is an accredited journalist with past works including interviews with investor Kevin O’Leary, ARK Invest’s Catherine Wood, FTX’s Sam Bankman-Fried, North Dakota Governor Doug Burgum, Lithuania’s Minister of Economy and Innovation Aušrinė Armonaitė, former Cisco chairman and CEO John Chambers, and persons at the Clinton Global Initiative.

Connect

Direct queries to renato@physikinvest.com. Find Physik Invest on TwitterLinkedInFacebook, and Instagram. Find Capelj on TwitterLinkedIn, and Instagram. Only follow the verified profiles.

Calendar

You may view this letter’s content calendar at this link.

Disclaimer

Do not construe this newsletter as advice. All content is for informational purposes. Capelj and Physik Invest manage their own capital and will not solicit others for it.

Categories
Commentary

Daily Brief For March 20, 2023

Physik Invest’s Daily Brief is read free by thousands of subscribers. Join this community to learn about the fundamental and technical drivers of markets.

Graphic updated 8:10 AM ET. Sentiment Neutral if expected /MES open is inside of the prior day’s range. /MES levels are derived from the profile graphic at the bottom of this letter. Click here for the latest levels. SqueezeMetrics Dark Pool Index (DIX) and Gamma (GEX) with the latter calculated based on where the prior day’s reading falls with respect to the MAX and MIN of all occurrences available. A higher DIX is bullish. The lower the GEX, the more (expected) volatility. Click to learn the implications of volatility, direction, and moneyness. Breadth reflects a reading of the prior day’s NYSE Advance/Decline indicator. The CBOE VIX Volatility Index (INDEX: VVIX) reflects the attractiveness of owning volatility. UMBS prices via MNDClick here for the economic calendar.

Fundamental

As well summarized by Eric Basmajian, inflation, and growth are on a downward trajectory. Most leading indicators “suggest recessionary pressure will be ongoing.” The banking crisis and response, which will ultimately “cause a tightening of lending to the private economy,” likely exacerbates the ongoing recessionary pressures.

Breaking: UBS To Buy Credit Suisse In $3.3 Billion Deal

Most strategists including the Damped Spring’s Andy Constan agree. In a recent video, Constan detailed the implications of policymakers’ intervention. In short, an asset fire sale was turned into a managed sale, and a reduction in credit creation will tighten financial conditions, slowing the economy and inflation.

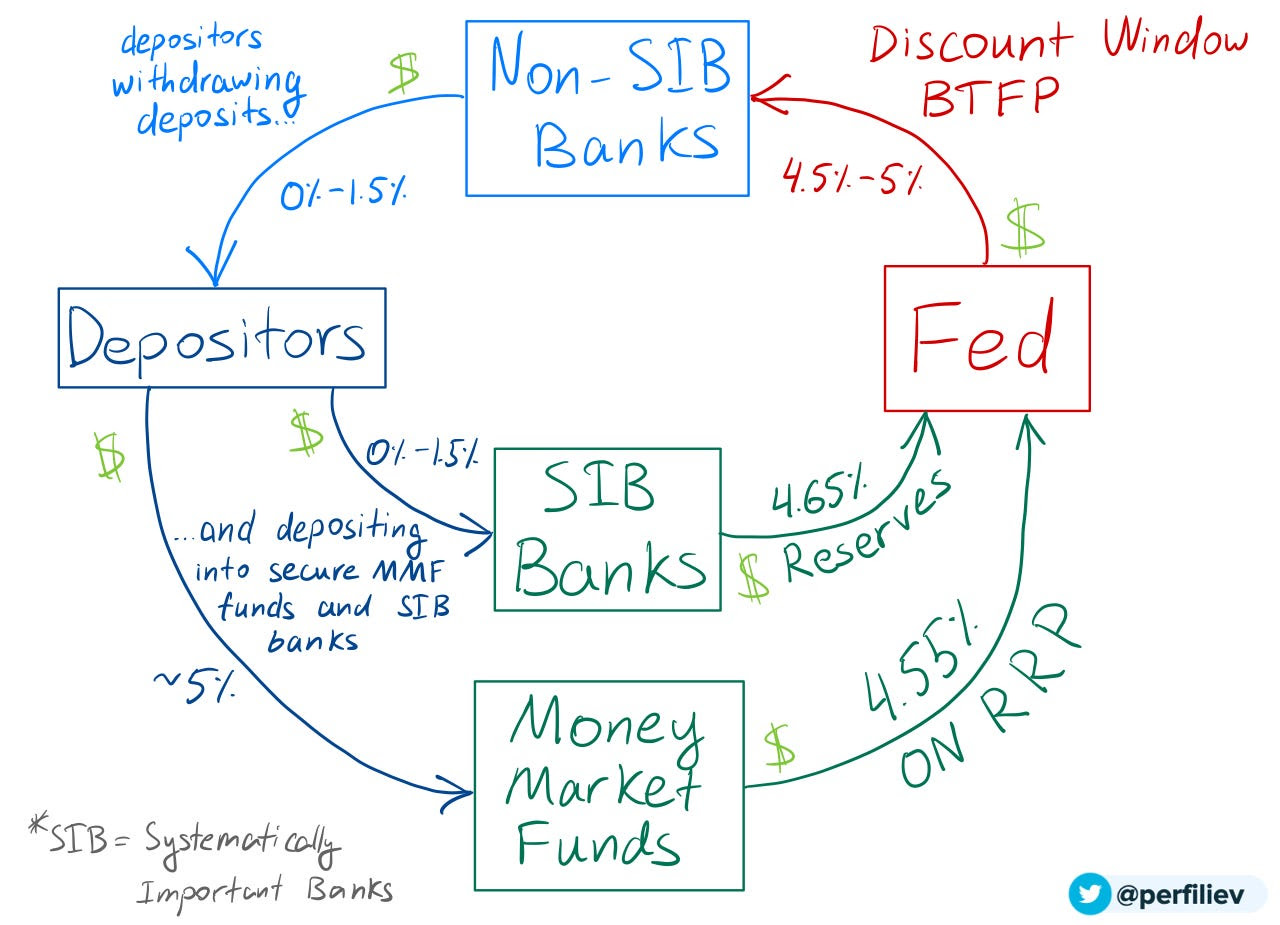
“Small banks that are facing deposit outflows will see earnings and margins collapse as their cost of funds surges from 1% or 2% on deposits to 4% or 5% at the Fed funding facility,” Basmajian summarizes, noting that the increase in the Federal Reserve (Fed) balance sheet came from the discount window, new bank funding facilities, and spillover from the FDIC insurance backstop, all of which are not to be confused with quantitative easing or QE (i.e., monetary stimulus and a flow of capital into capital markets). 

Graphic: Retrieved from Bank of American Corporation (NYSE: BAC) via The Market Ear.

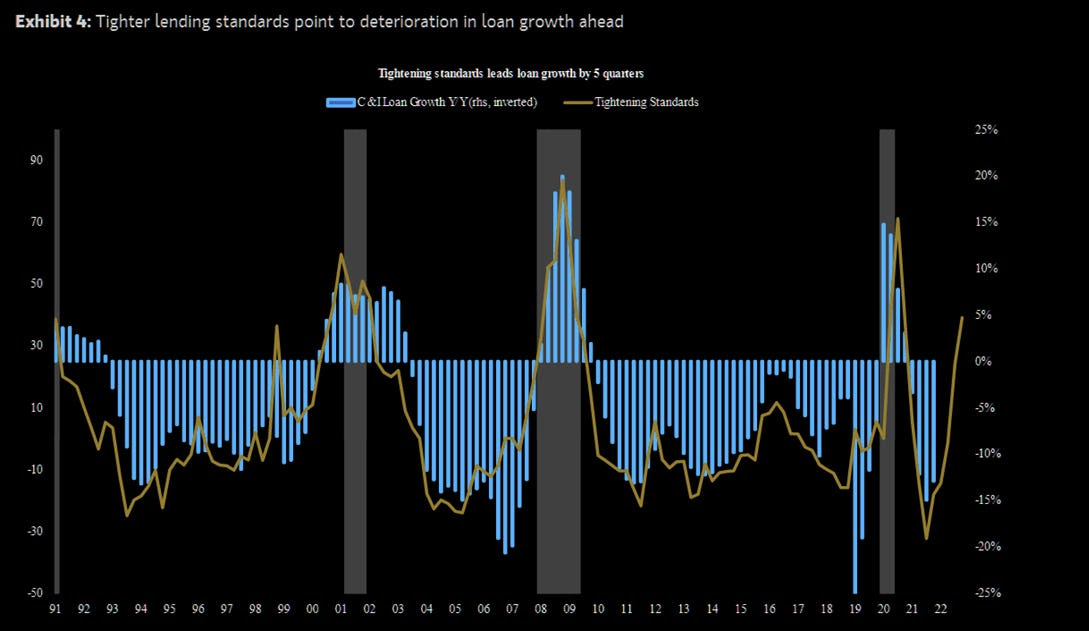
“As deposits leave regional and smaller banks for more yield and safety, they will flow into bigger banks that do less lending or into money market funds that don’t drive credit creation.” Consequently, there will be “a significant tightening of lending standards, and a credit crunch on the private economy as regional and smaller banks face massive funding pressure.”

Graphic: Retrieved from Morgan Stanley (NYSE: MS) via The Market Ear. “MS models show that a permanent +10pt tightening in lending standards for C&I loans leads to a 35bps rise in the unemployment rate over the next two years. Historically, recessions have arrived more than half a year after jobless claims begin a sustained rise.”

Traders are conflicted about the Fed’s coming interest rate decision. Many were expecting a couple more hikes of at least 25 basis points in size. However, following the recent bank turmoil in the US and abroad, it appears that traders think it will be one additional 25 basis point hike before rate cuts ensue in mid-2023.

Graphic: Retrieved from CME Group Inc’s (NASDAQ: CME) FedWatch Tool.

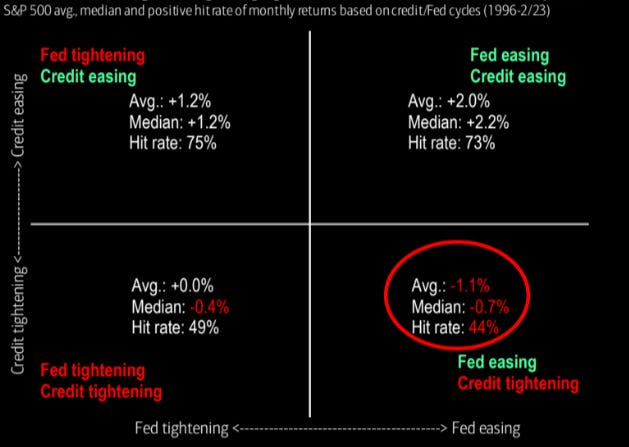
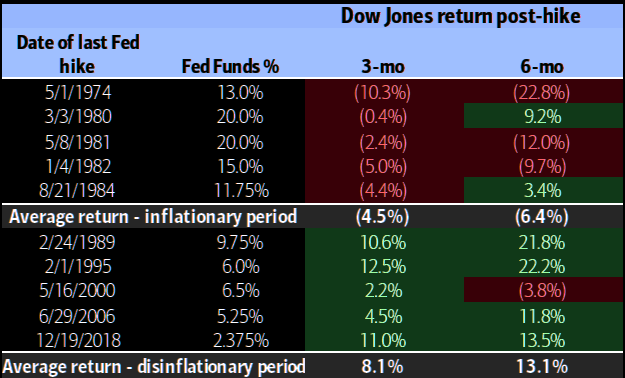
Historically, selling markets on the last Fed rate hike is a good strategy, Bank of America found.

Graphic: Retrieved from Bank of American Corporation (NYSE: BAC) via The Market Ear.

Positioning

Top-line measures of implied volatility or IVOL including the Cboe Volatility Index or VIX are higher heading into Monday’s trade.

Macro uncertainties have some frightened, hence “equity volatility present[ing] itself in a much stronger way,” said The Ambrus Group’s Kris Sidial. For this equity volatility (i.e., implied volatility or IVOL) to continue performing well, realized volatility or RVOL (i.e., the movement that actually happens and is not implied by traders’ supply and demand of options) must shift and stay higher as well (note: in many ways RVOL and IVOL reinforce the other during extreme greed or fear events.

Though big options expiries (OpEx) “may help unpin the market” and manifest market downside and follow-through in RVOL needed to keep IVOL performing, the window for this to happen may be closing.

The monetization of profitable options structures, as well as volatility compression and options decay, may result in counterparties buying back their short stock and/or futures hedges (to the short put positions they have on), thus boosting the market (particularly the depressed and rate-sensitive Nasdaq 100).

If the market rallies, that has the potential to “make things hotter” in the economy, explained Kai Volatility’s Cem Karsan, which emboldens policymakers to make and keep policy tighter. So, barring follow-through to the downside, any equity market upside that arises is likely limited, as a disclaimer, some think.

Apologies for rushing this section, today. More on positioning in the coming letters.

Technical

As of 8:10 AM ET, Monday’s regular session (9:30 AM – 4:00 PM ET), in the S&P 500, is likely to open in the middle part of a negatively skewed overnight inventory, inside of the prior day’s range, suggesting a limited potential for immediate directional opportunity.

The S&P 500 pivot for today is $3,946.75. 

Key levels to the upside include $3,970.75, $3,994.25, and $4,026.75.

Key levels to the downside include $3,912.25, $3,891.00, and $3,868.25.

Disclaimer: Click here to load the updated key levels via the web-based TradingView platform. New links are produced daily. Quoted levels likely hold barring an exogenous development.

Graphic: 65-minute profile chart of the Micro E-mini S&P 500 (FUTURE: /MES) bottom-middle.

Definitions

Volume Areas: Markets will build on areas of high-volume (HVNodes). Should the market trend for a period of time, this will be identified by a low-volume area (LVNodes). The LVNodes denote directional conviction and ought to offer support on any test.

If participants auction and find acceptance in an area of a prior LVNode, then future discovery ought to be volatile and quick as participants look to the nearest HVNodes for more favorable entry or exit.

POCs: Areas where two-sided trade was most prevalent in a prior day session. Participants will respond to future tests of value as they offer favorable entry and exit.


About

The author, Renato Leonard Capelj, spends the bulk of his time at Physik Invest, an entity through which he invests and publishes free daily analyses to thousands of subscribers. The analyses offer him and his subscribers a way to stay on the right side of the market. 

Separately, Capelj is an accredited journalist with past works including interviews with investor Kevin O’Leary, ARK Invest’s Catherine Wood, FTX’s Sam Bankman-Fried, North Dakota Governor Doug Burgum, Lithuania’s Minister of Economy and Innovation Aušrinė Armonaitė, former Cisco chairman and CEO John Chambers, and persons at the Clinton Global Initiative.

Connect

Direct queries to renato@physikinvest.com. Find Physik Invest on TwitterLinkedInFacebook, and Instagram. Find Capelj on TwitterLinkedIn, and Instagram. Only follow the verified profiles.

Calendar

You may view this letter’s content calendar at this link.

Disclaimer

Do not construe this newsletter as advice. All content is for informational purposes. Capelj and Physik Invest manage their own capital and will not solicit others for it.