“There’s no put; the Trump call on the upside is, if we have good policies, then the markets will go up.” – Secretary Scott Bessent
Macroeconomic Context: ‘A Detox Period’
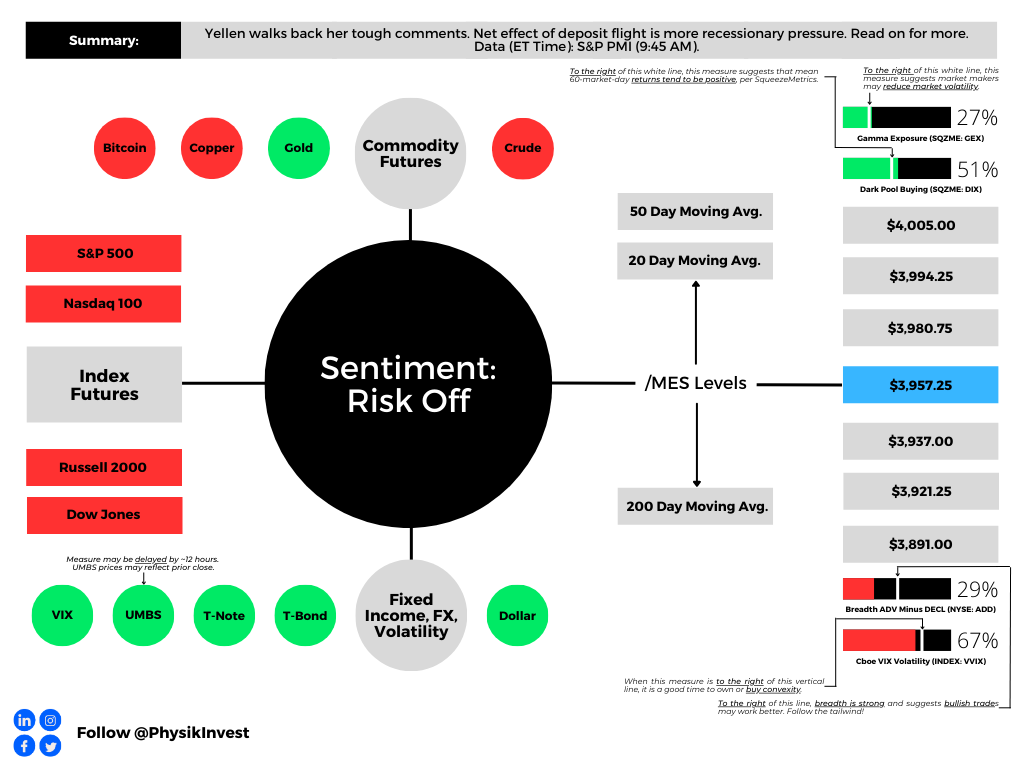
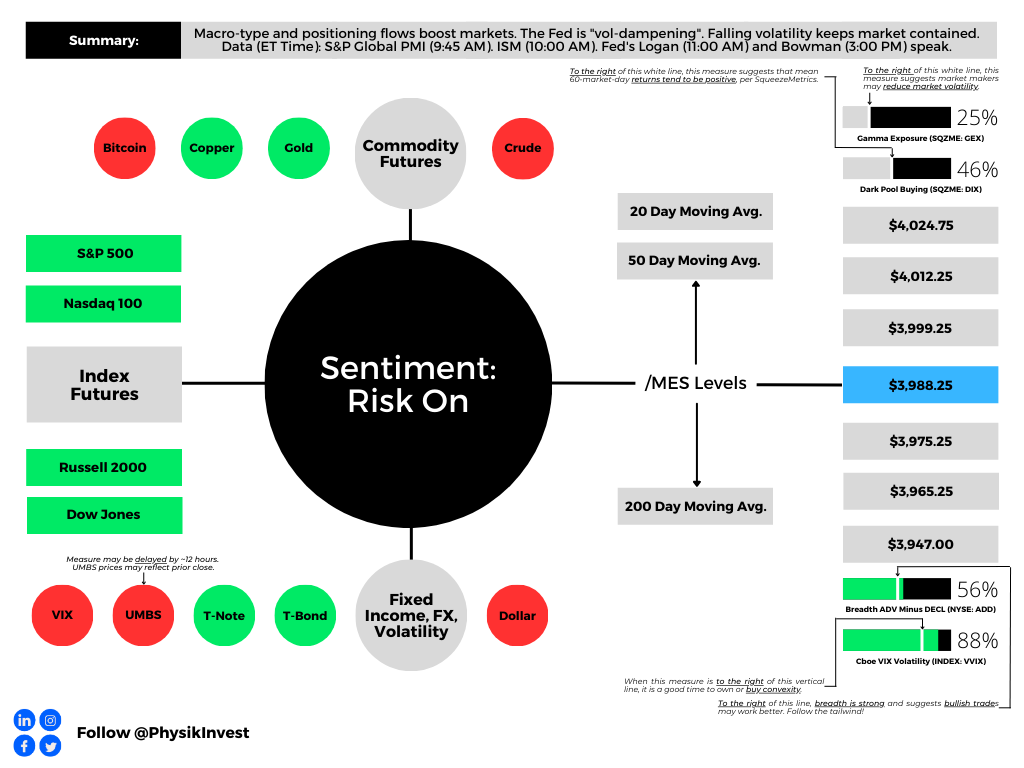
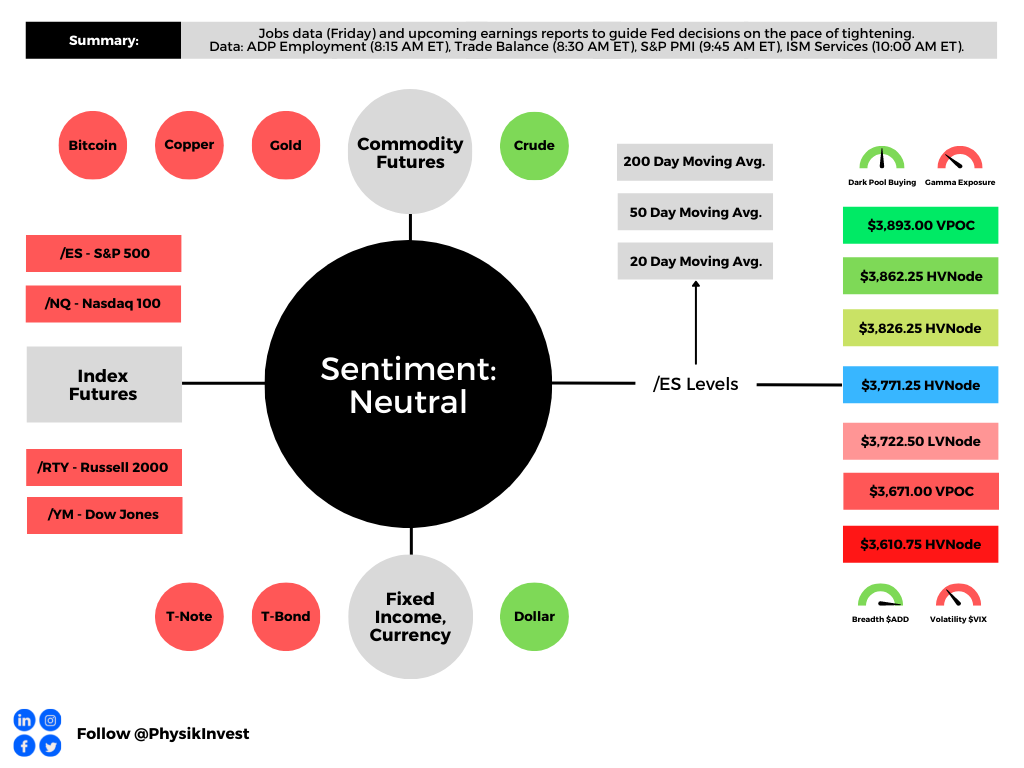
Economic and (geo)political uncertainty intersect with broader forces as the S&P 500 adjusts to positioning and liquidity realities.

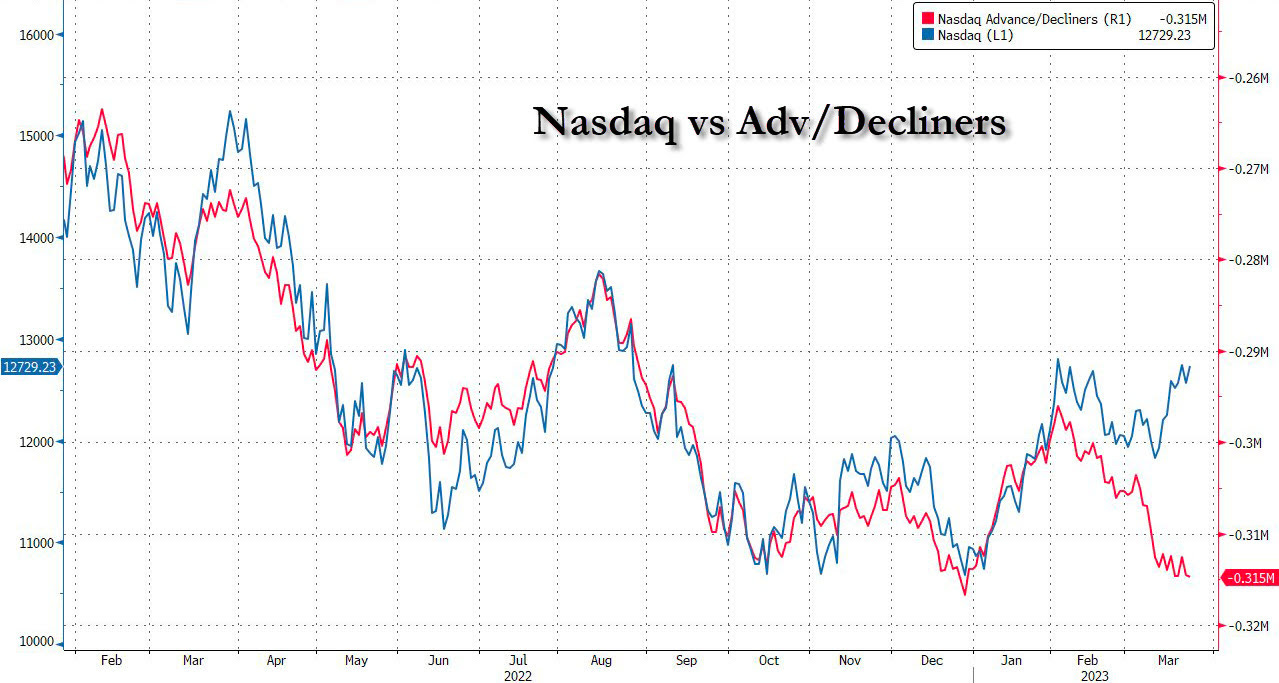
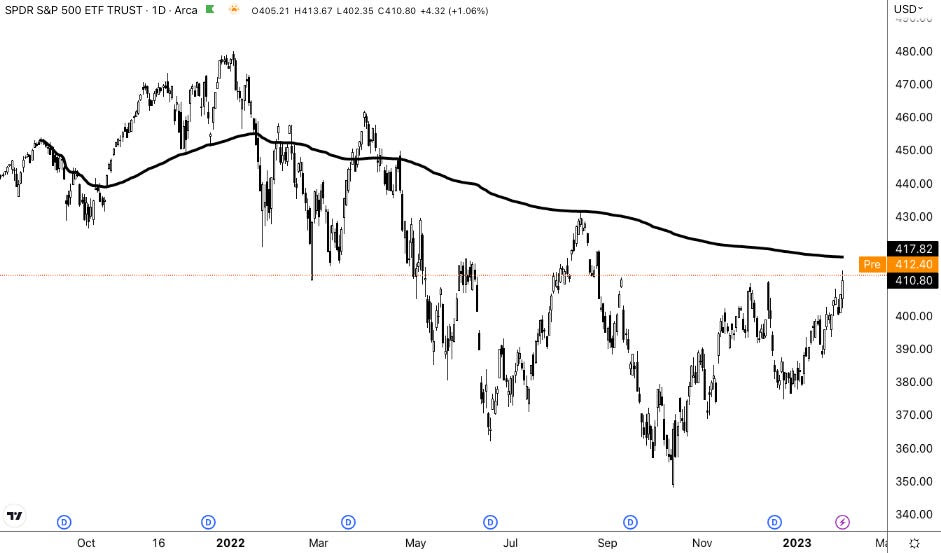
Leading up to the recent decline, market breadth (measuring how many stocks participate in a market move) had weakened. While a handful of dominant stocks masked the weakness, the underlying market was thinning out. Such dispersion [1] [2] [3], where some stocks surge while others lag, can create an illusion of stability in some market environments.
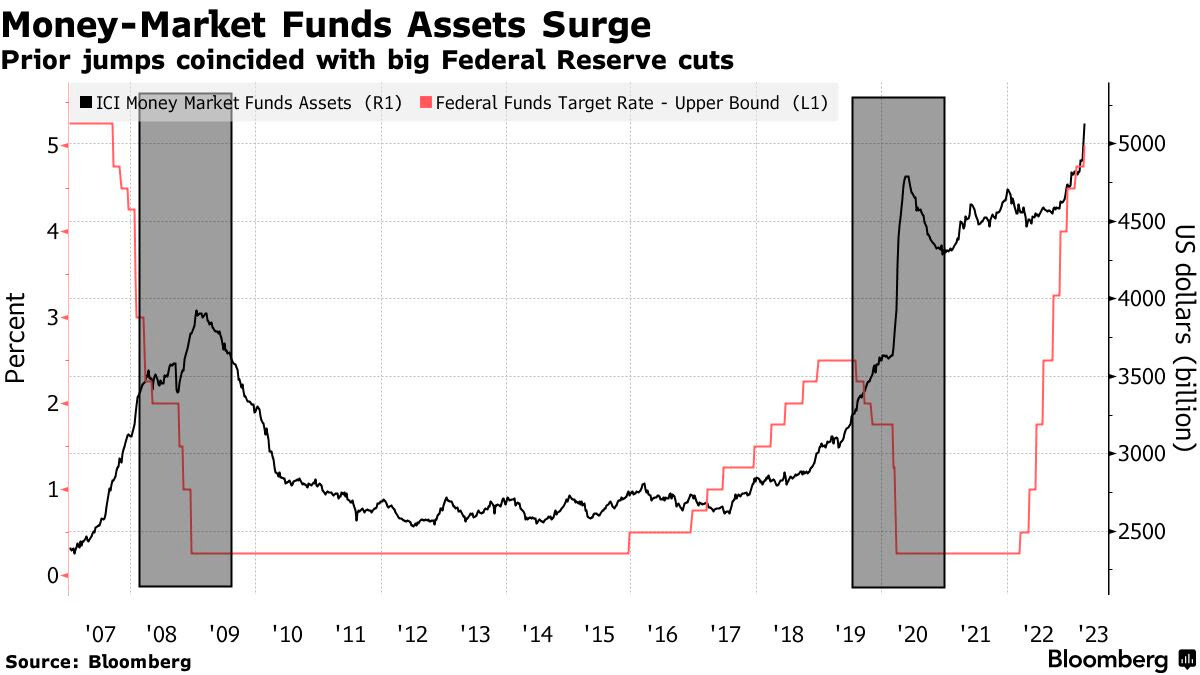
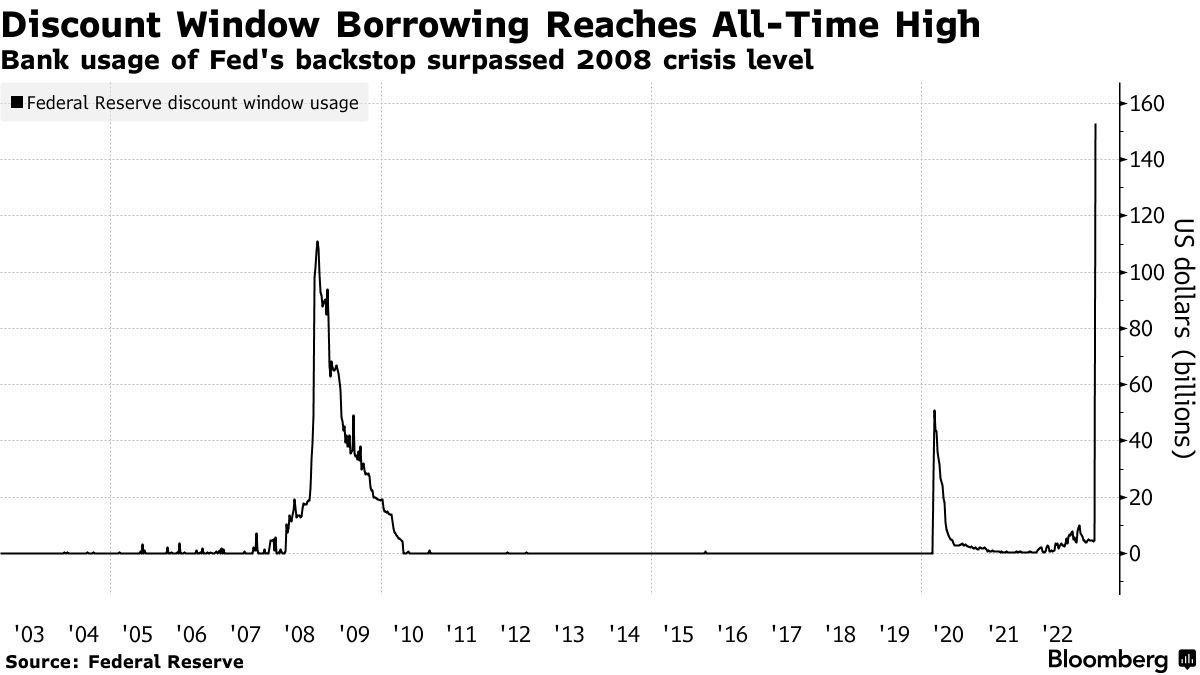
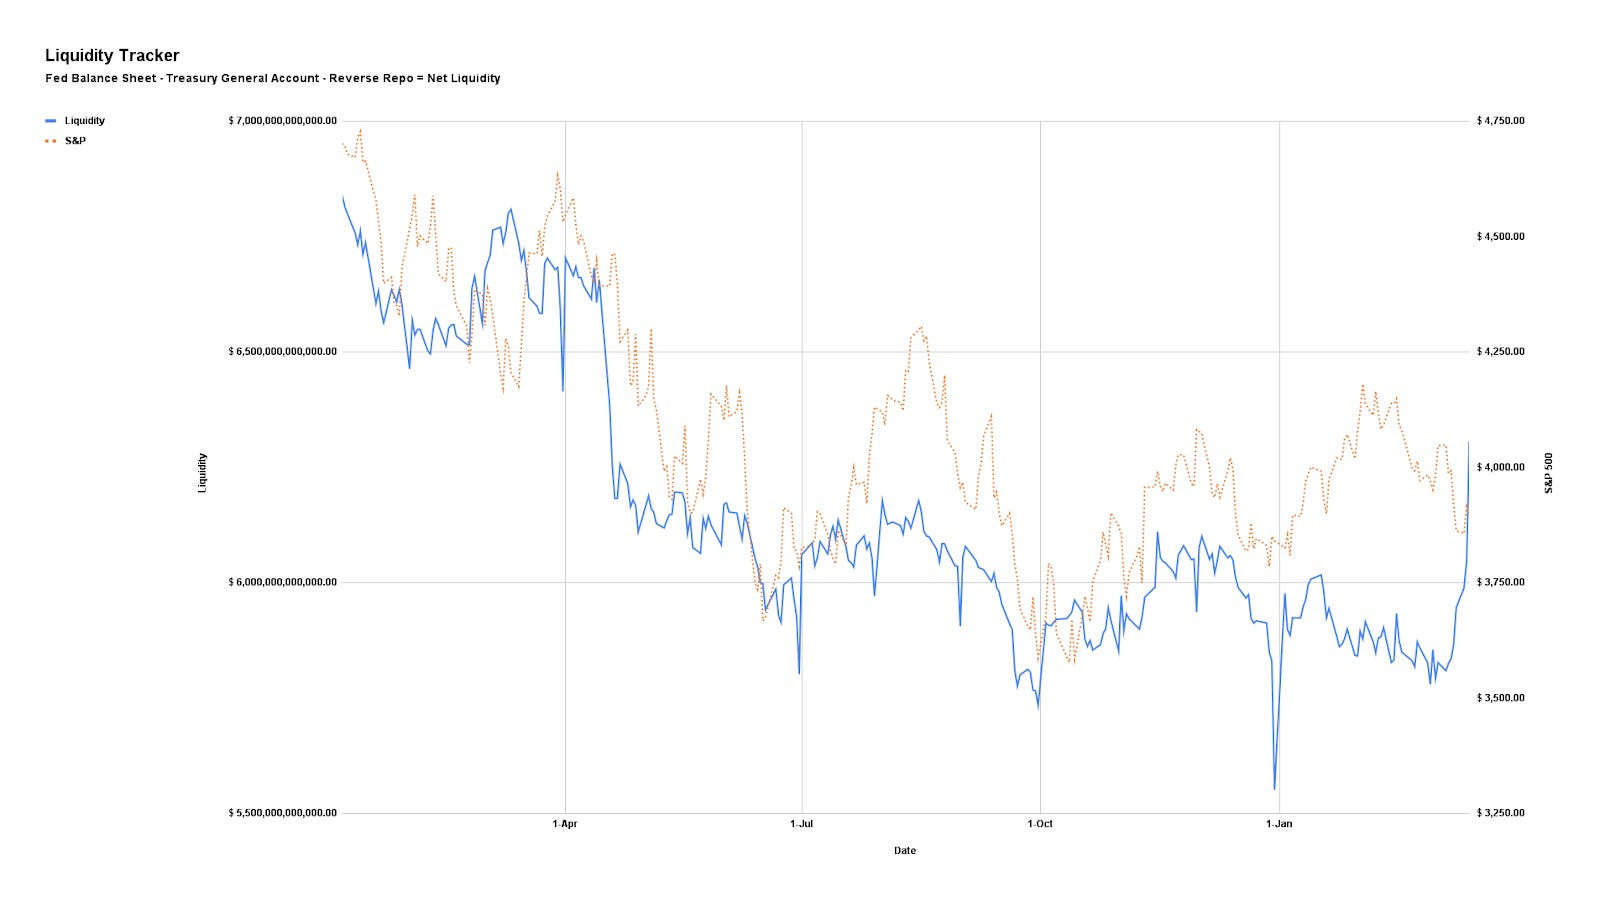
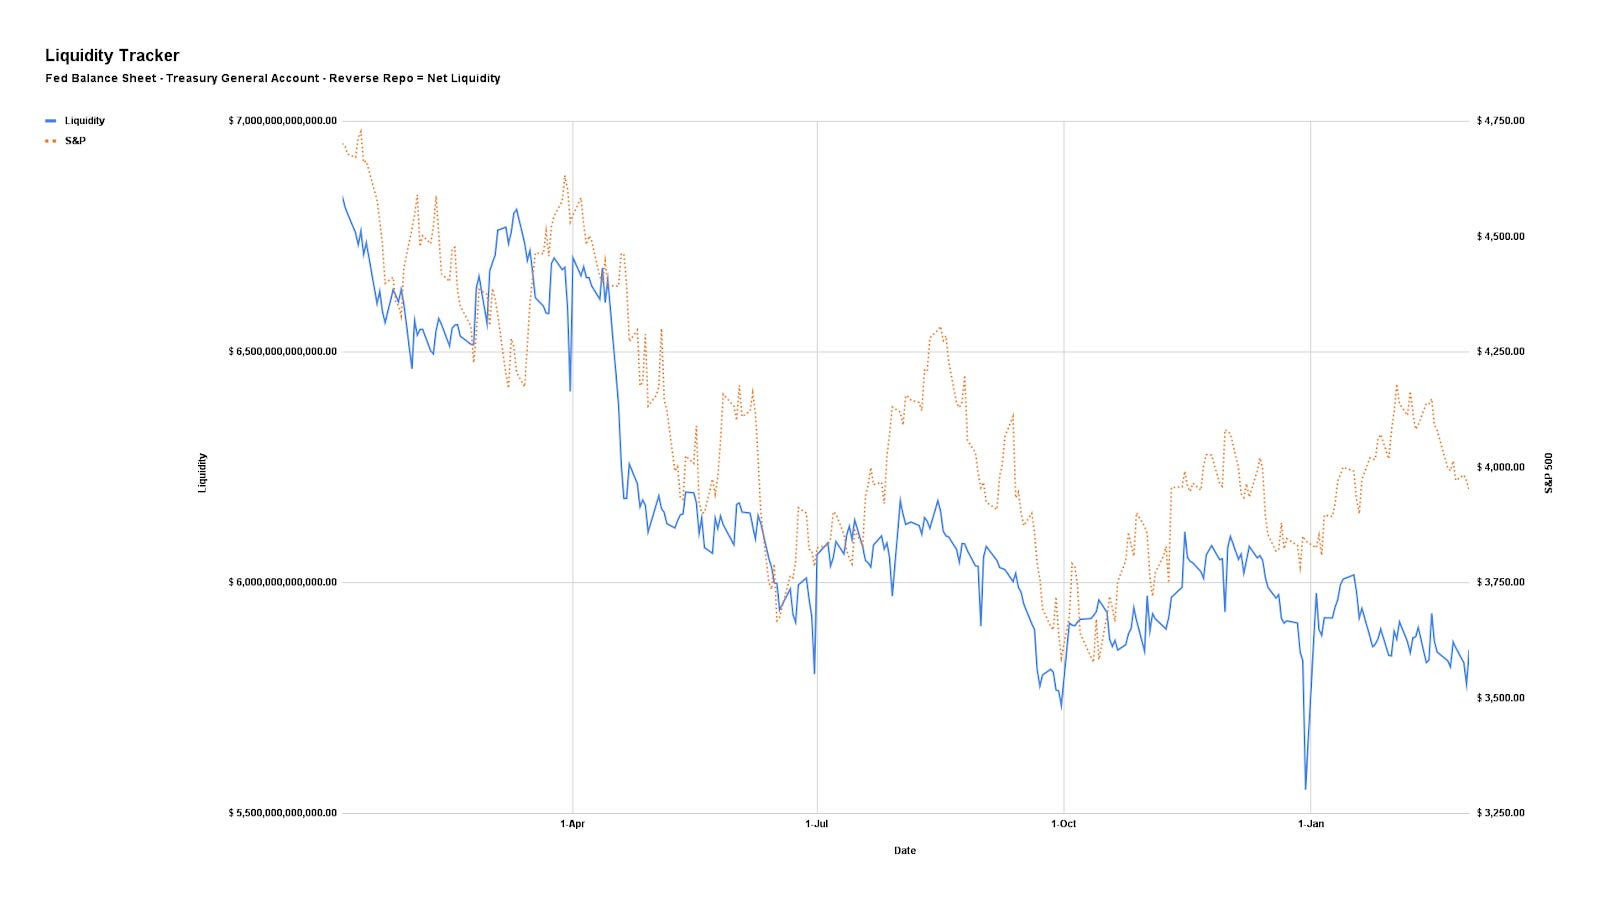
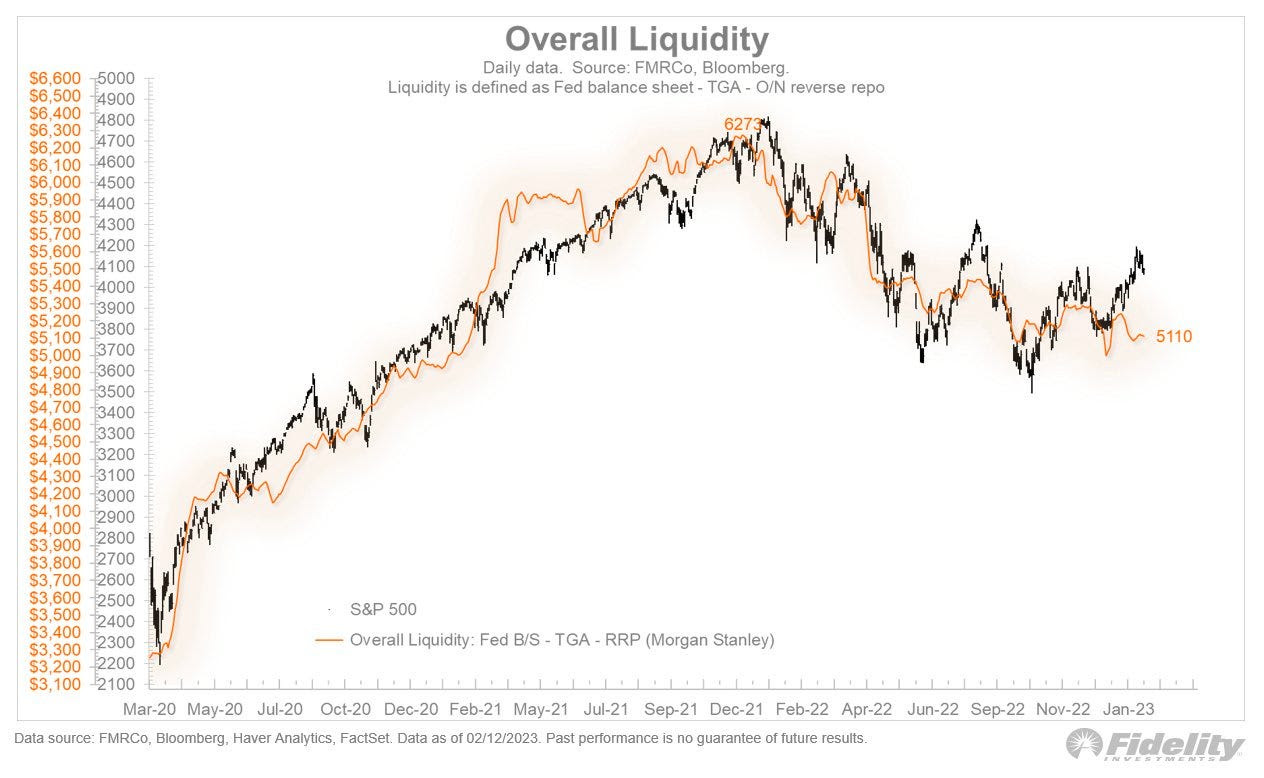
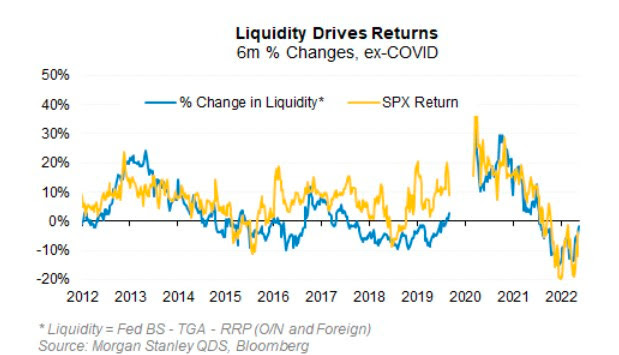
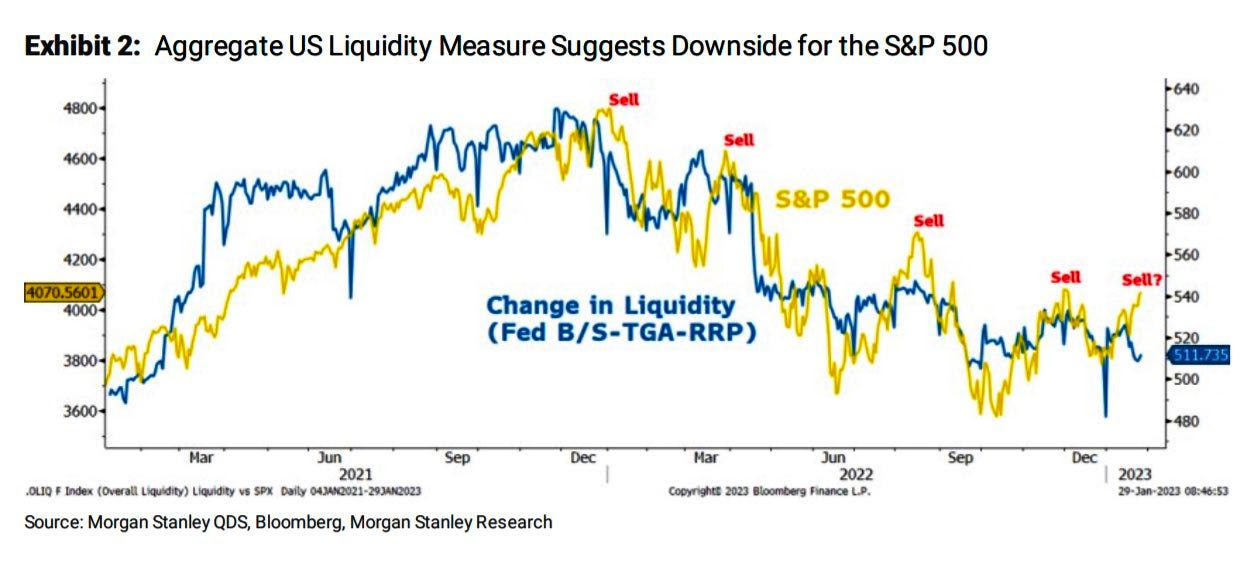
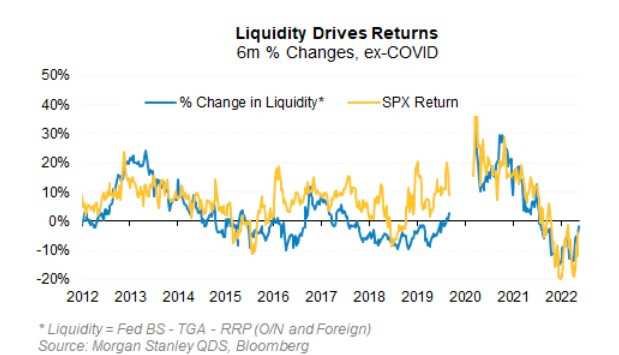
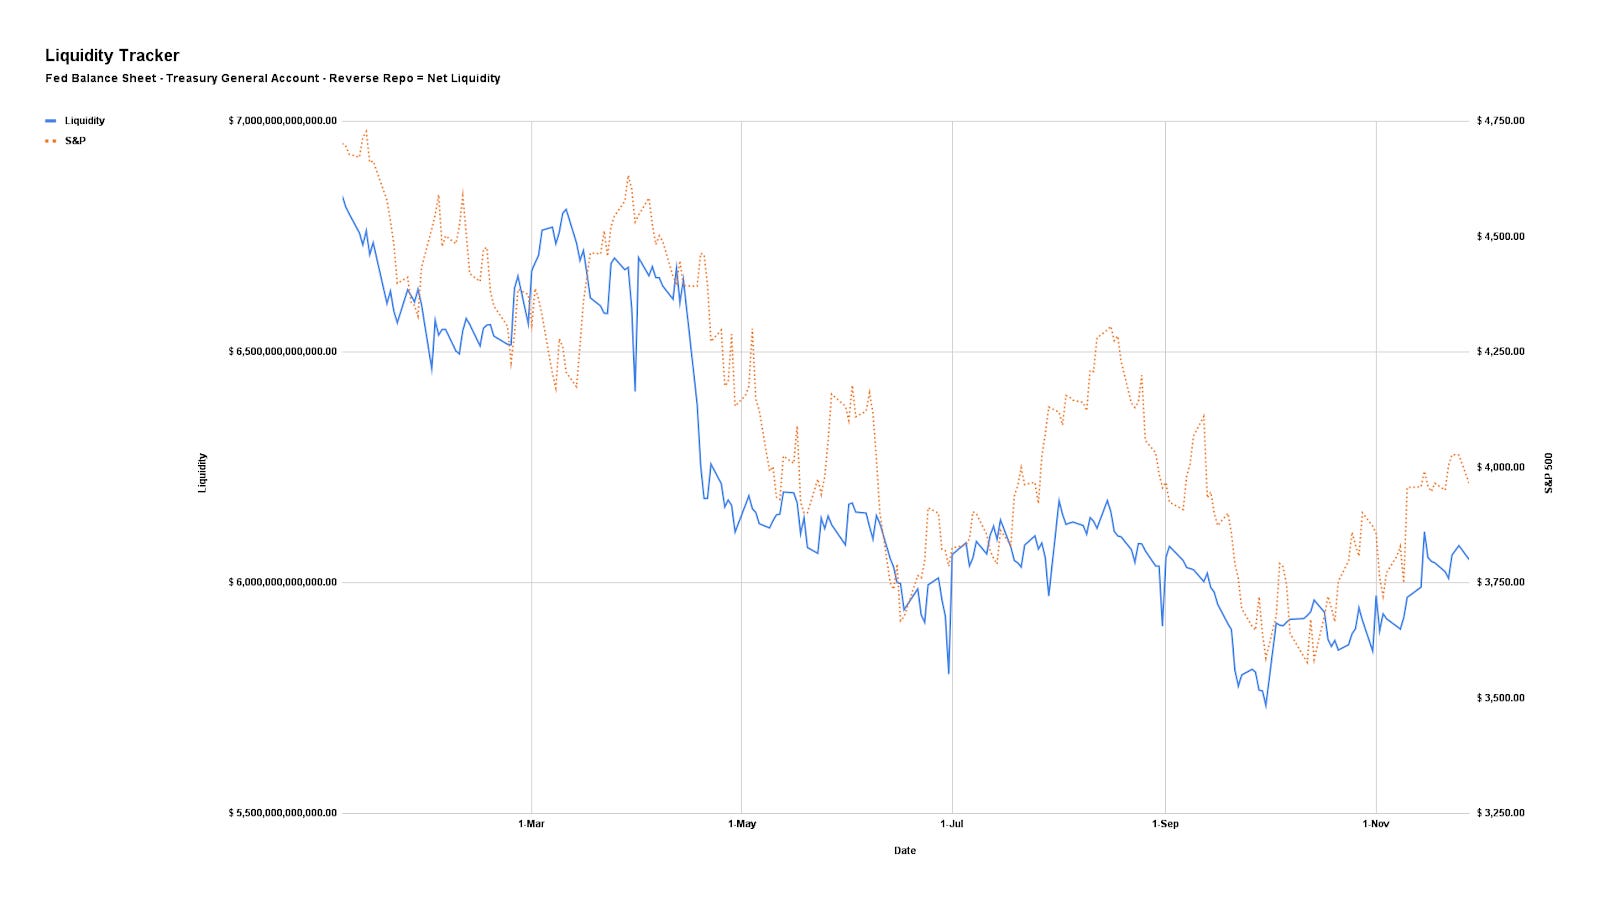
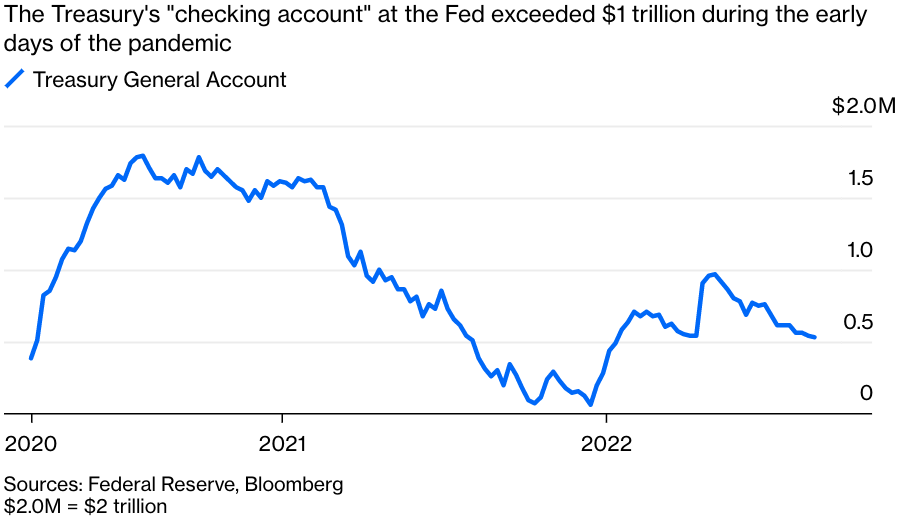
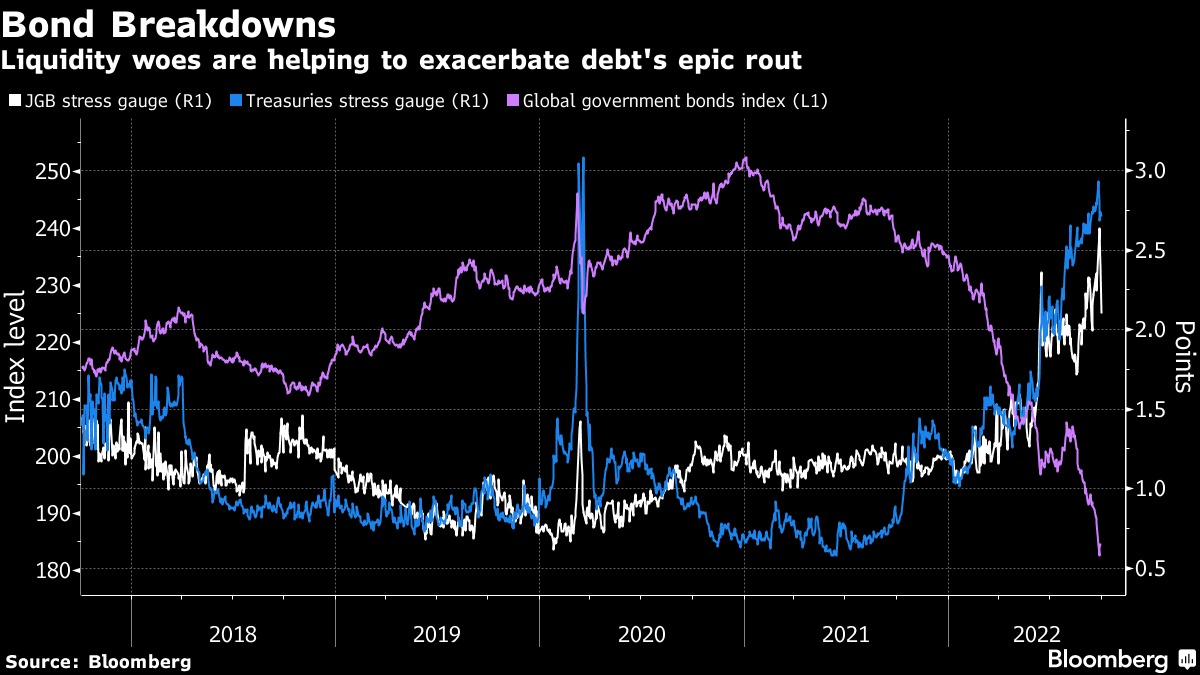
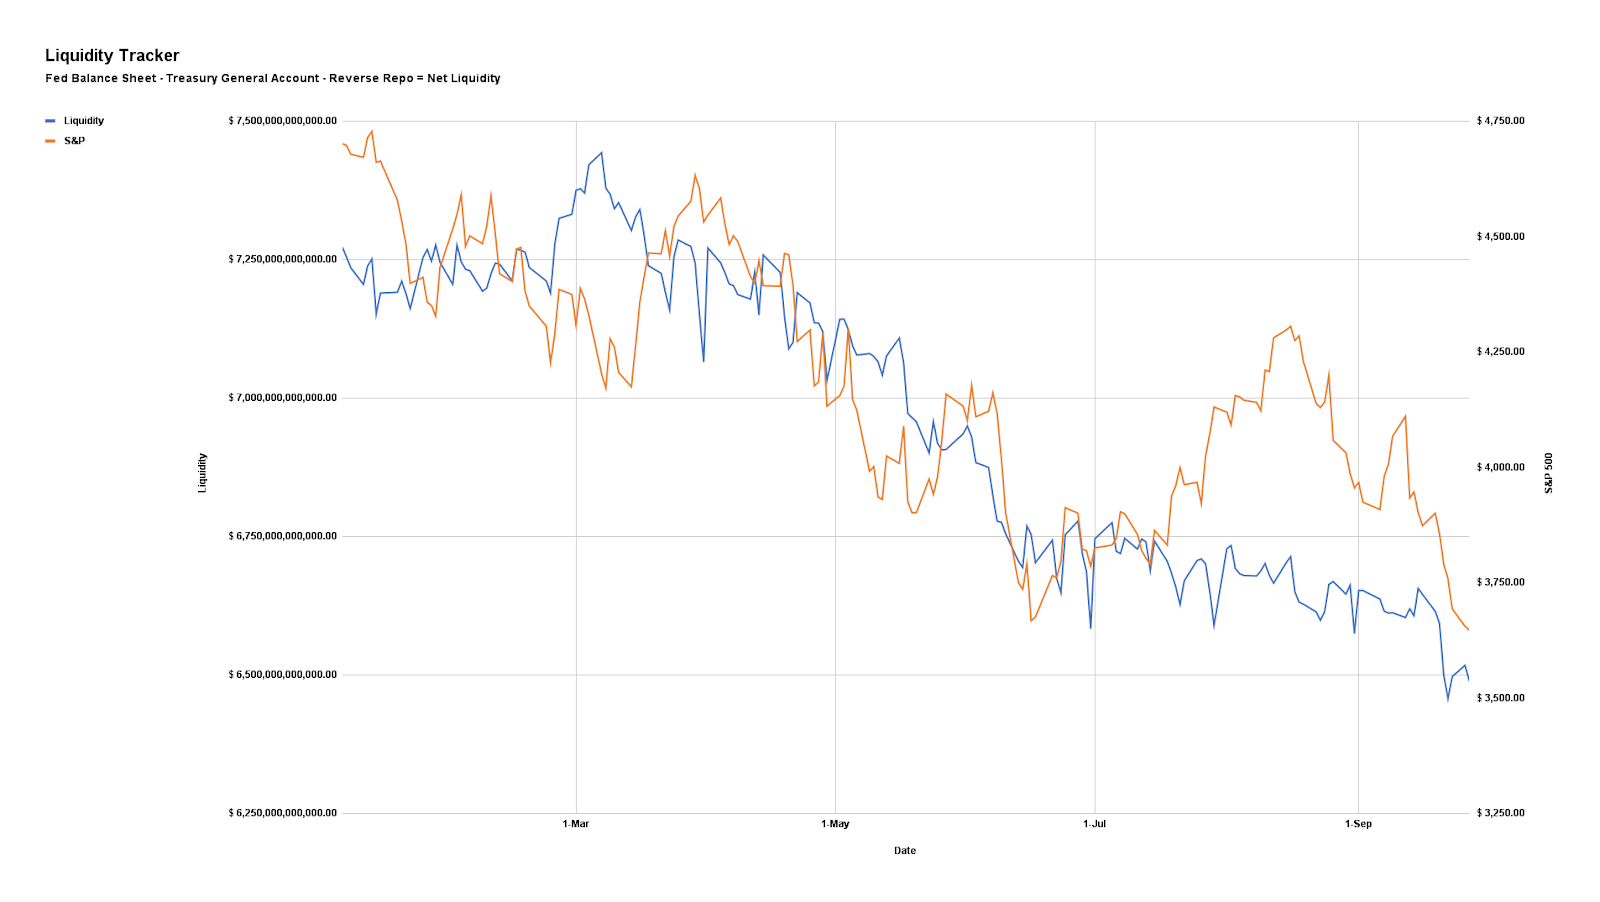
At the same time, liquidity—cash and credit availability—steadily drained from the system. Mechanisms like the reverse repo facility (where banks park excess cash with the Federal Reserve), the Treasury General Account (the government’s cash balance), and money market flows help offset [1] shortfalls. However, this time, they offered little cushion.

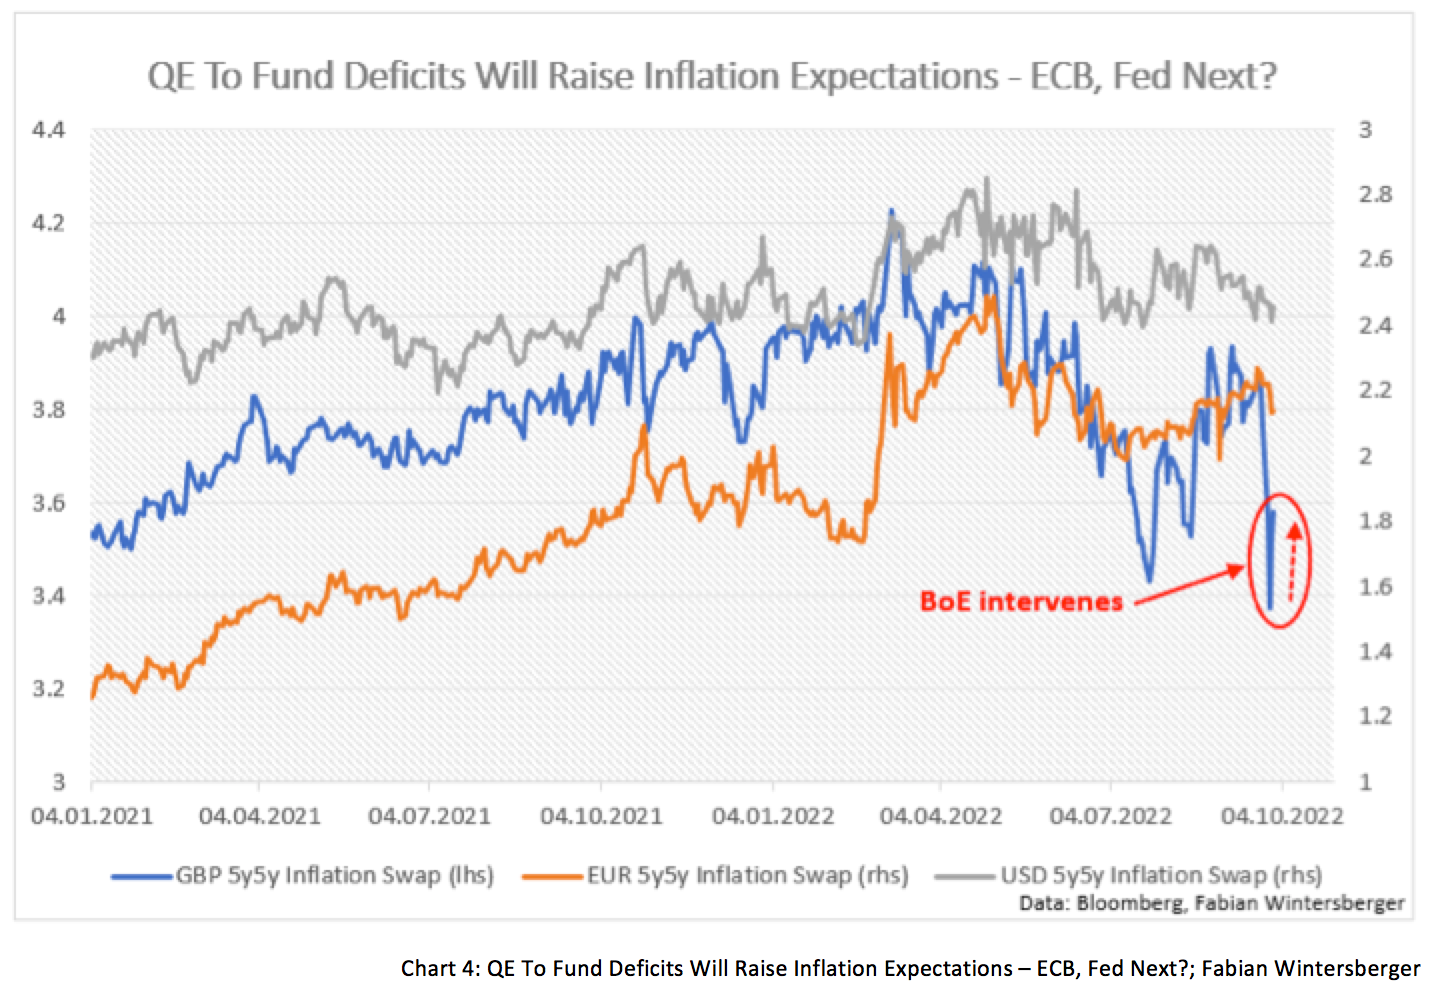
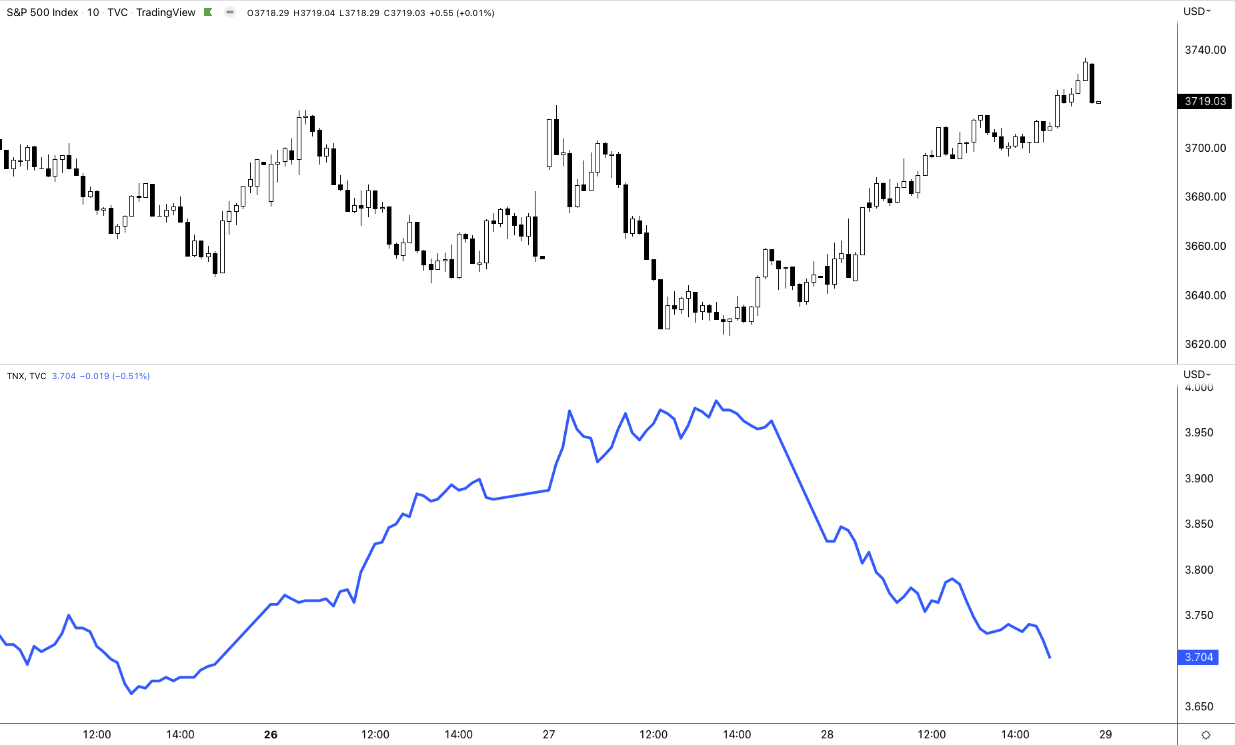
New policies—such as tariffs and trade restrictions—reinforce market trends and drive investors toward safer assets like bonds. There is a growing preference for lower bond yields over short-term stock market gains.

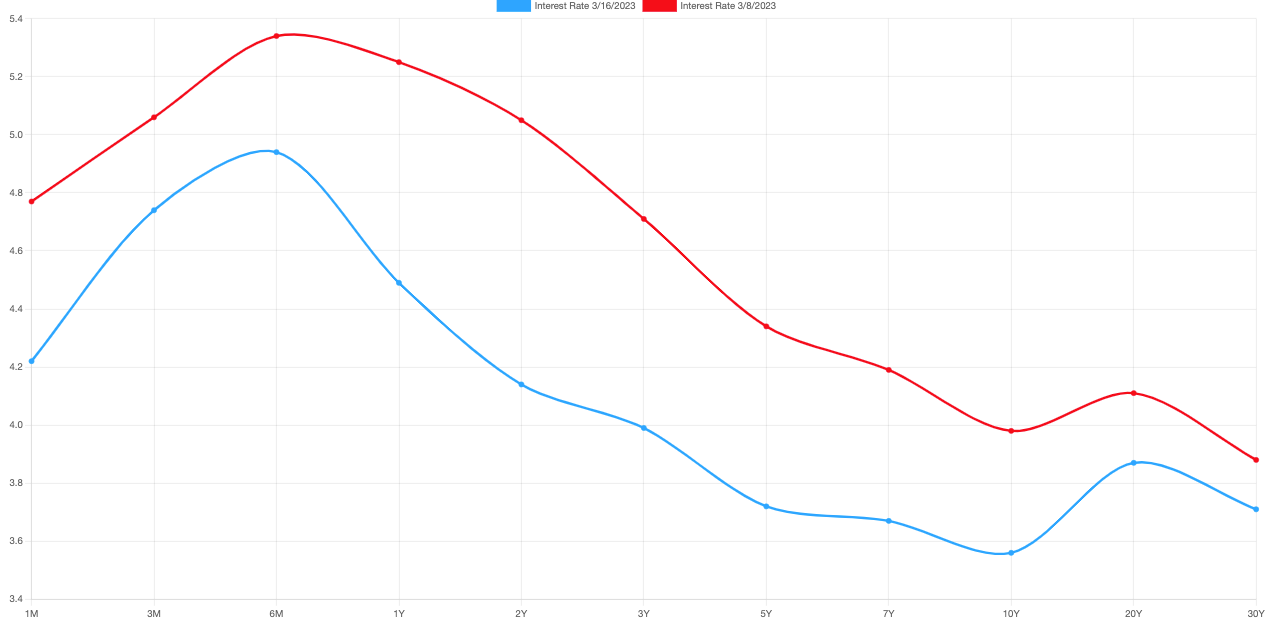
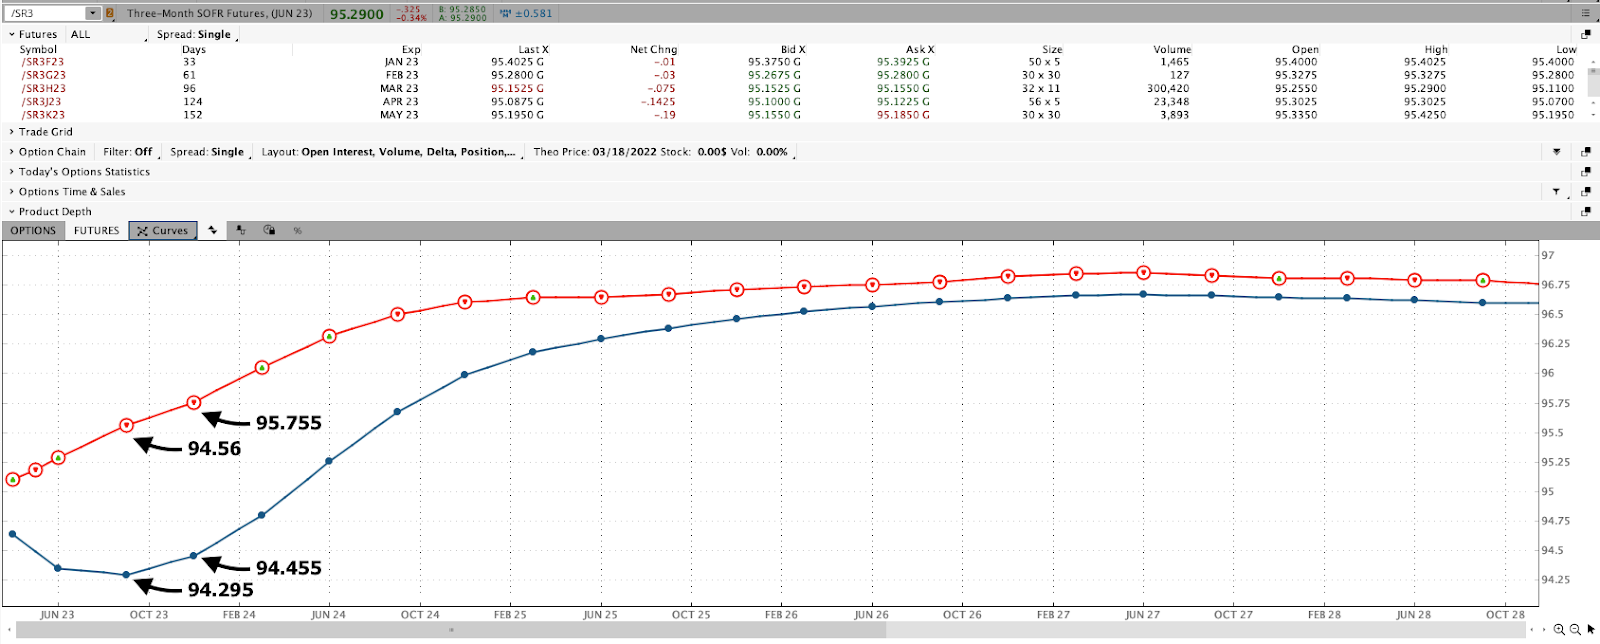
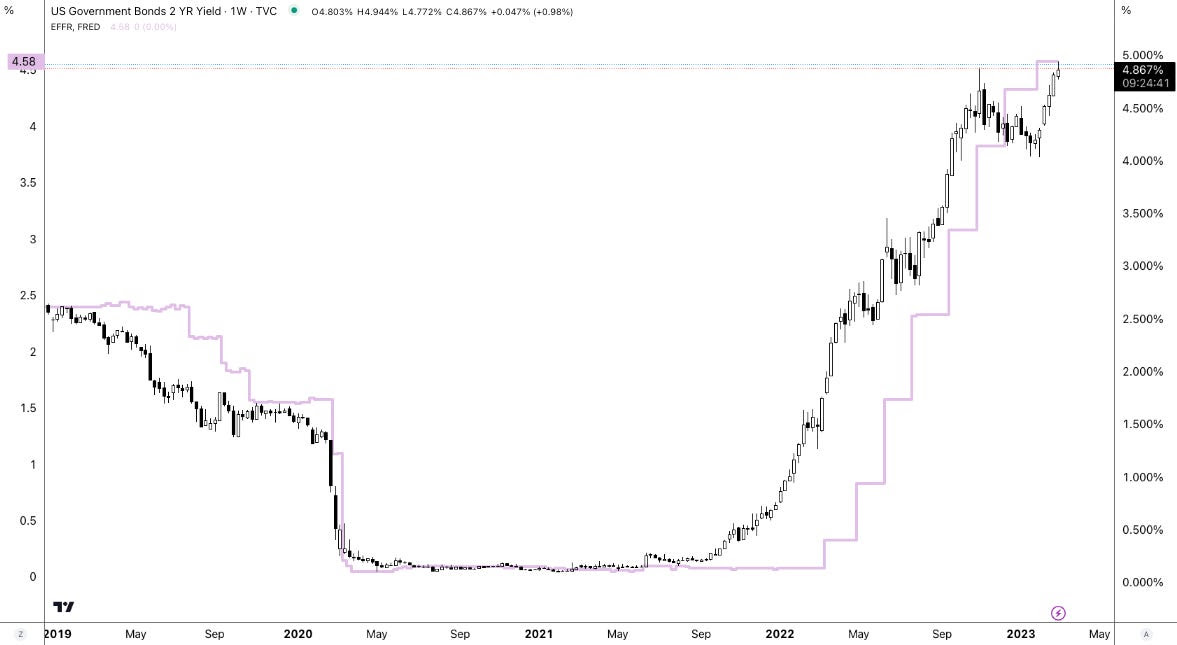
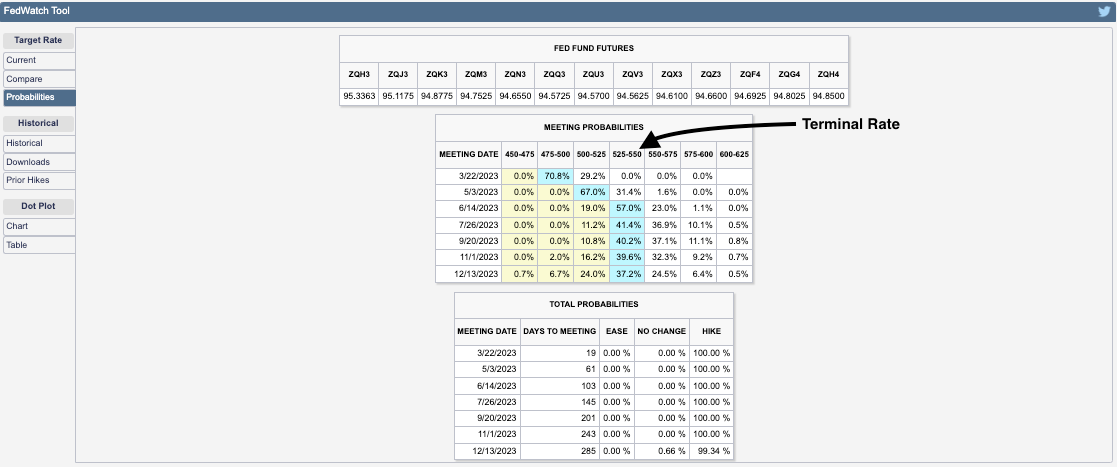
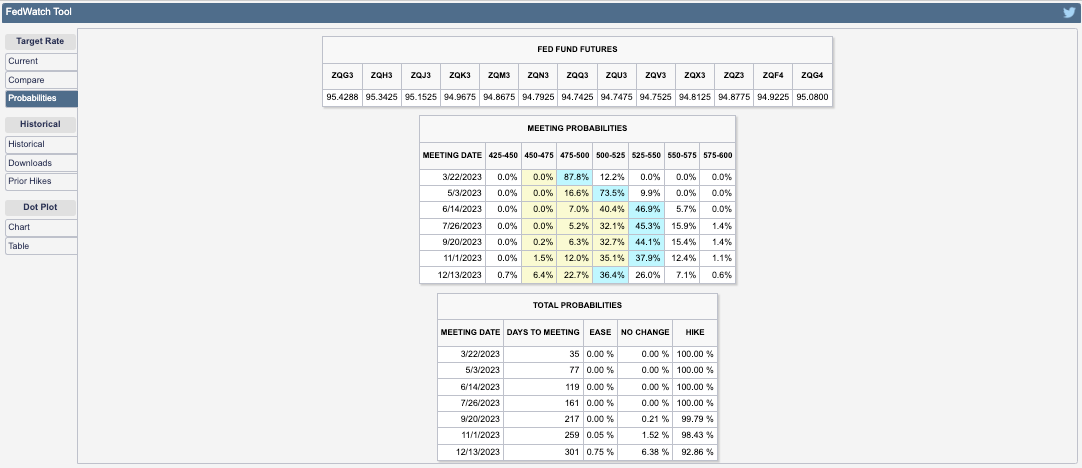
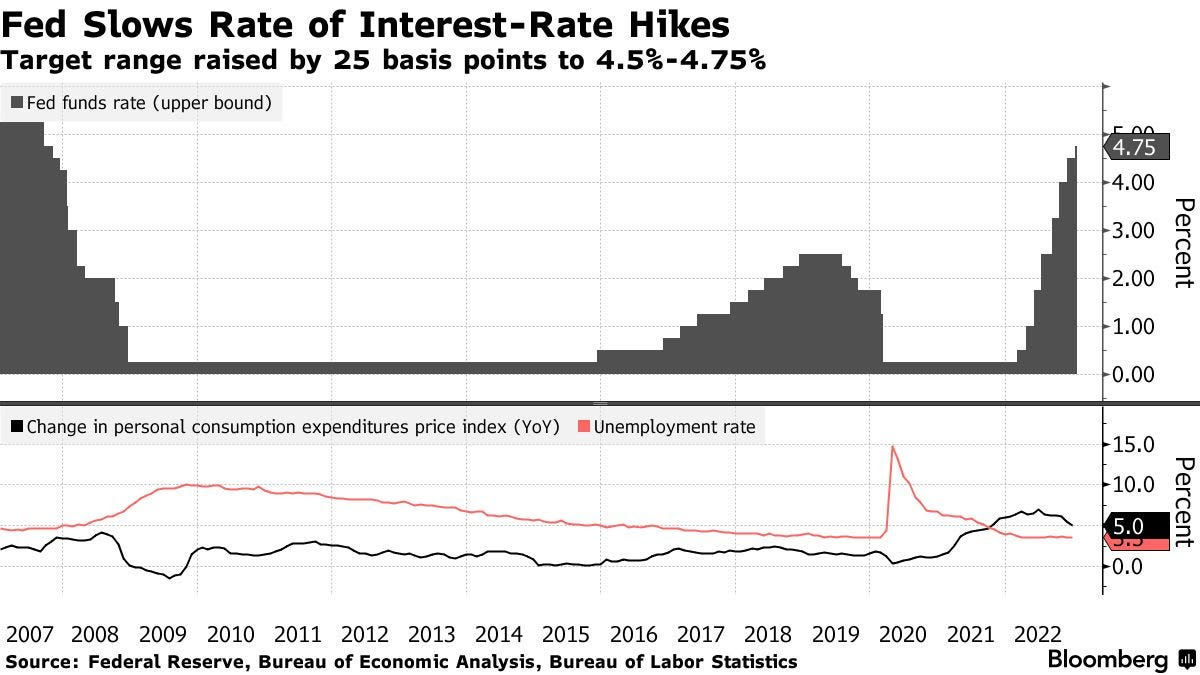
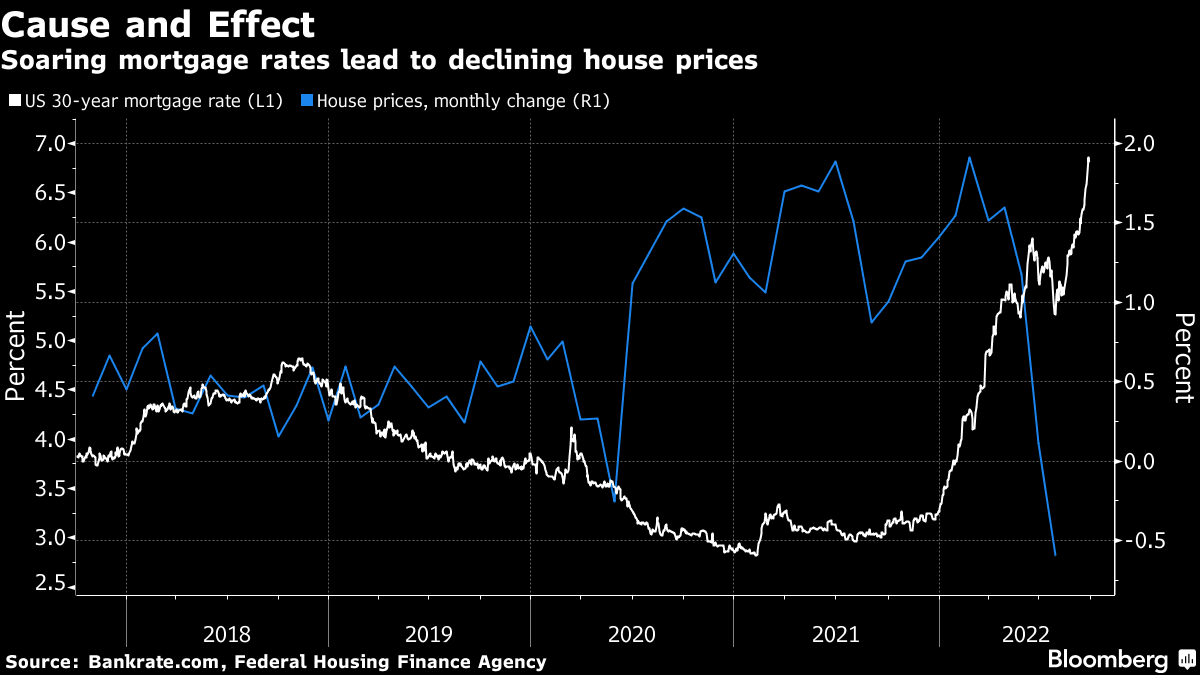
While the Federal Reserve controls short-term interest rates, long-term rates are more influenced by broader factors such as inflation expectations, economic growth, and investor sentiment.
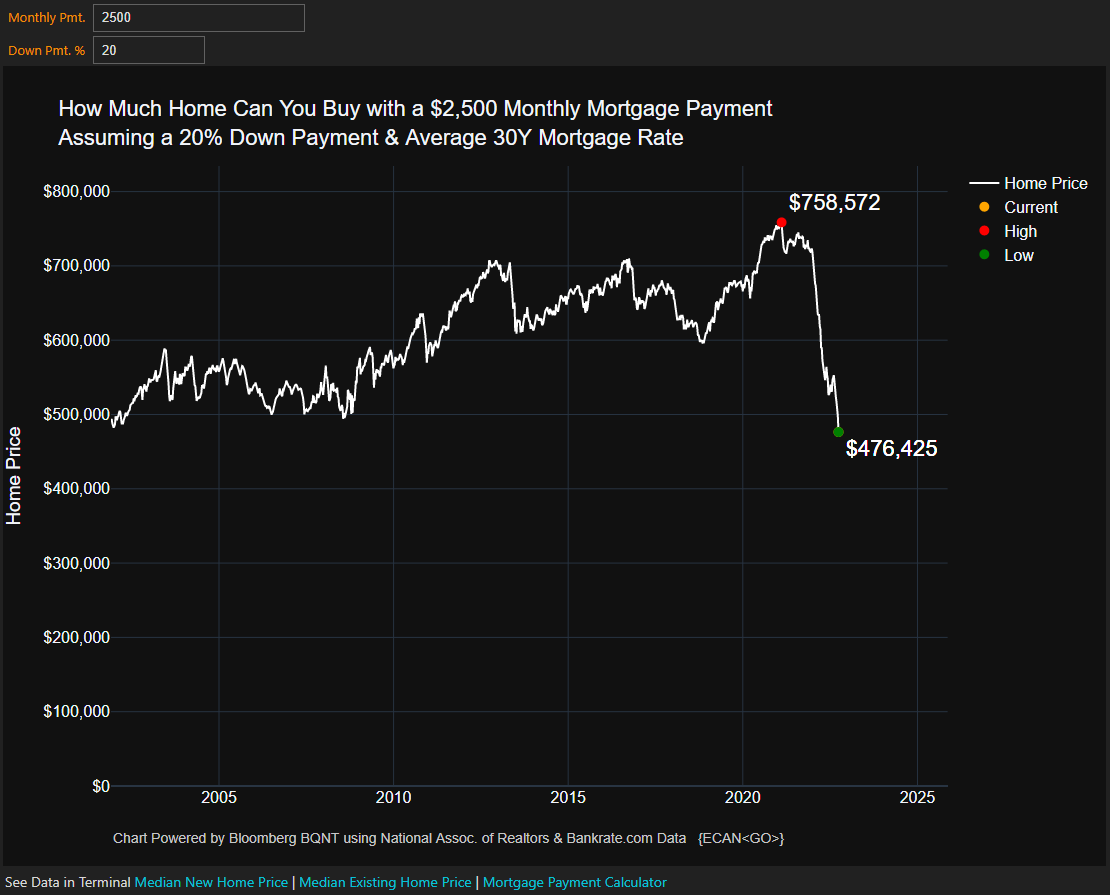
Although lower long-term rates can support risk assets, their more immediate and significant impact is on the broader economy. Lowering them reduces borrowing costs for homeowners and businesses, encouraging investment and consumption. Additionally, lowering these yields helps with servicing government debt burdens and improving fiscal stability.
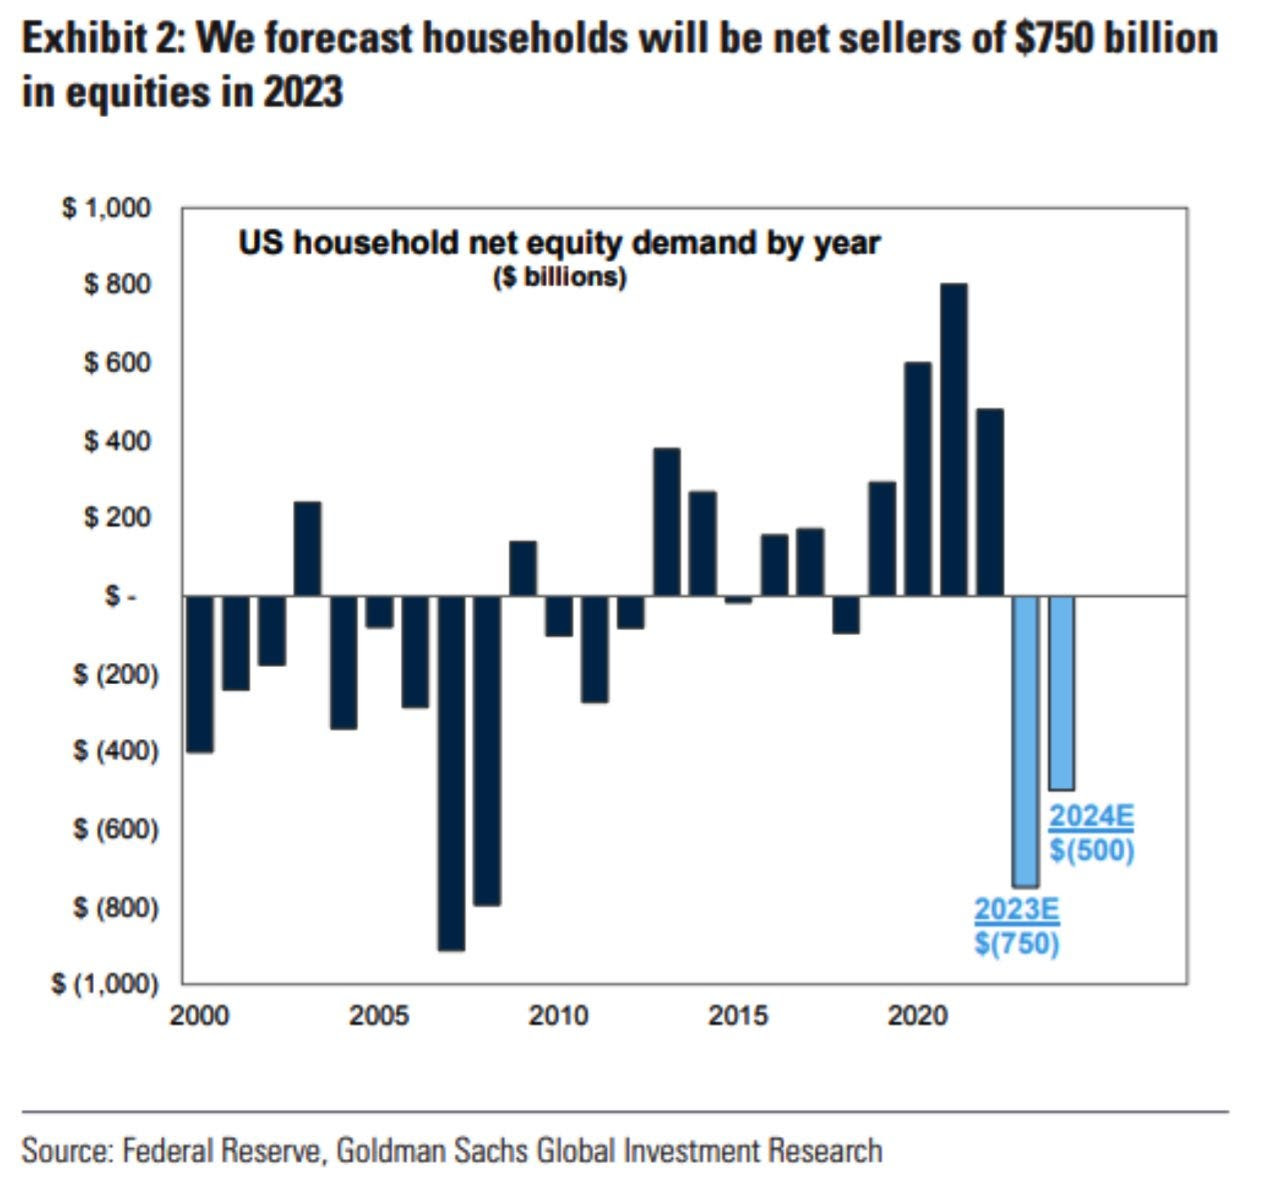
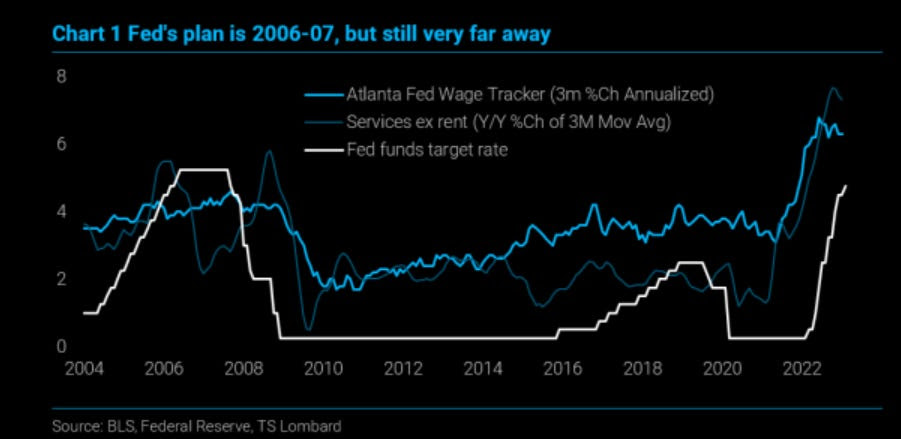
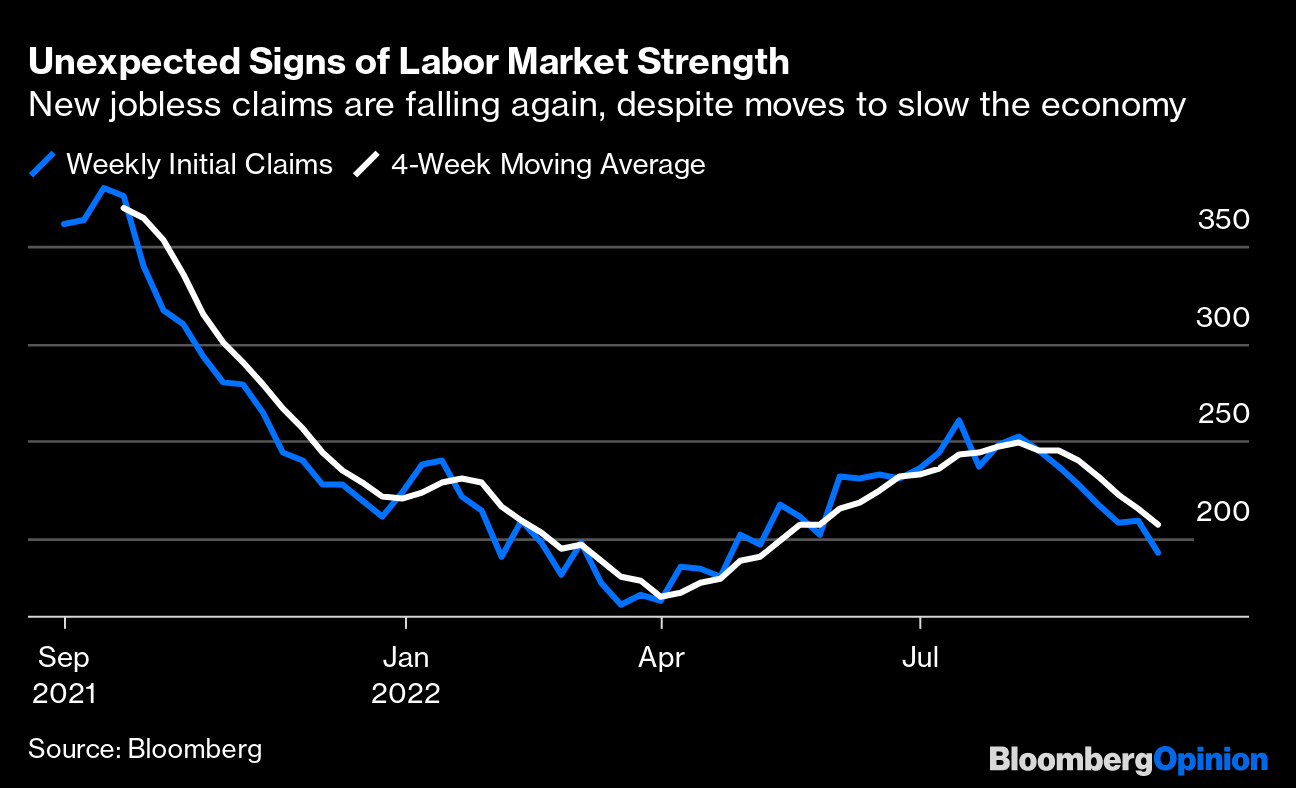
The shifts are intentional. Policymakers are transitioning the economy from dependence on government stimulus, but this adjustment comes with growing pains. Policy narratives and actions may weaken markets and slow economic activity in the short term. One reason receiving attention is the wealth effect—wealthier households, who drive a significant share of consumer spending, tend to spend more when stocks rise. Conversely, market drops can curb this effect and feed an economic slowdown.

Positioning Context: Setting Up For A Rip
History doesn’t repeat, but it often rhymes. Today’s setup echoes late summer 2024, albeit without the sharp volatility repricing. The difference? This time, investors were prepared, with hedges to act as insurance against market turmoil. The selling has been orderly, creating an illusion of stability and sustaining optimism.

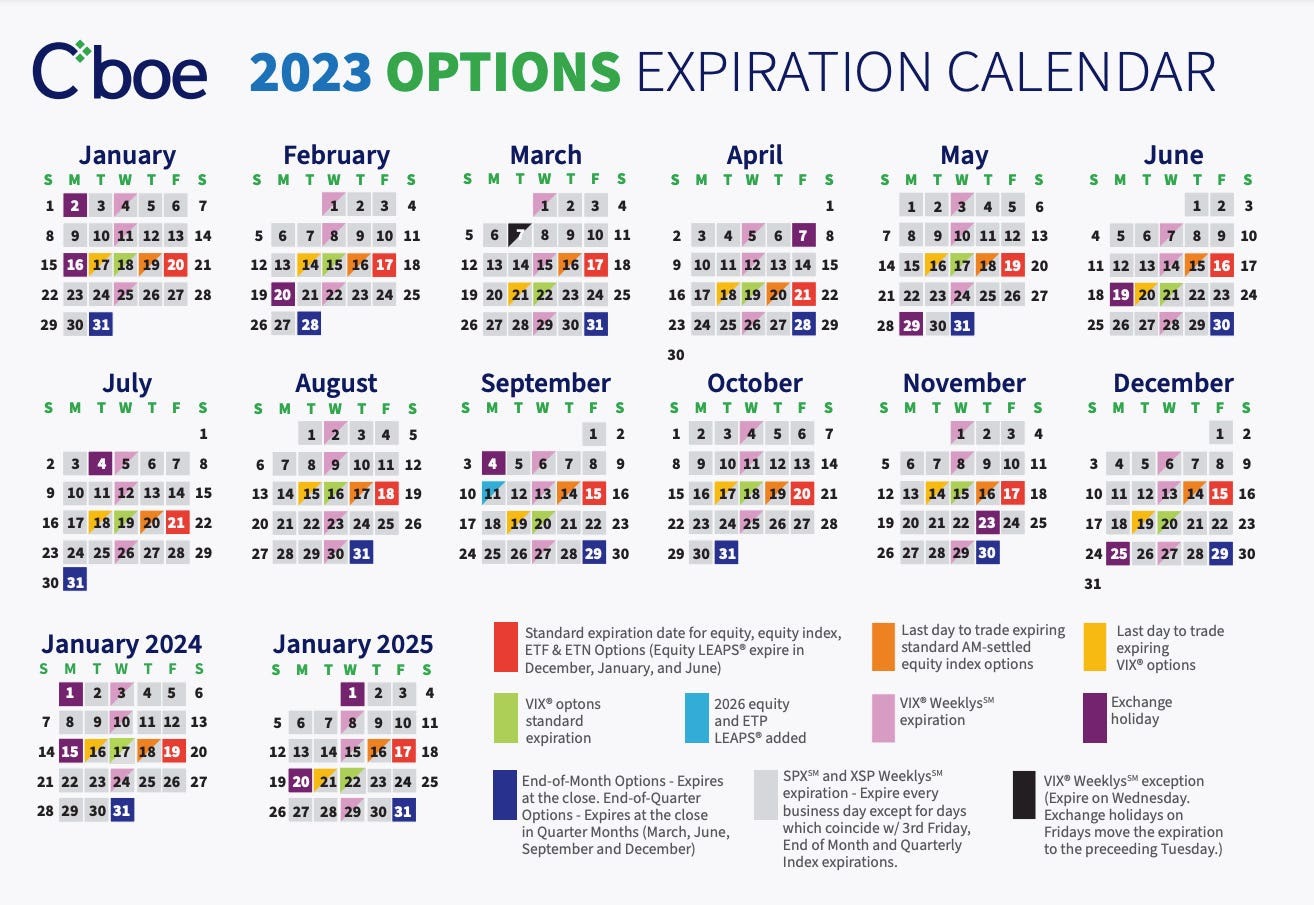
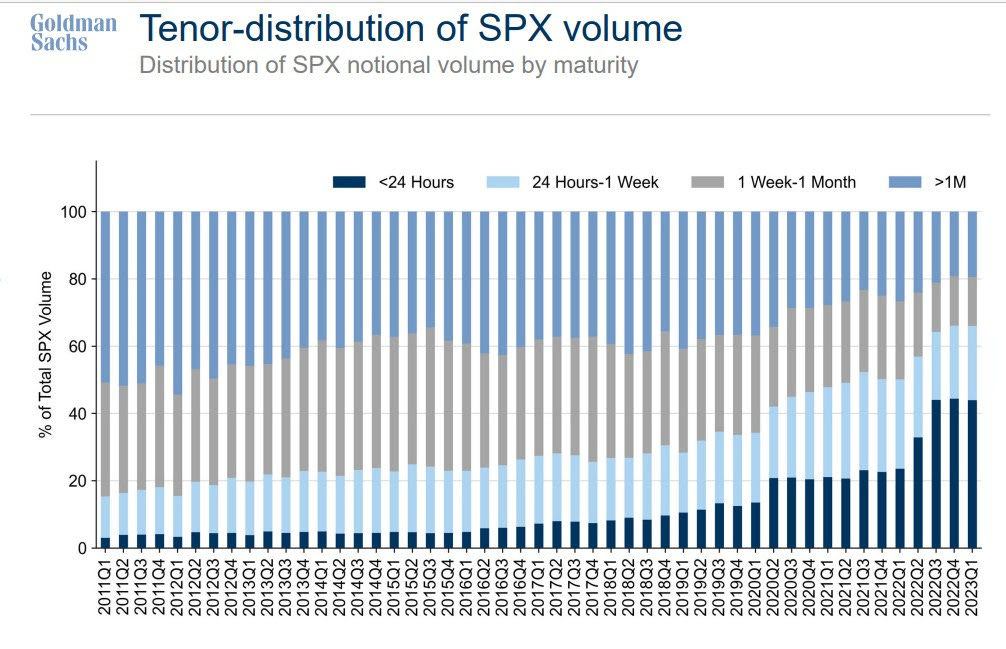
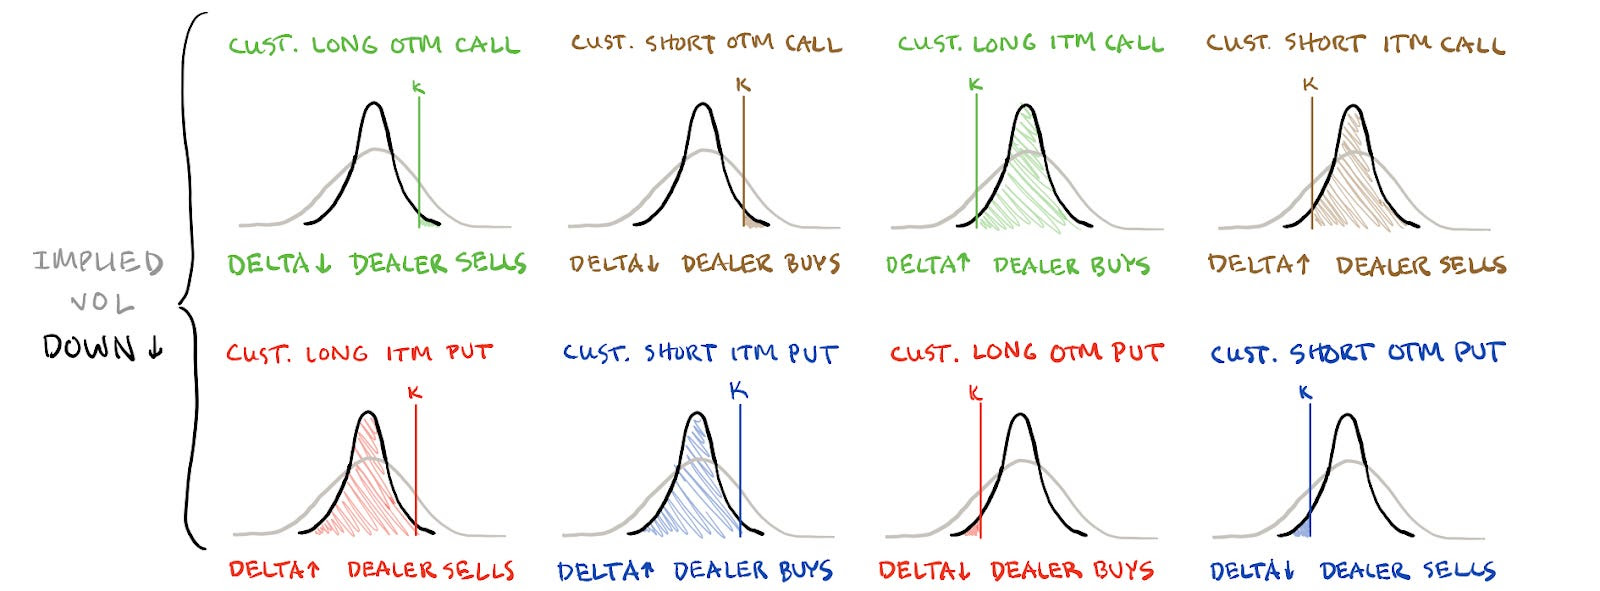
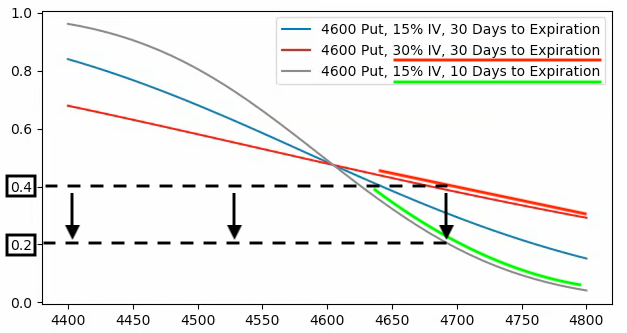
This ongoing decline began in mid-February, coinciding with the unwinding of significant amounts of call options—contracts to buy stocks at a set price. This added indirect pressure on the market through hedging-related flows.
SpotGamma expresses this view, highlighting that the February expiration was “call-weighted” due to strong stock performance leading up to it. This increased the likelihood of a pullback, as call sellers unwound their long stock hedges—a simplified explanation, as other offsetting positions may also be in play.

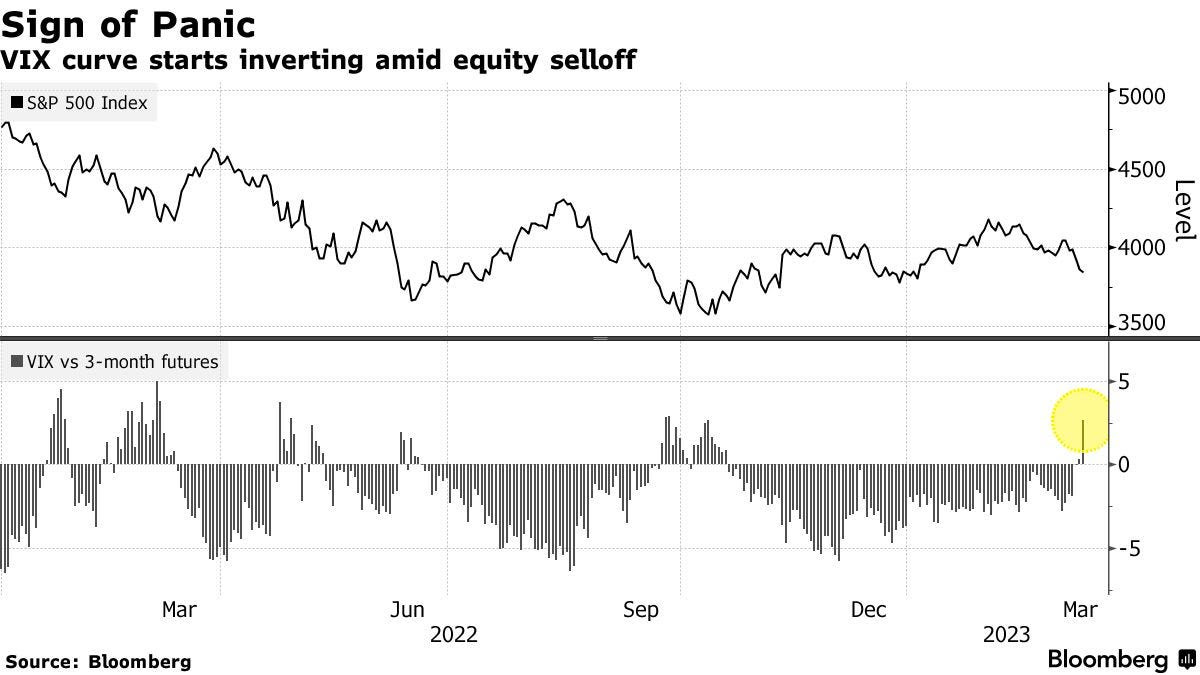
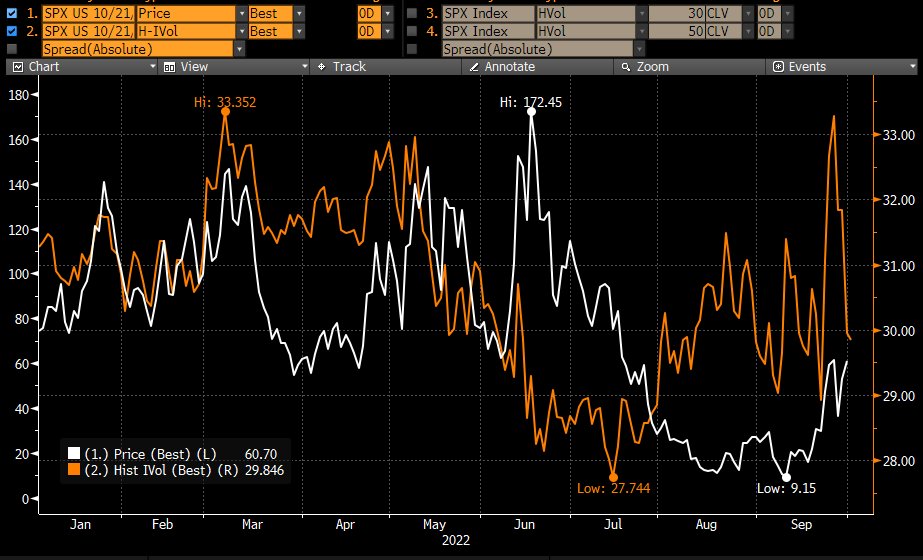
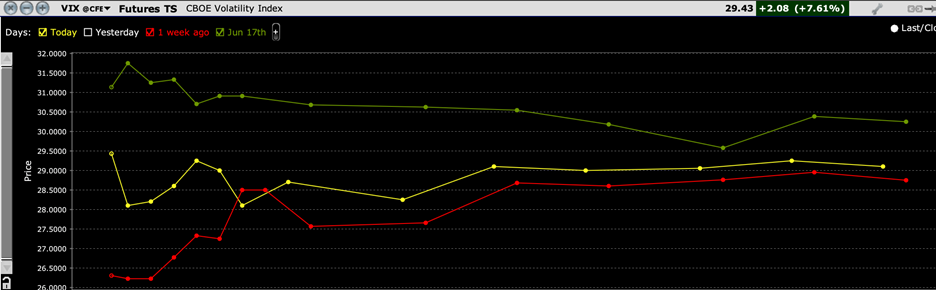
At the same time, after market shocks in August and December 2024, investors focused more on guarding against sudden volatility spikes rather than hedging against a broader market downturn. This pattern is familiar—the S&P 500 and the Cboe Volatility Index (VIX), which measures expected market volatility, sometimes rise together ahead of market peaks.

Meanwhile, within market supply dynamics, this activity has effectively set a floor under VIX pricing, as reflected in the VVIX trending higher since the volatility of late last summer.

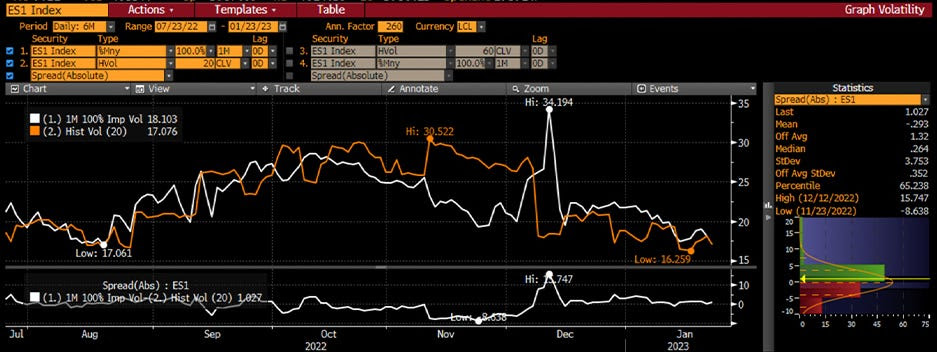
The result? Despite preparations for increased volatility, it hasn’t materialized, frustrating hedge holders and making it harder to identify a market bottom typically marked by extreme volatility spikes. Even with a backwardated implied volatility term structure (where short-term volatility is priced higher than longer-term volatility), anxiety and market movements remain out of sync.

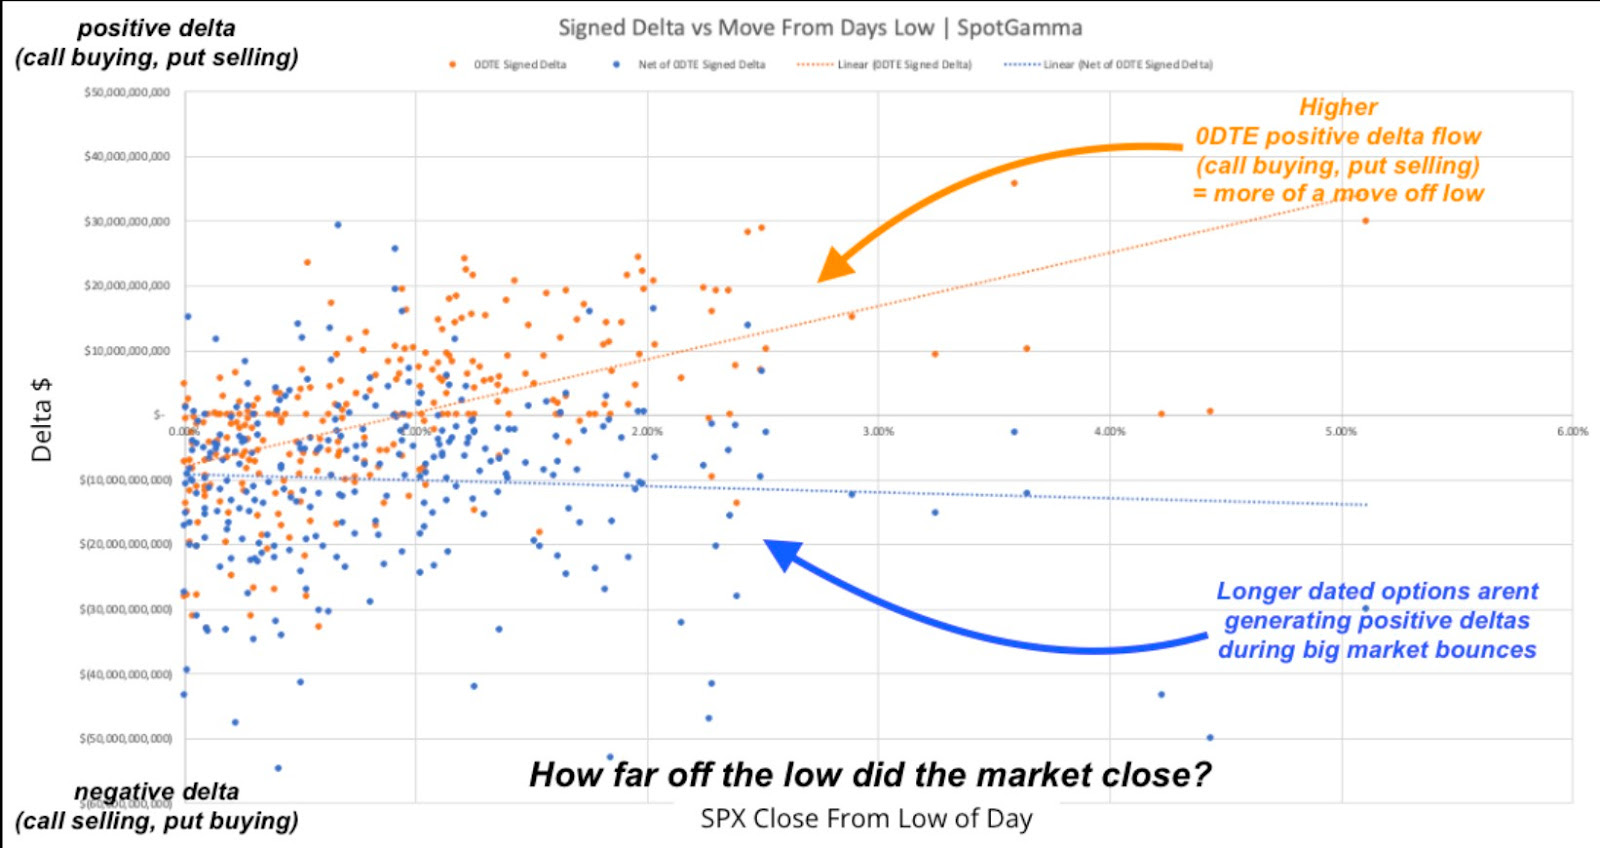
Over time, some traders might shift to longer-dated options, while others might drop their hedges altogether, which could amplify volatility-selling behavior. Ironically, this could create the conditions for shocks they were trying to hedge against.

Given this environment, 2022’s playbook becomes relevant. Back then, investors—rattled by the COVID crash—were prepared, monetizing hedges into declines and keeping a lid on volatility. We may see parallels now. After last week’s economic data, hedgers have been supplying volatility back to the market, offering brief relief as we potentially enter a seasonally stronger period.

The main takeaway? Current positioning dynamics indicate that investors have effectively managed and responded to the downside. While markets will be volatile, significant shocks may be delayed or avoided.

Context Applied: Trade Structuring
We adapted previously shared structuring guides. Given volatility’s failure to perform, we opted for downside ratios and flies. This worked, and we plan on developing some case studies.
A potential cyclical rebound within a broader period of weakness could be expressed via low-cost positive-delta (bullish) structures, including buying calls while proportionately hedging with stocks or futures, where potential gains from the calls can outweigh hedge-related losses. Additionally, as we prefer, one can deploy verticals and flies, buying options closer to the current market prices while selling more options further out (with an extra far-out option bought to reduce margin requirements if needed).

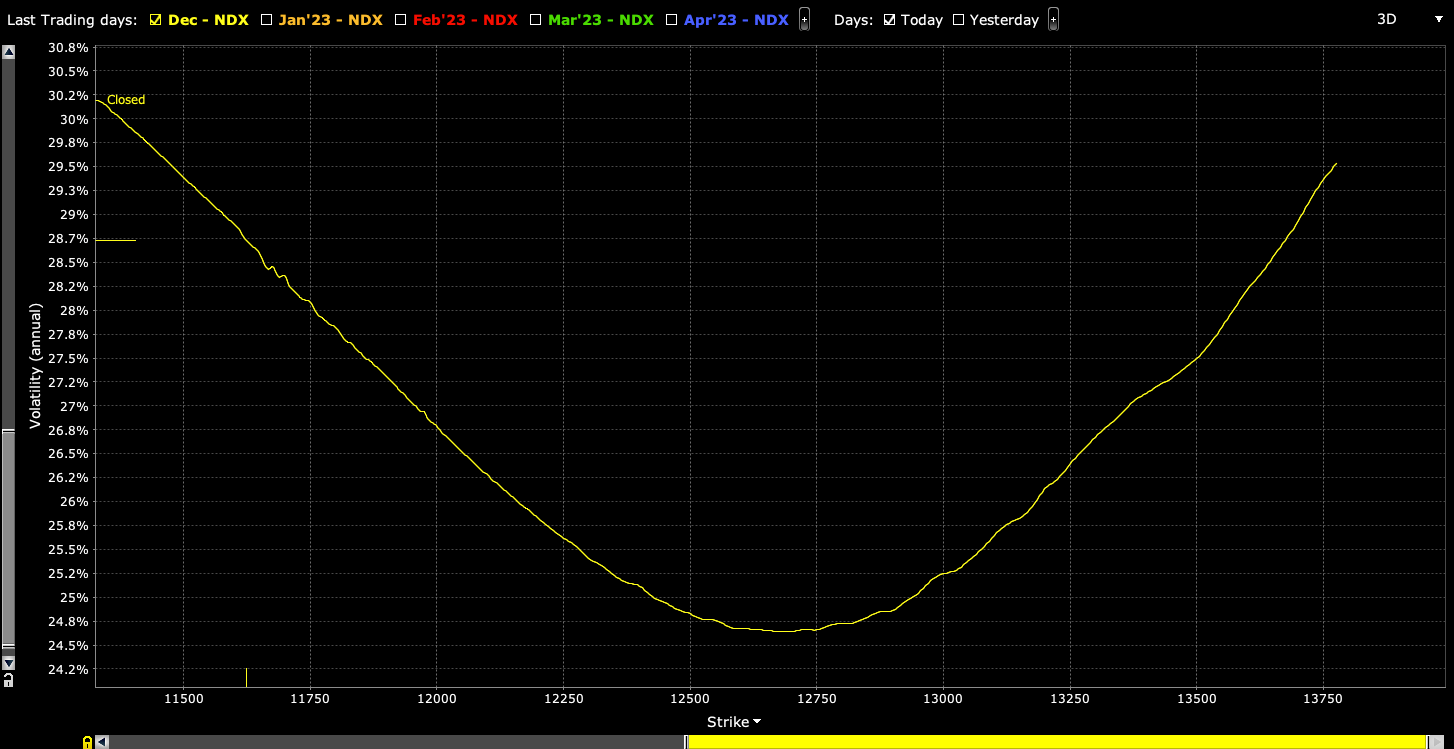
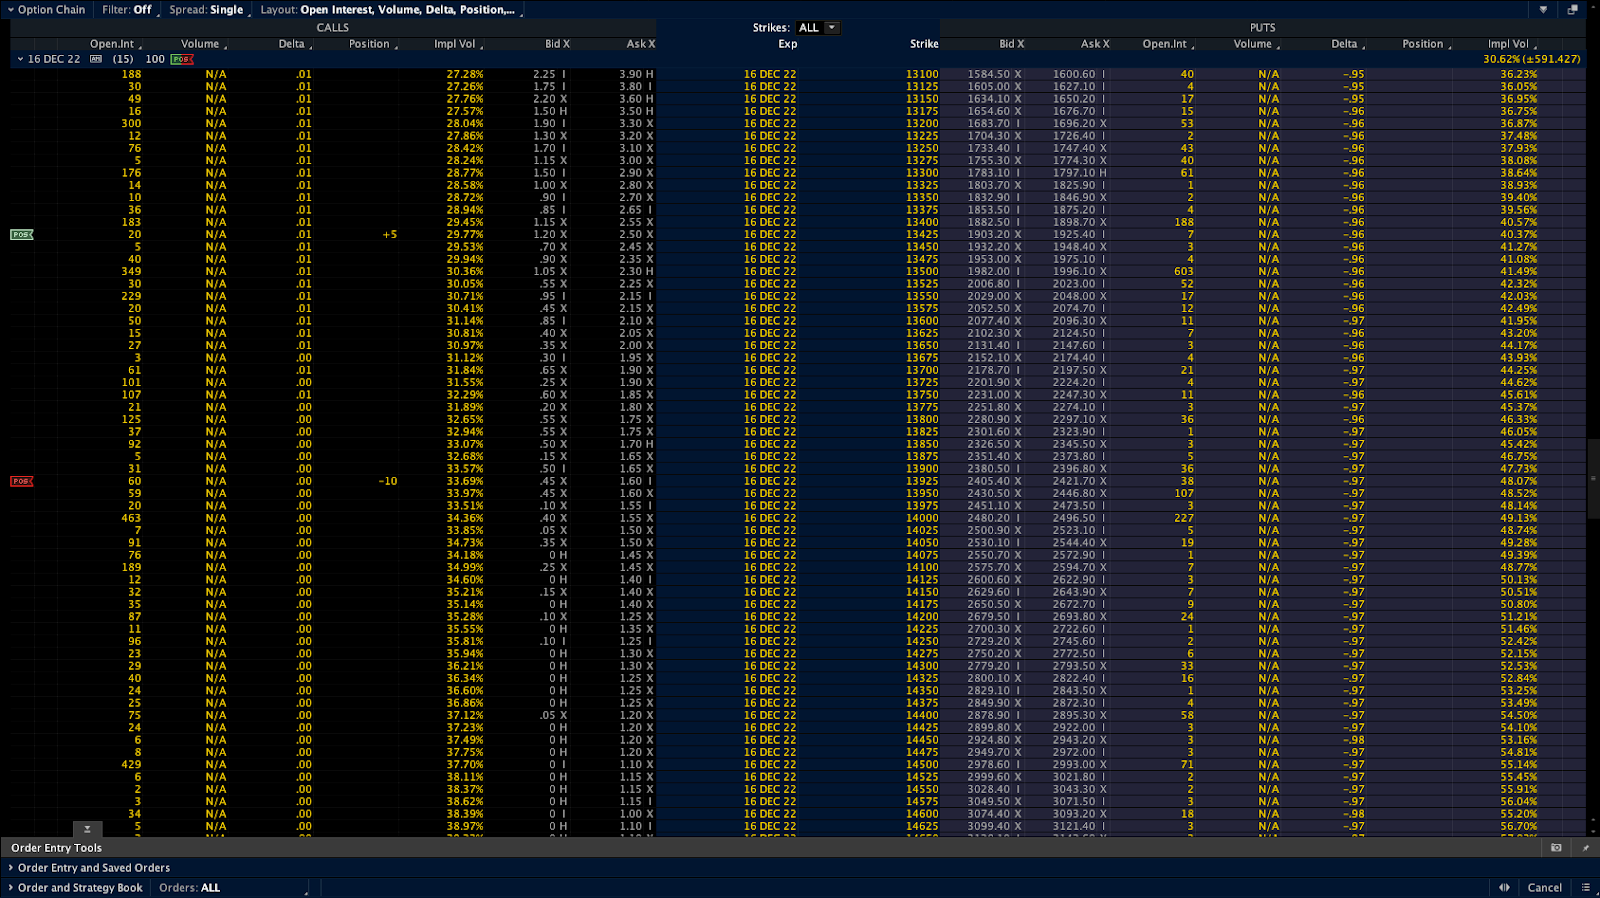
We and others agree that the Nasdaq 100 (NDX) and higher beta stocks are appealing. For one, relative strength pockets emerge in the NDX versus the SPX, potentially attributable to tariffs disproportionately impacting non-tech sectors. Checking options skews, and NDX options farther away in price may be underpriced for the eventually realized volatility.

For more on structuring across different products, be they gold or Bitcoin, see our Mar-a-Lago Accords letter published last month.
Disclaimer
By viewing our content, you agree to be bound by the terms and conditions outlined in this disclaimer. Consume our content only if you agree to the terms and conditions below.
Physik Invest is not registered with the US Securities and Exchange Commission or any other securities regulatory authority. Our content is for informational purposes only and should not be considered investment advice or a recommendation to buy or sell any security or other investment. The information provided is not tailored to your financial situation or investment objectives.
We do not guarantee the accuracy, completeness, or timeliness of any information. Please do not rely solely on our content to make investment decisions or undertake any investment strategy. Trading is risky, and investors can lose all or more than their initial investment. Hypothetical performance results have limitations and may not reflect actual trading results. Other factors related to the markets and specific trading programs can adversely affect actual trading results. We recommend seeking independent financial advice from a licensed professional before making investment decisions.
We don’t make any claims, representations, or warranties about the accuracy, completeness, timeliness, or reliability of any information we provide. We are not liable for any loss or damage caused by reliance on any information we provide. We are not liable for direct, indirect, incidental, consequential, or damages from the information provided. We do not have a professional relationship with you and are not your financial advisor. We do not provide personalized investment advice.
Our content is provided without warranties, is the property of our company, and is protected by copyright and other intellectual property laws. You may not be able to reproduce, distribute, or use any content provided through our services without our prior written consent. Please email renato@physikinvest for consent.
We reserve the right to modify these terms and conditions at any time. Following any such modification, your continued consumption of our content means you accept the modified terms. This disclaimer is governed by the laws of the jurisdiction in which our company is located.