Categories
Commentary

Daily Brief For March 22, 2022

Editor’s Note: The Daily Brief is a free glimpse into the prevailing fundamental and technical drivers of U.S. equity market products. Join the 200+ that read this report daily, below!

What Happened

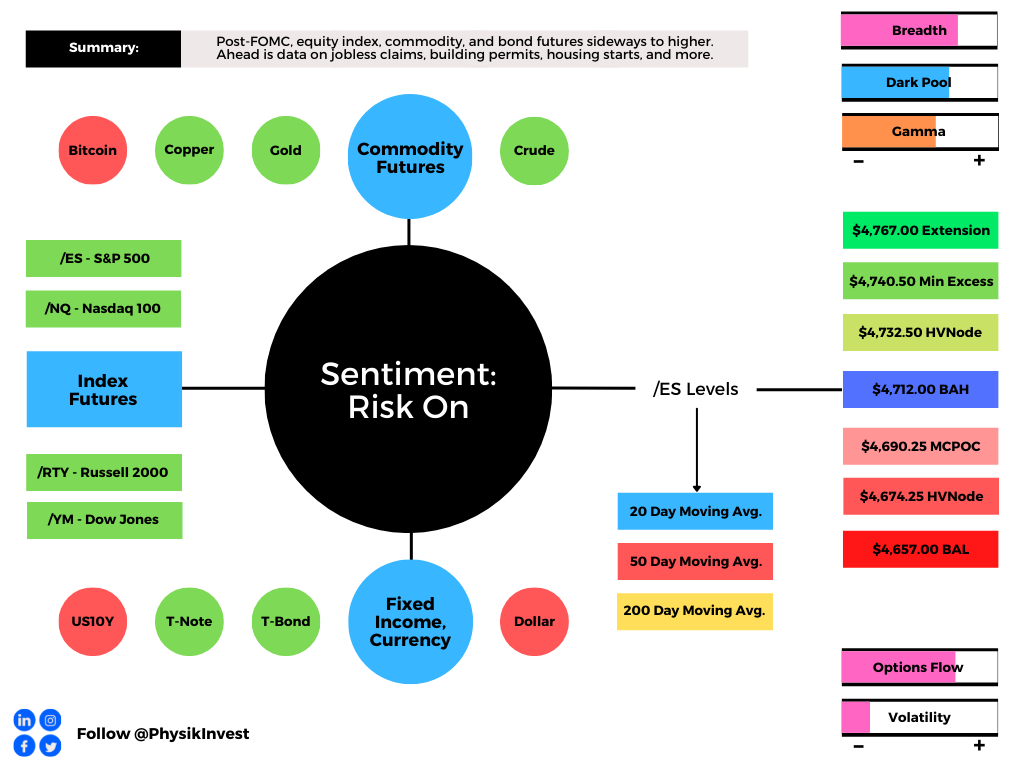
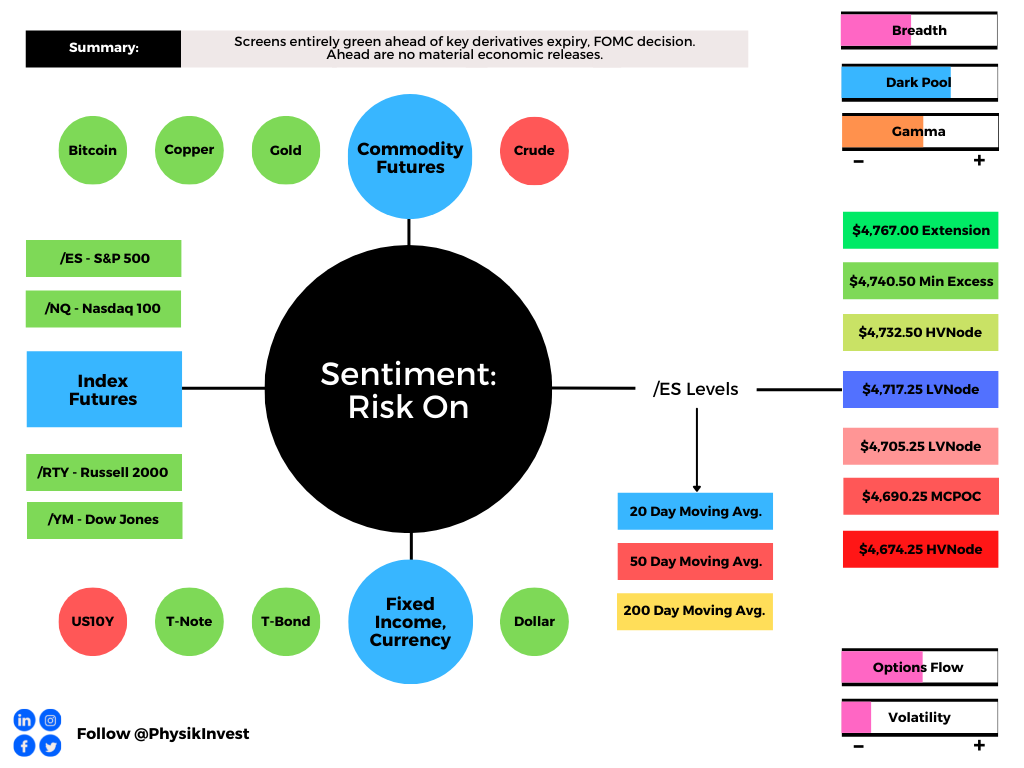
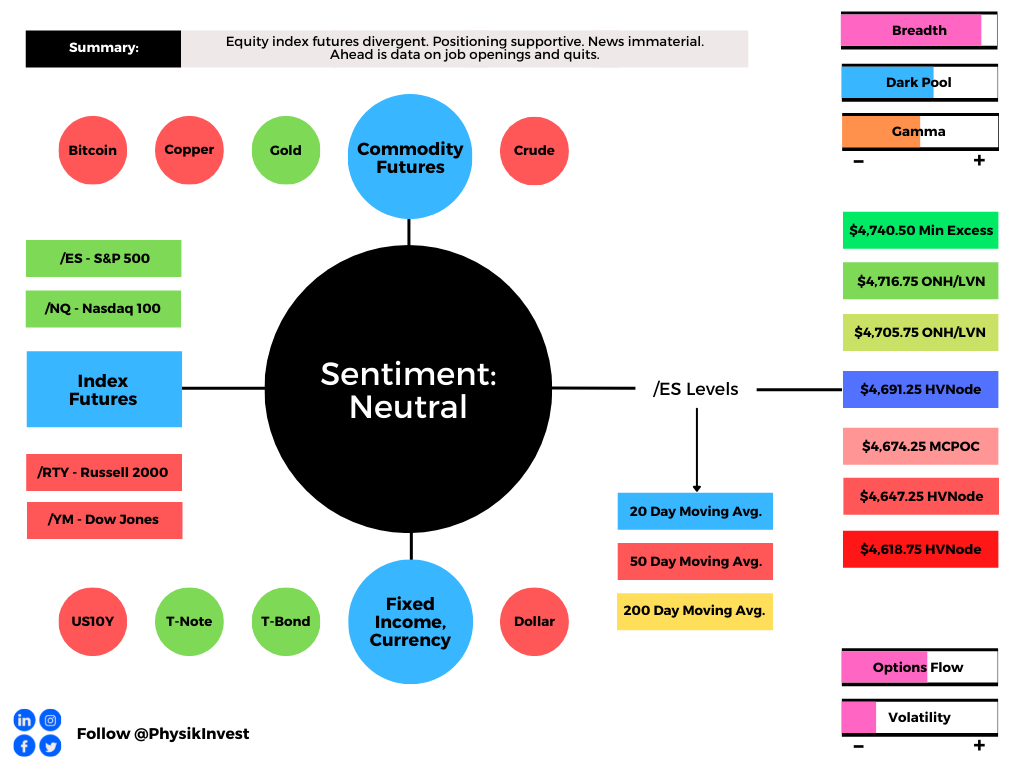
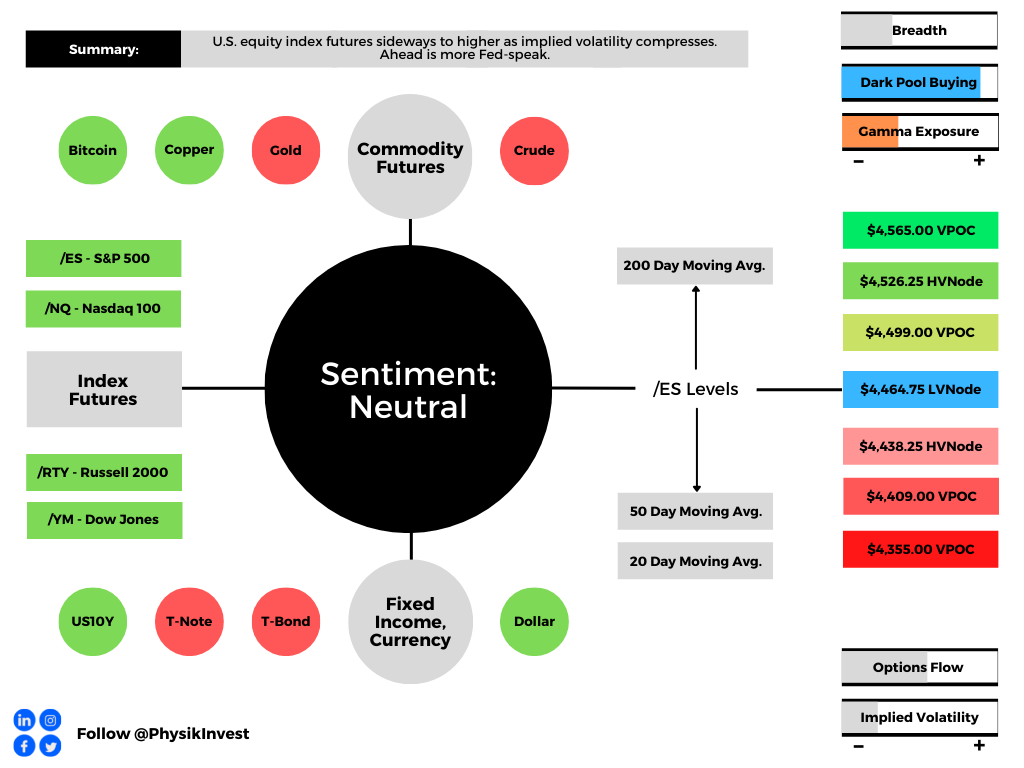
Overnight, equity index futures were sideways to higher, and this validates higher prices, more. 

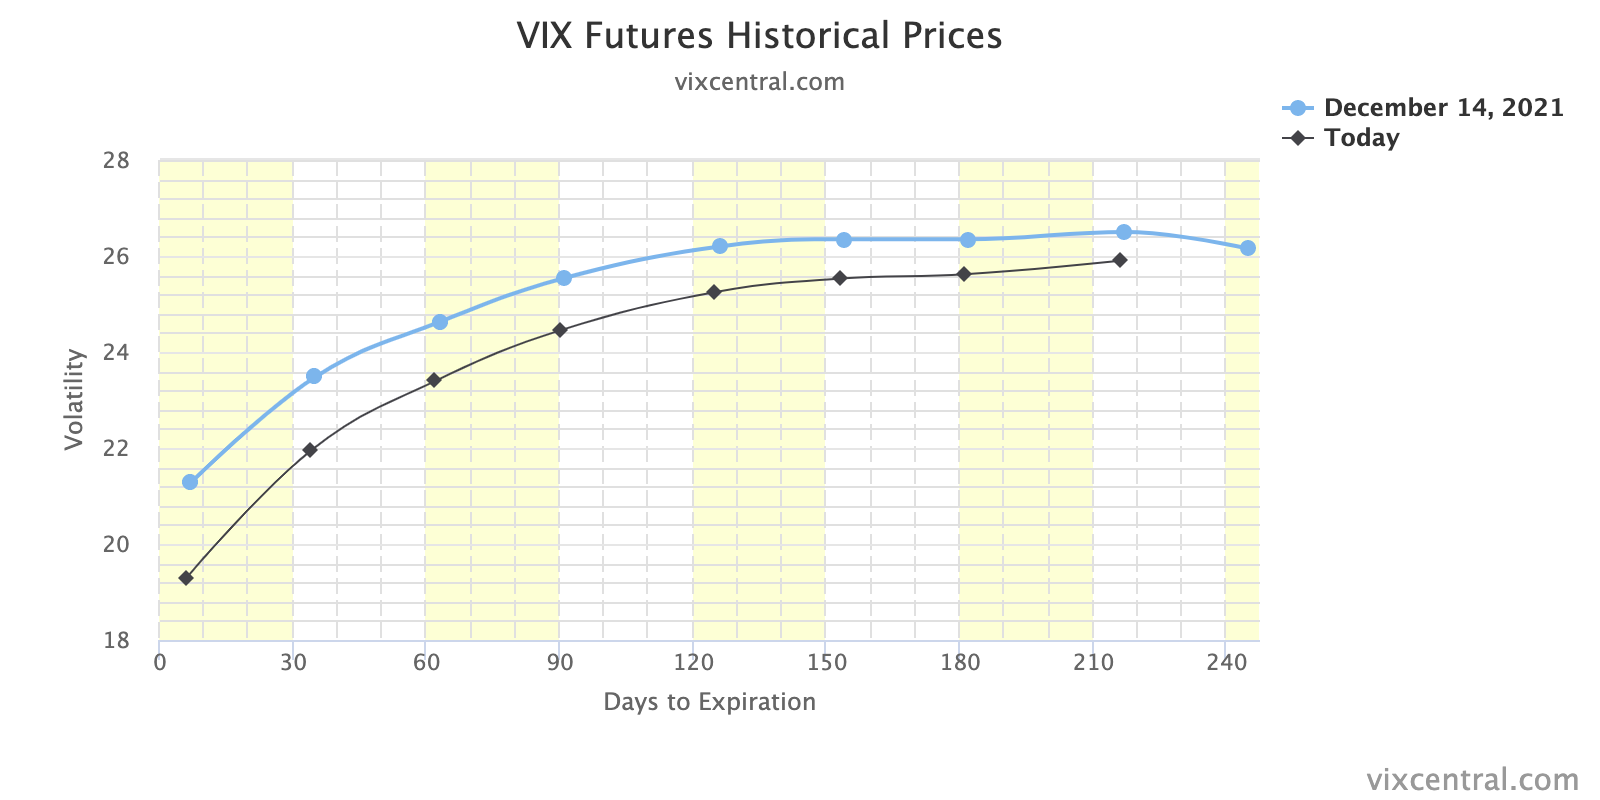
This is as implied volatility metrics – such as the Cboe Volatility Index (INDEX: VIX) – continue to suggest less demand for protection and a potential easing of concern.

As discussed in detail, yesterday, participants are not committing themselves to increased call option (i.e., insurance for shorts or bets on the upside) exposures, a dynamic usually seen at the start of sustained reversals. 

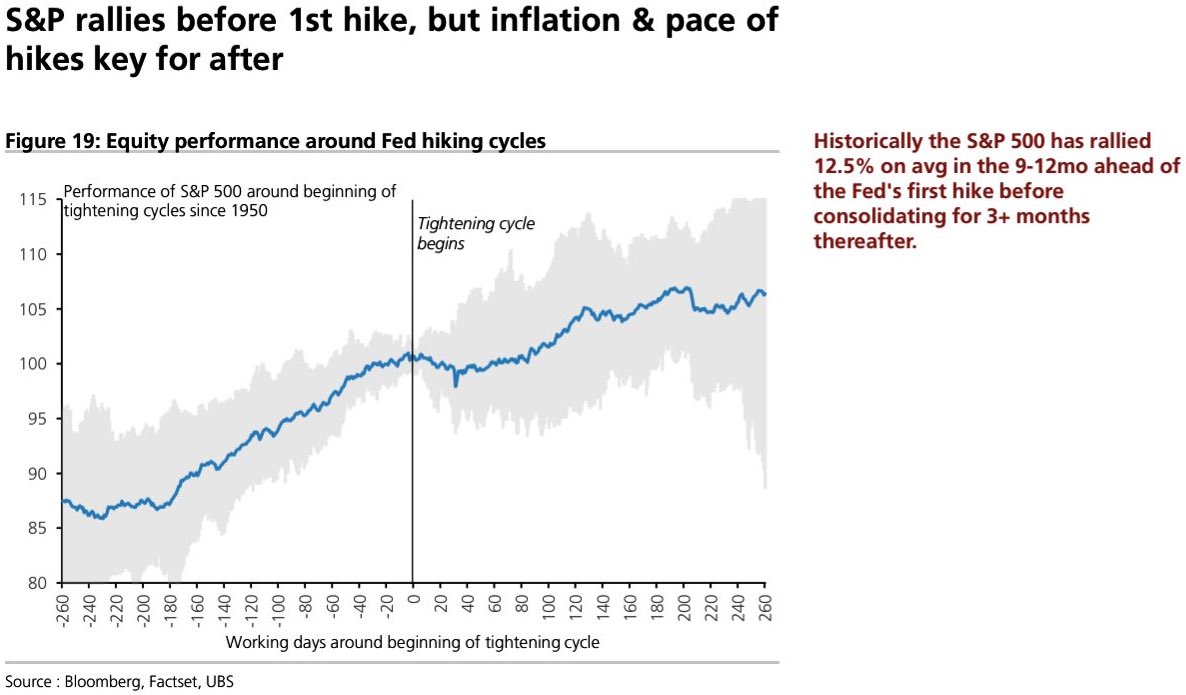
Given this, as well as institutional selling in spite of underinvestment (watch a chat), and the Federal Reserve’s (Fed) commitment to reining in inflation via “aggressive” monetary policy (i.e., hike and taper asset purchases) action, there is concern over the sustainability of this rally.

Ahead is Fed-speak. The New York Fed’s John Williams speaks at 10:35 AM ET. San Francisco Fed’s Mary Daly talks at 2:00 PM ET. The Cleveland Fed’s Loretta Mester talks at 5:00 PM ET.

Graphic updated 6:30 AM ET. Sentiment Neutral if expected /ES open is inside of the prior day’s range. /ES levels are derived from the profile graphic at the bottom of the following section. Levels may have changed since initially quoted; click here for the latest levels. SqueezeMetrics Dark Pool Index (DIX) and Gamma (GEX) calculations are based on where the prior day’s reading falls with respect to the MAX and MIN of all occurrences available. A higher DIX is bullish. At the same time, the lower the GEX, the more (expected) volatility. Learn the implications of volatility, direction, and moneyness. SHIFT data used for S&P 500 (INDEX: SPX) options activity. Note that options flow is sorted by the call premium spent; if more positive, then more was spent on call options. Breadth reflects a reading of the prior day’s NYSE Advance/Decline indicator. VIX reflects a current reading of the CBOE Volatility Index (INDEX: VIX) from 0-100.

What To Expect

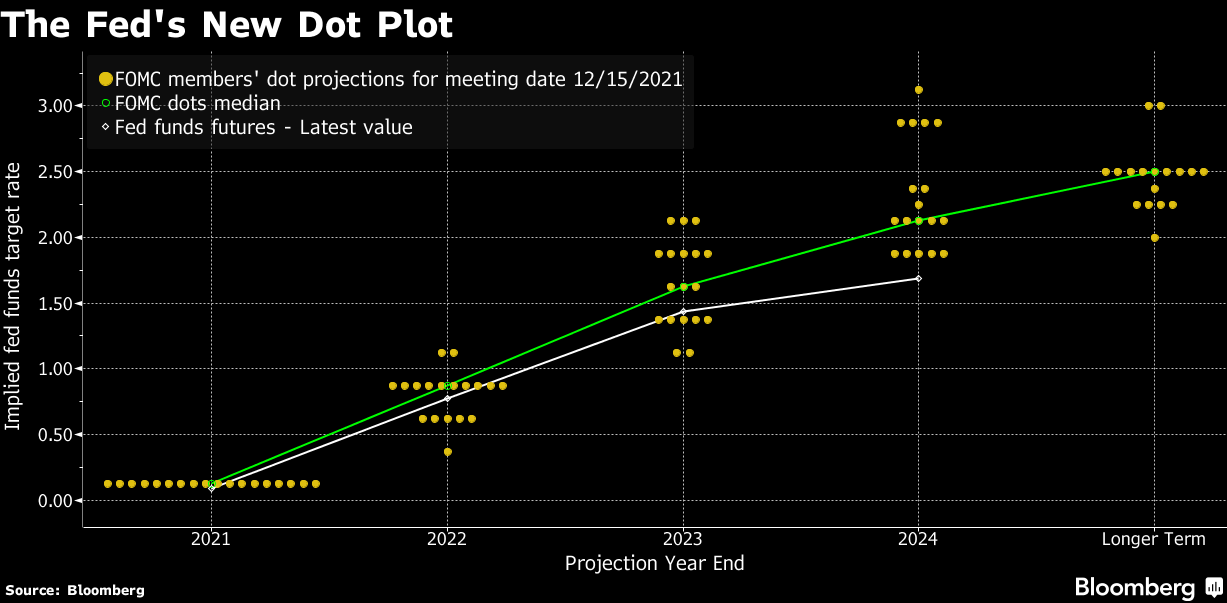
Fundamental: Based on remarks by the Fed’s Jerome Powell, quantitative tightening (QT) will move at a pace of $1 trillion a year. This is a faster pace than that of the prior QT.

Read yesterday’s commentary for more on QE and QT.

According to Joseph Wang’s detailed discussion on the implications of QT, the “[a]nticipation of QT is already widening the spread between Agency MBS and Treasuries but does not yet appear to affect Treasury prices.”

“The supply and demand dynamics suggest that the market may simply be slow to react. In that case, Treasury prices will also have to adjust downward, maybe by a lot.”

Pursuant to that remark, Damped Spring’s Andy Constan explains that quantitative easing (QE), “which decreased risk premiums and increased wealth was inflationary to assets but ineffective in generating inflation of goods and services.”

Essentially, QT is not a good tool to fight inflation.

“Raising rates is the strong tool to fight inflation for the Fed and decreasing the budget deficit growth is the tool for Fiscal policymakers; … the [Fed] will do both QT to reduce the balance sheet and hike rates to fight inflation.”

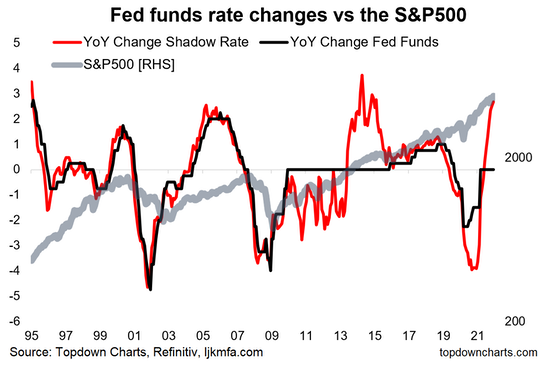
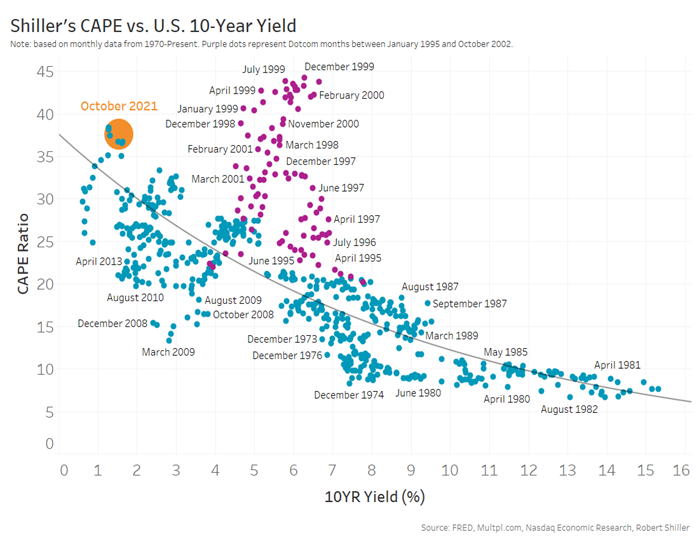
Moreover, higher bond yields (lower bond prices) are usually not good for stocks. The question is whether participants want to take on the added risk of investing at high valuations?

Graphic: Via S&P Global Inc (NYSE: SPGI). Markets tend not, necessarily, to perform poorly during rising interest rate environments. 

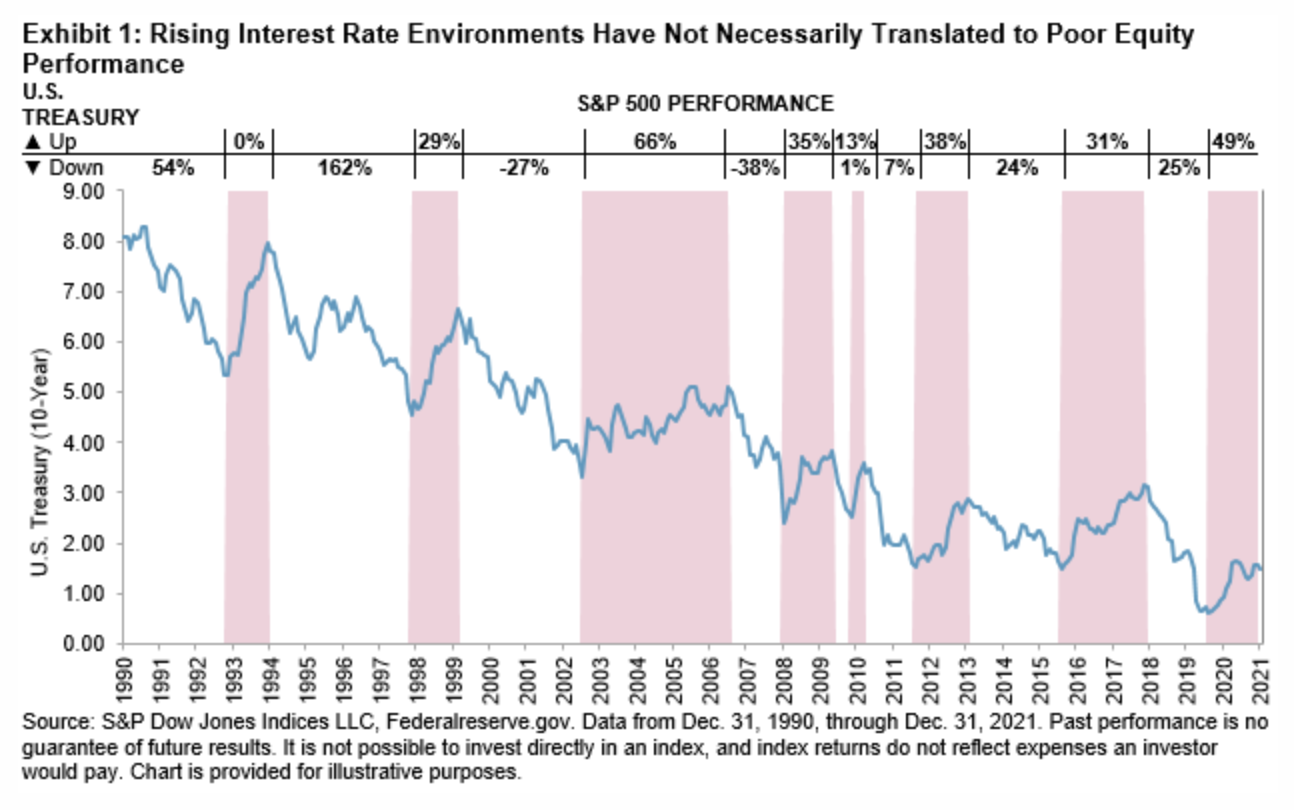
The QT narrative amplifies the impact of rate hikes

Lisa Shalett, CIO at Morgan Stanley (NYSE: MS) Wealth Management, discussed recently QT at $80 billion per month (and $500 billion in balance sheet reduction through year-end), as well as how the added risks are to be compensated through lower price-to-earnings multiples in the stock market.

“In tightening terms, that’s the equivalent of another 25-basis-point hike,” Shalett explained. “In contrast, balance sheet run-off totaled $700 billion from 2017 through 2019 before the Fed stopped because markets seized and stocks sold off.”

Graphic: Via Index Indicators. Breadth, here, is measured by the % of SPX stocks above the 50-day average.

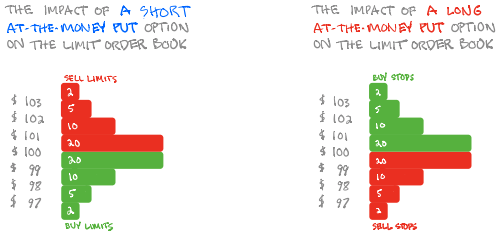
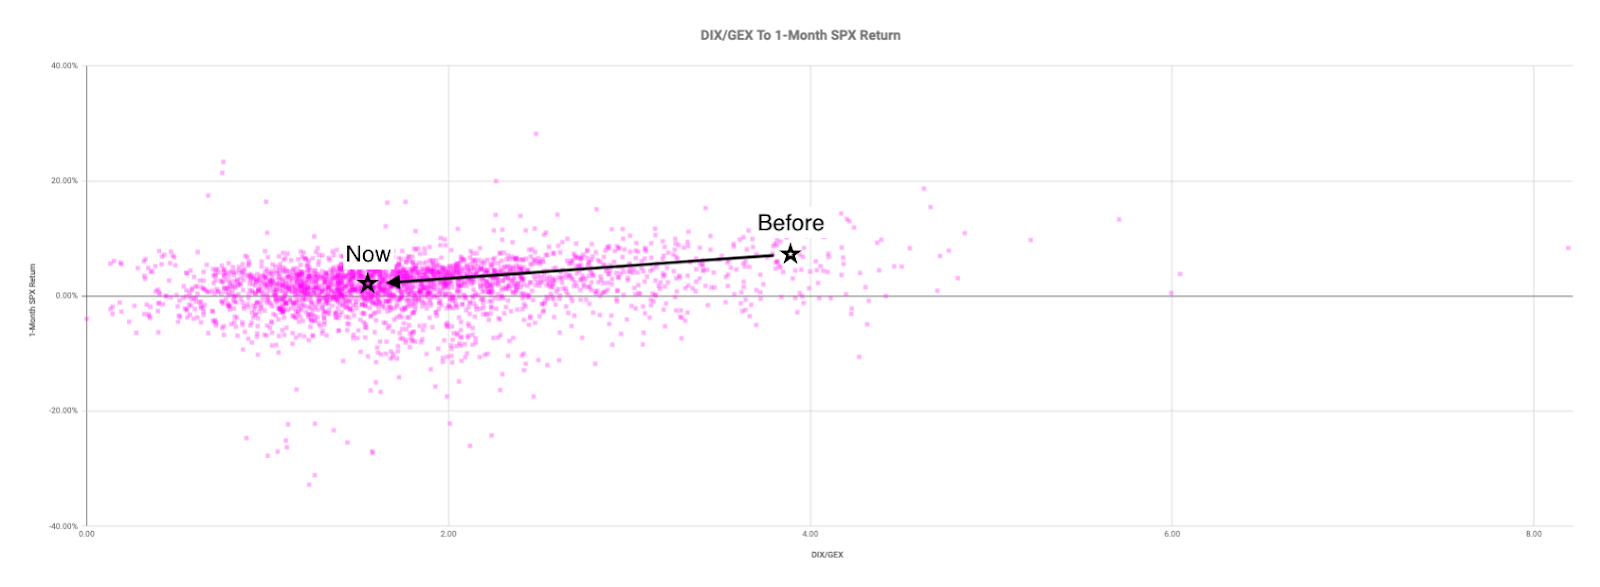
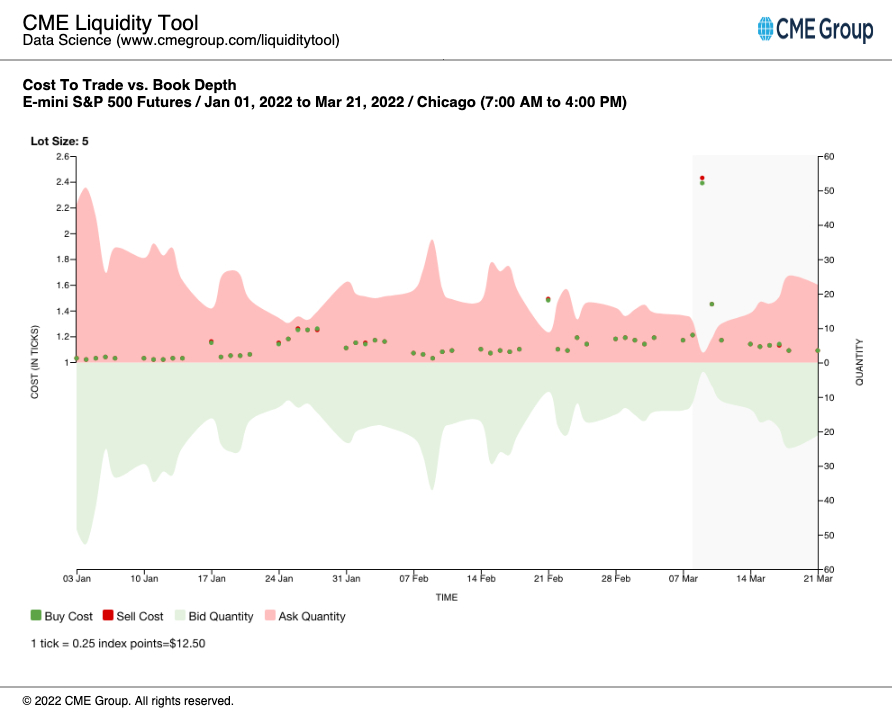
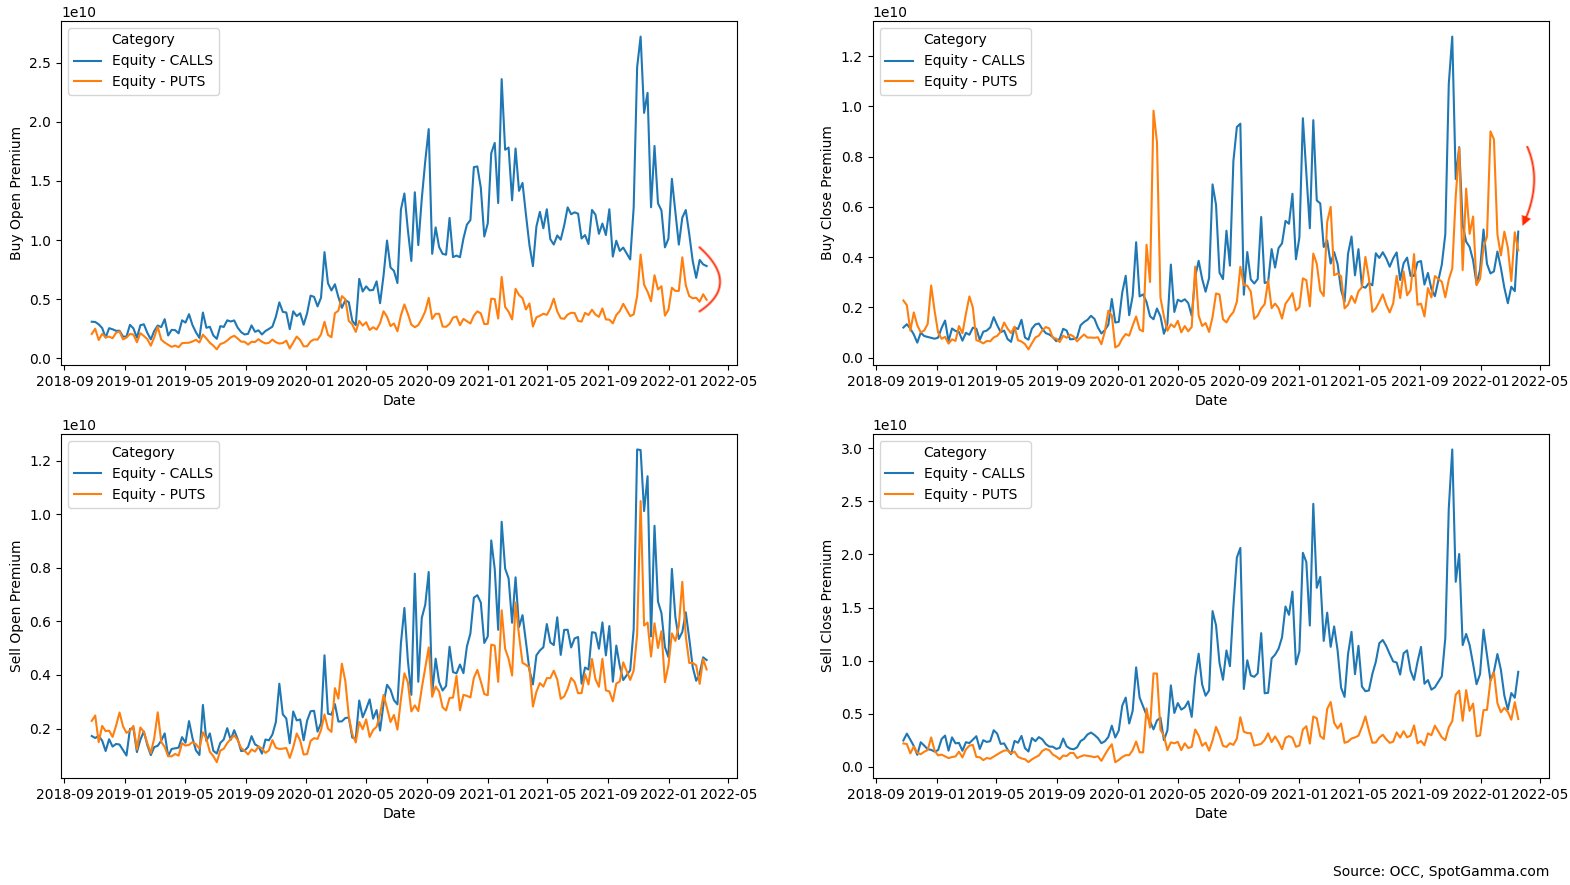
Positioning: As discussed before, a feature of falling markets is the demand for protection. 

When this protection is monetized (or decay ensues), options counterparties add to the market liquidity (i.e., buying back short futures hedges).

Graphic: Via CME Group Inc (NYSE: CME). Book depth thickens since early March swing low.

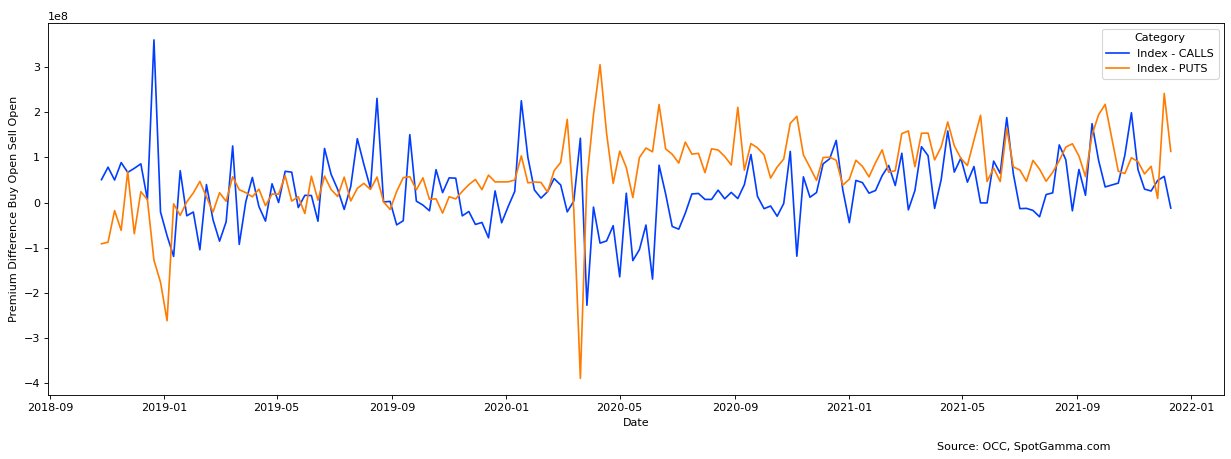
A feature of markets entering a sustainable recovery is the demand for call options.

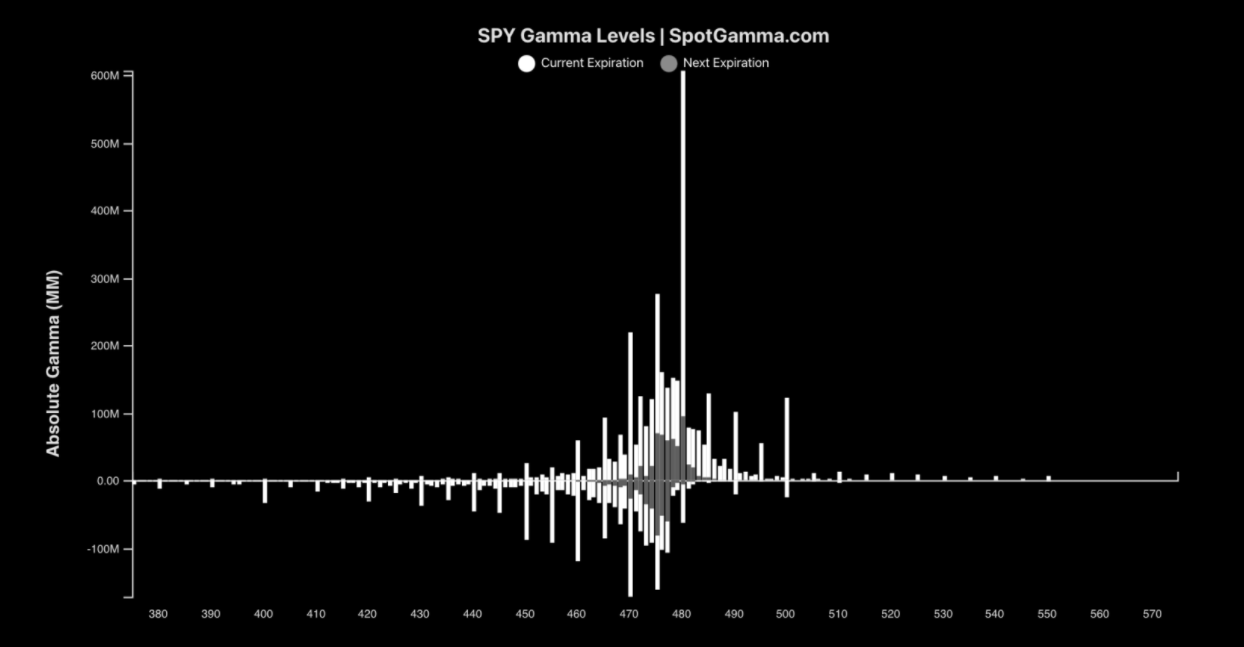
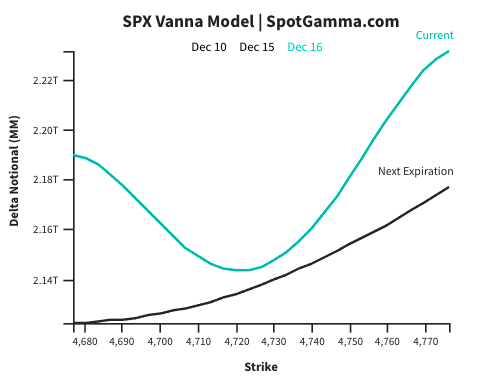
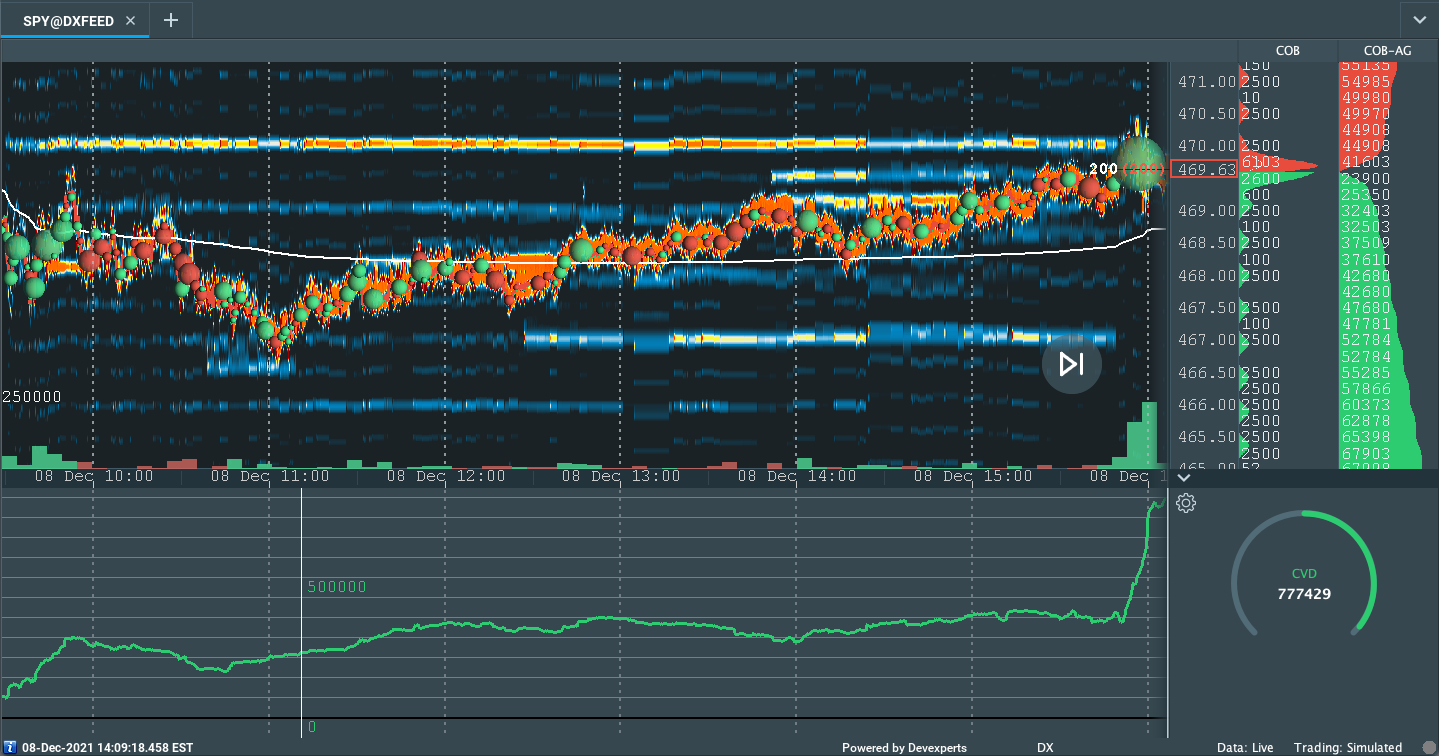
Based on metrics published by SpotGamma, call-buying was near its lows.

Graphic: Via SpotGamma. “Plots show the premium per trade aggregated each week, with calls in blue and puts in orange. This is only customer flow (i.e. retail, hedge funds). Starting with equities, call buying this past week was at LOWS going back to 2020 (top right).”

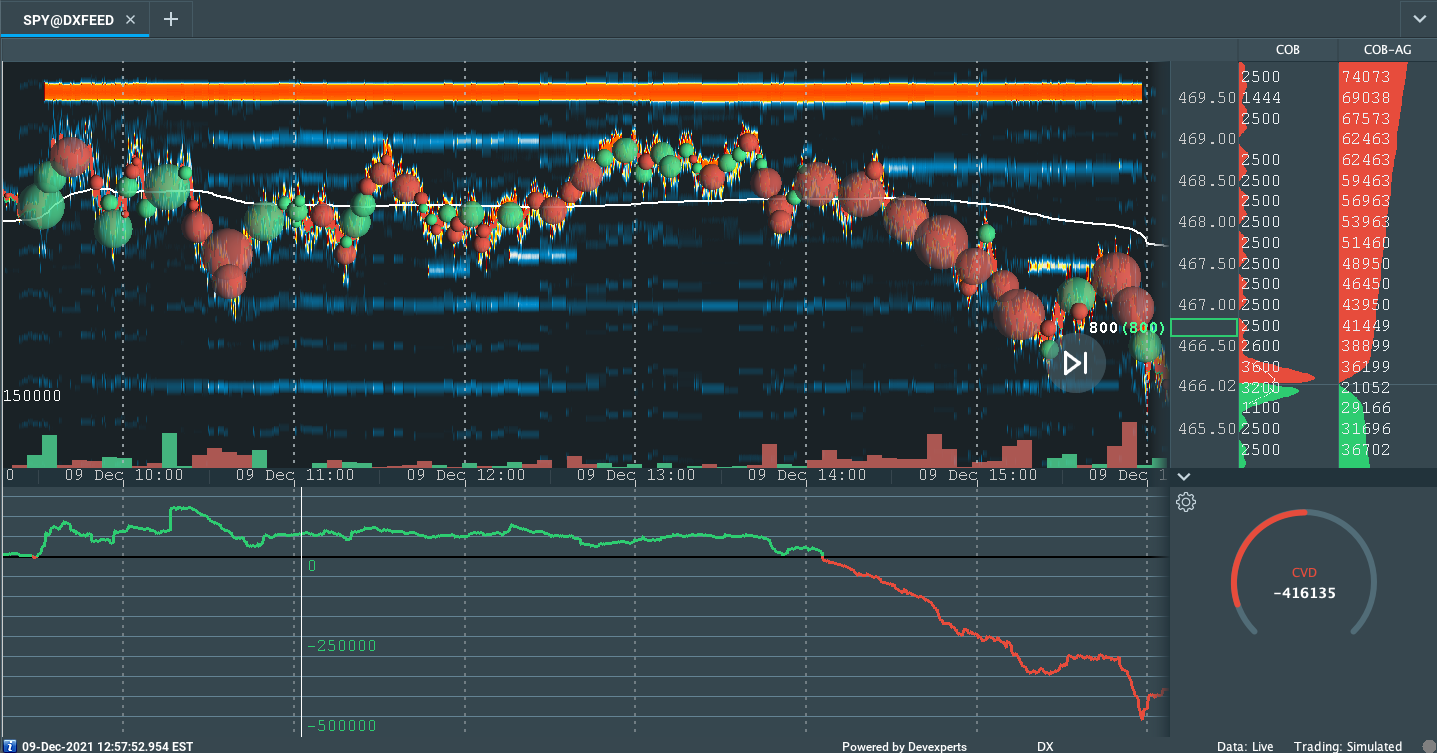
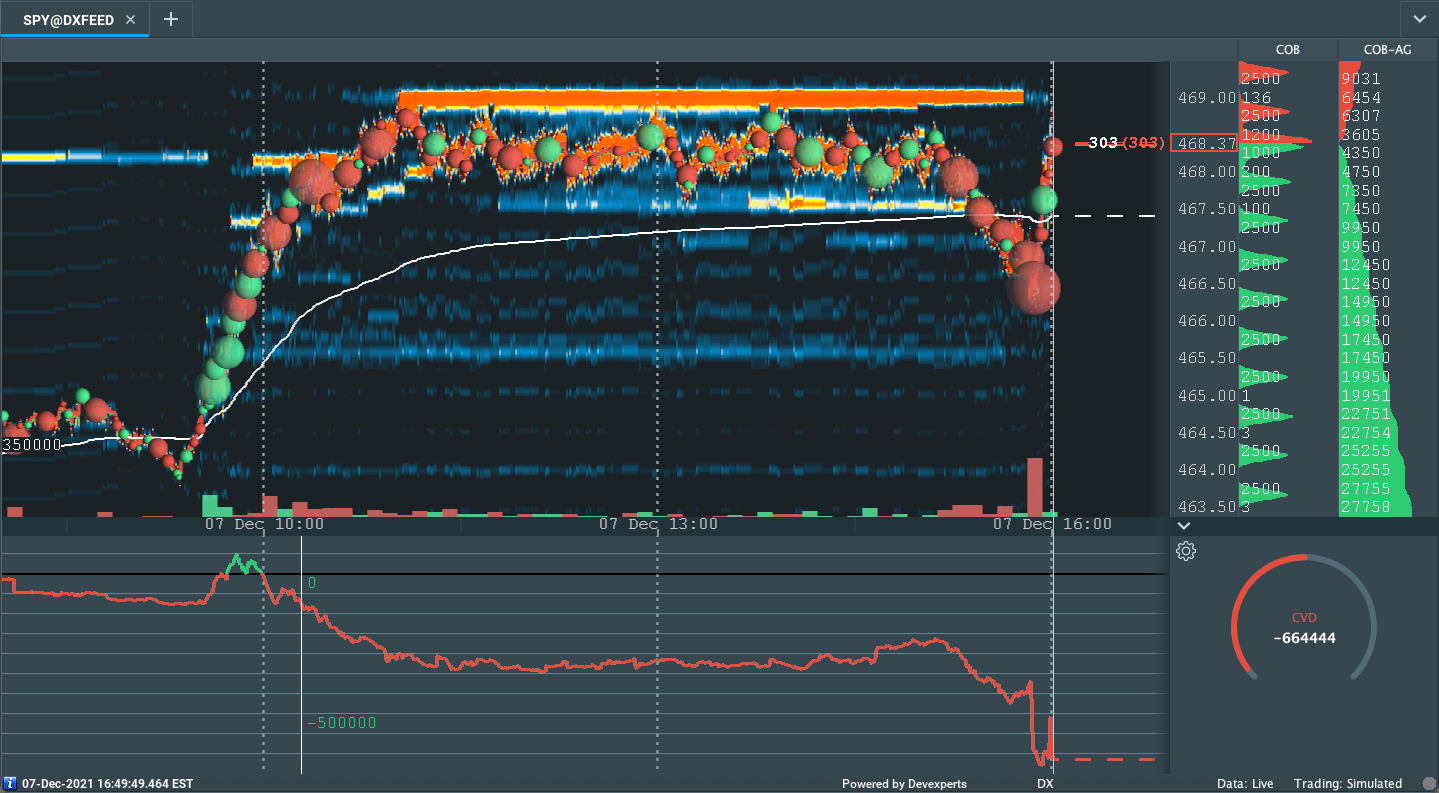
Looking at intraday measures, yesterday, we see that participants’ commitment to a change in direction remains low, still.

Graphic: SpotGamma’s Hedging Impact of Real-Time Options trade. The rising blue line denotes put selling (a positive delta impact). The falling orange line denotes call selling (a negative delta impact).

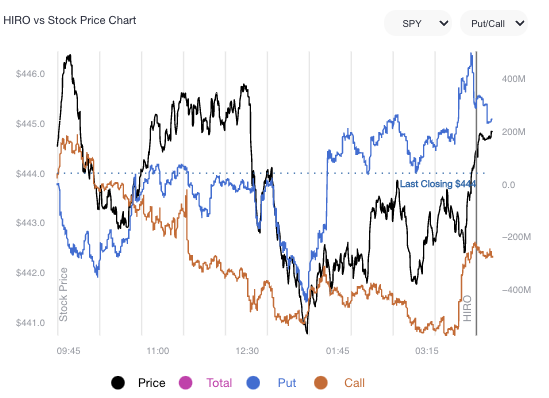
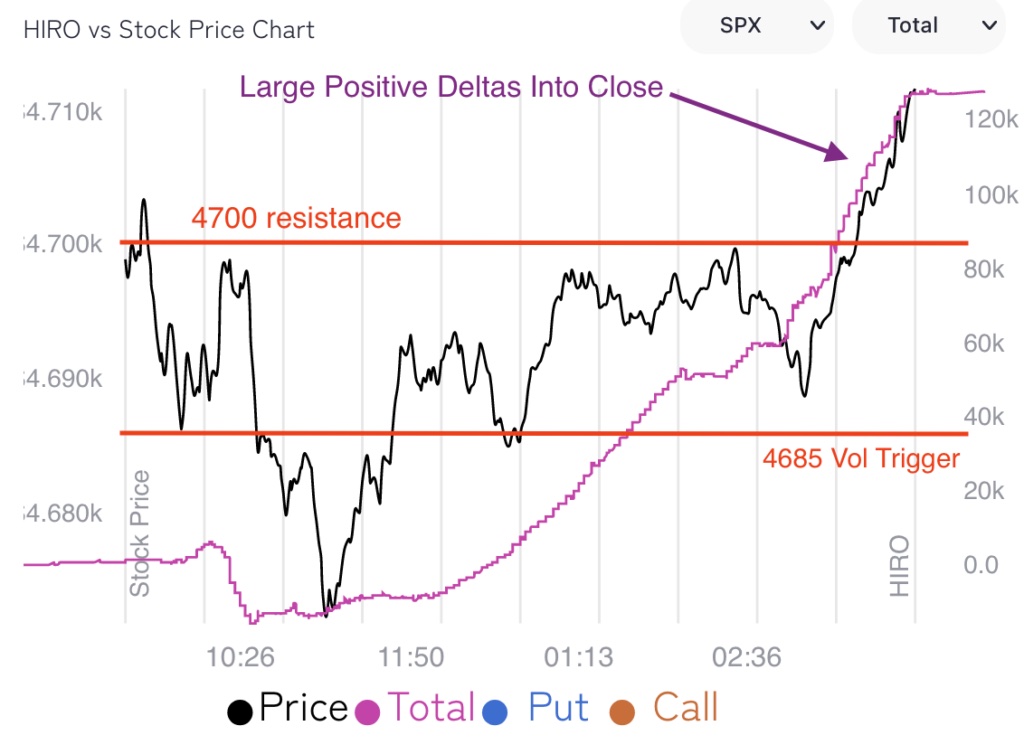
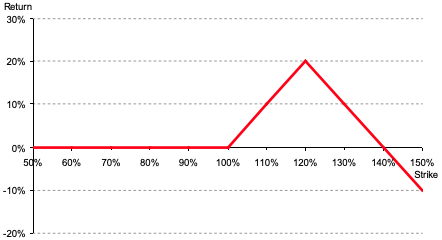
It’s possible that the bottoming process has yet to conclude. Instead, a build of positive options gamma (via the supply of protection – call selling – and more active hedging of call options near the money) may give the market some support.

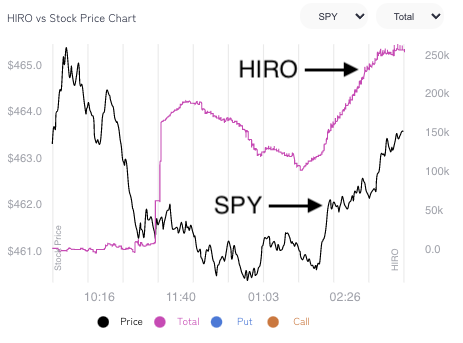
To explain, in accordance with the HIRO graphic above, we surmise counterparties are long calls and therefore tend toward selling into strength (buying into weakness) amid increasing (decreasing) positive delta exposure.

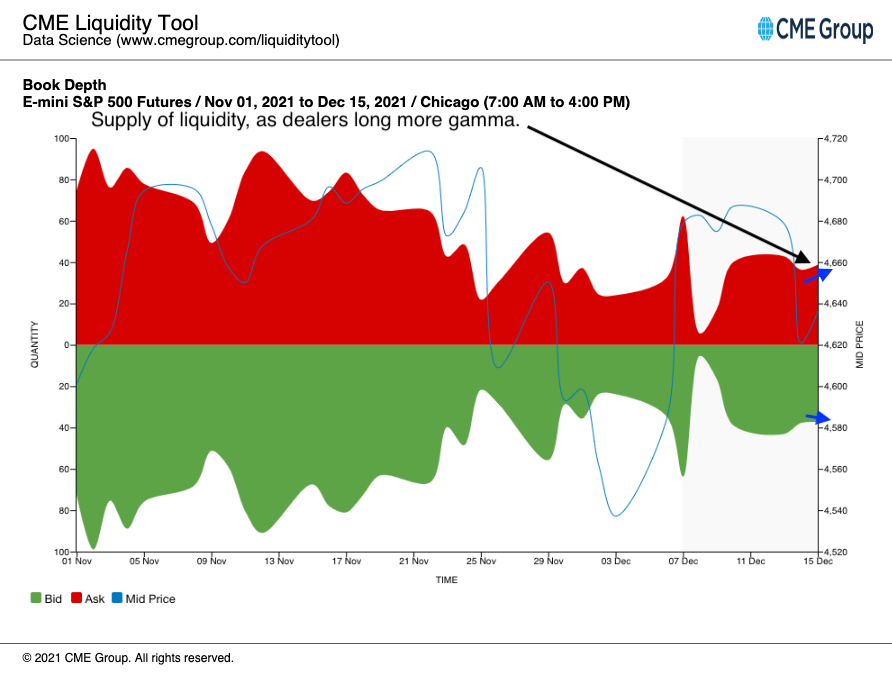
As short-dated activity clusters in the area just north of the most recent price rise, and this protection decays, dealer exposure to positive delta (gamma) falls (rises).”

“Taken together, dealers add to the market liquidity. When there is rising liquidity, volatility (a measure of how ample liquidity is) falls,” SpotGamma adds. 

“Was the SPX to liquidate, again, demand for protection and increases in volatility likely have us targeting options-based support.”

Graphic: Via SpotGamma. Key levels of interest.

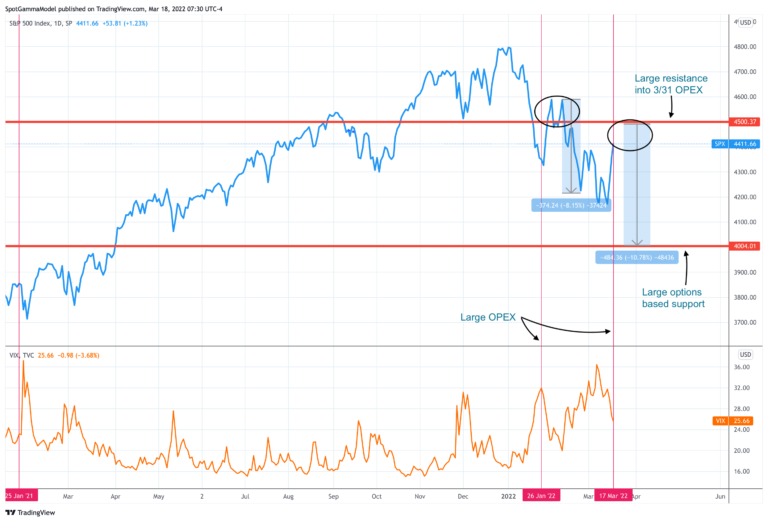
In other words, based on the information we have at the moment, the market is prone to sharp drops lower, and the rally is questionable. Caution.

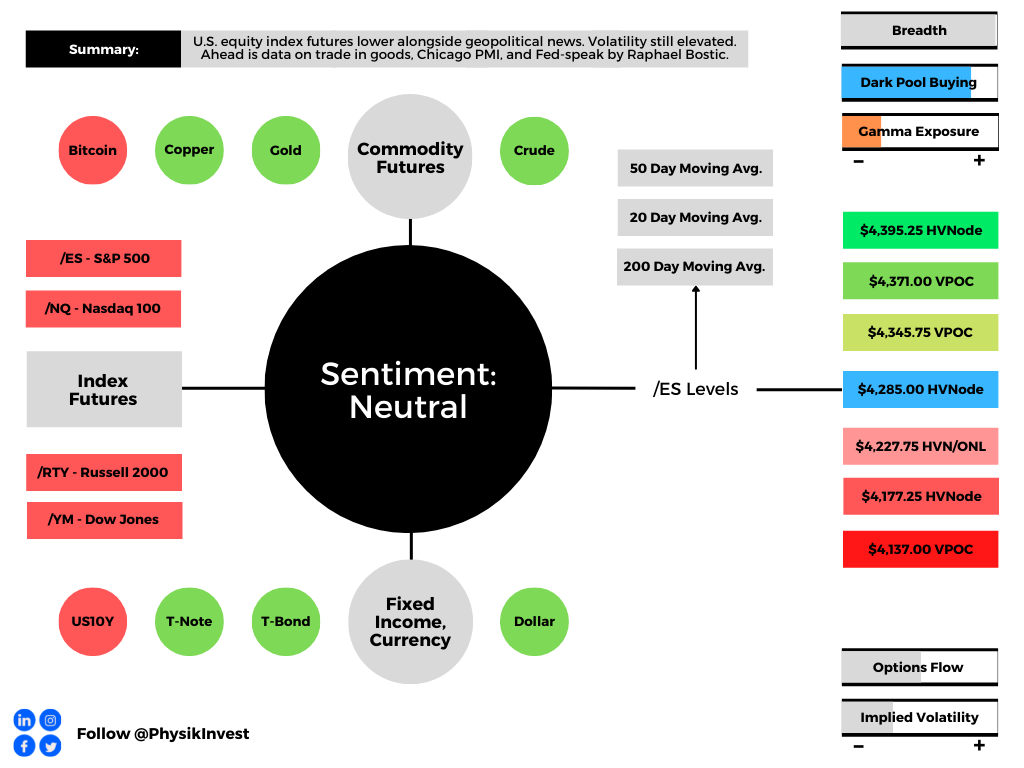
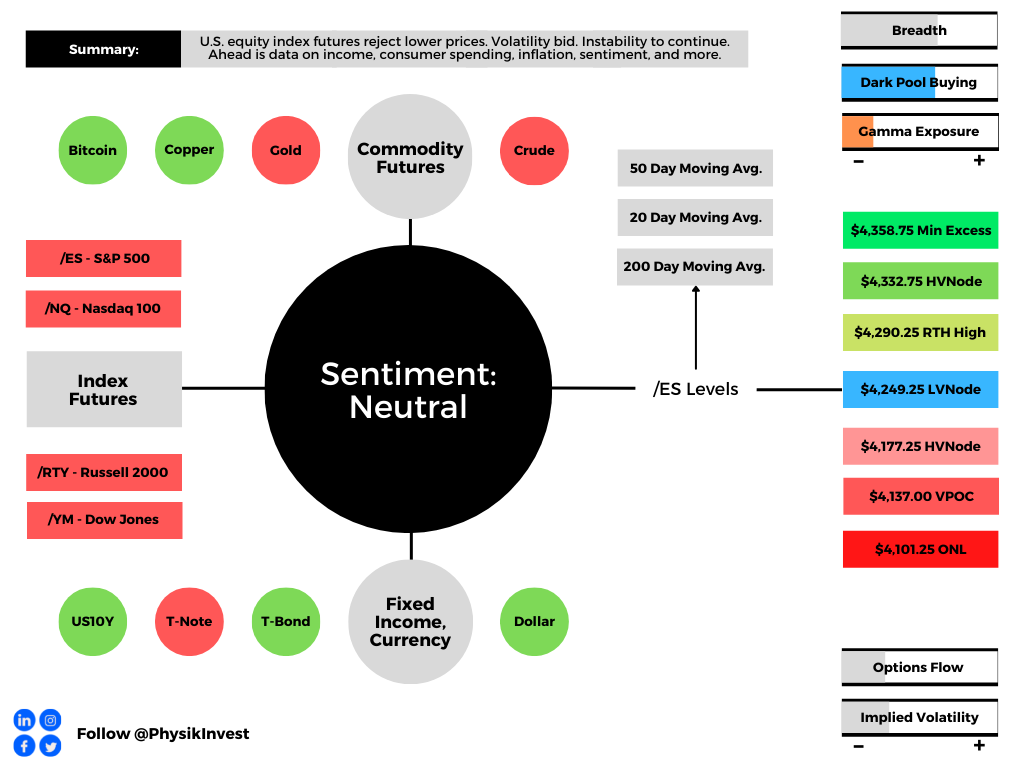
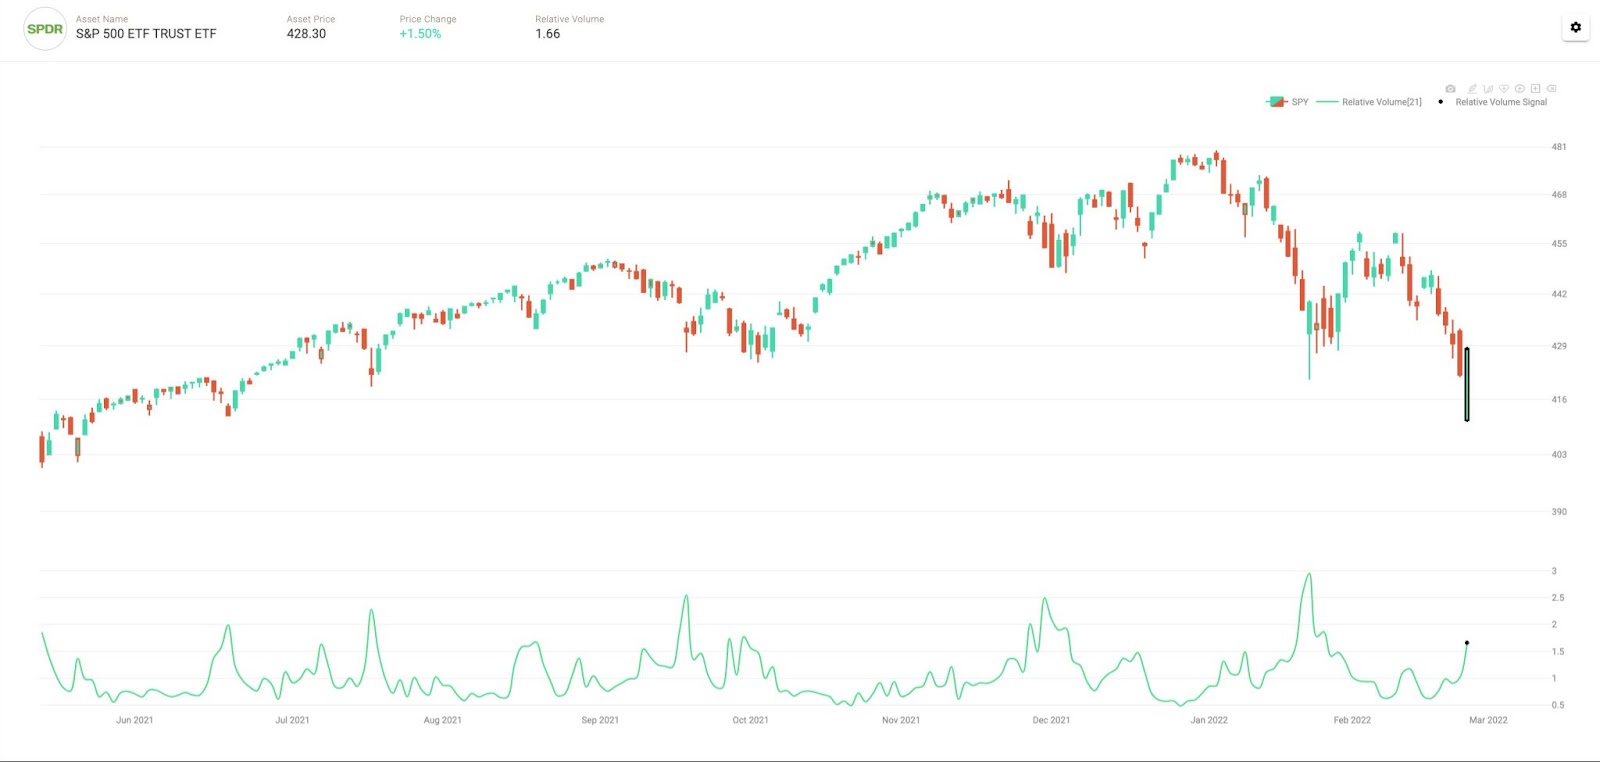
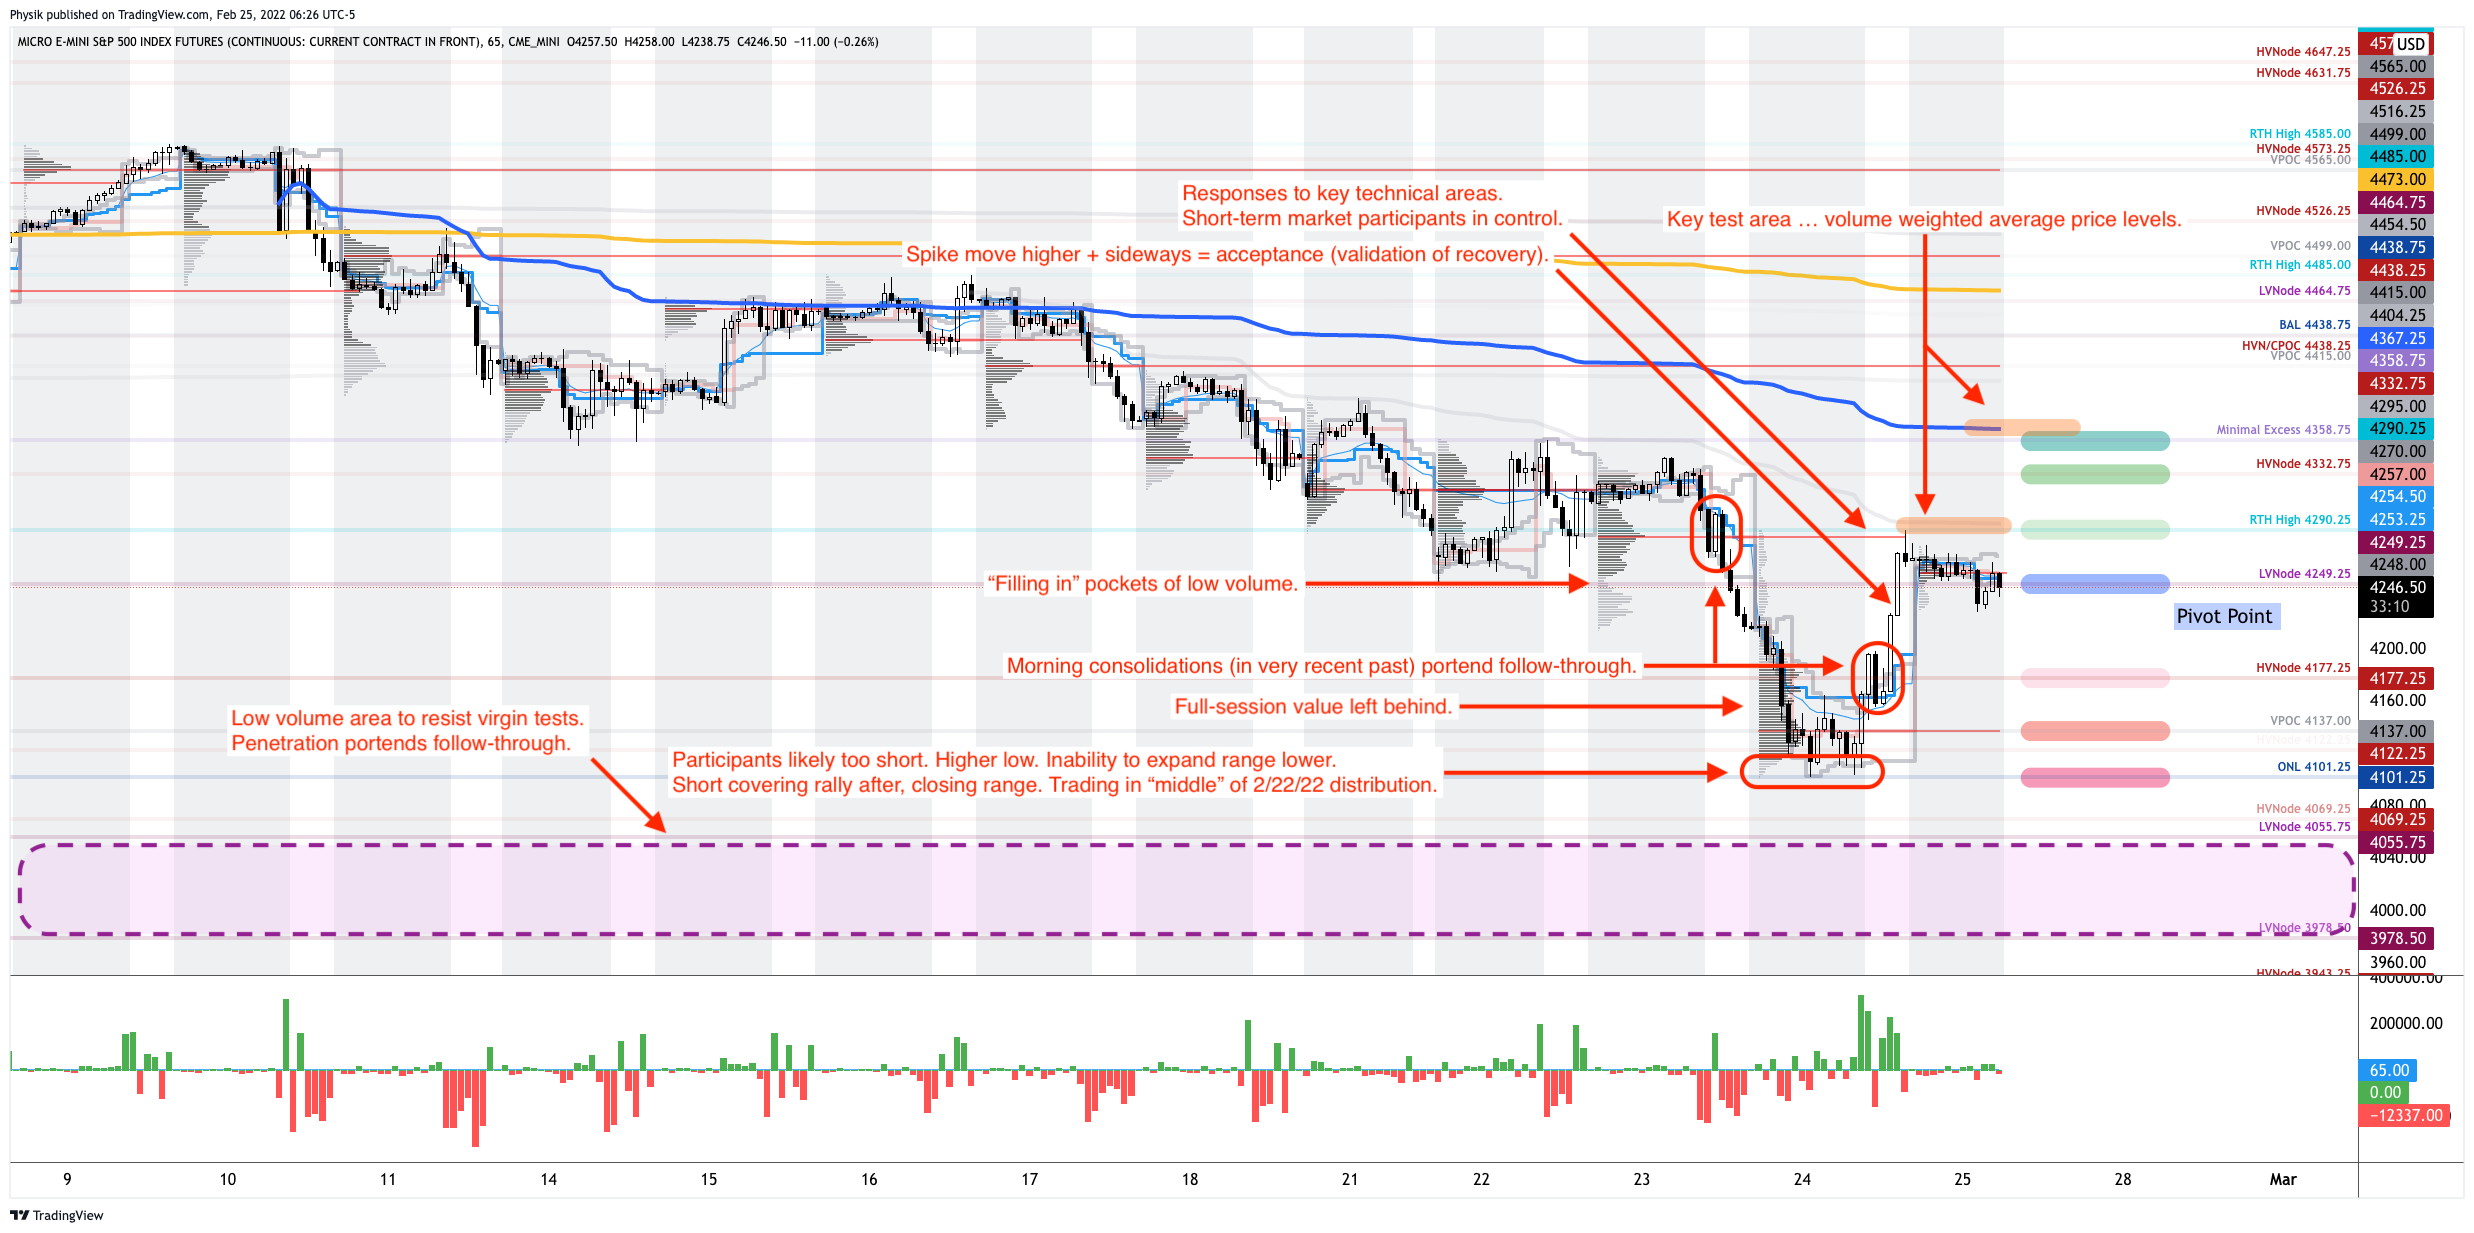
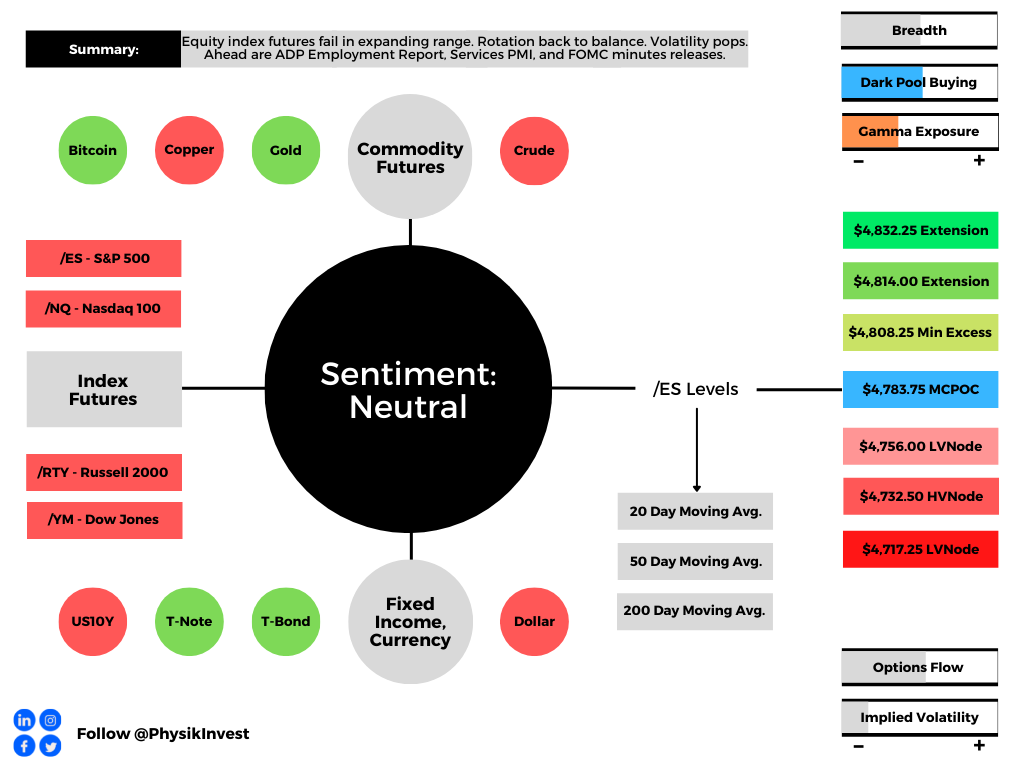
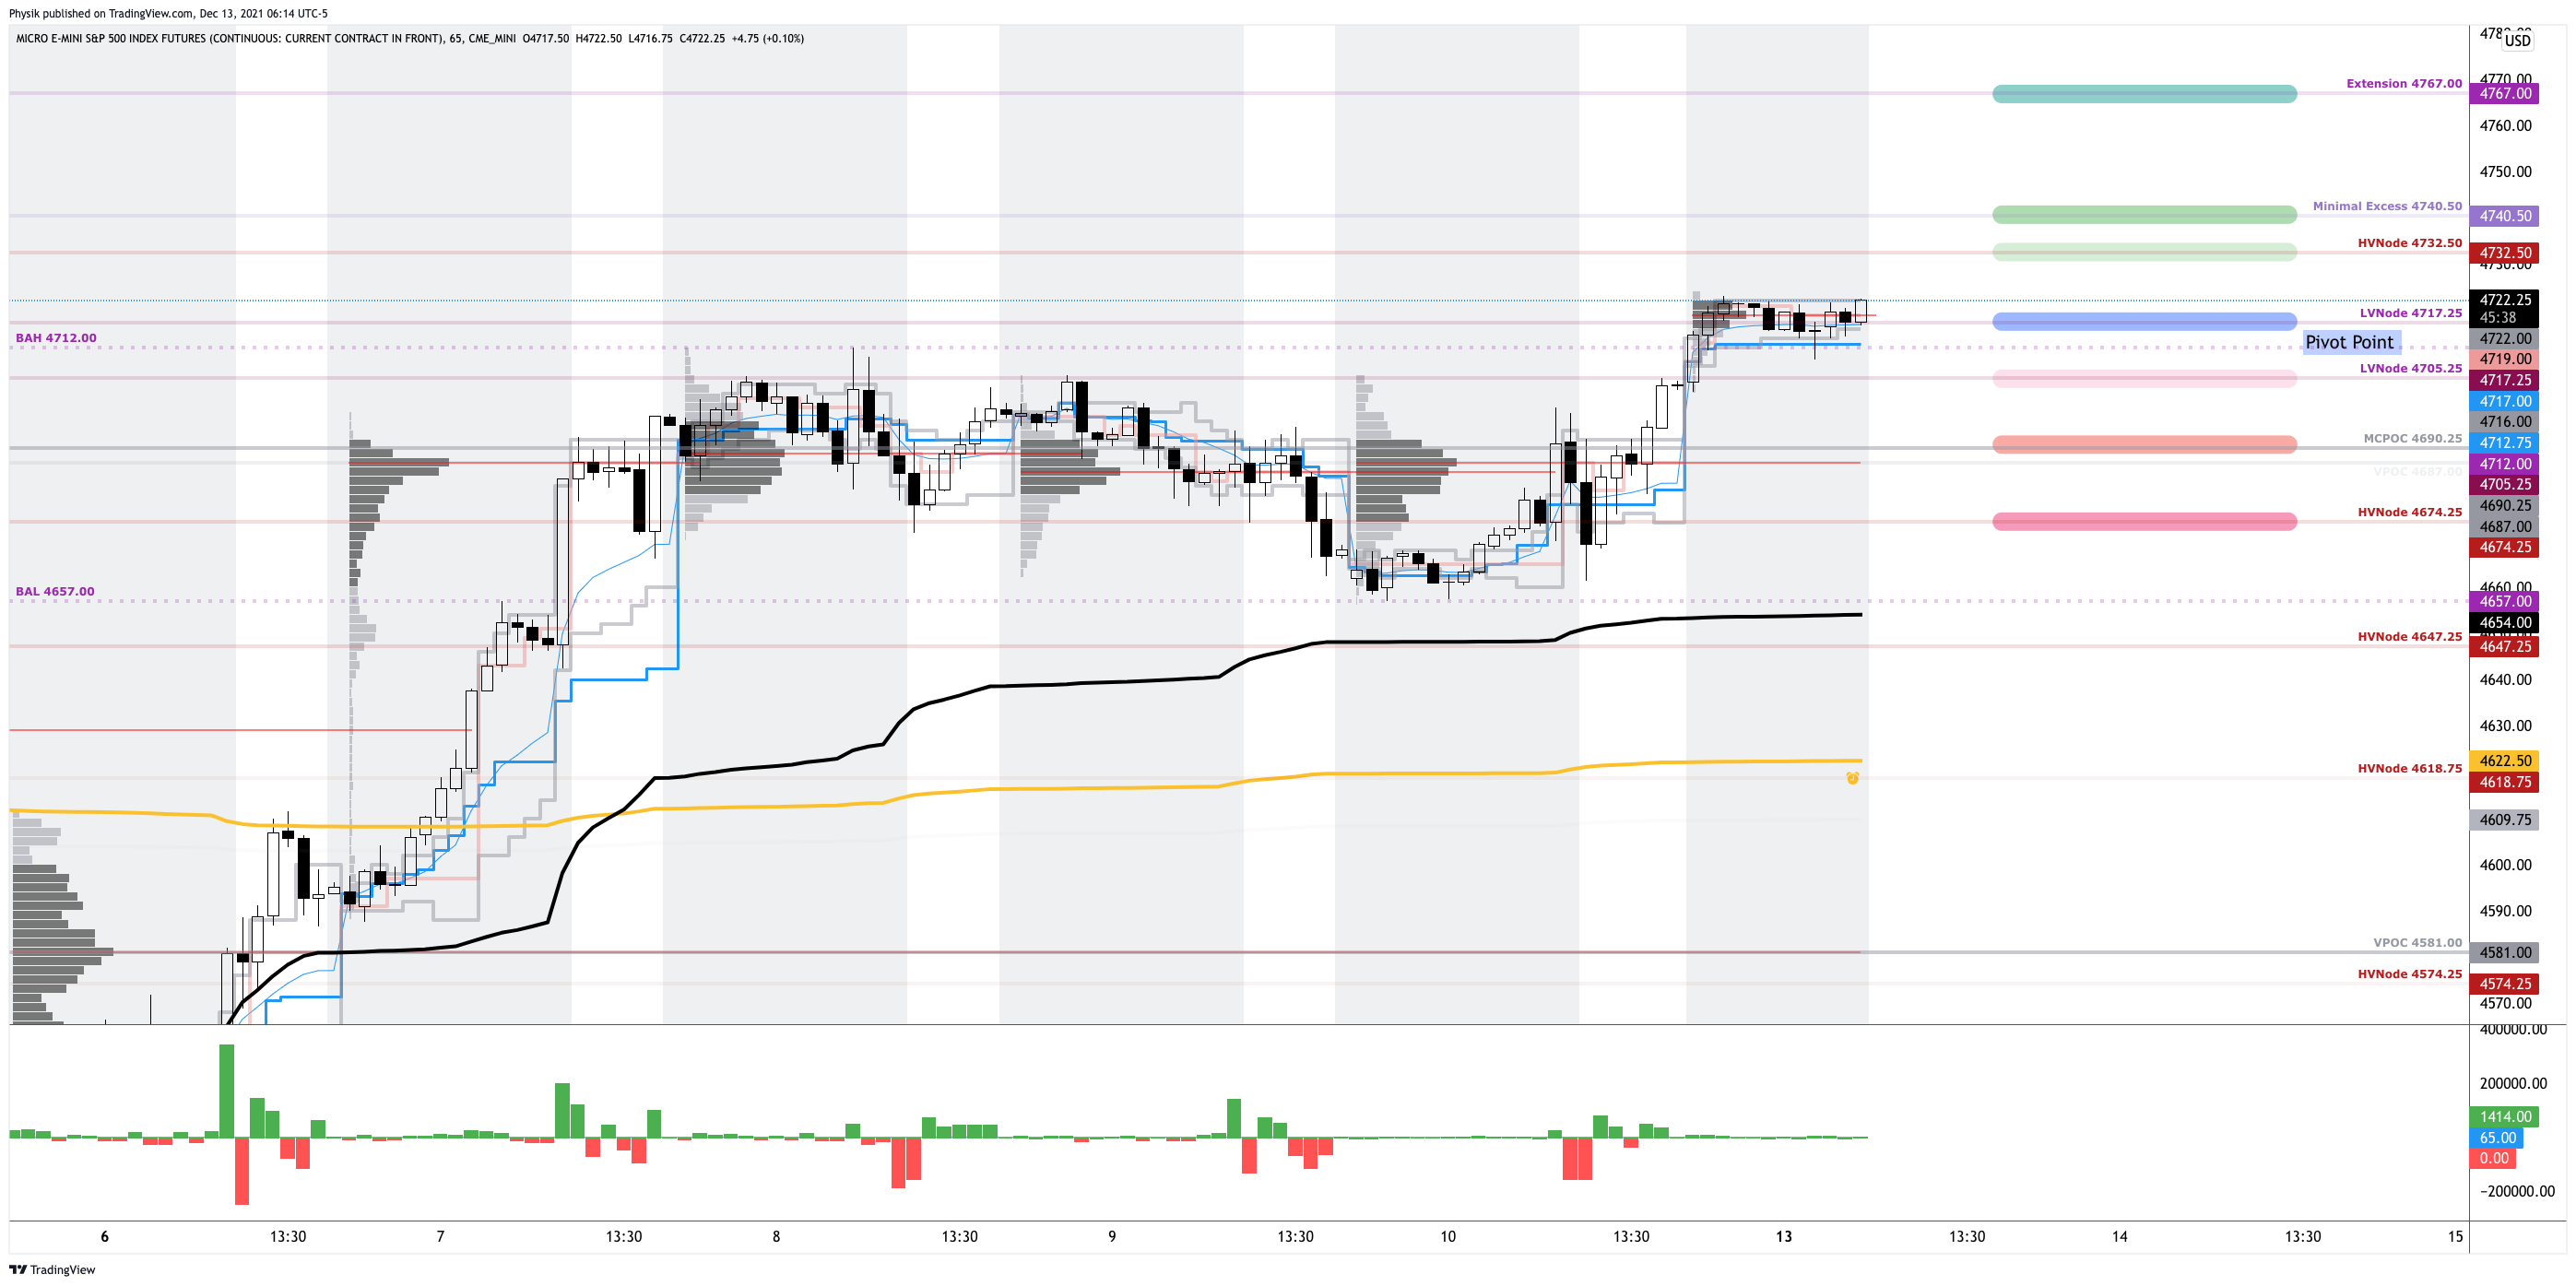
Technical: As of 6:30 AM ET, Tuesday’s regular session (9:30 AM – 4:00 PM ET), in the S&P 500, will likely open in the upper part of a positively skewed overnight inventory, inside of prior-range and -value, suggesting a limited potential for immediate directional opportunity.

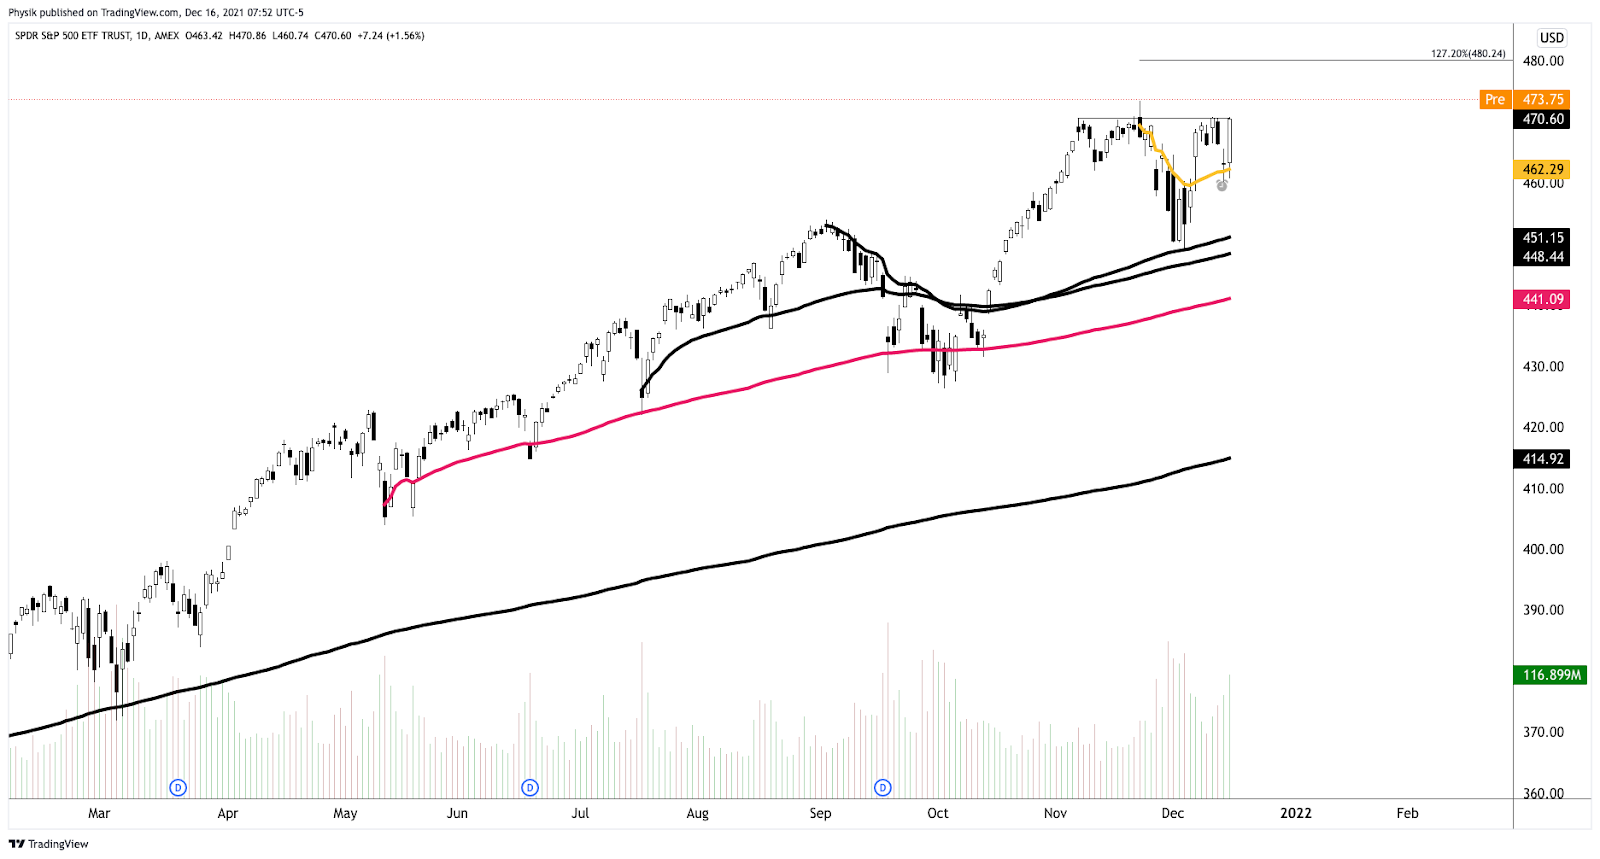
In the best case, the S&P 500 trades higher; activity above the $4,464.75 low volume area (LVNode) puts in play the $4,499.00 untested point of control (VPOC). Initiative trade beyond the VPOC could reach as high as the $4,526.25 high volume area (HVNode) and $4,565.00 VPOC, or higher.

In the worst case, the S&P 500 trades lower; activity below the $4,464.75 LVNode puts in play the $4,438.25 HVNode. Initiative trade beyond the HVNode could reach as low as the $4,409.00 and $4,355.00 VPOC, or lower.

Considerations: Push-and-pull, as well as responsiveness near key-technical areas (that are discernable visually on a chart), suggests technically-driven traders with short time horizons are very active. 

Such traders often lack the wherewithal to defend retests and, additionally, the type of trade may be indicative of the other time frame participants waiting for more information to initiate trades.

Click here to load today’s key levels into the web-based TradingView charting platform. Note that all levels are derived using the 65-minute timeframe. New links are produced, daily.
Graphic: 65-minute profile chart of the Micro E-mini S&P 500 Futures.

Definitions

Cave-Fill Process: Widened the area deemed favorable to transact at by an increased share of participants. This is a good development.

Volume Areas: A structurally sound market will build on areas of high volume (HVNodes). Should the market trend for long periods of time, it will lack sound structure, identified as low volume areas (LVNodes). LVNodes denote directional conviction and ought to offer support on any test. 

If participants were to auction and find acceptance into areas of prior low volume (LVNodes), then future discovery ought to be volatile and quick as participants look to HVNodes for favorable entry or exit.

Liquidation Breaks: The profile shape suggests participants were “too” long and had poor location.

POCs: POCs are valuable as they denote areas where two-sided trade was most prevalent in a prior day session. Participants will respond to future tests of value as they offer favorable entry and exit.

Excess: A proper end to price discovery; the market travels too far while advertising prices. Responsive, other-timeframe (OTF) participants aggressively enter the market, leaving tails or gaps which denote unfair prices.

About

After years of self-education, strategy development, mentorship, and trial-and-error, Renato Leonard Capelj began trading full-time and founded Physik Invest to detail his methods, research, and performance in the markets.

Capelj also develops insights around impactful options market dynamics at SpotGamma and is a Benzinga reporter.

Some of his works include conversations with ARK Invest’s Catherine Wood, investors Kevin O’Leary and John Chambers, FTX’s Sam Bankman-Fried, Kai Volatility’s Cem Karsan, The Ambrus Group’s Kris Sidial, among many others.

Disclaimer

In no way should the materials herein be construed as advice. Derivatives carry a substantial risk of loss. All content is for informational purposes only.

Categories
Commentary

Daily Brief For February 28, 2022

Editor’s Note: The Daily Brief is a free glimpse into the prevailing fundamental and technical drivers of U.S. equity market products. Join the 200+ that read this report daily, below!

What Happened

Overnight, equity index futures auctioned lower in light of an escalation of geopolitical tensions between Russia, Ukraine, and the rest of the world.

Western powers imposed harsh sanctions including the exclusion of some Russian lenders from the SWIFT messaging system “that underpins trillions of dollars worth of transactions,” globally.

As the Russian ruble lost ⅓ of its value and costs of insuring Russian government debt rose, the Bank of Russia (BoR) doubled its key interest rate to 20% and imposed some capital controls to take from the risk of a potential run on banks. Policymakers also banned foreign security sales.

The odds of an aggressive lift-off in interest rates by the Federal Reserve declined, accordingly. The market is now pricing in under six hikes for 2022 as crisis opens room for policy mistakes.

Ahead is data on trade in goods (8:30 AM ET), Chicago PMI (9:45 AM ET), and Fed-speak by Atlanta Fed President Raphael Bostic (10:30 AM ET).

Graphic updated 6:30 AM ET. Sentiment Neutral if expected /ES open is inside of the prior day’s range. /ES levels are derived from the profile graphic at the bottom of the following section. Levels may have changed since initially quoted; click here for the latest levels. SqueezeMetrics Dark Pool Index (DIX) and Gamma (GEX) calculations are based on where the prior day’s reading falls with respect to the MAX and MIN of all occurrences available. A higher DIX is bullish. At the same time, the lower the GEX, the more (expected) volatility. Learn the implications of volatility, direction, and moneyness. SHIFT data used for S&P 500 (INDEX: SPX) options activity. Note that options flow is sorted by the call premium spent; if more positive, then more was spent on call options. Breadth reflects a reading of the prior day’s NYSE Advance/Decline indicator. VIX reflects a current reading of the CBOE Volatility Index (INDEX: VIX) from 0-100.

What To Expect

Fundamental: As of February 27, 2022, there are reports that with its invasion of Ukraine, “Moscow was frustrated by the slow progress caused by an unexpectedly strong Ukrainian defense and failure to achieve complete air dominance.”

Graphic: Via Bloomberg, locations of Russian controls and attacks.

At present, Russia has only committed 50% of its available firepower to the war and solicited the involvement of neighboring allies. Still, even at 50%, it’s rough.

Russian markets, to put it simply, are in turmoil as a result of this conflict. Its policymakers, to stem the bleed, have banned foreigners from selling assets.

Graphic: Via Topdown Charts, Russian assets are imploding.

Accordingly, sentiment is as bad as it was in 2020, 2016, the period spanning 2008-2009, as well as the period just after the topping of the tech-and-telecom bubble. 

Graphic: Via Topdown Charts, “sentiment basically as bad as the COVID crash.”

In light of the world’s response to this conflict, Russia, too, has heightened its nuclear readiness.

Moreover, over the weekend, Credit Suisse Group AG’s (NYSE: CS) Zoltan Pozsar, in gauging the implications of conflict and sanctions, explained that excluding Russia from SWIFT may lead to missed payments and overdrafts similar to that experienced during March of 2020.

“Banks’ inability to make payments due to their exclusion from SWIFT is the same as Lehman’s inability to make payments due to its clearing bank’s unwillingness to send payments on its behalf,” he noted.

“The consequence of excluding banks from SWIFT is real, and so is the need for central banks to re-activate daily U.S. dollar funds supplying operations.”

In light of this, some have advanced a narrative around a potential run on Russian banks.

However, former BoR official Sergey Aleksashenko, in an alarmed yet less pessimistic take on CNBC, suggested a “low likelihood” of a run on the ruble.

Further, in light of the deceleration at home in the U.S., Pozsar concludes that “the Fed’s balance sheet might expand again before it contracts via QT (quantitative tightening).”

Graphic: Alfonso Peccatiello of The Macro Compass. He says “YTD: 2022 hikes priced in up from 3 to 6-7. Curves big-time flatter. Inflation expectations 10 bps lower. Real yields higher 40-50 bps. Credit spreads wider. Cyclical growth impulse fading away. Not a risk-on environment.”

Interactive Brokers Group Inc’s (NASDAQ: IBKR) Chief Strategist Steve Sosnick adds: “The tide of money is still positive, and it should provide a cushion for nervous markets as long as that remains the case. But when we consider that monetary conditions are supposed to be changing, volatility should persist if the monetary tide actually ebbs as expected.”

Perspectives: “​​Geopolitical catastrophes tend to be worse than believed in the short term but less than believed in the long term,” Ophir Gottlieb of Capital Market Laboratories notes

Similarly, JPMorgan Chase & Co’s (NYSE: JPM) head of global equity strategy Mislav Matejka says that “If one is selling on the back of the latest geopolitical developments now, the risk is of getting whipsawed.”

“Historically, [the] vast majority of military conflicts, especially if localized, did not tend to hurt investor confidence for too long, and would end up as buying opportunities.”

Graphic: Via Tier1Alpha. Taken from The Market Ear

Positioning: Strong passive buying support persists in the face of a lower liquidity, negative-gamma, high-volatility regime.

Graphic: Via Bloomberg. Taken from The Market Ear.

Adding, in light of the liquidation into last Thursday’s open (after which there was a large reversal), the VIX futures term structure, though in backwardation, was not as steep as in past moments of true panic.

IBKR’s Sosnick explains that “Even though VIX futures [were higher on Thursday morning] across the board and the curve has further steepened, neither the spot level nor the curve are yet demonstrating panic.” 

“I interpret the message of the market to be that we should continue to expect volatility – remember that volatility encompasses moves in both directions – but not to expect that a major bottom was put into place in recent sessions.”

With realized volatility is heightened and implied volatility not performing, so to speak, @darjohn25 explains, try to avoid “any short gamma on all short-dated tenors—you want to own the short term stuff for the foreseeable future.”

Technical: As of 6:30 AM ET, Monday’s regular session (9:30 AM – 4:00 PM ET), in the S&P 500, will likely open in the middle part of a negatively skewed overnight inventory, inside of prior-range and -value, suggesting a limited potential for immediate directional opportunity.

Gap Scenarios Potentially In Play: Gaps ought to fill quickly. Should they not, that’s a signal of strength; do not fade. Leaving value behind on a gap-fill or failing to fill a gap (i.e., remaining outside of the prior session’s range) is a go-with indicator.

Auctioning and spending at least 1-hour of trade back in the prior range suggests a lack of conviction; in such a case, do not follow the direction of the most recent initiative activity.

In the best case, the S&P 500 trades higher; activity above the $4,285.50 high volume area (HVNode) puts in play the $4,345.75 untested point of control (VPOC). Initiative trade beyond the VPOC could reach as high as the $4,371.00 VPOC and $4,395.25 HVNode, or higher.

In the worst case, the S&P 500 trades lower; activity below the $4,285.50 HVNode puts in play the $4,227.75 HVNode and overnight low (ONL) area. Initiative trade beyond the HVNode/ONL could reach as low as the $4,177.25 HVNode and $4,137.00 VPOC, or lower.

Click here to load today’s key levels into the web-based TradingView charting platform. Note that all levels are derived using the 65-minute timeframe. New links are produced, daily.
Graphic: 65-minute profile chart of the Micro E-mini S&P 500 Futures.

What People Are Saying

Definitions

Overnight Rally Highs (Lows): Typically, there is a low historical probability associated with overnight rally-highs (lows) ending the upside (downside) discovery process.

Volume Areas: A structurally sound market will build on areas of high volume (HVNodes). Should the market trend for long periods of time, it will lack sound structure, identified as low volume areas (LVNodes). LVNodes denote directional conviction and ought to offer support on any test. 

If participants were to auction and find acceptance into areas of prior low volume (LVNodes), then future discovery ought to be volatile and quick as participants look to HVNodes for favorable entry or exit.

POCs: POCs are valuable as they denote areas where two-sided trade was most prevalent in a prior day session. Participants will respond to future tests of value as they offer favorable entry and exit.

Excess: A proper end to price discovery; the market travels too far while advertising prices. Responsive, other-timeframe (OTF) participants aggressively enter the market, leaving tails or gaps which denote unfair prices.

Volume-Weighted Average Prices (VWAPs): A metric highly regarded by chief investment officers, among other participants, for quality of trade. Additionally, liquidity algorithms are benchmarked and programmed to buy and sell around VWAPs.

About

After years of self-education, strategy development, mentorship, and trial-and-error, Renato Leonard Capelj began trading full-time and founded Physik Invest to detail his methods, research, and performance in the markets.

Capelj is also a Benzinga finance and technology reporter interviewing the likes of Shark Tank’s Kevin O’Leary, JC2 Ventures’ John Chambers, FTX’s Sam Bankman-Fried, and ARK Invest’s Catherine Wood, as well as a SpotGamma contributor developing insights around impactful options market dynamics.

Disclaimer

Physik Invest does not carry the right to provide advice.

In no way should the materials herein be construed as advice. Derivatives carry a substantial risk of loss. All content is for informational purposes only.

Categories
Commentary

Daily Brief For February 25, 2022

Editor’s Note: The Daily Brief is a free glimpse into the prevailing fundamental and technical drivers of U.S. equity market products. Join the 200+ that read this report daily, below!

What Happened

Overnight, equity index futures auctioned sideways, providing some more validation to Thursday morning’s reversal fueled by aggressive short-covering.

Geopolitical tensions and monetary tightening are the two major narratives news outlets are assigning to the volatility. 

The U.S. and its allies applied more sanctions on Russia for its invasion of Ukraine and markets are still pricing around six quarter-point rate hikes by the Fed.

Ahead is data on personal income, consumer spending PCE inflation, core inflation, disposable income, durable goods orders, and core capital equipment orders (8:30 AM ET), University of Michigan sentiment, inflation expectations, and pending home sales (10:00 AM ET).

Graphic updated 6:35 AM ET. Sentiment Neutral if expected /ES open is inside of the prior day’s range. /ES levels are derived from the profile graphic at the bottom of the following section. Levels may have changed since initially quoted; click here for the latest levels. SqueezeMetrics Dark Pool Index (DIX) and Gamma (GEX) calculations are based on where the prior day’s reading falls with respect to the MAX and MIN of all occurrences available. A higher DIX is bullish. At the same time, the lower the GEX, the more (expected) volatility. Learn the implications of volatility, direction, and moneyness. SHIFT data used for S&P 500 (INDEX: SPX) options activity. Note that options flow is sorted by the call premium spent; if more positive, then more was spent on call options. Breadth reflects a reading of the prior day’s NYSE Advance/Decline indicator. VIX reflects a current reading of the CBOE Volatility Index (INDEX: VIX) from 0-100.

What To Expect

Fundamental: Must keep it short, today.

Per JPMorgan Chase & Co’s (NYSE: JPM) Marko Kolanovic, “While Equities are down year-to-date due to rising rates, we note that historically the initial volatility around rate liftoff didn’t last and equities made new all-time highs 2-4 quarters out.”

“The start of policy tightening is usually a confirmation that the cycle has legs, rather than the signal of its end. As we don’t see the yield curve inverting or real yields reaching problematic levels this year, it is premature to talk about end-of-cycle worries.”

Graphic: Via Haver. Retrieved from The Market Ear. Macro conditions are more supportive than during the Global Financial Crisis.

Pursuant to Kolanovic’s remarks, Andreas Steno Larsen of Heimstaden explains that bond yields remain governed by demographics, and this is good news for tech.

“I still think that inflation and bond markets will be governed by other structural trends over the medium term,” he said. “Just look at the growth rate of the working-age population (10 years forward) versus the term premium of US Treasury bonds. The current bond bear market is not standing on structural pillars.”

Graphic: Via Andreas Steno Larsen, “Bond yields remain governed by demographics over the medium-term. Low(er) for longer.”

Positioning: Based on a variety of metrics, some of which were pointed to in yesterday’s commentary, there were no clear signs of capitulation

For instance, one of the largest ETF products that track the Nasdaq 100 (QQQ) “has seen persistently illiquidity (daily range / $ volume). There was not much volume (participation) behind the move in price. The 1-week return distribution gets pretty wild.”

Graphic: Via @HalftersPower.

Similarly, “1 Month relative volume (today’s volume / 1-month average) on SPY today (1.66) doesn’t have a capitulatory look to it. Bottoms in the past year occurred at 2+.”

Graphic: Via @HalfersPower.

There was, however, a massive covering of short (negative delta) exposures. The gap lower presented participants a “gift” and many took it as an opportunity to monetize downside bets.

Despite metrics pointing to continued accumulation, and buying support, equity products are in negative gamma wherein the hedging of put-heavy exposures results in whip-saw action (i.e., options counterparties hedge in a manner that exacerbates moves to upside and downside).

Technical: As of 6:30 AM ET, Friday’s regular session (9:30 AM – 4:00 PM ET), in the S&P 500, will likely open in the upper part of a balanced skewed overnight inventory, inside of prior-range and -value, suggesting a limited potential for immediate directional opportunity.

In the best case, the S&P 500 trades higher; activity above the $4,249.25 low volume area (LVNode) puts in play the $4,290.25 regular trade high (RTH High). Initiative trade beyond the RTH High could reach as high as the $4,332.75 high volume area (HVNode) and $4,358.75 minimal excess high, or higher.

In the worst case, the S&P 500 trades lower; activity below the $4,249.25 LVNode puts in play the $4,177.25 HVNode. Initiative trade beyond the HVNode could reach as low as the $4,137.00 untested point of control (VPOC) and $4,101.25 overnight low (ONL), or lower.

Click here to load today’s key levels into the web-based TradingView charting platform. Note that all levels are derived using the 65-minute timeframe. New links are produced, daily.
Graphic: 65-minute profile chart of the Micro E-mini S&P 500 Futures.

Definitions

Overnight Rally Highs (Lows): Typically, there is a low historical probability associated with overnight rally-highs (lows) ending the upside (downside) discovery process.

Volume Areas: A structurally sound market will build on areas of high volume (HVNodes). Should the market trend for long periods of time, it will lack sound structure, identified as low volume areas (LVNodes). LVNodes denote directional conviction and ought to offer support on any test. 

If participants were to auction and find acceptance into areas of prior low volume (LVNodes), then future discovery ought to be volatile and quick as participants look to HVNodes for favorable entry or exit.

POCs: POCs are valuable as they denote areas where two-sided trade was most prevalent in a prior day session. Participants will respond to future tests of value as they offer favorable entry and exit.

Excess: A proper end to price discovery; the market travels too far while advertising prices. Responsive, other-timeframe (OTF) participants aggressively enter the market, leaving tails or gaps which denote unfair prices.

About

After years of self-education, strategy development, mentorship, and trial-and-error, Renato Leonard Capelj began trading full-time and founded Physik Invest to detail his methods, research, and performance in the markets.

Capelj is also a Benzinga finance and technology reporter interviewing the likes of Shark Tank’s Kevin O’Leary, JC2 Ventures’ John Chambers, FTX’s Sam Bankman-Fried, and ARK Invest’s Catherine Wood, as well as a SpotGamma contributor developing insights around impactful options market dynamics.

Disclaimer

Physik Invest does not carry the right to provide advice.

In no way should the materials herein be construed as advice. Derivatives carry a substantial risk of loss. All content is for informational purposes only.

Categories
Commentary

Daily Brief For January 5, 2022

The Daily Brief is a free glimpse into the prevailing fundamental and technical drivers of U.S. equity market products. Join the 200+ that read this report daily, below!

What Happened

Overnight, equity indices auctioned sideways to lower after a failed balance-area breakout resulted in a rotation back toward the most accepted (or traded at) price levels over two weeks.

Ahead is data on ADP National Employment Report (8:15 AM ET), Markit Services PMI (9:45 AM ET), and FOMC minutes (2:00 PM ET).

Graphic updated 6:30 AM ET. Sentiment Neutral if expected /ES open is inside of the prior day’s range. /ES levels are derived from the profile graphic at the bottom of the following section. Levels may have changed since initially quoted; click here for the latest levels. SqueezeMetrics Dark Pool Index (DIX) and Gamma (GEX) calculations are based on where the prior day’s reading falls with respect to the MAX and MIN of all occurrences available. A higher DIX is bullish. At the same time, the lower the GEX, the more (expected) volatility. Learn the implications of volatility, direction, and moneyness. SHIFT data used for S&P 500 (INDEX: SPX) options activity. Note that options flow is sorted by the call premium spent; if more positive, then more was spent on call options. Breadth reflects a reading of the prior day’s NYSE Advance/Decline indicator. VIX reflects a current reading of the CBOE Volatility Index (INDEX: VIX) from 0-100.

What To Expect

Fundamental: Today, participants ought to get further clarity around the timing of the Federal Reserve’s first interest-rate hike and its taper to the pace of asset buying.

The central bank doubled the pace of tapering in mid-December, setting the stage for rate hikes, later in 2022.

According to Bloomberg, expected are three quarter-percentage-point increases in the key federal funds rate target in 2022. 

Graphic: The “annual rate of change in the Fed Funds rate” via topdowncharts.com.

This expectation has coincided with a move higher in Treasury yields and weakness in the growth- and innovation-heavy Nasdaq 100. 

Recall that inflation and rates move inverse to each other. In defending against the pressures of inflation, higher rates have the potential to decrease the present value of future earnings making stocks, especially those that are high growth, less attractive.

Graphic: Via Bloomberg, “Fed Chair Jerome Powell at his press conference after last month’s meeting said that policy makers eventually ‘expect a gradual pace of policy firming.’ They don’t anticipate raising rates before ending the taper process, but could hike before reaching full employment, he added.”

Moreover, a concern is that “[t]he minutes could hint at a quicker start to shrinking the balance sheet than after the prior tapering.”

With the equity market rallying on the back of easy monetary frameworks and max liquidity, markets diverged from fundamentals.

Reductions in the balance sheet (i.e., removal of liquidity) may help prick the bubble. 

Additionally, with the use of leveraged products trending higher than in the past, cross-asset correlations increase with volatility and stress. This may result in “hedging and de-leveraging cascades that affect the stability of all markets,” as well put in one article I recently wrote.

In other words, the response by customers, as well as the dynamics of dealers’ risk exposure to direction and volatility, can cause violent crash dynamics to transpire, further cutting into liquidity, and aiding an unraveling.

“It’s not a coincidence that the mid-February to mid-March 2020 downturn literally started the day after February expiration and ended the day of March quarterly expiration,” Kai Volatility’s Cem Karsan once told me. “These derivatives are incredibly embedded in how the tail reacts and there’s not enough liquidity, given the leverage, if the Fed were to taper.”

See the graphic below for implications of customers’ demands for downside protection.

Graphic: SqueezeMetrics details the implications of customer activity in the options market, on the underlying’s order book. For instance, in selling a put, customers add liquidity and stabilize the market. How? The market maker long the put will buy (sell) the underlying to neutralize directional risk as price falls (rises).

Positioning: Pursuant to some of the comments made in yesterday’s commentary, expected is a continued compression in volatility. 

Monday saw the selling of upside (call) and downside (put) protection. Tuesday saw more of the former, and that promoted some of the reversion, for lack of better phrasing, seen yesterday.

Recall that the participant on the other side of this dominant trade is taking on more exposure to positive delta. 

Why? Well, with any price rise, gamma (or how an option’s delta is expected to change given a change in the underlying) is added to the delta. Counterparties are to offset gamma by adding liquidity (as can be approximated with thickening of book depth, below) to the market (i.e., buy dips, sell rips).

Graphic: Analysis of book depth for the E-mini S&P 500 futures contract, via CME Group Inc’s (NASDAQ: CME) Liquidity Tool. For more on the implications of participants’ options positioning and dealer hedging, read here.

The continued compression of volatility will only serve to bolster any price rise as “hedging vanna and charm flows, and whatnot will push the markets higher.”

Were participants to reach for downside protection, markets will tend toward instability. Not seeing this yet.

Graphic: The “Biggest tail risk to SPX isn’t any macro data/virus/war but its own options market.”

Technical: As of 6:40 AM ET, Wednesday’s regular session (9:30 AM – 4:00 PM ET), in the S&P 500, will likely open in the middle part of a negatively skewed overnight inventory, inside of prior-range and -value, suggesting a limited potential for immediate directional opportunity.

Balance (Two-Timeframe Or Bracket) Scenarios: Rotational trade that denotes current prices offer favorable entry and exit. Balance-areas make it easy to spot a change in the market (i.e., the transition from two-time frame trade, or balance, to one-time frame trade, or trend). 

Modus operandi is responsive trade (i.e., fade the edges), rather than initiative trade (i.e., play the break).

In the best case, the S&P 500 trades higher; activity above the $4,783.75 micro composite point of control (MCPOC) puts in play the $4,808.25 minimal excess high. Initiative trade beyond the $4,808.25 figure could reach as high as the $4,814.00 and $4,832.25 extension, or higher.

In the worst case, the S&P 500 trades lower; activity below the $4,783.75 MCPOC puts in play the $4,756.00 low volume area (LVNode). Initiative trade beyond the LVNode could reach as low as the $4,732.50 high volume area (HVNode) and $4,717.25 LVNode, or lower.

Considerations: The aforementioned trade in the S&P 500 marks a potential willingness to continue balance, and it is built on poor structure, a dynamic that adds to technical instability.

On a liquidation that finds acceptance (i.e., more than 30-minutes of trade at a particular price level) below $4,756.00, there is increased potential for a fast move lower to $4,732.50 or lower.

This is as there has been a persistence of responses to technical levels; weaker-handed participants (which seldom defend retests) are carrying a heavier hand in recent discovery.

With that, any penetration of low-volume pockets – voids like gaps that can be seen on a chart – there ought to be follow-through as the participants that were most active at those levels run for the exits.

Click here to load today’s key levels into the web-based TradingView charting platform. Note that all levels are derived using the 65-minute timeframe. New links are produced, daily.
Graphic: 65-minute profile chart of the Micro E-mini S&P 500 Futures.

What People Are Saying

Definitions

Volume Areas: A structurally sound market will build on areas of high volume (HVNodes). Should the market trend for long periods of time, it will lack sound structure, identified as low volume areas (LVNodes). LVNodes denote directional conviction and ought to offer support on any test. 

If participants were to auction and find acceptance into areas of prior low volume (LVNodes), then future discovery ought to be volatile and quick as participants look to HVNodes for favorable entry or exit.

Gamma: Gamma is the sensitivity of an option to changes in the underlying price. Dealers that take the other side of options trades hedge their exposure to risk by buying and selling the underlying. When dealers are short-gamma, they hedge by buying into strength and selling into weakness. When dealers are long-gamma, they hedge by selling into strength and buying into weakness. The former exacerbates volatility. The latter calms volatility.

Vanna: The rate at which the delta of an option changes with respect to volatility.

Charm: The rate at which the delta of an option changes with respect to time.

Options: If an option buyer was short (long) stock, he or she would buy a call (put) to hedge upside (downside) exposure. Option buyers can also use options as an efficient way to gain directional exposure.

MCPOCs: POCs are valuable as they denote areas where two-sided trade was most prevalent over numerous day sessions. Participants will respond to future tests of value as they offer favorable entry and exit.

Excess: A proper end to price discovery; the market travels too far while advertising prices. Responsive, other-timeframe (OTF) participants aggressively enter the market, leaving tails or gaps which denote unfair prices.

About

After years of self-education, strategy development, mentorship, and trial-and-error, Renato Leonard Capelj began trading full-time and founded Physik Invest to detail his methods, research, and performance in the markets.

Capelj is also a Benzinga finance and technology reporter interviewing the likes of Shark Tank’s Kevin O’Leary, JC2 Ventures’ John Chambers, FTX’s Sam Bankman-Fried, and ARK Invest’s Catherine Wood, as well as a SpotGamma contributor developing insights around impactful options market dynamics.

Disclaimer

Physik Invest does not carry the right to provide advice.

In no way should the materials herein be construed as advice. Derivatives carry a substantial risk of loss. All content is for informational purposes only.

Categories
Commentary

Daily Brief For December 29, 2021

Notice: Given travel commitments, commentaries will be suspended until January 3, 2022. 

As an aside, I’m sincerely honored to have you as a subscriber. 

This newsletter began as a tool to hold myself accountable for objectively assessing dominant narratives and market-generated information. 

Since launching, this commentary has grown. Content and engagement have improved.

Now, with many of the 200 or so of you that are reading this actively, I have spoken with via email, and the like, regarding trader development, among many other things.

When it comes to markets, at the end of the day, whether you’re at a bank (as some of you are) or at home, we’re all alone. The implications of this are staggering.

How are we to objectively assess and act on what the market is signaling to us with no framework or community to work off of?

That’s the problem and I hope to make a bigger impact, going forward.

Wishing you good health and success next year and beyond!

Best, 

Renato

What Happened

In the face of a “stealth correction,” and an “off-loading of risk” by professionals, the S&P 500 remains strong further bolstered by options selling and volatility compression.

This is as less heavily-weighted constituents remain volatile; with hedging pressures sticky at the index level, the only reconciliation can be a decline in correlation. 

As liquidity remains “holiday-thinned,” so to speak, coming into Friday’s weighty “Quarterlys” options expiration, positioning metrics suggest indices ought to stick at higher prices.

Thereafter, expect increased movement.

Moreover, ahead is data on trade in goods (8:30 AM ET) and pending home sales (10:00 AM ET).

Graphic updated 6:30 AM ET. Sentiment Neutral if expected /ES open is inside of the prior day’s range. /ES levels are derived from the profile graphic at the bottom of the following section. Levels may have changed since initially quoted; click here for the latest levels. SqueezeMetrics Dark Pool Index (DIX) and Gamma (GEX) calculations are based on where the prior day’s reading falls with respect to the MAX and MIN of all occurrences available. A higher DIX is bullish. At the same time, the lower the GEX, the more (expected) volatility. Learn the implications of volatility, direction, and moneyness. SHIFT data used for S&P 500 (INDEX: SPX) options activity. Note that options flow is sorted by the call premium spent; if more positive then more was spent on call options. Breadth reflects a reading of the prior day’s NYSE Advance/Decline indicator. VIX reflects a current reading of the CBOE Volatility Index (INDEX: VIX) from 0-100.

What To Expect

Given the persistence of responses to technical levels, weaker-handed participants (which seldom bear the wherewithal to defend retests) carry a heavier hand in recent price discovery.

Via volume profile analysis, we see a plethora of low-volume pockets – voids, if you will – that likely hold virgin tests. Successful penetration often portends follow-through as the participants that were most active at those levels (quickly run for the exits when wrong).

Context: In the face of market internals that look weaker than at any time since March of last year, the S&P 500 remains strong, relative to its counterparts.

As alluded to in a prior section, the commitment of capital on lower volatility is upping the dealers’ addition of liquidity, which supports high prices but may limit further price discovery.

Why? When a position’s delta rises with stock or index price rises, gamma – the expected change in delta given movement in the underlying – is added to delta. 

According to SpotGamma, “[a]s participants keep adding to their bets at $4,800.00, the dealer only takes on more exposure to positive gamma.”

Graphic: Via SpotGamma. “Based on the fact that we are at the S&P Call Wall and are approaching this large OPEX, we look for a pause and some consolidation in markets here.”

So, with liquidity “holiday-thinned,” so to speak, and participants’ concentration of activity in near-the-money options strikes, coming into this week’s “Quarterlys” options expiration, indices are to remain pinned.

After Friday, the market is more susceptible to fundamental forces as, according to SpotGamma, there will be “a decrease in sticky gamma hedging.”

Couple current options positioning and buying pressure – via short sales or liquidity provision on the market-making side – metrics suggest middling returns 1-month out, or so.

Graphic: Data SqueezeMetrics. Graph via Physik Invest.

Moreover, the expectation is that positive fundamental forces and dealers’ covering of hedges to remaining “put-heavy” positioning bolster seasonally-aligned price rise in January.

Graphic: Per The Market Ear, “January typically sees 134% of inflows (the rest of the 11 months -34%). And with every private wealth manager in the world right now pitching increased allocations into equities (out of cash and out of bonds), Goldman calculates that keeping 2021 pace, This would be $125BN worth of inflows quickly in January.”

In anticipation of higher prices, low cost, complex options structures like call-side calendars, butterflies, and ratio spreads are still top of mind. 

After a fast move higher over the past week or so, with positioning metrics as they are, it does not make sense to commit massive debits to static or variable long-delta trades. Cost matters.

Graphic: Via Banco Santander SA (NYSE: SAN) research, the return profile, at expiry, of a classic 1×2 (long 1, short 2 further away) ratio spread.

Expectations: As of 6:30 AM ET, Wednesday’s regular session (9:30 AM – 4:00 PM ET), in the S&P 500, will likely open in the middle part of a balanced overnight inventory, inside of prior-range and -value, suggesting a limited potential for immediate directional opportunity.

Spike Rules In Play: Spike’s mark the beginning of a break from value. Spikes higher (lower) are validated by trade at or above (below) the spike base (i.e., the origin of the spike). 

The spike base is $4,776.00. Below bearish (change in tone). Above bullish (status quo).

In the best case, the S&P 500 trades sideways or higher; activity above the $4,781.75 high volume area (HVNode) puts in play the $4,798.00 minimal excess. Initiative trade beyond the minimal excess could reach as high as the $4,805.50 and $4,815.00 extension, or higher.

In the worst case, the S&P 500 trades lower; activity below the $4,781.75 HVNode puts in play the $4,770.50 regular trade low (RTH Low). Initiative trade beyond the RTH Low could reach as low as the $4,732.50 HVNode and $4,717.25 low volume area (LVNode), or lower.

Click here to load today’s key levels into the web-based TradingView charting platform. Note that all levels are derived using the 65-minute timeframe. New links are produced, daily.
Graphic: 65-minute profile chart of the Micro E-mini S&P 500 Futures. Learn about the profile.

What People Are Saying

Definitions

Volume Areas: A structurally sound market will build on areas of high volume (HVNodes). Should the market trend for long periods of time, it will lack sound structure, identified as low volume areas (LVNodes). LVNodes denote directional conviction and ought to offer support on any test. 

If participants were to auction and find acceptance into areas of prior low volume (LVNodes), then future discovery ought to be volatile and quick as participants look to HVNodes for favorable entry or exit.

Excess: A proper end to price discovery; the market travels too far while advertising prices. Responsive, other-timeframe (OTF) participants aggressively enter the market, leaving tails or gaps which denote unfair prices.

Volume-Weighted Average Prices (VWAPs): A metric highly regarded by chief investment officers, among other participants, for quality of trade. Additionally, liquidity algorithms are benchmarked and programmed to buy and sell around VWAPs.

About

After years of self-education, strategy development, and trial-and-error, Renato Leonard Capelj began trading full-time and founded Physik Invest to detail his methods, research, and performance in the markets.

Additionally, Capelj is a Benzinga finance and technology reporter interviewing the likes of Shark Tank’s Kevin O’Leary, JC2 Ventures’ John Chambers, and ARK Invest’s Catherine Wood, as well as a SpotGamma contributor, helping develop insights around impactful options market dynamics.

Disclaimer

At this time, Physik Invest does not carry the right to provide advice. In no way should the materials herein be construed as advice. Derivatives carry a substantial risk of loss. All content is for informational purposes only.

Categories
Commentary

Daily Brief For December 16, 2021

What Happened

After the Federal Reserve (Fed) announced it would accelerate its taper to bond-buying, clearing the way for interest-rate hikes, the equity market rallied, broadly. 

With all major U.S. equity index futures trading higher, overnight, it appears that participants’ fears regarding monetary policy have been assuaged

As forecasted, a collapse in event-related implied volatility brought in positive flows that ought to support the market into this week’s weighty “quad-witching” derivatives expiry.

Ahead is data on jobless claims, building permits, housing starts, and manufacturing (8:30 AM ET). Then, there are releases on industrial production, capacity utilization (9:15 AM ET), as well as Markit manufacturing and services PMI (9:45 AM ET). 

Graphic updated 6:15 AM ET. Sentiment Risk-On if expected /ES open is above the prior day’s range. /ES levels are derived from the profile graphic at the bottom of the following section. Levels may have changed since initially quoted; click here for the latest levels. SqueezeMetrics Dark Pool Index (DIX) and Gamma (GEX) calculations are based on where the prior day’s reading falls with respect to the MAX and MIN of all occurrences available. A higher DIX is bullish. At the same time, the lower the GEX, the more (expected) volatility. Learn the implications of volatility, direction, and moneyness. SHIFT data used for S&P 500 (INDEX: SPX) options activity. Note that options flow is sorted by the call premium spent; if more positive then more was spent on call options. Breadth reflects a reading of the prior day’s NYSE Advance/Decline indicator. VIX reflects a current reading of the CBOE Volatility Index (INDEX: VIX) from 0-100.

What To Expect

Market hammered out a low, yesterday. 

This was after, to start the week, customers had been increasing their exposure to short-delta (call selling and put buying). The counterparty inventorying the opposite (long-delta) exposure sold (bought) futures into price discovery higher (lower).

Graphic: Customers increased their exposure to short-delta call exposure. “Last week was about selling index calls,” SpotGamma’s Brent Kochuba said on Twitter. “This is likely why the $SPX stopped at $4,700.00.”

This dynamic had the effect of pinning the market; was the S&P 500 to remain in consolidation, customers’ (dealers’) short-delta (long-delta) would have risen which would have made for even more pinning.

That didn’t happen, though.

Into Wednesday’s FOMC event, demand for protection expanded (as evidenced by a higher CBOE Volatility Index reading). That knocked most of the major indexes out of sideways trade.

However, as revealed Tuesday by SpotGamma’s (beta) Hedging Impact of Real-Time Options (HIRO) indicator, “participants saw lower prices as an opportunity to express their opinion of lower volatility into Wednesday’s Federal Open Market Committee (FOMC) update.”

From there on, as Ambrus Group’s Kris Sidial best explained, “vols were static in anticipation of the fed talk,” taking away from supportive flows (as a result of options sliding down their term structure [vanna]) and promoting sideways trade.

Graphic: SpotGamma’s Hedging Impact of Real-Time Options (HIRO) indicator, which is pink in color, was sideways to higher. This suggests positive options delta trades likely had dealers buying stock/futures into the close.

Context: Wednesday’s commentary really hit the nail on the head, so to speak. 

Therefore, I offer some light updates.

As expected, per Nordea, the Fed will “accelerate its tapering process, and is now set to conclude net purchases already by mid-March vs mid-June with the earlier pace.”

“The dot plot was revised significantly higher, and the plot now shows three hikes for next year, a further three for 2023 and another two for 2024.”

Graphic: “[T]he terminal rate being priced in by financial markets is closer to 1.5% vs. 2.5% for the Fed,” Nordea explained. “The market is now pricing that rate hikes could start already in the mid-March 2022 meeting.”

That said, today’s rates support validations better than in the ‘90s.

At the same time, equity markets tend to rally into the first hike; Moody’s Corporation’s (NYSE: MCO) forecast aligns with that – “the Dow Jones Industrial Average increases this quarter and peaks in early 2022, … [followed by] steady decline through 2022.”

Graphic: S&P 500 performance before and after rate hikes.

This positive take is in the face of what has been markedly divergent breadth and extreme relative weakness, especially in rate-sensitive names. 

Why? Rising rates, among other factors, have the potential to decrease the present value of future earnings, thereby making stocks, especially those that are high growth, less attractive. 

Graphic: As U.S. stocks’ inflation-adjusted earnings yield turns negative, as seen near the peak of the tech bubble, via Bloomberg, “Investors in the Nasdaq increasingly seem to think that only a few companies have much of a chance. With a growing possibility of more aggressive attempts to prosecute antitrust issues, that’s a riskier position than it appears.”

With the equity market moving higher, here, into the end of the week, we ought to not discount participants’ increasing exposure to leveraged products.

This increases the speed with which volatility is realized and was cited as a risk in one of Moody’s recent commentaries.

So, despite having seasonally-aligned “passive buying support” and supportive positioning metrics, as well as expectations of “the strongest quarterly nominal [economic] growth in more than three decades,” offsides positioning ought to exacerbate underlying price movements.

So what? As stated, yesterday, the market is in a positive-gamma environment wherein the counterparties to customer options trades add market liquidity and temper realized volatility.

With participants’ fears surrounding monetary policy assuaged, there are positive flows that ought to support the market into this week’s weighty “quad-witching” derivatives expiry.

Graphic: VIX term shifts inward; as short-dated protection quickly was monetized or expired, volatility collapsed and dealers’ exposure to positive delta declined which meant they would cover their short futures hedges. This “vanna” flow bolstered an SPX rally into the end-of-day.

Into the end of the week, the expectation is that participants continue to step in and commit increased capital on lower directional volatility (as they had into this week).

With activity concentrated in shorter-dated tenors, counterparties will take on more exposure to positive gamma which they will offset by supplying the market with more liquidity, thereby pressuring the price discovery process.

Graphic: Via SpotGamma data, the above model’s tilt suggests dealers will increasingly sell into strength and buy into weakness, pressuring any price discovery into the end of this week.

Moreover, the decrease in dealer supply (short delta) post-OPEX, via the covering of short stock/futures hedges to put-heavy positioning, ought to bolster any attempt higher.

Below: Though book depth “in isolation is not the correct method to gauge liquidity,” it can help in assessing participants’ demand/supply as volatility (and stress, by that token) increases.

Graphic: Analysis of book depth for the E-mini S&P 500 futures contract, via CME Group Inc’s (NASDAQ: CME) Liquidity Tool. For more on the implications of participants’ options positioning and dealer hedging, read here.

In anticipation of higher prices, low cost, complex options structures like call-side calendars, butterflies, and ratio spreads are top of mind.

Graphic: Via Banco Santander SA (NYSE: SAN) research, the return profile, at expiry, of a classic 1×2 (long 1, short 2 further away) ratio spread.

Expectations: As of 6:15 AM ET, Thursday’s regular session (9:30 AM – 4:00 PM ET), in the S&P 500, will likely open in the upper part of a positively skewed overnight inventory, outside of prior-range and -value, suggesting a potential for immediate directional opportunity.

Balance-Break + Gap Scenarios: A change in the market (i.e., the transition from two-time frame trade, or balance, to one-time frame trade, or trend) is occurring.

Monitor for acceptance (i.e., more than 1-hour of trade) outside of the balance area. 

Leaving value behind on a gap-fill or failing to fill a gap (i.e., remaining outside of the prior session’s range) is a go-with indicator. 

Rejection (i.e., return inside of balance) portends a move to the opposite end of the balance.

In the best case, the S&P 500 trades sideways or higher; activity above the $4,712.00 balance area boundary (BAH) puts in play the $4,732.50 high volume area (HVNode). Initiative trade beyond the HVNode could reach as high as the $4,740.50 minimal excess high and $4,767.00 extension, or higher.

In the worst case, the S&P 500 trades lower; activity below the $4,712.00 BAH puts in play the $4,690.25 micro composite point of control (MCPOC). Initiative trade beyond the MCPOC could reach as low as the $4,674.25 HVNode and $4,657.00 balance low (BAL), or lower.

Click here to load today’s key levels into the web-based TradingView charting platform. Note that all levels are derived using the 65-minute timeframe. New links are produced, daily.
Graphic: 65-minute profile chart of the Micro E-mini S&P 500 Futures. Learn about the profile.
Graphic: V-pattern recovery in SPDR S&P 500 ETF Trust (NYSE: SPY), one of the largest ETFs that track the S&P 500 index, portends continuation. The red, black, and yellow-colored lines are anchored volume-weighted average price levels (VWAPs), metric highly regarded by chief investment officers, among other participants, for quality of trade. Additionally, liquidity algorithms are benchmarked and programmed to buy and sell around VWAPs.

Definitions

V-Pattern: A pattern that forms after a market establishes a high, retests some support, and then breaks above said high. In most cases, this pattern portends continuation.

Volume Areas: A structurally sound market will build on areas of high volume (HVNodes). Should the market trend for long periods of time, it will lack sound structure, identified as low volume areas (LVNodes). LVNodes denote directional conviction and ought to offer support on any test. 

If participants were to auction and find acceptance into areas of prior low volume (LVNodes), then future discovery ought to be volatile and quick as participants look to HVNodes for favorable entry or exit.

Gamma: Gamma is the sensitivity of an option to changes in the underlying price. Dealers that take the other side of options trades hedge their exposure to risk by buying and selling the underlying. When dealers are short-gamma, they hedge by buying into strength and selling into weakness. When dealers are long-gamma, they hedge by selling into strength and buying into weakness. The former exacerbates volatility. The latter calms volatility.

Vanna: The rate at which the delta of an option changes with respect to volatility.

Charm: The rate at which the delta of an option changes with respect to time.

MCPOCs: POCs are valuable as they denote areas where two-sided trade was most prevalent over numerous day sessions. Participants will respond to future tests of value as they offer favorable entry and exit.

Price Discovery (One-Timeframe Or Trend): Elongation and range expansion denotes a market seeking new prices to establish value, or acceptance (i.e., more than 30-minutes of trade at a particular price level). 

Excess: A proper end to price discovery; the market travels too far while advertising prices. Responsive, other-timeframe (OTF) participants aggressively enter the market, leaving tails or gaps which denote unfair prices.

About

After years of self-education, strategy development, and trial-and-error, Renato Leonard Capelj began trading full-time and founded Physik Invest to detail his methods, research, and performance in the markets.

Additionally, Capelj is a Benzinga finance and technology reporter interviewing the likes of Shark Tank’s Kevin O’Leary, JC2 Ventures’ John Chambers, and ARK Invest’s Catherine Wood, as well as a SpotGamma contributor, helping develop insights around impactful options market dynamics.

Disclaimer

At this time, Physik Invest does not carry the right to provide advice. In no way should the materials herein be construed as advice. Derivatives carry a substantial risk of loss. All content is for informational purposes only.

Categories
Commentary

Daily Brief For December 13, 2021

What Happened

Overnight, most equity, commodity, and bond futures were higher.

This comes ahead of the weighty December 17 options and futures expiration – “quad witching” – large portfolio rebalances, and an update to Federal Reserve (Fed) policy, December 15.

Ahead, today, there are no key economic releases scheduled.

Graphic updated 6:15 AM ET. Sentiment Risk-On if expected /ES open is above the prior day’s range. /ES levels are derived from the profile graphic at the bottom of the following section. Levels may have changed since initially quoted; click here for the latest levels. SqueezeMetrics Dark Pool Index (DIX) and Gamma (GEX) calculations are based on where the prior day’s reading falls with respect to the MAX and MIN of all occurrences available. A higher DIX is bullish. At the same time, the lower the GEX, the more (expected) volatility. Learn the implications of volatility, direction, and moneyness. SHIFT data used for S&P 500 (INDEX: SPX) options activity. Note that options flow is sorted by the call premium spent; if more positive then more was spent on call options. Breadth reflects a reading of the prior day’s NYSE Advance/Decline indicator. VIX reflects a current reading of the CBOE Volatility Index (INDEX: VIX) from 0-100.

What To Expect

On lackluster breadth and supportive market liquidity metrics, the best case outcome occurred, evidenced by an expansion of range, Friday, followed by a gap out of balance, Sunday.

Graphic: SpotGamma’s (beta) Hedging Impact of Real-Time Options (HIRO) indicator suggested participants were buying (or covering short) calls and selling put options, into the close. S&P 500 prices followed as dealers added to their long-delta hedges.

Context: As fears of a COVID-19 resurgence are assuaged, in the face of U.S. job growth that fell short of expectations, per Bloomberg, the Fed ought to move more quickly to “save itself from having to hike too far and make rates so expensive that they slow down the economy.”

The expectation is that the Fed scales asset purchases by $30 billion per month versus the expected $15 billion. In doubling the pace of the taper to bond-buying, the odds of a rate hike happening as early as next June increase markedly. 

“If the Fed does not address inflation soon, they risk long rates shooting much higher,” says Jim Bianco of Bianco Research.

“But if they follow the market’s lead in aggressively hiking rates, they risk hurting the economy. We understand the Fed’s paralysis given the massive uncertainty coming out of the pandemic. However, the longer they wait to address inflation, the worse this conundrum will become.”

Rising rates, among other factors, have the potential to decrease the present value of future earnings, thereby making stocks, especially those that are high growth, less attractive.

Despite today’s rates supporting validations better than in the ‘90s, an intent to reduce stimulus serves as a headwind.

That said, equity markets typically rally into the first hike; Moody’s Corporation’s (NYSE: MCO) “forecast is that the Dow Jones Industrial Average increases this quarter and peaks in early 2022, … [followed by] steady decline through 2022.”

Graphic: S&P 500 performance before and after rate hikes, via The Market Ear.

Prevailing monetary frameworks and max liquidity promoted a large divergence in price from fundamentals; the growth of passive investing – the effect of increased moneyness among nonmonetary assets – and derivatives trading imply a lot of left-tail risks.

Graphic: As U.S. stocks’ inflation-adjusted earnings yield turns negative, as seen near the peak of the tech bubble, via Bloomberg, “Investors in the Nasdaq increasingly seem to think that only a few companies have much of a chance. With a growing possibility of more aggressive attempts to prosecute antitrust issues, that’s a riskier position than it appears.”

Adding, the Fed, too, is seeing vulnerabilities in asset prices.

“The decline in stock prices is forecast to be orderly but it could turn into something worse,” Moody’s explains. 

“One potential catalyst would be an explosion in the value of margin accounts at brokers and dealers, which amounted to $595 billion in the second quarter, nearly double the pre-pandemic level. A drop in stock prices could trigger margin calls.”

Margin calls happen when customers owe money to their brokerage firm; “If there is no money, investors have to sell other assets.”

Putting it simply, participants are more exposed to leveraged products, among other things, which increases the speed with which volatility is realized.

So despite positioning metrics flashing a buy, and expectations of “the strongest quarterly nominal [economic] growth in more than three decades,” offsides positioning may prompt a cascading reaction that exacerbates underlying price movements.

Short-term, however, aside from the presence of “natural, passive buying support,” the market is in a positive-gamma environment wherein the counterparties to customer options trades add market liquidity and temper realized volatility.

Graphic: “[N]atural, passive buying support,” coupled with strong put flows results in positive return distribution. Data via SqueezeMetrics. Graph via Physik Invest.

If participants are further assuaged of their fears at this week’s Federal Open Market Committee (FOMC) meeting, a collapse in event-related implied volatility ought to bring in positive flows as the long delta (from dealers’ exposure to short puts) decreases.

The decrease in dealer supply (short delta), via covering of short stock/futures hedges, would bolster any attempt higher.

Expectations: As of 6:15 AM ET, Monday’s regular session (9:30 AM – 4:00 PM ET), in the S&P 500, will likely open in the upper part of a positively skewed overnight inventory, outside of prior-range and -value, suggesting a potential for immediate directional opportunity.

Balance-Break + Gap Scenarios: A change in the market (i.e., the transition from two-time frame trade, or balance, to one-time frame trade, or trend) is occurring.

Monitor for acceptance (i.e., more than 1-hour of trade) outside of the balance area. 

Leaving value behind on a gap-fill or failing to fill a gap (i.e., remaining outside of the prior session’s range) is a go-with indicator. 

Rejection (i.e., return inside of balance) portends a move to the opposite end of the balance.

In the best case, the S&P 500 trades sideways or higher; activity above the $4,717.25 low volume area (LVNode) puts in play the $4,732.50 high volume area (HVNode). Initiative trade beyond the HVNode could reach as high as the $4,740.50 minimal excess and $4,767.00 extension, or higher.

In the worst case, the S&P 500 trades lower; activity below the $4,717.25 LVNode puts in play the $4,705.25 LVNode. Initiative trade beyond the LVNode could reach as low as the $4,690.25 MCPOC and $4,674.25 HVNode, or lower.

Click here to load today’s key levels into the web-based TradingView charting platform. Note that all levels are derived using the 65-minute timeframe. New links are produced, daily.
Graphic: 65-minute profile chart of the Micro E-mini S&P 500 Futures. Learn about the profile.

What People Are Saying

Definitions

Volume Areas: A structurally sound market will build on areas of high volume (HVNodes). Should the market trend for long periods of time, it will lack sound structure, identified as low volume areas (LVNodes). LVNodes denote directional conviction and ought to offer support on any test. 

If participants were to auction and find acceptance into areas of prior low volume (LVNodes), then future discovery ought to be volatile and quick as participants look to HVNodes for favorable entry or exit.

POCs: POCs are valuable as they denote areas where two-sided trade was most prevalent in a prior day session. Participants will respond to future tests of value as they offer favorable entry and exit.

MCPOCs: POCs are valuable as they denote areas where two-sided trade was most prevalent over numerous day sessions. Participants will respond to future tests of value as they offer favorable entry and exit.

Excess: A proper end to price discovery; the market travels too far while advertising prices. Responsive, other-timeframe (OTF) participants aggressively enter the market, leaving tails or gaps which denote unfair prices.

About

After years of self-education, strategy development, and trial-and-error, Renato Leonard Capelj began trading full-time and founded Physik Invest to detail his methods, research, and performance in the markets.

Additionally, Capelj is a Benzinga finance and technology reporter interviewing the likes of Shark Tank’s Kevin O’Leary, JC2 Ventures’ John Chambers, and ARK Invest’s Catherine Wood, as well as a SpotGamma contributor, helping develop insights around impactful options market dynamics.

Disclaimer

At this time, Physik Invest does not carry the right to provide advice. In no way should the materials herein be construed as advice. Derivatives carry a substantial risk of loss. All content is for informational purposes only.

Categories
Commentary

Daily Brief For December 10, 2021

What Happened

Overnight, equity index futures staged a reversal, auctioning back from yesterday’s knee-jerk liquidation toward intraday value, the levels at which 70% of Thursday’s volume transacted.

Ahead is data on the Consumer Price Index (CPI) and Core Inflation (8:30 AM ET), University of Michigan Consumer Sentiment and Expected Inflation (10:00 AM ET), as well as the Federal Budget (2:00 PM ET).

Graphic updated 6:40 AM ET. Sentiment Neutral if expected /ES open is inside of the prior day’s range. /ES levels are derived from the profile graphic at the bottom of the following section. Levels may have changed since initially quoted; click here for the latest levels. SqueezeMetrics Dark Pool Index (DIX) and Gamma (GEX) calculations are based on where the prior day’s reading falls with respect to the MAX and MIN of all occurrences available. A higher DIX is bullish. At the same time, the lower the GEX, the more (expected) volatility. Learn the implications of volatility, direction, and moneyness. SHIFT data used for S&P 500 (INDEX: SPX) options activity. Note that options flow is sorted by the call premium spent; if more positive then more was spent on call options. Breadth reflects a reading of the prior day’s NYSE Advance/Decline indicator. VIX reflects a current reading of the CBOE Volatility Index (INDEX: VIX) from 0-100.

What To Expect

After a multi-day pin against the S&P 500 $4,700.00 area, on weak intraday breadth and market liquidity metrics, the worst-case outcome occurred; participants moved the index away from its intraday value, the levels at which participants found it most favorable to trade at.

As noted in past commentaries, participants’ discovery of higher prices left poor structure; both Monday and Tuesday’s sessions left gaps and p-shaped emotional, multiple-distribution profile structures (i.e., old-money shorts covering).

Thursday’s end-of-day liquidation, ahead of new data on inflation, brought the S&P 500 into a pocket of low volume (LVNode) that participants quickly rejected overnight.

This rejection suggests participants responsively bought the move lower; more information is needed to warrant an expansion of range in either direction.

Graphic: Supportive delta (i.e., committed end-of-day selling as measured by volume delta or buying and selling power as calculated by the difference in volume traded at the bid and offer) in SPDR S&P 500 ETF Trust (NYSE: SPY), one of the largest ETFs that track the S&P 500 index, via Bookmap

Context: Inflation is key in gauging monetary policy. 

Per Bloomberg, a CPI figure above (below) of 7% likely sparks a risk-off (risk-on) move.

Either way, next week the Fed ought to announce an acceleration in its taper to bond-buying. 

Upon an end to the taper, there ought to be a tightening; William Dudley, a former New York Fed governor, believes there will be three 0.25-percentage-point rate increases next year. 

In 2023, Dudley sees four rate hikes that bring the median target rate to 1.8%, and then, the target rate will reach 2.5% in 2024.

Rising rates, among other factors, have the potential to decrease the present value of future earnings, thereby making stocks, especially those that are high growth, less attractive.

Higher inflation prints, today, could spark a risk-off move as participants price in more aggressive change to the monetary frameworks and liquidity provision that promoted a large divergence in price form fundamentals.

“[T]he Fed may be making a policy error by essentially overweighting a fight against inflation versus supporting growth,” Bank of America’s (NYSE: BAC) Mark Cabana explained.

Participants are “worried that the Fed is going to be tightening into supply-constrained inflation and reduction of consumer purchasing power and they’re doing that because they’re worried risk assets may be very sensitive to rate levels.”

Despite the doom and gloom, it’s worth noting that today’s rates and earnings support validations better than in the ‘90s.

The “growth in earnings is so far stronger than the multiple compression caused by rising rates (blue line),” and that will continue to bolster any rally attempt.

Graphic: Low rates support current valuations better than the ‘90s, according to Nasdaq.

Still, that intent to moderate stimulus serves as a headwind and some high-growth names have been weakening.

For instance, as shares of Tesla Inc (NASDAQ: TSLA) declined, yesterday, SpotGamma data suggested participants were seeking downside protection, in size.

Due to an environment wherein the counterparties to customer option trades buy (sell) into weakness (strength), indices are pinned.

“[D]ealer hedging has suppressed index level volatility, but underlying components are [] exhibiting idiosyncratic volatility,” as one paper puts it.

“The only reconciliation is a decline in correlation.”

If that activity in highly-weighted constituents like Tesla was to feed into the indices, the effects would be destabilizing.

However, in regards to positioning metrics, at present, the return distribution is skewed positive.

Adding, if participants are assuaged of their fears at next week’s Federal Open Market Committee (FOMC) meeting, a collapse in event-related implied volatility ought to bring in positive flows as the long delta (from dealers’ exposure to short puts) decreases; the decrease in dealer supply (short delta), via covering of short stock/futures hedges, would bolster any attempt higher. See below.

Expectations: As of 6:40 AM ET, Friday’s regular session (9:30 AM – 4:00 PM ET), in the S&P 500, will likely open in the upper part of a positively skewed overnight inventory, inside of prior-range and -value, suggesting a limited potential for immediate directional opportunity.

Balance Expected: Rotational trade that denotes current prices offer favorable entry and exit. 

Balance-areas make it easy to spot a change in the market (i.e., the transition from two-time frame trade, or balance, to one-time frame trade, or trend). 

Modus operandi is responsive trade (i.e., fade the edges), rather than initiative trade (i.e., play the break).

In the best case, the S&P 500 trades sideways or higher; activity above the $4,685.00 untested point of control (VPOC) puts in play the $4,705.75 LVNode. Initiative trade beyond the LVNode could reach as high as the $4,716.75 LVNode and $4,740.50 minimal excess high, or higher.

In the worst case, the S&P 500 trades lower; activity below the $4,685.00 VPOC puts in play the $4,674.25 HVNode. Initiative trade beyond the HVNode could reach as low as the $4,647.25 and $4,618.75 HVNode, or lower.

Click here to load today’s key levels into the web-based TradingView charting platform. Note that all levels are derived using the 65-minute timeframe. New links are produced, daily.
Graphic: 65-minute profile chart of the Micro E-mini S&P 500 Futures. Learn about the profile.

What People Are Saying

Definitions

Cave-Fill Process: Widened the area deemed favorable to transact at by an increased share of participants. This is a good development.

Volume Areas: A structurally sound market will build on areas of high volume (HVNodes). Should the market trend for long periods of time, it will lack sound structure, identified as low volume areas (LVNodes). LVNodes denote directional conviction and ought to offer support on any test. 

If participants were to auction and find acceptance into areas of prior low volume (LVNodes), then future discovery ought to be volatile and quick as participants look to HVNodes for favorable entry or exit.

POCs: POCs are valuable as they denote areas where two-sided trade was most prevalent in a prior day session. Participants will respond to future tests of value as they offer favorable entry and exit.

Value-Area Placement: Perception of value unchanged if value overlapping (i.e., inside day). Perception of value has changed if value not overlapping (i.e., outside day). Delay trade in the former case.

Excess: A proper end to price discovery; the market travels too far while advertising prices. Responsive, other-timeframe (OTF) participants aggressively enter the market, leaving tails or gaps which denote unfair prices.

About

After years of self-education, strategy development, and trial-and-error, Renato Leonard Capelj began trading full-time and founded Physik Invest to detail his methods, research, and performance in the markets.

Additionally, Capelj is a Benzinga finance and technology reporter interviewing the likes of Shark Tank’s Kevin O’Leary, JC2 Ventures’ John Chambers, and ARK Invest’s Catherine Wood, as well as a SpotGamma contributor, helping develop insights around impactful options market dynamics.

Disclaimer

At this time, Physik Invest does not carry the right to provide advice. In no way should the materials herein be construed as advice. Derivatives carry a substantial risk of loss. All content is for informational purposes only.

Categories
Commentary

Daily Brief For December 9, 2021

What Happened

Overnight, equity index futures auctioned sideways after the large move higher.

This comes alongside top news items including Evergrande’s default, omicron transmission, U.K. COVID-19 restrictions, among other things.

Ahead is data on jobless claims (8:30 AM ET), wholesale inventories (10:00 AM ET), as well as real household wealth and nonfinancial debt (12:00 PM ET).

Graphic updated 6:15 AM ET. Sentiment Neutral if expected /ES open is inside of the prior day’s range. /ES levels are derived from the profile graphic at the bottom of the following section. Levels may have changed since initially quoted; click here for the latest levels. SqueezeMetrics Dark Pool Index (DIX) and Gamma (GEX) calculations are based on where the prior day’s reading falls with respect to the MAX and MIN of all occurrences available. A higher DIX is bullish. At the same time, the lower the GEX, the more (expected) volatility. Learn the implications of volatility, direction, and moneyness. SHIFT data used for S&P 500 (INDEX: SPX) options activity. Note that options flow is sorted by the call premium spent; if more positive then more was spent on call options. Breadth reflects a reading of the prior day’s NYSE Advance/Decline indicator. VIX reflects a current reading of the CBOE Volatility Index (INDEX: VIX) from 0-100.

What To Expect

On lackluster intraday breadth and supportive market liquidity metrics, the best case outcome occurred evidenced by sideways trade and overlapping value (i.e., the prices levels at which 70% of the day’s volume was transacted).

Notwithstanding, as stated in the past, though this activity marks participants’ willingness to discover and validate higher prices, the prior structure is poor; there is technical instability.

Specifically, both Monday and Tuesday’s sessions left gaps and p-shaped emotional, multiple-distribution profile structures (i.e., old-money shorts covering).

As said before, participants will look to revisit, repair, and strengthen – build out areas of high volume (HVNodes) via the cave-fill process – these areas of low volume (LVNodes).

Graphic: Supportive delta (i.e., committed buying as measured by volume delta or buying and selling power as calculated by the difference in volume traded at the bid and offer) in SPDR S&P 500 ETF Trust (NYSE: SPY), one of the largest ETFs that track the S&P 500 index, via Bookmap.

Context: Next week the Federal Reserve is likely to announce an acceleration in its taper.

“[T]he implicit expectation is that by moving more quickly and aggressively, the Fed will save itself from having to hike too far and make rates so expensive that they slow down the economy,” Bloomberg’s John Authers explained

Adding, William Dudley, a former New York Fed governor, believes there will be three 0.25-percentage-point rate increases next year. 

In 2023, Dudley sees four rate hikes that bring the median target rate to 1.8%, and then, the target rate will reach 2.5% in 2024.

Authers adds: “If we take broad ‘M2’ money as a yardstick for the amount of liquidity in the economy, it’s clear that the Fed has trodden on the accelerator for much longer than other central banks.”

Graphic: Via Bloomberg, while the strength of the U.S. recovery owes a lot to monetary responses, the Fed will have to work harder to “rein in liquidity and calm inflation down.”

Moreover, rising rates, among other factors, have the potential to decrease the present value of future earnings, thereby making stocks, especially those that are high growth, less attractive.

As the market is a forward-looking mechanism, the implications of this are staggering. 

Prevailing monetary frameworks and max liquidity promoted a large divergence in price from fundamentals. 

The growth of passive investing – the effect of increased moneyness among nonmonetary assets – and derivatives trading imply a lot of left-tail risks.

As Kai Volatility’s Cem Karsan once told me: “There’s this constant structural positioning that naturally drives markets higher as long as volatility is compressed,” or there is supply.

“At the end of the day, though, the higher you go, the further off the ground you are and the more tail risk.”

To put it simply, participants are more exposed to leveraged products, among other things, which increases the speed with which volatility is realized.

“It’s not a coincidence that the mid-February to mid-March 2020 downturn literally started the day after February expiration and ended the day of March quarterly expiration” Karsan adds. 

“These derivatives are incredibly embedded in how the tail reacts and there’s not enough liquidity, given the leverage, if the Fed were to taper.”

Despite today’s rates and earnings supporting validations better than in the ‘90s, an intent to moderate stimulus serves as a headwind.

That said, the S&P 500 typically rallies into the first hike. After, expect noise.

Graphic: S&P 500 performance before and after rate hikes, via The Market Ear.

At present, the return distribution is skewed positive, but a lot of the punchy opportunity (based on how participants were positioned just a week ago) has disappeared.

The dynamics surrounding the collapse in volatility and expiry of extremely short-dated downside protection have played out; the market entered into positive-gamma wherein the counterparties to customer options trades add market liquidity and temper realized volatility.

Graphic: Per SpotGamma data, the S&P 500 is no longer in destabilizing negative-gamma (left). Instead, it is in stabilizing positive-gamma (right) territory.

If participants are assuaged of their fears at next week’s Federal Open Market Committee (FOMC) meeting, a collapse in event-related implied volatility ought to bring in positive flows as the long delta (from dealers’ exposure to short puts) decreases; the decrease in dealer supply (short delta), via covering of short stock/futures hedges, would bolster any attempt higher. See below.

Expectations: As of 6:15 AM ET, Thursday’s regular session (9:30 AM – 4:00 PM ET), in the S&P 500, will likely open in the bottom part of a negatively skewed overnight inventory, inside of prior-range and -value, suggesting a limited potential for immediate directional opportunity.

In the best case, the S&P 500 trades sideways or higher; activity above the $4,691.25 micro composite point of control (MCPOC) puts in play the $4,705.75 LVNode. Initiative trade beyond the LVNode could reach as high as the $4,716.75 LVNode and $4,740.50 minimal excess high, or higher.

In the worst case, the S&P 500 trades lower; activity below the $4,691.25 MCPOC puts in play the $4,674.25 HVNode. Initiative trade beyond the HVNode could reach as low as the $4,647.25 and $4,618.75 HVNode, or lower.

Click here to load today’s key levels into the web-based TradingView charting platform. Note that all levels are derived using the 65-minute timeframe. New links are produced, daily.
Graphic: 65-minute profile chart of the Micro E-mini S&P 500 Futures. Learn about the profile.

What People Are Saying

Definitions

Cave-Fill Process: Widened the area deemed favorable to transact at by an increased share of participants. This is a good development.

Volume Areas: A structurally sound market will build on areas of high volume (HVNodes). Should the market trend for long periods of time, it will lack sound structure, identified as low volume areas (LVNodes). LVNodes denote directional conviction and ought to offer support on any test. 

If participants were to auction and find acceptance into areas of prior low volume (LVNodes), then future discovery ought to be volatile and quick as participants look to HVNodes for favorable entry or exit.

MCPOCs: POCs are valuable as they denote areas where two-sided trade was most prevalent over numerous day sessions. Participants will respond to future tests of value as they offer favorable entry and exit.

Excess: A proper end to price discovery; the market travels too far while advertising prices. Responsive, other-timeframe (OTF) participants aggressively enter the market, leaving tails or gaps which denote unfair prices.

Value-Area Placement: Perception of value unchanged if value overlapping (i.e., inside day). Perception of value has changed if value not overlapping (i.e., outside day). Delay trade in the former case.

About

After years of self-education, strategy development, and trial-and-error, Renato Leonard Capelj began trading full-time and founded Physik Invest to detail his methods, research, and performance in the markets.

Additionally, Capelj is a Benzinga finance and technology reporter interviewing the likes of Shark Tank’s Kevin O’Leary, JC2 Ventures’ John Chambers, and ARK Invest’s Catherine Wood, as well as a SpotGamma contributor, helping develop insights around impactful options market dynamics.

Disclaimer

At this time, Physik Invest does not carry the right to provide advice. In no way should the materials herein be construed as advice. Derivatives carry a substantial risk of loss. All content is for informational purposes only.

Categories
Commentary

Daily Brief For December 8, 2021

Editor’s Note: The purpose of these commentaries is to align ourselves better for the day ahead. Seldom, however, do we step away to align ourselves with trade across larger time horizons. 

Given the proximity to the new year, I shall be placing more attention on planning.

How do we model a trading plan? Here is one link on things to consider.

What Happened

Overnight, equity index futures were divergent; the Russell 2000 and Dow Jones Industrial Averaged traded weak relative to their peers the S&P 500 and Nasdaq 100. 

This is as scientists discovered a harder-to-detect version of omicron that may be countered with an extra dose of vaccine.

In other news, the U.K. was set to impose new COVID-19 restrictions, the House passed a bill opening the way to a quick debt ceiling increase, and the list of Chinese developers warning they may not be able to meet upcoming financial obligations grew.

Ahead is data on job openings and quits (10:00 AM ET). 

Graphic updated 6:30 AM ET. Sentiment Neutral if expected /ES open is inside of the prior day’s range. /ES levels are derived from the profile graphic at the bottom of the following section. Levels may have changed since initially quoted; click here for the latest levels. SqueezeMetrics Dark Pool Index (DIX) and Gamma (GEX) calculations are based on where the prior day’s reading falls with respect to the MAX and MIN of all occurrences available. A higher DIX is bullish. At the same time, the lower the GEX, the more (expected) volatility. Learn the implications of volatility, direction, and moneyness. SHIFT data used for S&P 500 (INDEX: SPX) options activity. Note that options flow is sorted by the call premium spent; if more positive then more was spent on call options. Breadth reflects a reading of the prior day’s NYSE Advance/Decline indicator. VIX reflects a current reading of the CBOE Volatility Index (INDEX: VIX) from 0-100.

What To Expect

On strong intraday breadth and divergent market liquidity metrics, the best case outcome occurred, yesterday, evidenced by an upside gap, expansion of range, and separation of value.

Similar to Tuesday’s commentary, though this activity marks participants’ willingness to change the trend, the structure is poor. As a result, there is technical instability.

Specifically, both Monday and Tuesday’s sessions left gaps and p-shaped emotional, multiple-distribution profile structures (i.e., old-money shorts covering).

As said before, participants will look to revisit, repair, and strengthen – build out areas of high volume (HVNodes) via the cave-fill process – these areas of low volume (LVNodes).

Graphic: Divergent delta (i.e., non-committed buying as measured by volume delta or buying and selling power as calculated by the difference in volume traded at the bid and offer) in SPDR S&P 500 ETF Trust (NYSE: SPY), one of the largest ETFs that track the S&P 500 index, via Bookmap. The readings are supportive of responsive trade (i.e., rotational trade that suggests current prices offer favorable entry and exit; the market is attempting to balance).

Context: Has anything really changed since the November monthly options expiration (OPEX)?

Sure, we had some news with respect to COVID-19, China, and U.S. growth, but any associated fears were fast assuaged. 

In the span of four days, the S&P 500 rose nearly 5.00%. That’s just over 200 points!

Much of what we’re seeing is the direct result of changing market structure; participants are more exposed to leveraged products, among other things, which increases the speed with which volatility is realized.

Participants went from being exuberant and underexposed to protection – in the face of weakening breadth/fundamentals – to generating destabilizing demand for protection.

Alongside that demand of (shorter-dated) protection (where options sensitivity to direction is higher) was the market’s entry into short-gamma. In such an environment, counterparties to customers’ options trades exacerbate underlying volatility through hedging. 

Note all that movement in the front-end of the VIX futures term structure, below. Wow!

In the face of all the fear was “natural, passive buying support,” however, and expectations that short-dated protection (if realized volatility was to not be expressed to the downside) would either roll off the table (expire) or be monetized, resulting in counterparties reversing their hedges (initially short stock/futures) and supporting the market (buying to cover).

As said on December 6, and many commentaries before that, this “flow is stabilizing and may play into a seasonally-aligned rally into Christmas as participants see defenses rolled out against the new COVID-19 variant,” and so on.

Based on this week’s trade, thus far, it seems that the bull thesis is playing out. 

So you’re telling me to buy every S&P 500 call under the sun, right? NO!

There has yet to be a notable strengthening in overall market breadth and volatility remains rich in the face of the fast-approaching December OPEX and December 15-16 Federal Open Market Committee (FOMC) meeting.

Traders are antsy and have already started pricing in potential rate overshoots; Federal Reserve Chair Jerome Powell went from being uber dovish to increasingly hawkish on the topic of taper and interest rate expansion.

Though today’s rates and earnings support validations better than in the ‘90s, an intent to moderate stimulus serves as a headwind; the U.S. may realize the swiftest tightening in financial conditions since 2005 if the Fed was to hike rates three times next year. Yikes!

So, we have to be careful here. 

Despite the S&P rallying into the first hike, historically, dynamics with respect to market structure introduce a lot of noise. Therefore, we ought to be looking at structures that have little to lose in episodes where stress surfaces and volatility is expressed to the downside. 

Graphic: UBS Group AG (NYSE: UBS) research on S&P performance into rate hikes.

Examples of low-cost options structures include call-side calendars, butterflies, and ratio spreads.

Graphic: Via Banco Santander SA (NYSE: SAN) research, the return profile, at expiry, of a classic 1×2 (long 1, short 2 further away) ratio spread.

If opportune (and well-capitalized), there are opportunities to finance debits on the call side with structures on the put side. 

This, above, is no recommendation. It’s more so how I’m looking at the current market.

In summation, the return distribution is skewed positive, still, at this juncture, but a lot of the opportunity (based on how participants were positioned just a weak ago) has disappeared.

That’s not to say we can’t go higher; upon a smooth passage of the December FOMC and OPEX there may be an unwind of “structural positioning that naturally drives markets higher as long as volatility is compressed.”

Expectations: As of 6:30 AM ET, Wednesday’s regular session (9:30 AM – 4:00 PM ET), in the S&P 500, will likely open in the middle part of a balanced overnight inventory, inside of prior-range and -value, suggesting a limited potential for immediate directional opportunity.

In the best case, the S&P 500 trades sideways or higher; activity above the $4,691.25 HVNode puts in play the $4,705.75 LVNode and overnight high (ONH). Initiative trade beyond the latter could reach as high as the $4,716.75 LVNode/ONH and $4,740.50 minimal excess high, or higher.

In the worst case, the S&P 500 trades lower; activity below the $4,691.25 HVNode puts in play the $4,674.25 micro composite point of control (MCPOC). Initiative trade beyond the MCPOC could reach as low as the $4,647.25 and $4,618.75 HVNode, or lower.

Click here to load today’s key levels into the web-based TradingView charting platform. Note that all levels are derived using the 65-minute timeframe. New links are produced, daily.
Graphic: 65-minute profile chart of the Micro E-mini S&P 500 Futures. Learn about the profile.

What People Are Saying

Definitions

Cave-Fill Process: Widened the area deemed favorable to transact at by an increased share of participants. This is a good development.

Overnight Rally Highs (Lows): Typically, there is a low historical probability associated with overnight rally-highs (lows) ending the upside (downside) discovery process.

Volume Areas: A structurally sound market will build on areas of high volume (HVNodes). Should the market trend for long periods of time, it will lack sound structure, identified as low volume areas (LVNodes). LVNodes denote directional conviction and ought to offer support on any test. 

If participants were to auction and find acceptance into areas of prior low volume (LVNodes), then future discovery ought to be volatile and quick as participants look to HVNodes for favorable entry or exit.

MCPOCs: POCs are valuable as they denote areas where two-sided trade was most prevalent over numerous day sessions. Participants will respond to future tests of value as they offer favorable entry and exit.

Options Expiration (OPEX): Traditionally, option expiries mark an end to pinning (i.e, the theory that market makers and institutions short options move stocks to the point where the greatest dollar value of contracts will expire) and the reduction dealer gamma exposure.

Excess: A proper end to price discovery; the market travels too far while advertising prices. Responsive, other-timeframe (OTF) participants aggressively enter the market, leaving tails or gaps which denote unfair prices.

Value-Area Placement: Perception of value unchanged if value overlapping (i.e., inside day). Perception of value has changed if value not overlapping (i.e., outside day). Delay trade in the former case.

About

After years of self-education, strategy development, and trial-and-error, Renato Leonard Capelj began trading full-time and founded Physik Invest to detail his methods, research, and performance in the markets.

Additionally, Capelj is a Benzinga finance and technology reporter interviewing the likes of Shark Tank’s Kevin O’Leary, JC2 Ventures’ John Chambers, and ARK Invest’s Catherine Wood, as well as a SpotGamma contributor, helping develop insights around impactful options market dynamics.

Disclaimer

At this time, Physik Invest does not carry the right to provide advice. In no way should the materials herein be construed as advice. Derivatives carry a substantial risk of loss. All content is for informational purposes only.