Physik Invest’s Daily Brief is read by over 1,200 people. To join this community and learn about the fundamental and technical drivers of markets, subscribe below.
Fundamental
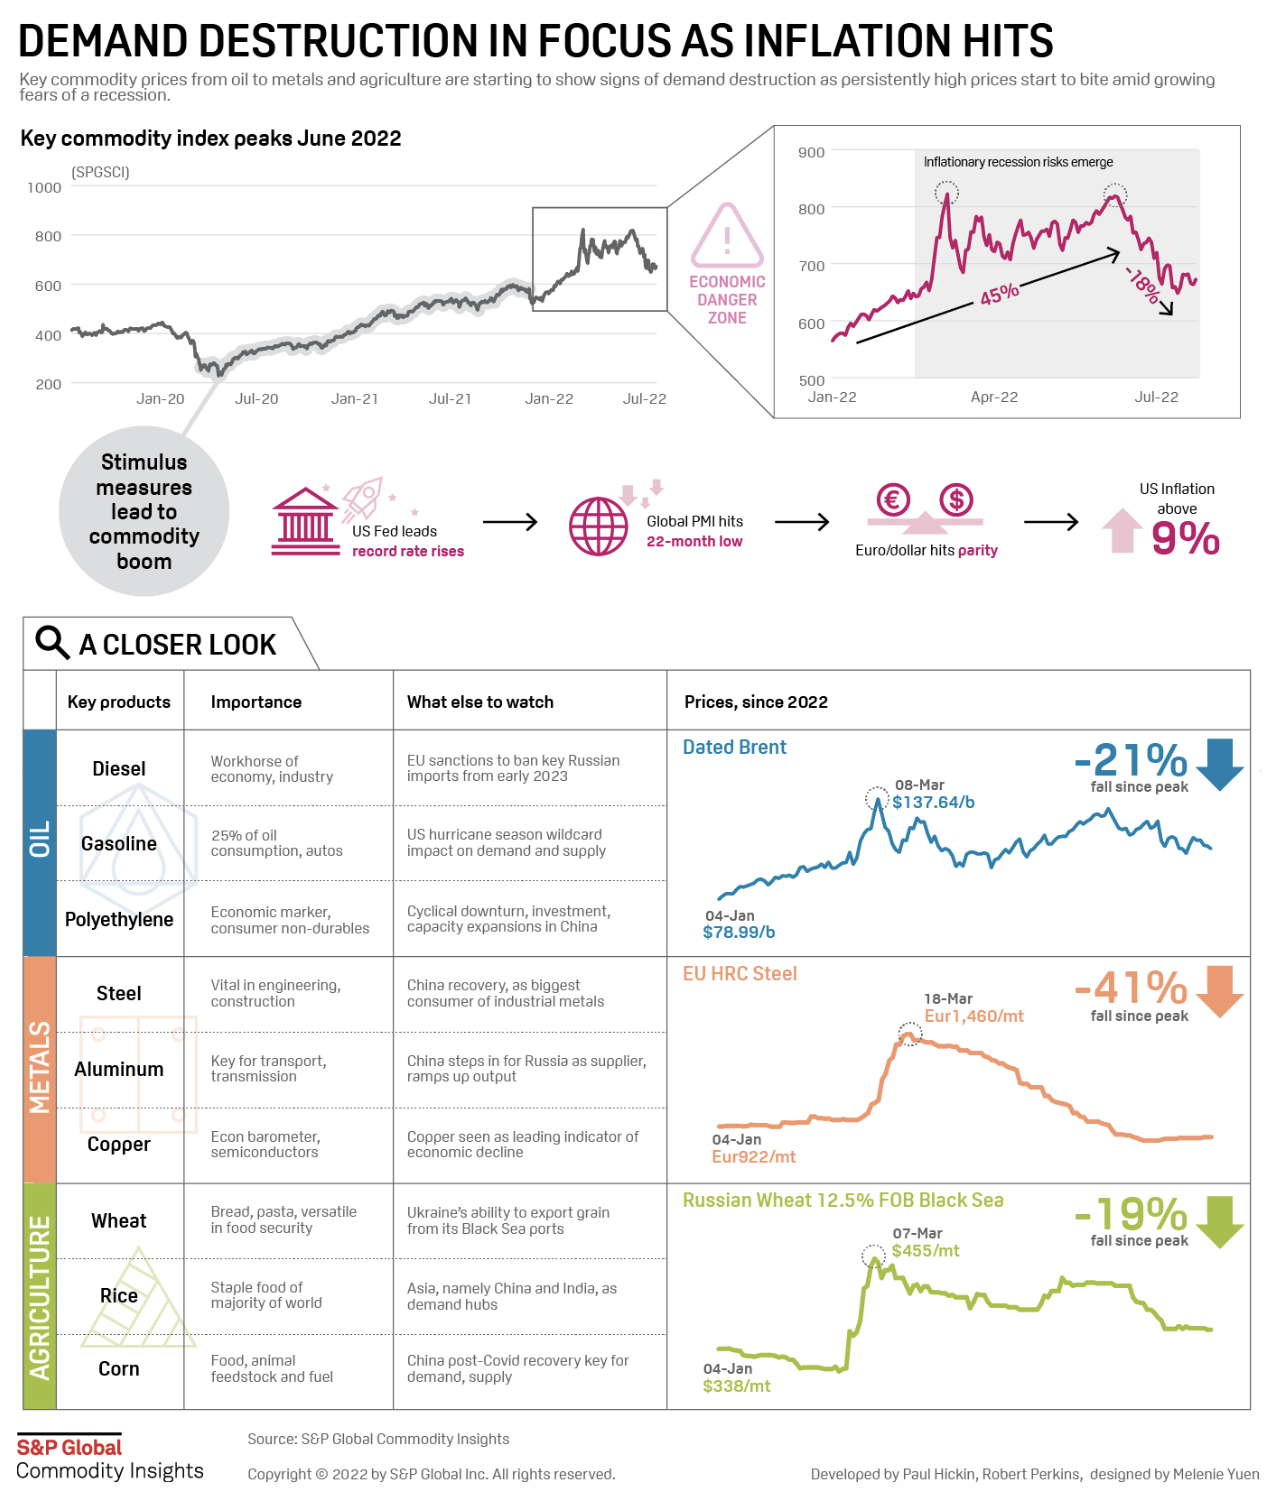
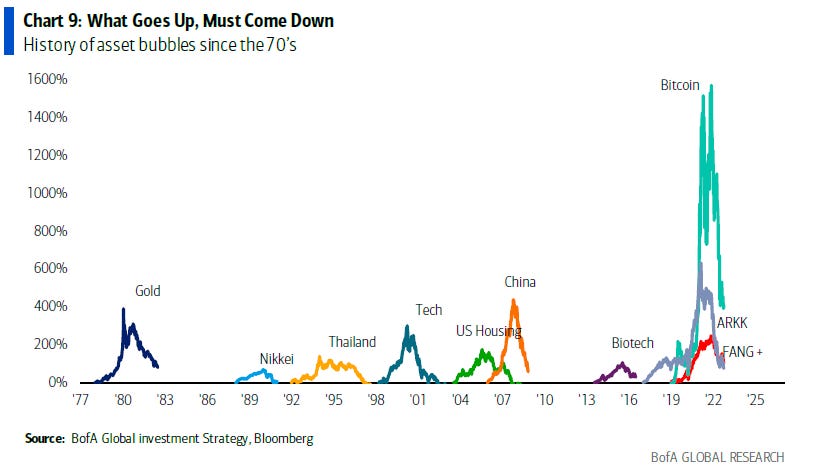
S&P Global Inc (NYSE: SPGI) put it really well in a recent update comparing today to the events of the mid-to-late 1630s. Dutch tulip bulbs traded as high as $750,000 per bulb (today’s money) before collapsing to near-zero.
That’s akin to what happened with the non-fungible token (NFT) craze of the late 2010s and early 2020s. Pictures of rocks sold for millions as recently as last year. Those pictures are worthless, now, and this has done a bit to dent the ecosystem’s apparent value, as well.
What’s going on to cause this:
It’s basically the case that easy money policies enabled market participants to borrow and fund longer-duration bets on ideas with (potential) promise in the future.
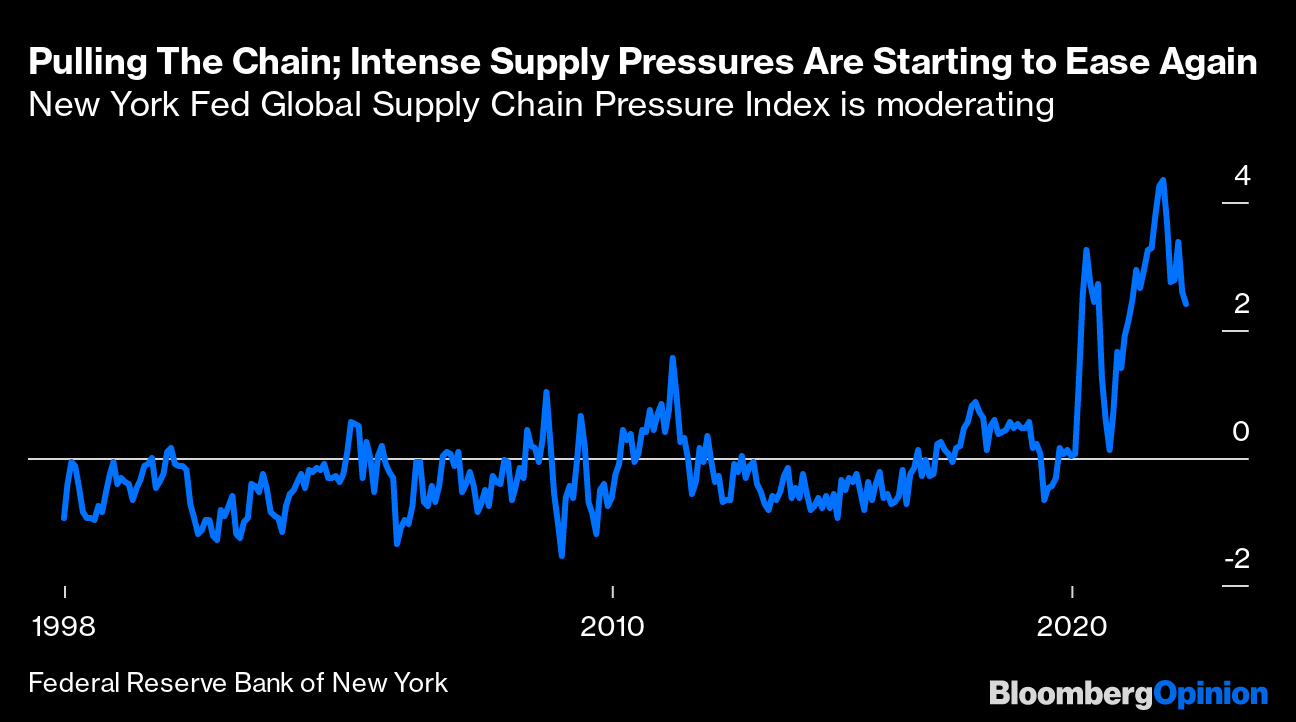
Financial asset investments, too, were far more attractive, and that’s why we saw the asset inflation accelerate, followed by goods and services inflation that was bolstered by chokepoints and trends (e.g., deglobalization via supply chain security and geopolitics) and, ultimately, prompted policymakers to pivot.
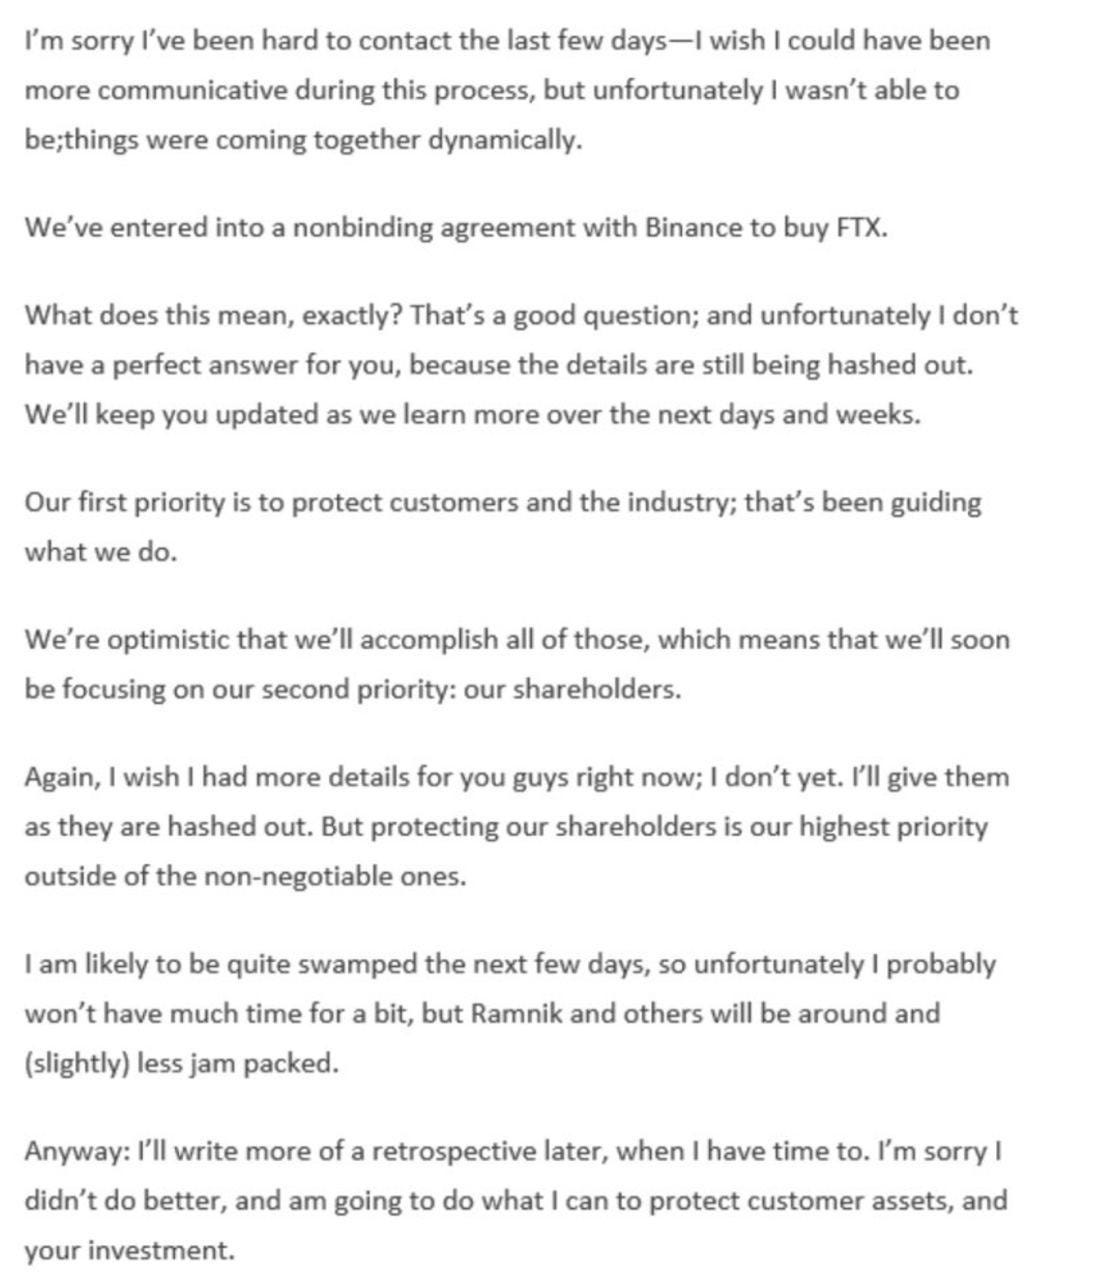
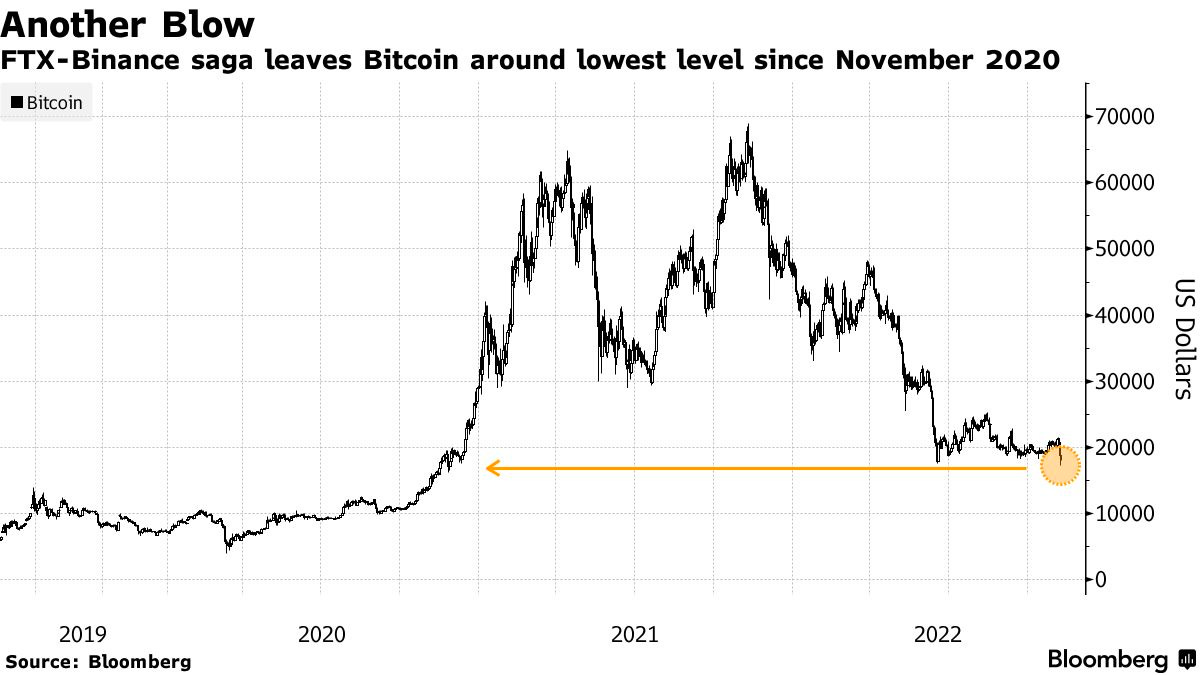
FTX (CRYPTO: FTT) is among the victims of this pivot. It’s apparent that the events surrounding the collapse of crypto ecosystems months back prompted a so-called “credit crunch,” an insider close to FTX’s leadership explained.
“Many loaners suddenly recalled all of their loans just to see who was still liquid. Alameda lost a lot from giving out loans to firms [that] defaulted. Alameda was now, also, on the hook for money they didn’t have since they had given a lot of the loan money to FTX or had lost it loaning to now bankrupt counterparties. [Founder and CEO Sam Bankman-Fried] had two choices at this point, let Alameda get liquidated or send user money from FTX to ensure Alameda’s survival.”
Bankman-Fried, a massive risk taker at heart, chose the latter.
The repercussions include the following:
Apart from “strong governance and transparency [to] grow in importance as the cryptocurrency industry attempts to reassure investors and customers, … regulation of cryptocurrency markets, which was already a matter of serious debate, could accelerate,” SPGI explained, noting that some “other areas of the decentralized finance [or DeFi] market may be affected. And lastly, these contagion effects are unlikely to ripple into traditional finance [or TradFi].”
Check out Reuters (FTX bankruptcy filings in, French central bank wants quick regulation) and The Information (Startups should prepare for ‘second order fallout’ from FTX collapse).
Simplify Asset Management’s Michael W. Green (who we quoted in the past for his perspective and belief that we are in “a dot-com type collapse” that’s happened “underneath the surface of the indices which is [a result of] … passive flows supporting the largest stocks within the index, whereas the smaller stocks can be influenced to a greater extent by [] discretionary managers”) said a likely result is a Central Bank Digital Currency (CBDC) and an “almost certain … change in the monetary system,” echoing what Kai Volatility’s Cem Karsan said a long-time ago: “I don’t see … a clear window where cryptocurrency is not subject to constraints and I think it’s highly likely that we move towards a digital dollar.”
CBDCs are highly controversial per my chats with the likes of Edge & Node’s Tegan Kline. She said they could “be used as a mass surveillance tool. Leaders have done little to invalidate her beliefs given their recent discussions on, for example, using CBDCs to derive “carbon footprint.”
That means having a read on where people are “traveling, how are they traveling, what are they eating, what are they consuming … This is something we’re working on,” leaders have put forth.
The point of this all is as follows:
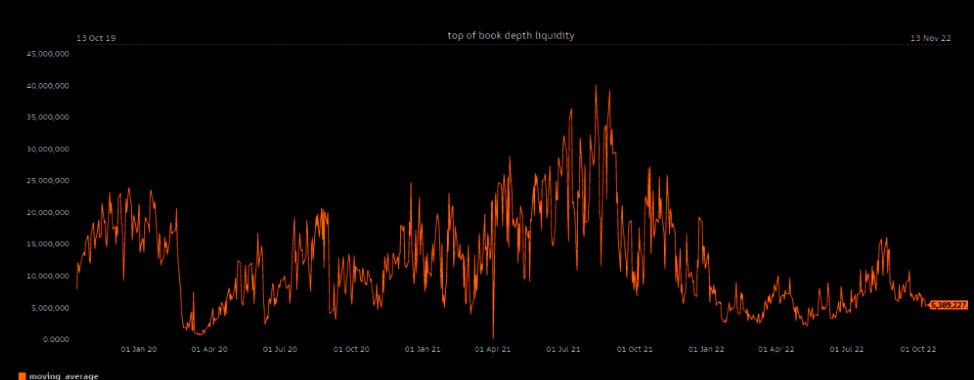
As many may know, “there’s no ultimate buyer” in spaces like crypto and DeFi, as ex-Goldman Sachs Group Inc (NYSE: GS) emerging market FX and yield trader Seraphim Czecker, who is now heading risk and product management at Euler Labs, said.
It’s that and the persistent interest in illiquid products that leave the door open to manipulation. Barring illiquidity, “if there’s a 10 or 15 standard deviation move, the liquidity will allow for … you [to] offload those assets quickly.”
However, that’s not the widespread case.
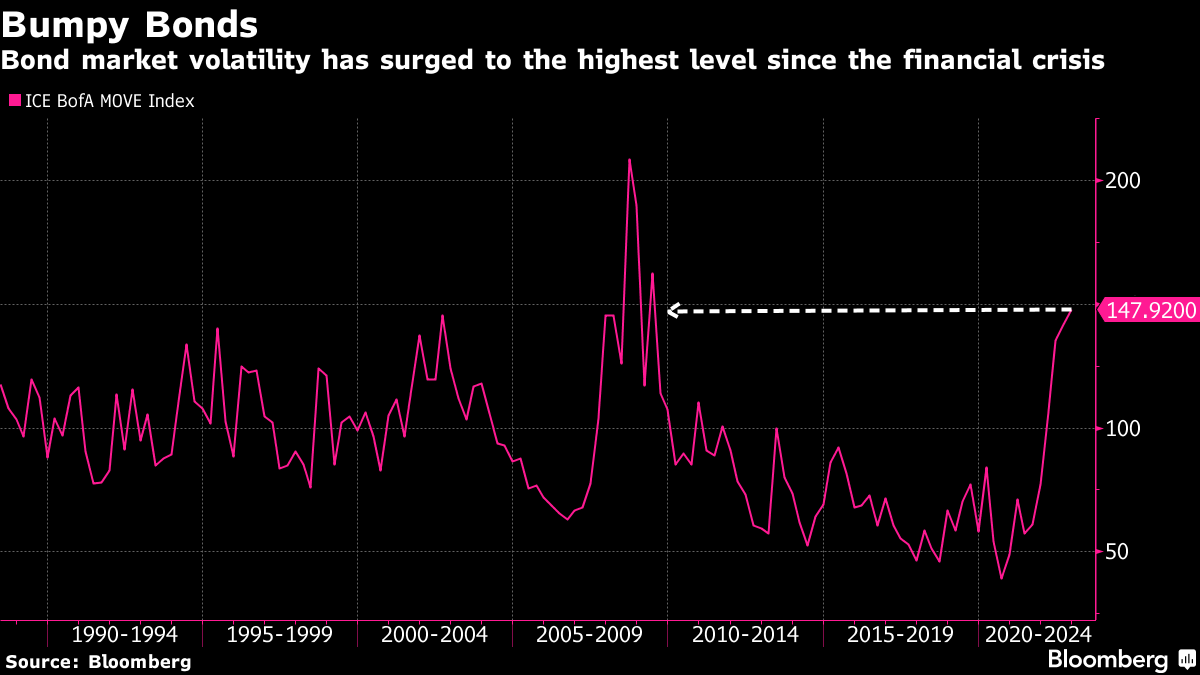
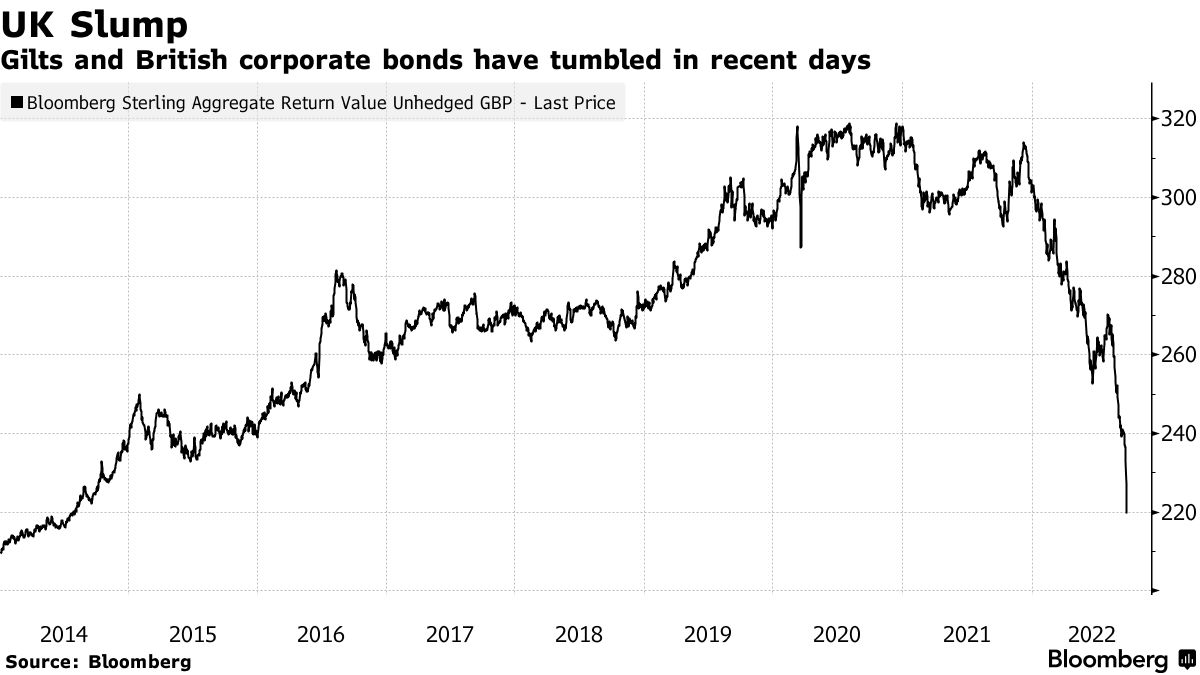
“For example, look at what happened in the UK with the pension funds and margin calls. That is a classic DeFi strategy. You take your bonds and borrow cash against them. Then, you put it back into bonds and loop it a couple of times. That way, you have a leveraged interest rate exposure. That’s the same principle of lending staked Ethereum (CRYPTO: ETH), borrowing ETH, and doing it a couple of times.”
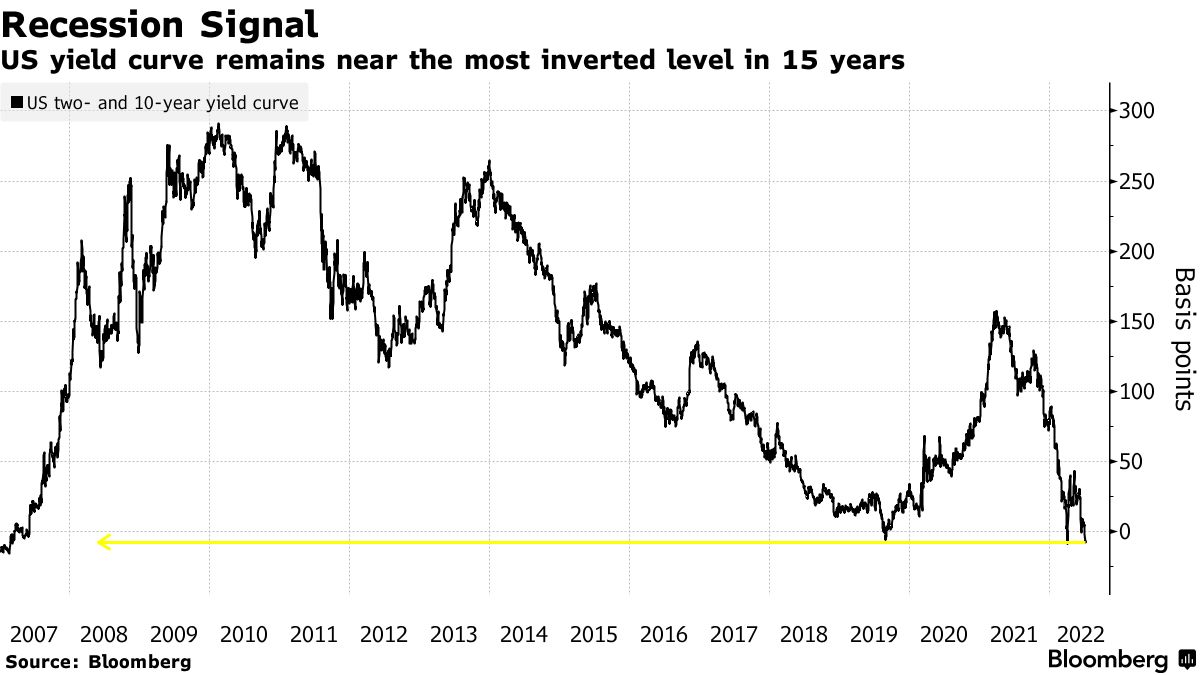
So, there may be “second order fallout” amid all this tightening. Markets, everywhere, are to de-rate. Ultimately, there’s probably a pivot to happen, in the future, with many leaders and strategists in finance unable to agree whether that (pivot) is the result of a recession.
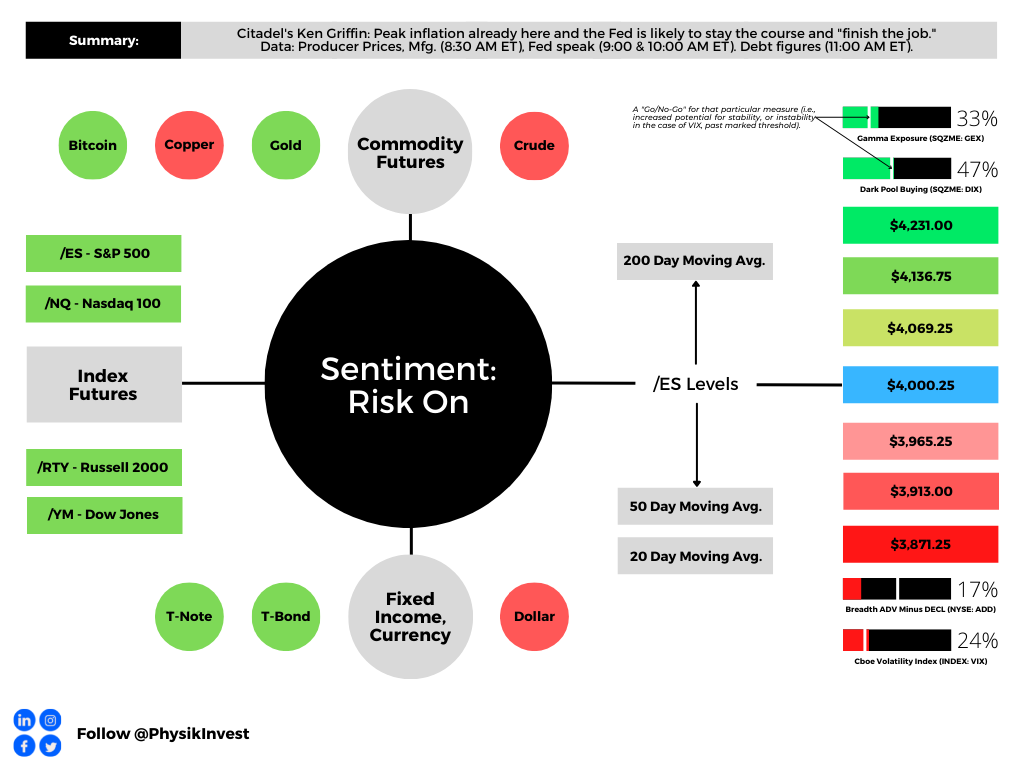
“To take the foot off the brake right now and not finish the job, I think it’s the absolute worst mistake that the Fed could possibly make,” Citadel’s Ken Griffin said at the Bloomberg New Economy Forum in Singapore. In spite of Citadel seeing a recession averted, Griffin said: “I am finding it a bit hard to believe we are not going to have a recession at that point of time, sometime in the middle to back half of 2023,” adding this year finishes with “modest growth.”
Those in agreement include Stanley Druckenmiller, who once managed George Soros’ funds. “You don’t even need to talk about Black Swans to be worried here. To me, the risk-reward of owning assets doesn’t make a lot of sense,” Druckenmiller said.
“When you make a mistake, you got to admit you’re wrong and move on that nine or 10 months, that [policymakers] just sat there and bought $120 billion in bonds,” he added. The “repercussions of that are going to be with us for a long, long time.”
Positioning
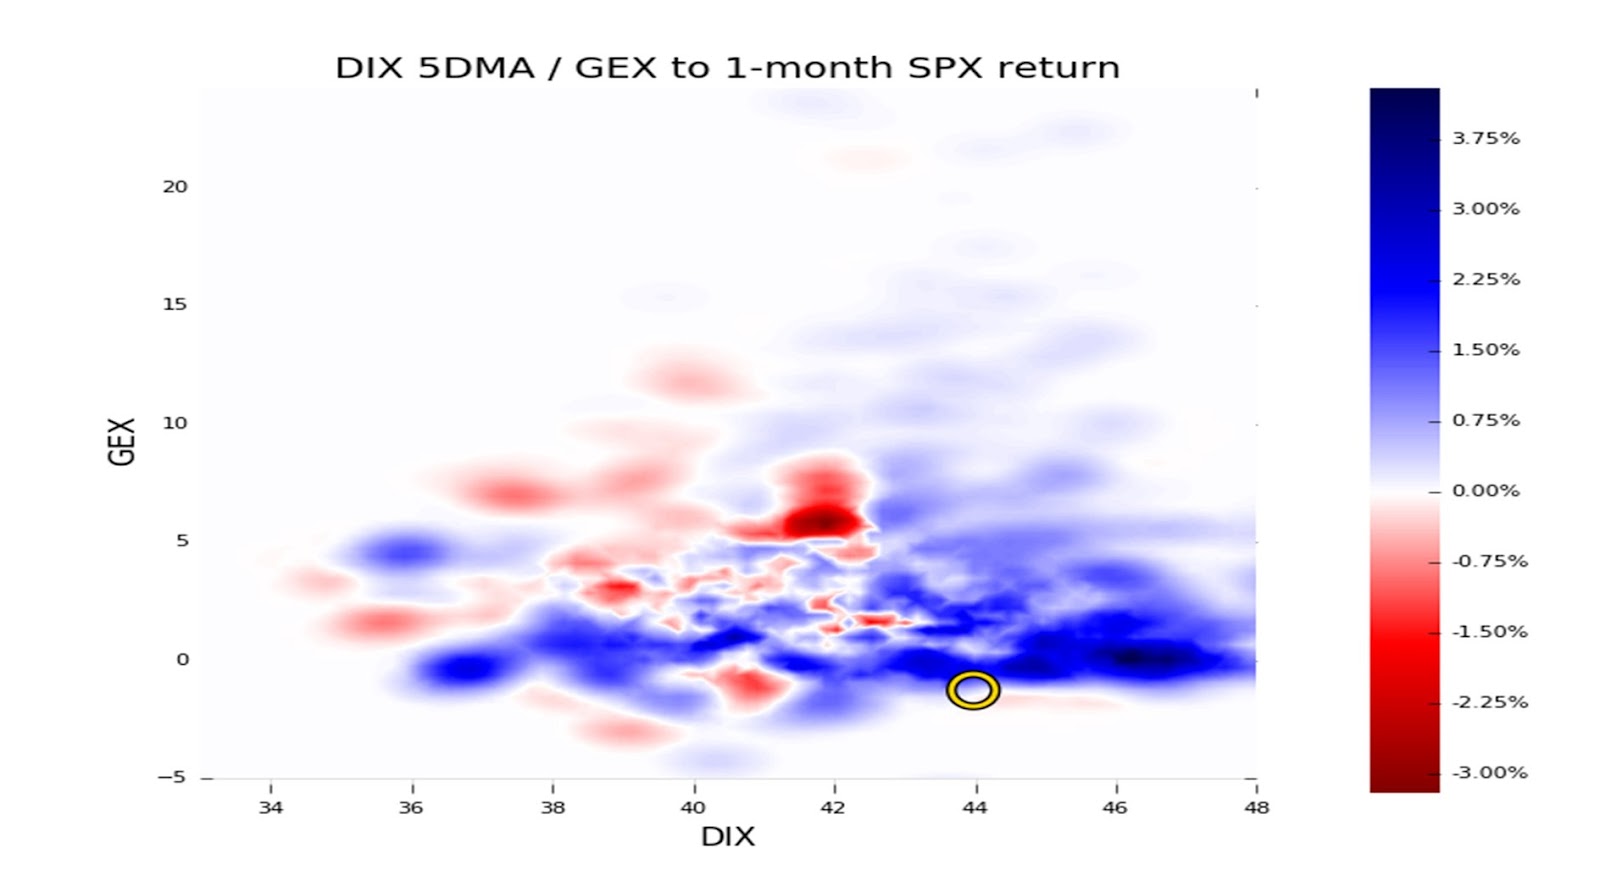
From a positioning perspective, much of what we’ve discussed in past notes is still true. Among others, Goldman Sachs Group Inc calculates up to $40 billion in buying over the next weeks with more than $80 billion of buying in an up market.
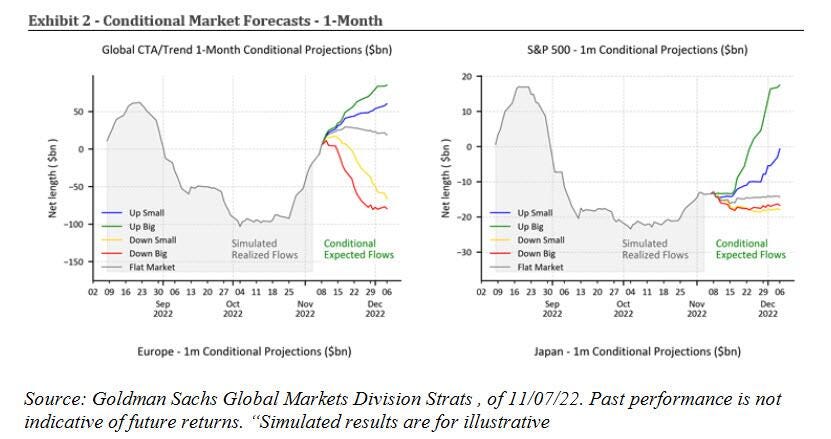
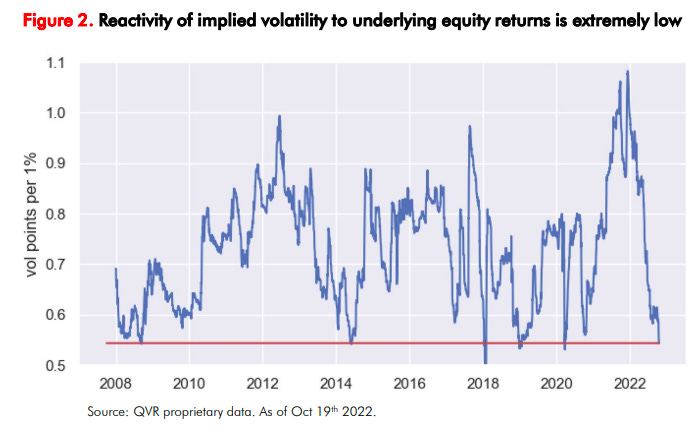
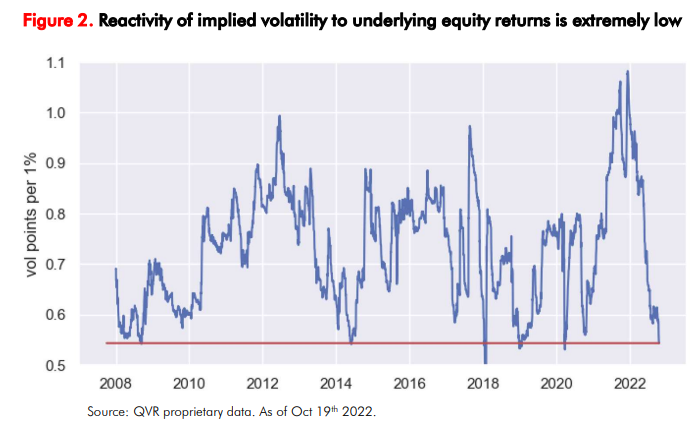
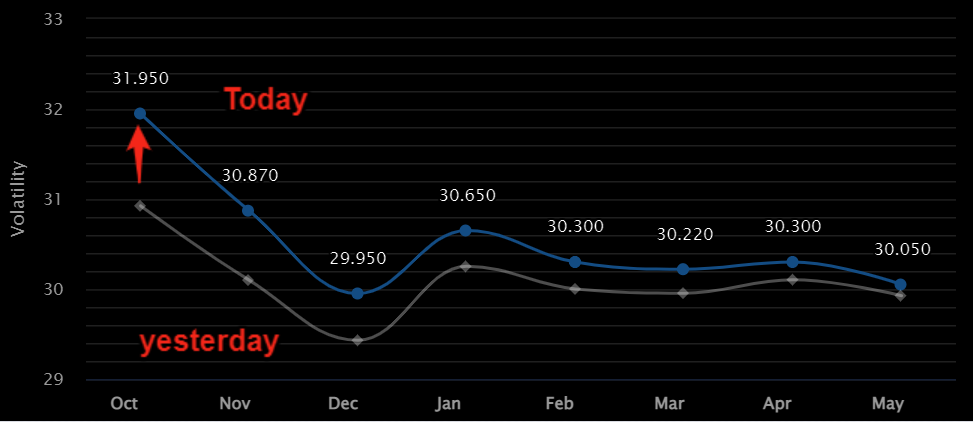
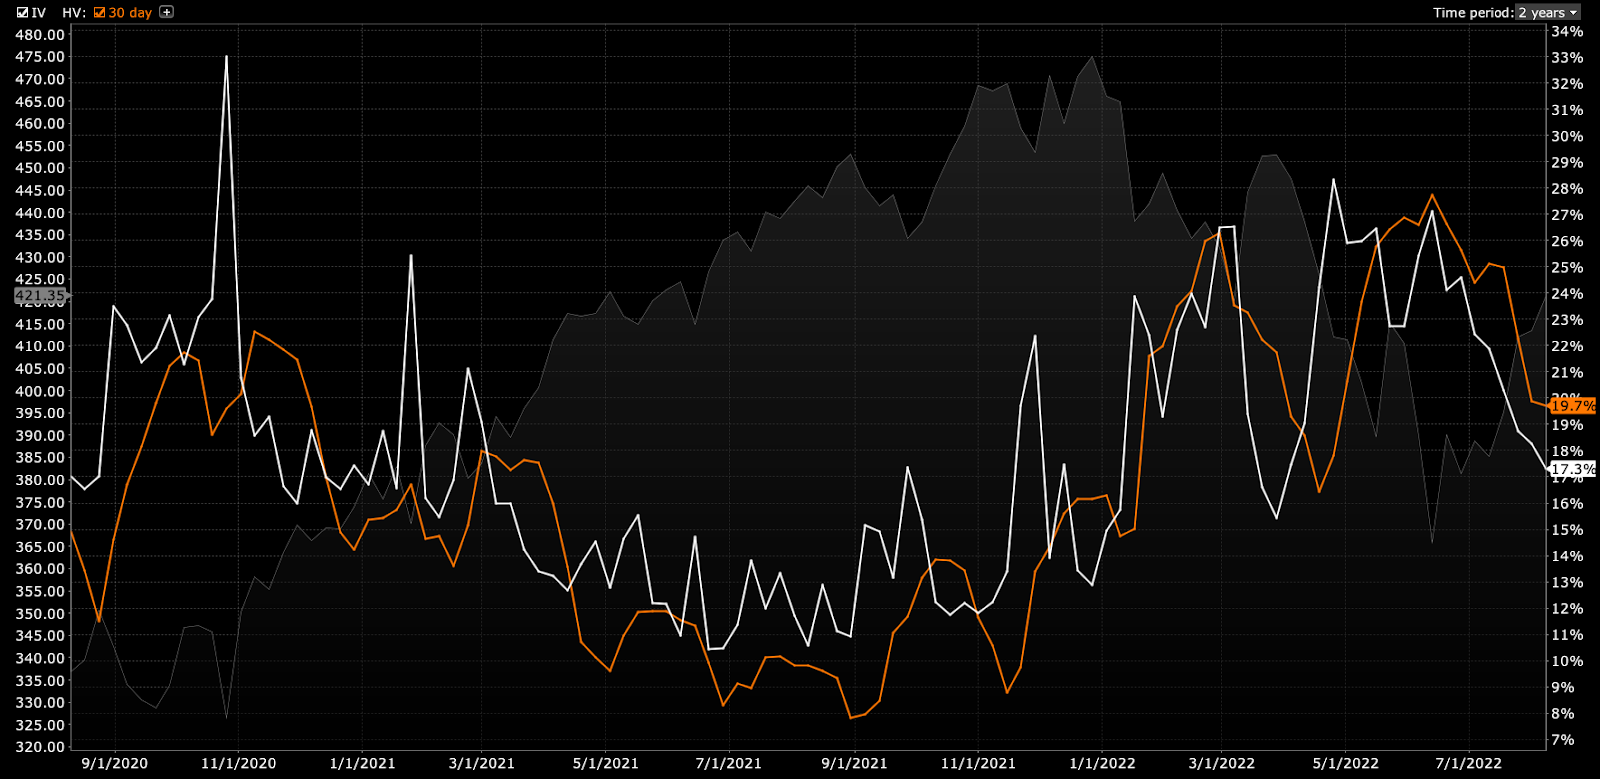
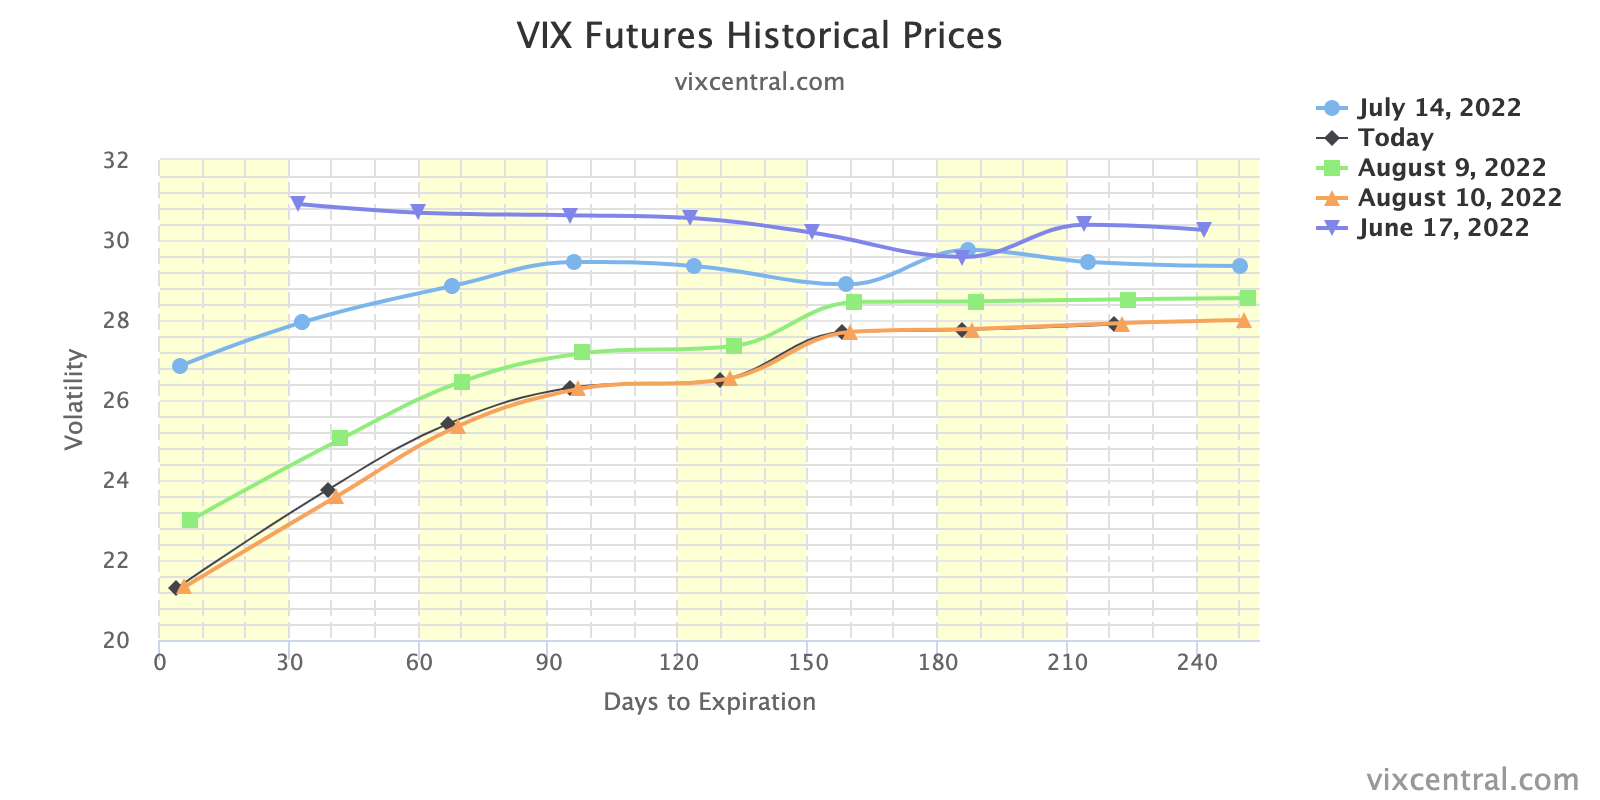
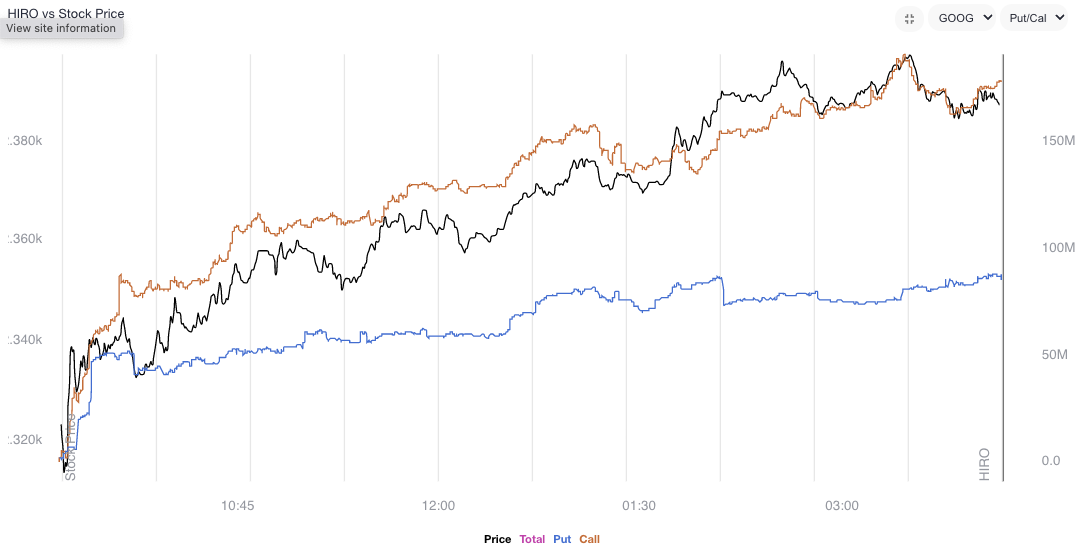
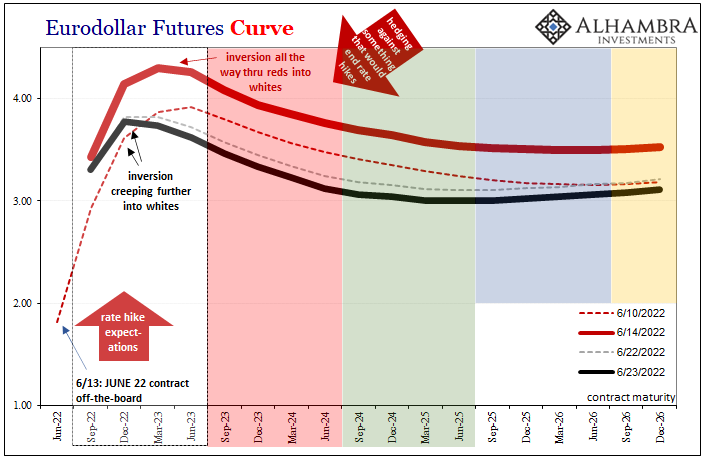
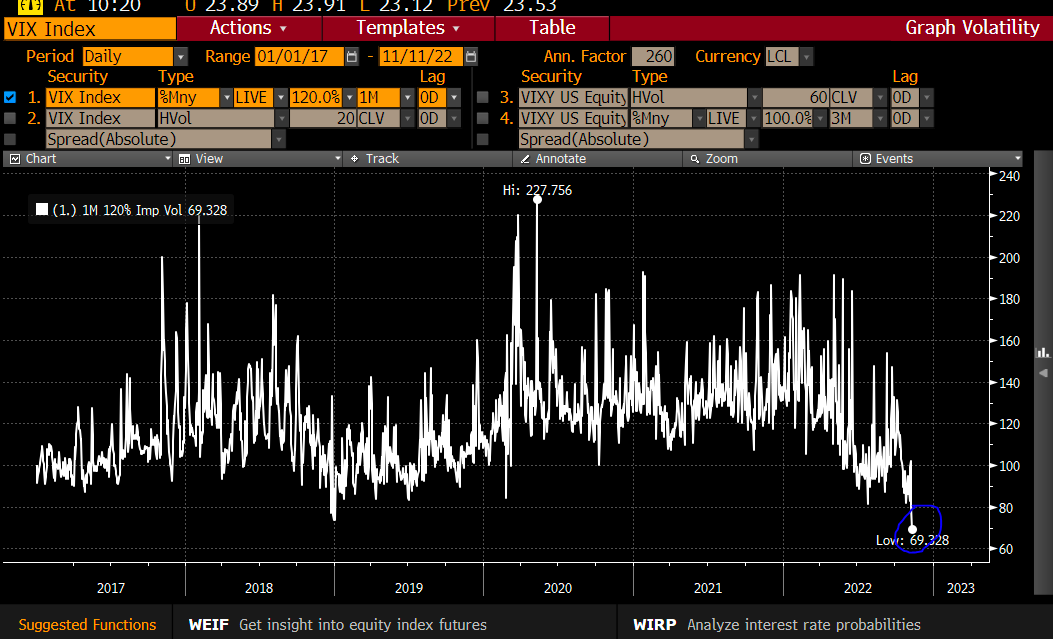
This is pursuant to our statements on the compression of implied volatility (evidenced by a shift lower in the term structure, particularly at the front end where options are most sensitive) compounding macro-type repositioning, with follow-on support coming from the reach for “Deltas and leverage” to the upside (call options).
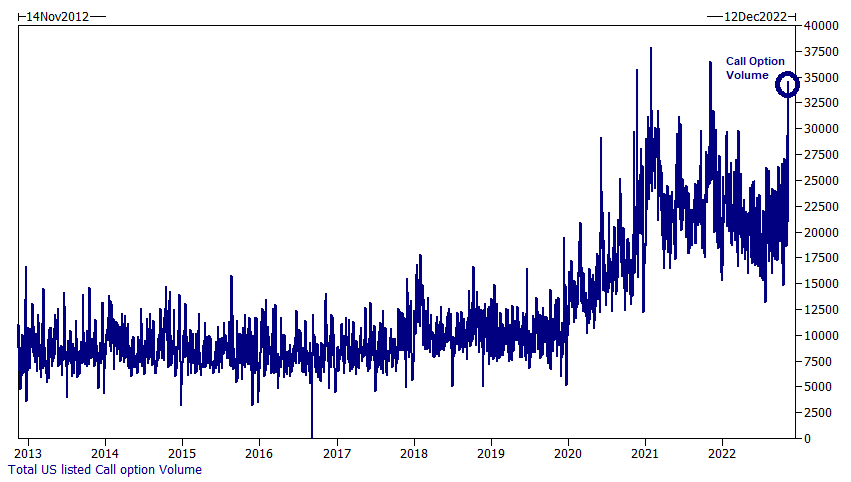
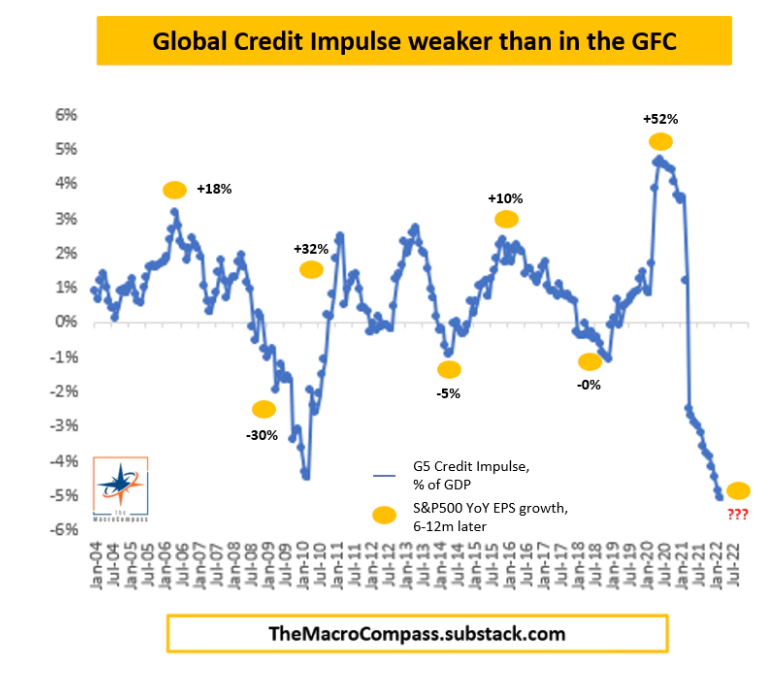
As Alfonso Peccatiello of The Macro Compass puts it well: “incentive schemes drive people to be much more willing to pay and chase upside.”
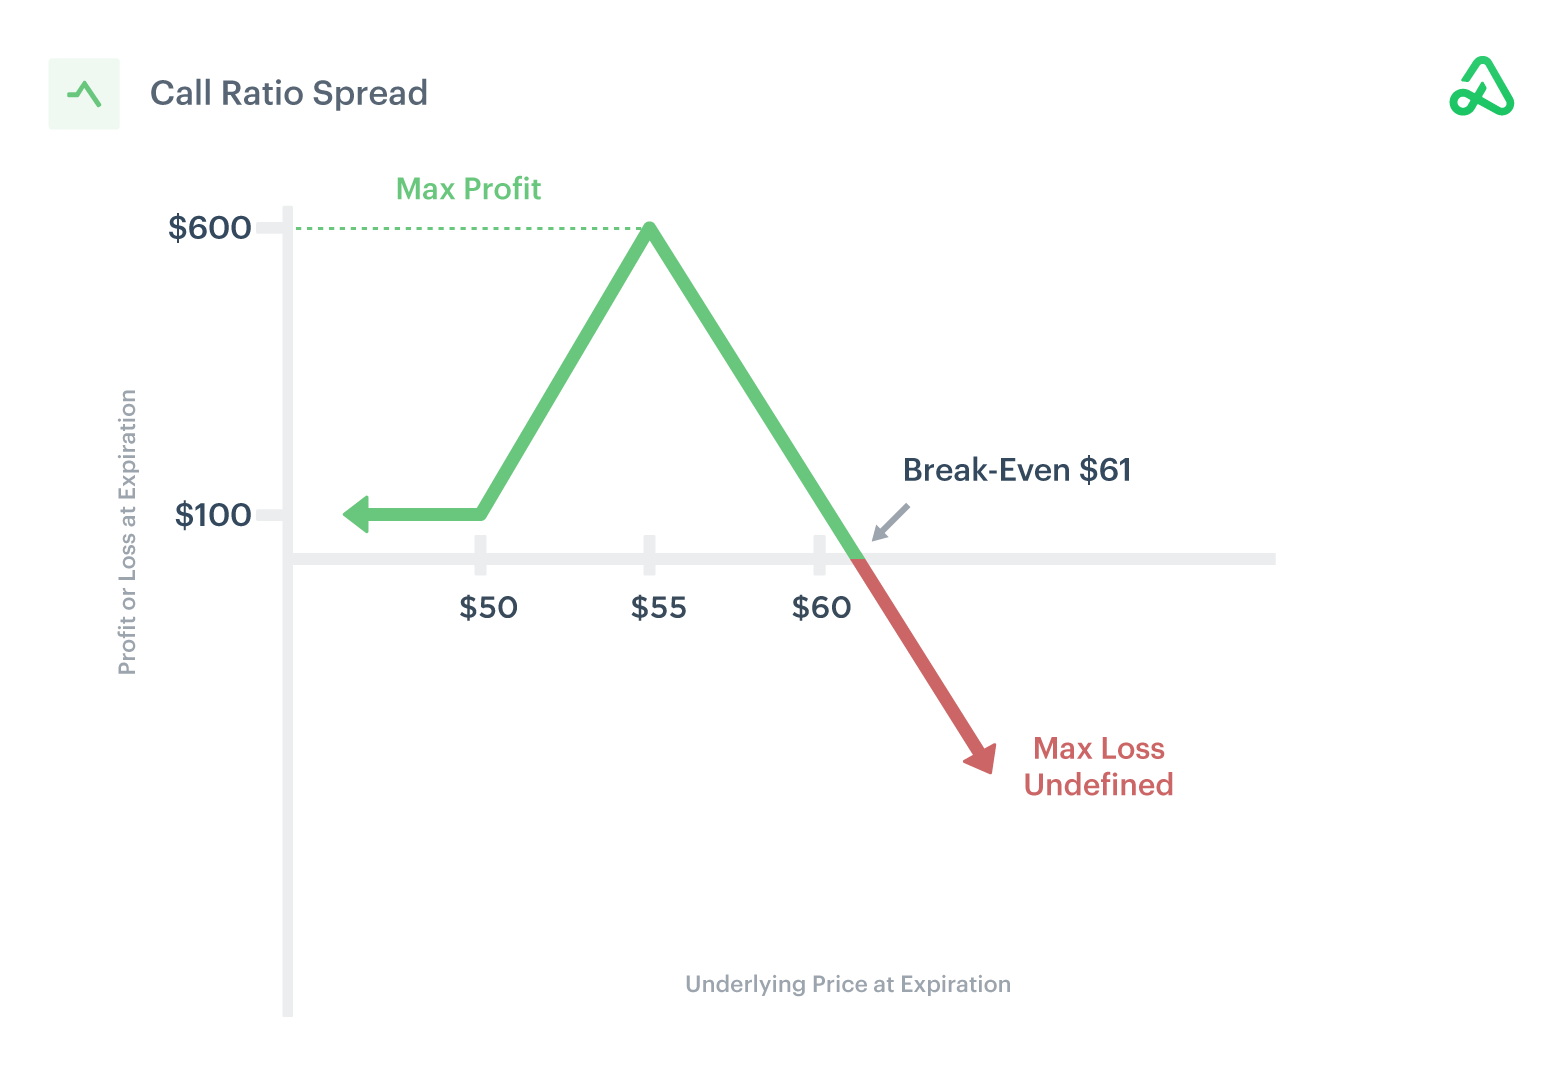
Preferred are “convex structures” that would benefit from rallies.
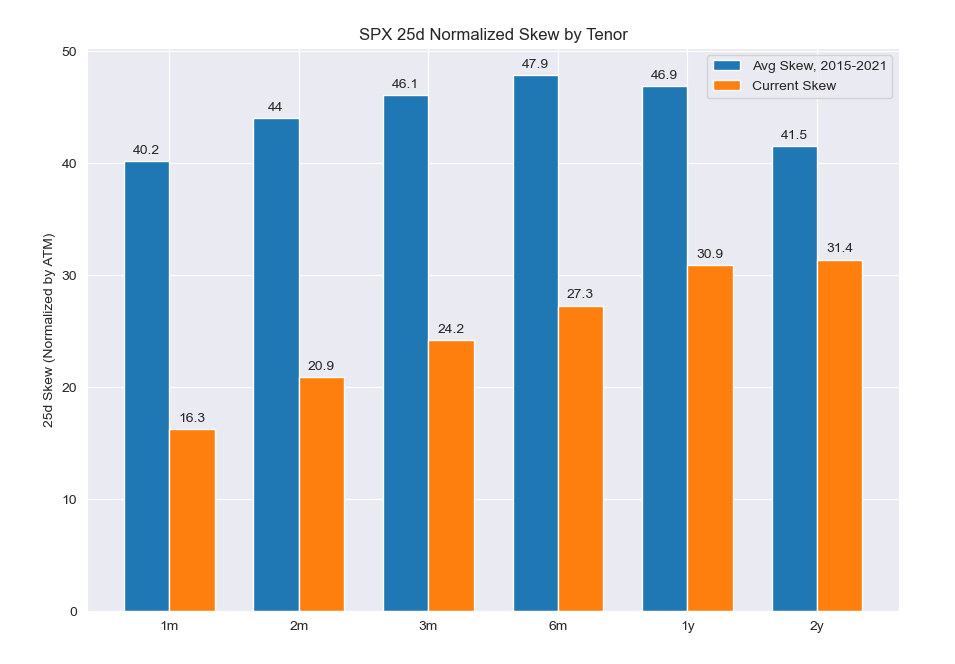
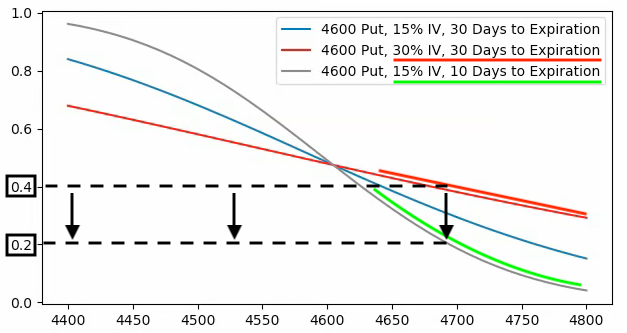
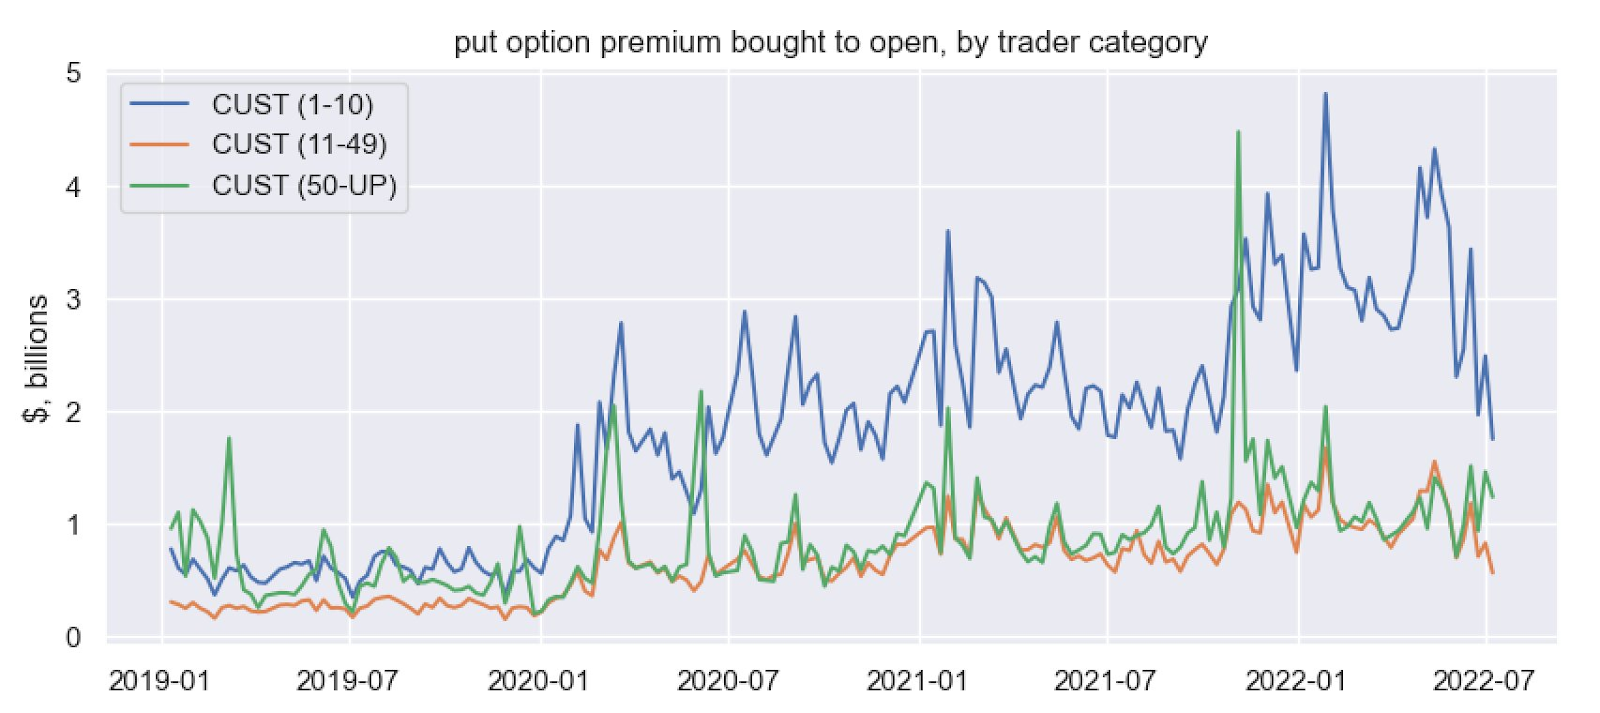
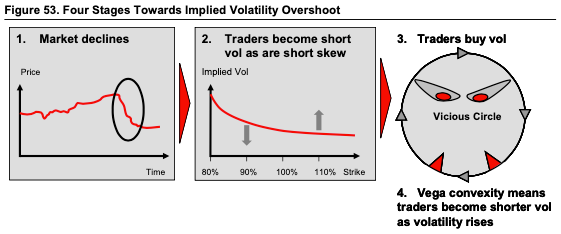
However, in traders’ monetization of put protection they owned, as well as reach for upside calls (to not miss out on a potential reversal), skew is at its lows.
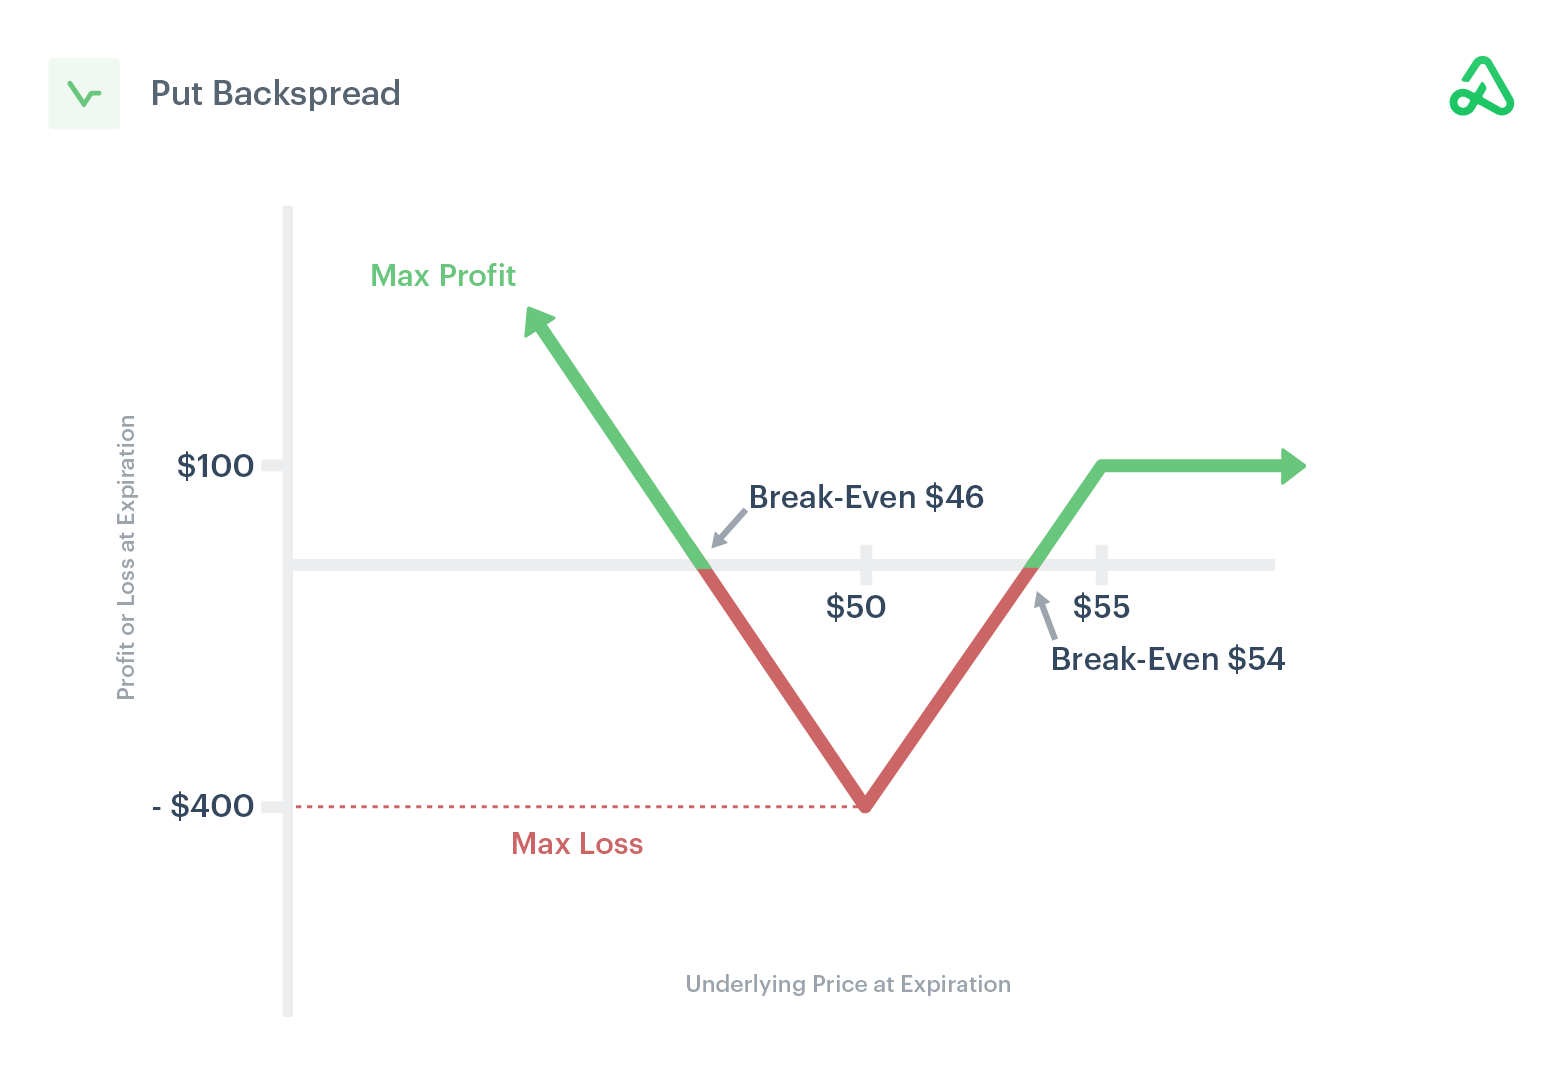
If the assumption is that “further tightening monetary policy and draining liquidity off the market might cause some problems down the road,” per Fabian Wintersberger, downside convexity (bets that trade non-linearly to changes in underlying price and volatility) are attractive.
Trades that may be attractive include collars, as well explained in a recent thread by IPS Strategic Capital’s Pat Hennessy.
“[T]he combination of historically flat skew [and] the highest rates we’ve seen in 15 years makes longer dated collars an attractive trade for those who are worried about the performance of stocks over the next year but do not want to sell or try timing the market.”
Technical
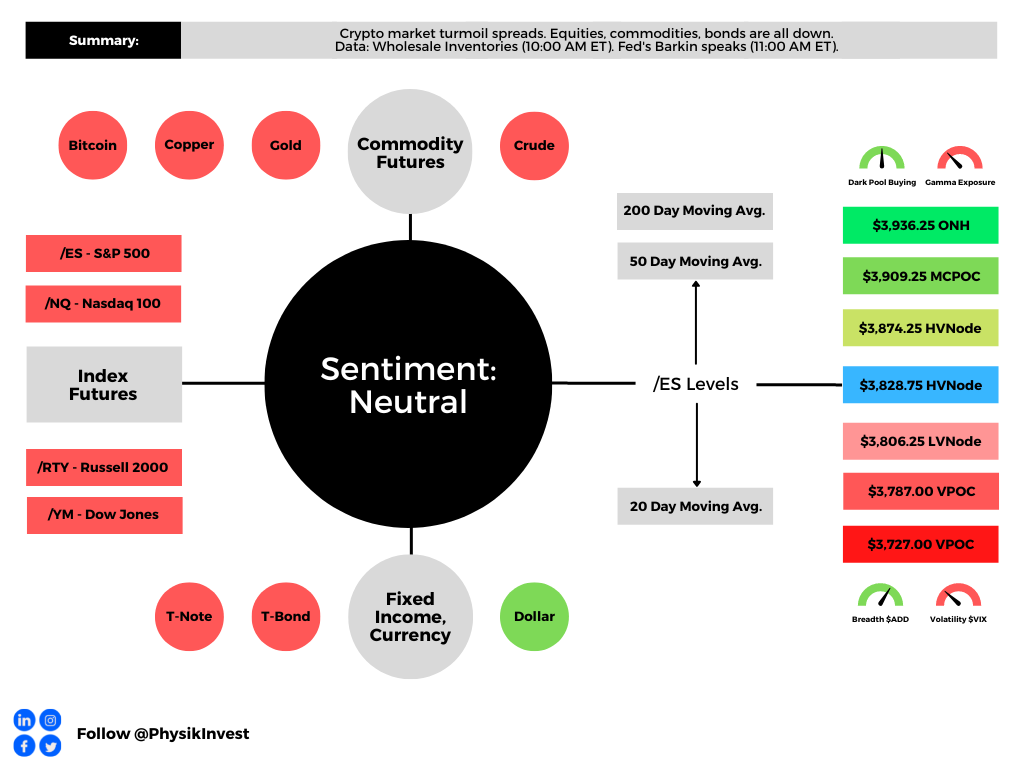
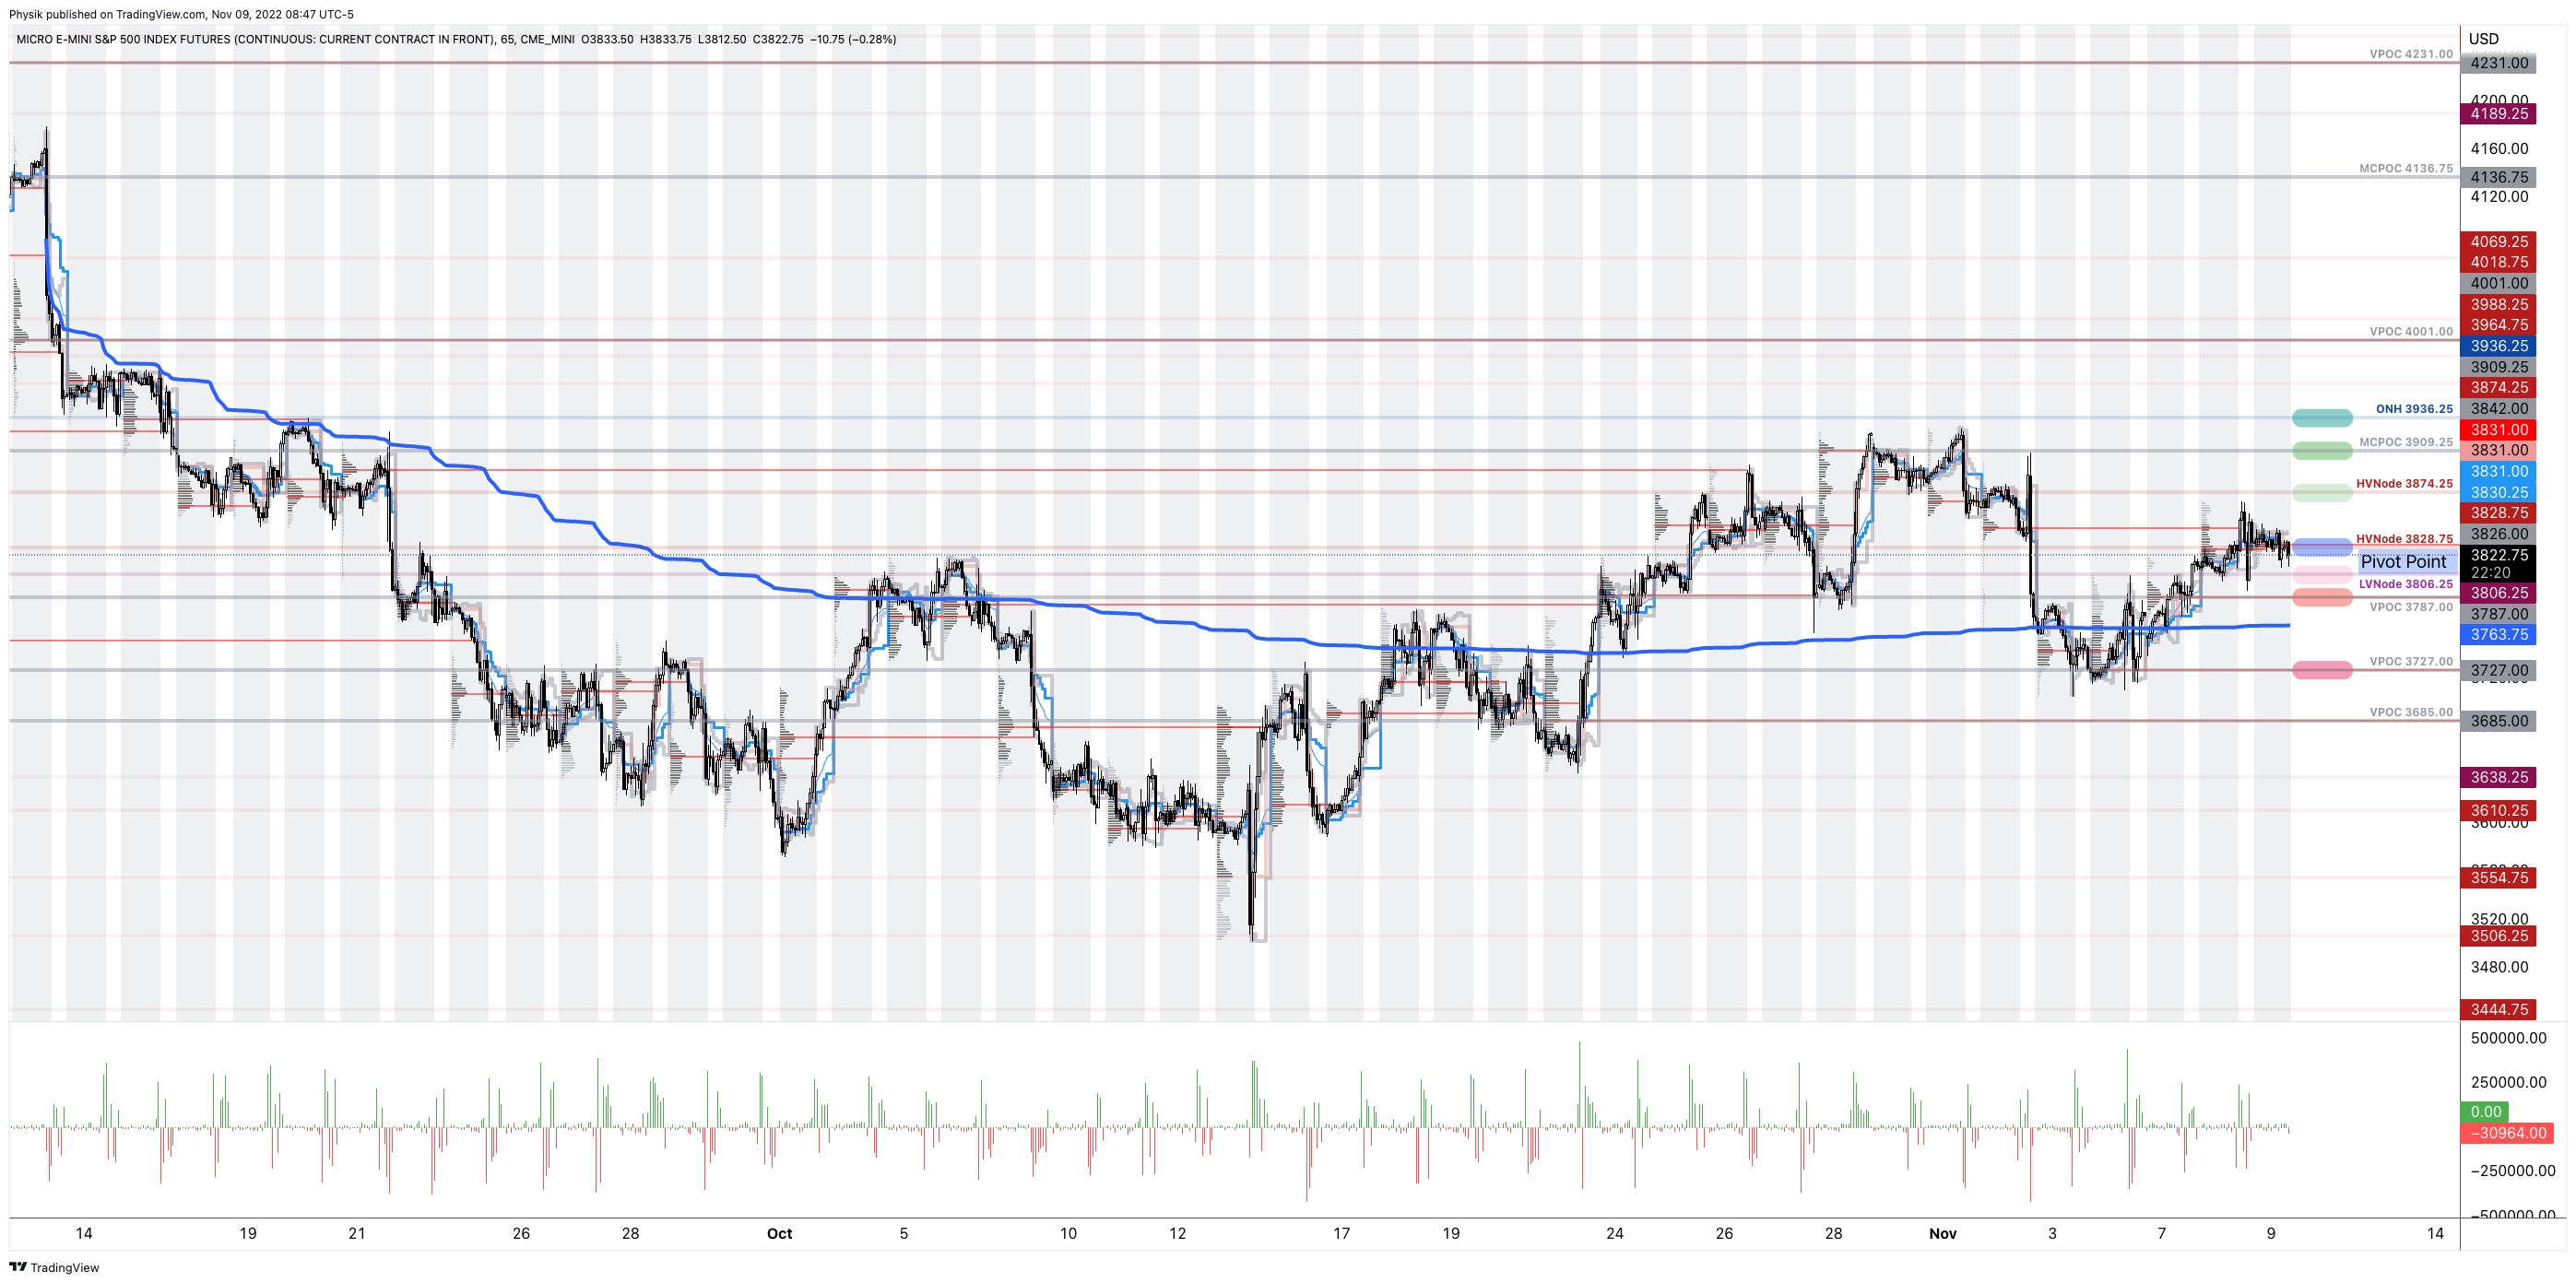
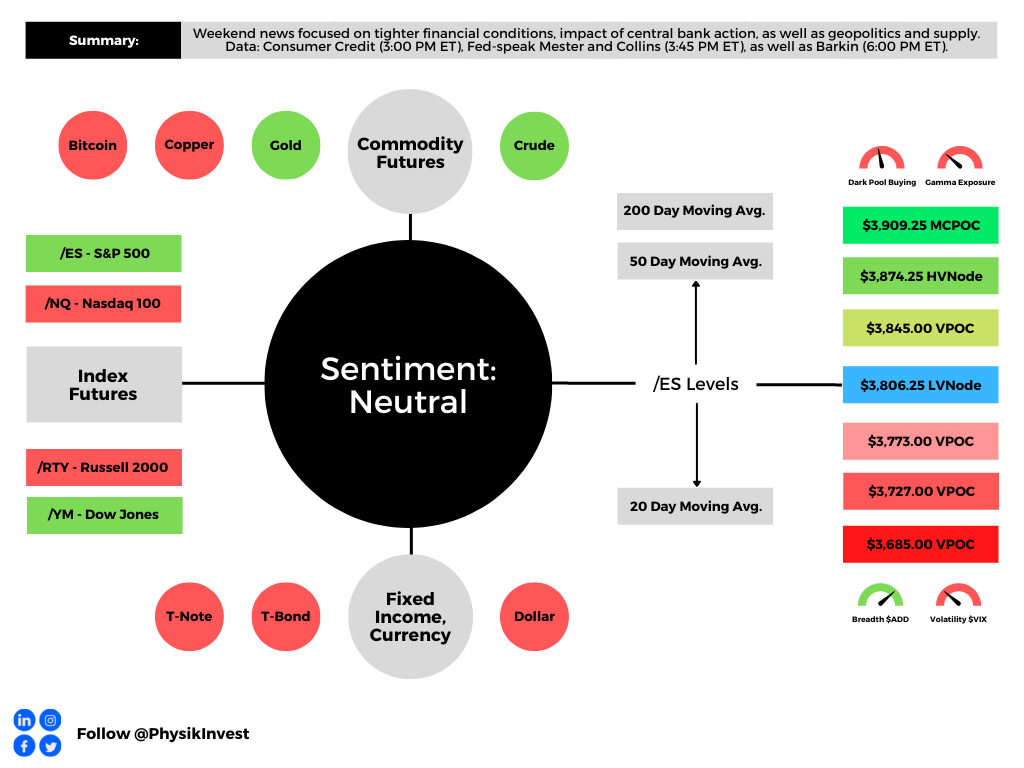
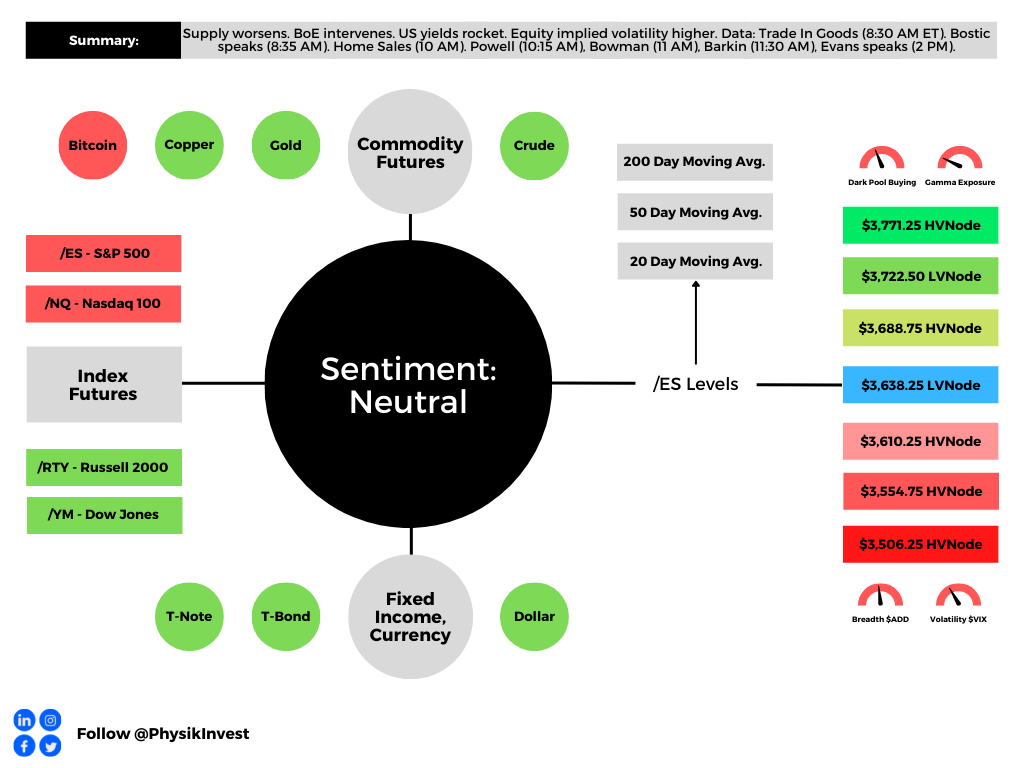
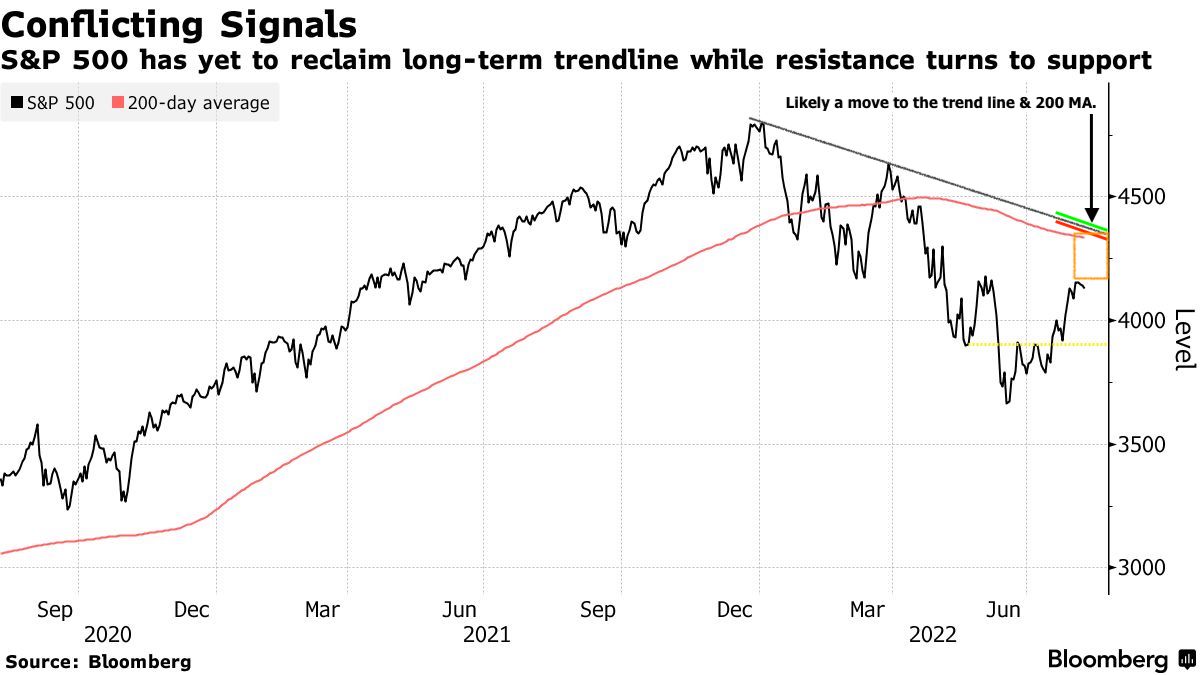
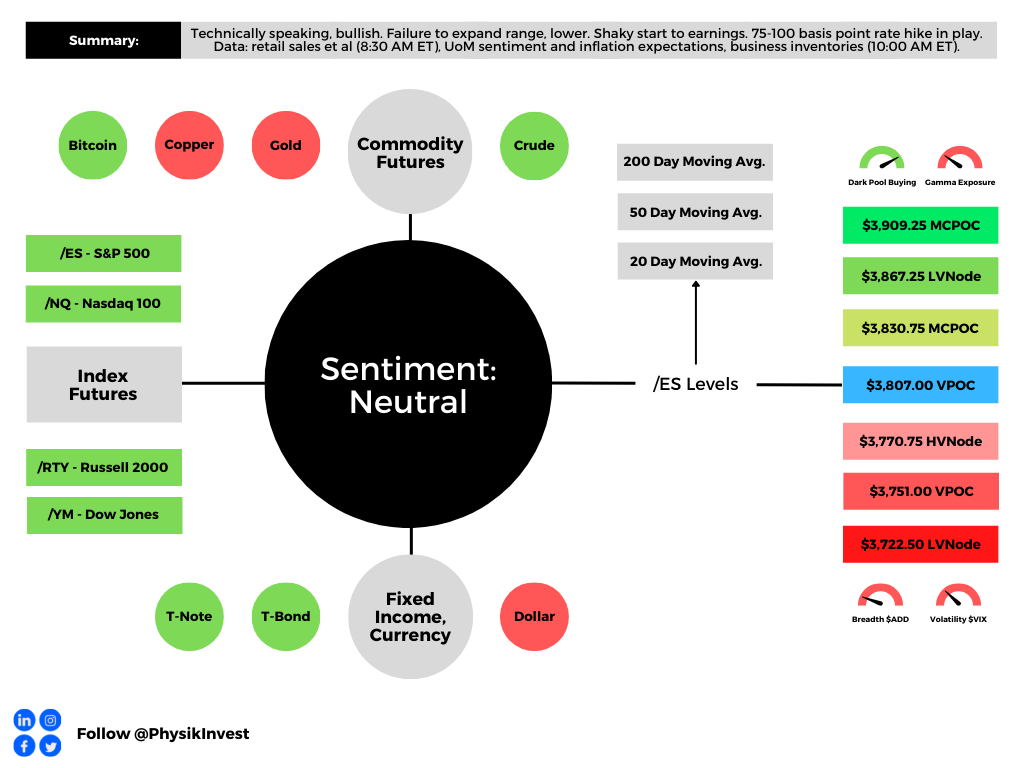
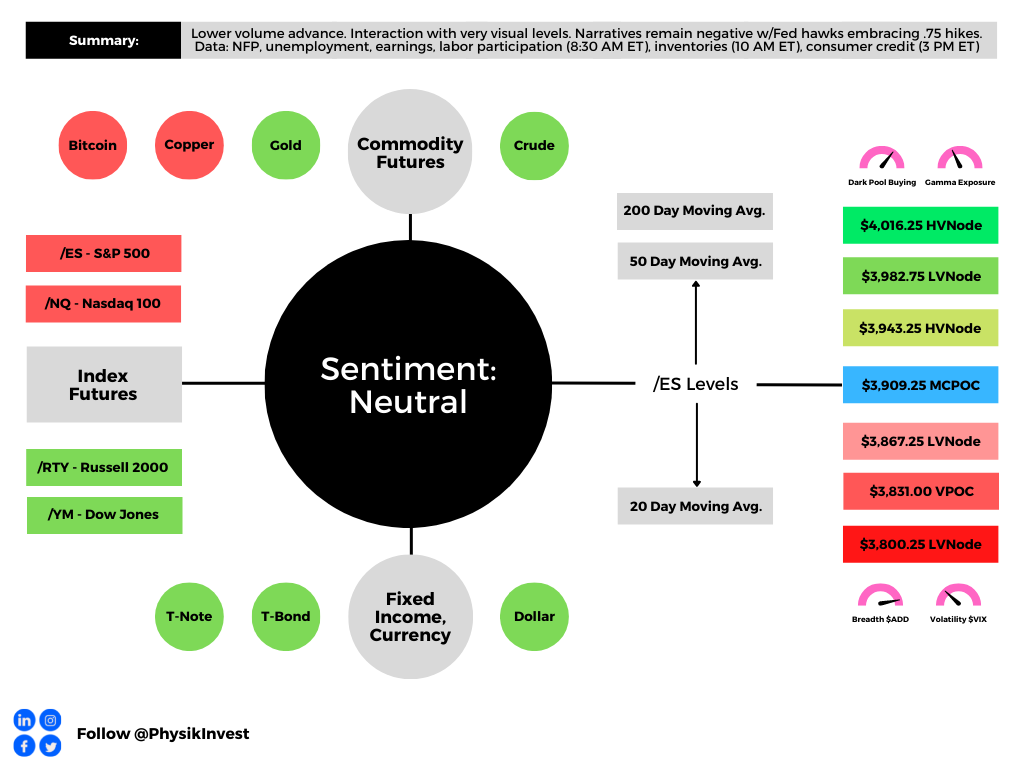
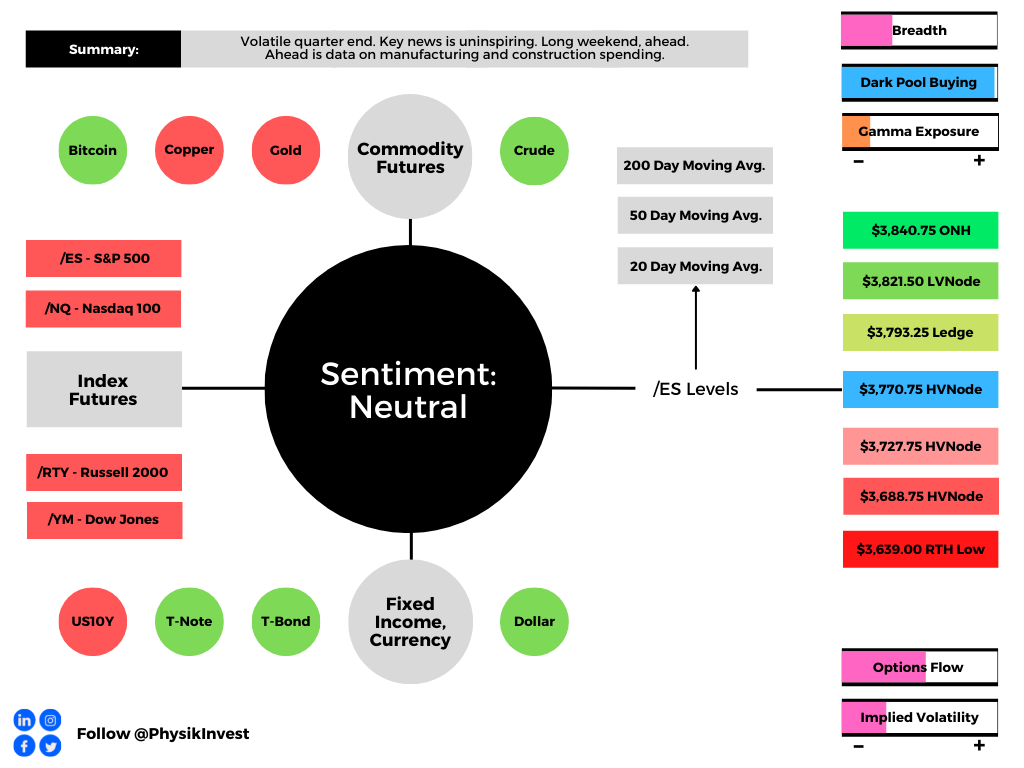
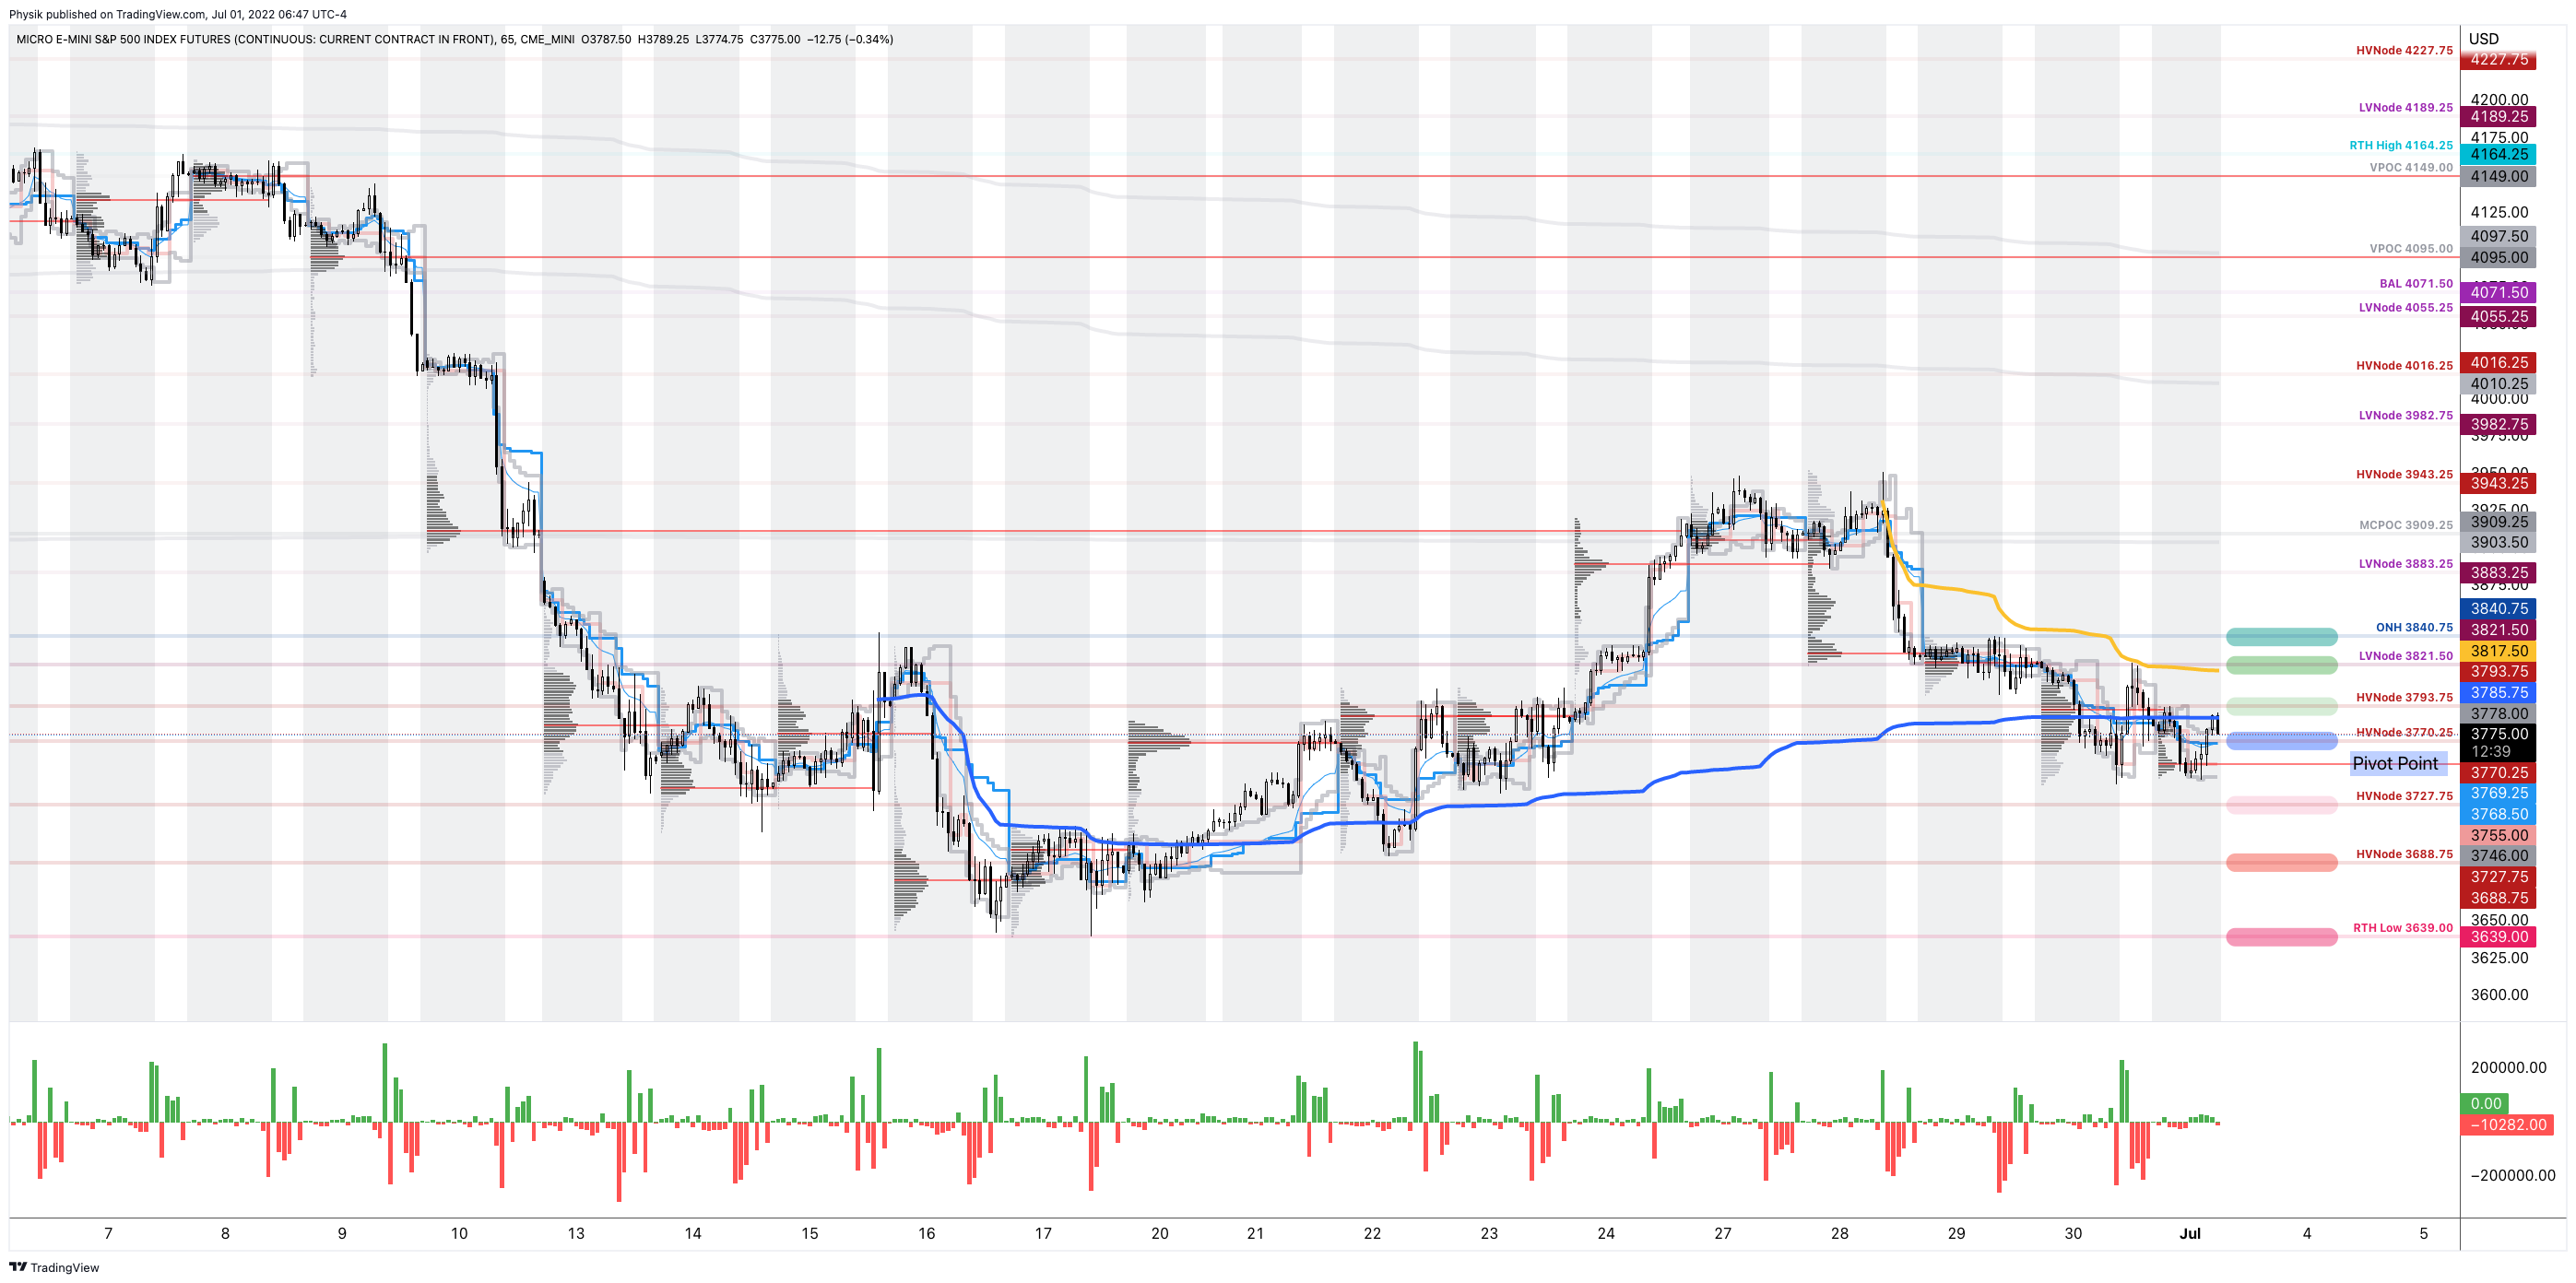
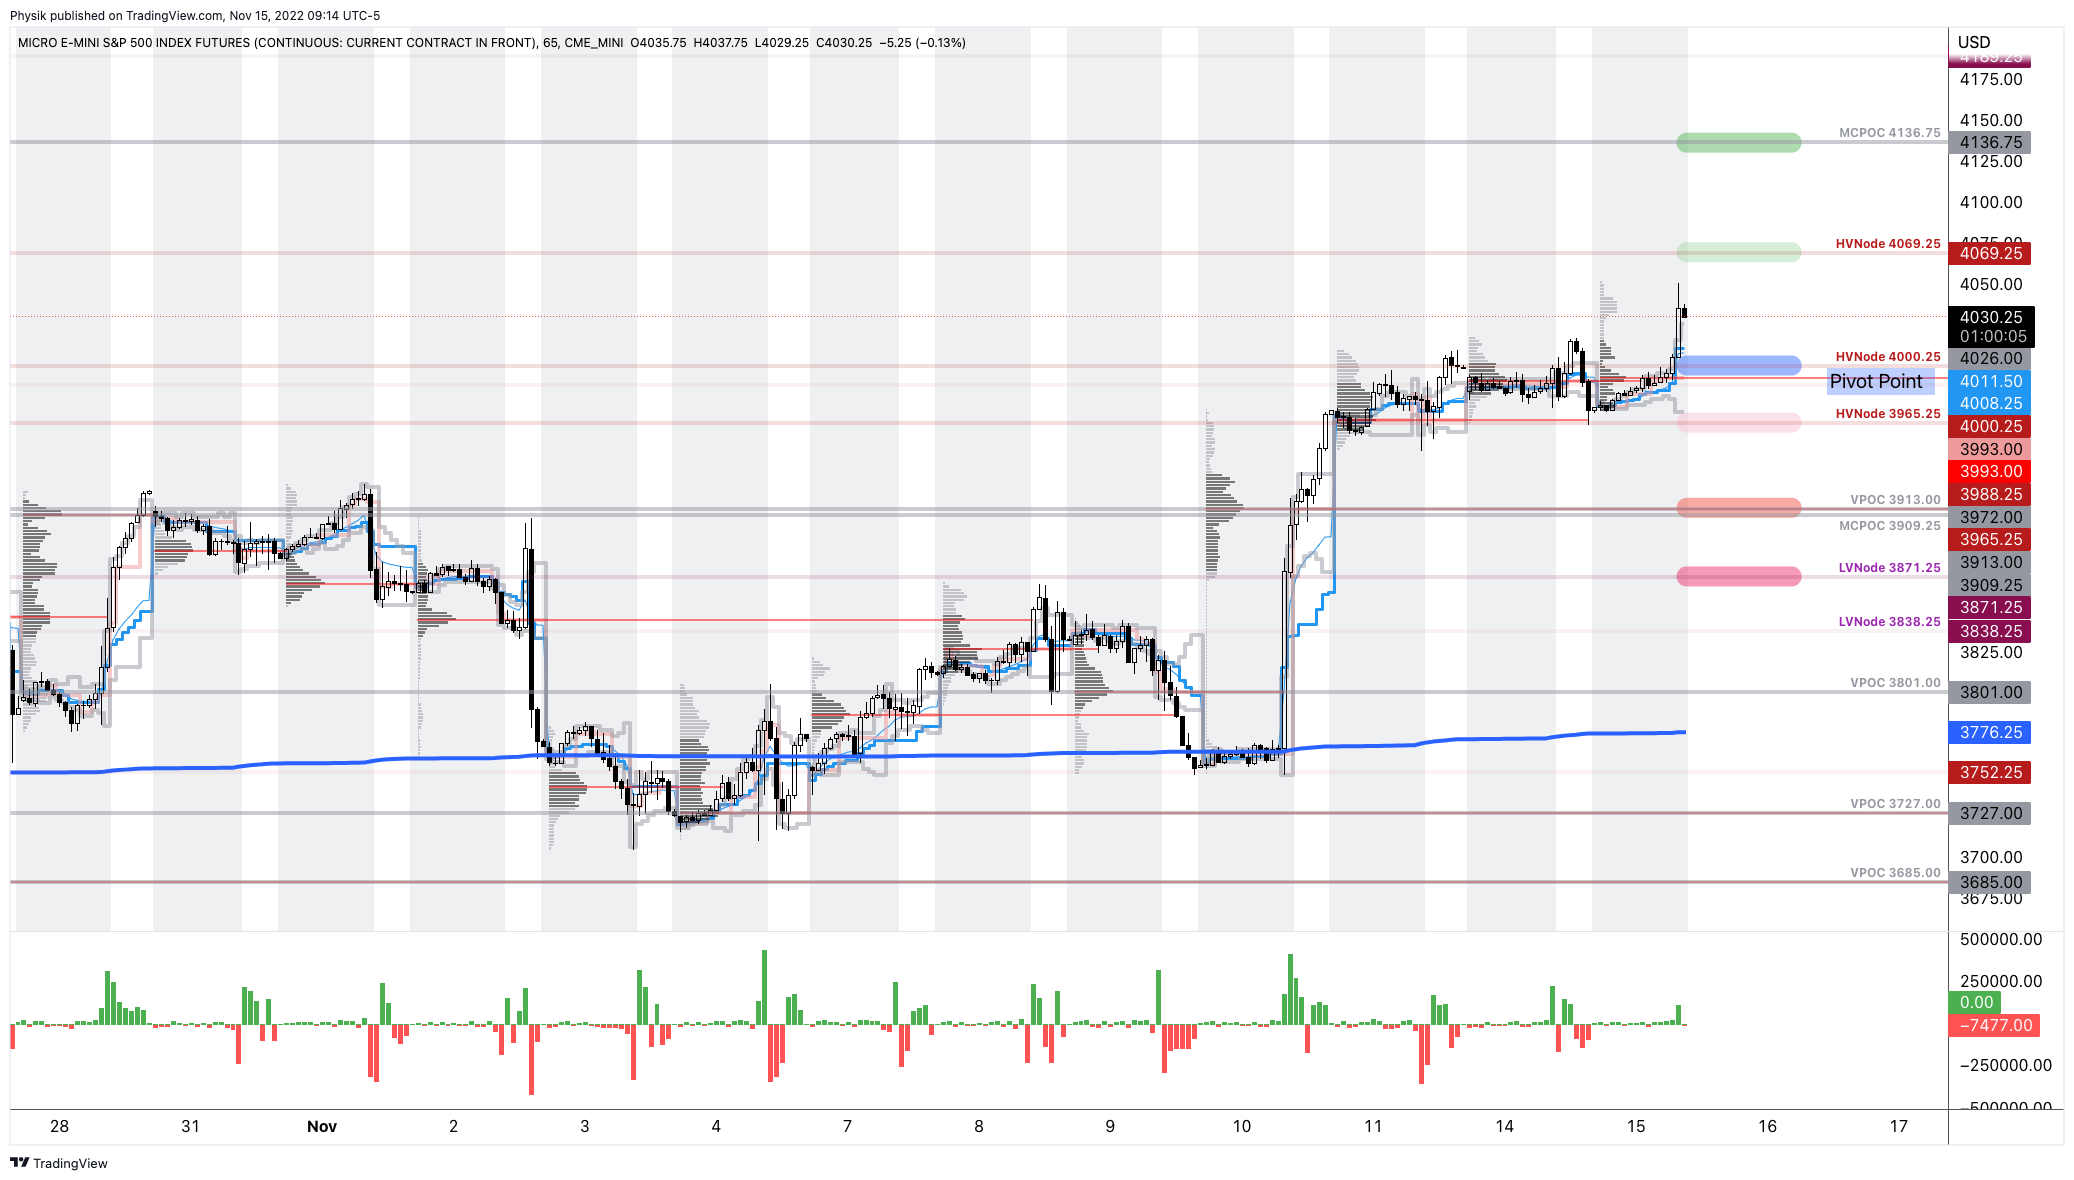
As of 9:00 AM ET, Tuesday’s regular session (9:30 AM – 4:00 PM ET), in the S&P 500, is likely to open in the upper part of a positively skewed overnight inventory, outside of prior-range and -value, suggesting a potential for immediate directional opportunity.
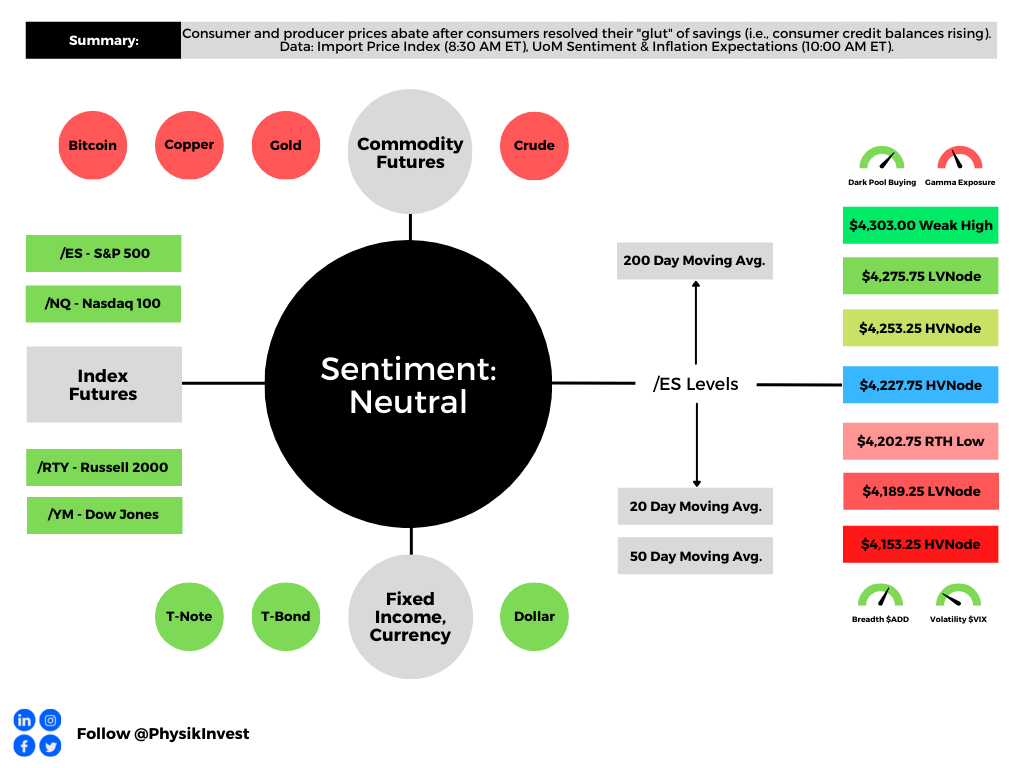
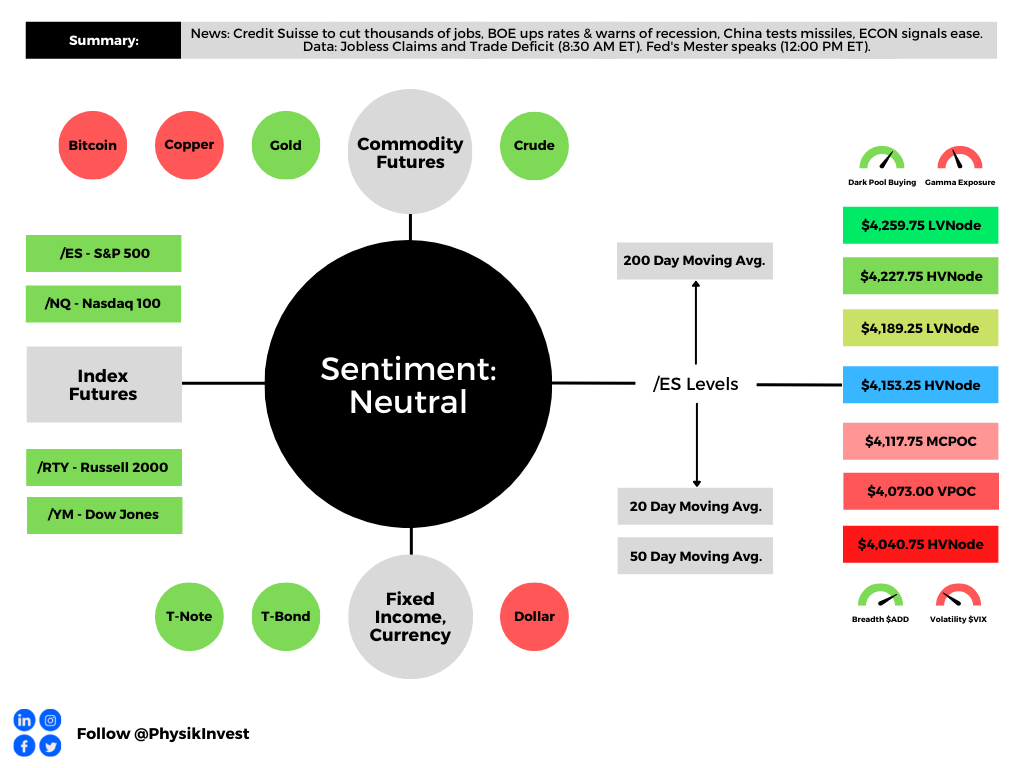
Our S&P 500 pivot for today is $4,000.25.
Key levels to the upside include $4,069.25, $4,136.75, and $4,231.00.
Key levels to the downside include $3,965.25, $3,913.00, and $3,871.25.
Click here to load today’s key levels into the web-based TradingView platform. All levels are derived using the 65-minute timeframe. New links are produced, daily.
Definitions
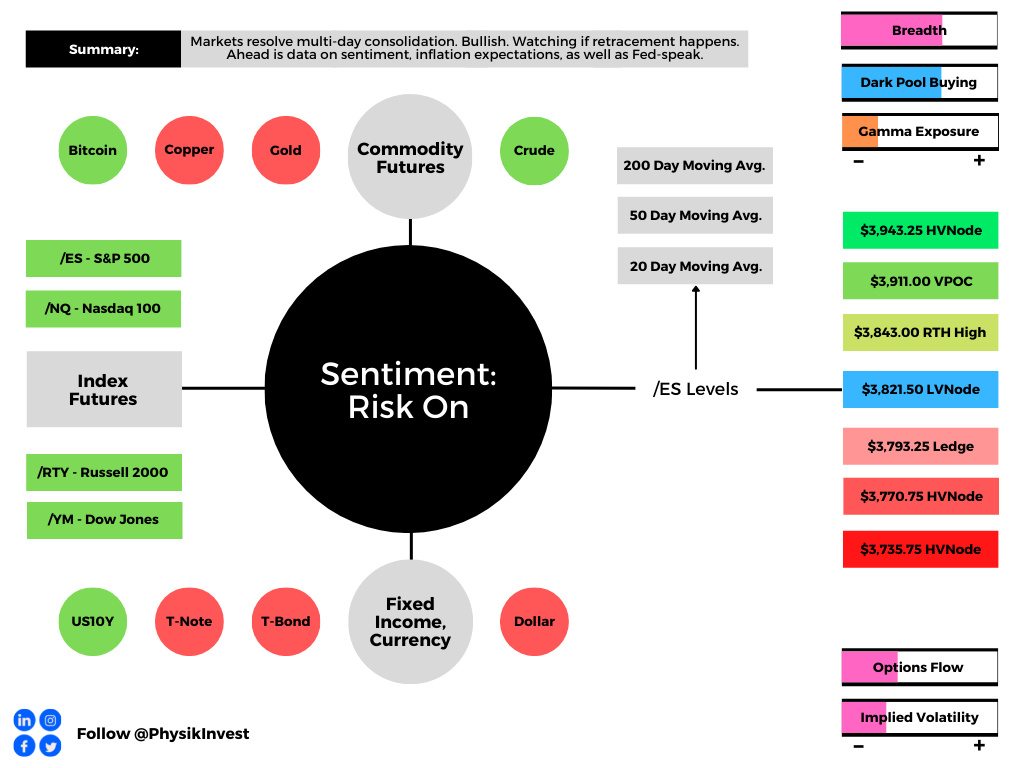
Volume Areas: A structurally sound market will build on areas of high volume (HVNodes). Should the market trend for long periods of time, it will lack sound structure, identified as low volume areas (LVNodes). LVNodes denote directional conviction and ought to offer support on any test.
If participants were to auction and find acceptance into areas of prior low volume (LVNodes), then future discovery ought to be volatile and quick as participants look to HVNodes for favorable entry or exit.
POCs: POCs are valuable as they denote areas where two-sided trade was most prevalent in a prior day session. Participants will respond to future tests of value as they offer favorable entry and exit.
MCPOCs: POCs are valuable as they denote areas where two-sided trade was most prevalent over numerous day sessions. Participants will respond to future tests of value as they offer favorable entry and exit.
About
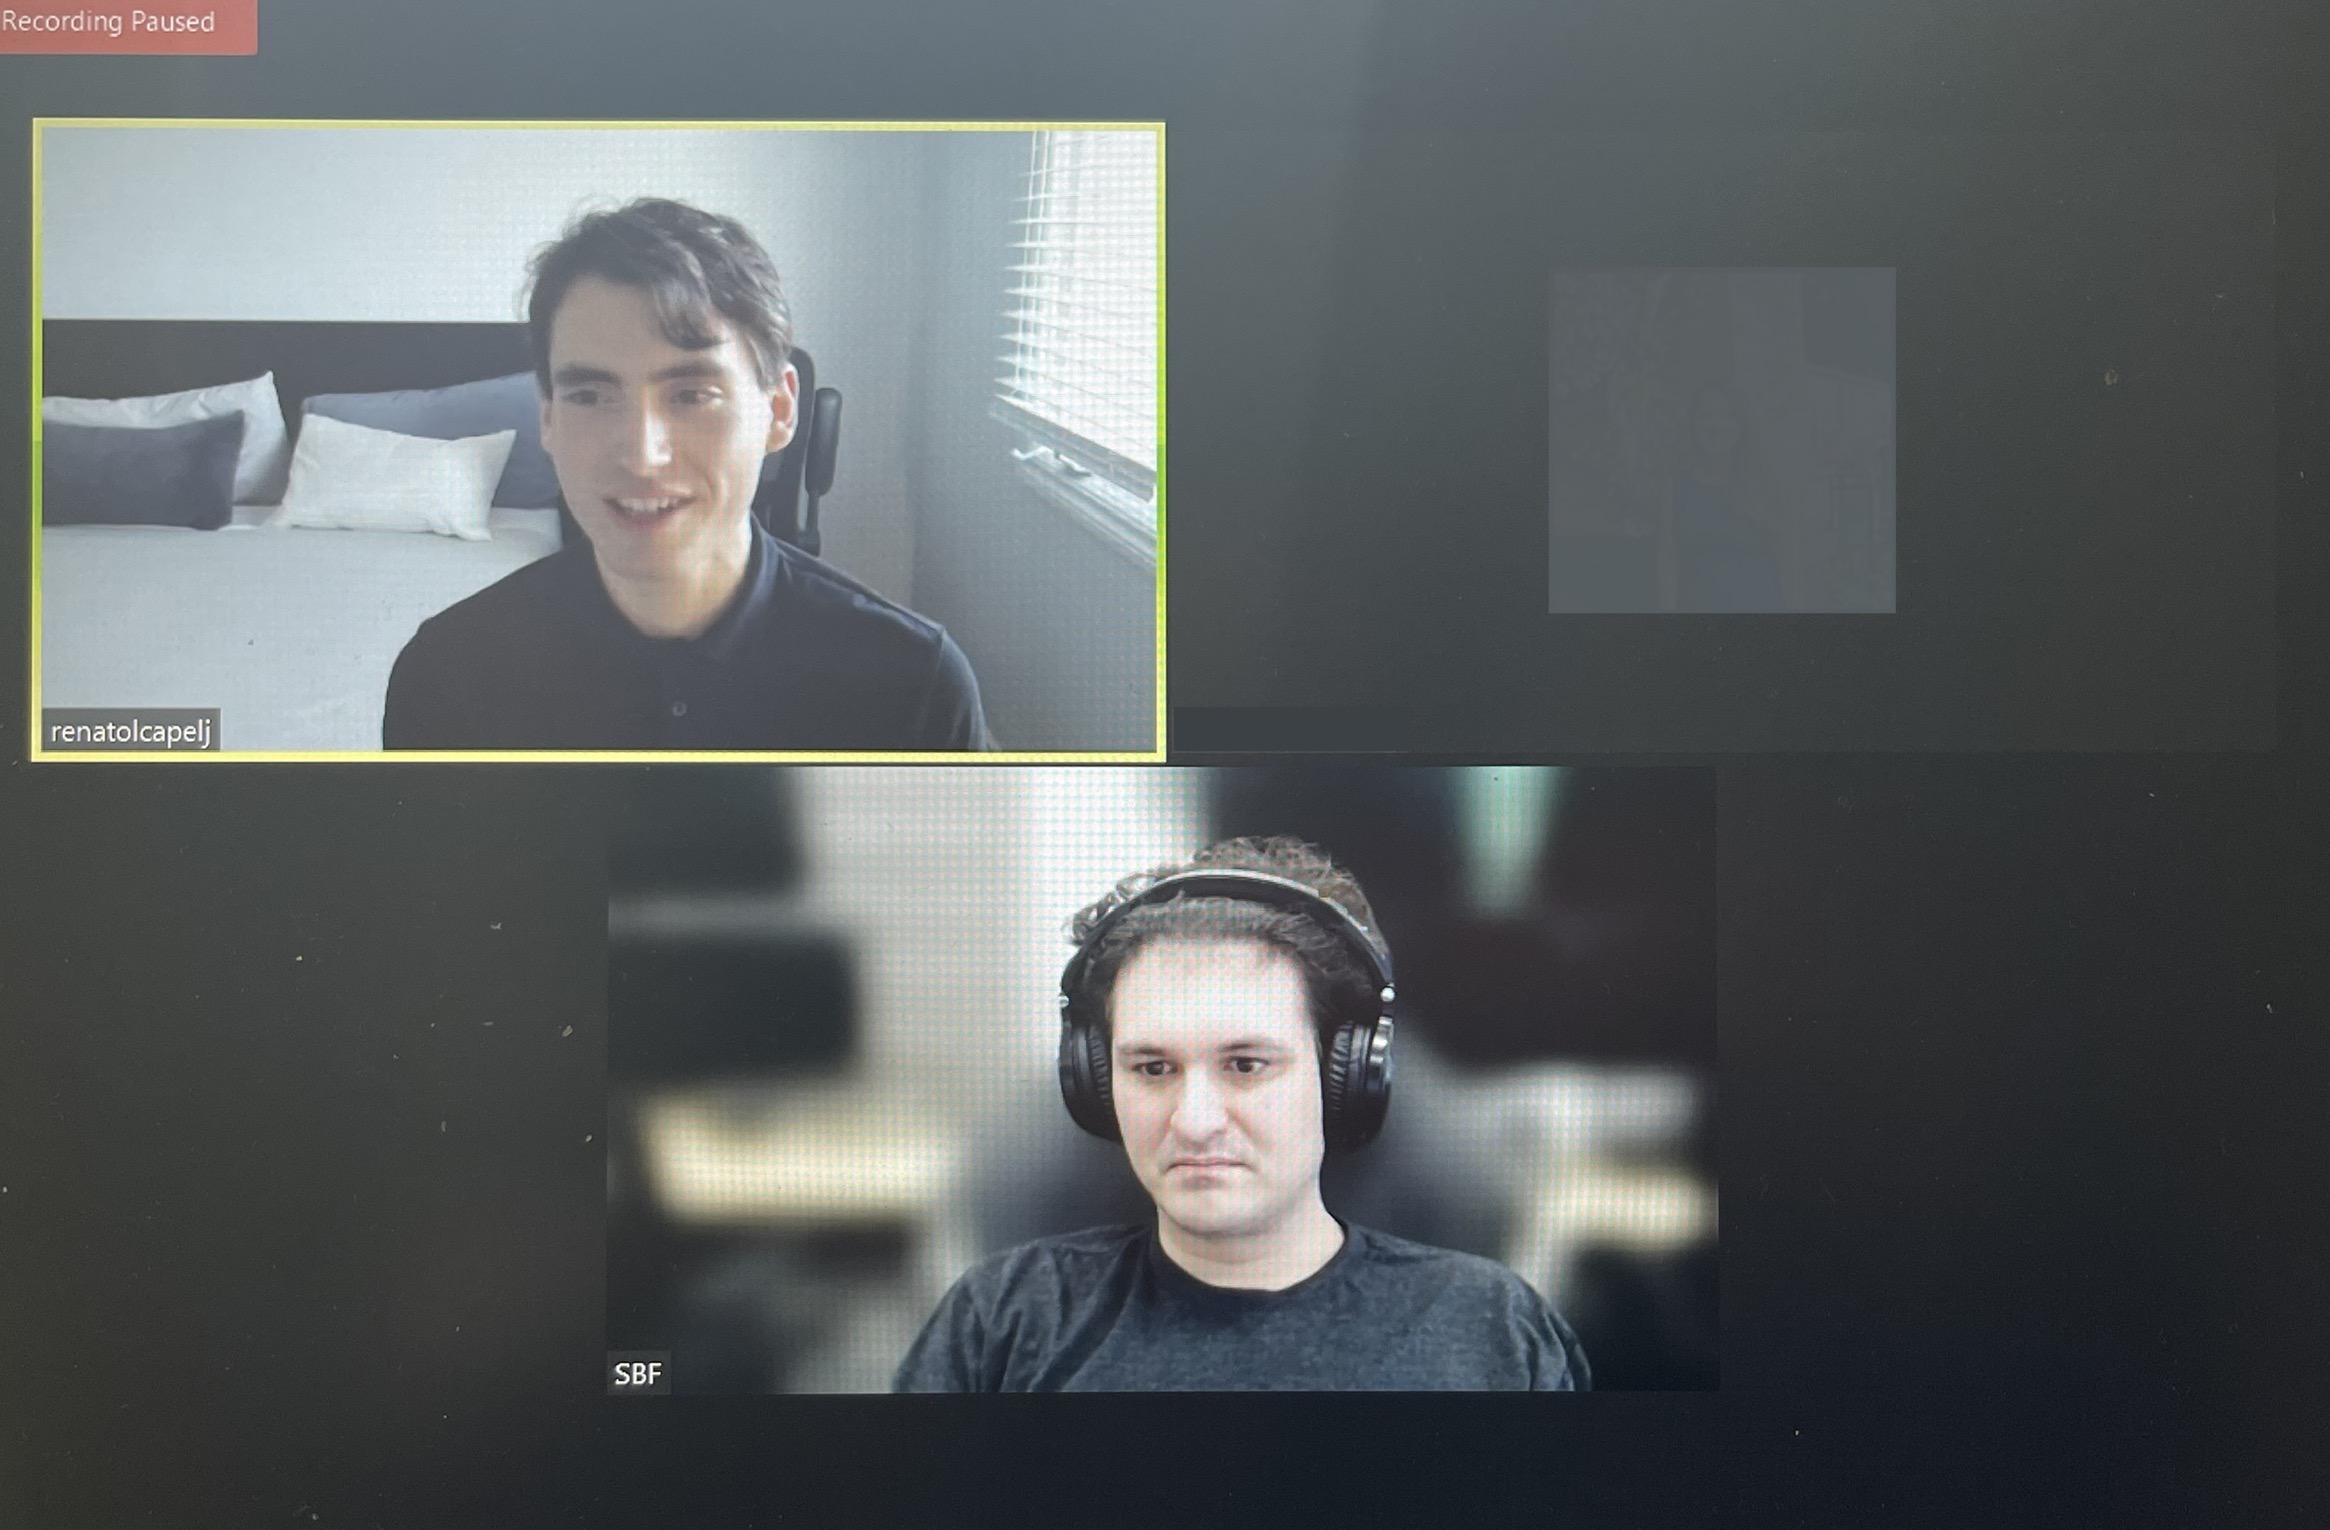
After years of self-education, strategy development, mentorship, and trial-and-error, Renato Leonard Capelj began trading full-time and founded Physik Invest to detail his methods, research, and performance in the markets.
Capelj also develops insights around impactful options market dynamics at SpotGamma and is a Benzinga journalist.
His works include private discussions with ARK Invest’s Catherine Wood, investors Kevin O’Leary and John Chambers, the infamous Sam Bankman-Fried of FTX, ex-Bridgewater Associate Andy Constan, Kai Volatility’s Cem Karsan, The Ambrus Group’s Kris Sidial, the Lithuanian Delegation’s Aušrinė Armonaitė, among many others.
Contact
Direct queries to renato@physikinvest.com or Renato Capelj#8625 on Discord.
Disclaimer
Do not construe this newsletter as advice. All content is for informational purposes.