Good Morning! I hope you are having a good start to the week. I would be so honored if you could comment and/or share this post. Cheers!
There is lots of buzz around bubbles and euphoria.
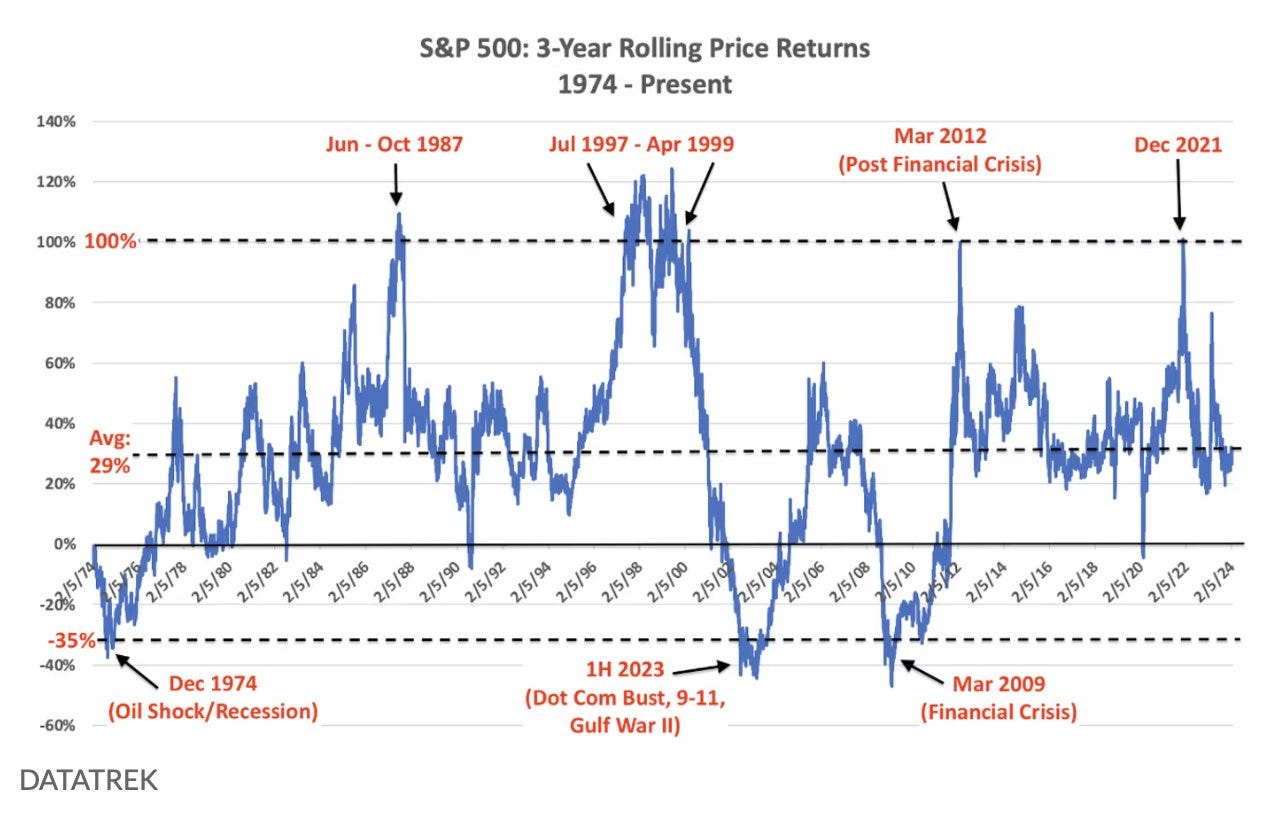
Since late 2022, the Nasdaq 100 has increased by ~75%, and the S&P 500 has increased by ~50%. However, there were some bumps along the way. In mid-to-late 2023, people got worried about the economy, which boosted interest rates. But in November 2023, investors discovered the government would issue less debt, decreasing interest rates. This was good news because future profits are more valuable now when interest rates drop (i.e., lower discount rates elevate the present value of future cash flows), so stocks tend to rise.
The general idea is that stocks will likely keep rising because of the promise of AI and expected profits growing faster than stock prices. Also, people think this will happen as the economy grows and inflation decreases. But it’s not just those factors. How people invest right now is also a big reason why stocks may increase.
Much Further To Run?
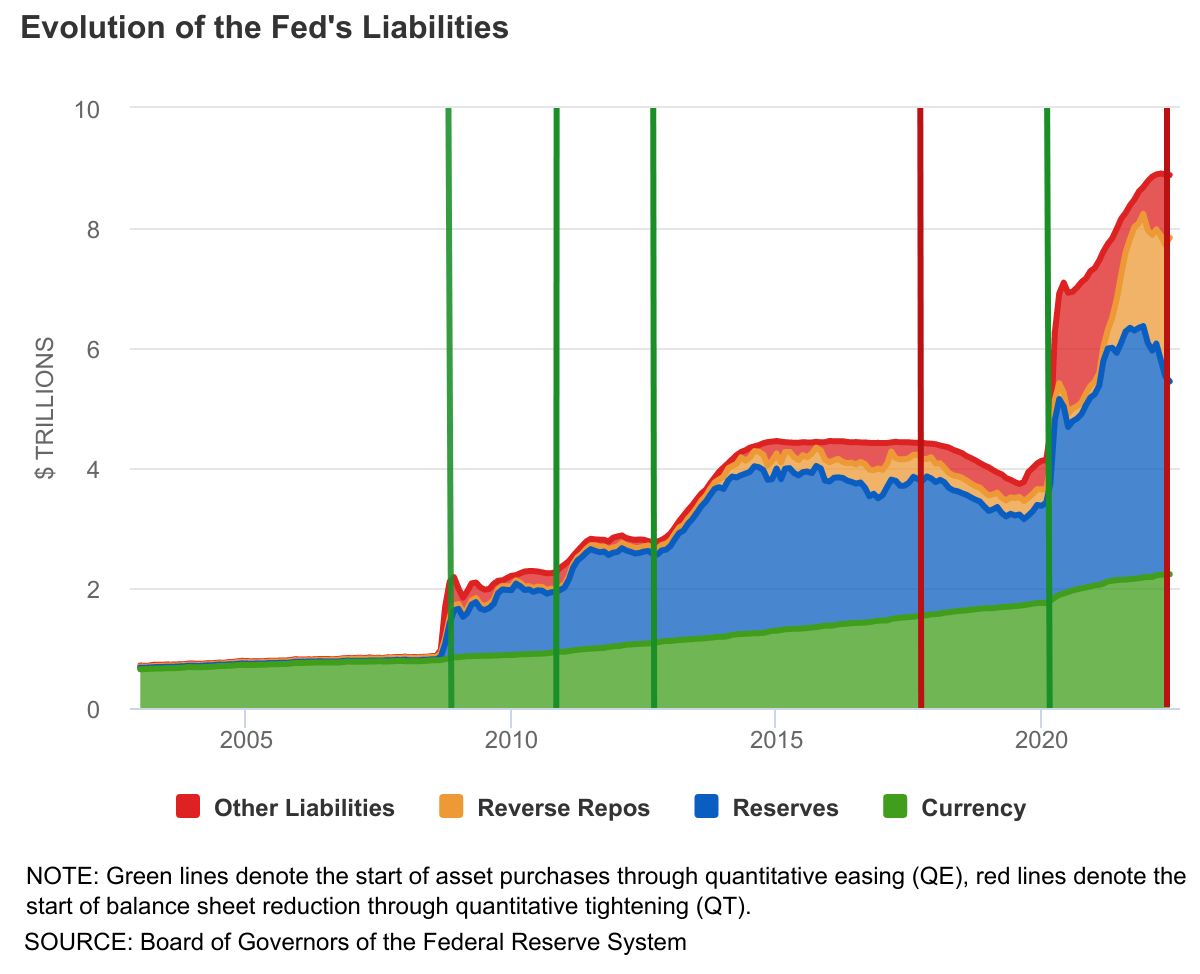
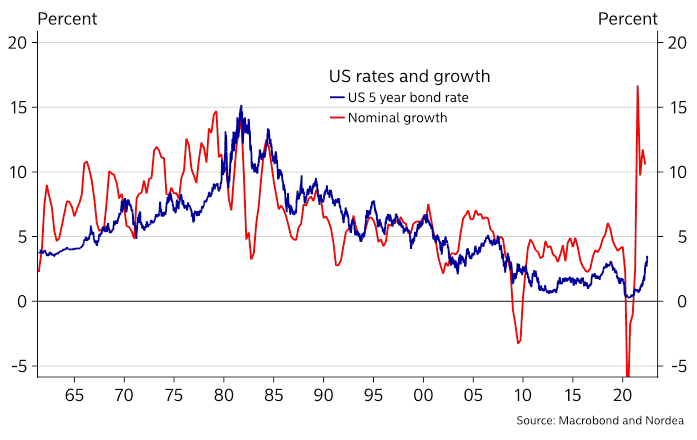
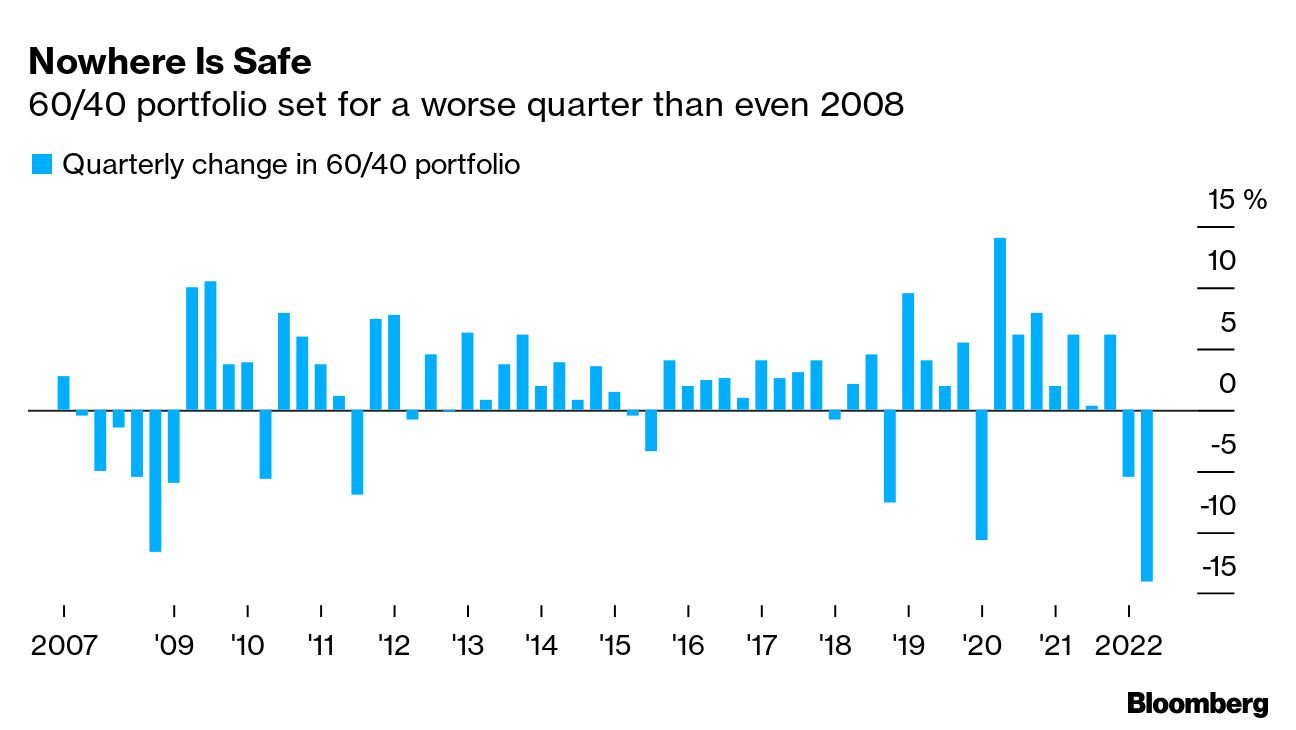
The primary catalyst lies in the imbalance of investor positioning stemming from the aftermath of ZIRP (Zero Interest Rate Policy), Fallacy Alarm elaborates. The conclusion of ZIRP reintroduced fixed-income securities as viable investments, prompting investors to boost their fixed-income allocations significantly in recent times.
Further asset rotation could manifest through a stagnant or declining stock market coupled with rising yields or through a robust stock market alongside stagnant or falling yields.
Accordingly, investors are now pursuing stocks at seemingly elevated valuations.

Fallacy Alarm adds color, making an interesting point on elevated valuations.
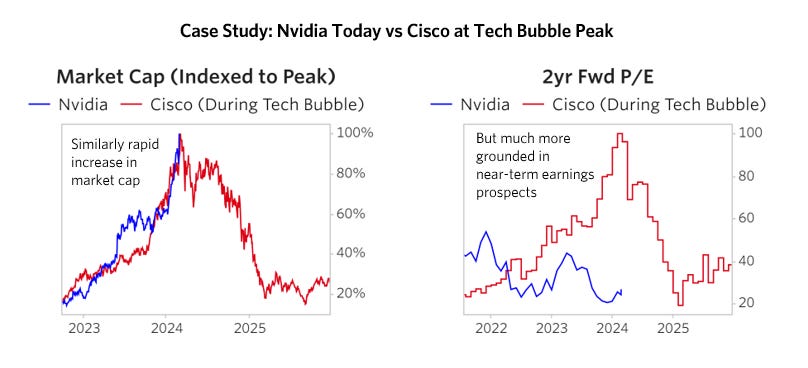
Bubbles (the hot topic) are not solely about prices; the collective portfolio allocation characterizes them. We dive further, finding there is room to expand. Per Bloomberg’s John Authers, the market is not as absurd, with the Magnificent Seven aligning more closely with the broader market than before.
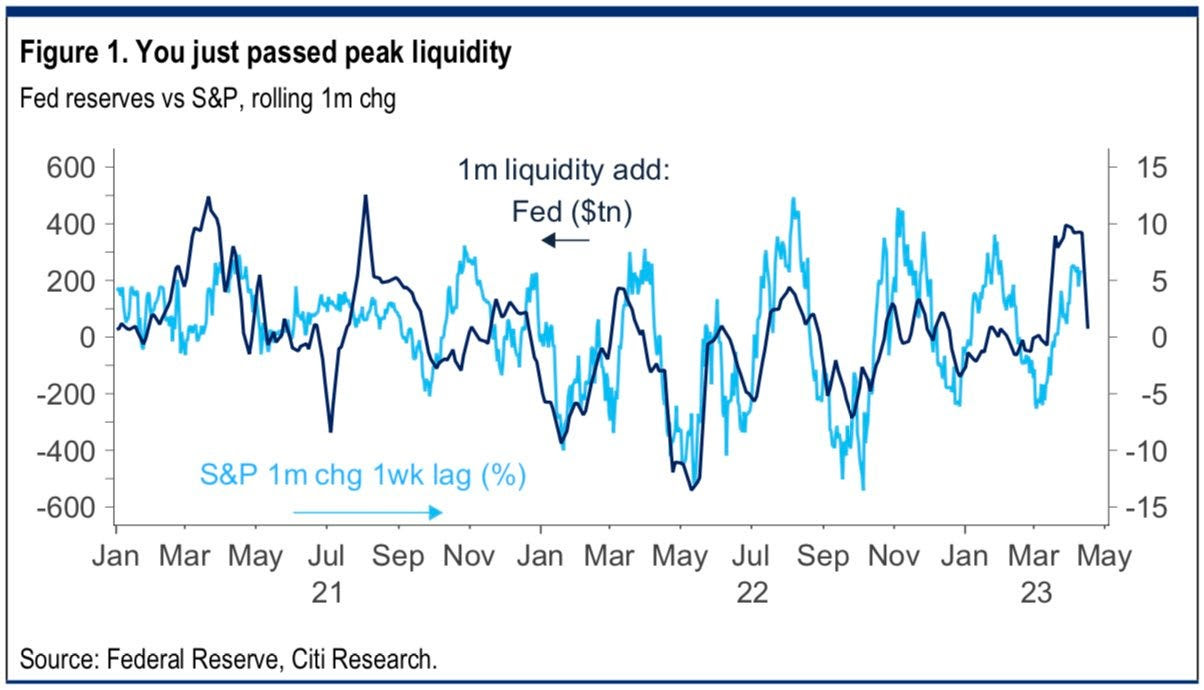
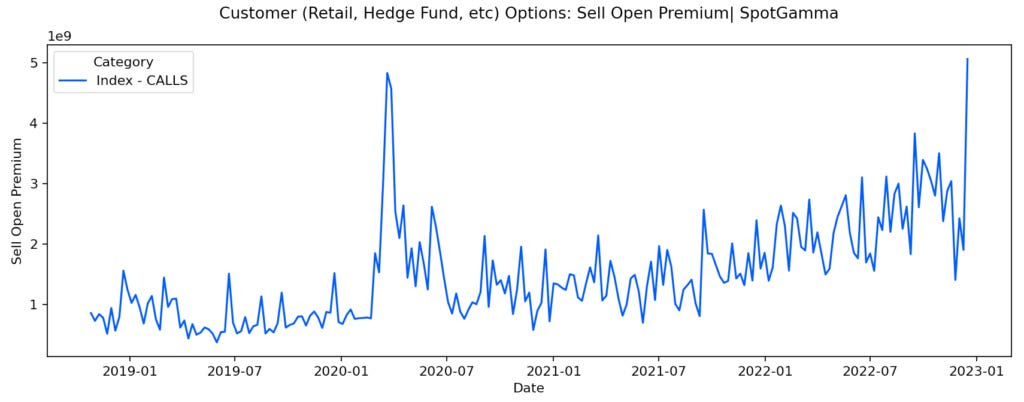
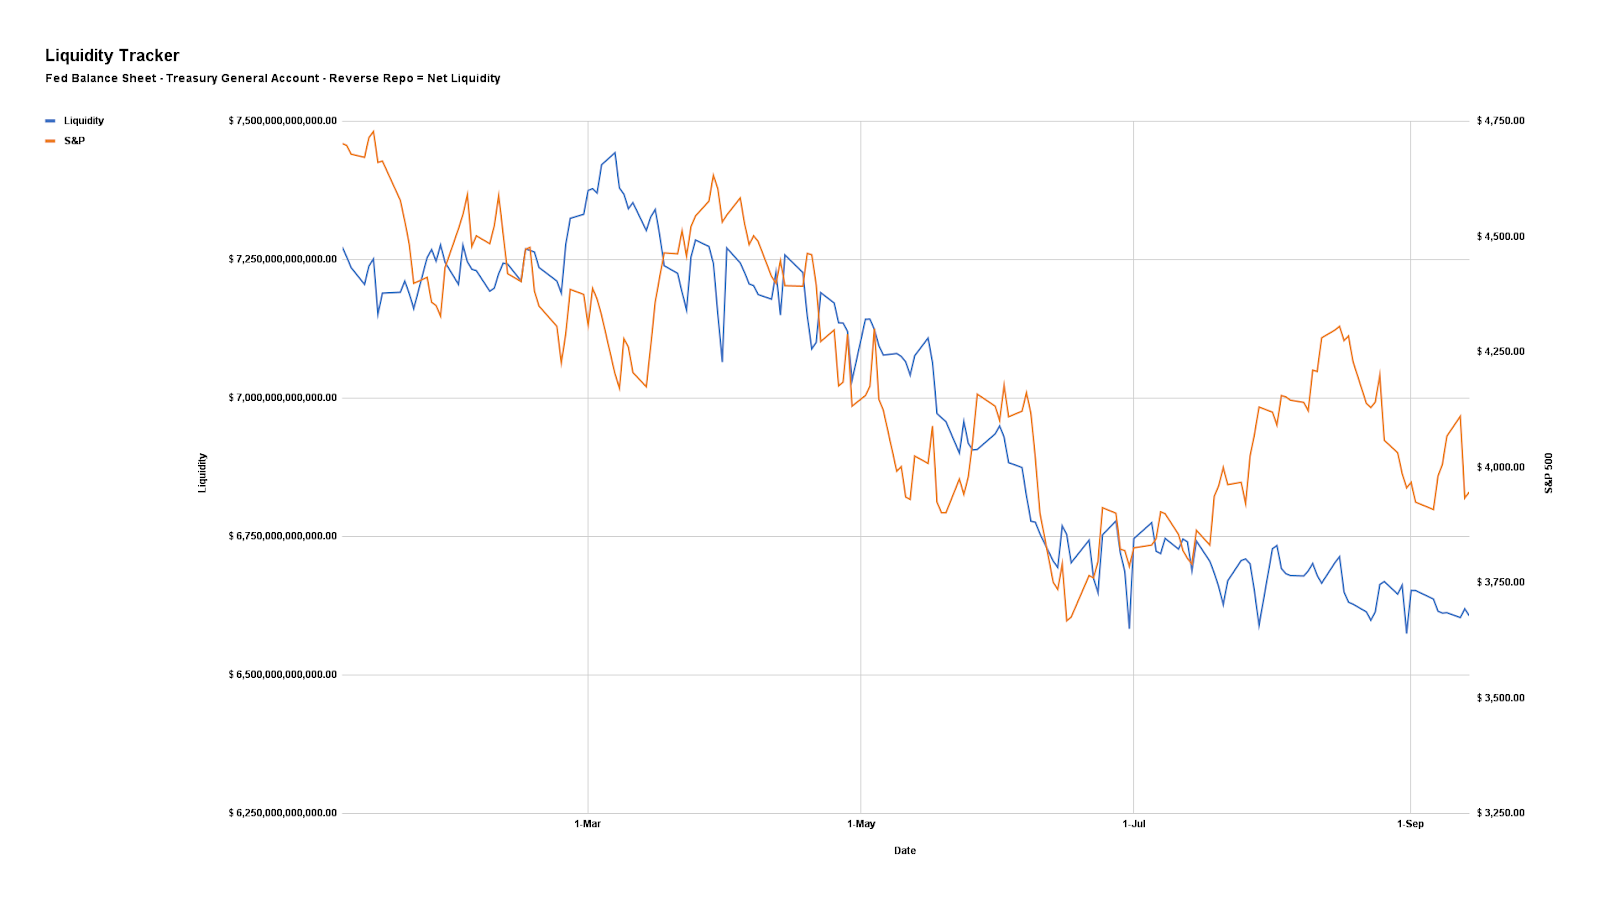
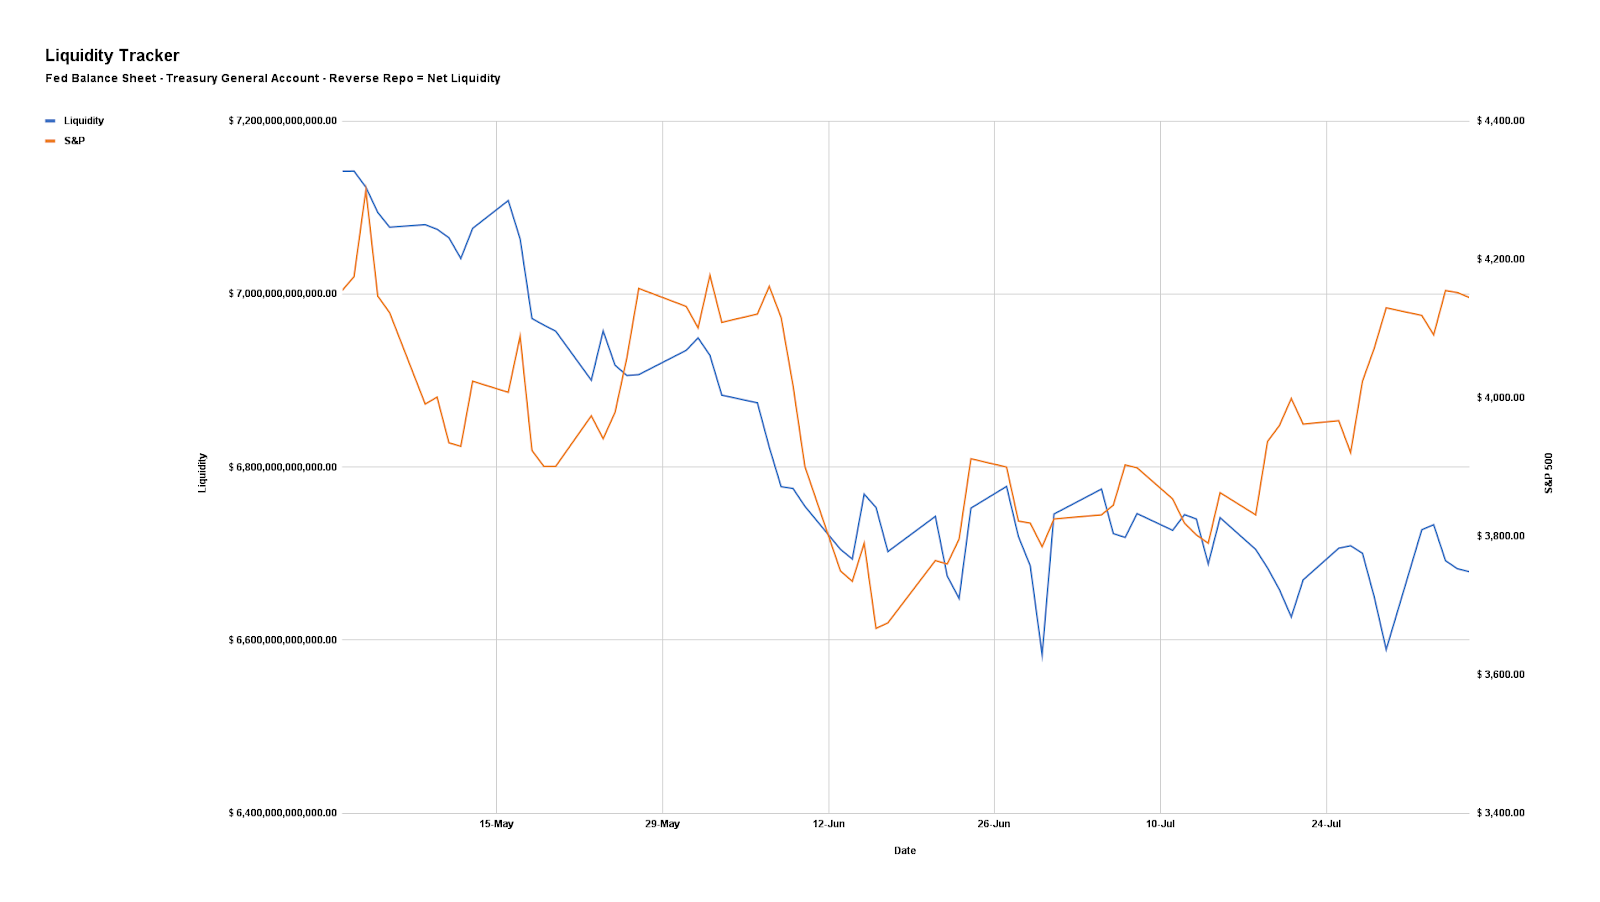
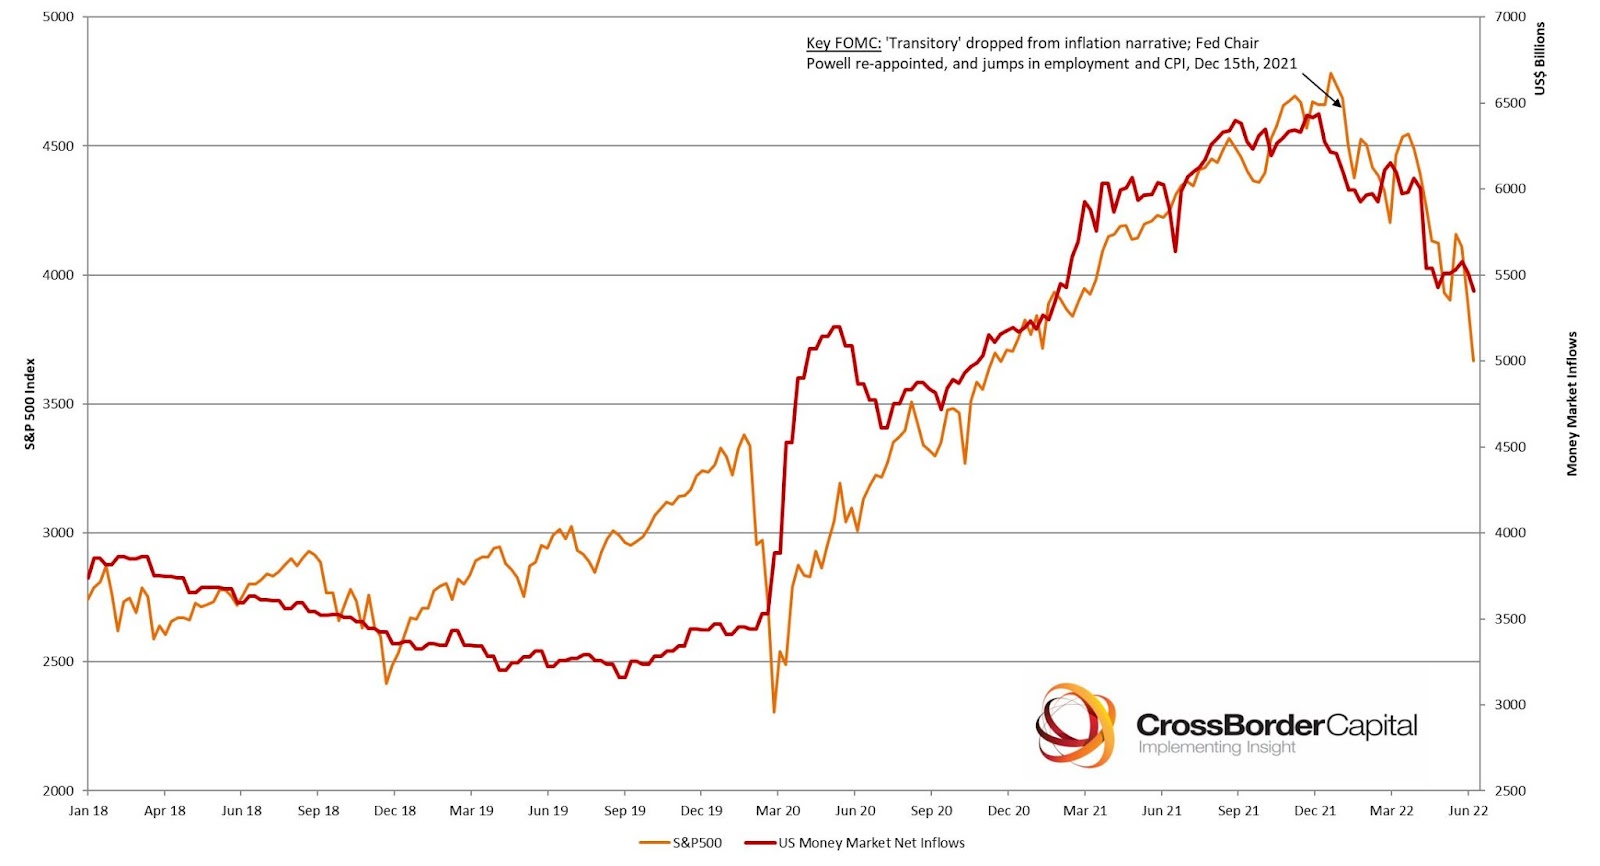
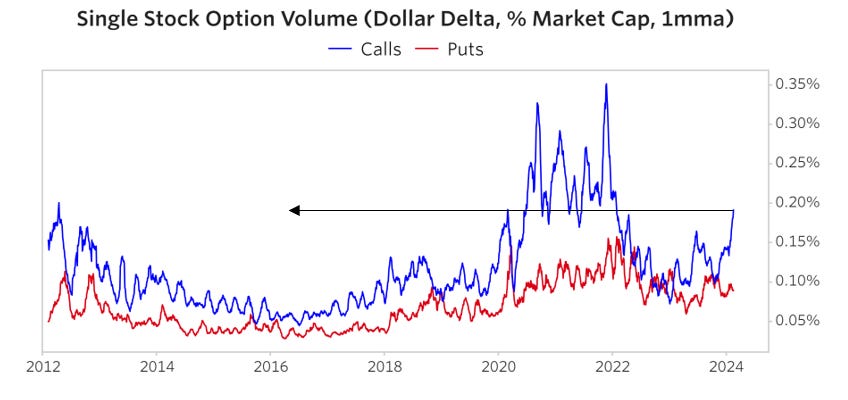
Additionally, Authers says that the S&P 500 remains relatively inexpensive, with room to go based on global liquidity, subdued margin debt levels, and not overly elevated single-stock call option volumes.
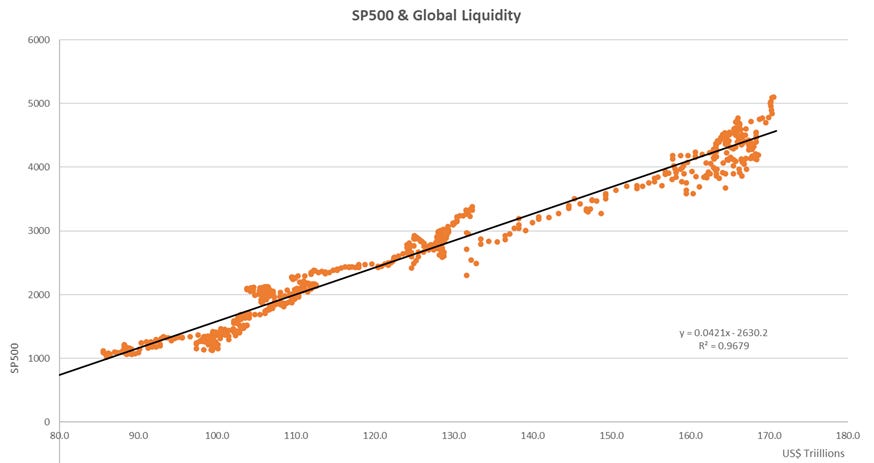
“The S&P 500 looks extended in absolute terms when measured by US domestic liquidity flows, but it looks far more comfortably placed when Global Liquidity is the benchmark,” CrossBorder Capital’s Mike Howell states. “US equities have got much further to run if we can reassure ourselves that Wall Street has become the ‘World market’ for stocks. Indeed, this might be plausible given the dominance of US firms in tech and AI applications?”
Embedded Risks To Rally
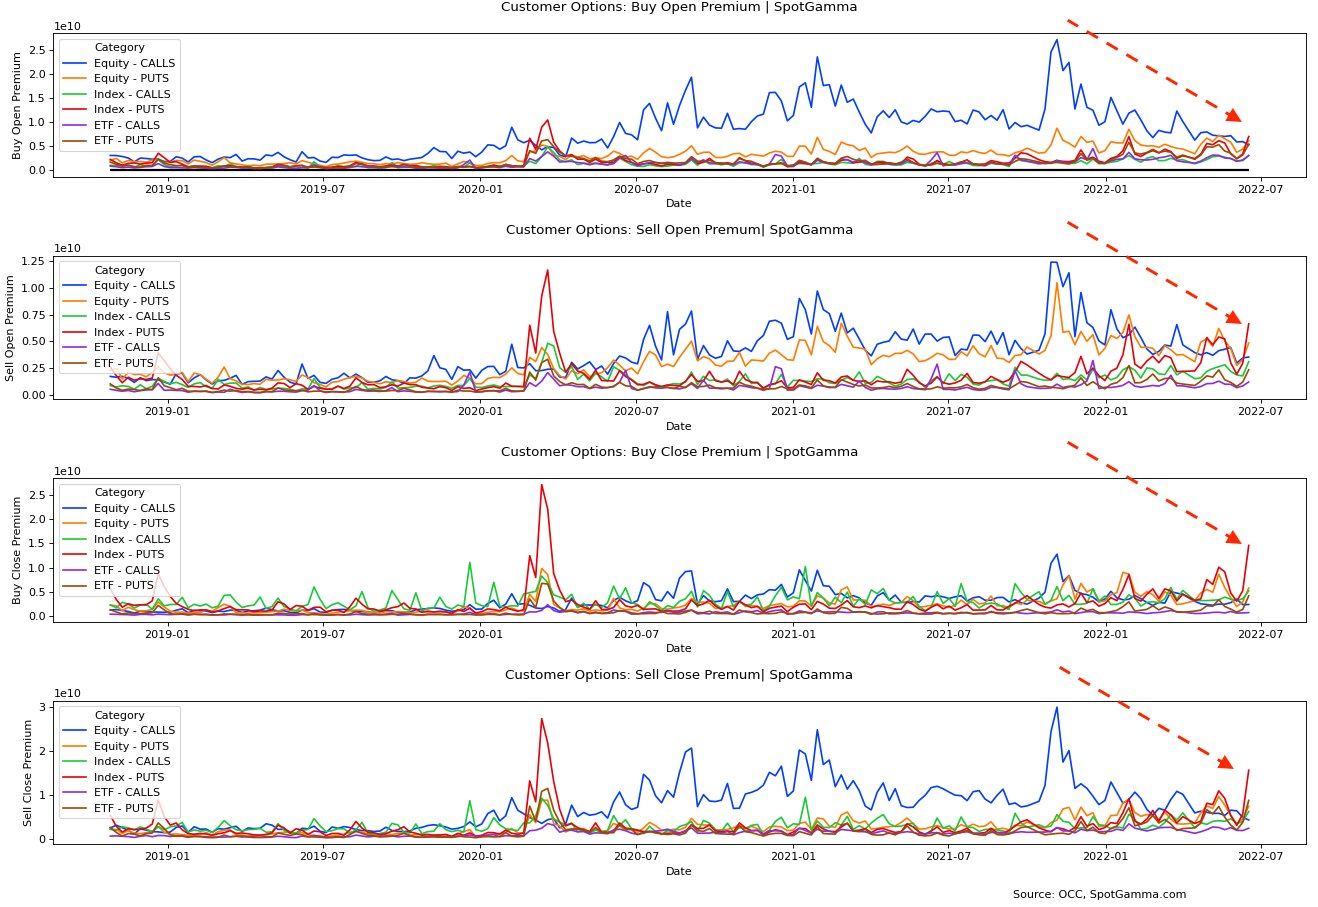
Some others are more cautious regarding the options volumes.
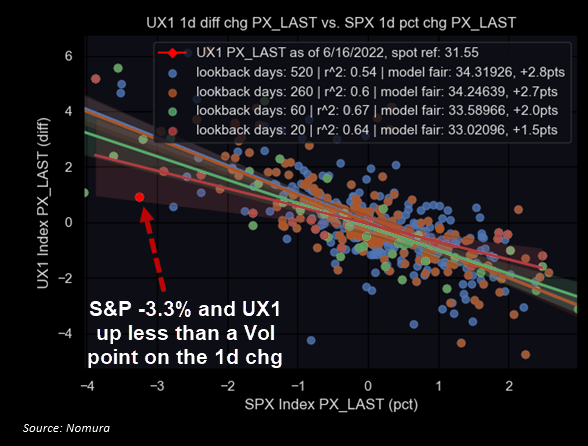
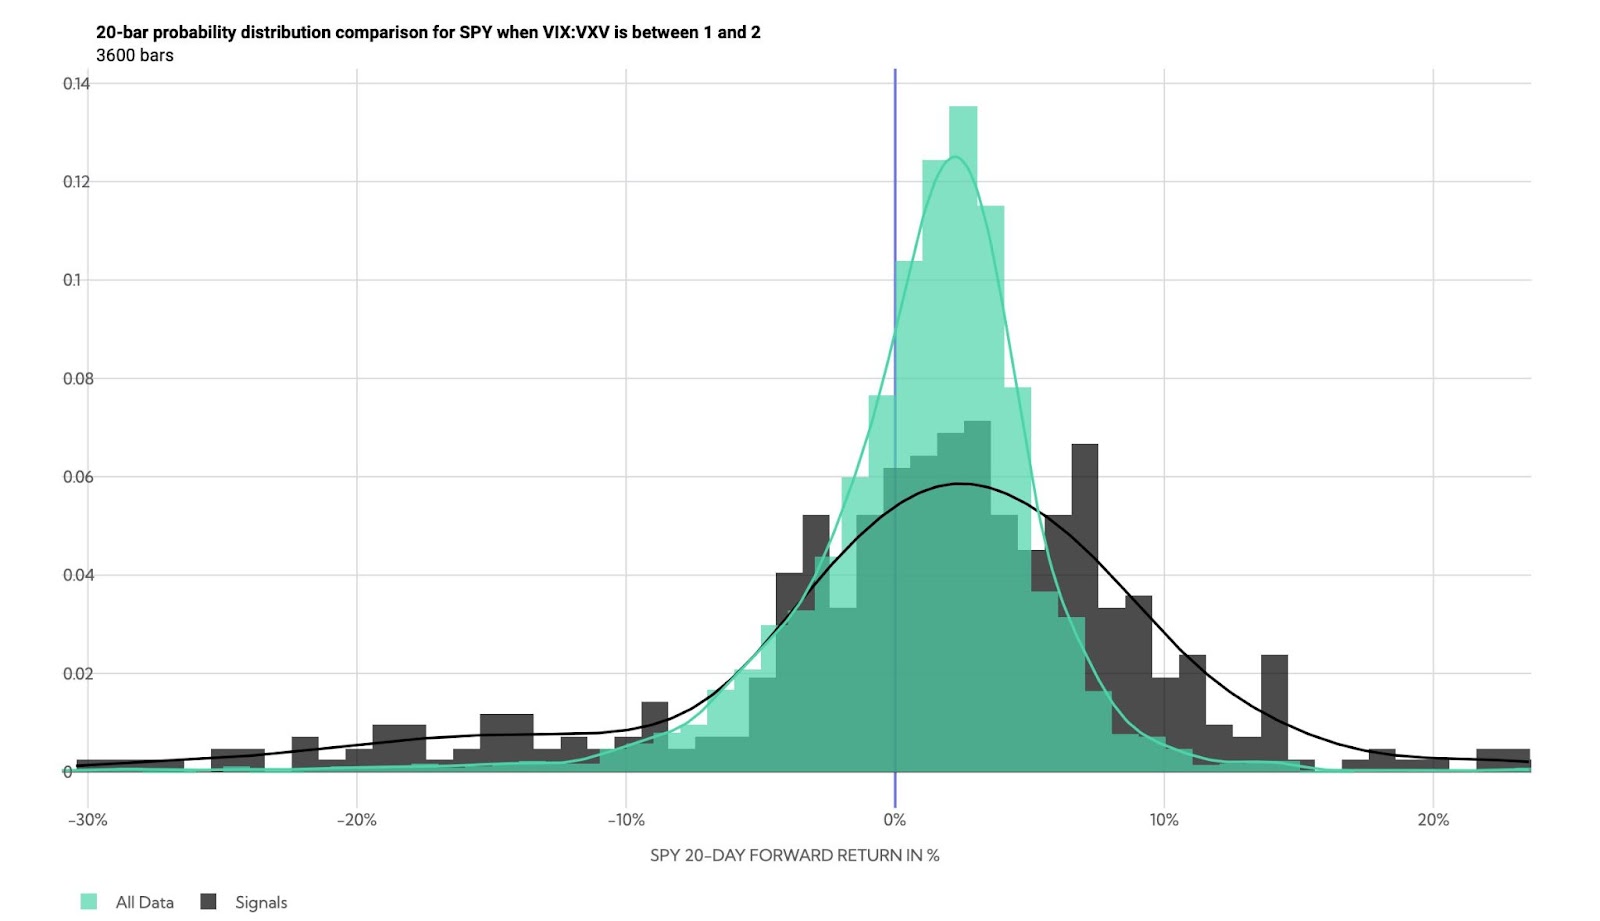
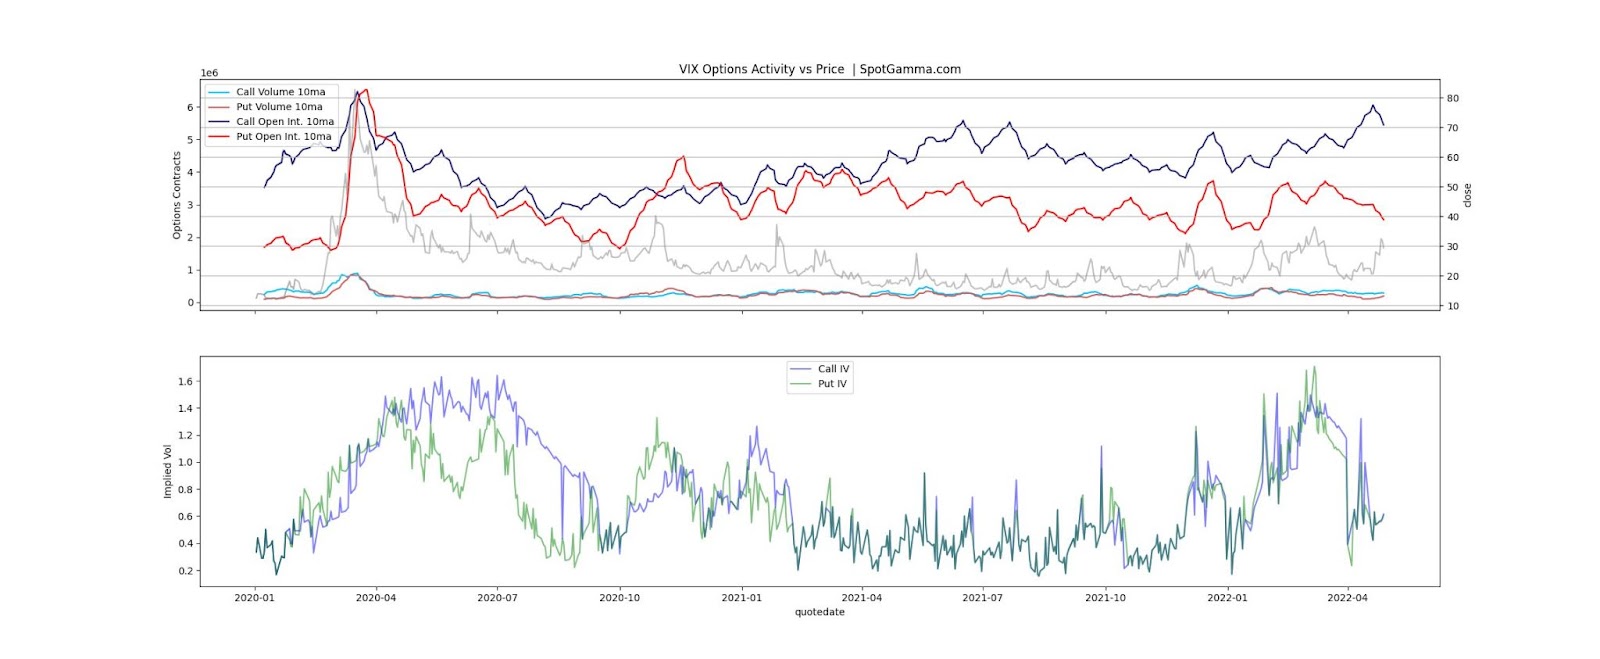
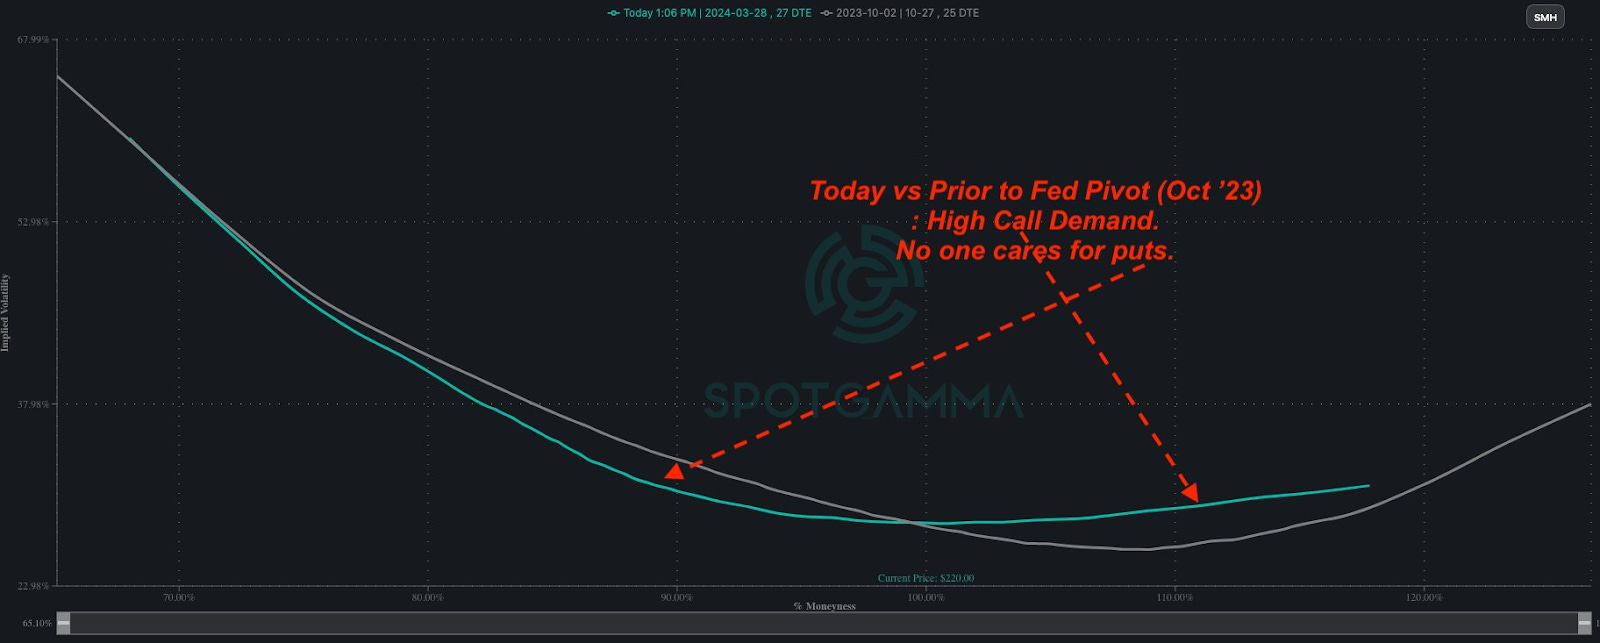
Nomura’s Charlie McElligott suggests the fear of a “crash up” causes a steeper call skew (i.e., the asymmetry in implied volatility levels across different strike prices). We see this with the positive relationship between spot prices and implied volatility. Additionally, volatility selling and structured product issuance may present risky dislocations.
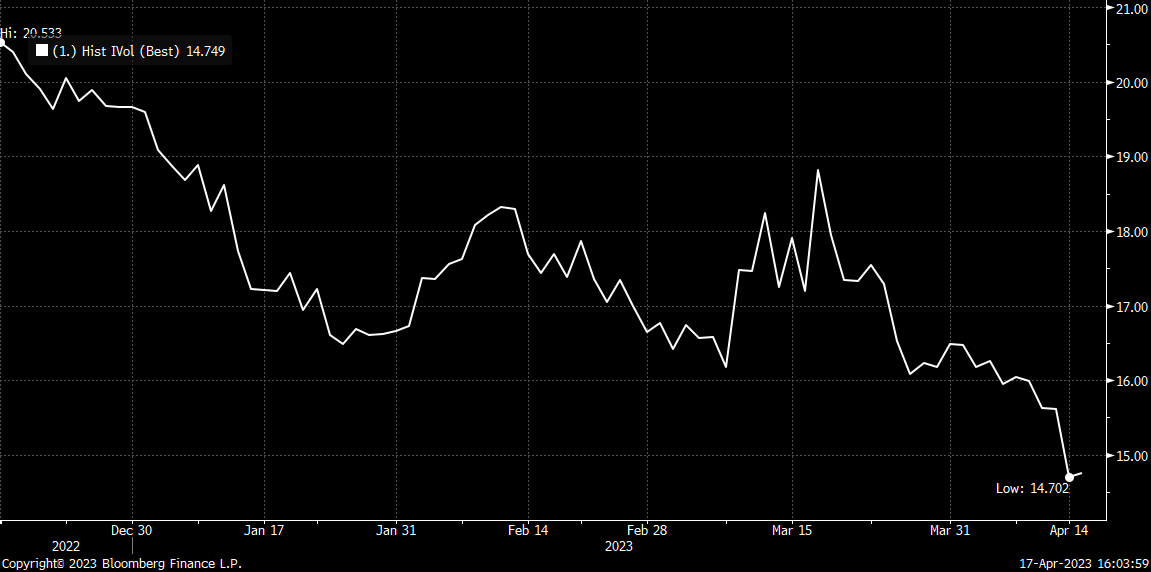
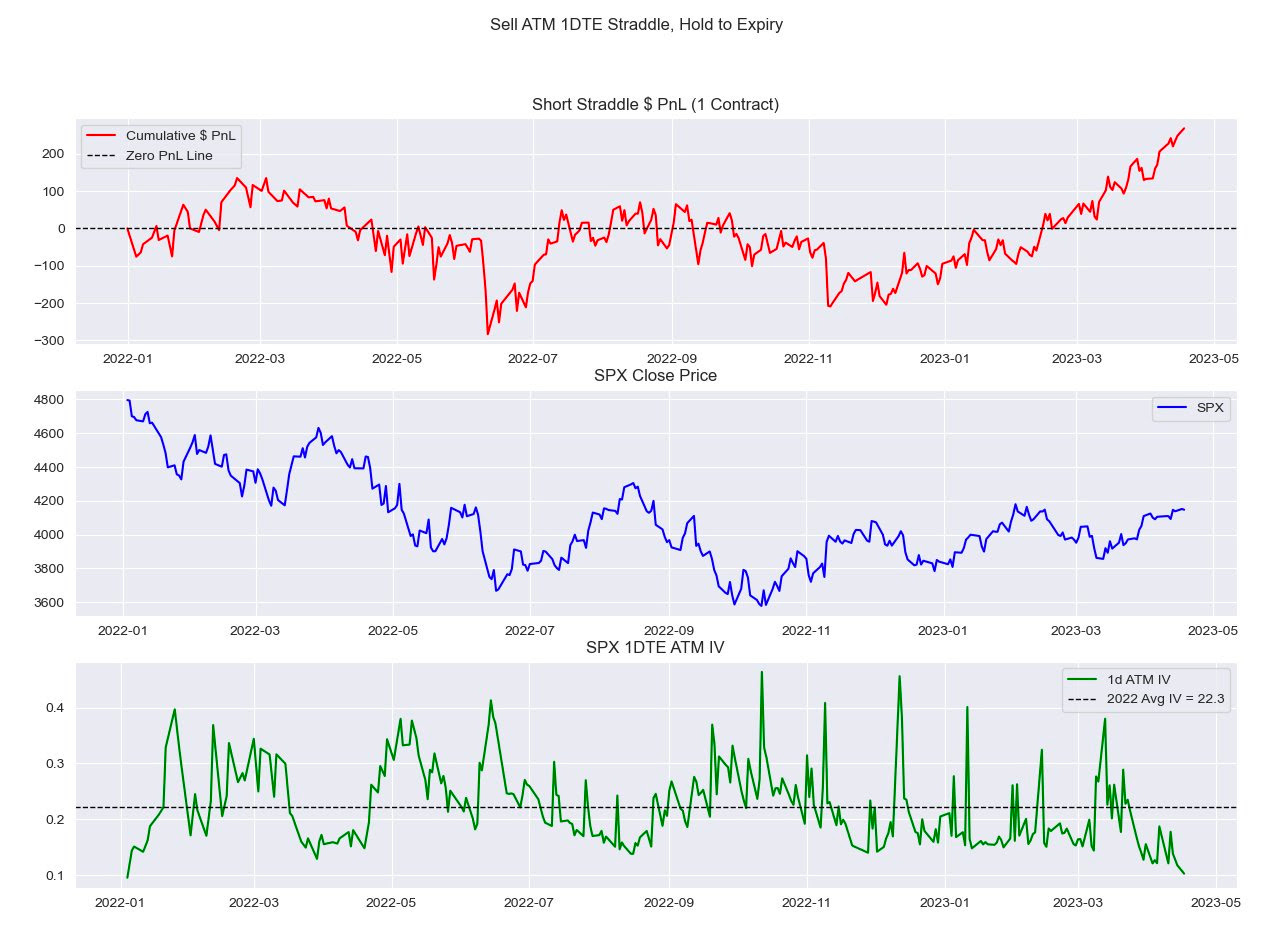
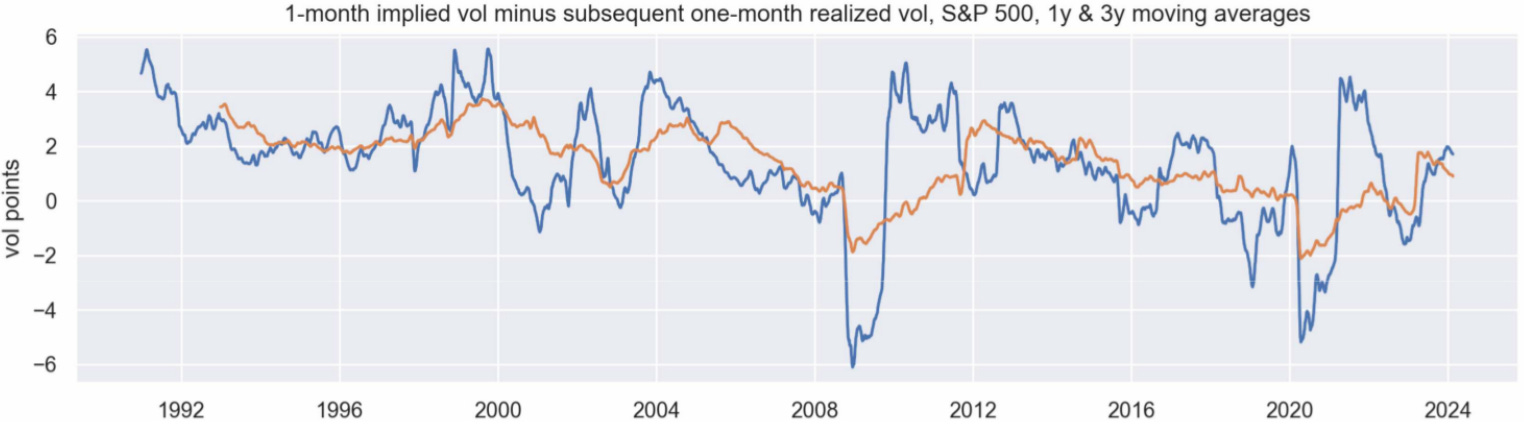
Some experts, like QVR Advisors, agree, note that selling volatility doesn’t offer the same returns with less risk as it used to. Instead, it’s now seen as taking on more risk for lower returns.
Options Volatility And Pricing
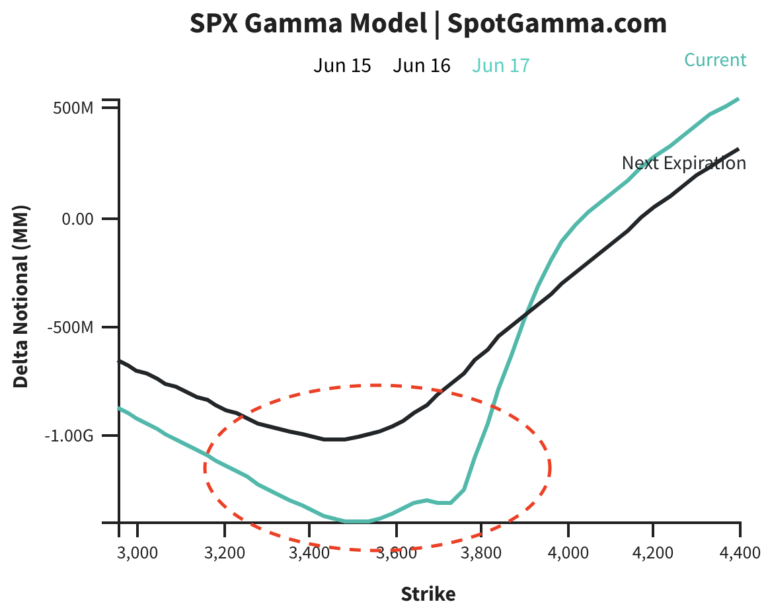
SpotGamma acknowledges these trends and dislocations can persist for some time.
So, what do we do about that?
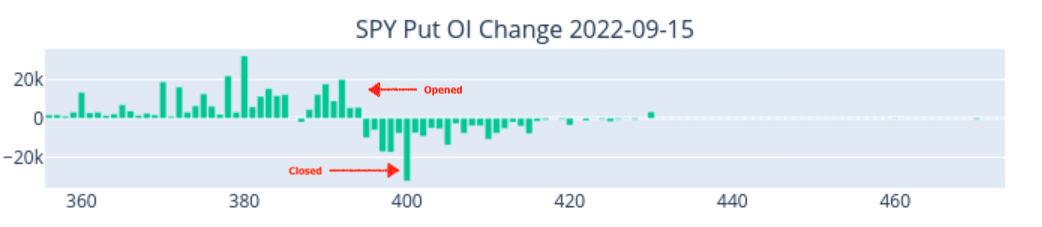
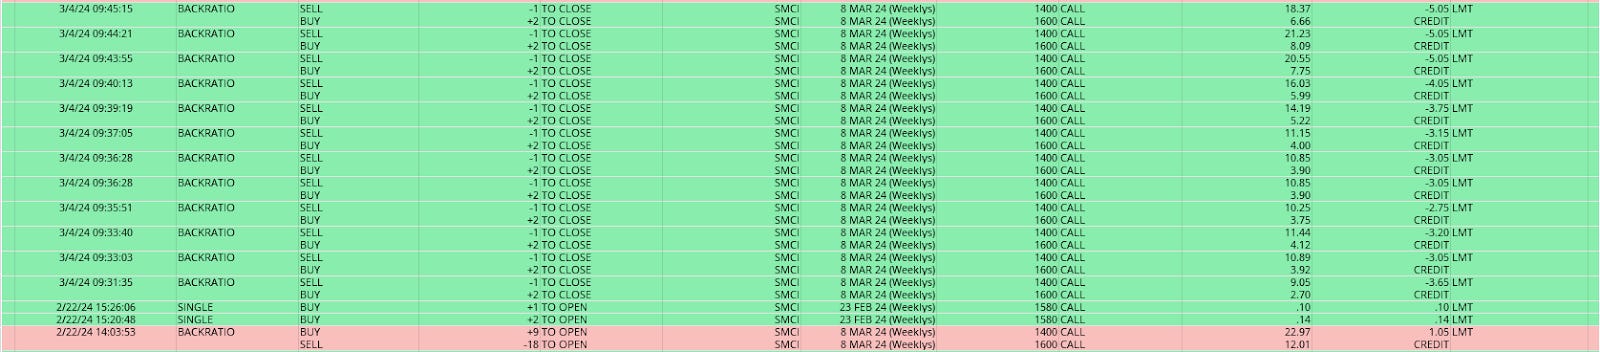
In last week’s detailed “BOXXing For Beginners” letter, we discussed getting selective and trading soaring stocks using creative options structures. Remaining faithful to our approach, we traded Super Micro Computer Inc (NASDAQ: SMCI) throughout the past week, utilizing a steep call skew to play upside potential at lower costs.
The outcomes for one of our accounts are detailed below.
Most positions were opened with modest credits and gradually closed with larger ones following news of its upcoming inclusion in the S&P 500. A significant portion of the profits were captured when the value of the 8 MAR 24 series reached its peak on Monday morning. During such moments, especially when nearing expiry, it’s crucial to pay attention to the market, closely monitoring the responsiveness of the spreads to underlying price action. When this responsiveness slipped in the morning, we closed all the positions, timing the peak on the structures at ~$5.00.
Managing ‘Greeks’ Versus ‘PnL’
When it is that late, as it was in the above trade, you are more focused on managing the PnL (i.e., profit and loss) and not Greek risk (i.e., the set of risk measures used to assess the sensitivity of option prices to changes in various factors, such as underlying asset price or delta, time decay or theta, volatility or vega, and interest rates or rho).
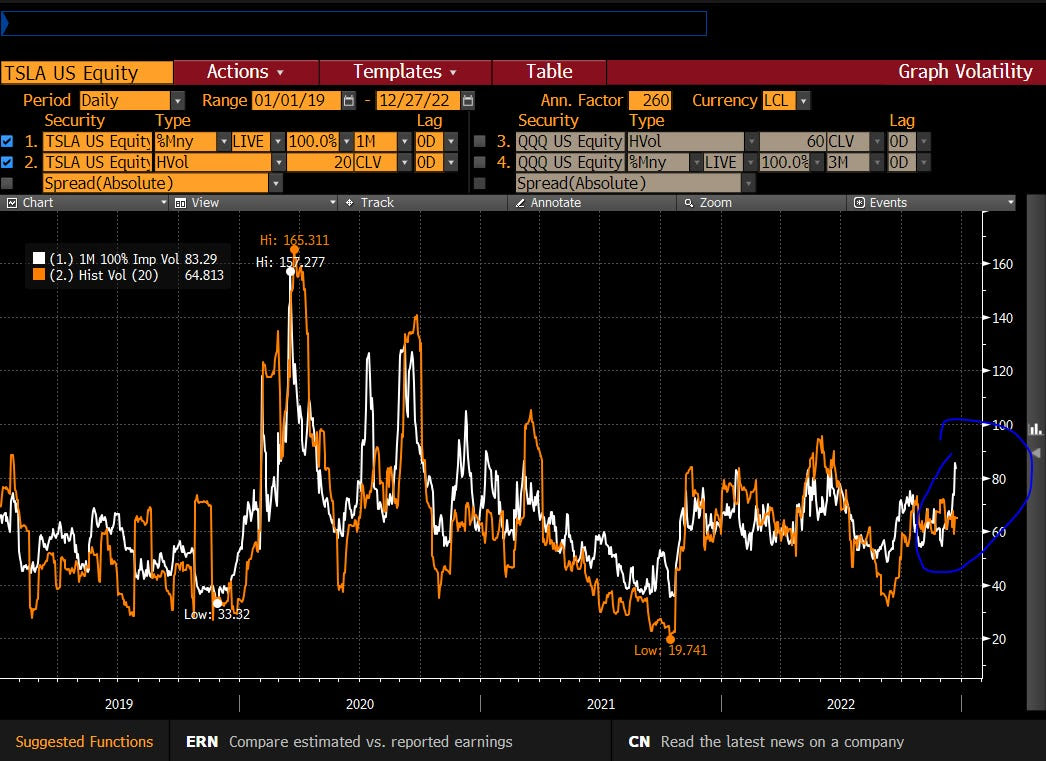
Accordingly, despite SMCI moving higher, the same spreads traded at a ~90% discount per late-Monday pricing. On Tuesday, that discount lessened to ~60%. Regardless, the right decision was to roll into similar, albeit wider, structures in anticipation of that same index effect that drove shares of Tesla Inc (NASDAQ: TSLA) higher in 2020 with its inclusion in the S&P 500.

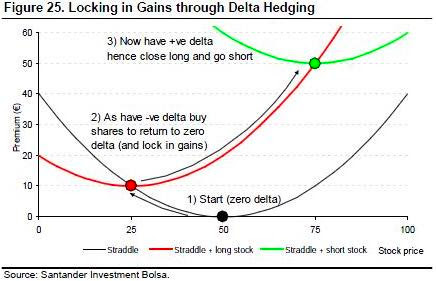
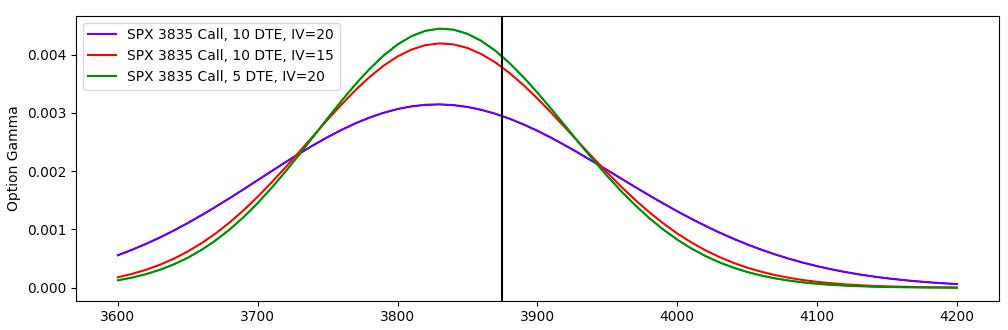
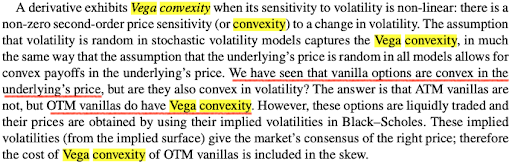
When trading these high-flying stocks, the level of risk often hinges on your exposure to vega. This risk can be mitigated by widening the gap between the closer long (+1) and farther away short (-2) options strikes.
Here’s the rationale.
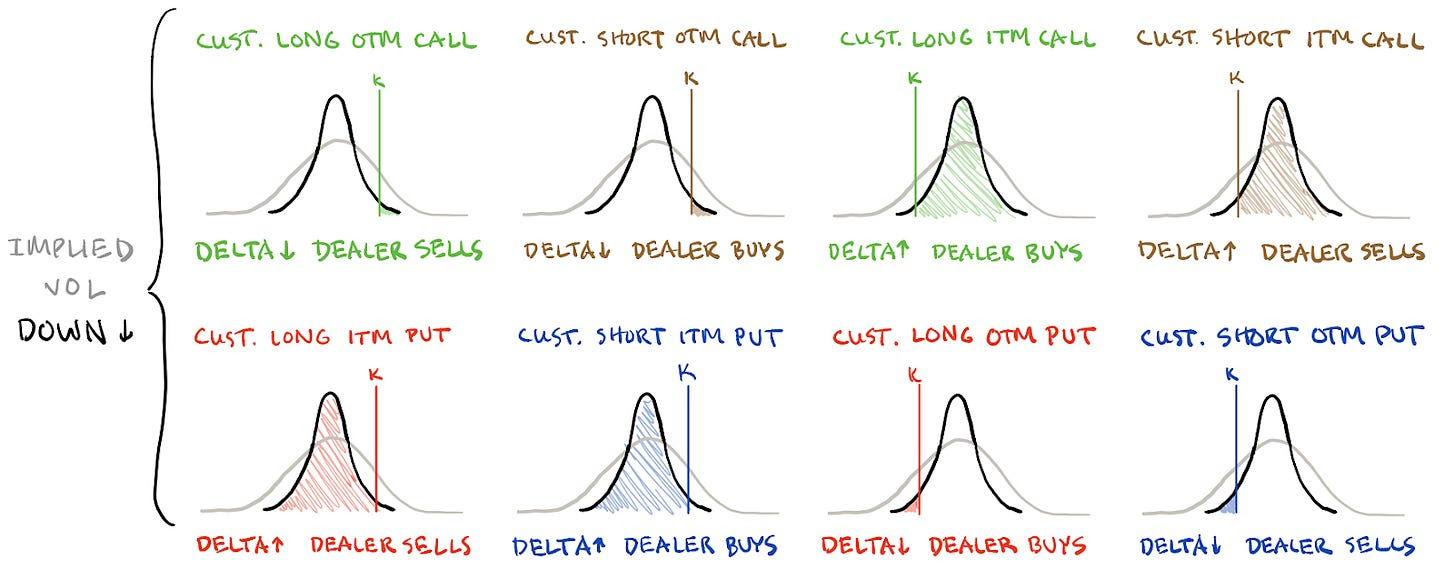
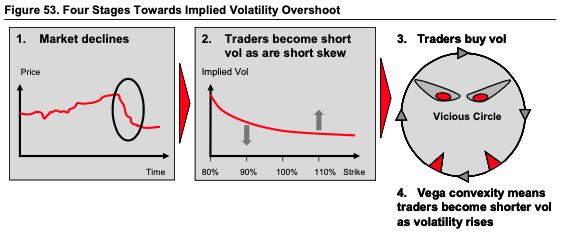
As the underlying asset moves along its skew curve, the impact of volatility on delta shifts, driven by increased implied volatility from options demand. Events, such as the market decline in 2020 and the meme stock frenzy in 2021, have illustrated how the implied volatility of out-of-the-money options can spike significantly more than the underlying asset’s movement.
Option exposures can exacerbate volatile situations through covering and hedging activities—a squeeze can occur caused by substantial movements and dramatic increases in options prices.
As mentioned last week, a straightforward method to assess the safety of such trades is by examining the pricing of fully in-the-money spreads. If these spreads trade at large credits to close, they are worth considering. Conversely, if the spreads require a debit to close, it’s advisable to steer clear. For those focused on the Greeks, aim for flat or positive exposure to vega.
Conclusions
In any case, the moral is as follows: many seem to be turning optimistic and raising their expectations while some pockets of irrationality, albeit not extreme, are popping up.
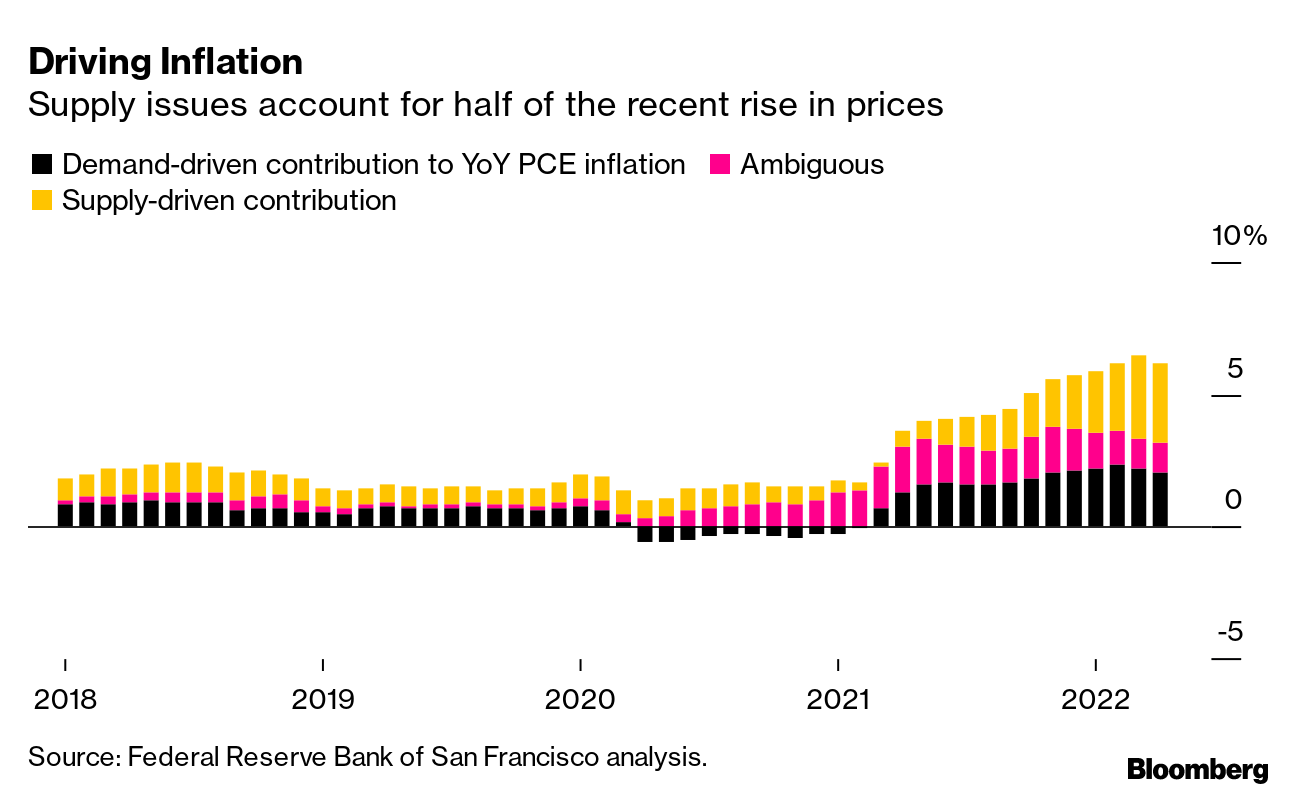
Sure, stocks may be cheap and not in a bubble to some, with added support coming from investors (re)positioning, earnings growth, and falling inflation, but there are slight shifts that may draw concern.
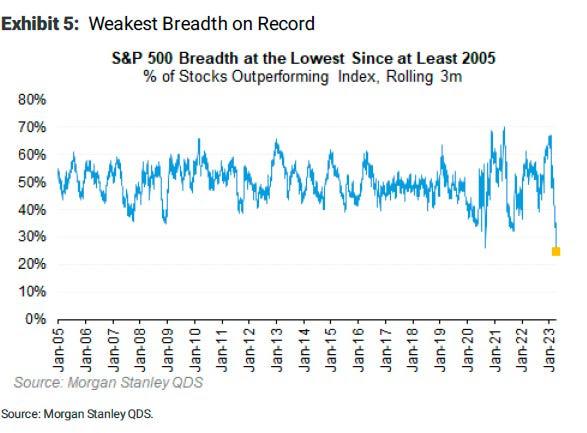
Such slight shifts can include the flattening of call skew, foreshadowing a waning appetite for risk, and potentially heralding market softness. Additionally, SpotGamma’s Brent Kochuba has shared data that points to lower correlations aligning with interim stock market highs, presenting more cause for caution.
While the allure of record highs may be enticing, we look to lock in some inflation protection as shared last week, participate in the upside creatively, be that in metals or high-flying stocks, and hedge using similarly creative structures on the downside, albeit much wider and with protection (e.g., Long Put Butterfly), and favorable Greeks (-delta, +gamma, +vega). There are many more details to add, but we will finish here to publish the newsletter as soon as possible. Cheers!