Good Morning! I hope you had a great weekend and enjoy today’s letter. I would be so honored if you could comment and/or share this post. Cheers!
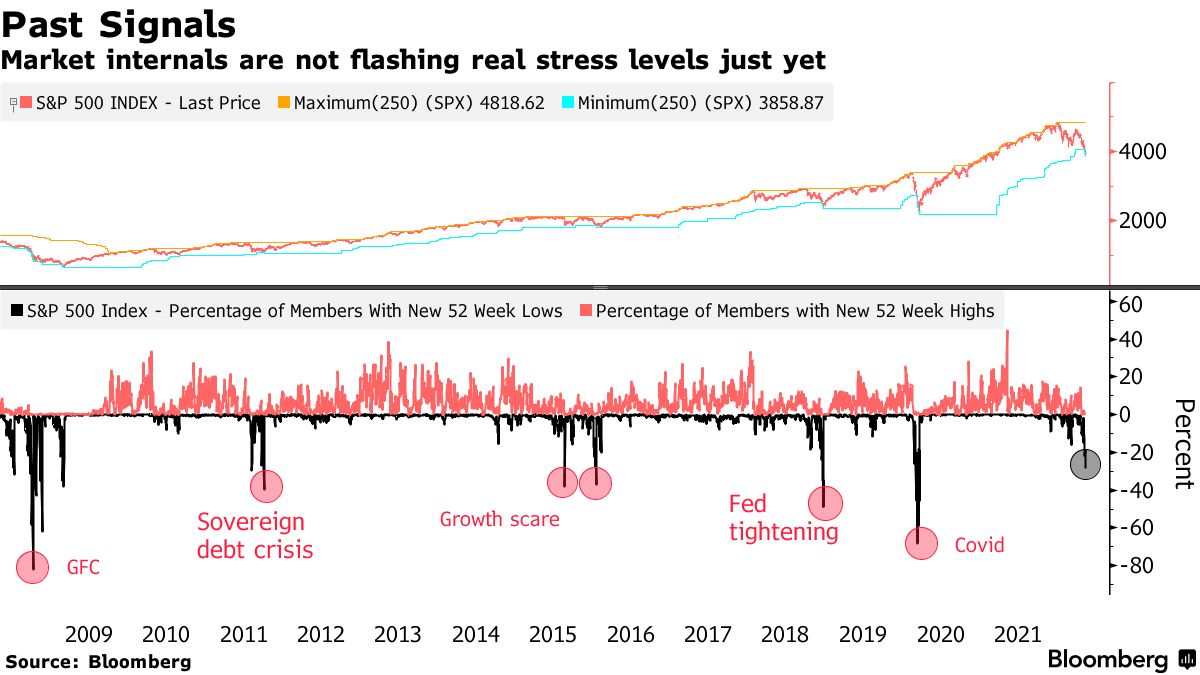
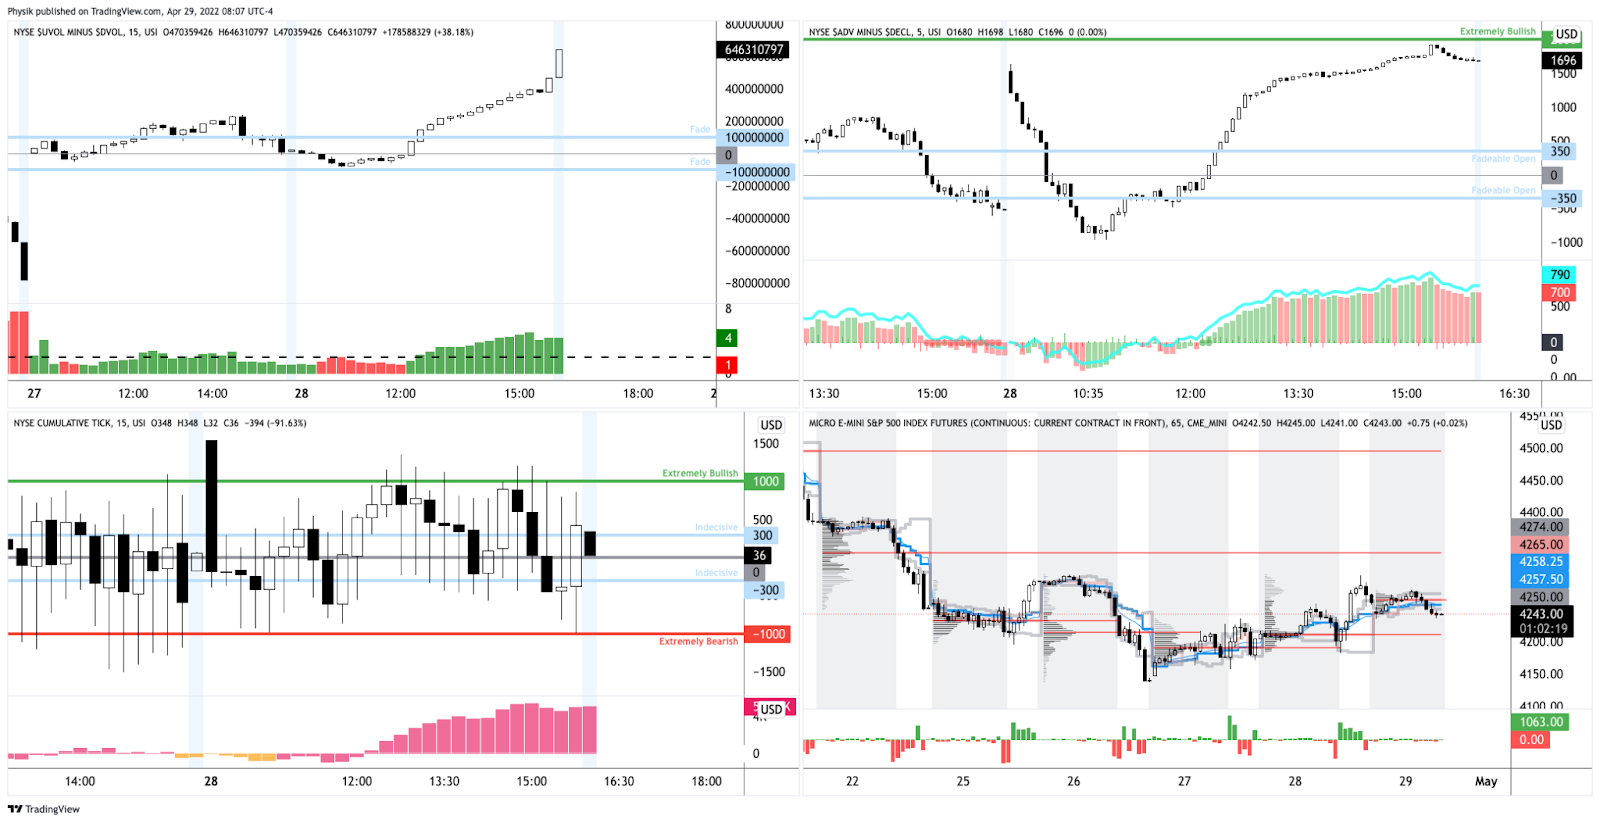
After a period of taking the stairs up, markets took the elevator down last week. Through Tuesday, the S&P 500 fell over 2.5% on a Consumer Price Index (CPI) print, which signaled higher-than-expected inflation. Internally, the selling was heavy.

Additionally, options were repriced in a big way.
Let’s digress.
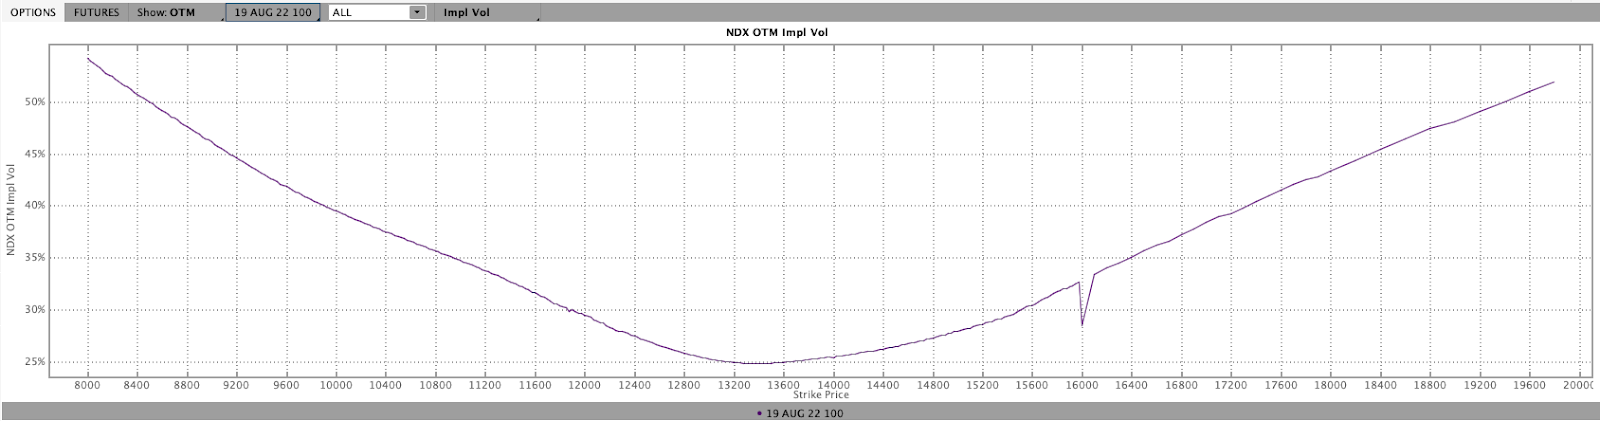
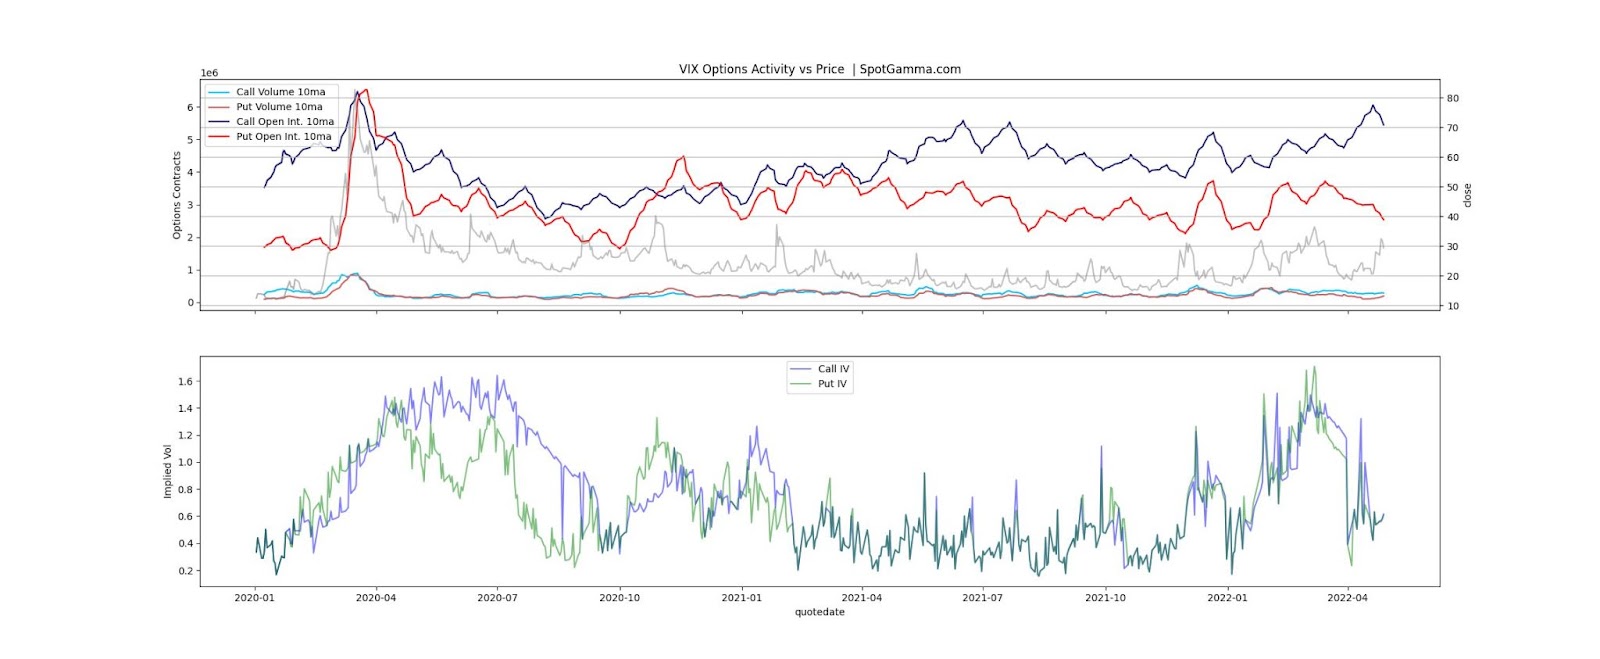
Recall that options implied volatility is a measure of the market’s expectation of the future volatility of an underlying asset, as reflected by the supply and demand of options themselves. Higher implied volatility indicates more significant expected price fluctuations.
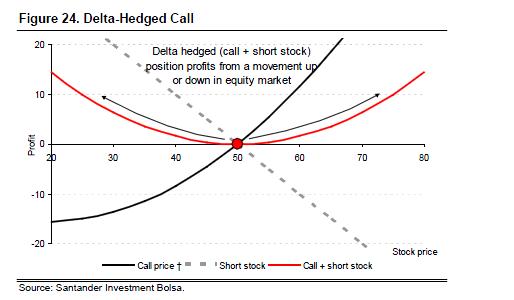
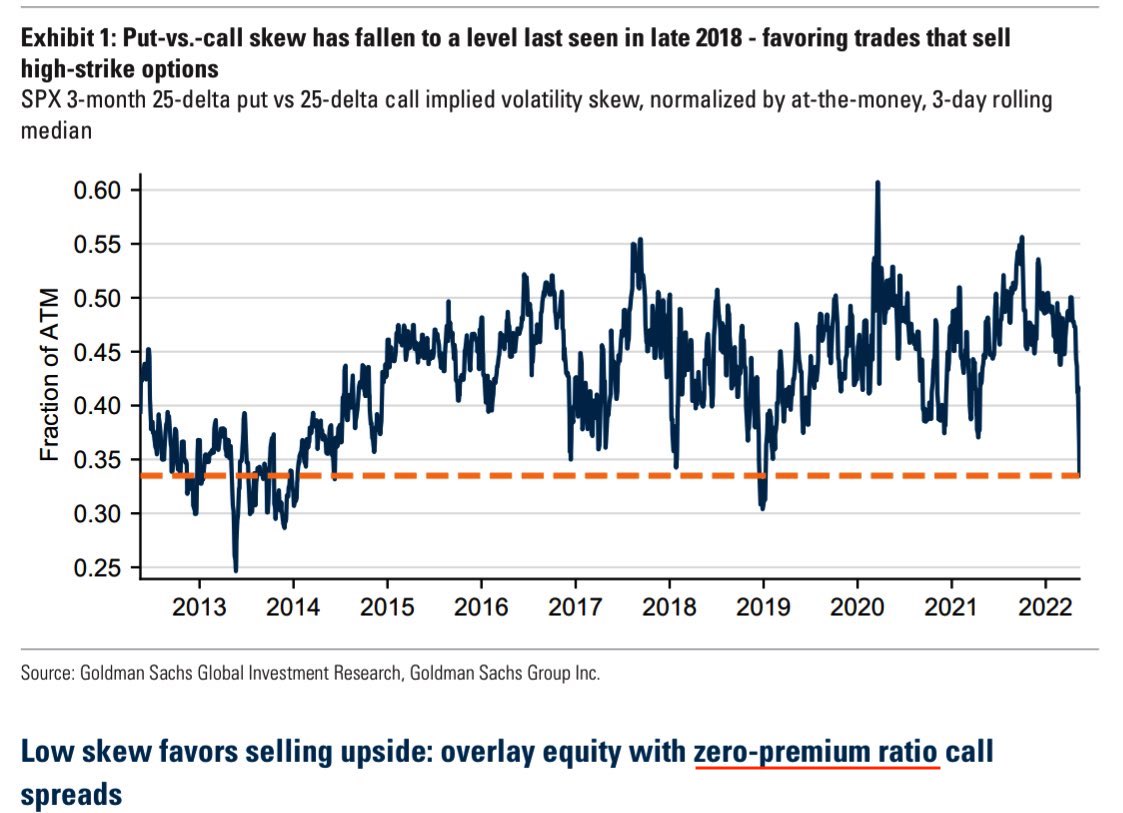
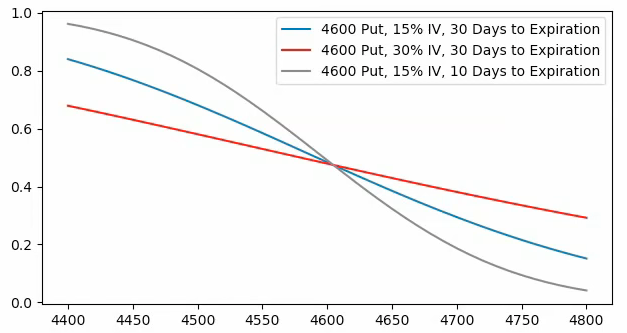
Options implied volatility skew refers to the unevenness in implied volatility levels across different strike prices. Steep, smile-looking, or v-shaped volatility skew reflects a scenario where increased market volatility disproportionately impacts farther away strike options due to (expected) losses from more frequent delta rebalancing in a moving market. Options traders assign higher implied volatility to those farther away strike options to compensate for increased risk/cost, often enabling savvy traders to exploit these variations to reduce their hedging costs.
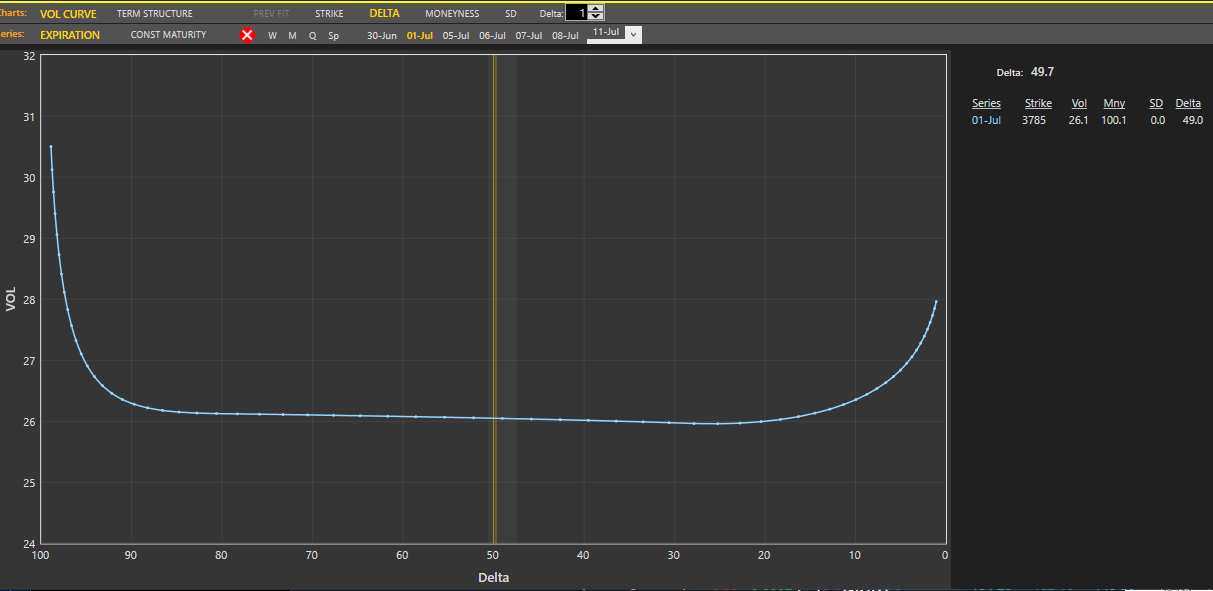
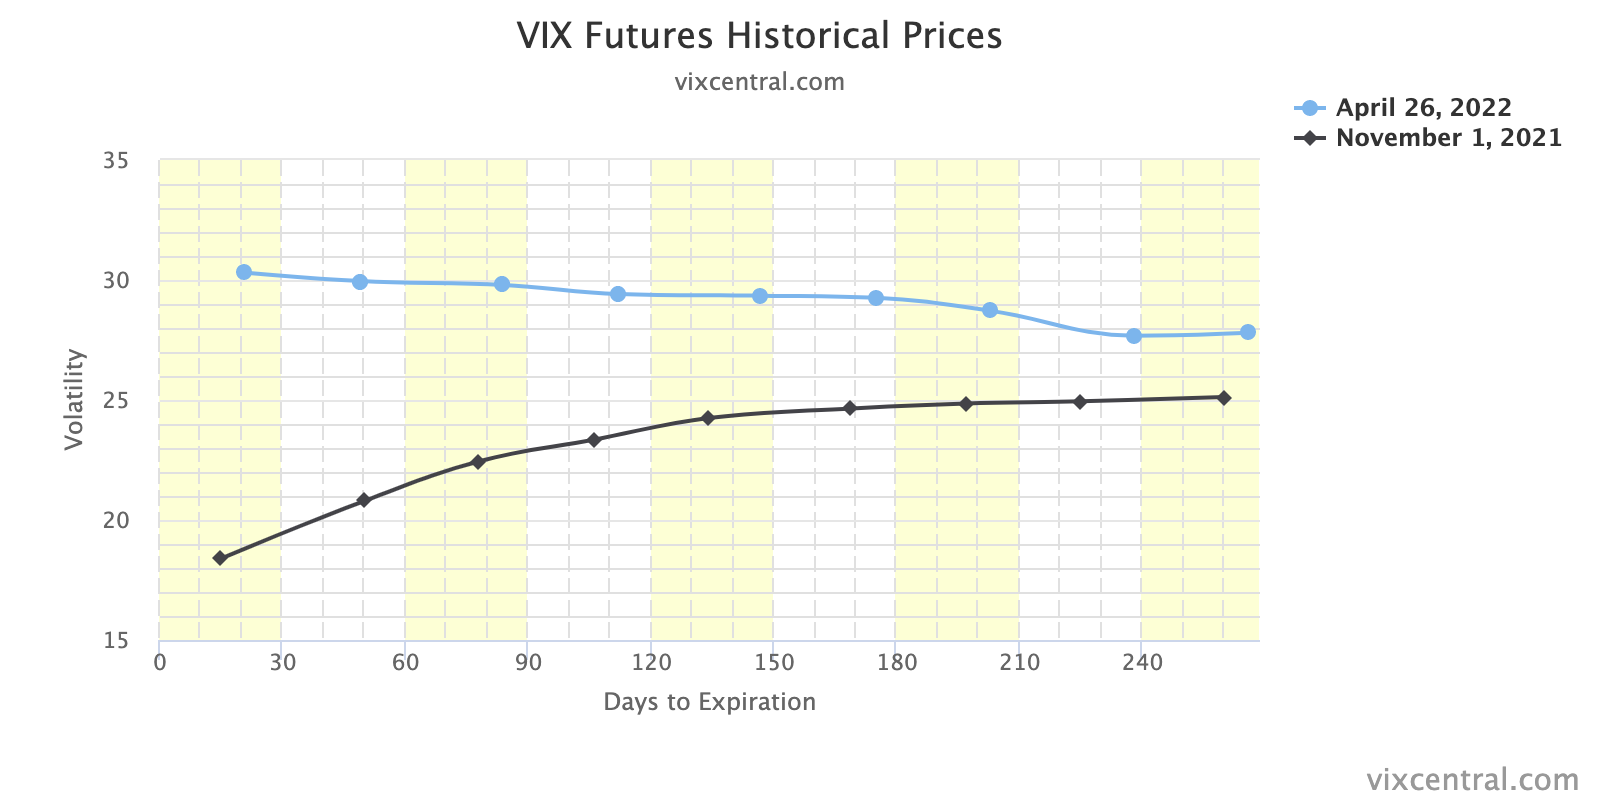
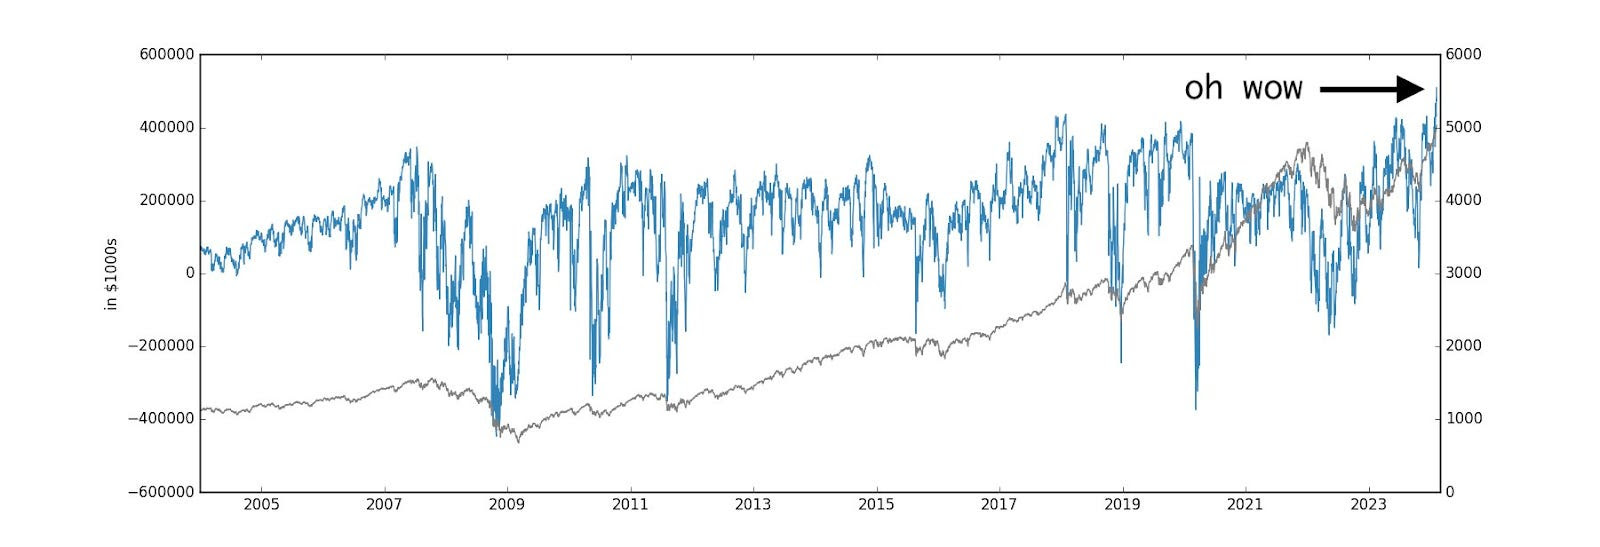
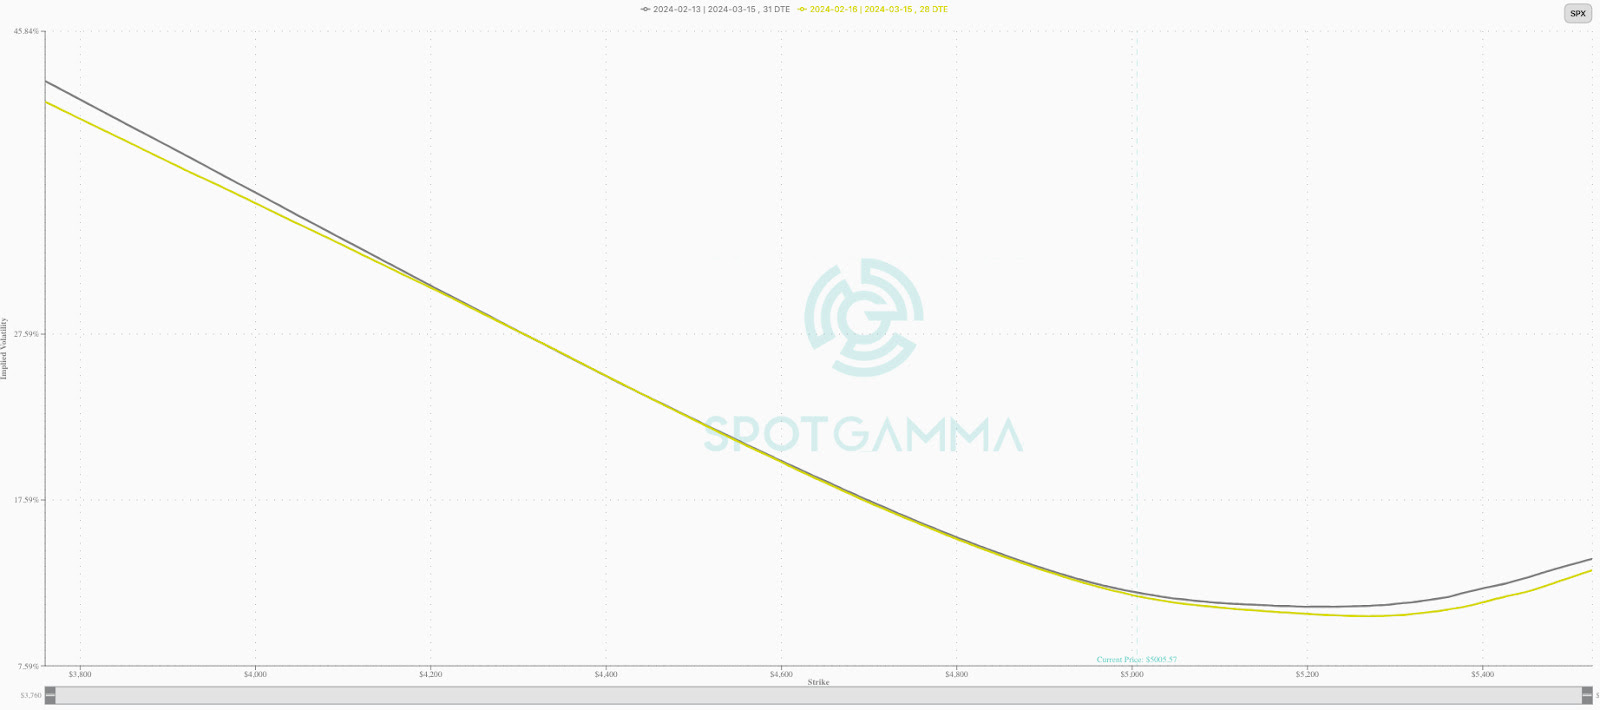
Moreover, before last week’s drop, the S&P 500’s implied volatility skew was subdued, as indicated by the grey-shaded area below. Tuesday’s decline coincided with increased options trading activity and demand, leading to a notable upward shift in skew. Distant S&P 500 put options experienced significant increases in implied volatility (see the below grey line moving away from the shaded area).

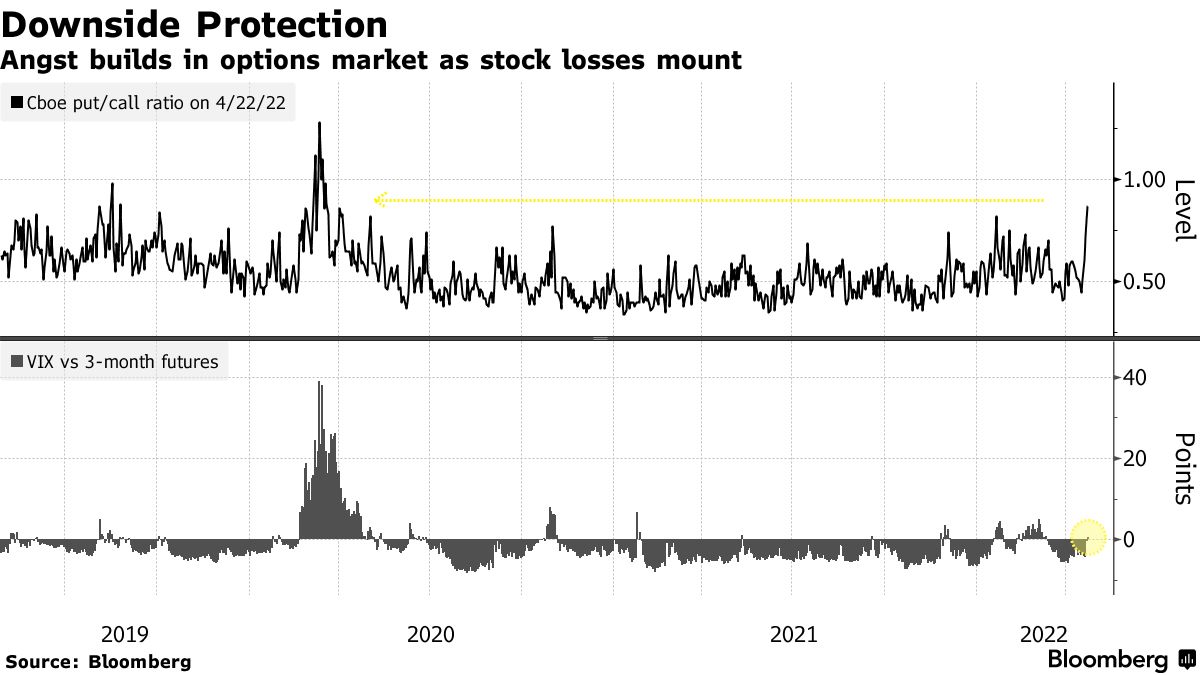
Though skew remains elevated, broader implied volatility measures, such as the Cboe Volatility Index or VIX, declined as rapidly as markets rallied in the days following Tuesday’s downturn.
What’s happening?
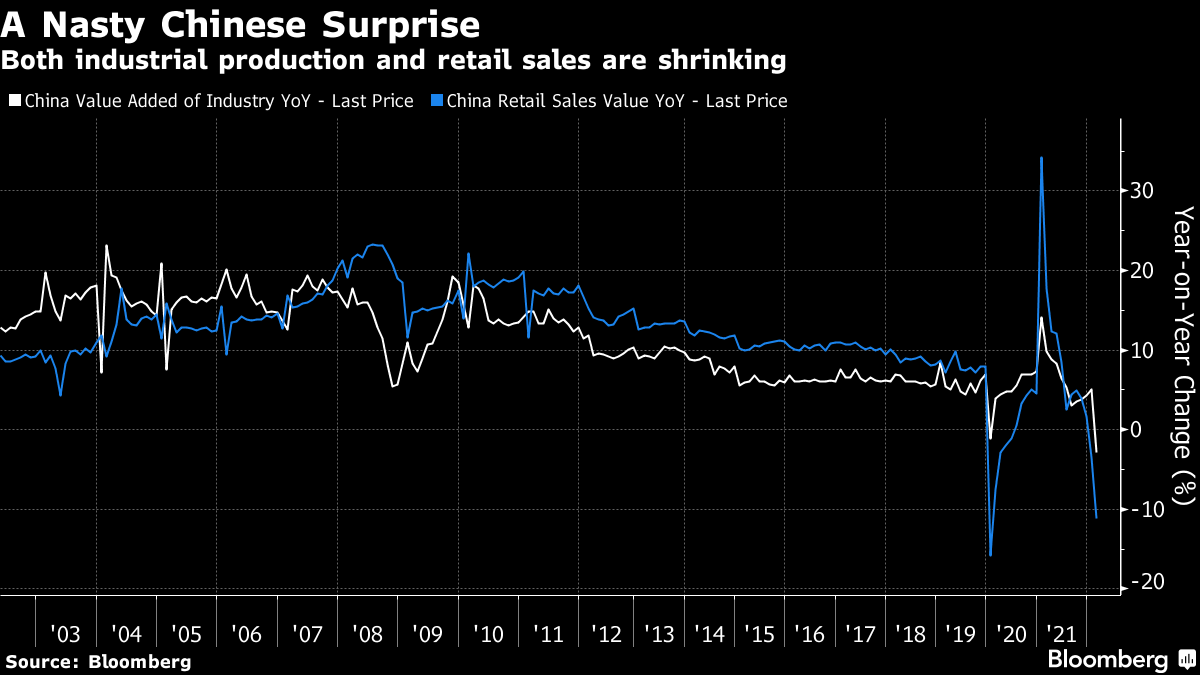
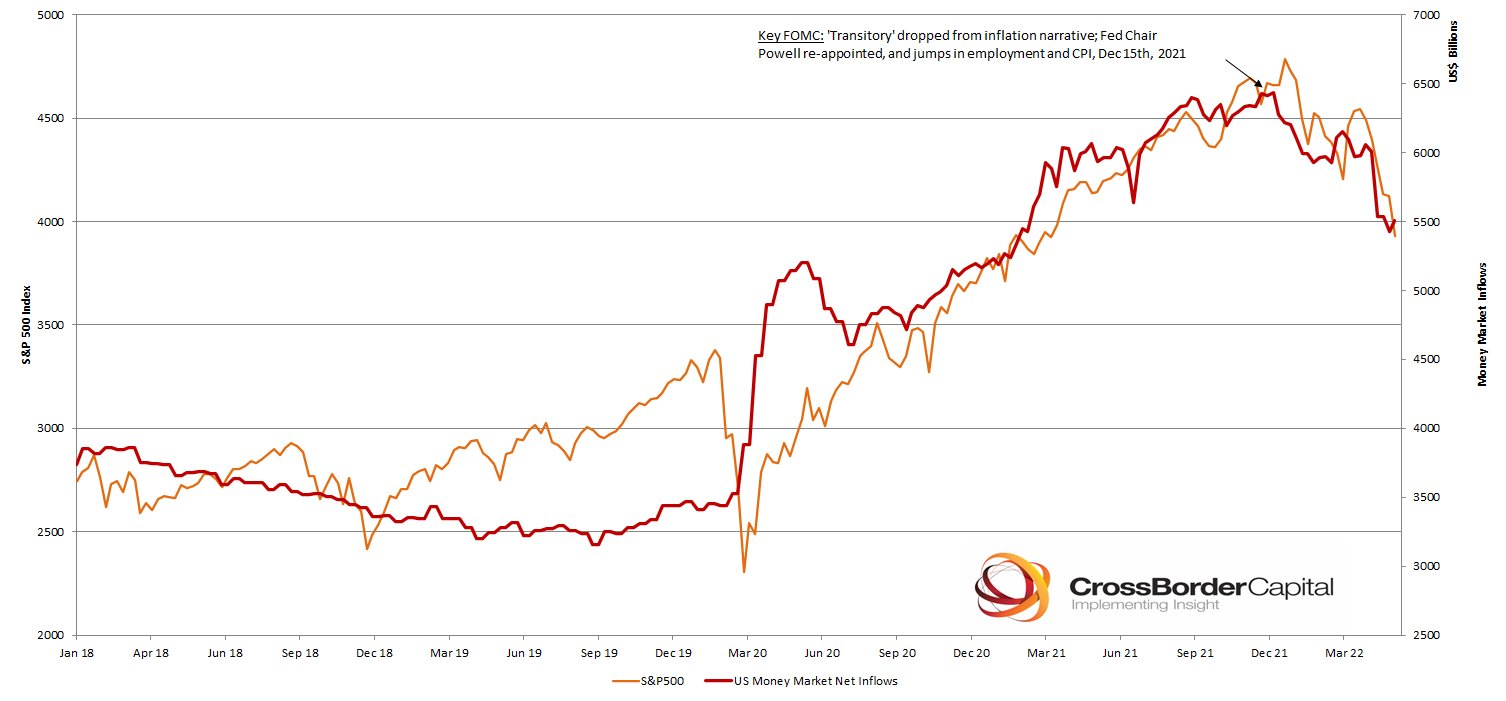
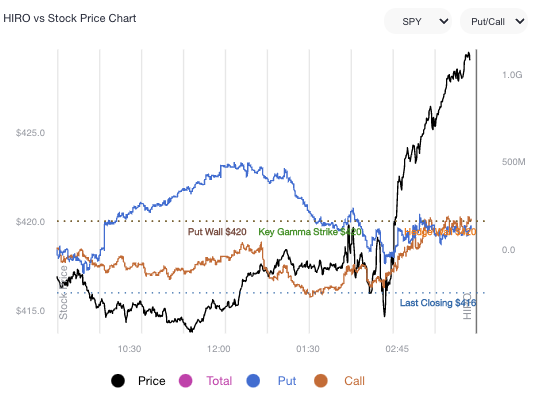
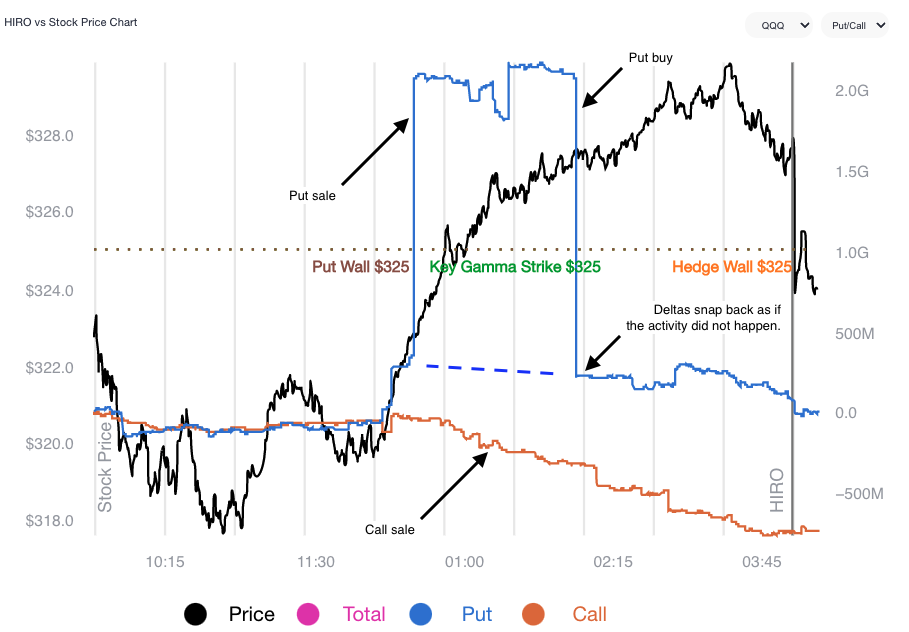
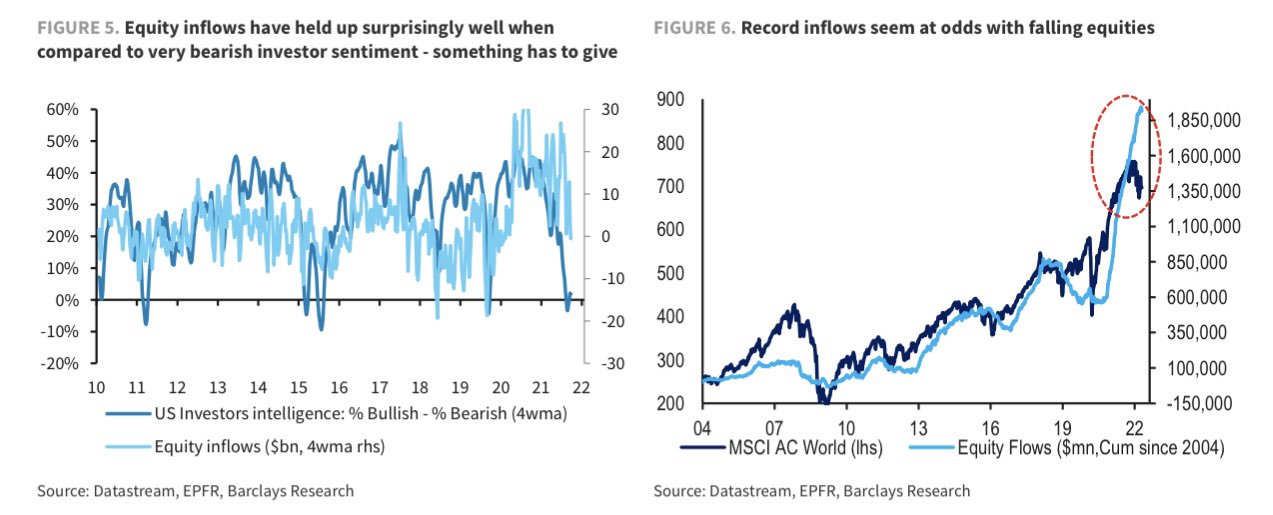
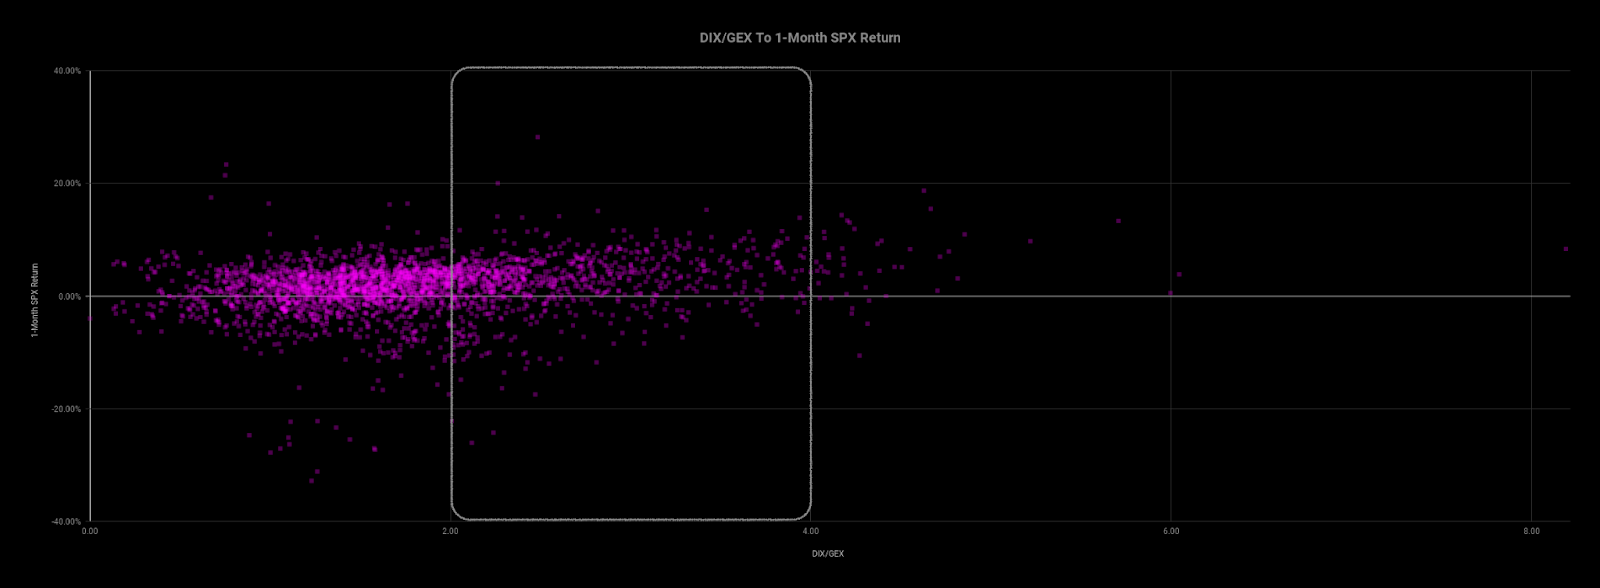
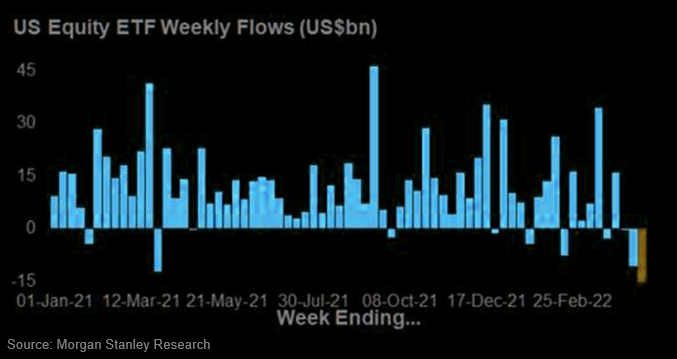
Despite further negative economic indicators, such as hot producer prices or weaker retail sales and manufacturing output, markets surged strongly, closing the week almost unchanged. Beyond significant investor inflows into stocks, totaling approximately $16 billion on Wednesday, according to Bank of America Corporation, analysis of S&P options positioning revealed mechanical demand for the S&P 500, as highlighted by SqueezeMetrics. Higher implied volatility strengthened an automatic buying mechanism, supporting markets.
This phenomenon is partially attributed to the significant options selling discussed in our recent newsletters, acknowledging the warnings issued by Cem Karsan of Kai Volatility and Kris Sidial of The Ambrus Group. Essentially, there’s been a rush among options sellers to enter into sizable positions, exemplified by the substantial options selling activity observed last week. UBS Group highlighted the persistence of this concerning toxic flow, noting aggressive trader actions, such as the sale of “70K of Thursday expiry 4120 puts at 0.05 on Wednesday.”

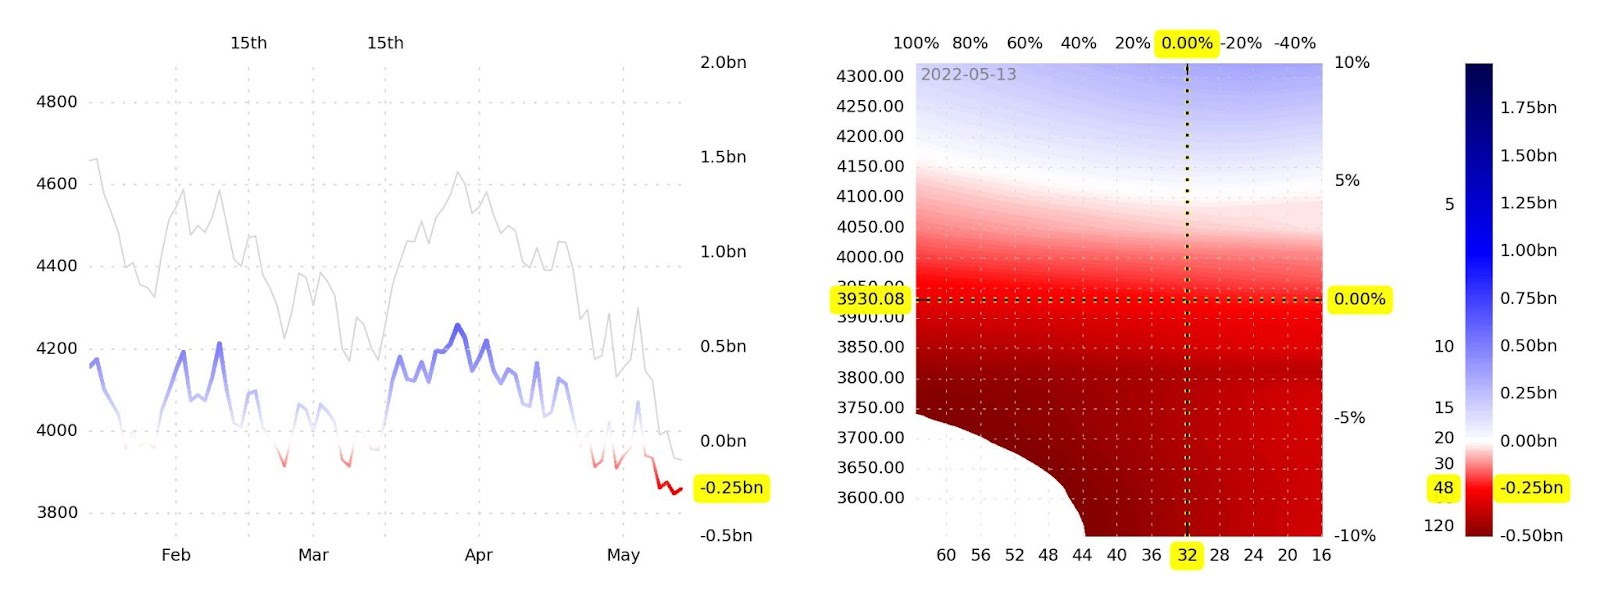
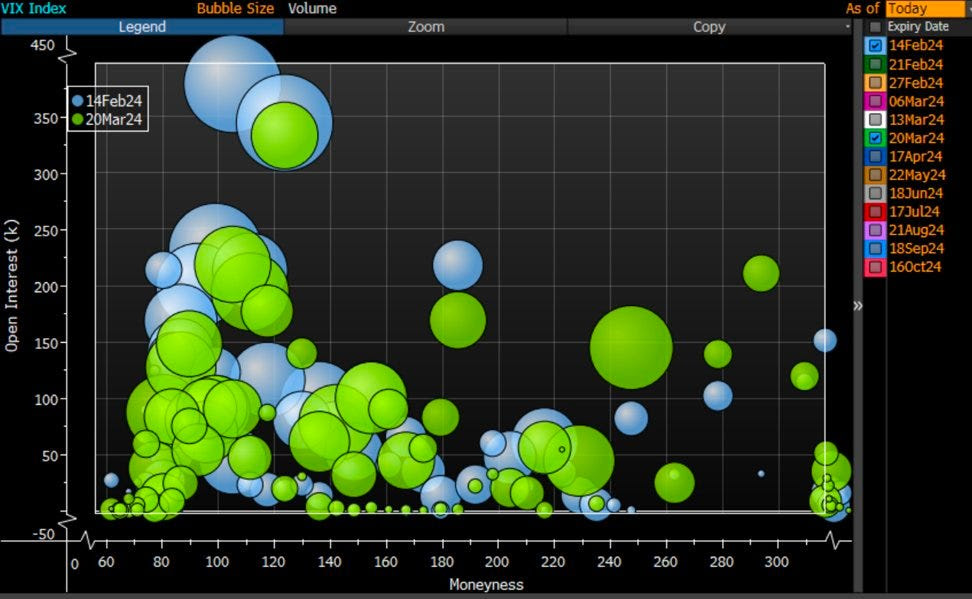
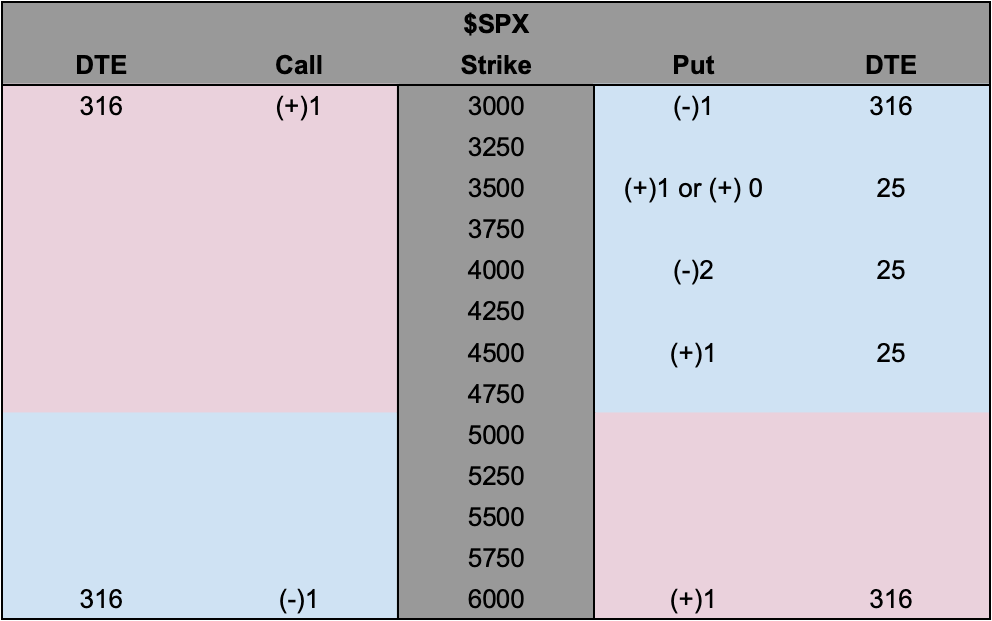
The estimated risk profile of this position is provided below (please allow for a margin of error of a day or two due to expiry). Essentially, it’s unfavorable, with the option seller at risk of losing much money if the market drops or implied volatility increases. Please be aware that we’re assessing this position independently, without knowledge of the option seller’s overall portfolio, including potential risk offsets from other positions they may hold.
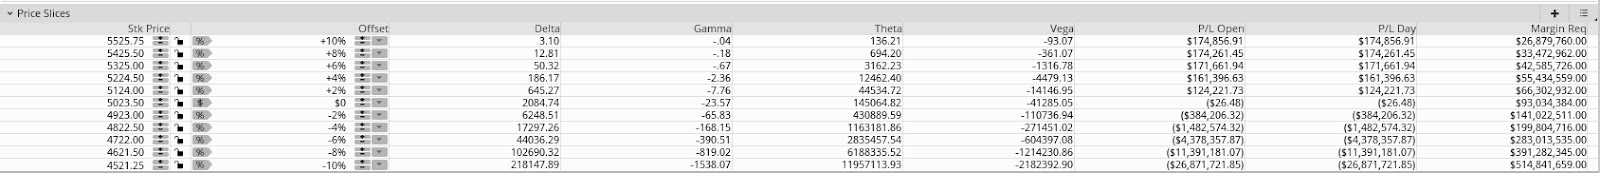
Customers favoring such positive delta “short skew” positions prompt dealers on the other side to assume a negative delta (i.e., make money if the market is lower or implied volatility is higher) “long skew” or “long options” position, which they may manage through the sale of put options or the purchase of call options, underlying stock shares, or futures for hedging purposes. For a deeper understanding of these mechanisms, refer to SqueezeMetrics’ paper, “The Implied Order Book.”

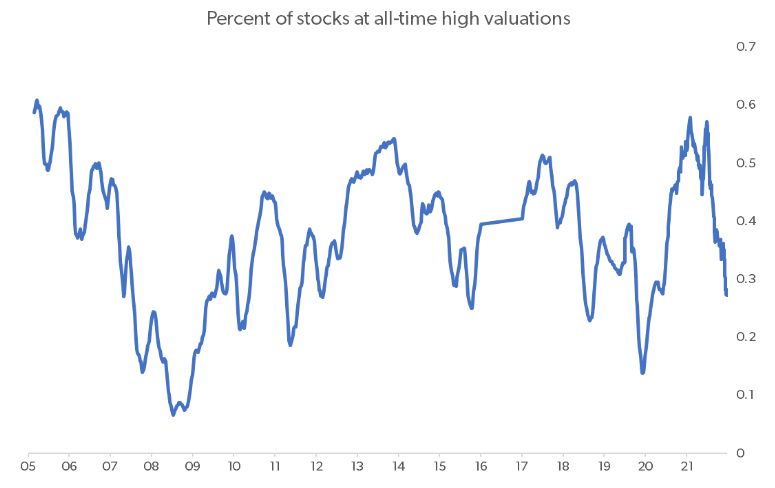
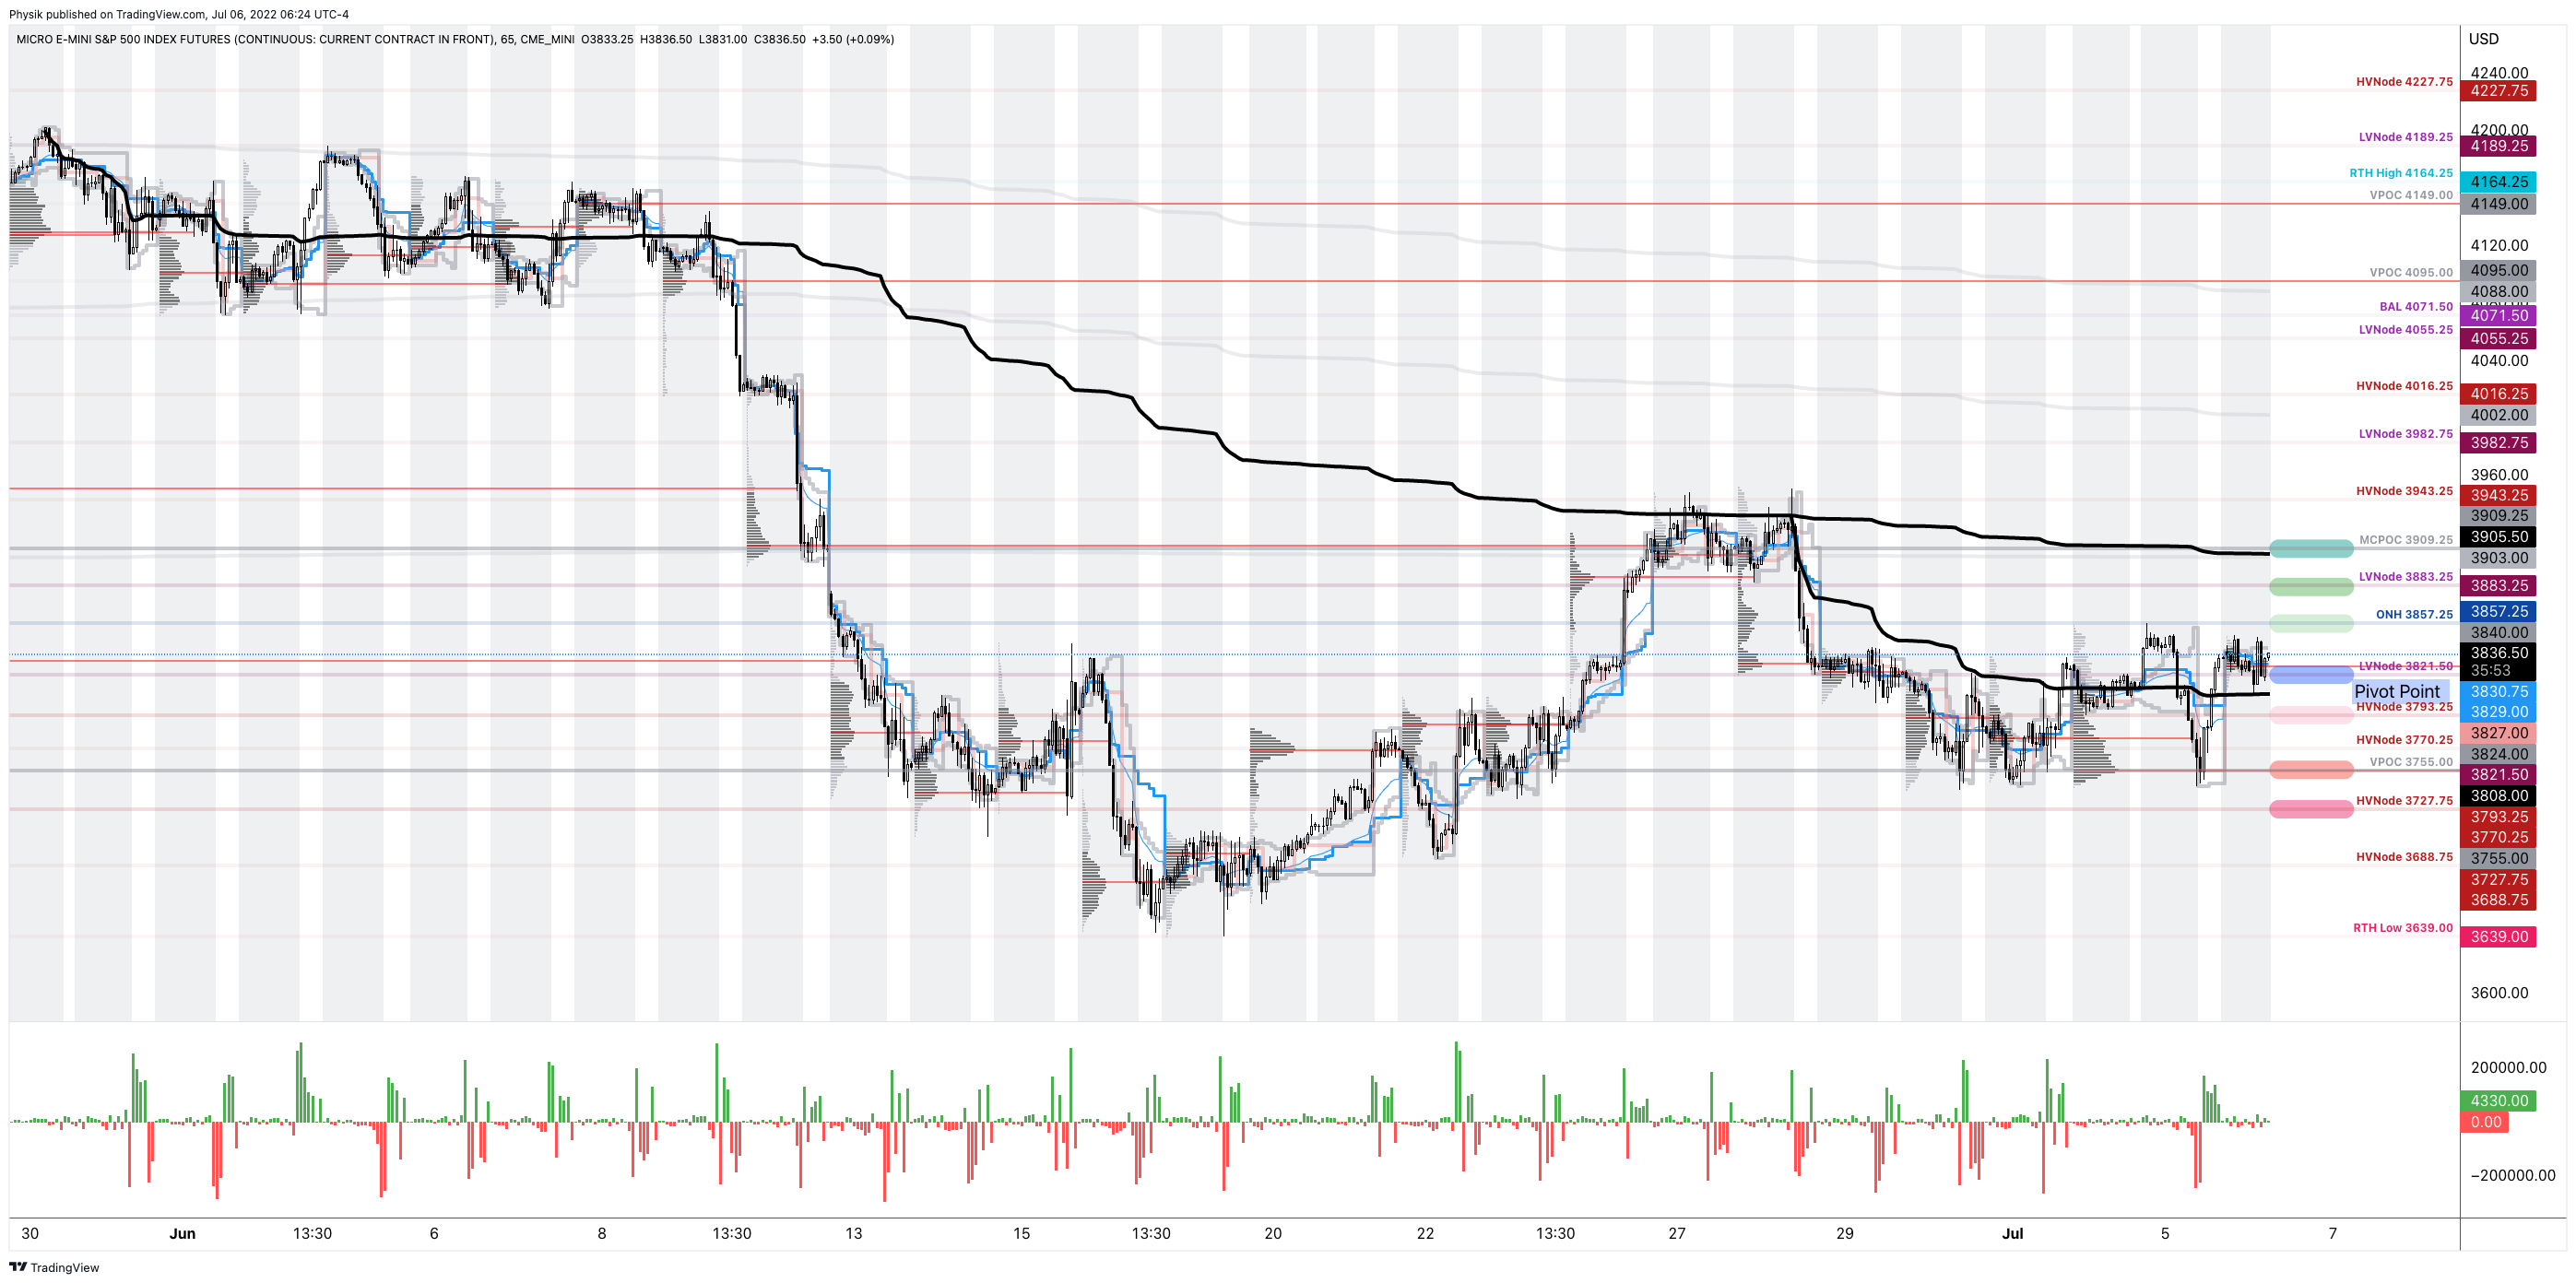
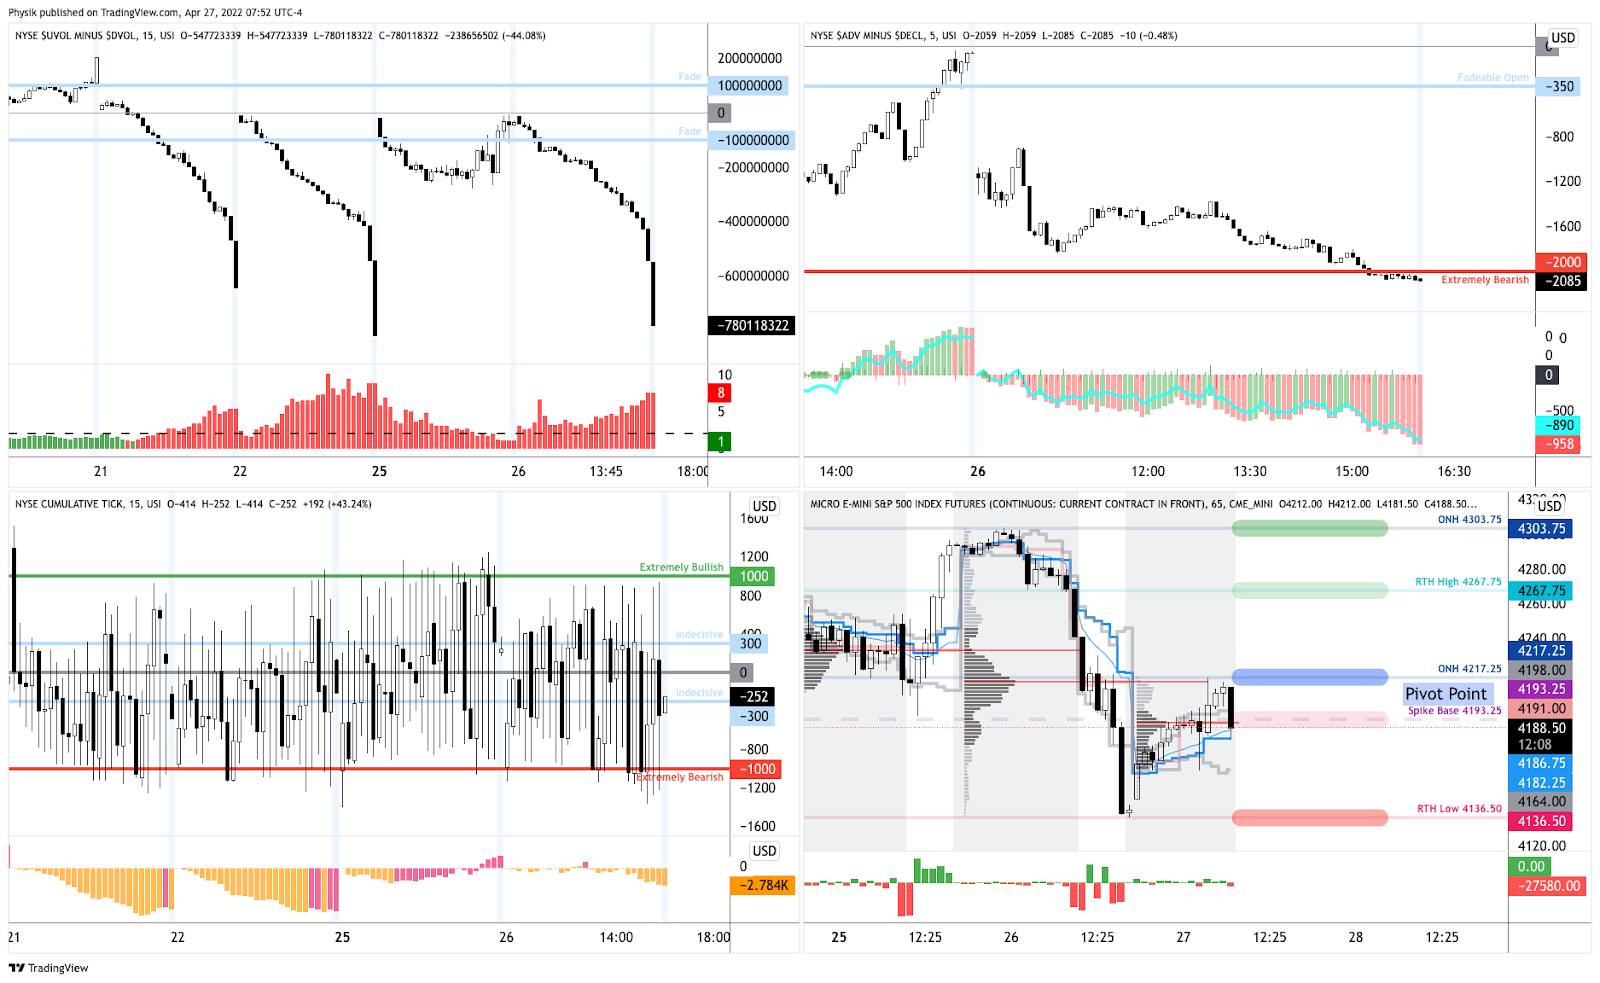
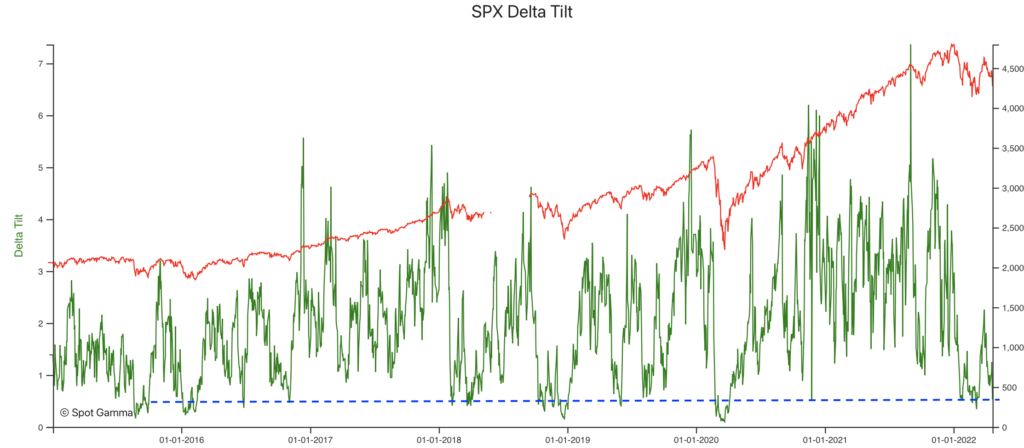
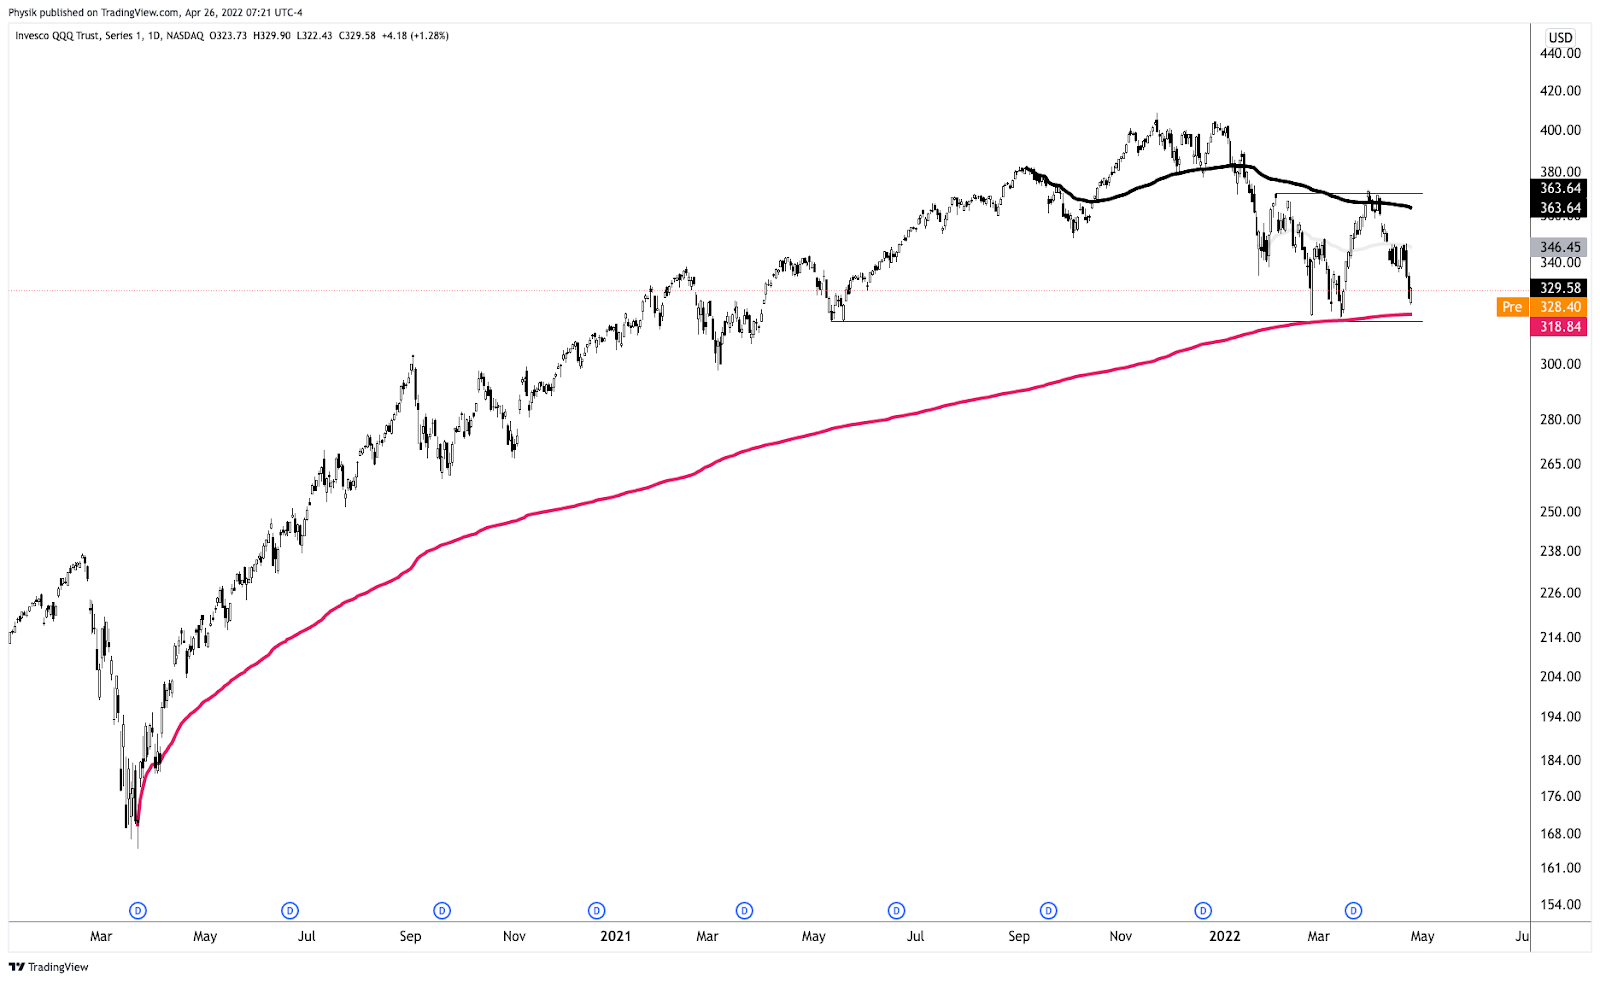
This all happened during a seasonally weak period. We’ll go past the positioning side of things in a moment, so bear with me, but you can see the drop-off in options deltas following mid-February below.
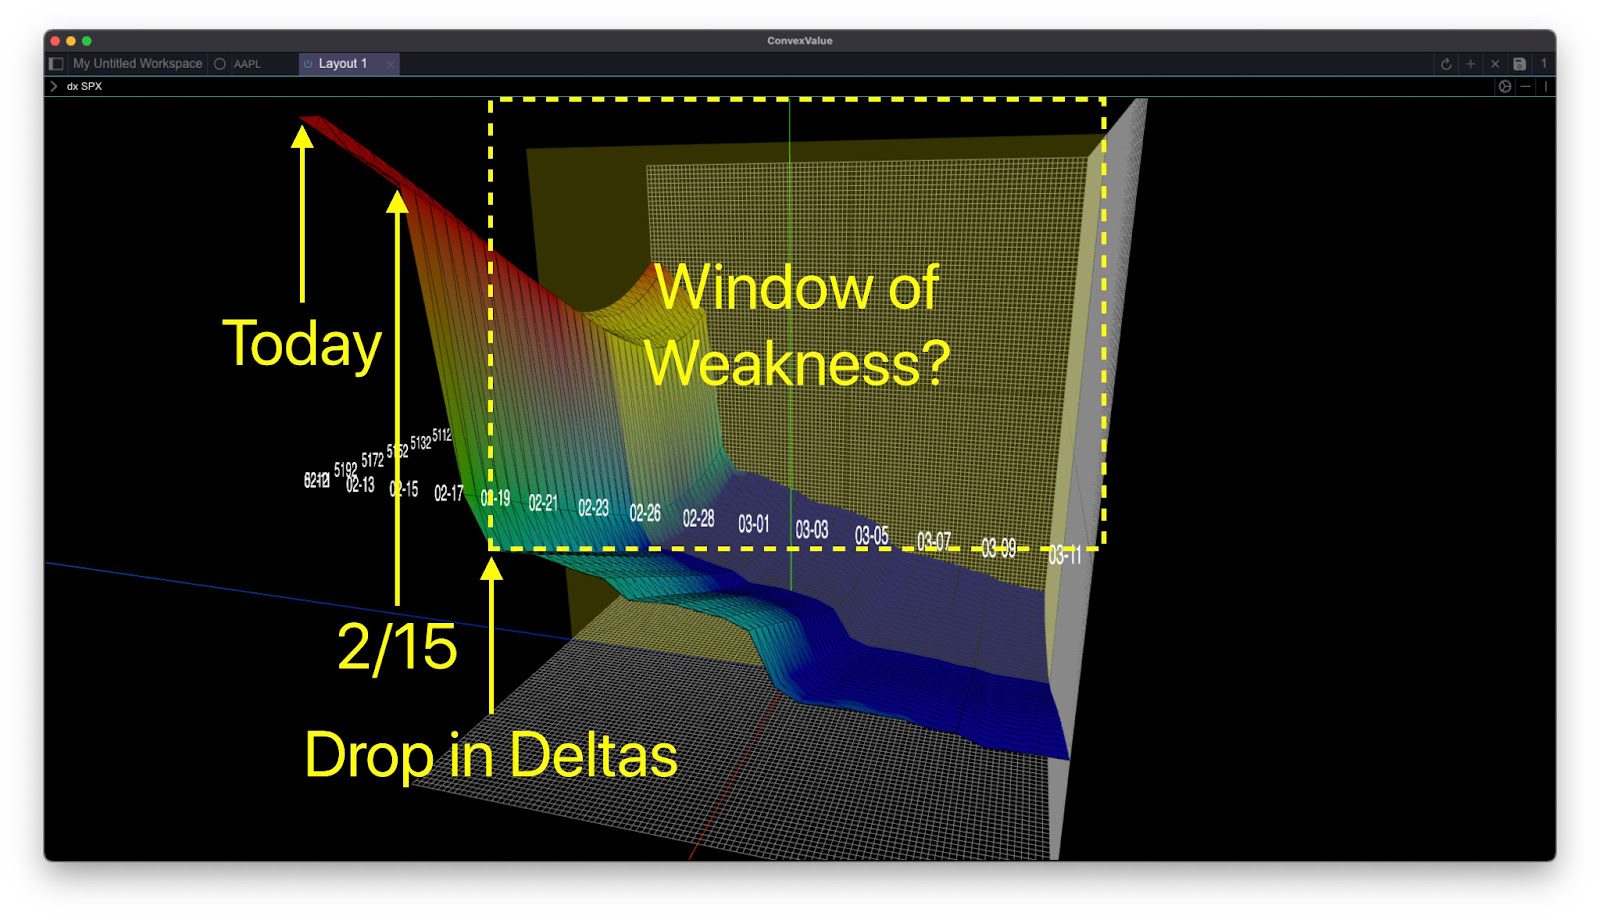
In essence, despite the anticipated reduction in options-based support, which Cem Karsan describes as a “window of non-strength” or a scenario conducive to increased volatility, the market’s reaction to Tuesday’s drop stemmed volatility. Observing these dynamics in real-time, here’s how we responded.

We had proactively positioned ourselves for a potentially weaker February, capitalizing on overlooked hedge opportunities outlined in recent newsletters—specifically, put spreads like butterflies. Others did similar, with Nomura Americas Cross-Asset Macro Strategist Charlie McElligott noting increased buying of put butterfly spreads in recent weeks (please see our late January and early February letters).
Depending on their setup (including the distance between strikes, the distance from the spot price, and the expiration timeframe), these spreads were positioned to profit from market declines. When the drop occurred, the unbalanced, very far out-of-the-money structures were priced to be closed at a small debit loss when the skew elevated substantially. Utilizing real-time analysis, we concluded it was opportune to increase our exposure to these far out-of-the-money units, capitalizing on the surge in implied volatility while cashing in on the closer spreads priced for a credit profit.

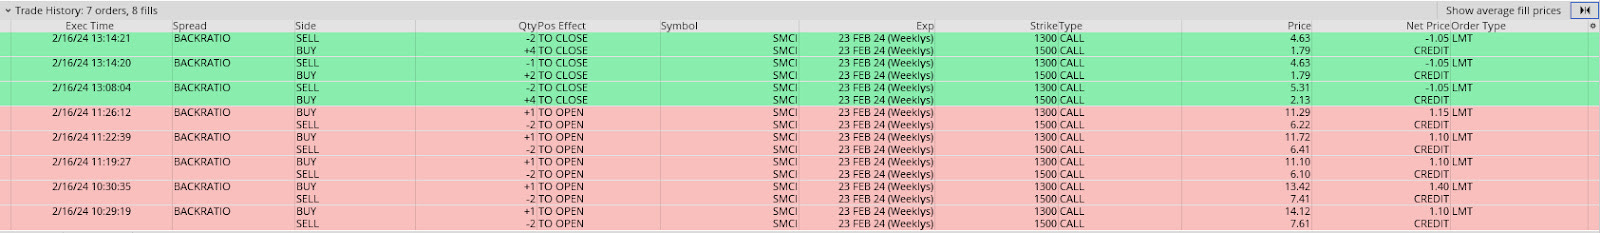
As markets recovered, we closed the recently initiated riskier spreads, freeing up buying power for opportunities elsewhere, such as in NVIDIA Corporation (NASDAQ: NVDA) and Super Micro Computer Inc (NASDAQ: SMCI), where a significant volatility skew, driven by heightened call options trading, enabled us to generate credit from short-dated spread trades.
By Friday’s end, we achieved one of our most successful weeks of the year, boosting our confidence and reinforcing our patience with underperforming trades, like the put butterfly hedges. PAY-tience!
What motivated our actions? Let’s elaborate.
Tactically, we favor owning options to express our opinions efficiently selling options further out to reduce costs. Occasionally, we will utilize a ratio, such as selling two options for every one purchased. For those less experienced, simplicity often proves effective. Consider straightforward approaches like purchasing a wide put vertical, entailing buying a put, and selling a put at some greater distance. Depending on your position, the returns may come in at multiples of each unit of risk undertaken.
Furthermore, the speculative trading and crowded positions in equities (as previously discussed in this and prior newsletters), along with the persistent volatility skew (as indicated by the yellow line compared to the grey line below), imply that hedging strategies (such as owning longer-dated calls and selling stock/futures as a combination, or using put option spread strategies to hedge shares) may continue to be appealing.
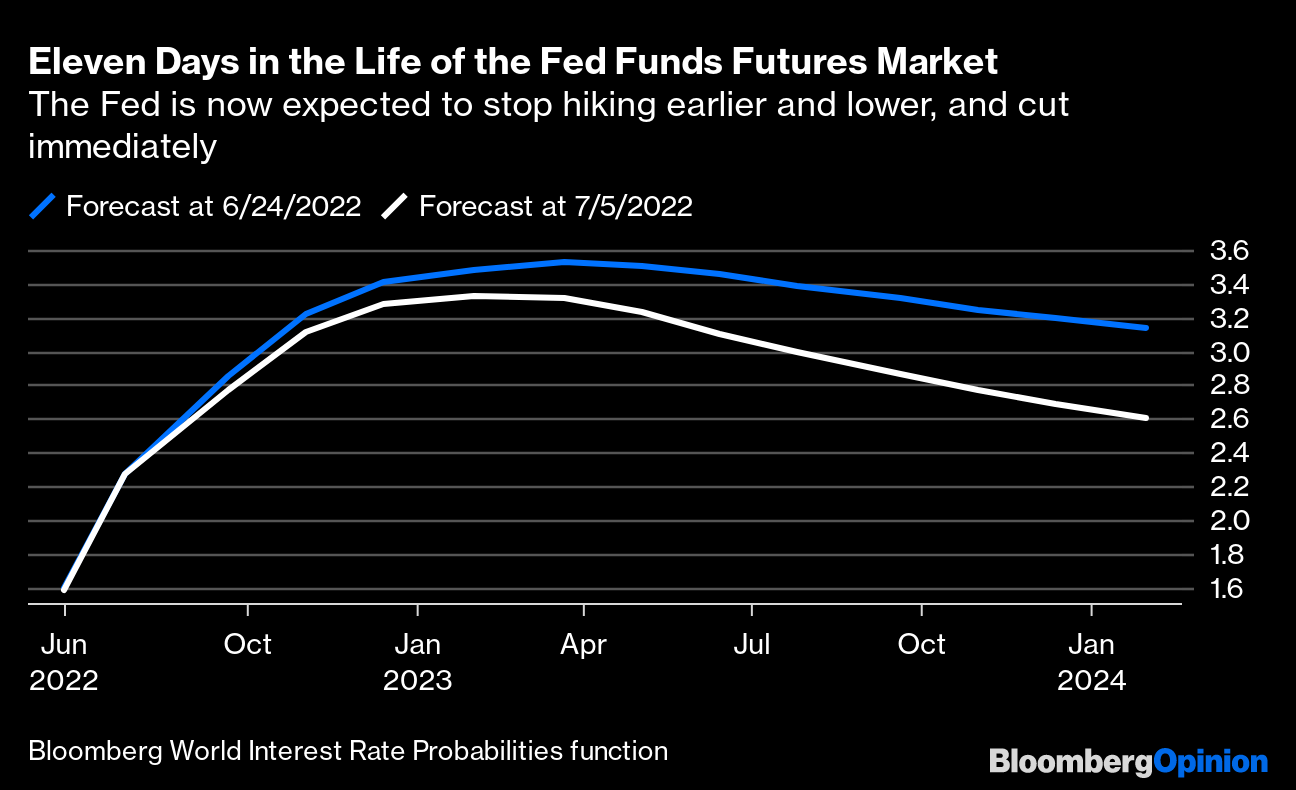
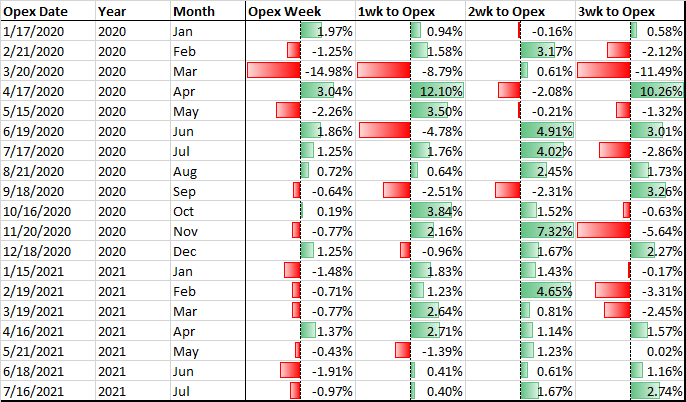
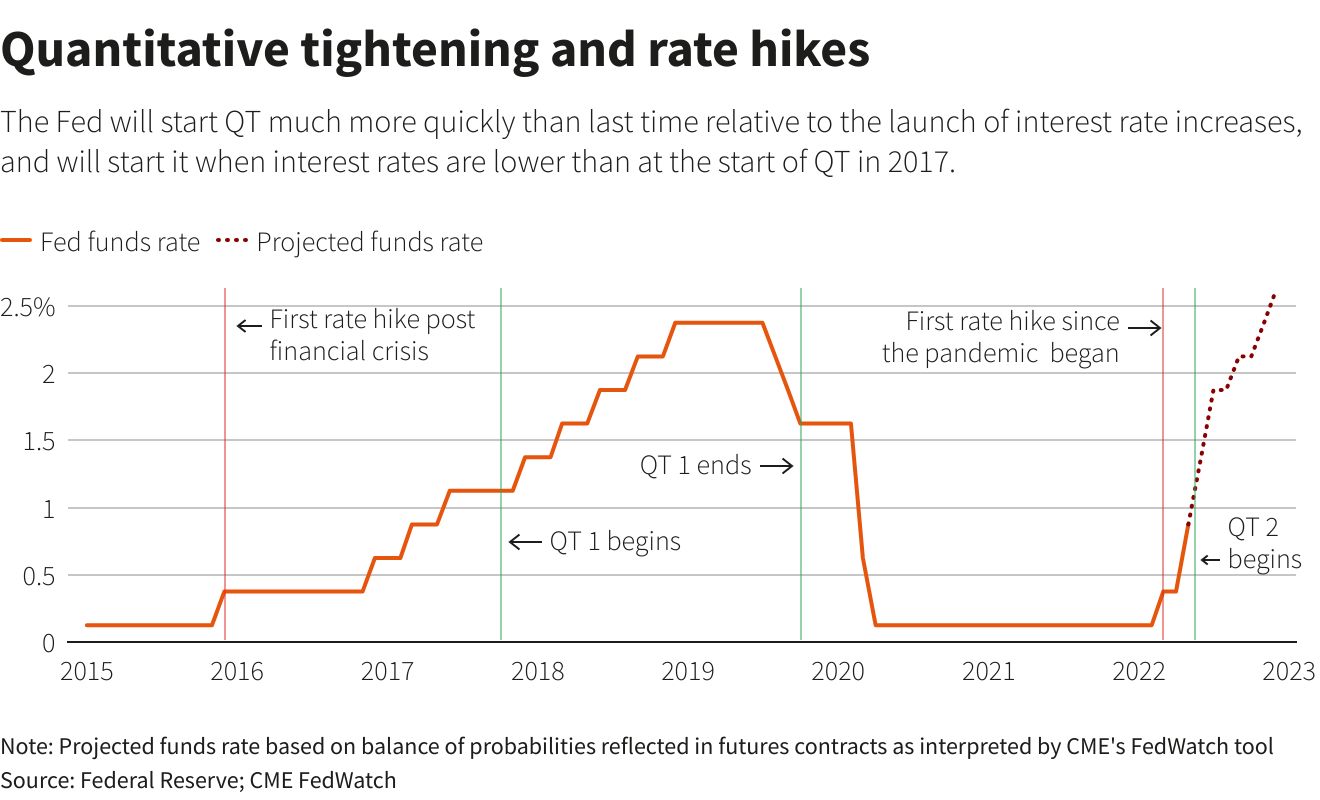
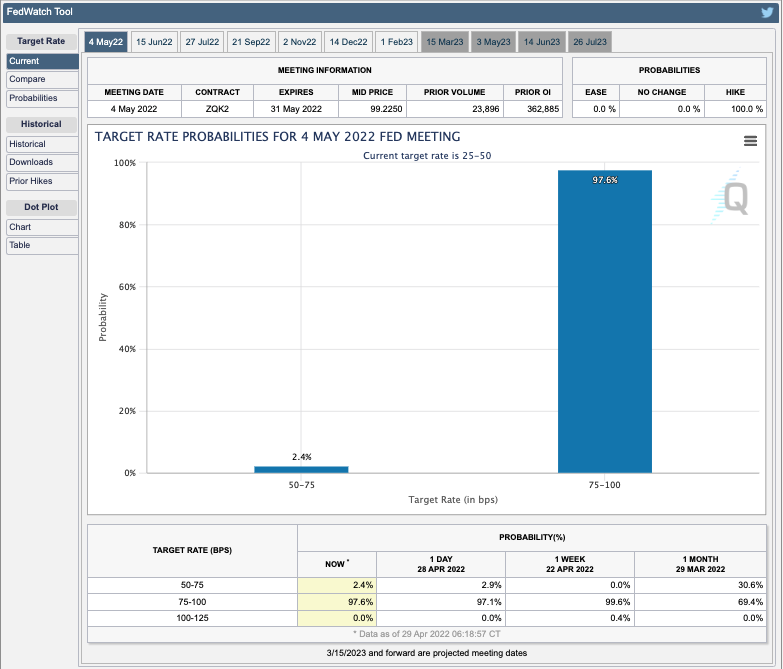
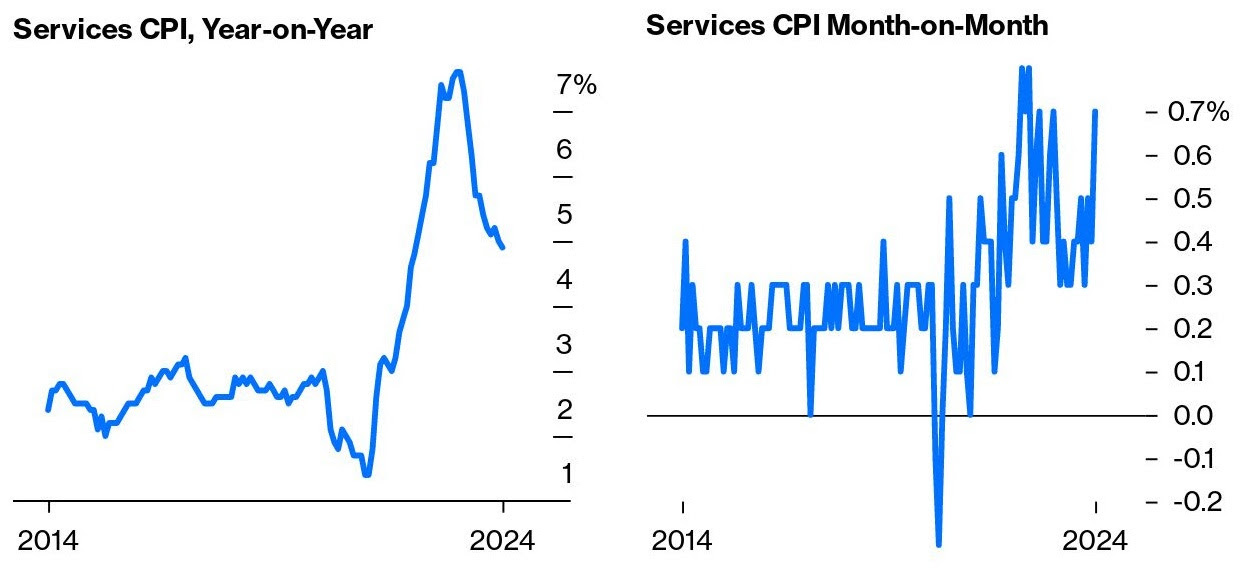
In terms of what to hedge, as highlighted by Fallacy Alarm, mid-February traditionally signals local market peaks due to significant cash injections followed by selling pressure to cover tax obligations. Additionally, a dilemma presents itself: should the focus be on combating inflation or stimulating growth? Presently, the data would dissuade anticipated rate cuts, though such actions might be contemplated if the Personal Consumption Expenditure, a key metric, points to lower price increases, particularly in services. Current interest rate projections suggest a bimodal scenario with a low probability of sudden rate declines.
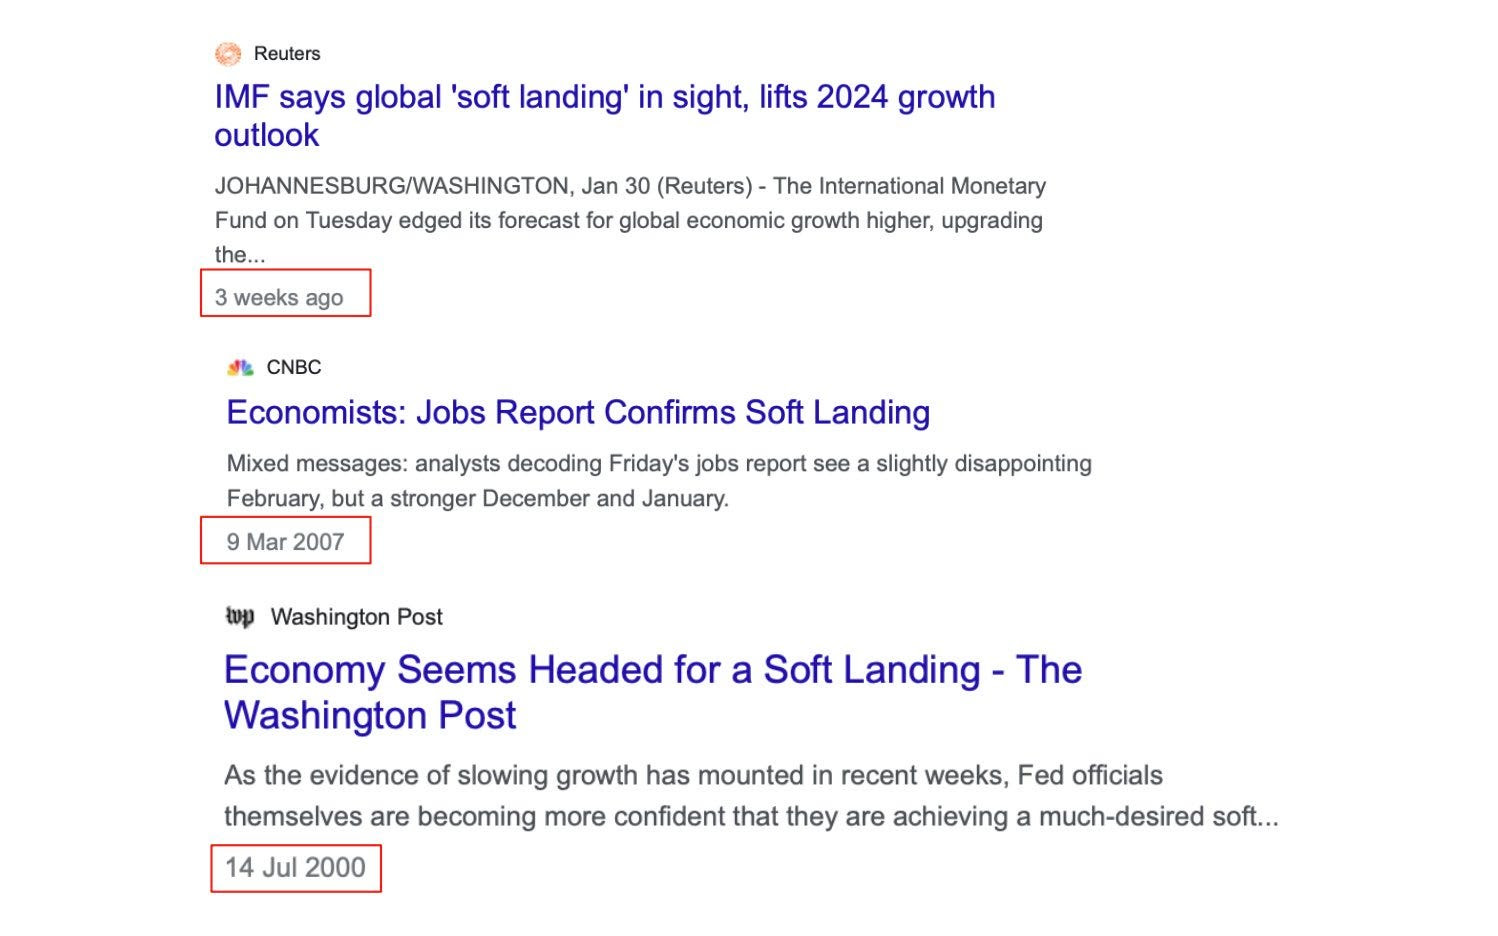
As further context, John Authers of Bloomberg says there remains a risk of overheating or a scenario where the economy remains robust, eventually forcing the Federal Reserve (Fed) to tighten policies until it precipitates a recession. This is in disagreement with TS Lombard. They question whether the Fed’s current stance is overly restrictive, while Bob Elliott of Unlimited Funds suggests that rates may decrease in response to slowing growth. Eventually, the persistent inflation stemming from structural factors could prompt subsequent rate hikes driven by increased funding needs.
Traders must remain vigilant, adopting strategic approaches to hedge exuberance and so-called windows of non-strength. Should there be “a stronger catalyst than a telegraphed CPI print,” says Kris Sidial, then “both tails and skew are likely to perform well,” with any rally, given the short-volatility, likely to unsettle positioning, leading dealers to boost momentum and whipsaw. In other words, much lower or higher markets, coupled with more demand for puts or calls respectively, means dealers take on more short volatility risk, which they adjust for by repricing options higher and hedging with underlying asset sales (in the case of puts) or purchases (in the case of calls).
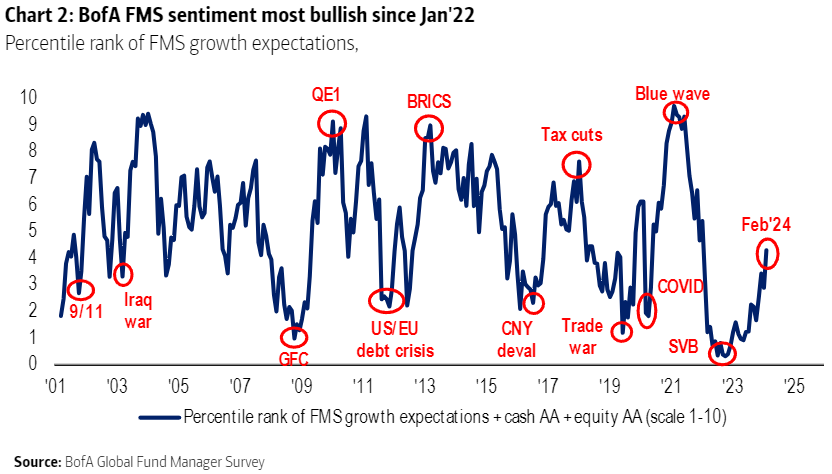
In conclusion, we remain mindful that it’s an election year, which could lead to heightened monetary and fiscal support in response to any weaknesses. While we maintain a positive outlook over the long term, we’re less optimistic in the short term.
This week, our attention is directed toward protecting our cash by rolling our remaining S&P 500 box spreads (acting as synthetic T-bills without impacting our buying power). We aim to secure these interest rates, keep a close watch on high-performing assets like silver, and replenish our long put skew (i.e., purchasing put spreads) in equities to hedge against potential vulnerabilities ahead. Following earnings announcements, we may resume engagement with companies such as Nvidia.
If you’re wondering what’s up with the newsletter formatting over the past weeks, we are trying stuff. Let us know what you like and don’t like. Cheers, and have a good week! And, finally, if you can, share!
The cover photo was retrieved from a RidgeHaven Capital post on Seeking Alpha.