Categories
Commentary

Daily Brief For May 25, 2022

The daily brief is a free glimpse into the prevailing fundamental and technical drivers of U.S. equity market products. Join the 300+ that read this report daily, below!

What Happened

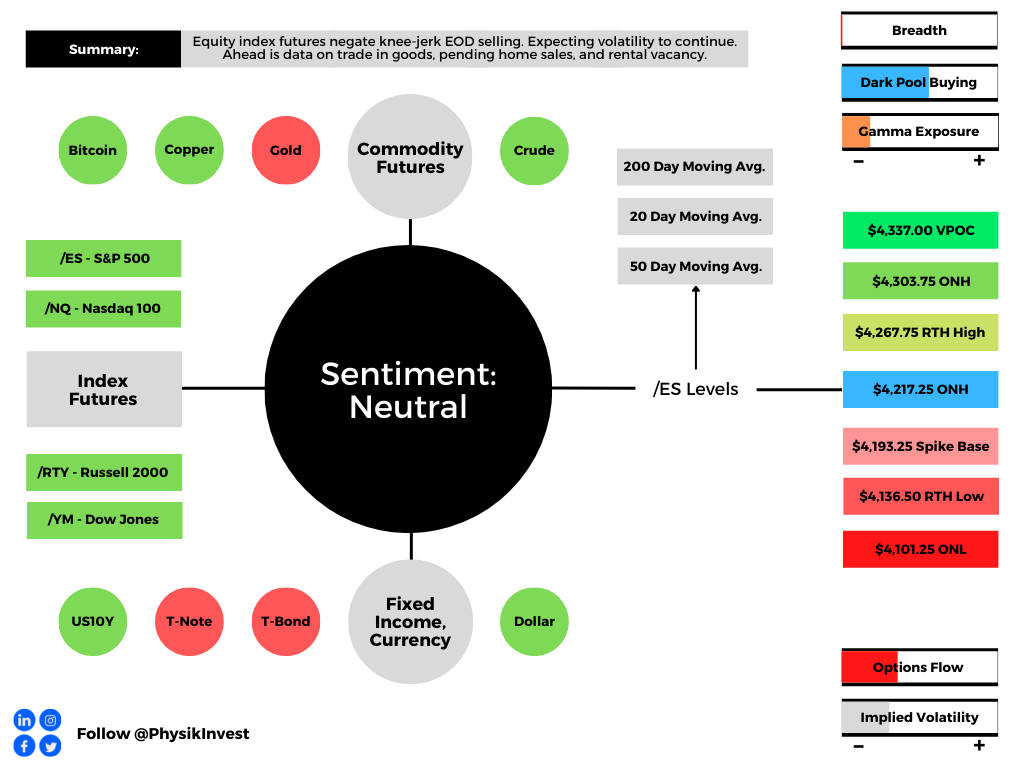
Overnight, equity index futures were steady alongside commodities and bonds. This is ahead of the release of minutes from a Federal Reserve (Fed) policy meeting. 

In the news were advertising and social media firms. Snap Inc (NYSE: SNAP) warned of slower growth and deterioration in the macro-environment. Its peers Meta Platforms Inc (NASDAQ: FB), Alphabet Inc (NASDAQ: GOOGL), and Twitter Inc (NYSE: TWTR) also saw weakness.

China’s COVID Zero commitment likely nudges it off a path to achieve economic targets “by a large margin for the first time ever,” as Bloomberg explains

This is as China and Russia have conducted one of their largest joint air drills “to send their own political, economic and military message to the international community,” much of which is at Davos, Switzerland doing thought exercises.

In a recent podcast, Pippa Malmgren, who is a former White House adviser and economist, well said, particularly in reference to some of the tension abroad, that “autocracy is not working well,” and “[y]ou go to war because … you have a domestic objective.”

Thought it was interesting. Give it a listen, here.

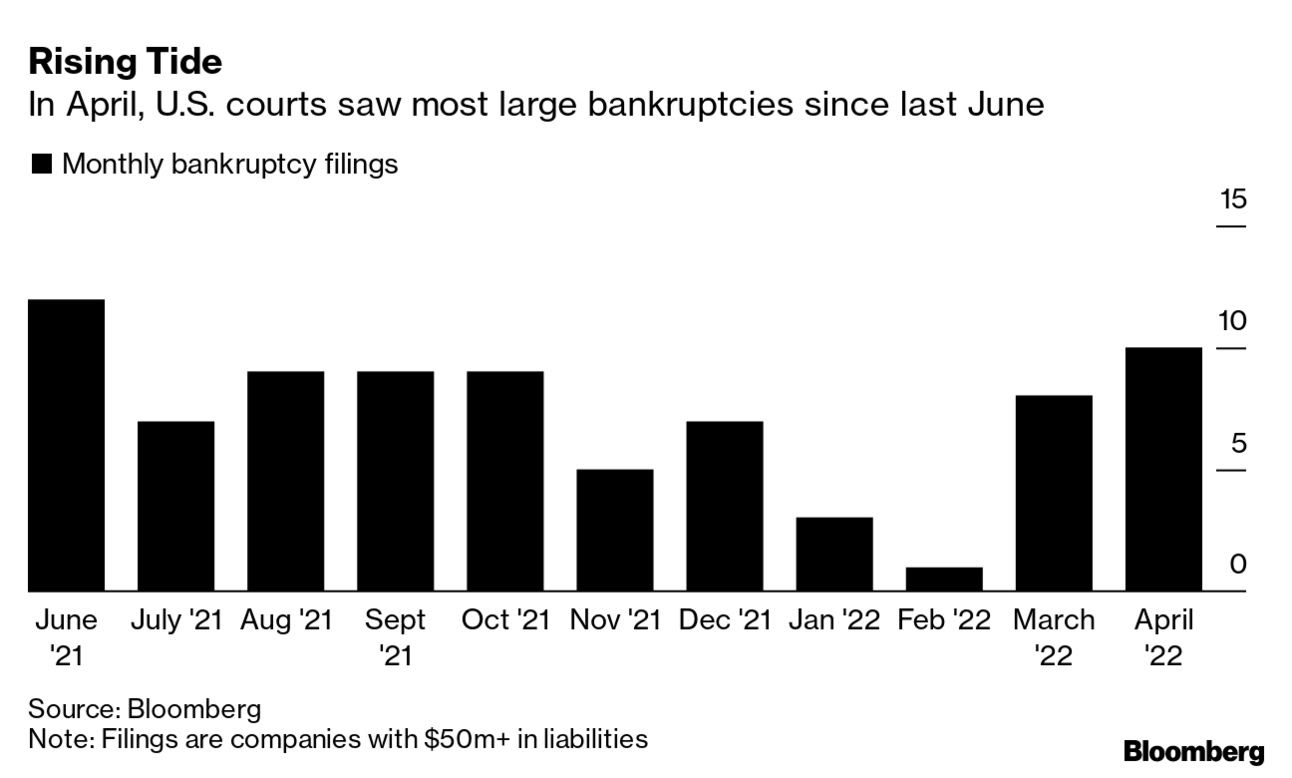
And, finally, Michael Burry of the “Big Short” sent a cryptic tweet alluding to what is likely the risk of another financial collapse. 

Moreover, ahead is data on durable goods and core capital equipment orders (8:30 AM ET). Later, the Fed publishes the minutes of its last policy meeting (2:00 PM ET).

Graphic updated 6:10 AM ET. Sentiment Neutral if expected /ES open is inside of the prior day’s range. /ES levels are derived from the profile graphic at the bottom of the following section. Levels may have changed since initially quoted; click here for the latest levels. SqueezeMetrics Dark Pool Index (DIX) and Gamma (GEX) calculations are based on where the prior day’s reading falls with respect to the MAX and MIN of all occurrences available. A higher DIX is bullish. At the same time, the lower the GEX, the more (expected) volatility. Learn the implications of volatility, direction, and moneyness. SHIFT data used for S&P 500 (INDEX: SPX) options activity. Note that options flow is sorted by the call premium spent; if more positive, then more was spent on call options. Breadth reflects a reading of the prior day’s NYSE Advance/Decline indicator. VIX reflects a current reading of the CBOE Volatility Index (INDEX: VIX) from 0-100.

What To Expect

Fundamental: The Fed will issue policy meeting minutes that may provide clarity with respect to its intent to hike and reduce the size of its balance sheet.

In focus, per ex-Fed insider Ellen Meade, is “the rate path, the expected economic conditions, and what policymakers want to see from the data before they slow the pace of tightening.”

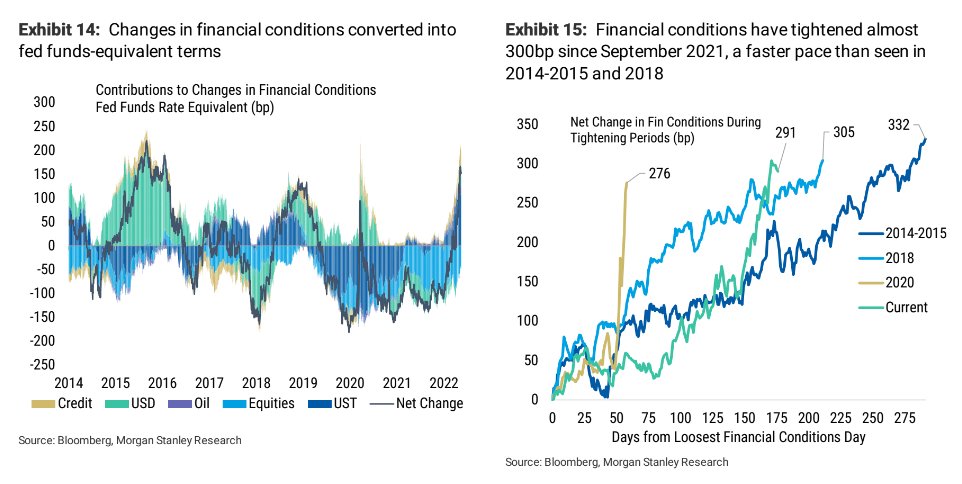
“The minutes may tell us they see the tightening in conditions this time around as greater than in earlier cycles. If that’s the case, then they may judge that they don’t need to raise the funds rate by as much this time around.”

Graphic: Via Morgan Stanley (NYSE: MS) research.

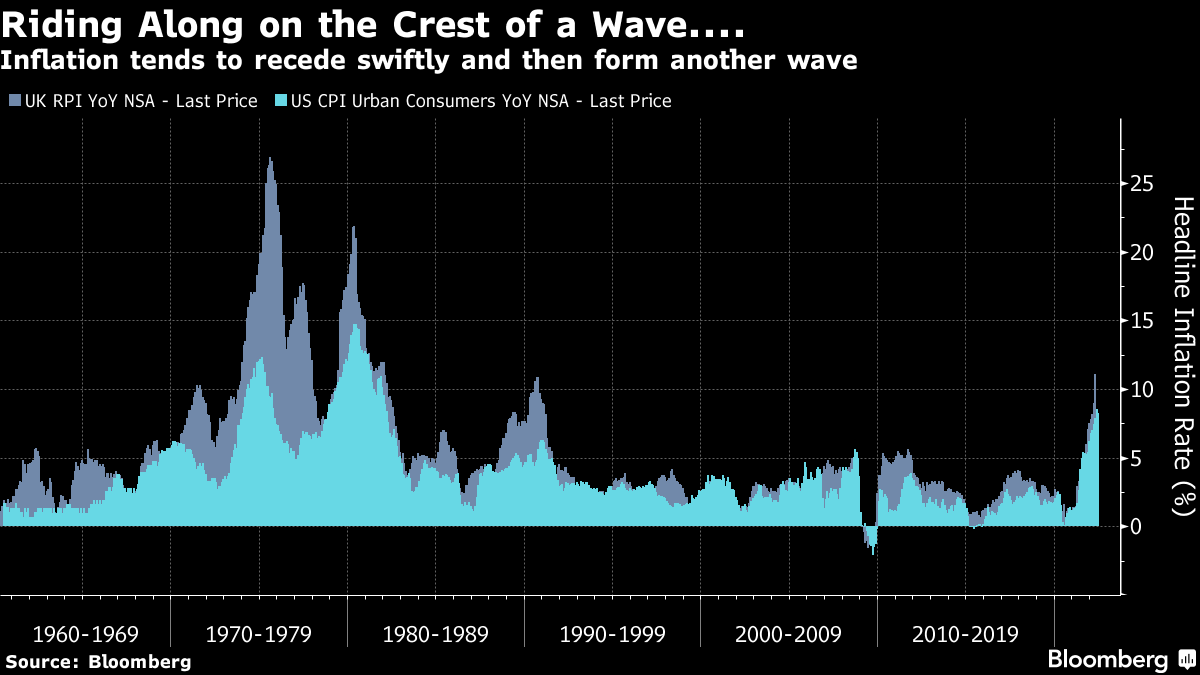
John Authers notes, however, that “inflation tends to move in waves” and it doesn’t, usually, “plateau and stay there.”

Graphic: Via Bloomberg.

“That suggests that even though the focus is already shifting to whether there is evidence of a growth slowdown,” he added, in a statement echoed by Meade who is betting on slower “GDP growth, below its longer-run rate, and a rise in the unemployment rate, perhaps to its longer-run median rate or slightly above.”

Graphic: Via Bloomberg.

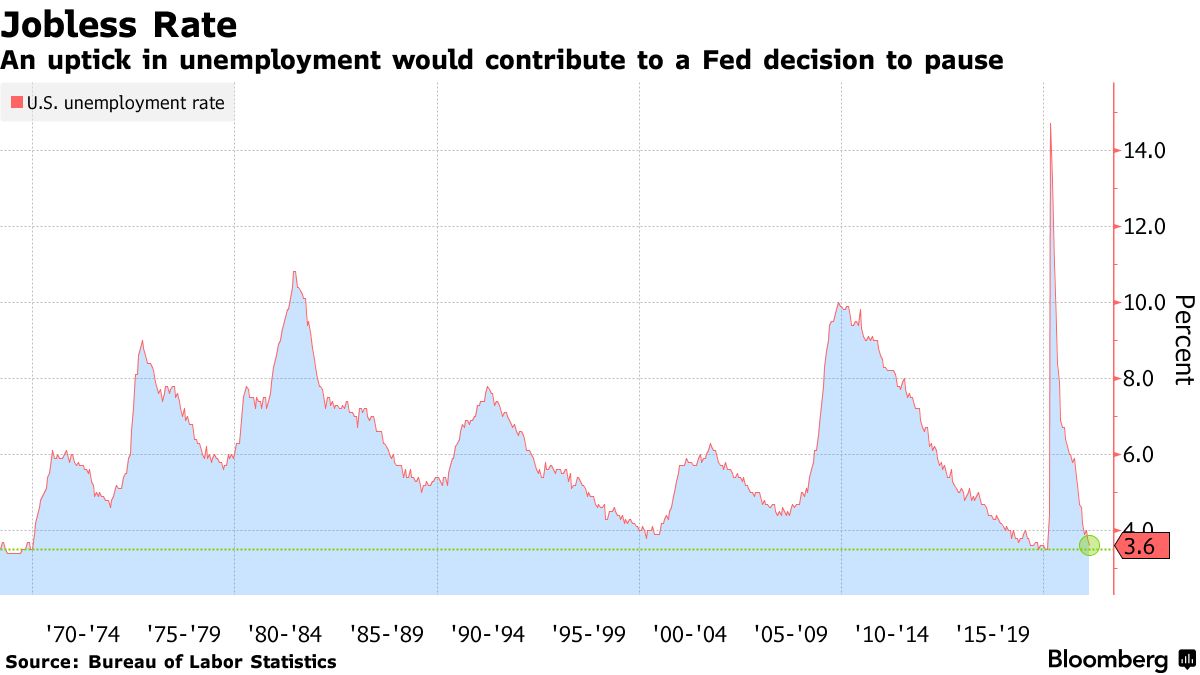
Pursuant to those last remarks, the Fed’s Raphael Bostic is already floating a pause to rate hikes near September if inflation falls more than expected over the summer.

As Diane Swonk of Grant Thorton explains, “Policy works with a lag. The Fed wants to catch up but not outrun the market in its effort to tighten credit market conditions.”

Graphic: Via Bloomberg.

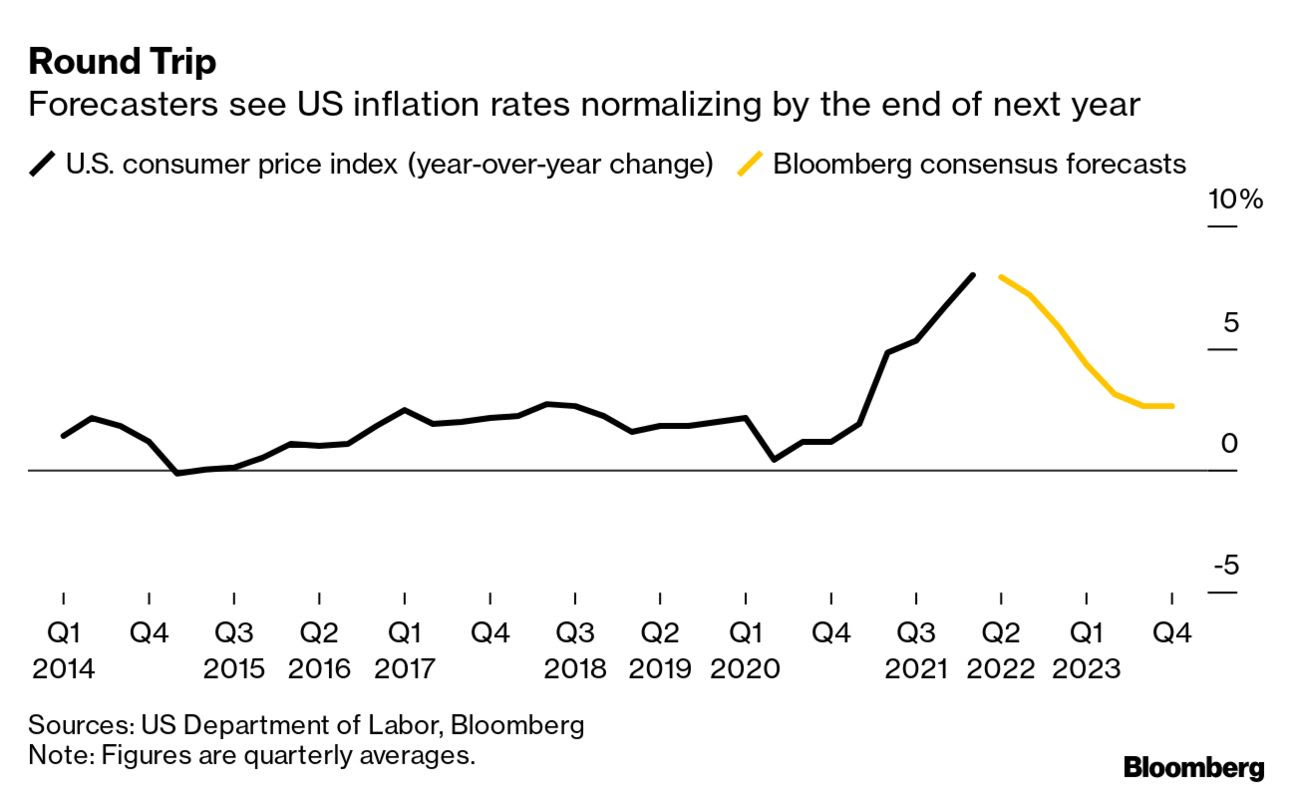
Futures First analyst Rishi Mishra, who is also the author of the “On Another Note” newsletter, suggests the Federal Open Market Committee may, rather, hone in on monthly changes with annual inflation still elevated.

“This brings down inflation expectations into a range where the Fed feels comfortable about de-anchoring risks,” Mishra said.

Graphic: Via JPMorgan Chase & Co (NYSE: JPM). Taken from Bloomberg. Though, potentially, “premature,” JPM’s model tracking the S&P 500, credit spreads and yield curve implies a 40% chance of a recession.

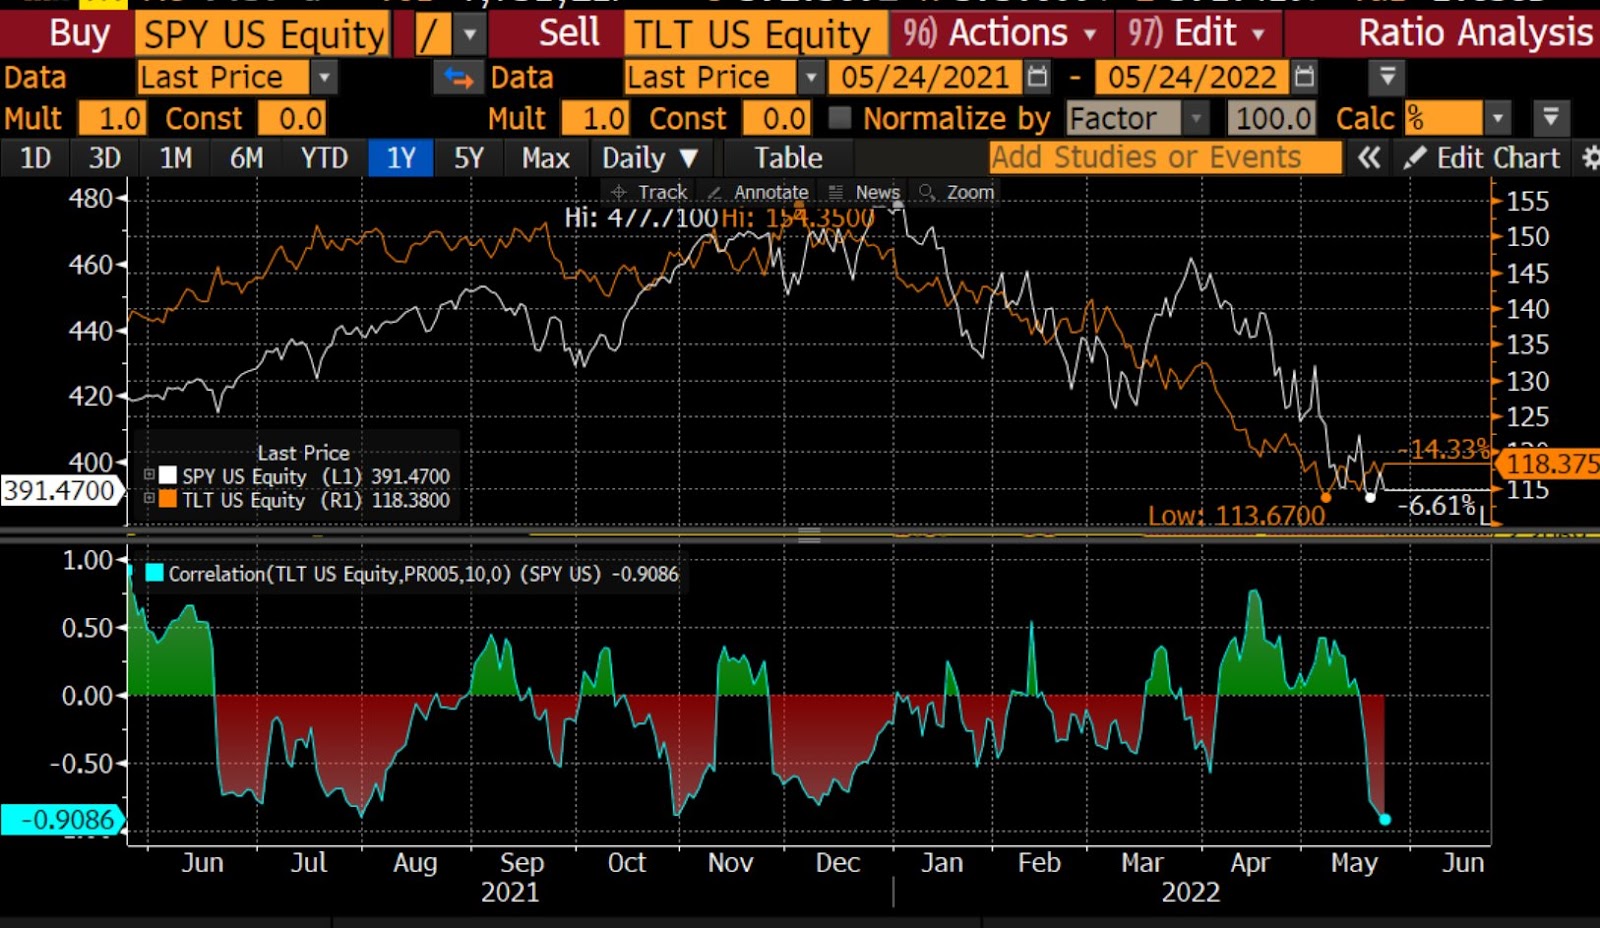
JPM’s Marko Kolanovic adds: “We have gone from a situation where both stocks and bonds were sold on the back of de-leveraging, to a situation where bonds rallied as stocks fell, nudging stock/bond correlations toward a more normal (negative) level.”

“We do indeed think this is where things could be gradually heading, but we acknowledge this is not likely to play out in a linear way.”

Graphic: Via @MrBlonde_macro. “Stock/bond correlation negative over the last 10 days. Some ‘normalization’ in cross-market relationships can be a source of relief.” The flip happened with 10-year yields at or above 3%.

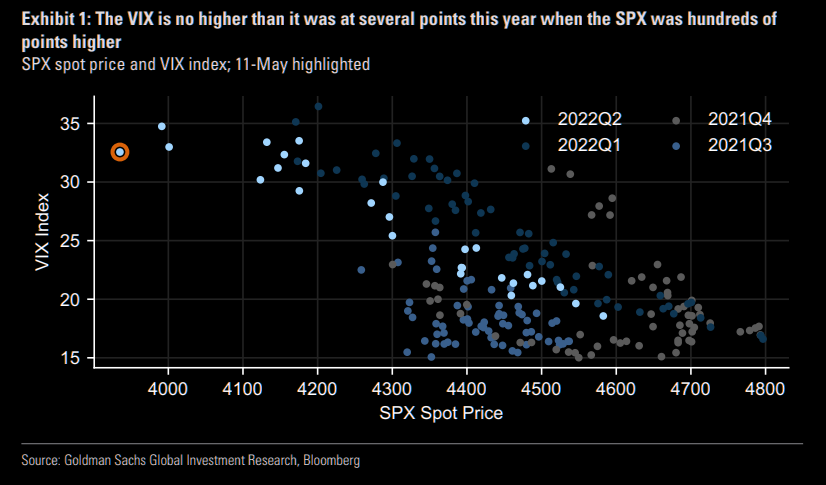
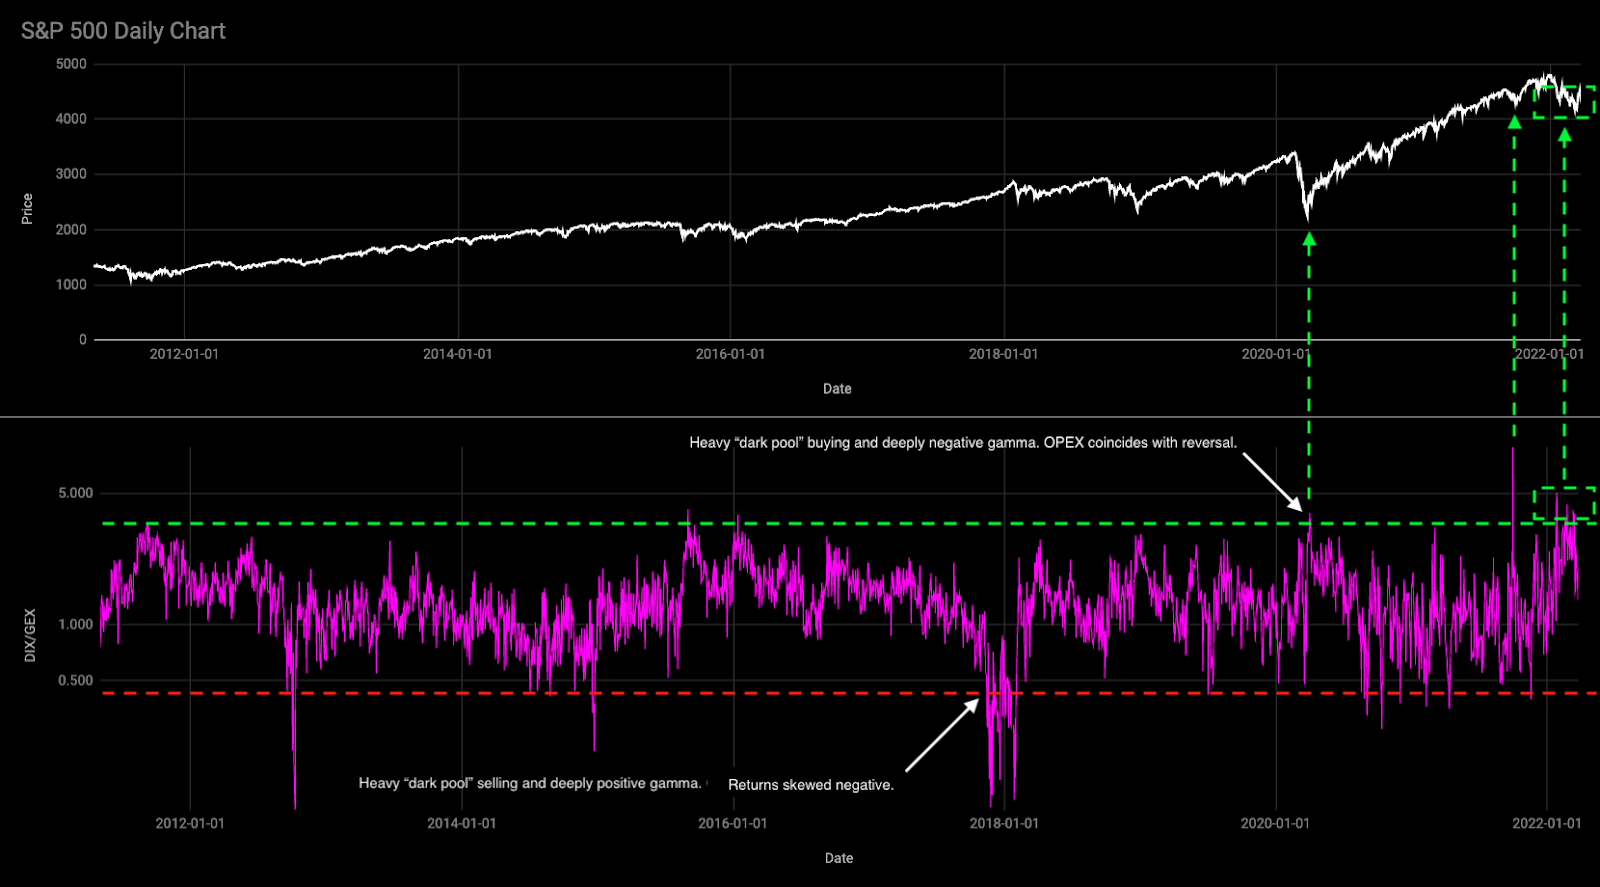
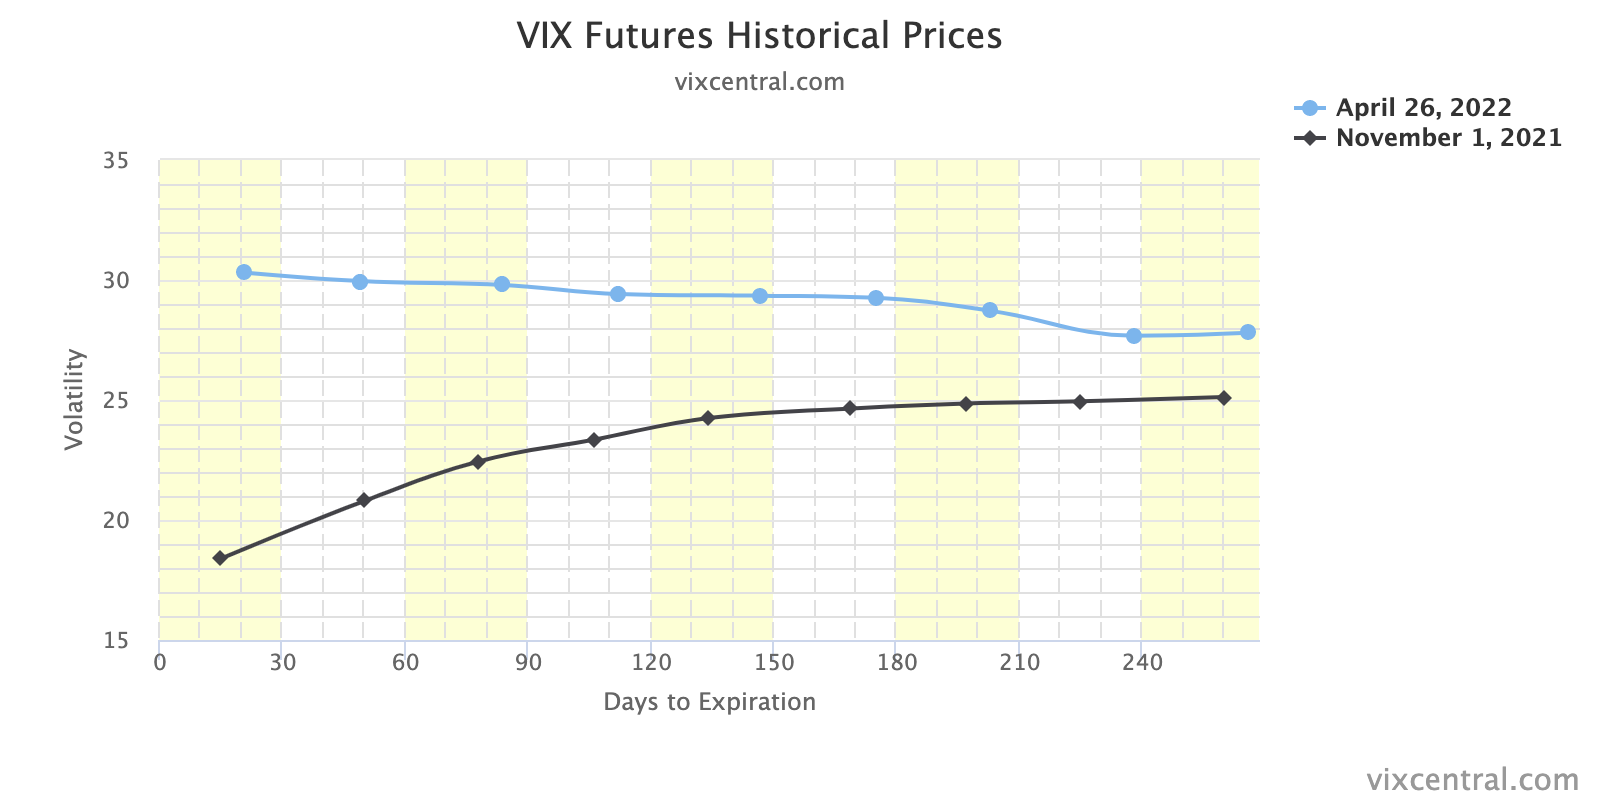
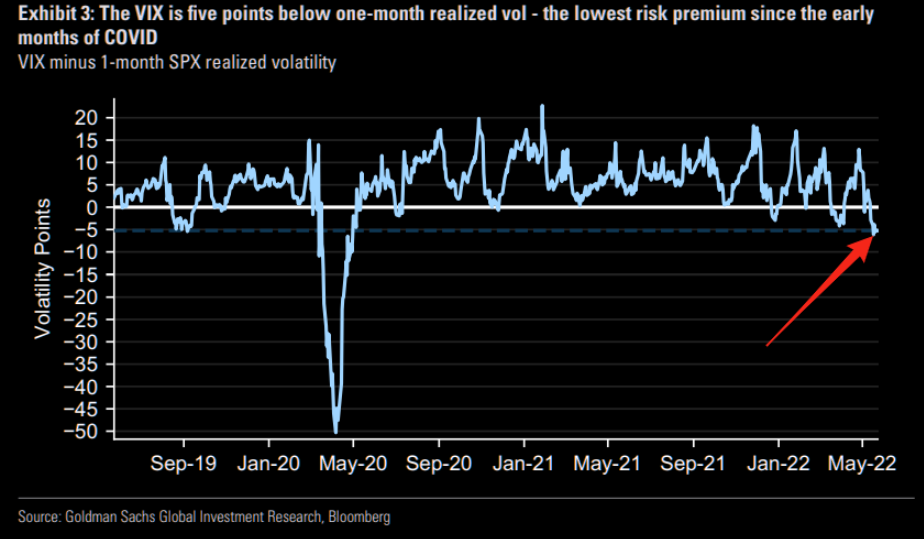
Positioning: In yesterday’s in-depth write-up, we talked about the underperformance of implied volatility (IVOL), relative to that which is realized (RVOL).

Dennis Davitt of Millbank Dartmoor Portsmouth had explained that the “RVOL of the underlying S&P 500 is above 27% … with IVOL of options trading between 24%-27%,” which translates to a VIX at 30%.

Graphic: Via Goldman Sachs Group Inc (NYSE: GS). Taken from The Market Ear.

So, essentially, it makes more sense to have exposure to underlying markets, synthetically (i.e., own options). 

This, though, merits a bit more clarification (as I do not want it to be construed as if I was buying, systemically, bets on the downside). The opposite, actually.

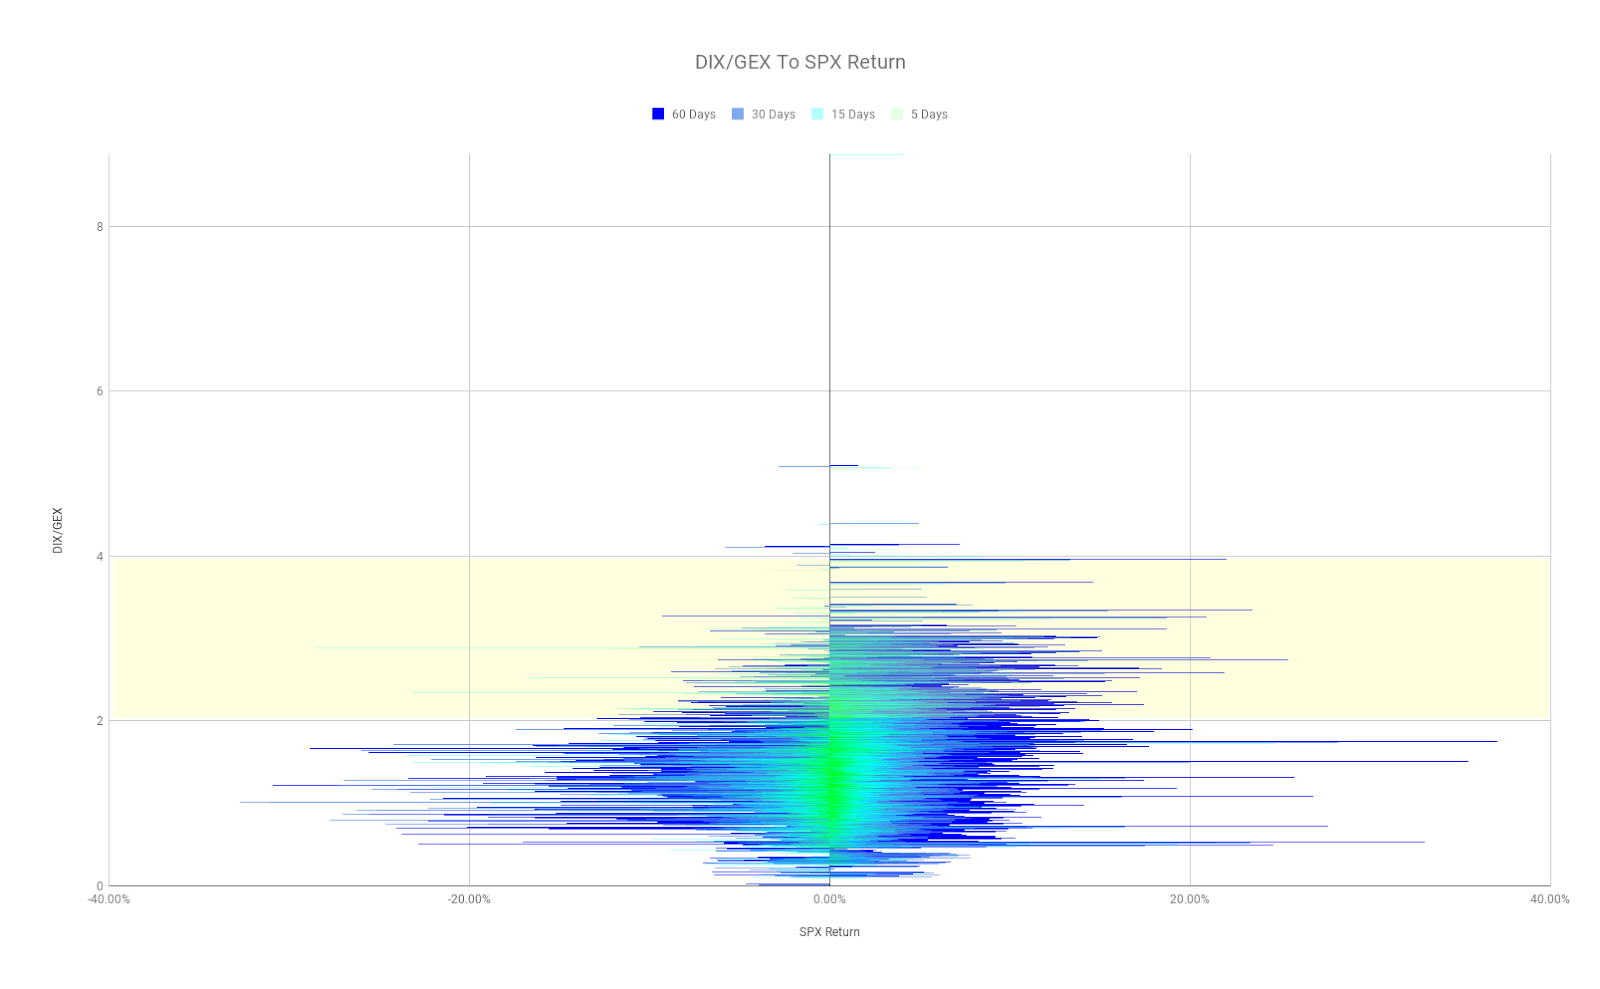
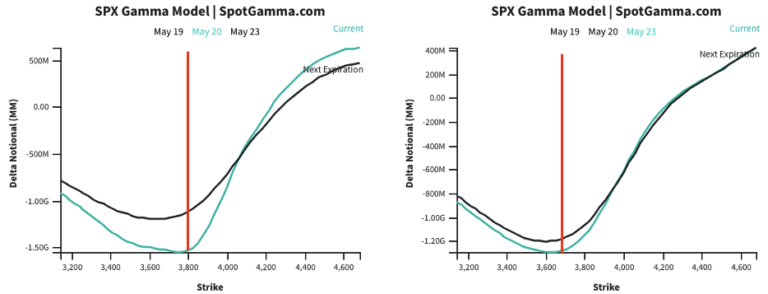
Moreover, this was stated in the context of a market that is “(1) stretched and (2) near a critical inflection which we see at $3,700.00 SPX,” per SpotGamma. Separately, investors are bidding “skew on the call side” amid their “fear of missing on the upside.”

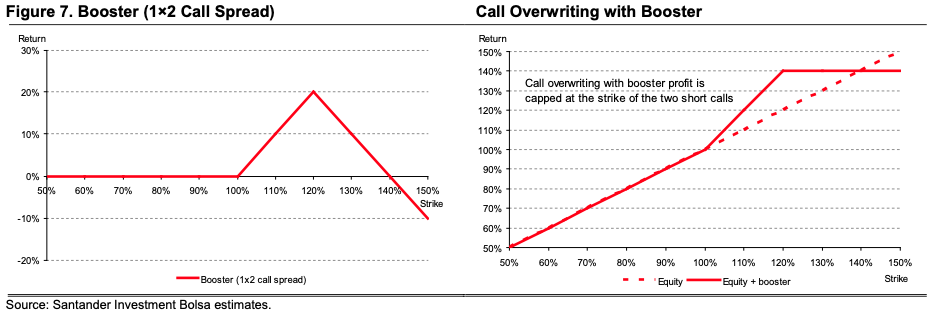
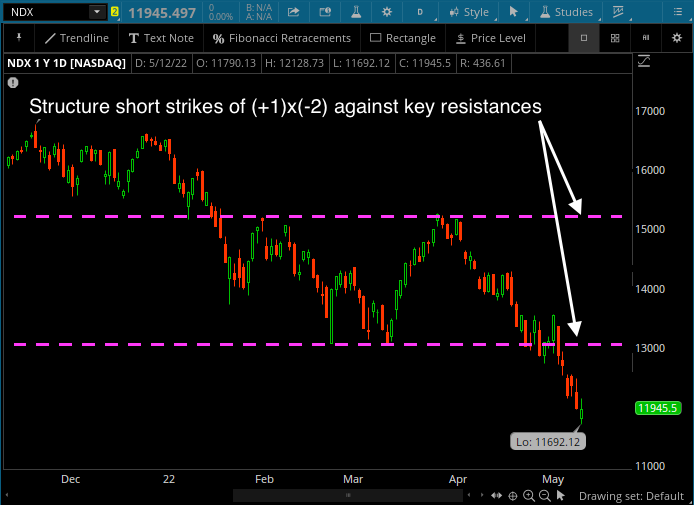
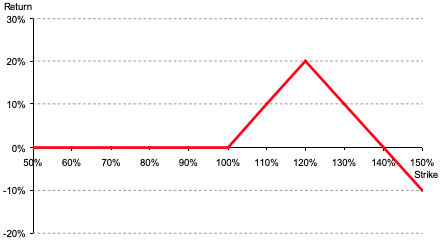
That’s when it makes sense to buy closer to at-the-money (ATM) and sell farther from ATM, or out-of-the-money (OTM). For instance, a margin intensive but low cost call +1 [ATM] x -2 [OTM] ratio spread

Note, however, that width and timing are everything. Too much time or too narrow may result in asymmetric losses when the demand for upside bets further out in price and time bids the skew that you’re short, relative to the at-the-money volatility you own. 

I’m willing to talk through this via email, if interested. Ping me at renato@physikinvest.com. I’m mindful that if I do post actual trade ideas, people may take them without knowing how to size and manage them, accordingly. Big yikes!

Goldman validates this thesis: “Even though the VIX’s reaction to recent spot downside has been mild, its high starting point leaves vol high overall, and we like strategies with a short volatility bias, including put selling and 1×2 call spread overlays.”

Graphic: Via Banco Santander SA (NYSE: SAN) research, the return profile, at expiry, of a classic 1×2 (long 1, short 2 further away) ratio spread.

Further, though SpotGamma assigns an edge to lower prices until the June FOMC and OPEX, “markets (which are already ‘fully loaded’ with puts) [are likely] pressured by liquidity providers’ hedging [at most] down to $3,700.00,” the area where that added pressure from hedging cools.

Graphic: Via SpotGamma.

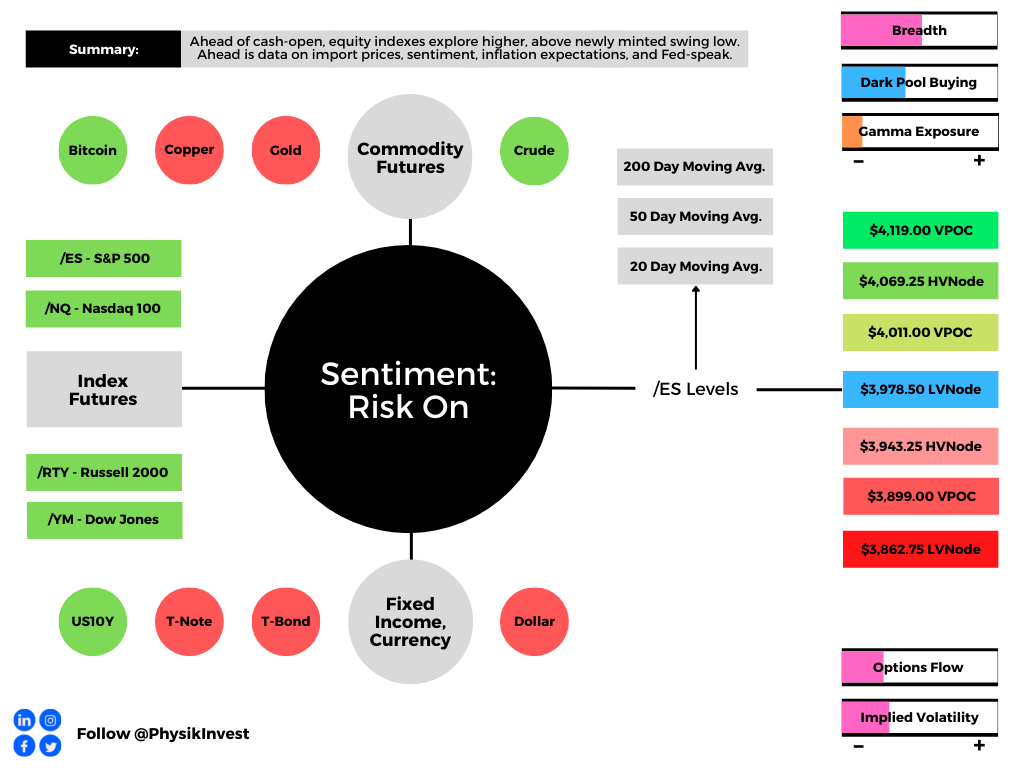
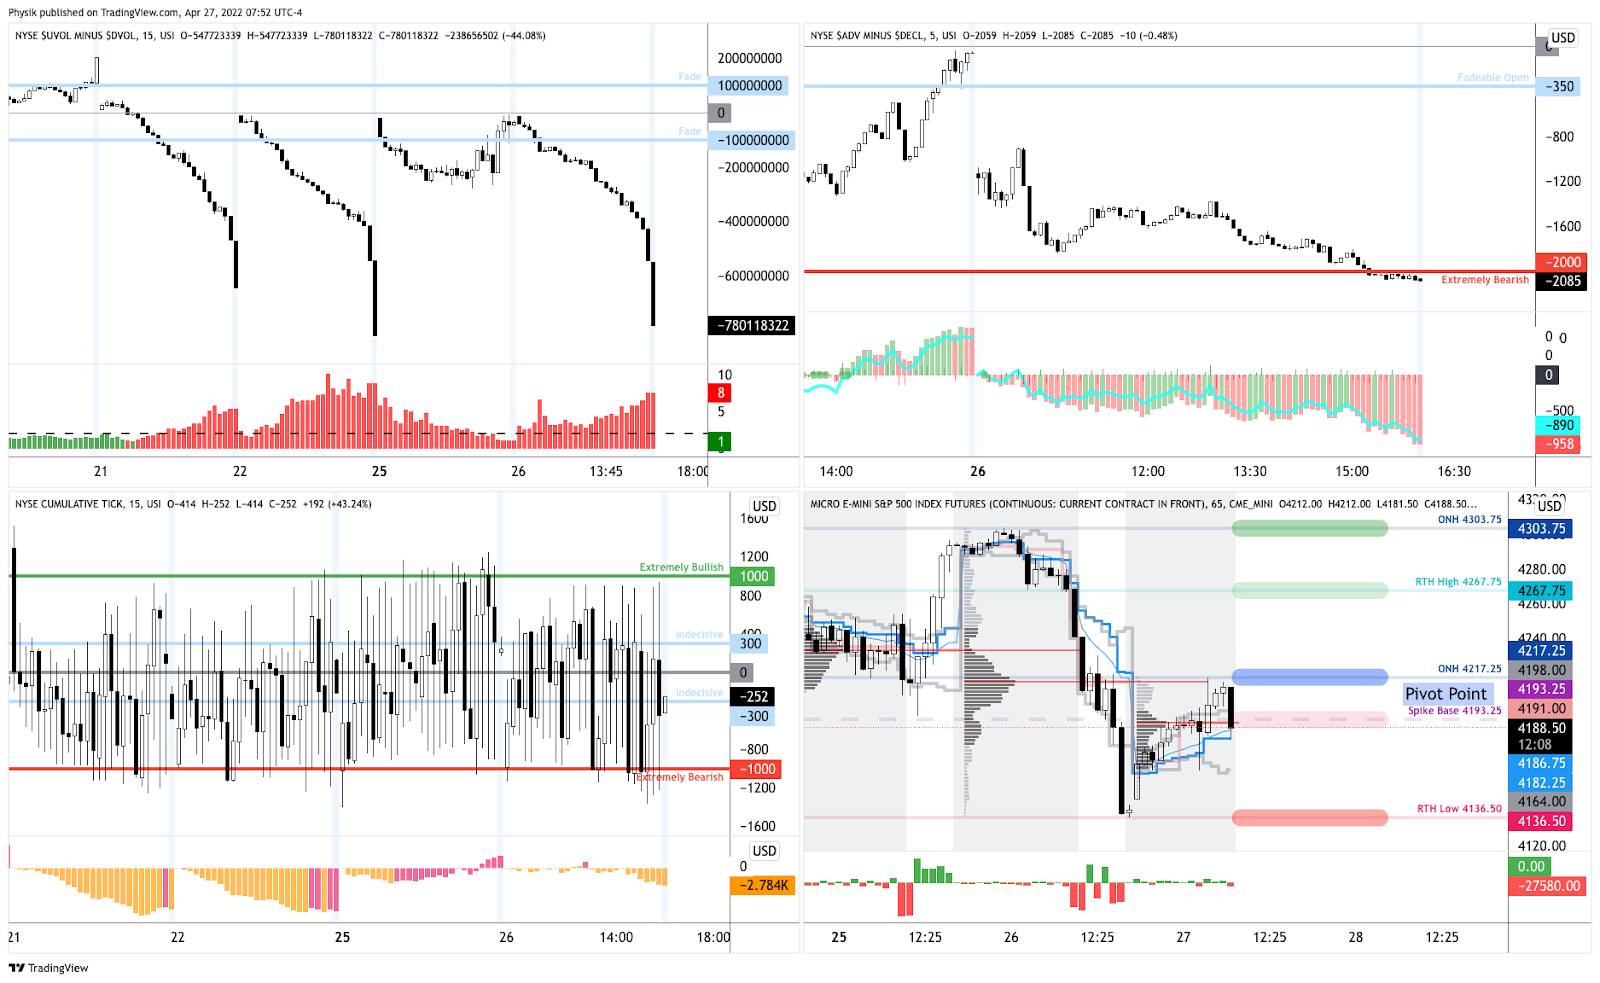
Technical: As of 6:15 AM ET, Wednesday’s regular session (9:30 AM – 4:00 PM ET), in the S&P 500, will likely open in the lower part of a balanced overnight inventory, just inside of prior-range and -value, suggesting a limited potential for immediate directional opportunity.

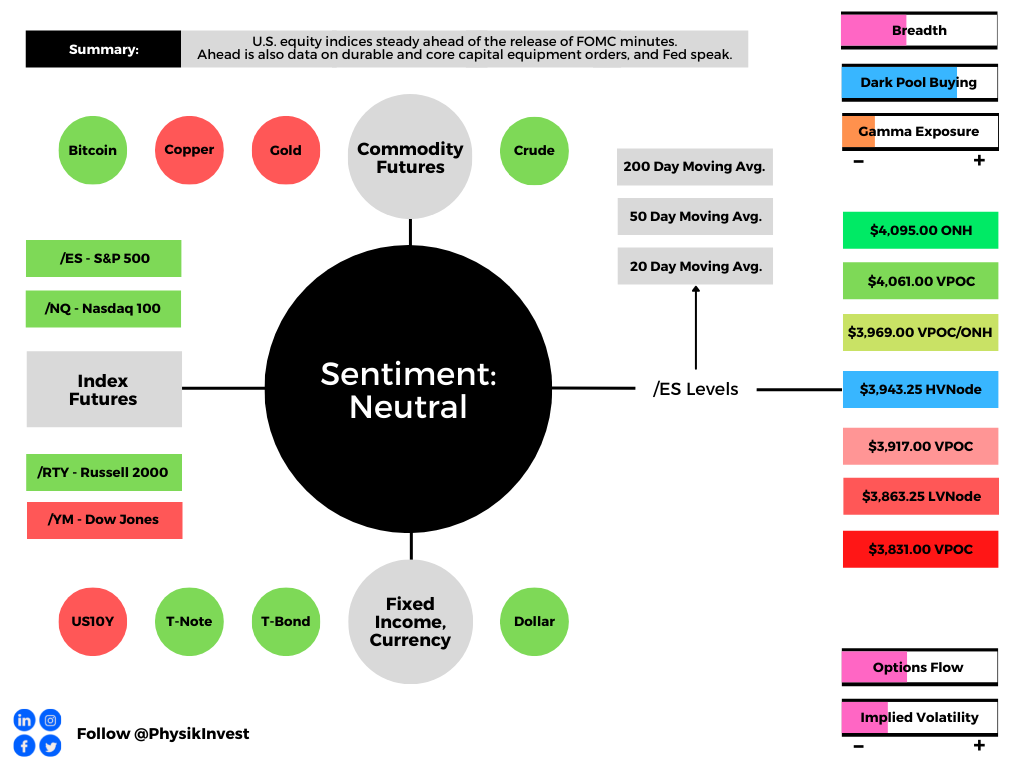
In the best case, the S&P 500 trades higher; activity above the $3,943.25 HVNode puts in play the $3,969.00 ONH. Initiative trade beyond the ONH could reach as high as the $4,061.00 VPOC and $4,095.00 ONH, or higher.

In the worst case, the S&P 500 trades lower; activity below the $3,943.25 HVNode puts in play the $3,917.00 VPOC. Initiative trade beyond the VPOC could reach as low as the $3,863.25 LVNode and $3,831.00 VPOC, or lower.

Click here to load today’s key levels into the web-based TradingView charting platform. Note that all levels are derived using the 65-minute timeframe. New links are produced, daily.
Graphic: 65-minute profile chart of the Micro E-mini S&P 500 Futures.

Considerations: Push-and-pull, as well as responsiveness near key-technical areas (discernable visually on a chart), suggests technically-driven traders with shorter time horizons are very active.

Such traders often lack the wherewithal to defend retests.

Large participants (who often move by committee) seldom respond to key technical inflections. It is their activity that often results in poor reliability of our technical levels.

Sometimes, the better trade is to wait for the larger participants’ entry and use the expansion of the range as a confirmation of a new trend.

Catalysts to consider include the release of Federal Open Market Committee (FOMC) minutes, Wednesday.

Definitions

Overnight Highs And Lows (ONH and ONL): Typically, there is a low historical probability associated with overnight rally-highs (lows) ending the upside (downside) discovery process.

Volume Areas: A structurally sound market will build on areas of high volume (HVNodes). Should the market trend for long periods of time, it will lack sound structure, identified as low volume areas (LVNodes). LVNodes denote directional conviction and ought to offer support on any test. 

If participants were to auction and find acceptance into areas of prior low volume (LVNodes), then future discovery ought to be volatile and quick as participants look to HVNodes for favorable entry or exit.

POCs: POCs are valuable as they denote areas where two-sided trade was most prevalent in a prior day session. Participants will respond to future value tests as they offer favorable entry and exit.

About

After years of self-education, strategy development, mentorship, and trial-and-error, Renato Leonard Capelj began trading full-time and founded Physik Invest to detail his methods, research, and performance in the markets.

Capelj also develops insights around impactful options market dynamics at SpotGamma and is a Benzinga reporter.

Some of his works include conversations with ARK Invest’s Catherine Wood, investors Kevin O’Leary and John Chambers, FTX’s Sam Bankman-Fried, Kai Volatility’s Cem Karsan, The Ambrus Group’s Kris Sidial, among many others.

Disclaimer

In no way should the materials herein be construed as advice. Derivatives carry a substantial risk of loss. All content is for informational purposes only.

Categories
Commentary

Daily Brief For May 13, 2022

The daily brief is a free glimpse into the prevailing fundamental and technical drivers of U.S. equity market products. Join the 300+ that read this report daily, below!

What Happened

Overnight, equity indices probed higher, above Thursday’s trade, which established a new swing low. The Cboe Volatility Index (INDEX: VIX) fell while yields were bid and commodities mixed.

Today, we’ll get into some key narratives including crypto turmoil and financial conditions, as well as a validation of some of our trade theses.

Ahead is data on import prices (8:30 AM ET), University of Michigan consumer sentiment and inflation expectations (10:00 AM ET), as well as Fed-speak by Neel Kashkari (11:00 AM ET).

Take care and watch your risk.

Graphic updated 6:40 AM ET. Sentiment Risk-On if expected /ES open is above the prior day’s range./ES levels are derived from the profile graphic at the bottom of the following section. Levels may have changed since initially quoted; click here for the latest levels. SqueezeMetrics Dark Pool Index (DIX) and Gamma (GEX) calculations are based on where the prior day’s reading falls with respect to the MAX and MIN of all occurrences available. A higher DIX is bullish. At the same time, the lower the GEX, the more (expected) volatility. Learn the implications of volatility, direction, and moneyness. SHIFT data used for S&P 500 (INDEX: SPX) options activity. Note that options flow is sorted by the call premium spent; if more positive, then more was spent on call options. Breadth reflects a reading of the prior day’s NYSE Advance/Decline indicator. VIX reflects a current reading of the CBOE Volatility Index (INDEX: VIX) from 0-100.

What To Expect

Fundamental: In the news, panic in the cryptocurrency markets eased and Tether (CRYPTO: USDT-USD), the world’s largest stablecoin, backed by commercial paper and U.S. Treasuries, climbed back to par.

JPMorgan Chase & Co’s (NYSE: JPM) Teresa Ho said there would be little impact on traditional funding markets while, according to Barclays PLC’s (NYSE: BCS) Joseph Abate, redemptions in Tether, which has a market value just shy of $90-100 billion, would only “cause meaningful strains in money markets should they exceed half of the stablecoin’s total holdings.”

Graphic: Via Bloomberg.

Also in the news are rising interest rates (e.g., mortgage rates up to ~5.30%) and a weak equity market (e.g., S&P 500 lower ~20%), among other things, feeding into a tightening of financial conditions (which is how monetary policy impacts the economy).

Graphic: Via Bloomberg.

“Financial conditions for households and businesses wanting to borrow or raise capital tightened again last week and are the most restrictive since the first wave of the pandemic in 2020 and before that 2012,” Reuters’ John Kemp said.

Graphic: Via John Kemp.

This is as inflation has become “deeply embedded,” spreading from the energy and raw materials-intensive merchandise sector to services.

Graphic: Via John Kemp.

“Rapid service sector price increases usually signal the imminent arrival of a recession,” Kemp said, pointing to decisions by some public companies like Uber Inc (NYSE: UBER), Twitter Inc (NYSE: TWTR), and Amazon Inc (NASDAQ: AMZN) to slow growth and cut labor forces as a validation of slowing momentum.

Graphic: Via Bloomberg. “I think we’re primed for a big distressed supply surge,” said Phil Brendel, a distressed debt analyst for Bloomberg Intelligence. “Everyone gets comfortable and complacent on credit and then when it turns, you tend to see these massive spikes.”

The accelerated selling of equities (~$6.2 billion), bonds (~11.4 billion), cash (~$19.7 billion), and some commodities (~$1.8 billion in gold), over the last week, per Bank of America Corporation’s (NYSE: BAC) Michael Hartnett is capitulation. 

“The definition of true capitulation is investors selling what they love,” Hartnett said, gauging the prospects that stocks have hit a near-term bottom. “Fear and loathing suggest stocks are prone to an imminent bear market rally, but we do not think ultimate lows have been reached.”

Positioning: In past commentaries, we talked about ways to play a returns distribution that is skewed to the upside (albeit, with large negative outliers).

Graphic: Via Physik Invest. Data retrieved from SqueezeMetrics. A higher DIX/GEX ratio has historically been associated with S&P 500 outperformance in the subsequent month. A very low DIX/GEX ratio has historically been associated with positive S&P 500 performance in the subsequent month, though there are many more negative outliers.

The following Goldman Sachs Group Inc (NYSE: GS) remark is a validation of what we’ve discussed:

“Even though the VIX’s reaction to recent spot downside has been mild, its high starting point leaves vol high overall, and we like strategies with a short volatility bias, including put selling and 1×2 call spread overlays.”

Graphic: Via Goldman Sachs Group Inc. Taken from The Market Ear.

Mainly, zero- and low-cost bets ($0.00-$1.00 debit to open) that deliver asymmetric payouts (sometimes in excess of $10.00 credit to close) in case of violent and short-lived reversals. 

Personally, this letter’s author is structured positive delta and gamma in the Nasdaq 100 (INDEX: NDX) via ratios spread (1×2) and butterfly (1x2x1) structures.

Graphic: Via Banco Santander SA (NYSE: SAN) research, the return profile, at expiry, of a classic 1×2 (long 1, short 2 further away) ratio spread.

As stated before, width and timing are everything. 

Too much time or too narrow may result in asymmetric losses when the demand for upside bets further out in price and time bids the skew that you’re short, relative to the at-the-money volatility you own.

Ten to fifteen days to expiration and 500-1000 points wide, in the Nasdaq 100 (INDEX: NDX), one of the hardest hit of the indexes, work well. 

An easy check is whether the spread prices for a debit or credit to close if the underlying moves to the long strike of the spread, all else equal.

Debits (which may run as low as $0.00, depending on trade location) can be offset with credits from put sales.

Graphic: Chart of the Nasdaq 100 (INDEX: NDX).

Technical: As of 6:45 AM ET, Friday’s regular session (9:30 AM – 4:00 PM ET), in the S&P 500, will likely open in the upper part of a positively skewed overnight inventory, outside of prior-range and -value, suggesting a higher potential for immediate directional opportunity.

In the best case, the S&P 500 trades higher; activity above the $3,978.50 low volume node (LVNode) puts into play the $4,011.00 untested point of control (VPOC). Initiative trade beyond the VPOC could reach as high as the $4,069.25 high volume area (HVNode) and $4,119.00 VPOC, or higher.

In the worst case, the S&P 500 trades lower; activity below the $3,978.50 LVNode puts into play the $3,943.25 HVNode. Initiative trade beyond the HVNode could reach as low as the $3,899.00 VPOC and $3,862.75 LVNode, or lower.

Click here to load today’s key levels into the web-based TradingView charting platform. Note that all levels are derived using the 65-minute timeframe. New links are produced, daily.
Graphic: 65-minute profile chart of the Micro E-mini S&P 500 Futures.

Considerations: Gap scenarios are in play.

Gaps ought to fill quickly. Should they not, that’s a signal of strength; do not fade. Leaving value behind on a gap-fill or failing to fill a gap (i.e., remaining outside of the prior session’s range) is a go-with indicator.

Auctioning and spending at least 1-hour of trade back in the prior range suggests a lack of conviction; in such a case, do not follow the direction of the most recent initiative activity.

Definitions

Volume Areas: A structurally sound market will build on areas of high volume (HVNodes). Should the market trend for long periods of time, it will lack sound structure, identified as low volume areas (LVNodes). LVNodes denote directional conviction and ought to offer support on any test. 

If participants were to auction and find acceptance into areas of prior low volume (LVNodes), then future discovery ought to be volatile and quick as participants look to HVNodes for favorable entry or exit.

POCs: POCs are valuable as they denote areas where two-sided trade was most prevalent in a prior day session. Participants will respond to future tests of value as they offer favorable entry and exit.

MCPOCs: POCs are valuable as they denote areas where two-sided trade was most prevalent over numerous day sessions. Participants will respond to future tests of value as they offer favorable entry and exit.

About

After years of self-education, strategy development, mentorship, and trial-and-error, Renato Leonard Capelj began trading full-time and founded Physik Invest to detail his methods, research, and performance in the markets.

Capelj also develops insights around impactful options market dynamics at SpotGamma and is a Benzinga reporter.

Some of his works include conversations with ARK Invest’s Catherine Wood, investors Kevin O’Leary and John Chambers, FTX’s Sam Bankman-Fried, Kai Volatility’s Cem Karsan, The Ambrus Group’s Kris Sidial, among many others.

Disclaimer

In no way should the materials herein be construed as advice. Derivatives carry a substantial risk of loss. All content is for informational purposes only.

Categories
Commentary

Daily Brief For April 27, 2022

The Daily Brief is a free glimpse into the prevailing fundamental and technical drivers of U.S. equity market products. Join the 200+ that read this report daily, below!

What Happened

Overnight, equity index futures probed higher, essentially negating Tuesday’s end-of-day, knee-jerk liquidation.

Tuesday’s selling came alongside Russia cutting gas to Poland and Bulgaria, Vice President Kamala Harris testing positive for COVID-19, and heavy selling in growth and tech stocks, amid doubts corporate profits can withstand the Federal Reserve’s bid to tame inflation.

As Jerome Schneider of Pacific Investment Management Co says, QT will “have a profound effect on the cost of liquidity and more importantly the cost of transacting business and reallocating assets from one avenue to another avenue.” 

“There might not necessarily be a rapid deceleration or decline in the stock market or other risk assets, but there’s going to be a changing cost of capital that this balance sheet is going to be part of.”

After the close, weakness continued. Alphabet Inc (NASDAQ: GOOGL) (NASDAQ: GOOG) missed on slowing sales growth and digital-ad spending. One of the biggest losers was Tesla Inc (NASDAQ: TSLA) which shed 12% or so on news that Elon Musk would use his fortune, much of which is tied up in Tesla, to buy Twitter Inc (NYSE: TWTR).

Germany’s passage of a bigger borrowing budget, coupled with China’s pledge to boost infrastructure bolstered an overnight advance that fed into price action at home. The S&P 500, in particular, for a brief moment, took back a key level, negating much of yesterday’s liquidation.

Ahead is data on international trade in goods (8:30 AM ET), as well as pending home sales and the rental vacancy rate (10:00 AM ET).

Graphic updated 7:00 AM ET. Sentiment Neutral if expected /ES open is inside of the prior day’s range. /ES levels are derived from the profile graphic at the bottom of the following section. Levels may have changed since initially quoted; click here for the latest levels. SqueezeMetrics Dark Pool Index (DIX) and Gamma (GEX) calculations are based on where the prior day’s reading falls with respect to the MAX and MIN of all occurrences available. A higher DIX is bullish. At the same time, the lower the GEX, the more (expected) volatility. Learn the implications of volatility, direction, and moneyness. SHIFT data used for S&P 500 (INDEX: SPX) options activity. Note that options flow is sorted by the call premium spent; if more positive, then more was spent on call options. Breadth reflects a reading of the prior day’s NYSE Advance/Decline indicator. VIX reflects a current reading of the CBOE Volatility Index (INDEX: VIX) from 0-100.

What To Expect

Positioning: Markets are positioned for continued volatility. 

Based on a reading of market gamma exposure (GEX) and buying support (DIX), the returns distribution is skewed positive. There’s buying in the context of an environment in which the hedging of options positioning implies selling into weakness and buying of strength.

Graphic: Via Barclays PLC (NYSE: BCS) research.

In the most simple way that I can explain: when positioning is stretched one way, that often tends to mark a turning point – the returns distribution is either skewed positive or negative.

Graphic: Via Physik Invest. Data via SqueezeMetrics. Updated March of 2022. A high DIX/GEX ratio often portends positive 1-month returns.

An updated read, after Tuesday’s weak close, tells us that we can (1) definitely expect larger ranges to continue and (2) potential for short-term bounces

Based on overnight activity, one of those is happening, now.

Graphic: Via Physik Invest. Data via SqueezeMetrics.

This is as participants are both well-hedged and using weakness as an opportunity to buy into a less highly valued market.

Well-hedged means that customers (i.e., you and I) own protection against long equity exposure. So, that could mean customers own puts and/or are short calls. One of the most dominant flows is the long put, short call.

Such trade offers customers positive, yet asymmetric (gamma), exposure to direction (delta). In other words, negative delta and positive gamma. 

The counterparty has exposure to positive delta and negative gamma. If the underlyings trade lower and volatility rises, all else equal, the position will lose. To hedge against these losses, the counterparties will sell underlying into weakness.

If prices reverse and move higher, these counterparties will re-hedge and buy underlying.

Normally, as seen over the bull run of 2020 and 2021, markets are in an uptrend and there’s a strong supply of volatility. Often, customers sell more calls than puts and, in an uptrend, those calls solicit more active hedging than the put options.

Recall that the customer is short the call. That means the counterparty is long the call (a positive delta and gamma trade) and will make money if prices rise, all else equal. 

The hedging of this particular exposure (i.e., sell strength, buy weakness), in an uptrend, occurs slower (i.e., counterparts will allow their profits to run), and that’s what can help the market sustain lower volatility trends for longer periods.

When prices reverse and underlyings trade lower, put options solicit increased hedging activity. Given the nature of counterparty exposure to those puts, that hedging happens quickly and can take from market liquidity as to volatility (i.e., buy strength, sell weakness).

See, below, E-mini S&P 500 book depth, a proxy for market liquidity, and how much it has declined since the end of last year when markets became more volatile and noise around the Federal Reserve’s intent to taper bond-buying and raise rates grew louder.

Graphic: Via CME Group Inc (NASDAQ: CME) Liquidity Tool. Note how in late March, book depth rose as markets rose and customer call activity solicited increased hedging of counterparty long-gamma exposure (i.e., buy weakness, sell strength), adding to market liquidity.

In the above environment, counterparty hedging matters; the market is more sensitive to the flow, so to speak. That sensitivity is expected to continue.

SpotGamma, an options data and analysis service, sees the early May period as pivotal. Then is the Federal Open Market Committee (FOMC) meeting and the potential Russian default, per Moody’s Corporation (NYSE: MCO).

As quoted: “Russia ‘may be considered in default’ if it does not pay two bonds in US dollars by end of a grace period on May 4.”

Graphic: Via Bloomberg.

Until those events are resolved, participants will likely continue to (remain) hedge(d). Upon resolve, customers likely monetize their protection to offset losses on underlying equity exposure. 

That means selling volatility which reduces counterparty exposure to short puts (negative gamma and positive delta). To re-hedge, underlying is bought back and that may support a price rise.

Graphic: VIX term structure via VIX Central. Expansion (higher) solicits counterparty selling which pressures the market lower. Compression (lower) solicits counterparty buying which bolsters attempts higher.

Whether that price rise has legs depends on what the fundamental situation is, then. See the below section titled Considerations for a full technical picture and the most likely turning points.

Technical: As of 7:00 AM ET, Wednesday’s regular session (9:30 AM – 4:00 PM ET), in the S&P 500, will likely open in the middle part of a balanced overnight inventory, inside of prior-range and -value, suggesting a limited potential for immediate directional opportunity.

In the best case, the S&P 500 trades higher; activity above the $4,217.25 overnight high (ONH) puts in play the $4,267.75 regular trade high (RTH High). Initiative trade beyond the RTH High could reach as high as the $4,303.75 ONH and $4,337.00 VPOC, or higher.

In the worst case, the S&P 500 trades lower; activity below the $4,217.25 ONH puts in play the $4,193.25 spike base. Initiative trade beyond the spike base could reach as low as the $4,136.50 regular trade low (RTH Low) and $4,101.25 overnight low (ONL), or lower.

Considerations: Spikes mark the beginning of a break from value. Spikes higher (lower) are validated by trade at or above (below) the spike base (i.e., the origin of the spike).

Additionally, the indexes continue to trade below their 20-, 50-, and 200-day simple moving averages, confirming the trend change and bearish tone (further validated by poor breadth).

Graphic: Market Internals as pioneered by (a mentor of mine) Peter Reznicek. Notice the indicator in the top right, weighted S&P sectors (histogram) versus unweighted (blue line). During late last week, participants sold the entire market, heavily (as supported by the difference between the volume flowing into stocks that are up versus those that are down).

All indexes remain, as stated, yesterday, below their volume-weighted average prices (VWAPs) anchored from the start of this year (or their respective peaks). 

VWAPs are a metric highly regarded by chief investment officers (CIOs), among other participants, for quality of trade. Liquidity algorithms, too, are benchmarked and programmed to buy and sell around VWAPs.

The Invesco QQQ Trust Series 1 (NASDAQ: QQQ) just tested a major VWAP, yesterday, anchored from the lows of March 2020. That’s a fair price to pay for Nasdaq 100 exposure.

Graphic: Invesco QQQ Trust Series 1 (NASDAQ: QQQ) with anchored VWAPs.

Notwithstanding, notice the flat-to-declining AVWAP that’s black in color. So long as prices remain below this level, the index is likely a sell. 

Should that level flatten (and begin to rise), and if the QQQ was able to trade above it for a sustained period, there is potential for sustained upside.

Click here to load today’s key levels into the web-based TradingView charting platform. Note that all levels are derived using the 65-minute timeframe. New links are produced, daily.
Graphic: 65-minute profile chart of the Micro E-mini S&P 500 Futures.

Definitions

Overnight Rally Highs (Lows): Typically, there is a low historical probability associated with overnight rally-highs (lows) ending the upside (downside) discovery process.

Volume Areas: A structurally sound market will build on areas of high volume (HVNodes). Should the market trend for long periods of time, it will lack sound structure, identified as low volume areas (LVNodes). LVNodes denote directional conviction and ought to offer support on any test. 

If participants were to auction and find acceptance into areas of prior low volume (LVNodes), then future discovery ought to be volatile and quick as participants look to HVNodes for favorable entry or exit.

POCs: POCs are valuable as they denote areas where two-sided trade was most prevalent in a prior day session. Participants will respond to future tests of value as they offer favorable entry and exit.

About

After years of self-education, strategy development, mentorship, and trial-and-error, Renato Leonard Capelj began trading full-time and founded Physik Invest to detail his methods, research, and performance in the markets.

Capelj also develops insights around impactful options market dynamics at SpotGamma and is a Benzinga reporter.

Some of his works include conversations with ARK Invest’s Catherine Wood, investors Kevin O’Leary and John Chambers, FTX’s Sam Bankman-Fried, Kai Volatility’s Cem Karsan, The Ambrus Group’s Kris Sidial, among many others.

Disclaimer

In no way should the materials herein be construed as advice. Derivatives carry a substantial risk of loss. All content is for informational purposes only.