Categories
Commentary

Daily Brief For February 3, 2023

Physik Invest’s Daily Brief is read by thousands of subscribers. You, too, can join this community to learn about the fundamental and technical drivers of markets.

Graphic updated 8:20 AM ET. Sentiment Neutral if expected /ES open is inside of the prior day’s range. /ES levels are derived from the profile graphic at the bottom of this letter. Click here for the latest levels. SqueezeMetrics Dark Pool Index (DIX) and Gamma (GEX) with the latter calculated based on where the prior day’s reading falls with respect to the MAX and MIN of all occurrences available. A higher DIX is bullish. At the same time, the lower the GEX, the more (expected) volatility. Click to learn the implications of volatility, direction, and moneyness. Breadth reflects a reading of the prior day’s NYSE Advance/Decline indicator. The CBOE VIX Volatility Index (INDEX: VVIX) reflects the attractiveness of owning volatility.

Positioning

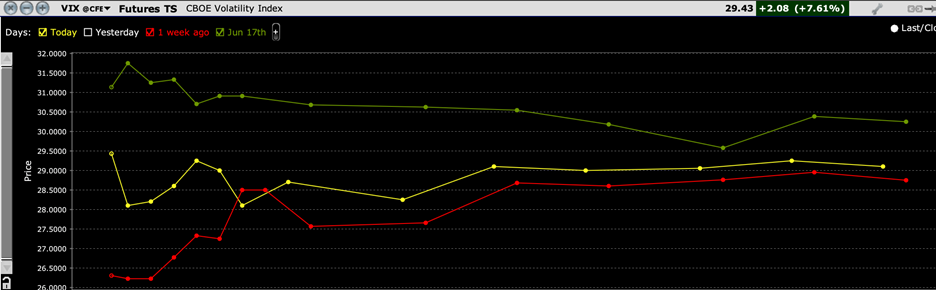
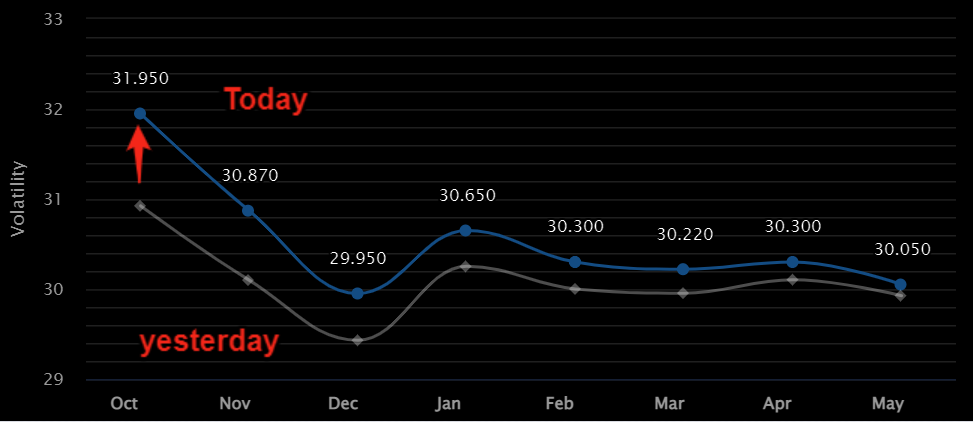
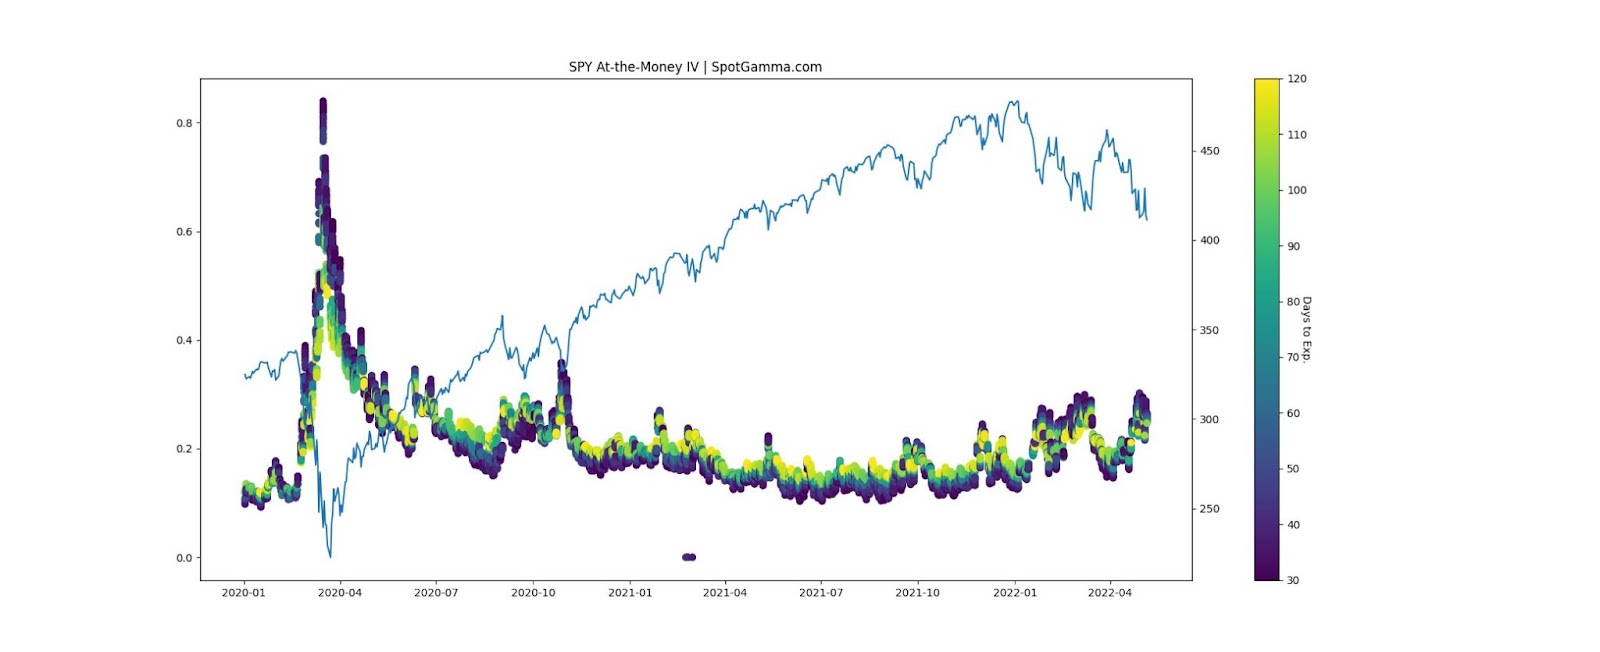
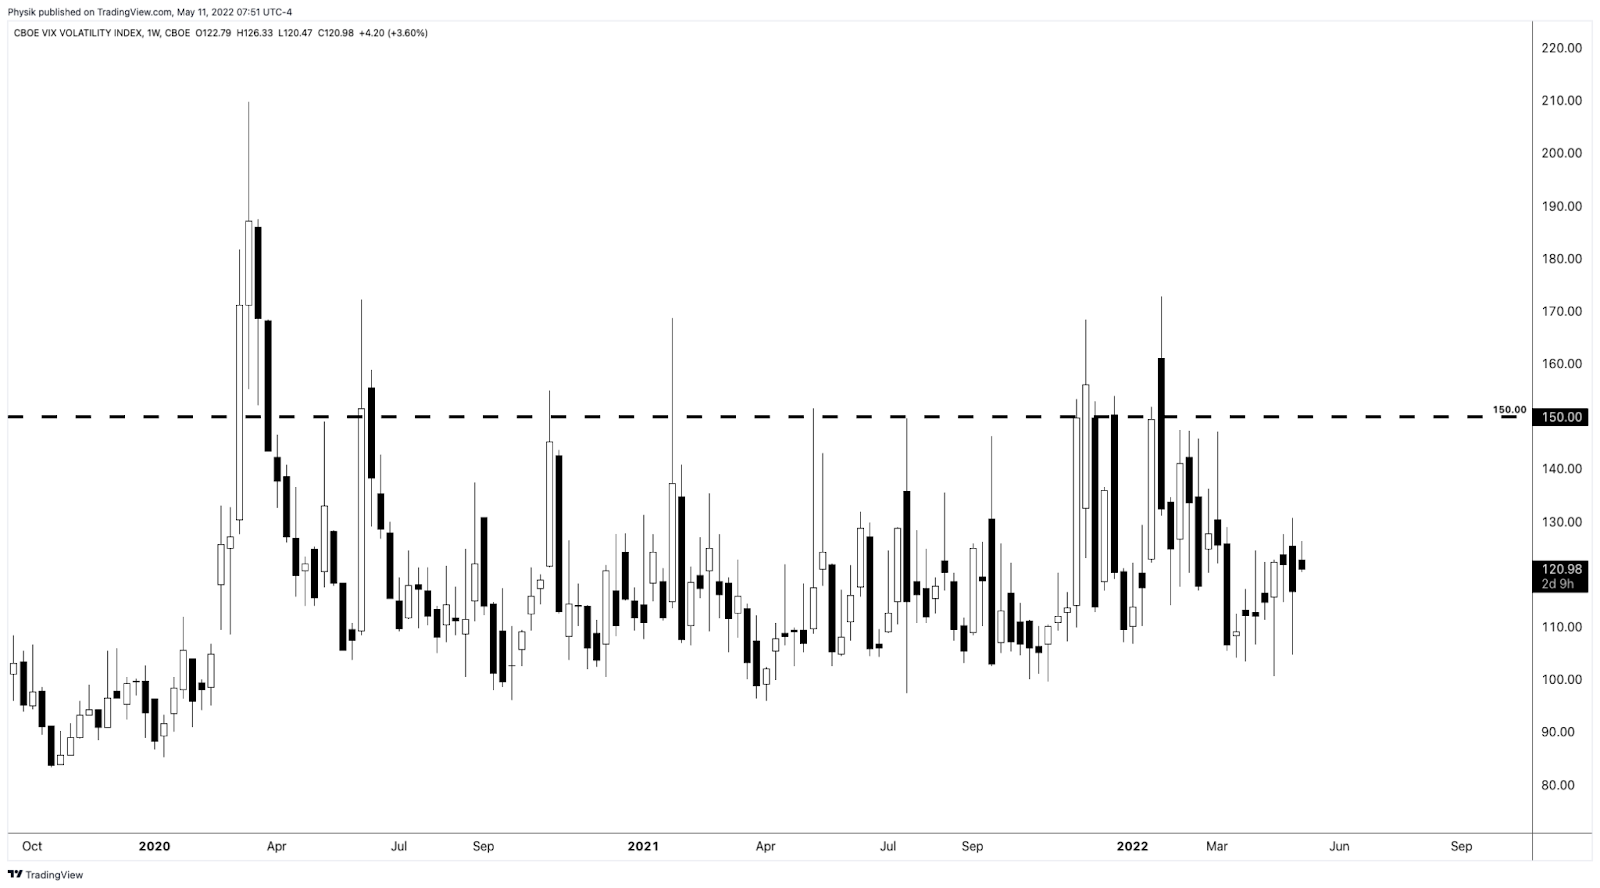
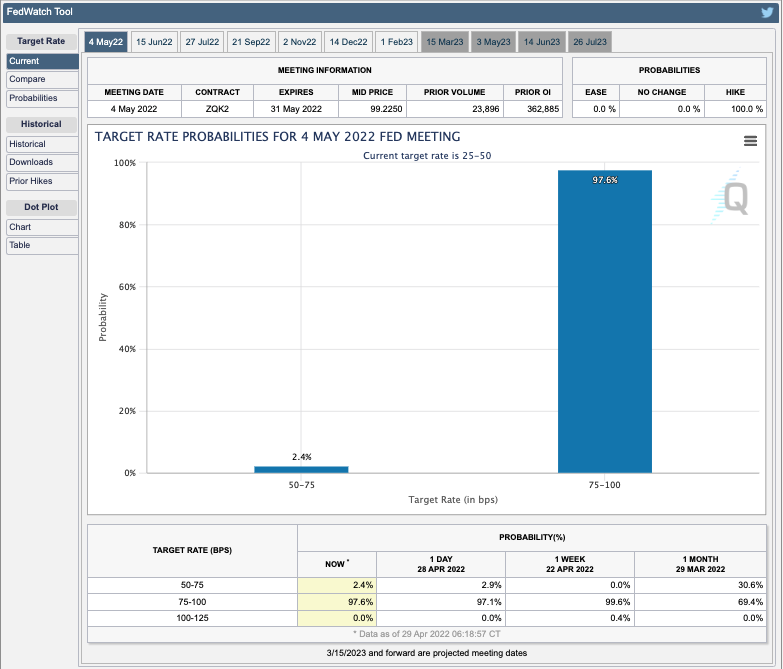
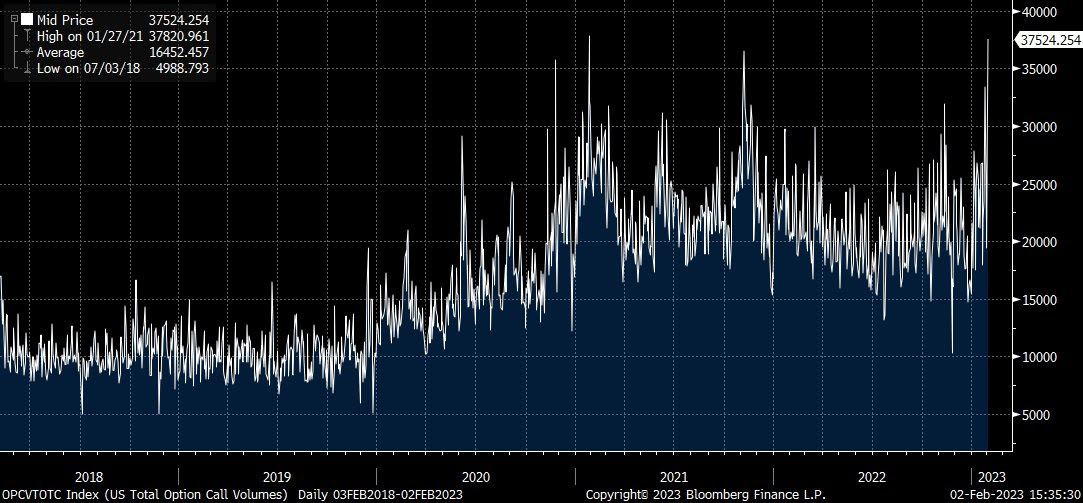
The Federal Reserve’s (Fed) decision to increase its benchmark interest rate by 25 basis points kicked off a bout of strength, boosted by the compression of wound implied volatility (IVOL). This volatility compression we observed with a shift lower in the IV term structure in the S&P 500 (INDEX: SPX). Follow-on strength surfaced on Thursday and, based on an analysis of top-line IVOL measures such as the Cboe Volatility Index (INDEX: VIX) trending higher with the SPX, it was, in part, from traders’ demands for call options, hence high call option volumes.

Graphic: Retrieved from Bloomberg via Danny Kirsch on 2/2/2023.

Recall our detailed letter published prior to February 2, 2023 (e.g., February 1, 2023, January 26, 2023, and beyond). The context was set for the SPX and VIX to trend higher; traders bidding up call options due to their fear of missing out, in the context of less liquidity to absorb those demands, would be beneficial to owners of structures like call option butterflies and ratio spreads. Additionally, owning such structures would help dampen the impact of potential SPX downside on portfolios.

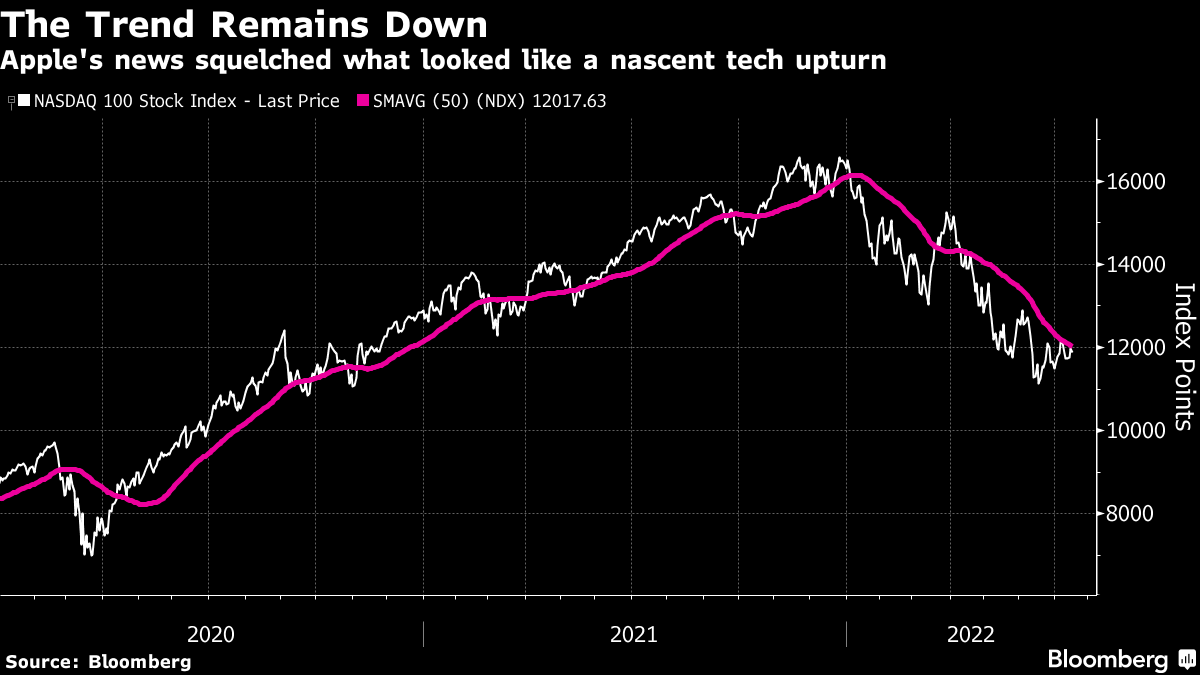
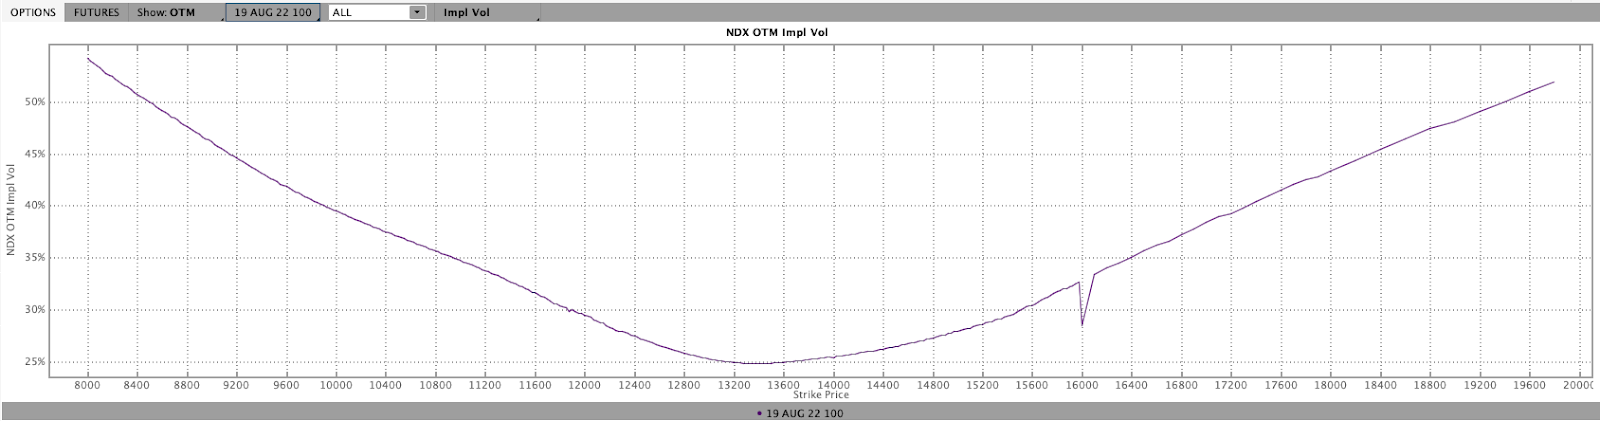
For instance, on January 25, 2023, this letter said trades structured in the indexes such as the Nasdaq 100 (INDEX: NDX), where there was a steeper skew that would enable us to collect more credit in the options we are short, thereby lowering the cost of the spread we own, looked attractive, given the likelihood that the index would stay strong after the earnings reports of some big movers like Tesla Inc (NASDAQ: TSLA). 

In yesterday’s letter update, we said that such trades were working spectacularly. In fact, your letter writer’s trading partner, who “initiated some +1 x -2 (17 FEB 23 13500/14000) [NDX] call ratio spreads for free (i.e., $0.00 debit or better to enter),” saw his spreads price in excess of a $40.00 credit to close, yesterday. That structure went from a $0 debit to open to a $4,000.00 credit to close. Again, nice job Justin. I’m expecting that case study, soon!

The NDX was probably the best place to be, yesterday, looking at the magnitude of movement in some of the heavyweights in the SPX, yesterday.

Graphic: Retrieved from Tier1Alpha.

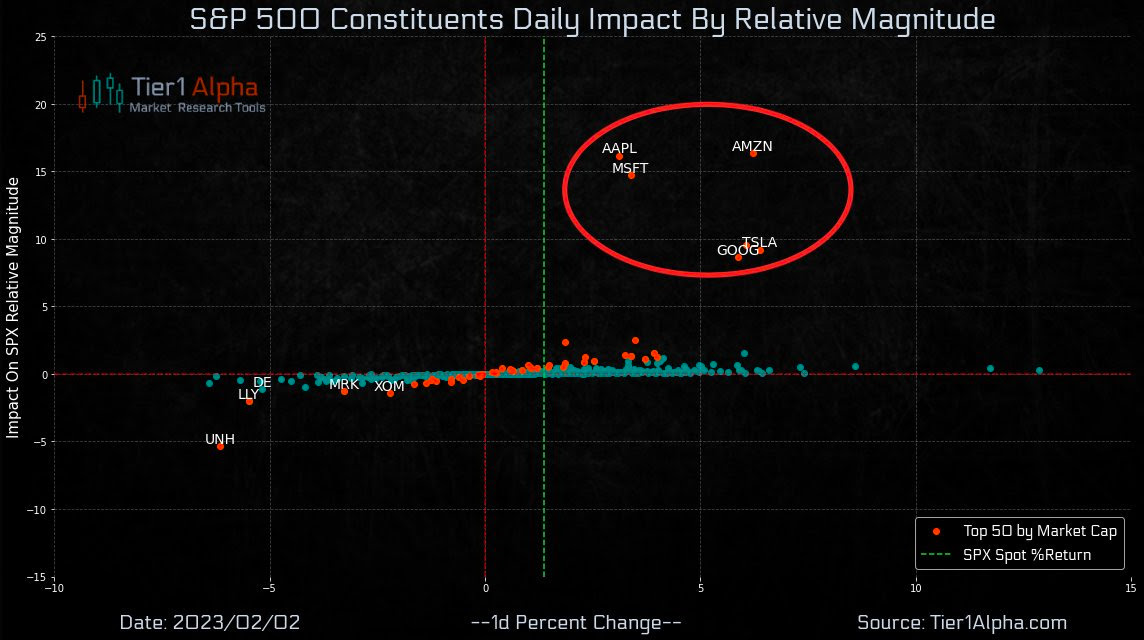
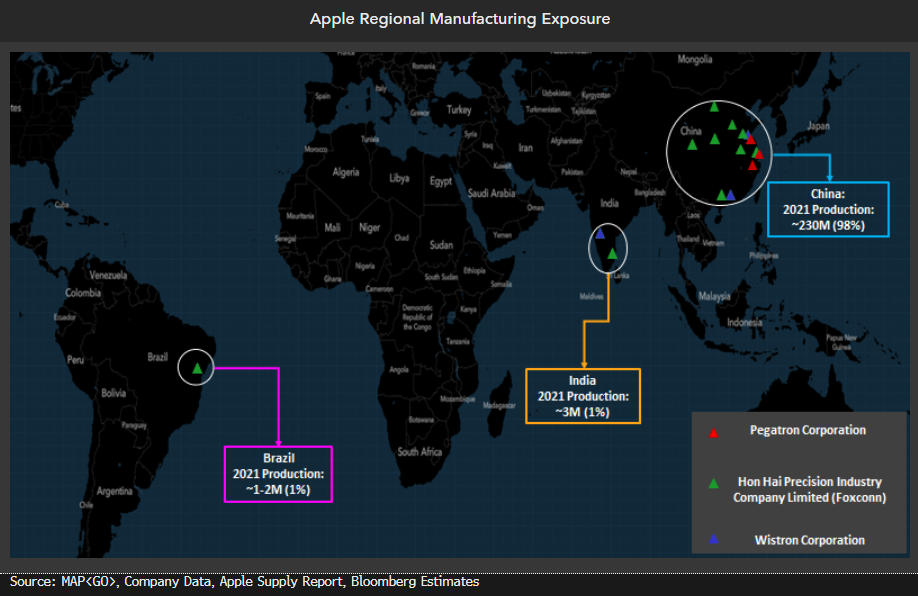
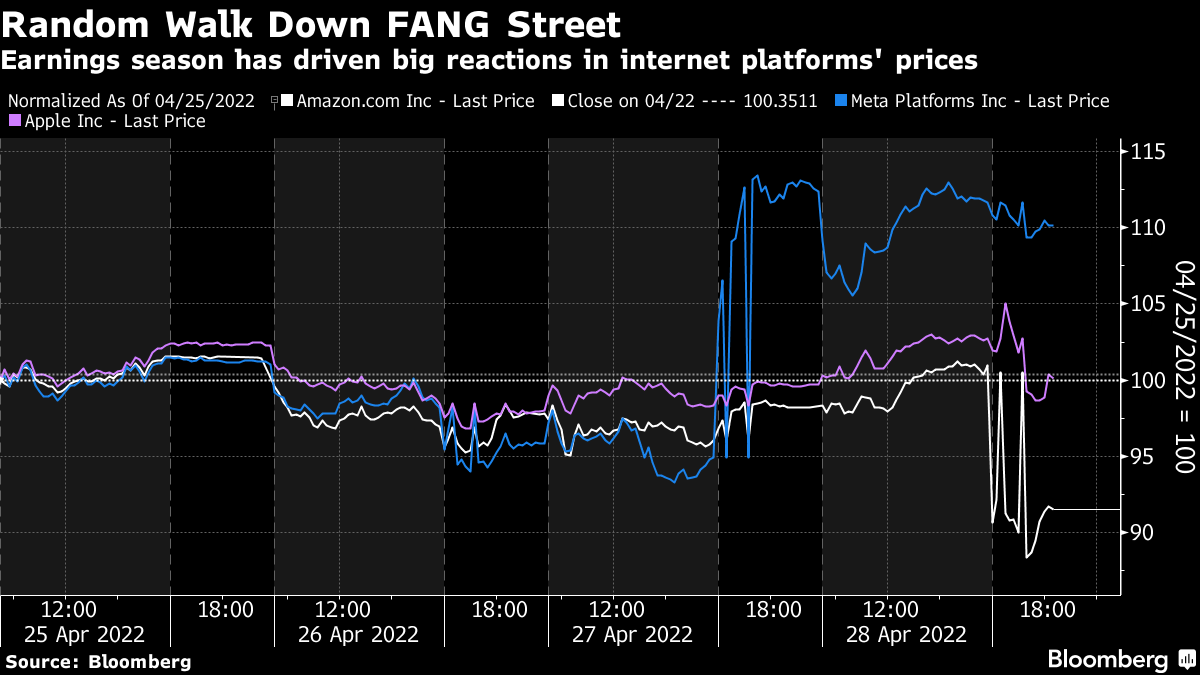
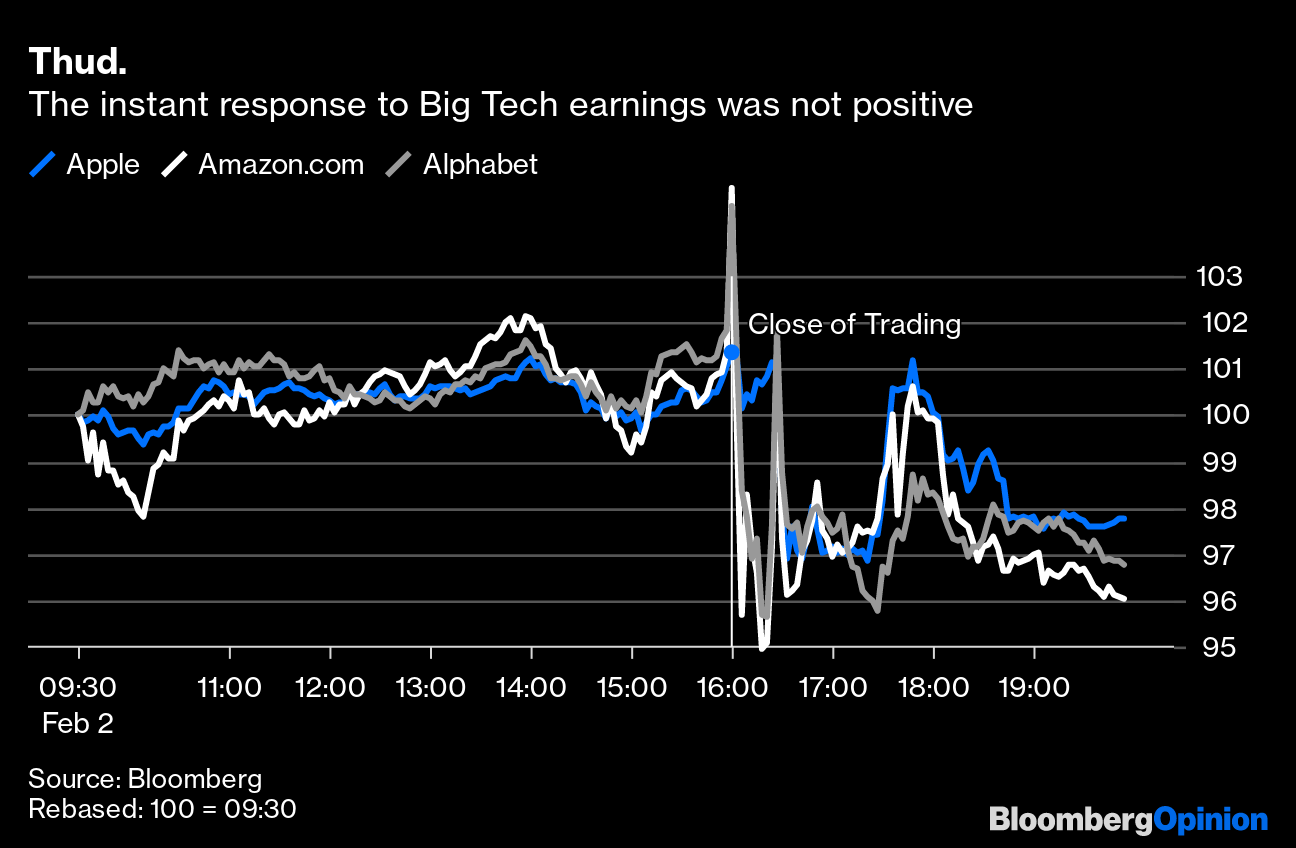
Noteworthy is that many of the strongest performers (e.g., Google, Amazon, Apple) weakened considerably in the after-market when their earnings, and the speeches associated, pointed to some challenges ahead.

Graphic: Retrieved from Bloomberg.

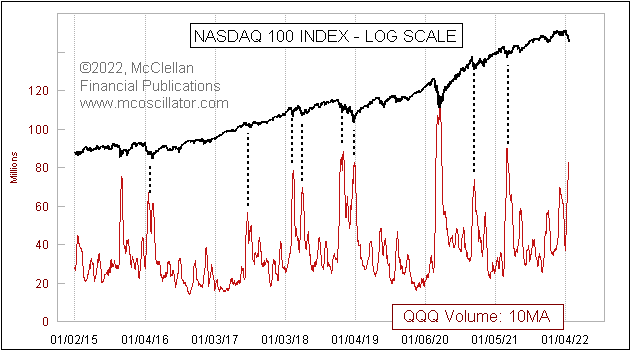
Breadth was, generally, not that strong, to add. This validates your letter writer’s belief the market is in a precarious position. Notwithstanding the market’s potential to stay strong into the mid-February timeframe as some strategists believe, the data seems to suggest that “whenever there are two million or more call contracts that exchange hands on the Cboe, future 5- and 10-day returns tend toward being negative (about -1.37% and -2.12% respectively),” SpotGamma said.

SpotGamma added: “This is, in part, because the bullish hedging impact of short-dated call options activity is not long-lasting. Also, IV compressing from a relatively low starting point also does little to bolster long-lasting rallies.”

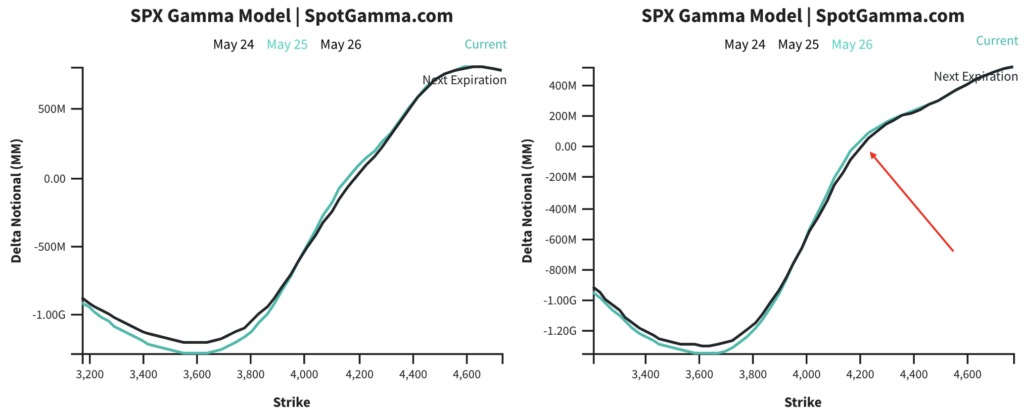
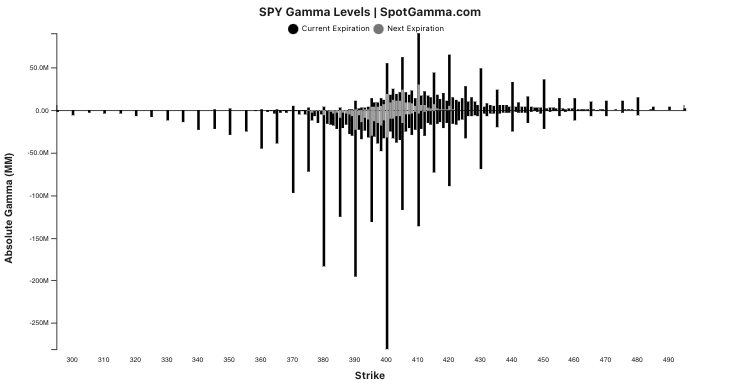
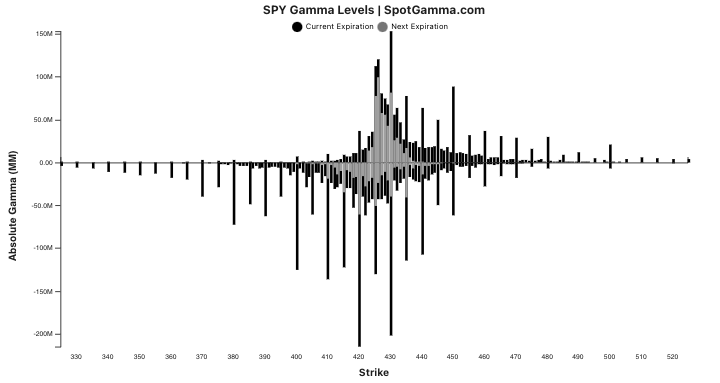
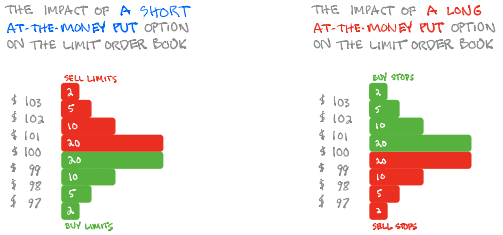
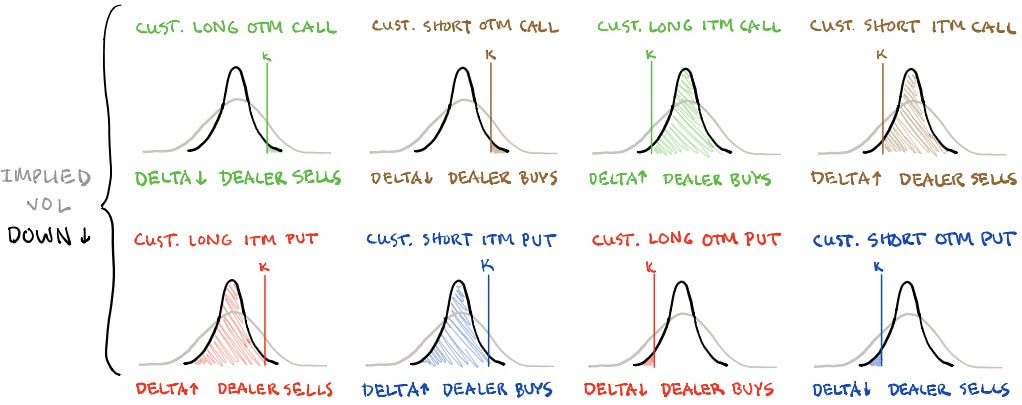
As further validation for the precariousness the market is in, “[t]he most prominent feature of the 0DTE landscape is actually customer-bought calls way out at $4,200.00 (which would ramp up buying from dealer long-gamma if SPX were to rise to ~$4,170.00.” Per SpotGamma, should “traders’ interest build at or slightly above current SPX prices, then dealers’ hedging may actually result in range suppression or pressure” as time passes and volatility falls. That’s because if a long call option’s probability of finishing in the money at expiration falls, the dealer’s risk falls as well and, so, the dealer can sell some of their hedges. This is market pressure.

Graphic: Retrieved from SqueezeMetrics.

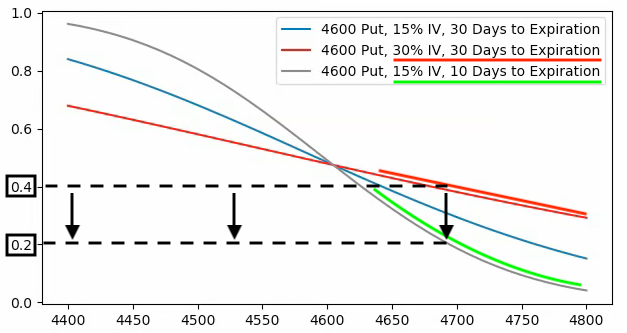
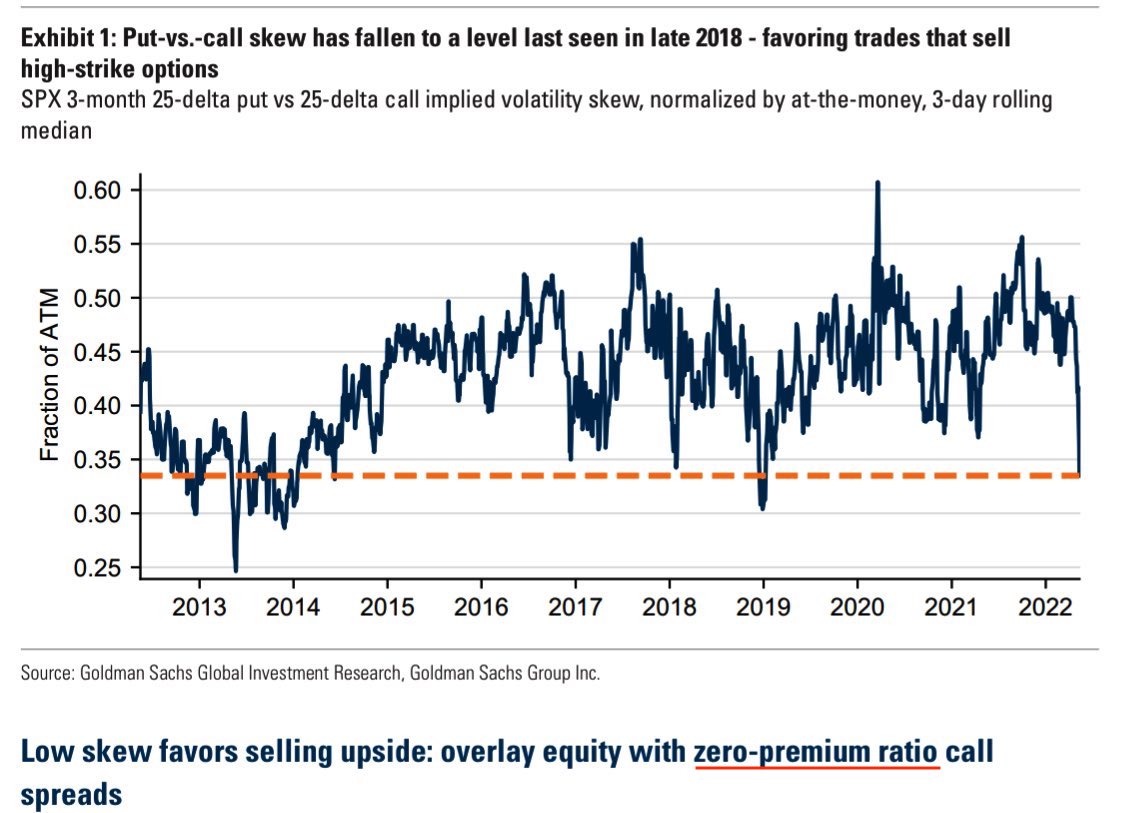
As this letter stated, yesterday, knowing that longer-dated SPX IVOL “is cheap, now attractive trades include selling rich call verticals to finance put verticals.”

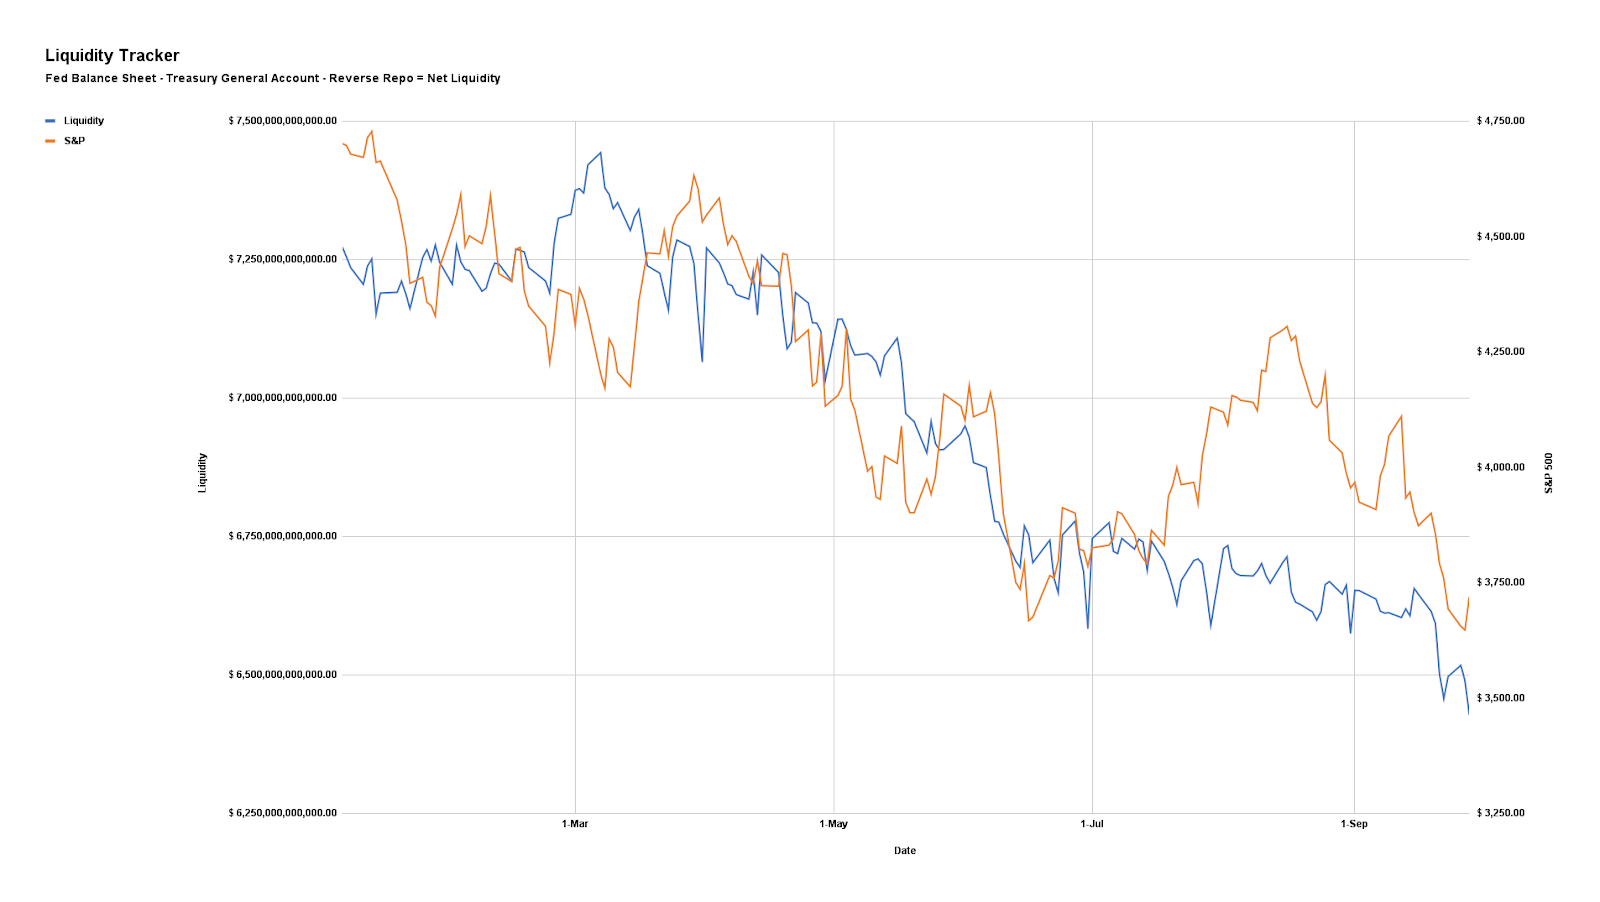
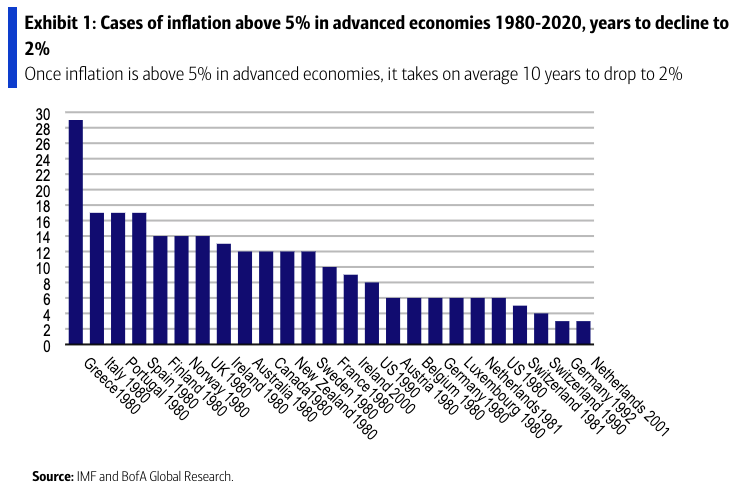
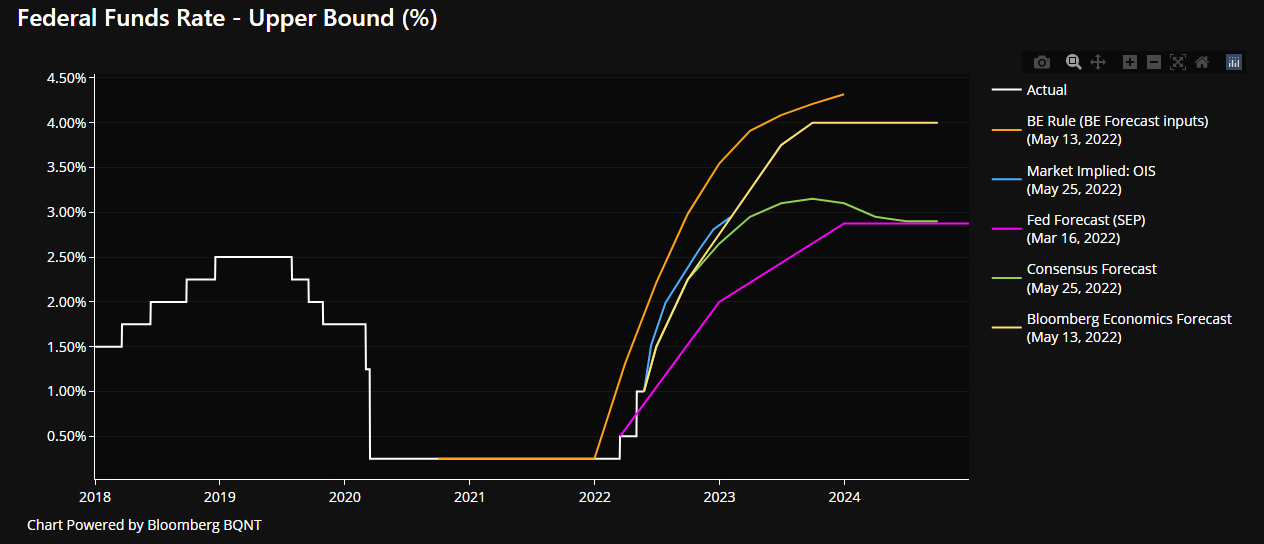
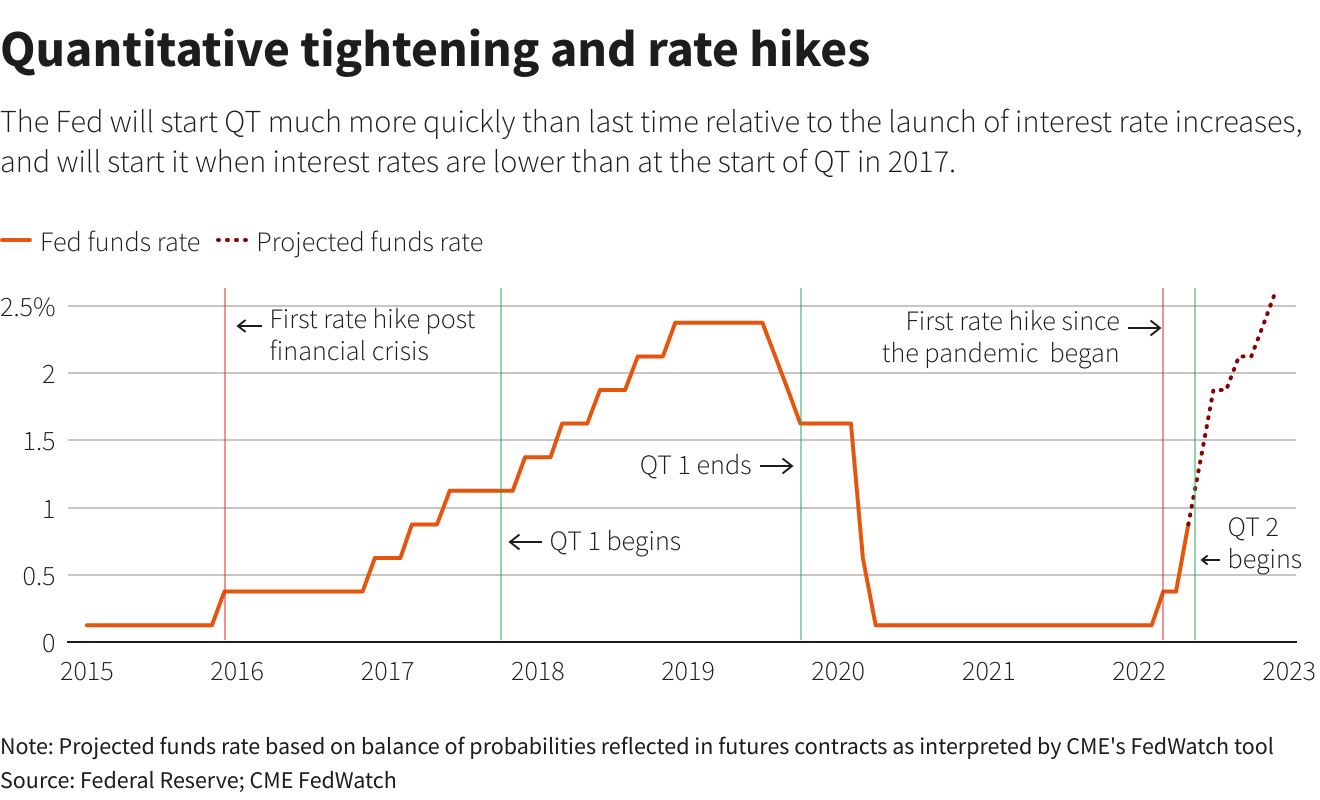
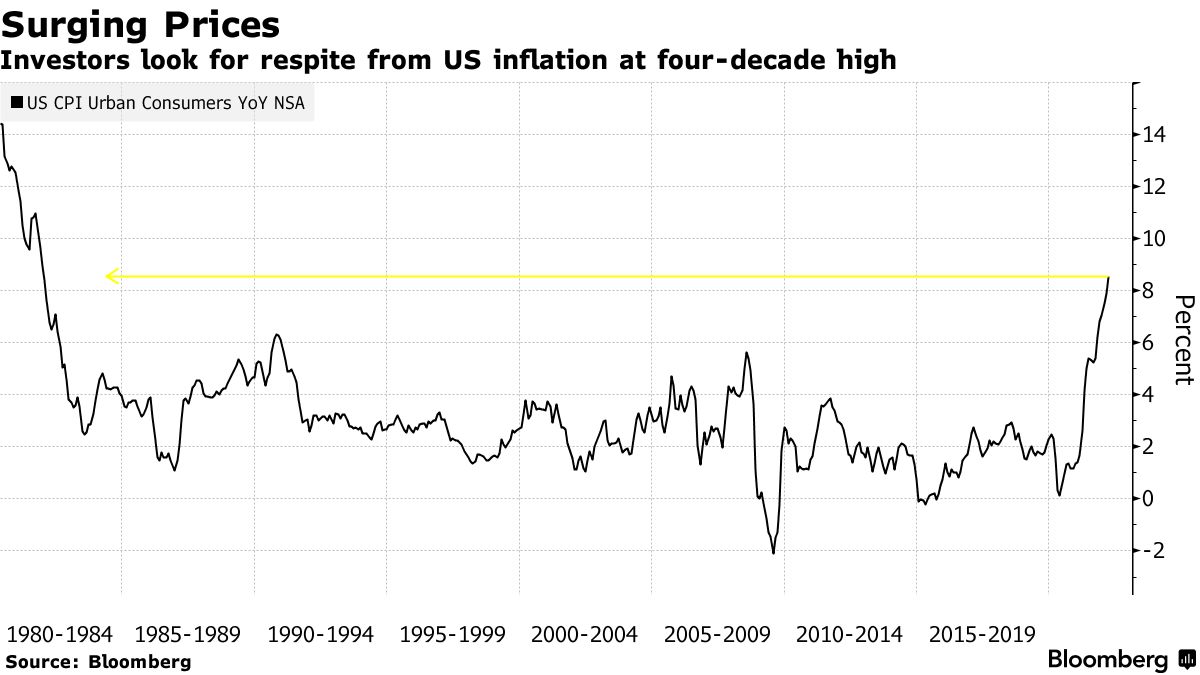
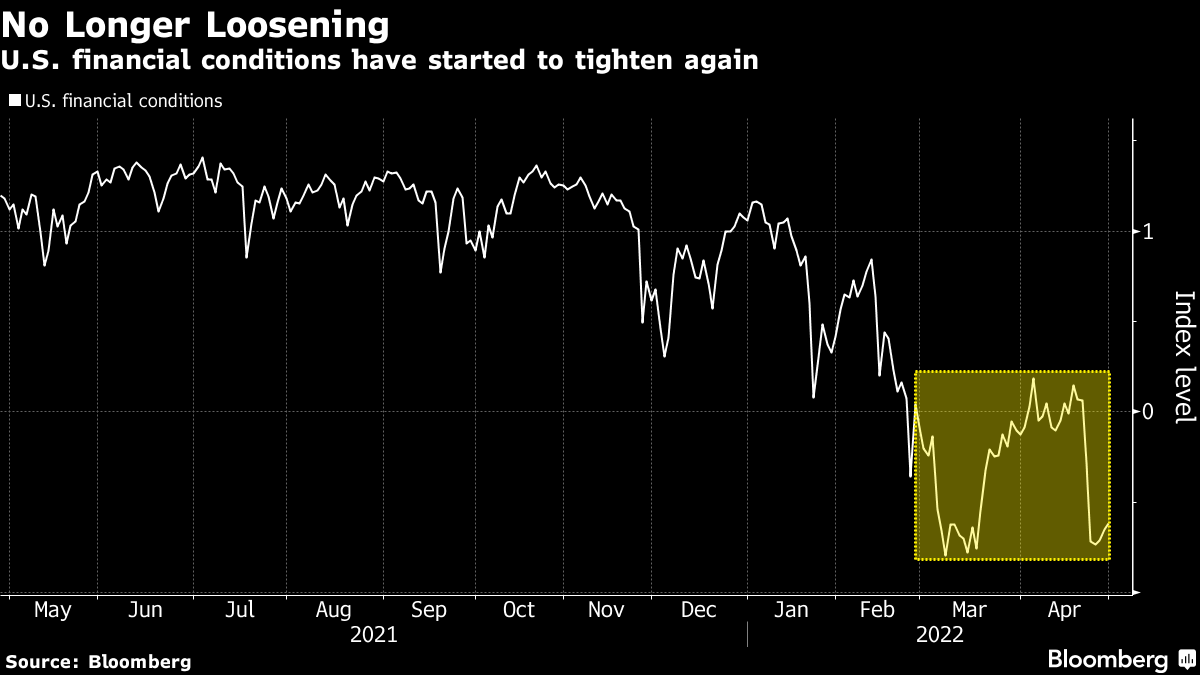
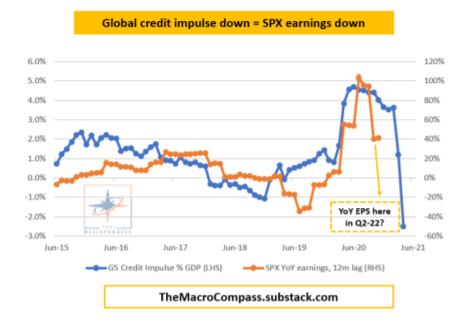
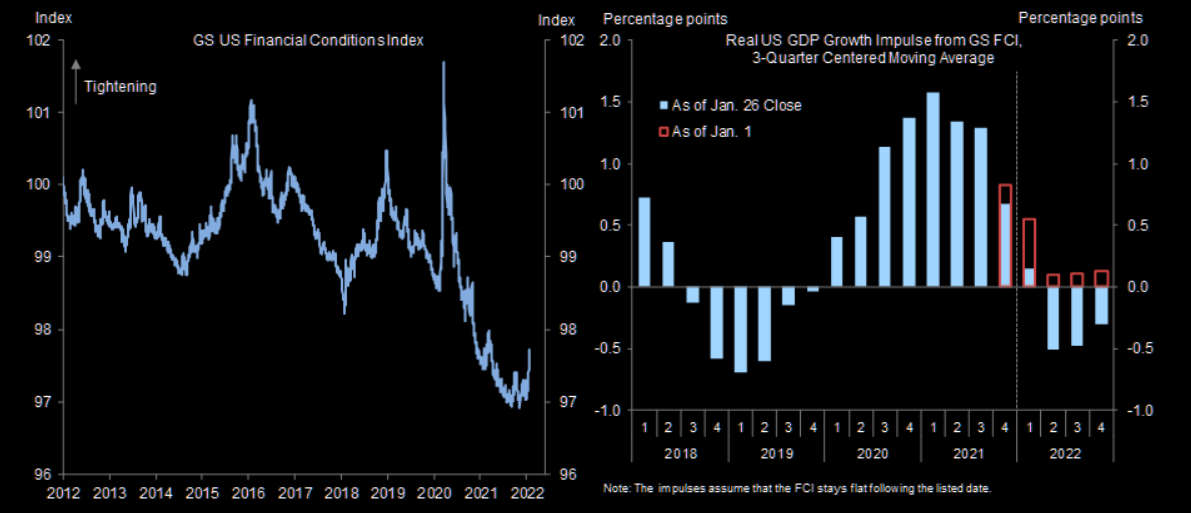
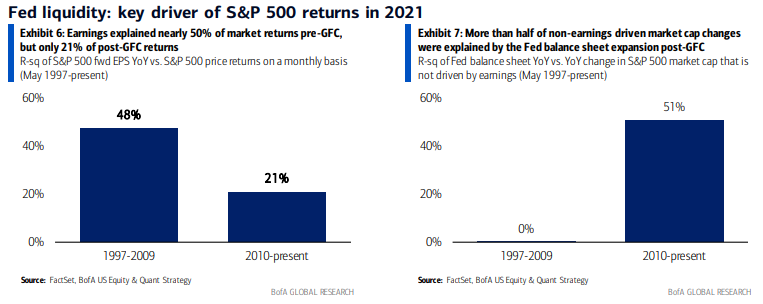
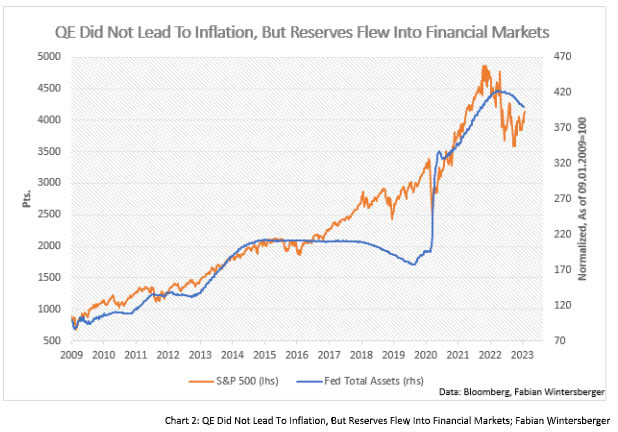
Per Joseph Wang, the “increasing probability of a second bout of inflation, an issue in the 1970s that the Fed is keen to avoid … [by] retighten[ing] financial conditions … through its balance sheet,” the flow of capital out of capital markets presents more pressure on the financial economy (not necessarily the real economy). Cheap put protection may help hedge the realization of further macro-type market pressure.

Graphic: Retrieved from Fabian Wintersberger.

Technical

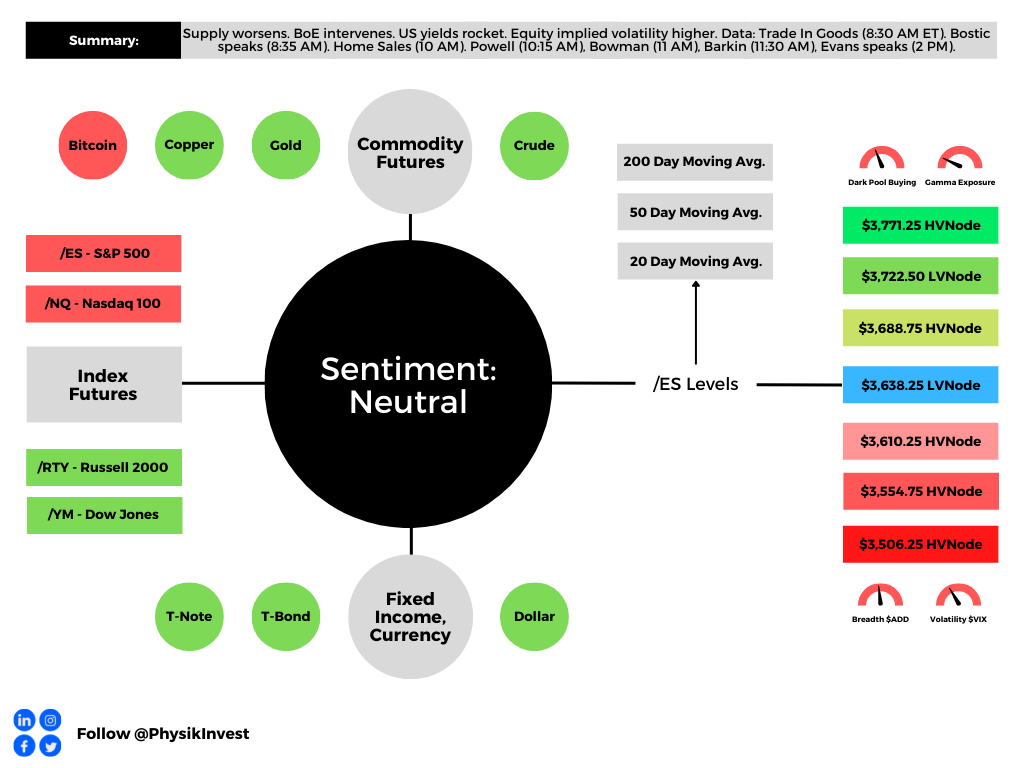
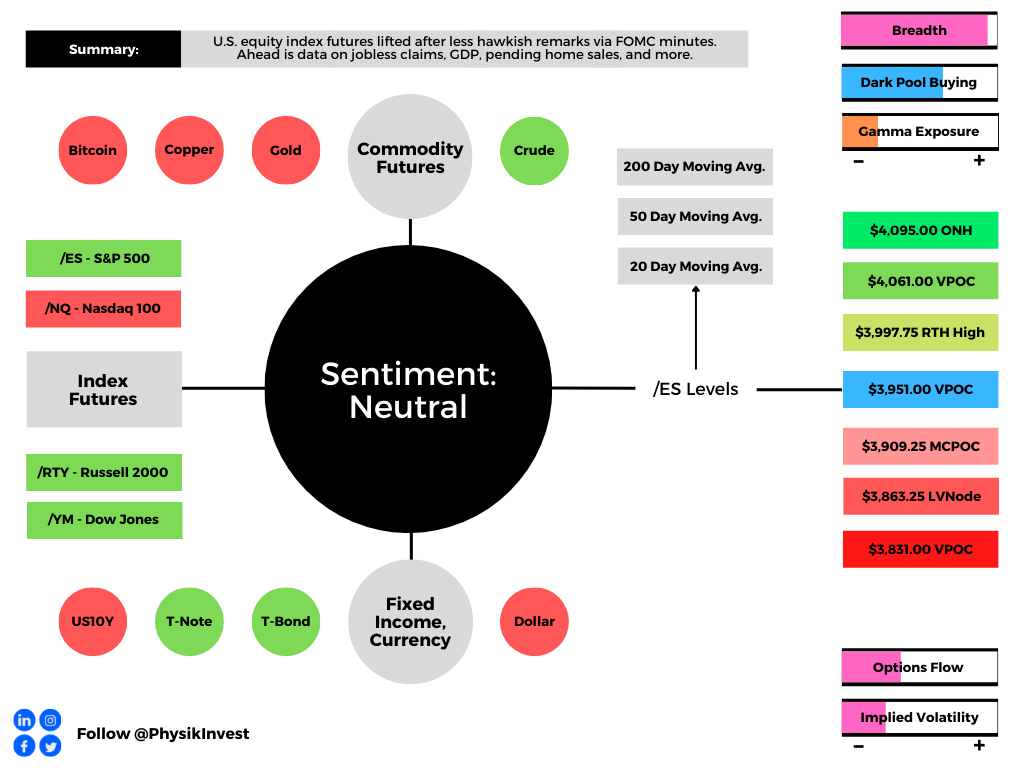
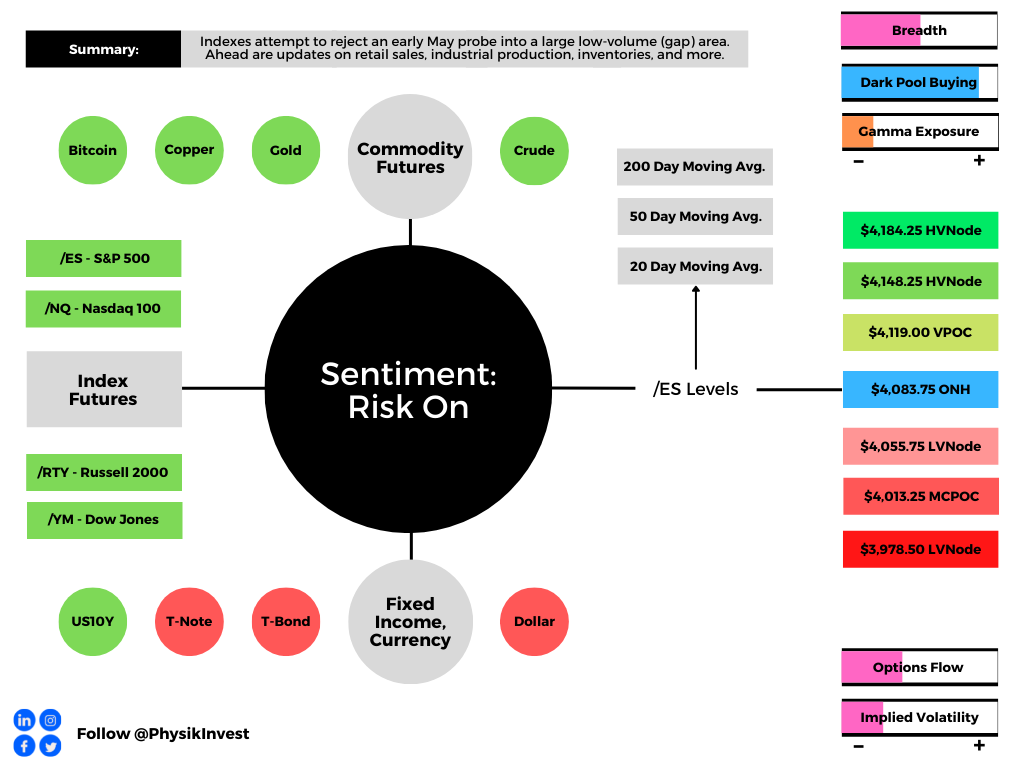
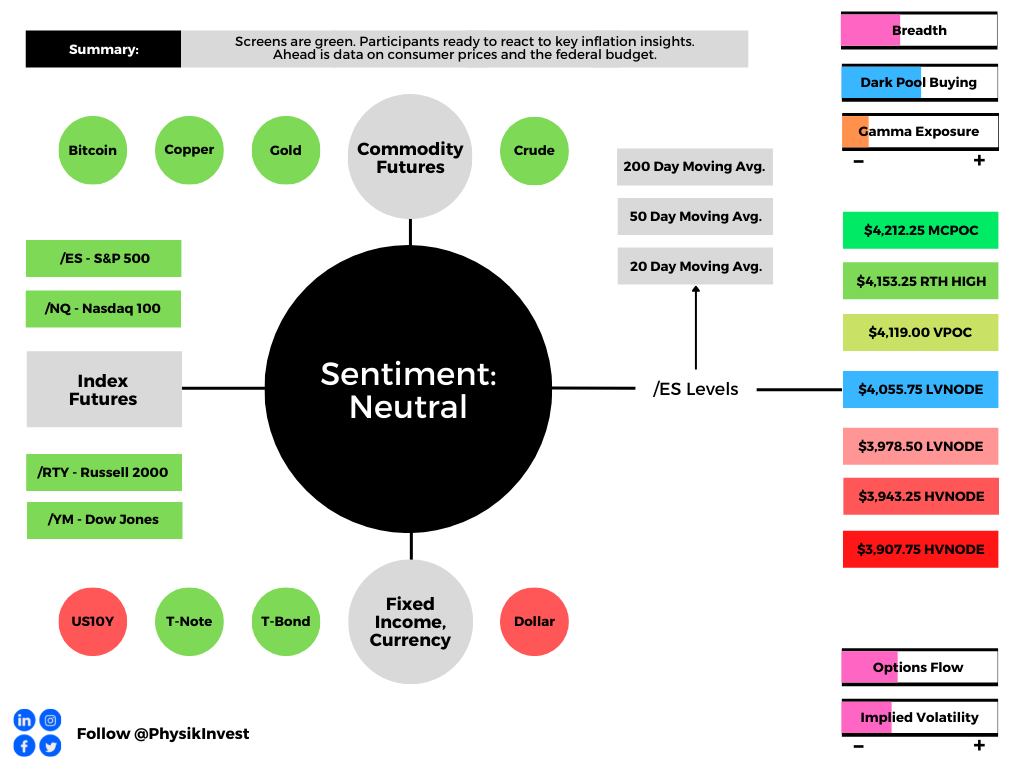
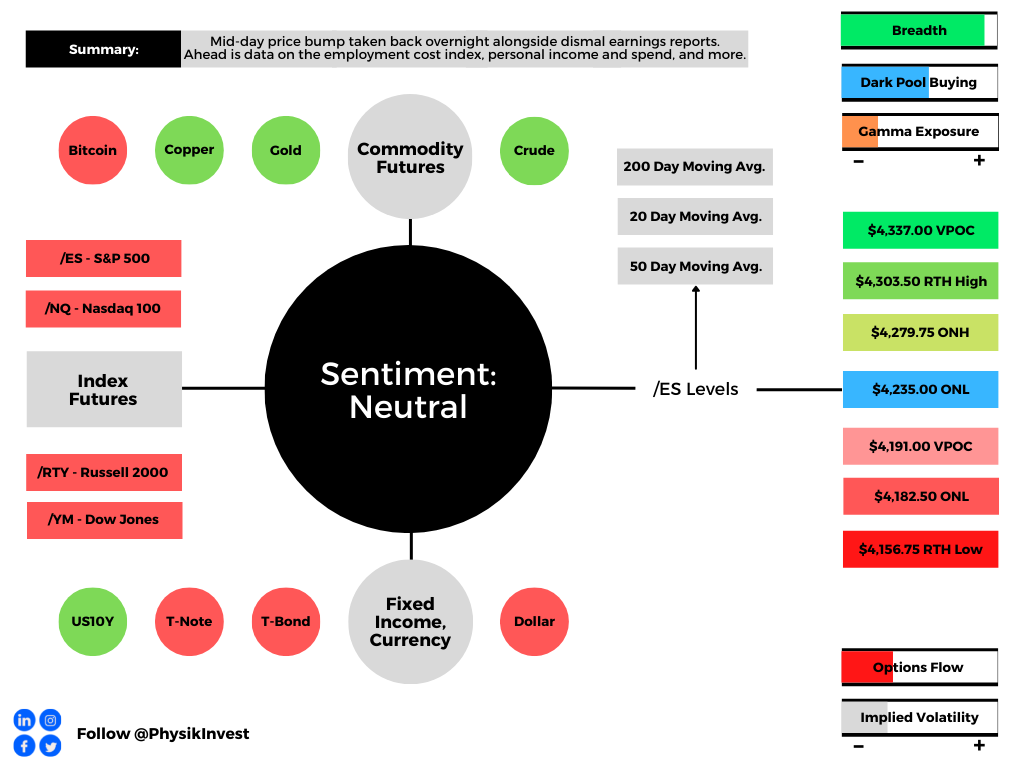
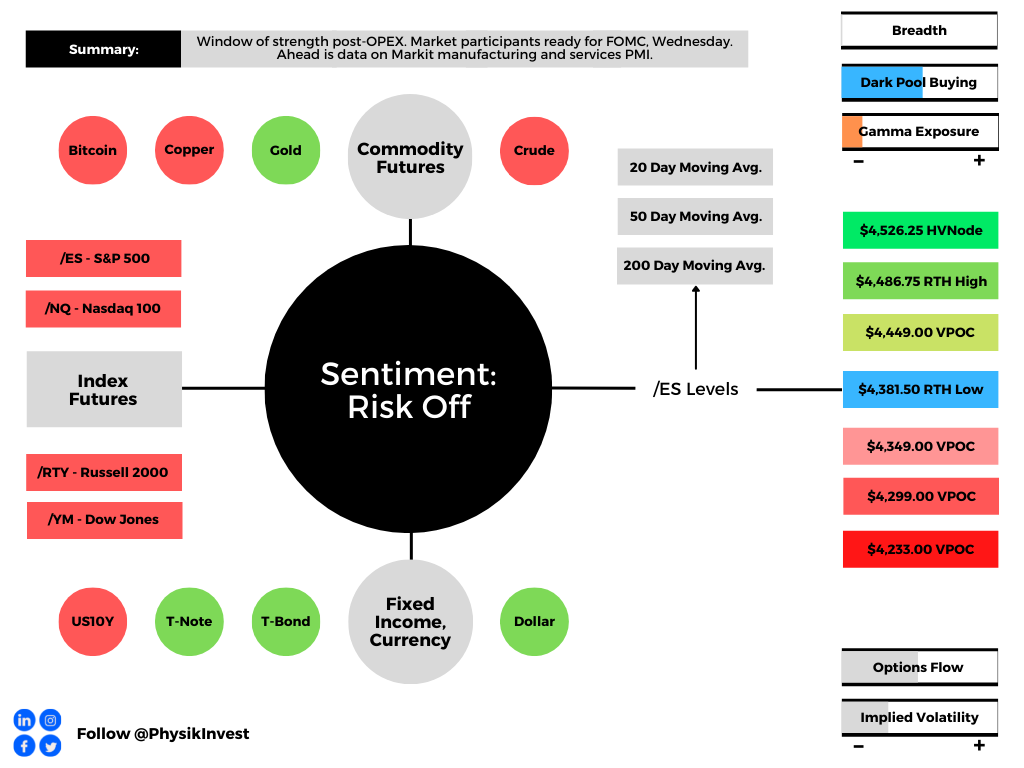
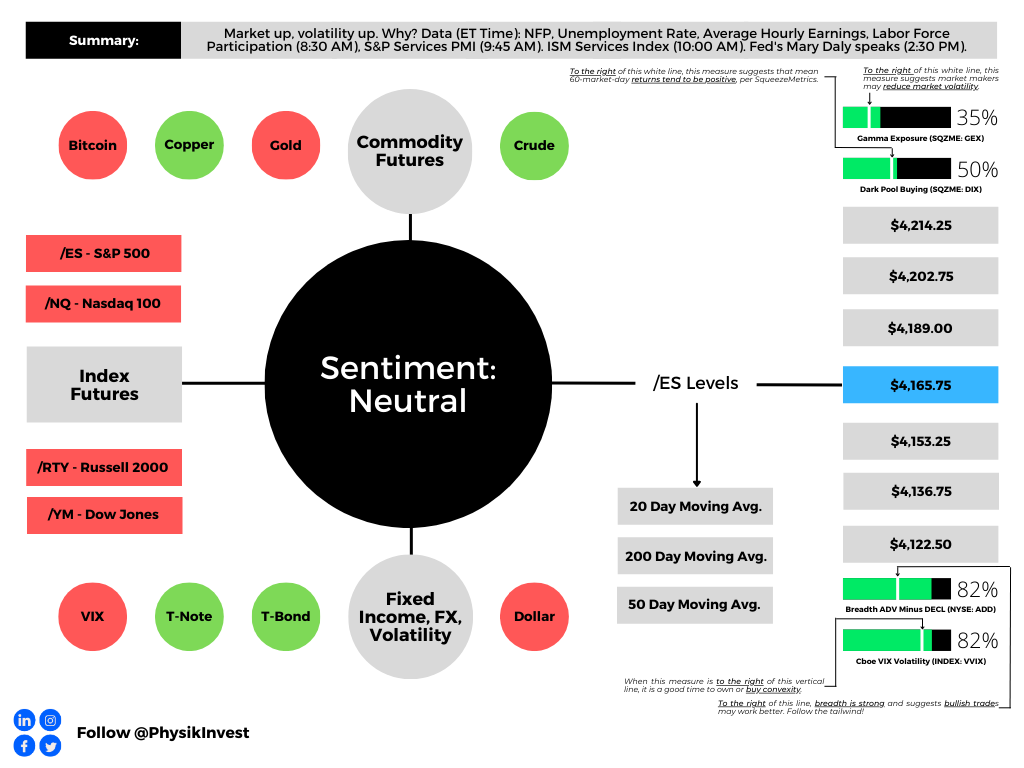
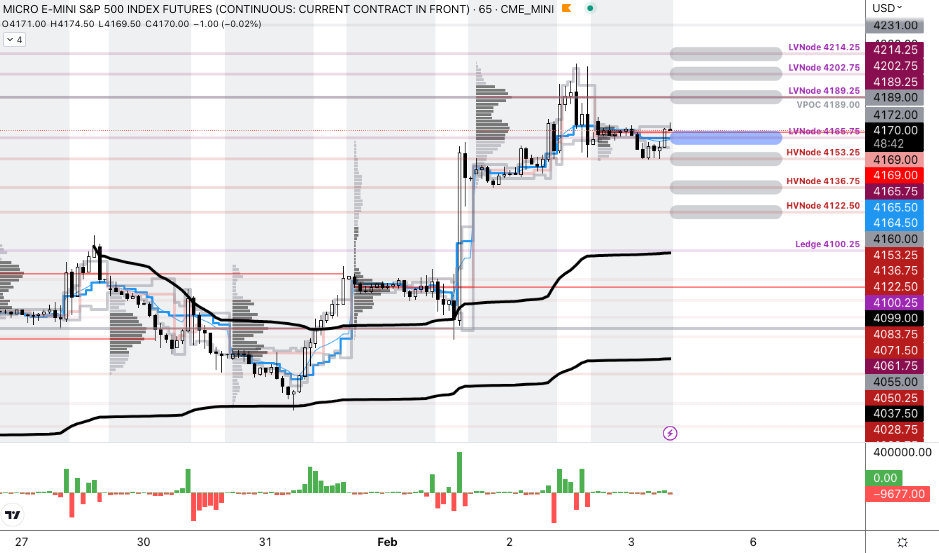
As of 8:15 AM ET, Friday’s regular session (9:30 AM – 4:00 PM ET), in the S&P 500, is likely to open in the upper part of a negatively skewed overnight inventory, inside of the prior range, suggesting a limited potential for immediate directional opportunity.

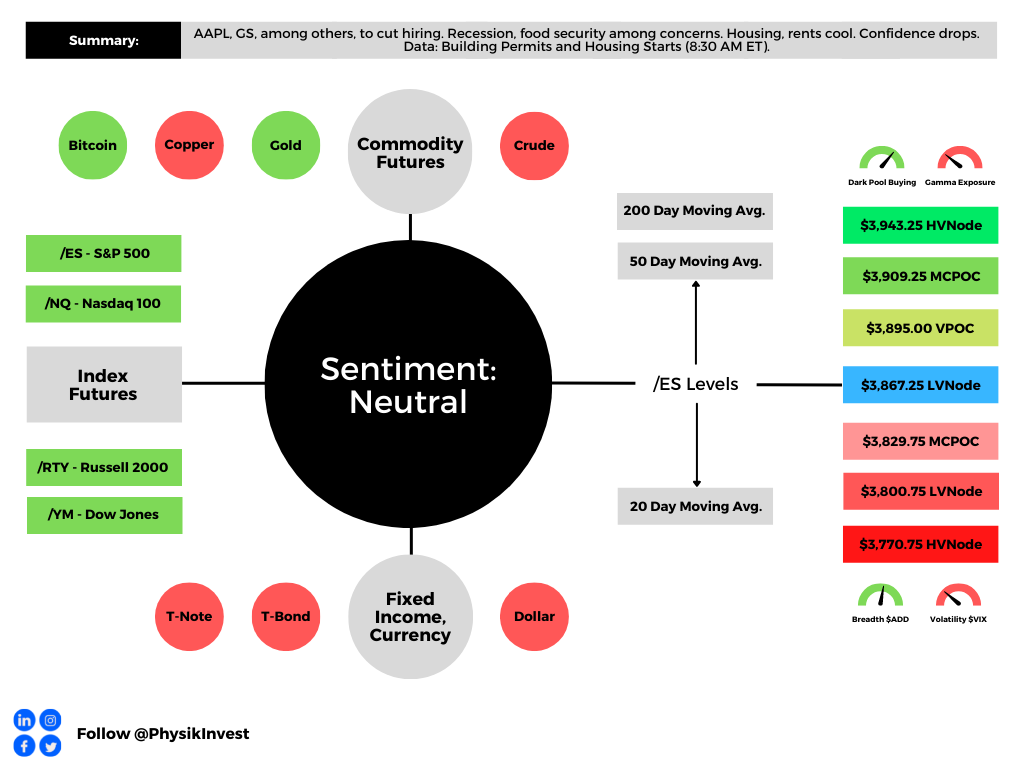
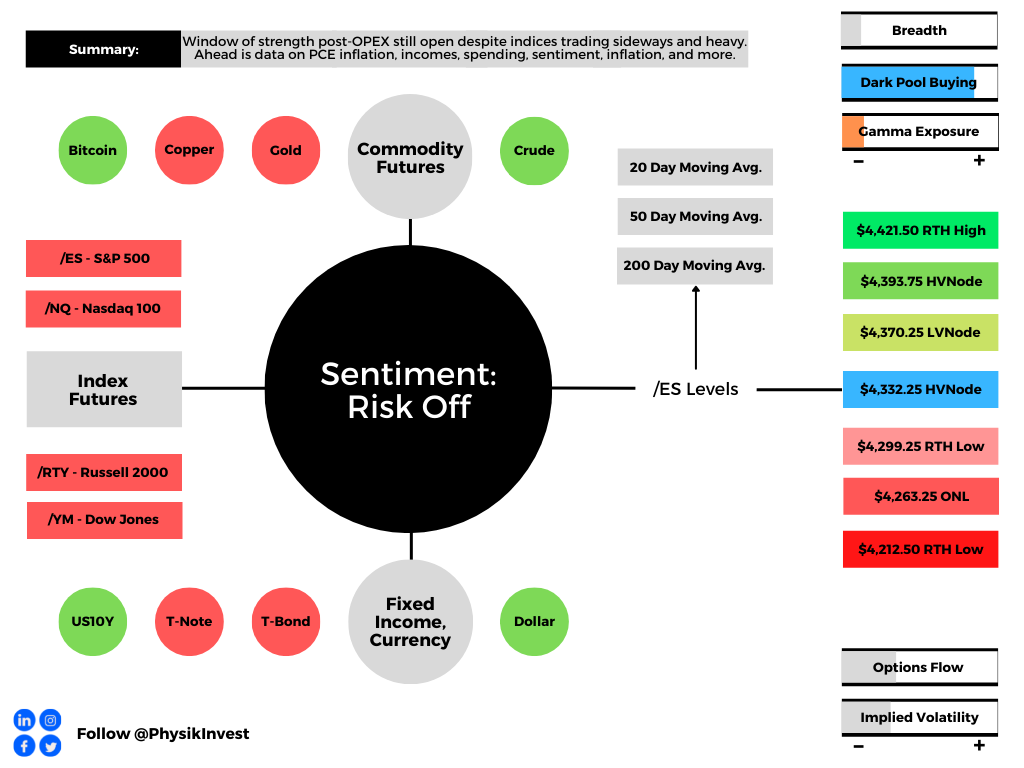
The S&P 500 pivot for today is $4,165.75. 

Key levels to the upside include $4,189.00, $4,202.75, and $4,214.25.

Key levels to the downside include $4,153.25, $4,136.75, and $4,122.50.

Disclaimer: Click here to load the updated key levels via the web-based TradingView platform. New links are produced daily. Quoted levels hold weight barring an exogenous development.

Graphic: 65-minute profile chart of the Micro E-mini S&P 500 Futures.

Definitions

Volume Areas: Markets will build on areas of high-volume (HVNodes). Should the market trend for a period of time, this will be identified by a low-volume area (LVNodes). The LVNodes denote directional conviction and ought to offer support on any test.

If participants auction and find acceptance in an area of a prior LVNode, then future discovery ought to be volatile and quick as participants look to the nearest HVNodes for more favorable entry or exit.

POCs: Areas where two-sided trade was most prevalent in a prior day session. Participants will respond to future tests of value as they offer favorable entry and exit.


About

In short, Renato Leonard Capelj is an economics graduate working in finance and journalism.

Capelj spends most of his time as the founder of Physik Invest through which he invests and publishes daily analyses to subscribers, some of whom represent well-known institutions.

Separately, Capelj is an equity options analyst at SpotGamma and an accredited journalist interviewing global leaders in business, government, and finance.

Past works include conversations with investor Kevin O’Leary, ARK Invest’s Catherine Wood, FTX’s Sam Bankman-Fried, Lithuania’s Minister of Economy and Innovation Aušrinė Armonaitė, former Cisco chairman and CEO John Chambers, and persons at the Clinton Global Initiative.

Contact

Direct queries to renato@physikinvest.com or Renato Capelj#8625 on Discord.

Calendar

You may view this letter’s content calendar at this link.

Disclaimer

Do not construe this newsletter as advice. All content is for informational purposes.

Categories
Commentary

Daily Brief For September 30, 2022

The daily brief is a free glimpse into the prevailing fundamental and technical drivers of U.S. equity market products. Join the 980+ that read this report daily, below!

Graphic updated 9:50 AM ET. Sentiment Neutral if expected /ES open is inside of the prior day’s range. /ES levels are derived from the profile graphic at the bottom of the following section. Levels may have changed since initially quoted; click here for the latest levels. SqueezeMetrics Dark Pool Index (DIX) and Gamma (GEX) calculations are based on where the prior day’s reading falls with respect to the MAX and MIN of all occurrences available. A higher DIX is bullish. At the same time, the lower the GEX, the more (expected) volatility. Learn the implications of volatility, direction, and moneyness. Breadth reflects a reading of the prior day’s NYSE Advance/Decline indicator. VIX reflects a current reading of the CBOE Volatility Index (INDEX: VIX) from 0-100.

Administrative

Apologies for the delay. Hectic end-of-week! A little heavy on the fundamental side of things and light on the positioning. More to unpack next week. Have a great weekend!

Fundamental

As an update to our September 29, 2022 letter, Russia responded to the Nord Stream attack suggesting the incident spoke of state-sponsored “terrorism”, all the while “an EU official said the incident had fundamentally changed the nature of the conflict in Ukraine,” per Refinitiv.

Graphic: Retrieved from Bloomberg. Updated September 28, 2022.

In short, Russia’s throwing blame on the US, among others, suggesting it was likely to benefit through a boost in liquefied natural gas (LNG) sales. Russia previously said the leaks were in areas “fully under the control” of US intelligence agencies.

It’s the case that in February 2022, Joe Biden commented that if Russia invaded Ukraine, there would “no longer be a Nord Stream 2,” also.

In response, Nord Stream 1 leaks will be stopped on Monday with no forecasts yet on the future of the pipeline’s operation.

To note, the pipelines were not “supplying gas to Europe when the leaks were first detected, … [but] both had gas in them.” Regardless, the EU will be assessing the application of sanctions.

Moving on, as a recap, this week there was tons of volatility in overseas fixed income and FX markets. In short, the announcement of new fiscal policies coincided with market volatility that prompted reflexive feedback responses, which we dissected in our September 29, 2022 letter.

A cascade of margin calls, during the route to 7-8% yields, would have put in jeopardy 90% of UK pension funds. 

To explain, per Reuters, there are schemes “that pay pensioners a fixed annual amount, often a portion of the final salary they earned as employees.” The schemes invest about 50% of assets in bonds, in order to have cash on hand and pay pension liabilities.

To reduce the effects of market volatility, positions are hedged through derivatives “managed by so-called liability-driven investment (LDI) funds,” Reuters well explained. “For example, pension schemes might pay the floating rate leg of an interest rate swap and receive fixed rates.”

Due to the leverage, market moves have an amplified effect on the funds. Therefore, if bonds fall too much, too fast, more cash must be sent to these LDIs. 

“[P]ositions become loss-making – they are paying out more money in the transaction than they are receiving.”

In some cases, schemes were to have “cash reserves to cope with a 200 bps rise in swap rates over a year. However, 30-year gilt interest rate swaps … rose 360 bps this year and 120 bps in the last few days before the BoE stepped in” and bought bonds, boosting inflation expectations, the thing that monetary tightening was, in part, intended to reduce.

Graphic: Retrieved from Fabian Wintersberger.

Accordingly, pensions sold gilts to “ready cash to meet those collateral calls, or they were kicked out of their derivatives positions because they could not pay up in time and had to sell gilts to avoid having a naked exposure to further sharp moves.”

The BoE’s actions calm the market allowing for the more orderly processing of transactions. 

Still, the UK is seen “out-hiking the Fed in the wake of Kwarteng tax cuts,” while “schemes are running out of cash.”

Graphic: Retrieved via Bloomberg.

The risks don’t just stop there, though, we added. 

For one, there’s damage to be had if FX hedges go awry, which we said would likely prompt a call for collateral, too; investors will “buy overseas assets and hedge away the currency risk,” Jim Leaviss explained. “[I]f you had bought a dollar bond and hedged it, the dollars that you have effectively sold ‘short’ against sterling as the hedge have rallied, and the counterparty to the FX hedge will call for a collateral payment.”

The actions of the recent days likely put investors in a position of less liquid assets to meet the (potential) collateral calls, and this is part of the aforementioned technical factors that are likely to have a bearing on the direction of bonds and yields “over coming months.”

Additionally, some participants speculate the US may run into similar issues as the UK. A single (unconfirmed) participant explained pensions may be “selling equities and other asset classes to meet their swap obligations.”

Graphic: Retrieved via Bloomberg.

Separately, another topic of discussion was the People’s Bank of China (PBOC) telling state-run banks to prepare for the shedding of dollar holdings to buy and assist in propping up the yuan.

Graphic: Retrieved from Reuters’ John Kemp.

This is all the while the Federal Reserve (Fed), to address problems of its own (e.g., real estate affordability) is implementing aggressive monetary tightening (prompting a rise in the dollar and triggering a “reverse currency war”). 

Graphic: Retrieved from Bloomberg. “So if you want to spend $2,500 a month, you can now buy a house that costs $476,425. For that same monthly payment, you could have purchased a $758,572 house in early 2021.”

As an aside, US mortgage rates hit a 15-year high and home prices are falling.

Graphic: Retrieved via Bloomberg. To note, housing wealth regressions indicate “that every dollar of changes in housing wealth leads to a 38-cent change in consumption.”

China is looking to do less of the same and “spark growth in an economy that’s been dragged down by COVID-19 lockdowns, a real estate crash, and supply chain snags,” which have hurt some US firms including Apple Inc (NASDAQ: AAPL).

Graphic: Retrieved from Bloomberg. Apple’s manufacturing exposure to China.

That’s the mismatch (i.e., China easy, US uneasy) that’s going on and, per some, the Fed may be acting on a set of lagging indicators; monetary policy action may do more harm than good.

Graphic: Retrieved from Bloomberg. Via Liz Ann Sonders. “Unbelievable decline in shipping rates … cost to send a 40-ft container from Shanghai to Los Angeles has fallen by 74% from peak and is back to August 2020 levels.”

But, for now, a robust labor market and continued spending by American consumers have some feeling there’s far more room to go before US monetary policy does more harm than good.

Graphic: Retrieved from Bloomberg. An end of an era is approaching, however, as companies that grew largely over the past years, including Meta Platforms Inc (NASDAQ: META), seek to reduce headcount and reorganize.

Positioning

All that was said yesterday, and earlier this week, remains valid. In short, the decline prompted traders to demand downside protection, and this wound measures of implied volatility (IVOL).

Graphic: Retrieved from Interactive Brokers Group Inc (NASDAQ: IBKR). Read, here, to understand backwardation and contango in futures markets.

For IVOL measures to remain wound, something bad needs to happen, in short. Otherwise, as seen yesterday, slightly, the S&P 500 drifted lower while certain IVOL measures, such as the Cboe Volatility Index (INDEX: VIX) printed a lower high than that observed on Wednesday.

Per SpotGamma, “If the decline in IVOL is very pronounced, relative to the decline in the S&P, that too can aid in a push-and-pull that actually serves to … resist far-reaching weakness.”

Graphic: Retrieved from SpotGamma. SPX prices X-axis. Option delta Y-axis. When the factors of implied volatility (Vanna) and time change (Charm), hedging ratios change. The graphic is for illustrational purposes, only.

From hereon, the decay and/or removal of the protection that’s been demanded in the past days and weeks may place a like on IVOL and boost markets over a very short term. In the long term, however, weakness is here to stay, says Kai Volatility’s Cem Karsan. 

That’s amid impacts of quantitative tightening (QT) which is manifesting itself as “$4.5 billion less in demand for assets per day,” as well as the blackout period for buybacks (which were consistently “supporting the market”) and options repositioning bolstering the weakness.

Graphic: Via Physik Invest. Data compiled by @jkonopas623. Fed Balance Sheet data, here. Treasury General Account Data, here. Reverse Repo data, here. NL = BS – TGA – RRP.

A lot more on this positioning, and the rollover of some large fund exposures, which have grasped the attention of many online, in some coming letters.

Technical

As of 9:50 AM ET, Friday’s regular session (9:30 AM – 4:00 PM ET), in the S&P 500, is likely to open in the middle part of a balanced overnight inventory, inside of prior-range and -value, suggesting a limited potential for immediate directional opportunity.

In the best case, the S&P 500 trades higher.

Any activity above the $3,638.25 LVNode puts into play the $3,688.75 HVNode. Initiative trade beyond the HVNode could reach as high as the $3,722.50 LVNode and $3,771.25 HVNode, or higher.

In the worst case, the S&P 500 trades lower.

Any activity below the $3,638.25 LVNode puts into play the $3,610.75 HVNode. Initiative trade beyond the latter could reach as low as the $3,554.75 and $3,506.25 HVNode, or lower.

Click here to load today’s key levels into the web-based TradingView charting platform. Note that all levels are derived using the 65-minute timeframe. New links are produced, daily.
Graphic: 65-minute profile chart of the Micro E-mini S&P 500 Futures.

Definitions

Volume Areas: A structurally sound market will build on areas of high volume (HVNodes). Should the market trend for long periods of time, it will lack sound structure, identified as low volume areas (LVNodes). LVNodes denote directional conviction and ought to offer support on any test. 

If participants were to auction and find acceptance into areas of prior low volume (LVNodes), then future discovery ought to be volatile and quick as participants look to HVNodes for favorable entry or exit.

About

After years of self-education, strategy development, mentorship, and trial-and-error, Renato Leonard Capelj began trading full-time and founded Physik Invest to detail his methods, research, and performance in the markets.

Capelj also develops insights around impactful options market dynamics at SpotGamma and is a Benzinga reporter.

Some of his works include conversations with ARK Invest’s Catherine Wood, investors Kevin O’Leary and John Chambers, FTX’s Sam Bankman-Fried, ex-Bridgewater Associate Andy Constan, Kai Volatility’s Cem Karsan, The Ambrus Group’s Kris Sidial, among many others.

Disclaimer

In no way should the materials herein be construed as advice. Derivatives carry a substantial risk of loss. All content is for informational purposes only.

Categories
Commentary

Daily Brief For September 28, 2022

The daily brief is a free glimpse into the prevailing fundamental and technical drivers of U.S. equity market products. Join the 970+ that read this report daily, below!

Graphic updated 8:20 AM ET. Sentiment Neutral if expected /ES open is inside of the prior day’s range. /ES levels are derived from the profile graphic at the bottom of the following section. Levels may have changed since initially quoted; click here for the latest levels. SqueezeMetrics Dark Pool Index (DIX) and Gamma (GEX) calculations are based on where the prior day’s reading falls with respect to the MAX and MIN of all occurrences available. A higher DIX is bullish. At the same time, the lower the GEX, the more (expected) volatility. Learn the implications of volatility, direction, and moneyness. Breadth reflects a reading of the prior day’s NYSE Advance/Decline indicator. VIX reflects a current reading of the CBOE Volatility Index (INDEX: VIX) from 0-100.

Administrative

Apologies, team, if the quality was lacking these past few days. Extremely busy on my end and I look forward to some detailed letters in the near future! – Renato

Fundamental

“Great powers are waging hot wars involving the flow of technologies, goods, and commodities.”

That’s according to Credit Suisse Group AG’s (NYSE: CS) Zoltan Pozsar who believes that the pillars forming the context for a low-inflation world are changing, and this is setting the stage for longer-lasting structural inflation.

In short, inflationary impulses are incoming from non-linear geopolitical and economic conflicts. 

Just yesterday, Europe was investigating attacks on pipelines from Russia; there were “major leaks into the Baltic Sea from two Russian gas pipelines at the cent[er] of an energy standoff.”

“The word sabotage springs to mind,” Javier Blas of Bloomberg, said. “In a single day, the conduits, which link Russia with Germany under the Baltic Sea, have suffered not one, not two, but three separate major leaks.”

Per reports by Refinitiv, seismologists nearby registered “powerful blasts” that “do not resemble signals from earthquakes.” Instead, the explosions likely correspond with hundreds of “kilos (kg) of dynamite.”

Graphic: Retrieved from Bloomberg. 

Given that Nordstream 1 and 2 are not operational, now, the “leaks are more likely a message: [if truly the culprit], Russia is opening a new front on its energy war against Europe.” 

Accordingly, gas prices were higher but “below this year’s peaks,” Refinitiv reported. Generally, across some benchmarks, prices read “more than 200%, higher than in early September 2021.”

Separately, the Bank of England (BoE) is delaying quantitative-tightening (QT) bond sales and opting to purchase longer-dated government bonds in an attempt to restore stability, which we discussed was at risk on Monday and Tuesday.

Graphic: Retrieved from Bloomberg. Credit Default Swaps (CDSs) are a tool for investors to offload credit risk to other market participants.

As a result, after a near-vertical drop (visible below) in Gilts and British corporate bonds (which impacted mortgage lending, for one), UK yields saw some of their biggest drops on record.

Graphic: Retrieved from Bloomberg. Updated September 26, 2022.

The actions over the past few days complicate the Monetary Policy Committee’s (MPC) objective to reach a return to 2% inflation in the medium term.

Graphic: Retrieved, initially, from Bank of America Corporation (NYSE: BAC). Via The Transcript. Interest rates “may be higher for longer” than expected.

At home, here, in the US, yields on the 10-year topped 4.00%. There is a heightened chance of a Federal Reserve (Fed) bump in rates that brings the target rate to 375-400 basis points, while the UK, in stemming its inflationary pressures, is expected to bump by double that amount.

The action to stem inflation is feeding through to demand. Apple Inc (NASDAQ: AAPL) said it would ease plans to boost iPhone production “after an anticipated surge in demand failed to materialize,” a Bloomberg report said

“The supply constraints pulling down on the market since last year have eased and the industry has shifted to a demand-constrained market,” said Nabila Popal, research director at IDC. 

“High inventory in channels and low demand with no signs of immediate recovery has OEMs panicking and cutting their orders drastically for 2022,” a fear we said ARK Invest’s Catherine Wood shared, not too long ago.

Positioning

The beginning of the week was characterized by a sideways-to-lower S&P 500 (INDEX: SPX) and implied volatility (IVOL) metrics, such as the Cboe Volatility Index (INDEX: VIX), rising.

Per IVOL the term structure, demand for options protections seems to be concentrated in options that are shorter-dated and far more sensitive to changes in direction and volatility.

That means for large shifts in price and/or volatility, hedging ratios (e.g., Delta) shift markedly, too. This prompts “hedging feedback mechanisms in both market directions,” per SpotGamma.

Graphic: Retrieved from VIX Central. Taken from The Market Ear. Updated 9/27/2022.

Moreover, the risks are skewed to the upside, SpotGamma added. 

“For pumped-up options far from the money to retain their value, there essentially needs to be an adverse move (in price and volatility). Should nothing bad happen, the probability of these options paying out will fade, as will their exposure to direction (or Delta). [In] re-hedg[ing] decreased exposure to Delta, liquidity providers [] may provide the market with a boost.”

Graphic: Retrieved from SpotGamma. SPX prices X-axis. Option delta Y-axis. When the factors of implied volatility (Vanna) and time change (Charm), hedging ratios change. The graphic is for illustrational purposes, only.

At the same time, there appears to be some “dealer disintermediation” amid “less incentive to make deep, tight markets” due to “capital constraints,” potentially, explained SqueezeMetrics, the creator of the DIX (Dark Pool Index).

This comes after months of high average readings in DIX (likely as market-makers assembled “basket[s] of S&P 500 stocks to create ETF shares, or to hedge away the exposure of a futures contract[s]”). Typically, high DIX readings are associated with stronger 1-month market returns, particularly when put flows are strong (i.e., lower Gamma exposure readings, like now).

Graphic: Retrieved from SqueezeMetrics.

Overall, the trend change is “suggestive of some second thoughts from the [buy-the-dip] crowd, and perhaps (likely!) some deleveraging from elsewhere,” SqueezeMetrics ended.

Technical

As of 8:20 AM ET, Wednesday’s regular session (9:30 AM – 4:00 PM ET), in the S&P 500, is likely to open in the upper part of a negatively skewed overnight inventory, inside of prior-range and -value, suggesting a limited potential for immediate directional opportunity.

In the best case, the S&P 500 trades higher.

Any activity above the $3,638.25 LVNode puts into play the $3,688.75 HVNode. Initiative trade beyond the HVNode could reach as high as the $3,722.50 LVNode and $3,771.25 HVnode, or higher.

In the worst case, the S&P 500 trades lower.

Any activity below the $3,638.25 LVNode puts into play the $3,610.75 HVNode. Initiative trade beyond the HVNode could reach as low as the $3,554.75 and $3,506.25 HVNode, or lower.

Click here to load today’s key levels into the web-based TradingView charting platform. Note that all levels are derived using the 65-minute timeframe. New links are produced, daily.
Graphic: 65-minute profile chart of the Micro E-mini S&P 500 Futures.

Definitions

Volume Areas: A structurally sound market will build on areas of high volume (HVNodes). Should the market trend for long periods of time, it will lack sound structure, identified as low volume areas (LVNodes). LVNodes denote directional conviction and ought to offer support on any test. 

If participants were to auction and find acceptance into areas of prior low volume (LVNodes), then future discovery ought to be volatile and quick as participants look to HVNodes for favorable entry or exit.

POCs: POCs are valuable as they denote areas where two-sided trade was most prevalent in a prior day session. Participants will respond to future tests of value as they offer favorable entry and exit.

About

After years of self-education, strategy development, mentorship, and trial-and-error, Renato Leonard Capelj began trading full-time and founded Physik Invest to detail his methods, research, and performance in the markets.

Capelj also develops insights around impactful options market dynamics at SpotGamma and is a Benzinga reporter.

Some of his works include conversations with ARK Invest’s Catherine Wood, investors Kevin O’Leary and John Chambers, FTX’s Sam Bankman-Fried, ex-Bridgewater Associate Andy Constan, Kai Volatility’s Cem Karsan, The Ambrus Group’s Kris Sidial, among many others.

Disclaimer

In no way should the materials herein be construed as advice. Derivatives carry a substantial risk of loss. All content is for informational purposes only.

Categories
Commentary

Daily Brief For July 19, 2022

The daily brief is a free glimpse into the prevailing fundamental and technical drivers of U.S. equity market products. Join the 300+ that read this report daily, below!

Graphic updated 6:50 AM ET. Sentiment Neutral if expected /ES open is inside of the prior day’s range. /ES levels are derived from the profile graphic at the bottom of the following section. Levels may have changed since initially quoted; click here for the latest levels. SqueezeMetrics Dark Pool Index (DIX) and Gamma (GEX) calculations are based on where the prior day’s reading falls with respect to the MAX and MIN of all occurrences available. A higher DIX is bullish. At the same time, the lower the GEX, the more (expected) volatility. Learn the implications of volatility, direction, and moneyness. Breadth reflects a reading of the prior day’s NYSE Advance/Decline indicator. VIX reflects a current reading of the CBOE Volatility Index (INDEX: VIX) from 0-100.

Fundamental

After the release of data on consumer prices, earlier this month, the belief was that a de-rate, on inflation, was, potentially, nearing an end, although it was likely to remain at a “higher level than we’ve seen historically,” per the likes of Chevron Corporation’s (NYSE: CVX) CEO Mike Wirth.

Read: National Association of Homebuilders (NAHB) Housing Market Index (HMI) sees record decline. Rental markets cooling. Foreign buying jumps. Food to be the ultimate weapon in the 21st century.

Graphic: Retrieved from Randy Woodward. “Bloomberg commodities index vs. headline CPI.”

Now comes an even deeper compression on earnings?

Graphic: Retrieved from Callum Thomas. “Clear downward momentum in earnings revisions, only 33% of analyst earnings estimates have been revised upward (i.e. the rest downward) — matches the worsening macro.”

Well, maybe. Based on executives’ perspectives, we’re probably “talking ourselves into a recession,” precisely what the likes of Robert Shiller have expressed worry on.

Accordingly, participants are now pricing in shaky earnings, selling the stock of Goldman Sachs Group Inc (NYSE: GS), Apple Inc (NASDAQ: AAPL), and beyond, on those firms’ preparations for an increased potential for an economic downturn.

Up until this week, the Nasdaq 100 (INDEX: NDX) was doing better, consolidating for a potential break above a key response area, like the S&P 500 (INDEX: SPX), highlighted in a section further below.

It failed after the release of earnings from some index heavyweights.

Graphic: Retrieved from Bloomberg. “The Nasdaq 100, down 27% for the year so far, had briefly managed to get above its 50-day moving average on Monday, suggesting that the relentless downward trend was over — but the index failed to stay there, thanks in large part to Apple.”

Pessimism is incredibly strong among investors, however, a sort-of contrarian signal.

In spite of some Bank of America Corporation (NYSE: BAC) indicators pointing to poor fundamentals, sentiment is suggestive of a looming “stocks/credit rally in coming weeks.”

Graphic: Retrieved from Bloomberg. “Investors slashed their exposure to risk assets to levels not seen even during the global financial crisis in a sign of full capitulation amid a “dire” economic outlook, according to Bank of America Corp.’s monthly fund manager survey.”

Positioning

Though we’re far more than halfway through a dot-com type collapse that’s happened “underneath the surface of the indices,” per Simplify Asset Management’s Mike Green, still-strong passive flows continue to support the largest stocks within the indexes.

Graphic: Retrieved from The Market Ear. Via Barclays PLC (NYSE: BCS).

At the same time, options volumes show traders concentrating less on bullish strategies in the single stocks, while the index flows remain steady.

Graphic: Via Deutsche Bank AG (NYSE: DB).

Looking at skew on something like the tech- and growth-heavy Nasdaq 100 (INDEX: NDX), our comments in prior letters (regarding volatility supply from the re-hedging of defensive structures on the put side and volatility demand on the call side from the positioning for a reversal) appear still valid.

Read: Daily Brief for July 15, 2022.

Therefore, spread opportunities still exist and remain attractive.

Graphic: Via Charles Schwab Corporation-owned (NYSE: SCHW) TD Ameritrade’s Thinkorswim. Skew resembles more of a smile, rather than a smirk.

Read: Trading Volatility, Correlation, Term Structure and Skew by Colin Bennett.

Technical

As of 6:45 AM ET, Tuesday’s regular session (9:30 AM – 4:00 PM ET), in the S&P 500, is likely to open in the upper part of a positively skewed overnight inventory, inside of prior-range and -value, suggesting a limited potential for immediate directional opportunity.

In the best case, the S&P 500 trades higher.

Any activity above the $3,867.25 LVNode puts into play the $3,895.00 VPOC. Initiative trade beyond the VPOC could reach as high as the $3,909.25 MCPOC and $3,943.25 HVNode, or higher.

In the worst case, the S&P 500 trades lower.

Any activity below the $3,867.25 LVNode puts into play the $3,829.75 MCPOC. Initiative trade beyond the MCPOC could reach as low as the $3,800.75 LVNode and $3,770.75 HVNode, or lower.

Click here to load today’s key levels into the web-based TradingView charting platform. Note that all levels are derived using the 65-minute timeframe. New links are produced, daily.
Graphic: 65-minute profile chart of the Micro E-mini S&P 500 Futures.

Considerations: Responsiveness near key-technical areas (that are discernable visually on a chart), suggests technically-driven traders with short time horizons are very active. 

Such traders often lack the wherewithal to defend retests and, additionally, the type of trade may be indicative of the other time frame participants waiting for more information to initiate trades.

Definitions

Volume Areas: A structurally sound market will build on areas of high volume (HVNodes). Should the market trend for long periods of time, it will lack sound structure, identified as low volume areas (LVNodes). LVNodes denote directional conviction and ought to offer support on any test. 

If participants were to auction and find acceptance into areas of prior low volume (LVNodes), then future discovery ought to be volatile and quick as participants look to HVNodes for favorable entry or exit.

POCs: POCs are valuable as they denote areas where two-sided trade was most prevalent in a prior day session. Participants will respond to future tests of value as they offer favorable entry and exit.

MCPOCs: POCs are valuable as they denote areas where two-sided trade was most prevalent over numerous day sessions. Participants will respond to future tests of value as they offer favorable entry and exit.

Volume-Weighted Average Prices (VWAPs): A metric highly regarded by chief investment officers, among other participants, for quality of trade. Additionally, liquidity algorithms are benchmarked and programmed to buy and sell around VWAPs.

About

After years of self-education, strategy development, mentorship, and trial-and-error, Renato Leonard Capelj began trading full-time and founded Physik Invest to detail his methods, research, and performance in the markets.

Capelj also develops insights around impactful options market dynamics at SpotGamma and is a Benzinga reporter.

Some of his works include conversations with ARK Invest’s Catherine Wood, investors Kevin O’Leary and John Chambers, FTX’s Sam Bankman-Fried, former Bridgewater Associate Andy Constan, Kai Volatility’s Cem Karsan, The Ambrus Group’s Kris Sidial, among many others.

Disclaimer

In no way should the materials herein be construed as advice. Derivatives carry a substantial risk of loss. All content is for informational purposes only.

Categories
Commentary

Daily Brief For May 26, 2022

The daily brief is a free glimpse into the prevailing fundamental and technical drivers of U.S. equity market products. Join the 300+ that read this report daily, below!

Separately, the Daily Brief will be on pause from May 30, 2022, to June 7, 2022, due to the author’s overseas travel commitments. Apologies for the inconvenience and happy trading!

What Happened

Overnight, equity index futures were divergent, albeit nearly flat, after Wednesday’s release of minutes to the last Federal Open Market Committee (FOMC) meeting were less hawkish than expected, bolstering a small expansion of the range to the upside.

Though higher prices were held at the index level, some products like Apple Inc (NASDAQ: AAPL) were lower after issuing updates on its production. Yesterday, it was social media and advertising businesses like Snap Inc (NYSE: SNAP) that fell on forecasts for meager growth.

In other news, Sequoia Capital warned that the current environment for founders is a “crucible moment,” and there is no indication good times will return soon. 

Pursuant to that belief, we have firms like Klarna and Bolt, who just began laying off employees, preparing for slower growth and focusing on “short-term profitability.”

A chief concern, among participants at the World Economic Forum, beyond a global recession and inflation, is the potential for ongoing conflicts to cause “mass starvation” and “political instability around the world.”

Today we get updates on jobless claims, real gross domestic product, and income, as well as final sales to domestic purchasers (8:30 AM ET). Later, pending home sales (10:00 AM ET).

Graphic updated 6:30 AM ET. Sentiment Neutral if expected /ES open is inside of the prior day’s range. /ES levels are derived from the profile graphic at the bottom of the following section. Levels may have changed since initially quoted; click here for the latest levels. SqueezeMetrics Dark Pool Index (DIX) and Gamma (GEX) calculations are based on where the prior day’s reading falls with respect to the MAX and MIN of all occurrences available. A higher DIX is bullish. At the same time, the lower the GEX, the more (expected) volatility. Learn the implications of volatility, direction, and moneyness. SHIFT data used for S&P 500 (INDEX: SPX) options activity. Note that options flow is sorted by the call premium spent; if more positive, then more was spent on call options. Breadth reflects a reading of the prior day’s NYSE Advance/Decline indicator. VIX reflects a current reading of the CBOE Volatility Index (INDEX: VIX) from 0-100.

What To Expect

Fundamental: As was suggested could happen in Wednesday’s pre-market letter, the Federal Reserve (Fed) indicated potential policy flexibility, later this year.

Per the most recent FOMC minutes, officials are determined to achieve price stability with “50 basis-point increases in the target range … at the next couple of meetings.”

“Many participants judged that expediting the removal of policy accommodation would leave the committee well-positioned later this year to assess the effects of policy firming and the extent to which economic developments warranted policy adjustments.”

Graphic: Via Bloomberg. “​​The swaps market and consensus forecasts to Bloomberg Economics both imply considerably faster rate hikes, while Bloomberg’s own forecast is more hawkish still.”

Accordingly, finalized were balance sheet reduction plans. Starting June 1, 2022, Treasury holdings will decline by $30 billion per month, rising to $60 billion per month in September. 

Mortgage-backed securities (MBS) holdings will shrink by $17.5 billion per month, ultimately rising to $35 billion, in accordance with our post-FOMC letter published May 5, 2022.

As stated, previously, with QT, central banks remove assets from their balance sheet either through outright sales or the non-reinvestment of the principal sum of maturing securities.

“QT is a direct flow of capital to capital markets” and the prospects of withdrawing this liquidity, when revealed in December’s FOMC meeting minutes, was what fed into a retreat from risk.

Graphic: Via Reuters.

Overall, the minutes left the tone unchanged and reaffirmed the Fed’s commitment to stable prices.

Bloomberg’s John Authers concludes, well: “If inflation should look as though it might fail to get down even to the revised forecast of 4.3% by the end of the year, there’s still a possibility that the Fed will have to be more hawkish than it currently intends, not less.”

“But at least the path until the end of summer looks clear.”

Graphic: Via Bloomberg.

Positioning: We’re carrying forward remarks from notes earlier this week as there has been a limited change in tone.

Based on current positioning, most products we monitor continue to trade in an environment that solicits more volatile hedging of put open interest and realized volatility (RVOL). This is because, naively, we look at participants as mainly owning protection to the downside. 

So, they have asymmetric (positive gamma) exposure to the downside (negative delta). On the other side, liquidity providers have a negative gamma and positive delta that they must sell into weakness and buy into strength underlying to hedge.

It is at a certain juncture, far above current prices (i.e., Zero Gamma), that the volatile effects of hedging this put open interest begin to cool. It is above these levels that participants’ exposure to calls solicits increased hedging activities which promote stability and less volatility.

Graphic: Via Tier1Alpha. “Spot SPX is currently over -8.55% below the gamma flipping point, a distance similar to the drawdown at the end of 2018. We’ll have to see quite a reverse in trend before a substantial regime shift can take place.”

It’s because, naively, we look at participants as financing their bets on the downside with call exposure. On the other side, liquidity providers, then, have a positive gamma and delta trade they hedge by buying into weakness and selling into strength.

We’re definitely not there yet but, based on remarks in past letters (e.g., stretched market and investors bidding “skew on the call side” amid their “fear of missing on the upside”), this letter’s author continues leaning toward strategies that have little to lose in case of further implied volatility (IVOL) compression or weakness into the June FOMC and OPEX.

Graphic: Via SpotGamma. “[C]all positions were added [above] $4,000.00, with $4,100.00 [and] $4,200.00 adding 10k + 15k [in open interest] respectively. That’s not huge, but it was enough to kink the gamma curve in an interesting way.”

Technical: As of 6:30 AM ET, Thursday’s regular session (9:30 AM – 4:00 PM ET), in the S&P 500, will likely open in the upper part of a positively skewed overnight inventory, nearly outside of prior-range and -value, suggesting a potential for immediate directional opportunity.

In the best case, the S&P 500 trades higher; activity above the $3,951.00 VPOC puts in play the $3,997.75 RTH High. Initiative trade beyond the RTH High could reach as high as the $4,061.00 VPOC and $4,095.00 ONH, or higher.

In the worst case, the S&P 500 trades lower; activity below the $3,951.00 VPOC puts in play the $3,909.25 MCPOC. Initiative trade beyond the MCPOC could reach as low as the $3,863.25 LVNode and $3,831.00 VPOC, or lower.

Click here to load today’s key levels into the web-based TradingView charting platform. Note that all levels are derived using the 65-minute timeframe. New links are produced, daily.
Graphic: 65-minute profile chart of the Micro E-mini S&P 500 Futures.

Definitions

Overnight Highs And Lows (ONH and ONL): Typically, there is a low historical probability associated with overnight rally-highs (lows) ending the upside (downside) discovery process.

Volume Areas: A structurally sound market will build on areas of high volume (HVNodes). Should the market trend for long periods of time, it will lack sound structure, identified as low volume areas (LVNodes). LVNodes denote directional conviction and ought to offer support on any test. 

If participants were to auction and find acceptance into areas of prior low volume (LVNodes), then future discovery ought to be volatile and quick as participants look to HVNodes for favorable entry or exit.

POCs: POCs are valuable as they denote areas where two-sided trade was most prevalent in a prior day session. Participants will respond to future value tests as they offer favorable entry and exit.

About

After years of self-education, strategy development, mentorship, and trial-and-error, Renato Leonard Capelj began trading full-time and founded Physik Invest to detail his methods, research, and performance in the markets.

Capelj also develops insights around impactful options market dynamics at SpotGamma and is a Benzinga reporter.

Some of his works include conversations with ARK Invest’s Catherine Wood, investors Kevin O’Leary and John Chambers, FTX’s Sam Bankman-Fried, Kai Volatility’s Cem Karsan, The Ambrus Group’s Kris Sidial, among many others.

Disclaimer

In no way should the materials herein be construed as advice. Derivatives carry a substantial risk of loss. All content is for informational purposes only.

Categories
Commentary

Daily Brief For May 17, 2022

The daily brief is a free glimpse into the prevailing fundamental and technical drivers of U.S. equity market products. Join the 300+ that read this report daily, below!

What Happened

Overnight, equity index futures were higher. The S&P 500, in particular, probed the high end of the low-volume (gap) area it broke into on May 9, 2022.

The key is to monitor whether the S&P 500 is able to sustain the prices it discovered overnight. If so, then the odds that participants are, indeed, hammering out a bottom are heightened.

Ahead is data on retail sales (8:30 AM ET), industrial production and capacity utilization (9:15 AM ET), the NAHB home builders’ index, and business inventories (10:00 AM ET).

Fed-speak is scattered. At 9:15 AM ET, the Philadelphia Fed’s Patrick Harker speaks on health care. At 2:00 PM ET, Fed Chair Jerome Powell is interviewed by the WSJ. At 2:30 PM ET, the Cleveland Fed’s Loretta Mester talks at an inflation conference. And, lastly, at 6:45 PM ET, the Chicago Fed’s Charles Evans speaks.

Graphic updated 6:50 AM ET. Sentiment Risk-On if expected /ES open is above the prior day’s range. /ES levels are derived from the profile graphic at the bottom of the following section. Levels may have changed since initially quoted; click here for the latest levels. SqueezeMetrics Dark Pool Index (DIX) and Gamma (GEX) calculations are based on where the prior day’s reading falls with respect to the MAX and MIN of all occurrences available. A higher DIX is bullish. At the same time, the lower the GEX, the more (expected) volatility. Learn the implications of volatility, direction, and moneyness. SHIFT data used for S&P 500 (INDEX: SPX) options activity. Note that options flow is sorted by the call premium spent; if more positive, then more was spent on call options. Breadth reflects a reading of the prior day’s NYSE Advance/Decline indicator. VIX reflects a current reading of the CBOE Volatility Index (INDEX: VIX) from 0-100.

What To Expect

Fundamental: Out of all the news, it was noteworthy when Elon Musk broke with the prevailing opinion to declare the U.S. was facing a tough recession that would last up to 18 months. 

This is on the heels of a large “misallocation of capital,” he says, caused by the government printing “a zillion amount of more money than it had.”

Musk cautioned companies to watch their costs and cash flows, the latter of which we talked on the importance of in cycles where monetary conditions are tighter and there is less money to be had for corporates who are taking “the long view” and “competing on eyeballs and growth,” per Kai Volatility’s Cem Karsan who this letter’s writer spoke with last summer.

As Karsan puts it, over the last four decades, monetary policy was a go-to for supporting the economy. Money was sent to capital and that promoted deflation, ultimately creating “a disinterest and unimportance to cash flows.”

“Monetary policy has a velocity of almost zero, it goes directly to ‘Planet Palo Alto,’ and Palo Alto creates new technologies,” Moontower’s Kris Abdelmesih puts well in a summary of Karsan’s macro thesis.

“They’re sophisticated, futuristic people. They provide new self-driving cars and things getting delivered to your doorstep. They create supply … [and] does not increase demand. And so it is deflationary.”

Over the last years, in light of talk to address increasing inequality, money was sent to labor, so to speak, and that promoted inflation.

Moreover, today’s contractionary monetary policy is a blunt tool and is not equipped to “address the main problem which is a lack of supply to absorb the demand.”

Please read Moontower’s full write-up, here.

That’s sort of in accordance with comments we quoted Credit Suisse Group AG’s (NYSE: CS) Zoltan Pozsar making, yesterday. Essentially, “the Fed is pursuing demand destruction through negative wealth effects,” as the “central banks can only deal with nominal” chokepoints.

By that token, we must “[c]onsider at least the possibility that the extreme volatility and lack of liquidity [we] see in markets is by design, and the Fed will not be deterred by it, but rather that it will be emboldened by it in its singular pursuit of price stability.”

With even President Biden endorsing the closure of the “wealth window,” Karsan believes corporations will have to worry about making money again.

“These cycles are a lot shorter than the monetary supply-side cycles but they tend to be very bad for multiples and great for economic growth.”

With that in mind, there is no escape. Even the traditional bond-stock relationship – the 60/40 framework – is at risk of being upended.

Graphic: Via Andy Constan of Damped Spring Advisors. “Zero rate hikes in 2023. Clearly, a recession is being priced in.” Per Bloomberg, a Bank of America Corporation (NYSE: BAC) survey puts the Fed put (a pivot) at $3,529.00 in the S&P 500.

Positioning: Measures of implied volatility came in. That’s significant since participants have a lot of exposure to put options.

Further, we see liquidity providers being short those puts. As volatility continues to come in, the exposure of those options to direction (delta) compresses. 

As a result, liquidity providers will taper some of their negative delta short stock and futures hedges to that positive delta put position.

Graphic: Via SpotGamma. “SPX prices X-axis. Option delta Y-axis. When the factors of implied volatility and time change, hedging ratios change. For instance, if SPX is at $4,700.00 and IV jumps 15% (all else equal), the dealer may sell an additional 0.2 deltas to hedge their exposure to the addition of a positive 0.2 delta. The graphic is for illustrational purposes, only.”

Those delta hedging flows with respect to changes in volatility (vanna) are on top of what has historically been a front-running of the bullish flow associated with the delta decay of options, particularly with respect to time (charm), into options expirations (OPEX). 

Graphic: @pat_hennessy breaks down returns for the S&P 500, categorized by the week relative to OPEX. 

Notwithstanding, though proxies for buying and this hedging of existing options positioning, at the surface, appear to point to positively (skewed) forward returns, we have concern over the level at which from implied volatility is dropping from, and the general divergence between the volatility realized and implied, talked about yesterday.

Basically, as SpotGamma says, there’s not as much “stored energy to catalyze a rally.” 

SqueezeMetrics adds

The Cboe Volatility Index (INDEX: VIX) compressing, while dealer gamma exposure is “more negative than it’s been in years is not how you get sustained rallies–it’s how you get energy for bigger downside moves.”

Therefore, we continue to focus on participating in upside with as little debit risk as possible, via the use of complex strategies, further validated by quoted research.

Graphic: Via Goldman Sachs Group Inc. The VIX’s “high starting point leaves vol high overall, and we like strategies with a short volatility bias, including put selling and 1×2 call spread overlays.”

Technical: As of 6:30 AM ET, Tuesday’s regular session (9:30 AM – 4:00 PM ET), in the S&P 500, will likely open in the upper part of a positively skewed overnight inventory, outside of prior-range and -value, suggesting a potential for immediate directional opportunity.

In the best case, the S&P 500 trades higher; activity above the $4,083.75 overnight high (ONH) puts in play the $4,119.00 untested point of control (VPOC). Initiative trade beyond the VPOC could reach as high as the $4,148.25 and $4,184.25 high volume nodes (HVNodes), or higher.

In the worst case, the S&P 500 trades lower; activity below the $4,083.75 ONH puts in play the $4,055.75 low volume area (LVNode). Initiative trade beyond the LVNode could reach as low as the $4,013.25 micro composite point of control (MCPOC) and $3,978.50 LVNode, or lower.

Click here to load today’s key levels into the web-based TradingView charting platform. Note that all levels are derived using the 65-minute timeframe. New links are produced, daily.
Graphic: 65-minute profile chart of the Micro E-mini S&P 500 Futures.

Considerations: A push-and-pull between the largest of S&P 500 weights.

For instance, Apple Inc (NASDAQ: AAPL) is clinging to its prior trend.

Graphic: Via Bloomberg.

All the while products like Amazon Inc (NASDAQ: AMZN), are trading into key supports.

Graphic: Via Bloomberg.

We continue to monitor our market internals and (large) changes in positioning (e.g., open interest builds at higher prices further out in time) that will provide further validation to this most recent S&P 500 reversal.

Graphic: Market Internals as pioneered by (a mentor of mine) Peter Reznicek. Current reads of breadth (top charts), in particular, are uninspiring. An advance you do not short has an advance-decline line that’s pegged at +2,000, coupled with a Tick (bottom left) that has trouble closing below 0 for nearly the entirety of a session. Caution.

What People Are Saying

Definitions

Overnight Rally Highs (Lows): Typically, there is a low historical probability associated with overnight rally-highs (lows) ending the upside (downside) discovery process.

Volume Areas: A structurally sound market will build on areas of high volume (HVNodes). Should the market trend for long periods of time, it will lack sound structure, identified as low volume areas (LVNodes). LVNodes denote directional conviction and ought to offer support on any test. 

If participants were to auction and find acceptance into areas of prior low volume (LVNodes), then future discovery ought to be volatile and quick as participants look to HVNodes for favorable entry or exit.

POCs: POCs are valuable as they denote areas where two-sided trade was most prevalent in a prior day session. Participants will respond to future tests of value as they offer favorable entry and exit.

MCPOCs: POCs are valuable as they denote areas where two-sided trade was most prevalent over numerous day sessions. Participants will respond to future tests of value as they offer favorable entry and exit.

About

After years of self-education, strategy development, mentorship, and trial-and-error, Renato Leonard Capelj began trading full-time and founded Physik Invest to detail his methods, research, and performance in the markets.

Capelj also develops insights around impactful options market dynamics at SpotGamma and is a Benzinga reporter.

Some of his works include conversations with ARK Invest’s Catherine Wood, investors Kevin O’Leary and John Chambers, FTX’s Sam Bankman-Fried, Kai Volatility’s Cem Karsan, The Ambrus Group’s Kris Sidial, among many others.

Disclaimer

In no way should the materials herein be construed as advice. Derivatives carry a substantial risk of loss. All content is for informational purposes only.

Categories
Commentary

Daily Brief For May 11, 2022

The Daily Brief is a free glimpse into the prevailing fundamental and technical drivers of U.S. equity market products. Join the 200+ that read this report daily, below!

What Happened

Overnight, index and commodity futures were bid while yields and the Cboe Volatility Index (INDEX: VIX) came in, little.

In the news was continued crypto market turmoil. The TerraUSD stablecoin maintained its break with the U.S. dollar, trading as low as ~0.25. Shanghai reported a drop in new COVID-19 cases.

Key, today, is data on consumer prices (8:30 AM ET). If Wednesday’s print shows price pressures continuing to mount, traders will put more weight on the potential for larger hikes.

Later, is some Fed speak (12:00 PM ET) and federal budget updates (2:00 PM ET).

Graphic updated 6:45 AM ET. Sentiment Neutral if expected /ES open is inside of the prior day’s range. /ES levels are derived from the profile graphic at the bottom of the following section. Levels may have changed since initially quoted; click here for the latest levels. SqueezeMetrics Dark Pool Index (DIX) and Gamma (GEX) calculations are based on where the prior day’s reading falls with respect to the MAX and MIN of all occurrences available. A higher DIX is bullish. At the same time, the lower the GEX, the more (expected) volatility. Learn the implications of volatility, direction, and moneyness. SHIFT data used for S&P 500 (INDEX: SPX) options activity. Note that options flow is sorted by the call premium spent; if more positive, then more was spent on call options. Breadth reflects a reading of the prior day’s NYSE Advance/Decline indicator. VIX reflects a current reading of the CBOE Volatility Index (INDEX: VIX) from 0-100.

What To Expect

Fundamental: Shortened commentary, today.

Participants expect inflation to have peaked. This would be confirmed by the annual CPI printing 8.1%, down from 8.5% in March.

Graphic: Via Bloomberg.

“Perhaps the tightest questions will concern core inflation (excluding food and fuel, which continue to be roiled by the situation in Ukraine),” says Bloomberg’s John Authers. 

“Now, if the economists polled by Bloomberg are correct, core month-on-month inflation is going to rise a bit. That does not help the narrative that the peak is in. If this particular number comes in below expectations, we can expect that to be taken very, very positively on the markets.”

Graphic: Via Bank of America Corporation (NYSE: BAC). Taken from Bloomberg. “It’s straightforward common sense that higher inflation would lead to paying a lower multiple of earnings because you expect future earnings to be eaten into by inflation. And common sense is borne out empirically; all else equal, higher inflation does indeed tend to mean lower earnings multiples.”

Positioning: Participants are most concerned and hedging against aggressive monetary policy action and economic chokepoints.

Investors will get clarity on some of these issues in the coming sessions.

Graphic: Via SpotGamma, the estimated gamma for calls by strike as a positive number and puts as a negative number on the S&P 500 ETF, the SPY. Notice the weight on the put side.

Barring a worst-case scenario, if markets do not perform to the downside (i.e., do not trade lower), those highly-priced (often very short-dated) bets on direction will continue to decay (i.e., removal of event premiums).

Graphic: Via SpotGamma. At-the-money implied volatility is backwardated given the heightened demand for shorter-dated protection, relative to that which is longer-dated.

Accordingly, hedging flows with respect to time and volatility may, then, bolster sharp rallies.

Graphic: Via SpotGamma. “SPX prices X-axis. Option delta Y-axis. When the factors of implied volatility and time change, hedging ratios change. For instance, if SPX is at $4,700.00 and IV jumps 15% (all else equal), the dealer may sell an additional 0.2 deltas to hedge their exposure to the addition of a positive 0.2 delta. The graphic is for illustrational purposes, only.”

The alternative is that participants’ fears for whatever matter are not assuaged. In case of an imbalance, demand for protection may kick off a repricing of volatility, particularly that which is further away from current prices (i.e., skew), depressed by strong supply.

Graphic: Updated May 10, 2022. The VVIX via Physik Invest. Cboe VVIX Index (INDEX: VVIX), or the volatility of volatility, has a mean below 100 and a high correlation with the Cboe Volatility Index (INDEX: VIX) during times of stress. When realized volatility is as high as it has been, the VVIX typically trades closer to 150.

Whether any price rise kicks off a sustained reversal depends on what the fundamental situation is, then.

Presently, some of the largest index constituents (e.g., Apple Inc [NASDAQ: AAPL]) are starting to succumb to the fundamental situation, if we will, and that may feed into the indexes which are pinned due to passive and hedging flows.

In other words, fundamentals will trump this talk of positioning (i.e., it is only in the short-term does this positioning we’ve talked about have greater implications).

Graphic: Via Physik Invest. Data retrieved from SqueezeMetrics. A higher DIX/GEX ratio has historically been associated with S&P 500 outperformance in the subsequent month. A very low DIX/GEX ratio has historically been associated with positive S&P 500 performance in the subsequent month, though there are many more negative outliers.

Technical: As of 6:30 AM ET, Wednesday’s regular session (9:30 AM – 4:00 PM ET), in the S&P 500, will likely open in the upper part of a positively skewed overnight inventory, inside of prior-range and -value, suggesting a limited potential for immediate directional opportunity.

In the best case, the S&P 500 trades higher; activity above the $4,055.75 low volume node (LVNode) puts into play the $4,119.00 untested point of control (VPOC). Initiative trade beyond the VPOC could reach as high as the $4,153.25 regular trade high (RTH High) and $4,212.25 micro composite point of control (VPOC), or higher.

In the worst case, the S&P 500 trades lower; activity below the $4,055.75 LVNode puts into play the $3,978.50 LVNode. Initiative trade beyond the $3,978.50 LVNode could reach as low as the $3,943.25 and $3,907.75 high volume areas (HVNode), or lower.

Click here to load today’s key levels into the web-based TradingView charting platform. Note that all levels are derived using the 65-minute timeframe. New links are produced, daily.
Graphic: 65-minute profile chart of the Micro E-mini S&P 500 Futures.

Definitions

Volume Areas: A structurally sound market will build on areas of high volume (HVNodes). Should the market trend for long periods of time, it will lack sound structure, identified as low volume areas (LVNodes). LVNodes denote directional conviction and ought to offer support on any test. 

If participants were to auction and find acceptance into areas of prior low volume (LVNodes), then future discovery ought to be volatile and quick as participants look to HVNodes for favorable entry or exit.

POCs: POCs are valuable as they denote areas where two-sided trade was most prevalent in a prior day session. Participants will respond to future tests of value as they offer favorable entry and exit.

MCPOCs: POCs are valuable as they denote areas where two-sided trade was most prevalent over numerous day sessions. Participants will respond to future tests of value as they offer favorable entry and exit.

Volume-Weighted Average Prices (VWAPs): A metric highly regarded by chief investment officers, among other participants, for quality of trade. Additionally, liquidity algorithms are benchmarked and programmed to buy and sell around VWAPs.

About

After years of self-education, strategy development, mentorship, and trial-and-error, Renato Leonard Capelj began trading full-time and founded Physik Invest to detail his methods, research, and performance in the markets.

Capelj also develops insights around impactful options market dynamics at SpotGamma and is a Benzinga reporter.

Some of his works include conversations with ARK Invest’s Catherine Wood, investors Kevin O’Leary and John Chambers, FTX’s Sam Bankman-Fried, Kai Volatility’s Cem Karsan, The Ambrus Group’s Kris Sidial, among many others.

Disclaimer

In no way should the materials herein be construed as advice. Derivatives carry a substantial risk of loss. All content is for informational purposes only.

Categories
Commentary

Daily Brief For April 29, 2022

The Daily Brief is a free glimpse into the prevailing fundamental and technical drivers of U.S. equity market products. Join the 200+ that read this report daily, below!

What Happened

Overnight, equity index futures auctioned sideways-to-lower after a mid-day price bump Thursday, on the heels of dismal earnings, among other things including a contraction in economic growth, last quarter.

Amazon Inc (NASDAQ: AMZN) shares fell after the company projected sluggish sales as well as higher costs.

Apple Inc (NASDAQ: AAPL) saw strong sales and profit help top estimates. The company announced a $90 billion share buyback and fears over supply constraints.

Tesla Inc’s (NASDAQ: TSLA) Elon Musk offloaded $4 billion worth of shares just after his deal to buy Twitter Inc (NYSE: TWTR) was reached days before.

Also in the news: Russia’s urgency to avoid a default. Food Inflation hits an all-time high. China’s currency plunge raises the risk of 2015-style panic. No-money-down crypto mortgages and why housing may be topping. Barclays PLC (NYSE: BCS) halts ETN sales.

Ahead is data on the employment cost index, PCE, personal income and consumer spending (8:30 AM ET), as well as Chicago PMI (9:45 AM ET), and University of Michigan consumer sentiment and inflation expectations (10:00 AM ET).

Graphic updated 6:30 AM ET. Sentiment Neutral if expected /ES open is inside of the prior day’s range. /ES levels are derived from the profile graphic at the bottom of the following section. Levels may have changed since initially quoted; click here for the latest levels. SqueezeMetrics Dark Pool Index (DIX) and Gamma (GEX) calculations are based on where the prior day’s reading falls with respect to the MAX and MIN of all occurrences available. A higher DIX is bullish. At the same time, the lower the GEX, the more (expected) volatility. Learn the implications of volatility, direction, and moneyness. SHIFT data used for S&P 500 (INDEX: SPX) options activity. Note that options flow is sorted by the call premium spent; if more positive, then more was spent on call options. Breadth reflects a reading of the prior day’s NYSE Advance/Decline indicator. VIX reflects a current reading of the CBOE Volatility Index (INDEX: VIX) from 0-100.

What To Expect

Fundamental: In hindsight, a very volatile week characterized by large, two-sided action and little constructive movement (i.e., a week that ended sideways rather than up or down).

Graphic: Via Bloomberg. Indexes sideways, mainly, as large constituents report their earnings.

This is ahead of what many think is likely to be front-loaded 50 basis point tightening next week and in June with rates, ultimately, trading in the range of 2.25-2.50% end-of-year.

Graphic: Via CME Group Inc’s (NASDAQ: CME) FedWatch Tool.

In light of tightening expectations, Columbia Threadneedle’s Gene Tannuzzo says “Tighter financial conditions are the mechanism that reduces demand and ultimately slows inflation.”

Graphic: Via Bloomberg. Financial conditions have started to tighten.

“If financial conditions don’t tighten [i.e., stocks regain their swagger] and inflation remains high, in their eyes, they need to hike more.”

Graphic: Via S&P Global Inc (NYSE: SPGI). Food Inflation Hits All-Time High, Fuels Security Risks.

In regards to balance sheet reduction, “QT will consist of run-off caps of USD 60bn for US Treasuries (UST) and USD 35bn for mortgage-backed securities (MBS), which will make up for a cap of USD 95bn per month going forward,” Nordea Bank (OTC: NRDBY) research says.

“The balance sheet reduction will revolve around coupon securities, with the Fed’s c. USD 326bn Treasury bills only allowed roll-off in months when maturing caps do not reach the cap. We expect the Fed to use a 3-month roll-on period in its reduction, which will make up for a relatively smooth and predictable treasury run-off.”

Positioning: Our April 27 discussion on positioning went into great detail on the likelihood of continued volatility and lower prices. 

On April 28 we noted the implications of heightened implied volatility and no follow-through to the downside. 

The returns distribution, based on implied volatility metrics alone, was skewed positive, albeit with a potential for large negative outliers.

Graphic: Via @HalfersPower. “In backwardation via $VIX: $VIX3M next month [realized volatility] is highest amongst the deciles (d10 >1) ~43% subsequent realized volatility.”

During Thursday’s trade, markets endured a near-vertical price rise alongside repositioning and what SpotGamma says is a “put-heavy expiration [Friday] (20% of gamma roll-off expected).”

Graphic: SpotGamma’s Hedging Impact of Real-Time Options indicator for the QQQ.

The idea is as follows: customers are well-hedged (customers own puts and/or are short calls) and this offers them positive, yet asymmetric (gamma), exposure to direction (delta). In other words, negative delta and positive gamma

The counterparty has exposure to positive delta and negative gamma. If the underlyings trade lower and volatility rises, all else equal, the position will lose. To hedge against these losses, the counterparties will sell underlying into weakness.

If this exposure is to roll off or underlying prices reverse and move higher, these counterparties will re-hedge and buy underlying. That’s what SpotGamma is hinting at.

Graphic: Via SpotGamma, the estimated gamma for calls by strike as a positive number and puts as a negative number on the S&P 500 ETF, the SPY. Notice the weight on the put side.

SpotGamma also notes: “VIX call open interest (blue) is near March ’20 highs. With VIX near 1-yr highs put interest (red) is near lows. Equity rally/vol decline seems like it would catch most everyone offsides.”

Graphic: Via SpotGamma.

Technical: As of 6:15 AM ET, Friday’s regular session (9:30 AM – 4:00 PM ET), in the S&P 500, will likely open in the middle part of a balanced overnight inventory, inside of prior-range and -value, suggesting a limited potential for immediate directional opportunity.

In the best case, the S&P 500 trades higher; activity above the $4,235.00 overnight low (ONL) puts in play the $4,279.75 overnight high (ONH). Initiative trade beyond the ONH could reach as high as the $4,303.50 regular trade high (RTH High) and $4,337.00 untested point of control (VPOC), or higher.

In the worst case, the S&P 500 trades lower; activity below the $4,235.00 ONL puts in play the $4,191.00 VPOC. Initiative trade beyond the VPOC could reach as low as the $4,182.50 ONL and $4,156.75 regular trade low (RTH Low), or lower.

Click here to load today’s key levels into the web-based TradingView charting platform. Note that all levels are derived using the 65-minute timeframe. New links are produced, daily.
Graphic: 65-minute profile chart of the Micro E-mini S&P 500 Futures.

Considerations: Into this week, markets were extremely weak alongside hawkish remarks from the Fed and dismal responses to earnings results, among other things.

Graphic: Via Bloomberg.

Then, as a major index – the Invesco QQQ Trust Series 1 (NASDAQ: QQQ) – tested a major VWAP anchored from the lows of March 2020. After, a rounded bottom began to form while implied volatility metrics continued to trend higher.

Graphic: Invesco QQQ Trust Series 1 (NASDAQ: QQQ) with anchored VWAPs.

Thursday’s price rise and volatility compression, particularly at the short-end of the term structure coincided with some of the strongest breadth in days. 

Notwithstanding, the entire advance was taken back overnight and now the S&P 500 is trading back inside a multi-day consolidation. 

If a short-term trader, playing responsively (i.e., fading edges) is likely the best course of action until the indexes, at least, are able to break above this week’s ranges and remain there (i.e., not trade back down).

Graphic: Market Internals as pioneered by (a mentor of mine) Peter Reznicek. Notice the indicator in the top right, weighted S&P sectors (histogram) versus unweighted (blue line). During late last week, participants sold the entire market, heavily (as supported by the difference between the volume flowing into stocks that are up versus those that are down).

Definitions

Overnight Rally Highs (Lows): Typically, there is a low historical probability associated with overnight rally-highs (lows) ending the upside (downside) discovery process.

Volume Areas: A structurally sound market will build on areas of high volume (HVNodes). Should the market trend for long periods of time, it will lack sound structure, identified as low volume areas (LVNodes). LVNodes denote directional conviction and ought to offer support on any test. 

If participants were to auction and find acceptance into areas of prior low volume (LVNodes), then future discovery ought to be volatile and quick as participants look to HVNodes for favorable entry or exit.

POCs: POCs are valuable as they denote areas where two-sided trade was most prevalent in a prior day session. Participants will respond to future tests of value as they offer favorable entry and exit.

Volume-Weighted Average Prices (VWAPs): A metric highly regarded by chief investment officers, among other participants, for quality of trade. Additionally, liquidity algorithms are benchmarked and programmed to buy and sell around VWAPs.

About

After years of self-education, strategy development, mentorship, and trial-and-error, Renato Leonard Capelj began trading full-time and founded Physik Invest to detail his methods, research, and performance in the markets.

Capelj also develops insights around impactful options market dynamics at SpotGamma and is a Benzinga reporter.

Some of his works include conversations with ARK Invest’s Catherine Wood, investors Kevin O’Leary and John Chambers, FTX’s Sam Bankman-Fried, Kai Volatility’s Cem Karsan, The Ambrus Group’s Kris Sidial, among many others.

Disclaimer

In no way should the materials herein be construed as advice. Derivatives carry a substantial risk of loss. All content is for informational purposes only.

Categories
Commentary

Daily Brief For January 28, 2022

Editor’s Note: Thanks for subscribing to The Daily Brief, a free glimpse into the prevailing fundamental and technical drivers of U.S. equity market products. 

In the coming week, commentaries are set to pause as I go on vacation. Look forward to providing valuable market color when I return, on February 7, 2022

Talk to you soon!

What Happened

Despite certain index heavy-weights trading higher in light of earnings announcements, equity index futures remain weak, trading sideways to lower overnight with bonds. 

Measures of implied volatility (IV) remain bid while certain metrics continue to show buying support. Given the way counterparties to customer options trades hedge, a compression in volatility may bolster a move higher.

Though the odds point to a counter-trend rally, continued selling is not out of the question. A break of multi-session support levels, combined with rising IV, would pressure indices further.

Ahead is data on PCE Inflation, incomes, spending, and the Employment Cost Index (8:30 AM ET). After is University of Michigan data on sentiment and inflation expectations (10:00 AM ET).

Graphic updated 6:55 AM ET. Sentiment Risk-Off if expected /ES open is below the prior day’s range. /ES levels are derived from the profile graphic at the bottom of the following section. Levels may have changed since initially quoted; click here for the latest levels. SqueezeMetrics Dark Pool Index (DIX) and Gamma (GEX) calculations are based on where the prior day’s reading falls with respect to the MAX and MIN of all occurrences available. A higher DIX is bullish. At the same time, the lower the GEX, the more (expected) volatility. Learn the implications of volatility, direction, and moneyness. SHIFT data used for S&P 500 (INDEX: SPX) options activity. Note that options flow is sorted by the call premium spent; if more positive, then more was spent on call options. Breadth reflects a reading of the prior day’s NYSE Advance/Decline indicator. VIX reflects a current reading of the CBOE Volatility Index (INDEX: VIX) from 0-100.

What To Expect

Fundamental: Equity indices are struggling to catch a bid amidst a more hawkish Fed, persistent geopolitical tensions, and data showing slowing growth at home and abroad.

Graphic: @MacroAlf plots credit impulse as a percent of GDP and SPX year-over-year earnings.

This is in the face of heavyweights, like Apple Inc (NASDAQ: AAPL) which posted its highest-ever quarterly earnings after sales climbed 11% to a record $124 billion, trading higher.

Coming back to comments from yesterday, the Federal Open Market Committee (FOMC) revealed asset purchases would stop in March. Then, in the face of an economy that’s much stronger than at the start of the last hiking cycle, the window for higher rates would be opened. 

What spooked markets was Fed Chair Jerome Powell “saying that the Fed has plenty of room to raise interest rates without harming the labor market,” according to an analysis by Moody’s Corporation (NYSE: MCO).

“Powell didn’t push back against market expectations for three to four rate hikes this year, but he signaled the central bank will have zero tolerance for any upside surprises in inflation.”

According to a write-up by Nasdaq Inc’s (NASDAQ: NDAQ) Phil Mackintosh, “some economists are already worrying whether the Fed can engineer a ‘soft landing’ for the economy, which is where rate hikes slow the economy and inflation but don’t cause a recession.”

Based on the data, though, “selloffs in rate hike cycles, especially since 1975, are mostly much smaller corrections,” Mackintosh adds.

“So, it seems we should worry much more about a recession than hikes.”

Graphic: Per Nasdaq, “[S]tock market corrections are much more dependent on the business cycle than the rates cycle. That makes sense—during rate-hike cycles, companies have strong demand and revenue growth recessions. Whereas, during recessions, unemployment and spending usually contract.”

Complicating the Fed’s job, per Nasdaq, are outside influences such as waning fiscal stimulus and further supply shocks (the good and bad ones). 

However, “annualized returns for the S&P 500 during rate hike cycles are mostly positive, … [as] rising rates usually equals a strong economy, which is usually good for companies, leading to earnings growth.”

“That earnings growth more than offsets the valuation impact of higher rates.”

Graphic: Per Nasdaq, annualized S&P 500 returns during rate-hike cycles.

To assuage some fears, Goldman Sachs Group Inc (NYSE: GS) thinks that the “interplay of Fed policy, financial conditions, and the growth outlook could make it hard for the Fed to actually deliver consecutive hikes, even if they feel like a natural forecast along the way.”

Graphic: Goldman Sachs sees a (small) tightening in financial conditions. Graphic retrieved from The Market Ear. According to Bloomberg, “there is quite a long way to go before the Fed would feel any great need to come to their rescue.”

Positioning: A short-gamma environment (wherein an options delta falls with stock price rises and rises when stock prices fall) portends increased two-way volatility.

This is as the counterparties to customer options trades hedge in a manner that exacerbates movement (i.e., buying strength and selling weakness).

Graphic: SqueezeMetrics details the implications of customer activity in the options market, on the underlying’s order book. For instance, in selling a put, customers add liquidity and stabilize the market. How? The market maker long the put will buy (sell) the underlying to neutralize directional risk as price falls (rises).

As noted in past commentaries, the removal of put-heavy exposure, after the January monthly options expiration (OPEX), as well as the reduction in event premiums tied to FOMC, opened a window of strength, wherein dealers would have less positive delta to sell against.

In other words, as measures of implied volatility were to compress, as is the case when there is less demand (or more supply) of downside put protection (a positive-delta trade for the dealers), the dealer’s exposure to positive delta declines.

However, the failure to expand range is punishing toward highly demanded protection with a shorter time to maturity. These options, which are more “convex” and sensitive to changes in direction and volatility, have the most to lose as markets settle and “decay returns with vengeance,” according to SpotGamma, an options modeling and data service.

“As time and volatility trend to zero (as all options expire), given the current market environment, dealers’ exposure to the risk of out-of-the-money protection will decline.”

That solicits the dealers’ unwind of “short-delta hedges to decaying positive-delta protection.”

Those delta hedging flows with respect to time (charm) and volatility (vanna) are to reinforce the strong buying support (as measured by liquidity provision on the market-making side).

Graphic: From SpotGamma. SPX prices X-axis. Option delta Y-axis. When the factors of implied volatility and time change, hedging ratios change. For instance, if SPX is at $4,700.00 and IV jumps 15% (all else equal), the dealer may sell an additional 0.2 deltas to hedge their exposure to the addition of a positive 0.2 delta. The graphic is for illustrational purposes, only.

At present, in putting it simply, markets would really have to (1) fall out of bed or (2) demand for protection to explode for options counterparties, at least, to pressure markets much further.

As SpotGamma (which you can check out by clicking here) puts well: 

“In other words, the frantic hedging that destabilizes markets as customers reach for protection en masse has already happened. There would have to be an addition of macro flows for sale and/or new put buying for dealers to sell.”

Technical: As of 6:55 AM ET, Friday’s regular session (9:30 AM – 4:00 PM ET), in the S&P 500, will likely open in the lower part of a negatively skewed overnight inventory, outside of prior-range and -value, suggesting a potential for immediate directional opportunity.

Gap Scenarios: Gaps ought to fill quickly. Should they not, that’s a signal of strength; do not fade. Leaving value behind on a gap-fill or failing to fill a gap (i.e., remaining outside of the prior session’s range) is a go-with indicator.

Auctioning and spending at least 1-hour of trade back in the prior range suggests a lack of conviction; in such a case, do not follow the direction of the most recent initiative activity.

In the best case, the S&P 500 trades higher; activity above the $4,332.25 high volume area (HVNode) puts in play the $4,370.25 low volume area (LVNode). Initiative trade beyond the LVNode could reach as high as the $4,393.75 HVNode and $4,421.50 regular trade high (RTH High), or higher.

In the worst case, the S&P 500 trades lower; activity below the $4,332.25 HVNode puts in play the $4,299.25 RTH Low. Initiative trade beyond the RTH Low could reach as low as the $4,263.25 overnight low (ONL) and $4,212.50 RTH Low, or lower.

Click here to load today’s key levels into the web-based TradingView charting platform. Note that all levels are derived using the 65-minute timeframe. New links are produced, daily.
Graphic: 65-minute profile chart of the Micro E-mini S&P 500 Futures.

Definitions

Overnight Rally Highs (Lows): Typically, there is a low historical probability associated with overnight rally-highs (lows) ending the upside (downside) discovery process.

Volume Areas: A structurally sound market will build on areas of high volume (HVNodes). Should the market trend for long periods of time, it will lack sound structure, identified as low volume areas (LVNodes). LVNodes denote directional conviction and ought to offer support on any test. 

If participants were to auction and find acceptance into areas of prior low volume (LVNodes), then future discovery ought to be volatile and quick as participants look to HVNodes for favorable entry or exit.

Gamma: Gamma is the sensitivity of an option to changes in the underlying price. Dealers that take the other side of options trades hedge their exposure to risk by buying and selling the underlying. When dealers are short-gamma, they hedge by buying into strength and selling into weakness. When dealers are long-gamma, they hedge by selling into strength and buying into weakness. The former exacerbates volatility. The latter calms volatility.

Vanna: The rate at which the delta of an option changes with respect to volatility.

Charm: The rate at which the delta of an option changes with respect to time.

Options Expiration (OPEX): Traditionally, option expiries mark an end to pinning (i.e, the theory that market makers and institutions short options move stocks to the point where the greatest dollar value of contracts will expire) and the reduction dealer gamma exposure.

About

After years of self-education, strategy development, mentorship, and trial-and-error, Renato Leonard Capelj began trading full-time and founded Physik Invest to detail his methods, research, and performance in the markets.

Capelj is also a Benzinga finance and technology reporter interviewing the likes of Shark Tank’s Kevin O’Leary, JC2 Ventures’ John Chambers, FTX’s Sam Bankman-Fried, and ARK Invest’s Catherine Wood, as well as a SpotGamma contributor developing insights around impactful options market dynamics. 

Disclaimer

Physik Invest does not carry the right to provide advice.

In no way should the materials herein be construed as advice. Derivatives carry a substantial risk of loss. All content is for informational purposes only.

Categories
Commentary

Daily Brief For January 24, 2022

The Daily Brief is a free glimpse into the prevailing fundamental and technical drivers of U.S. equity market products. Join the 200+ that read this report daily, below!

What Happened

Overnight, equity index futures auctioned sideways to lower while measures of implied volatility expanded, which suggests increased fear and demand for protection.

This is in the context of an environment wherein the equity market, in particular, is positioned for heightened volatility, albeit potential strength, after Friday’s large monthly options expiration.

Ahead is data on Markit Manufacturing and Services PMI (9:45 AM ET).

Graphic updated 6:15 AM ET. Sentiment Risk-Off if expected /ES open is below the prior day’s range. /ES levels are derived from the profile graphic at the bottom of the following section. Levels may have changed since initially quoted; click here for the latest levels. SqueezeMetrics Dark Pool Index (DIX) and Gamma (GEX) calculations are based on where the prior day’s reading falls with respect to the MAX and MIN of all occurrences available. A higher DIX is bullish. At the same time, the lower the GEX, the more (expected) volatility. Learn the implications of volatility, direction, and moneyness. SHIFT data used for S&P 500 (INDEX: SPX) options activity. Note that options flow is sorted by the call premium spent; if more positive, then more was spent on call options. Breadth reflects a reading of the prior day’s NYSE Advance/Decline indicator. VIX reflects a current reading of the CBOE Volatility Index (INDEX: VIX) from 0-100.

What To Expect

Fundamental: “The ratio of stocks hitting 52-week lows is at the highest since March 2020,” according to The Market Ear

In fact, in the face of a traditionally bullish period, seasonally, this is the worst January on record for the Nasdaq.

Graphic: Per Bloomberg, “Down almost 12% in January, the Nasdaq 100 is on course for its worst month since the 2008 global financial crisis. On any four-day basis, the current streak of 1% drops was the first since 2018.”

This weakness is in the context of months of divergent breadth by lesser weighted index constituents, geopolitical tensions, the prospects of reduced stimulus to combat high inflation, poor responses to earnings results, and disappointments in real demand and growth.

Graphic: @MacroAlf plots credit impulse as a percent of GDP and SPX year-over-year earnings.

The tone amongst retail participants is changing, too, with outflows starting for the first time since a major rush in account openings. When asked whether the selling is over, JPMorgan Chase & Co’s (NYSE: JPM) prime brokerage data suggests no.

This is in opposition to the typical trend into the start of the Federal Reserve (Fed) hiking cycles.

“U.S. equities have stumbled significantly on their way toward the first hike of this cycle, which is not the norm,” Jefferies Financial Group (NYSE: JEF) explained. “Performance tends to be poor immediately after the first hike, and can be worse if stocks are weakly into the first hike.”

Notwithstanding, Jefferies adds, “the SPX was higher in the 12 months that followed the start of each of the last 7 hike cycles.”

Graphic: S&P 500 performance before and after rate hikes.

With some of that context in mind, what is there to look forward to? The corporate buyback blackout window ended after the close of business, Friday, and equity inflows remain robust.

What is there to be wary of? 

Well, given that “risk is being repriced to fit the world where real rates are a lot higher, and the Fed put [is] much lower thanks to the Fed’s need to fight inflation,” this week’s Federal Open Market Committee (FOMC) meeting shall provide market participants more context as to the “timing and pace of QT” which may assuage fears unless the Fed is all out to “drop QE next week itself.”

The odds of that happening are low.

Graphic: Per Bloomberg, “As Savita Subramanian of Bank of America Corporation (NYSE: BAC) shows in the following chart, expected earnings are far less helpful in explaining market outcomes since 2010 than they were before. Meanwhile, changes in the Fed’s balance sheet, the amount of money it’s making available to markets, have become hugely important.”

As Bloomberg’s John Authers puts it well: “Despite many scares, money has stayed plentiful for the last decade, rates have fallen, and anyone who did much to protect themselves against the risk of a decline would have done badly by it.”

Graphic: As Goldman Sachs Group Inc (NYSE: GS) “shows in this chart, companies are becoming ever more profitable in a way that seems to be sustained.”

Positioning: The major broad market indices – the S&P 500, Nasdaq 100, and Russell 2000 – are in an environment characterized by negative gamma and heightened volumes. 

Graphic: Per Tom McClellan, “Persistently high volume late in QQQ is a sign of overly bearish sentiment worthy of a bottom. Key caveat: just because one notices a sentiment indication which should matter does not mean it has to matter right away.”

The negative gamma – in reference to the options counterparties reaction “when a position’s delta falls (rises) with stock or index price rises (falls)” – is what compounds the selling. 

With measures of implied volatility expanding, as is the case when there is heightened demand for downside put protection (a positive-delta trade for the dealers), protection is bid and the dealer’s exposure to positive delta rises, which solicits more selling in the underlying (addition of short-delta hedges).

Graphic: SqueezeMetrics details the implications of customer activity in the options market, on the underlying’s order book. For instance, in selling a put, customers add liquidity and stabilize the market. How? The market maker long the put will buy (sell) the underlying to neutralize directional risk as price falls (rises).

Moreover, in negative-gamma, dealers are selling weakness and buying strength, taking liquidity. 

That’s destabilizing but it appears that “Friday in the markets did not have abnormal liquidity across S&P500 stocks.”

Graphic: Per @HalfersPower on Twitter, liquidity rankings for S&P 500 components. 

High readings in indicators like the put/call volume ratio, which denotes heightened trade of puts, relative to calls, as well as how calm equity market volatility is relative to rate volatility, could be the result of adequate hedging into the monthly options expiration (OPEX) and this week’s FOMC meeting.

“A very nasty flush out on a key polarized psychological level (S&P 500 $4,500.00) on the highest negative gamma day on an OPEX,” said Kris Sidial of The Ambrus Group on the increased potential for relief as a result of aggressive dip-buying. 

“Aggressive shorts piling in on an already dismantled tech selloff, leading into FOMC meeting after an 8% decline in the market, and Apple Inc (NASDAQ: AAPL) reporting earnings.”

Sidial’s opinion that the market is due for a counter-trend rally, in the face of an environment in which “there does not seem to be a direct hazard,” is aligned with the expectation that removal of put-heavy exposure, post-OPEX, and a reduction in embedded event premiums tied to the approaching FOMC, opens up a window of strength, wherein dealers have less positive delta exposure to sell against.

Technical: As of 6:15 AM ET, Monday’s regular session (9:30 AM – 4:00 PM ET), in the S&P 500, will likely open in the lower part of a balanced skewed overnight inventory, outside of prior-range and -value, suggesting a potential for immediate directional opportunity.

Gap Scenarios: Gaps ought to fill quickly. Should they not, that’s a signal of strength; do not fade. Leaving value behind on a gap-fill or failing to fill a gap (i.e., remaining outside of the prior session’s range) is a go-with indicator.

Auctioning and spending at least 1-hour of trade back in the prior range suggests a lack of conviction; in such a case, do not follow the direction of the most recent initiative activity.

In the best case, the S&P 500 trades higher; activity above the $4,381.50 regular trade low (RTH Low) puts in play the $4,449.00 untested point of control (VPOC). Initiative trade beyond the VPOC could reach as high as the $4,486.75 RTH High and $4,526.25 high volume area (HVNode), or higher.

In the worst case, the S&P 500 trades lower; activity below the $4,381.50 RTH Low puts in play the $4,349.00 VPOC. Initiative trade beyond the $4,349.00 VPOC could reach as low as the $4,299.00 and $4,233.00 VPOC, or lower.

Considerations: The daily, weekly, and monthly charts are in alignment. 

The loss of trend across higher timeframes suggests a clear change in tone. This does not discount the potential for fast, but short-lived counter-trend rallies.

Click here to load today’s key levels into the web-based TradingView charting platform. Note that all levels are derived using the 65-minute timeframe. New links are produced, daily.
Graphic: 65-minute profile chart of the Micro E-mini S&P 500 Futures.

Definitions

Volume Areas: A structurally sound market will build on areas of high volume (HVNodes). Should the market trend for long periods of time, it will lack sound structure, identified as low volume areas (LVNodes). LVNodes denote directional conviction and ought to offer support on any test. 

If participants were to auction and find acceptance into areas of prior low volume (LVNodes), then future discovery ought to be volatile and quick as participants look to HVNodes for favorable entry or exit.

POCs: POCs are valuable as they denote areas where two-sided trade was most prevalent in a prior day session. Participants will respond to future tests of value as they offer favorable entry and exit.

Options Expiration (OPEX): Traditionally, option expiries mark an end to pinning (i.e, the theory that market makers and institutions short options move stocks to the point where the greatest dollar value of contracts will expire) and the reduction dealer gamma exposure.

About

After years of self-education, strategy development, mentorship, and trial-and-error, Renato Leonard Capelj began trading full-time and founded Physik Invest to detail his methods, research, and performance in the markets.

Capelj is also a Benzinga finance and technology reporter interviewing the likes of Shark Tank’s Kevin O’Leary, JC2 Ventures’ John Chambers, FTX’s Sam Bankman-Fried, and ARK Invest’s Catherine Wood, as well as a SpotGamma contributor developing insights around impactful options market dynamics.

Disclaimer

Physik Invest does not carry the right to provide advice.

In no way should the materials herein be construed as advice. Derivatives carry a substantial risk of loss. All content is for informational purposes only.