Physik Invest’s Daily Brief is read by over 1,200 people. To join this community and learn about the fundamental and technical drivers of markets, subscribe below.
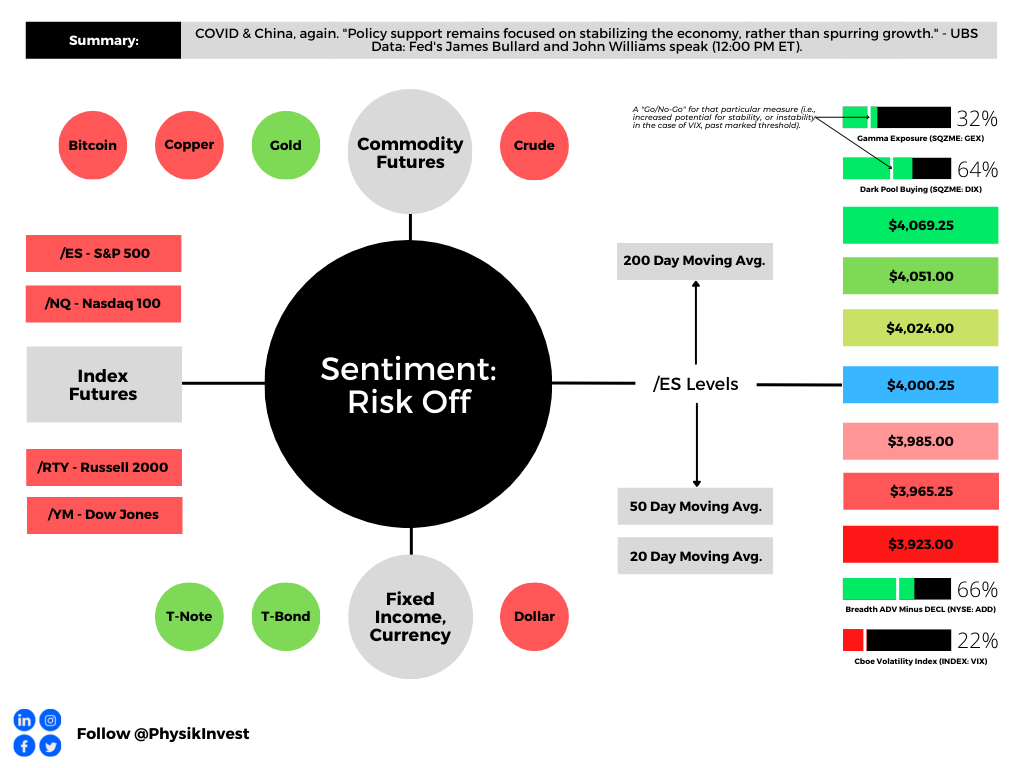
Graphic updated 6:50 AM ET. Sentiment Risk-Off if expected /ES open is below the prior day’s range. /ES levels are derived from the profile graphic at the bottom of this letter. Levels may have changed since initially quoted; click here for the latest levels. SqueezeMetrics Dark Pool Index (DIX) and Gamma (GEX) with the latter calculated based on where the prior day’s reading falls with respect to the MAX and MIN of all occurrences available. A higher DIX is bullish. At the same time, the lower the GEX, the more (expected) volatility. Click to learn the implications of volatility, direction, and moneyness. Breadth reflects a reading of the prior day’s NYSE Advance/Decline indicator. VIX reflects a current reading of the CBOE Volatility Index (INDEX: VIX) from 0-100.
Administrative
Hope you had a great holiday with your closest!
Fundamental
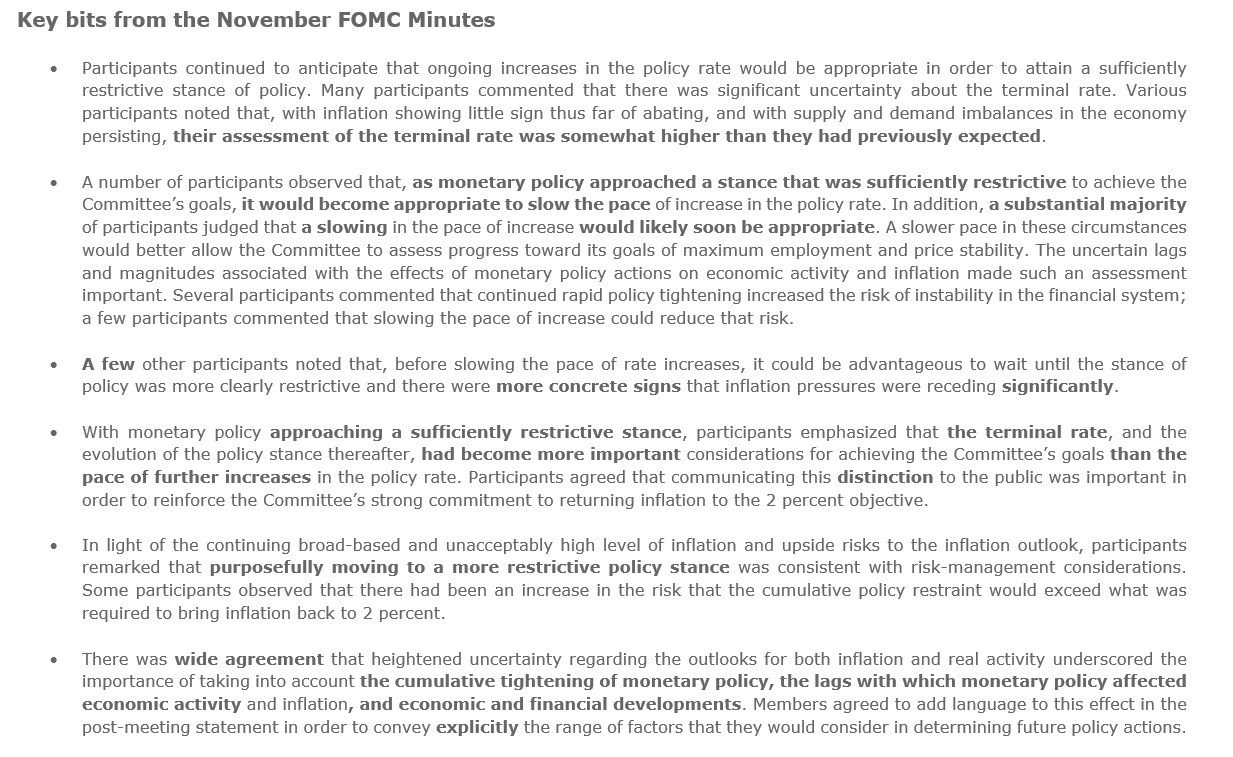
Minutes from a Federal Open Market Committee (FOMC) meeting dropped last week.
As strategist Rishi Mishra summarized well, “the focus shift[ed] to the terminal rate from the pace of tightening; although the terminal rate would be higher than previously expected, the pace at which we get there will be slower because they want to take lags into account.”
At its core, the economy has not slowed as much as the Fed was expecting, said Ellen Meade, a former Fed Board economist; “[t]hey can’t stop the rate increases until they see some measured evidence that the economy is slowing.”
So, with inflation “still at its highest since the 1980s,” according to Fabian Wintersberger, all the while financial conditions have loosened on easing inflation pressures, markets have yet to face their “most significant problems, [and] … keeping interest rates around 5% will not be a Fed pivot” (which is likely to happen near the middle of 2023, per the consensus analysis).
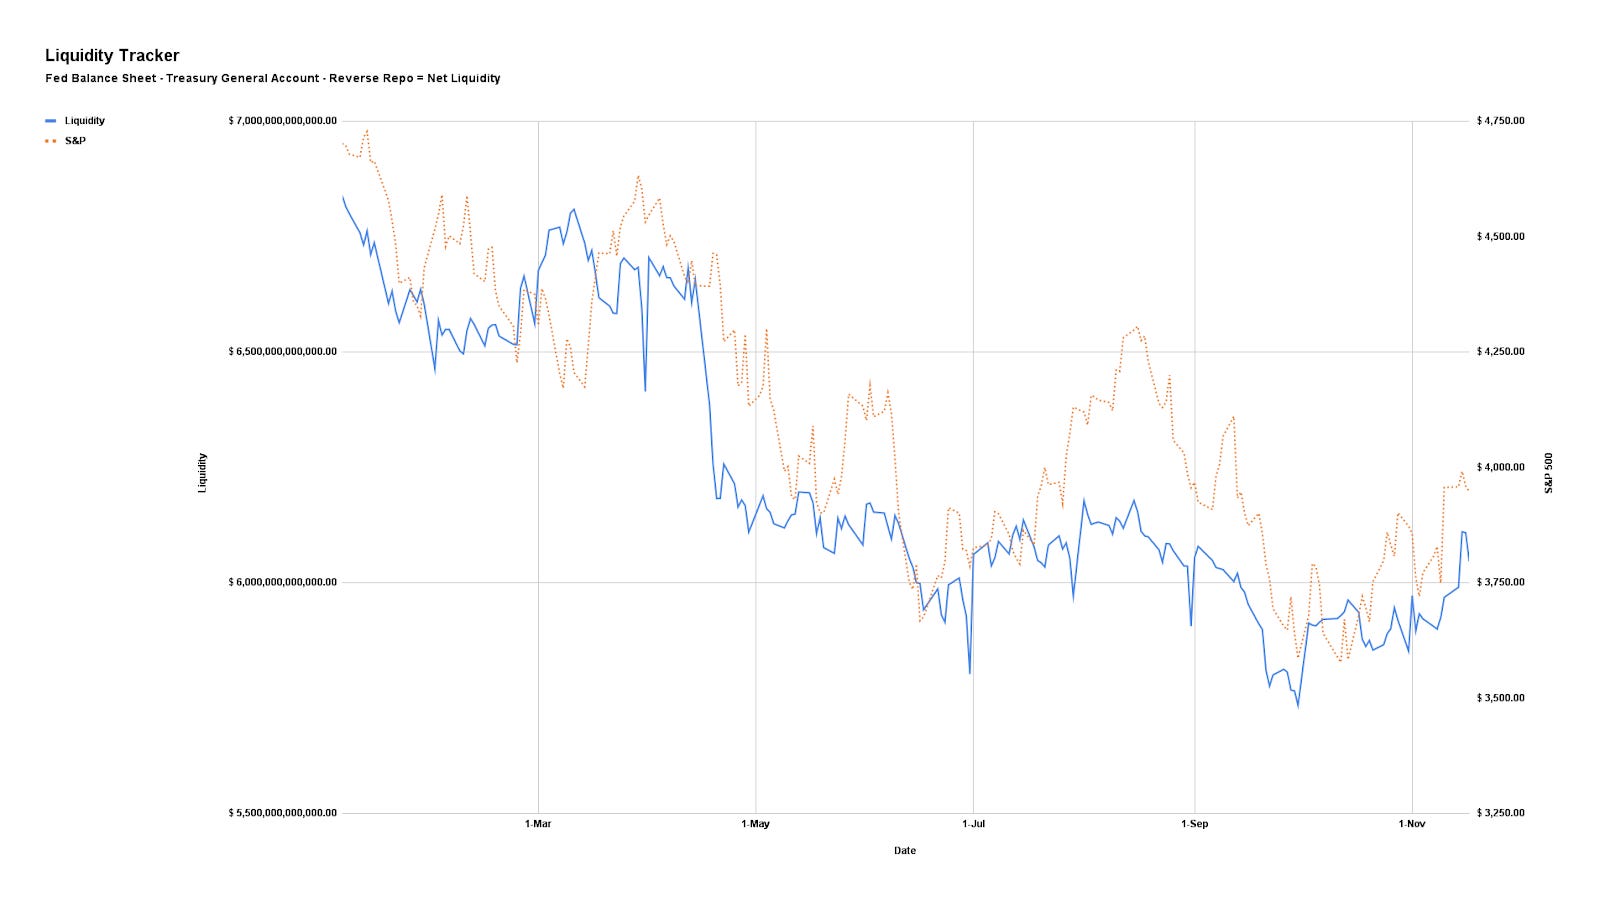
To bring the “balance sheet back to [2020 levels], [the Fed] needs to reduce it by 41%.” The balance sheet has only been reduced by 1.5%. Should liquidity keep shrinking, that pulls investors out of risk.
Graphic: Via Physik Invest. Data compiled by @jkonopas623. Fed Balance Sheet data, here. Treasury General Account Data, here. Reverse Repo data, here. NL = BS – TGA – RRP.
Positioning
From a volatility perspective, it’s not a terrible time to hedge.
An example demonstrates the point, well. As lightly discussed in last week’s letters, in mid-June, a trading partner and I noticed a change in tone in the non-linearity of volatility and skew with respect to linear changes in the price of the market or S&P 500 (INDEX: SPX).
The cost of certain spread structures (e.g., long/short one option near- or at-the-money and short/long two or more further out-of-the-money options) changed by hundreds of percent for only a few basis points of change in the underlying’s price.
Here’s more detail:
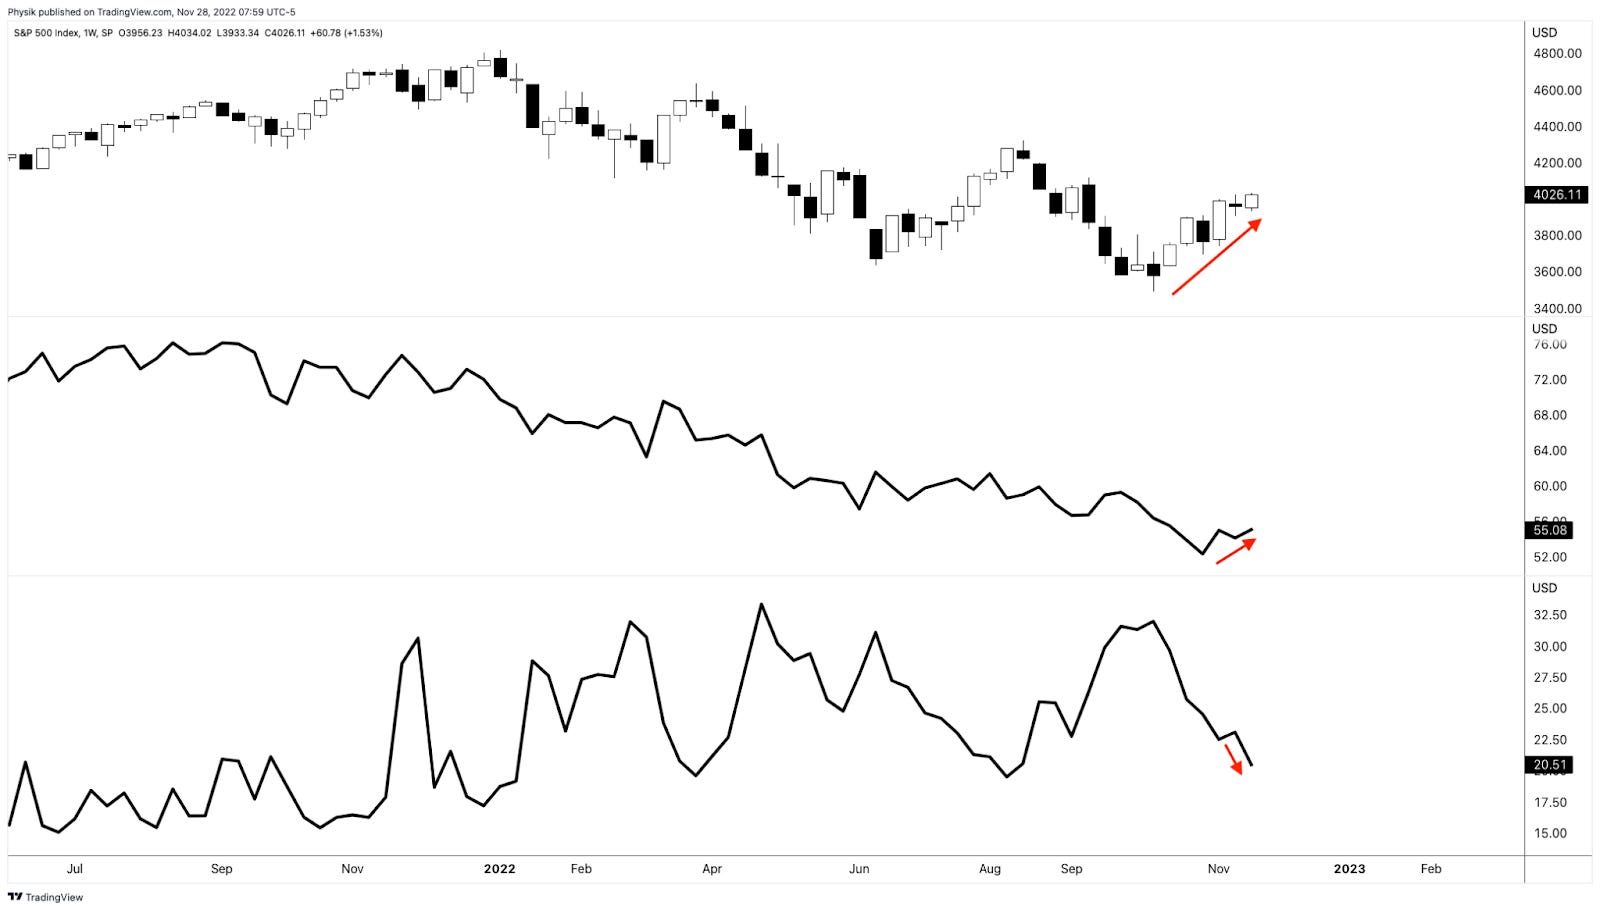
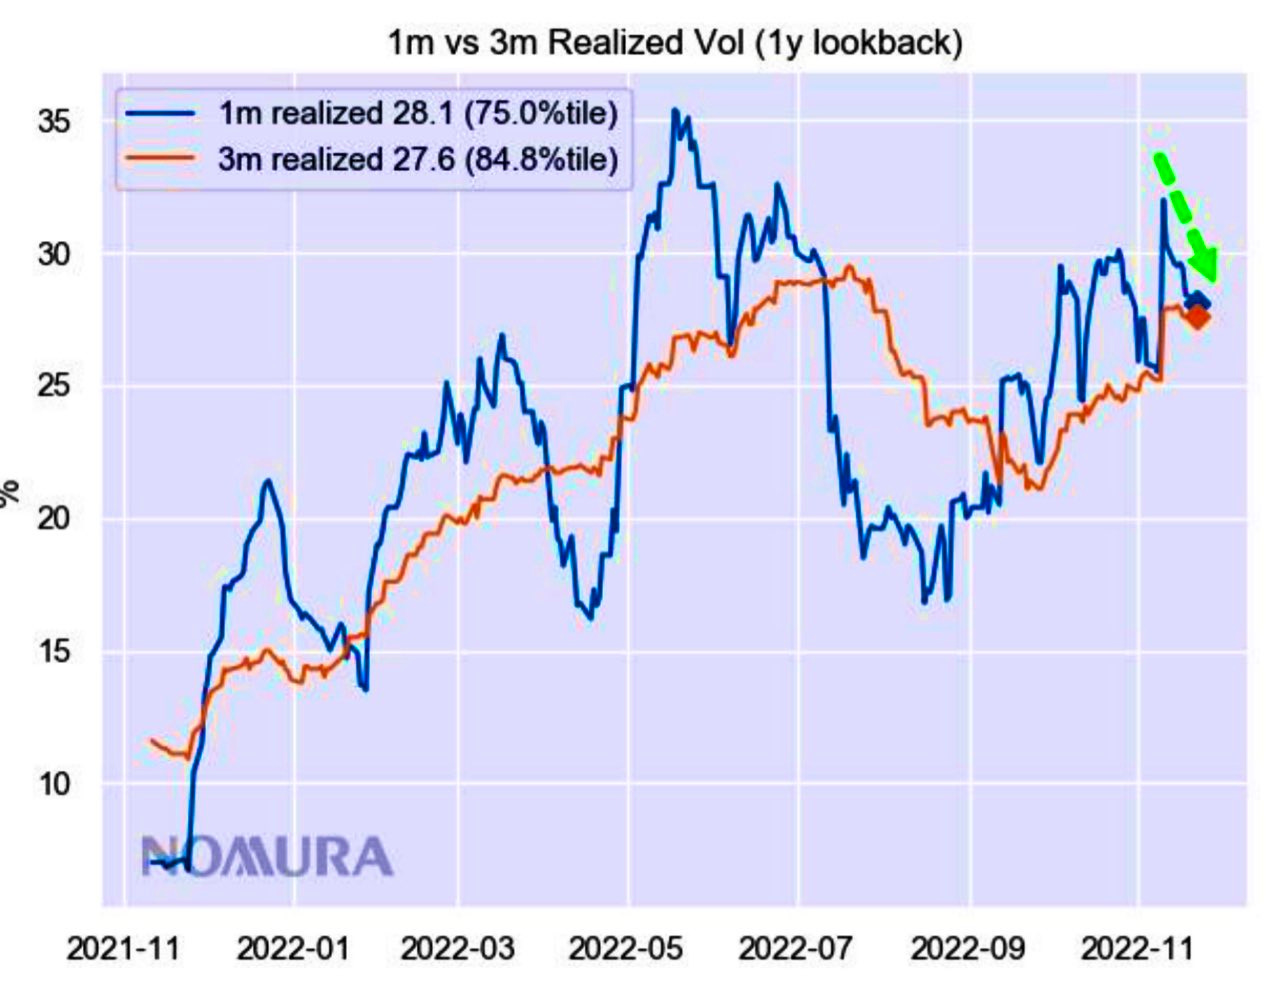
The market rose (boosted by a “vol crunch” and “systemic exposure reallocation,” per Nomura Holdings Inc’s [NYSE: NMR] Charlie McElligott) and, though top-line measures of IVOL have declined (e.g., INDEX: VIX), volatility skew is performing well.
Graphic: Retrieved from TradingView. Top, S&P 500 (INDEX: SPX). Middle Nations SkewDex (INDEX: SDEX). Bottom Cboe Volatility Index (INDEX: VIX). According to one paper from Nations Indexes, “SkewDex tells market participants how expensive out-of-the-money options are in relation to at-the-money options and thus, how risk-averse investors are.”
As Kai Volatility’s Cem Karsan once explained, this suggests “a potentially critical change in dealer positioning [and] the distribution of underlying outcomes”.
IVOL is at a lower bound and the bullish impacts yielded by its compressing have, largely, played out.
There is more to be gained by movement higher in IVOL. By owning protection, particularly that which is farther from current prices, you are positioned to monetize on non-linear repricings of volatility (as we saw earlier this year and may still see).
Graphic: Retrieved from Nomura Holdings Inc (NYSE: NMR).
Technical
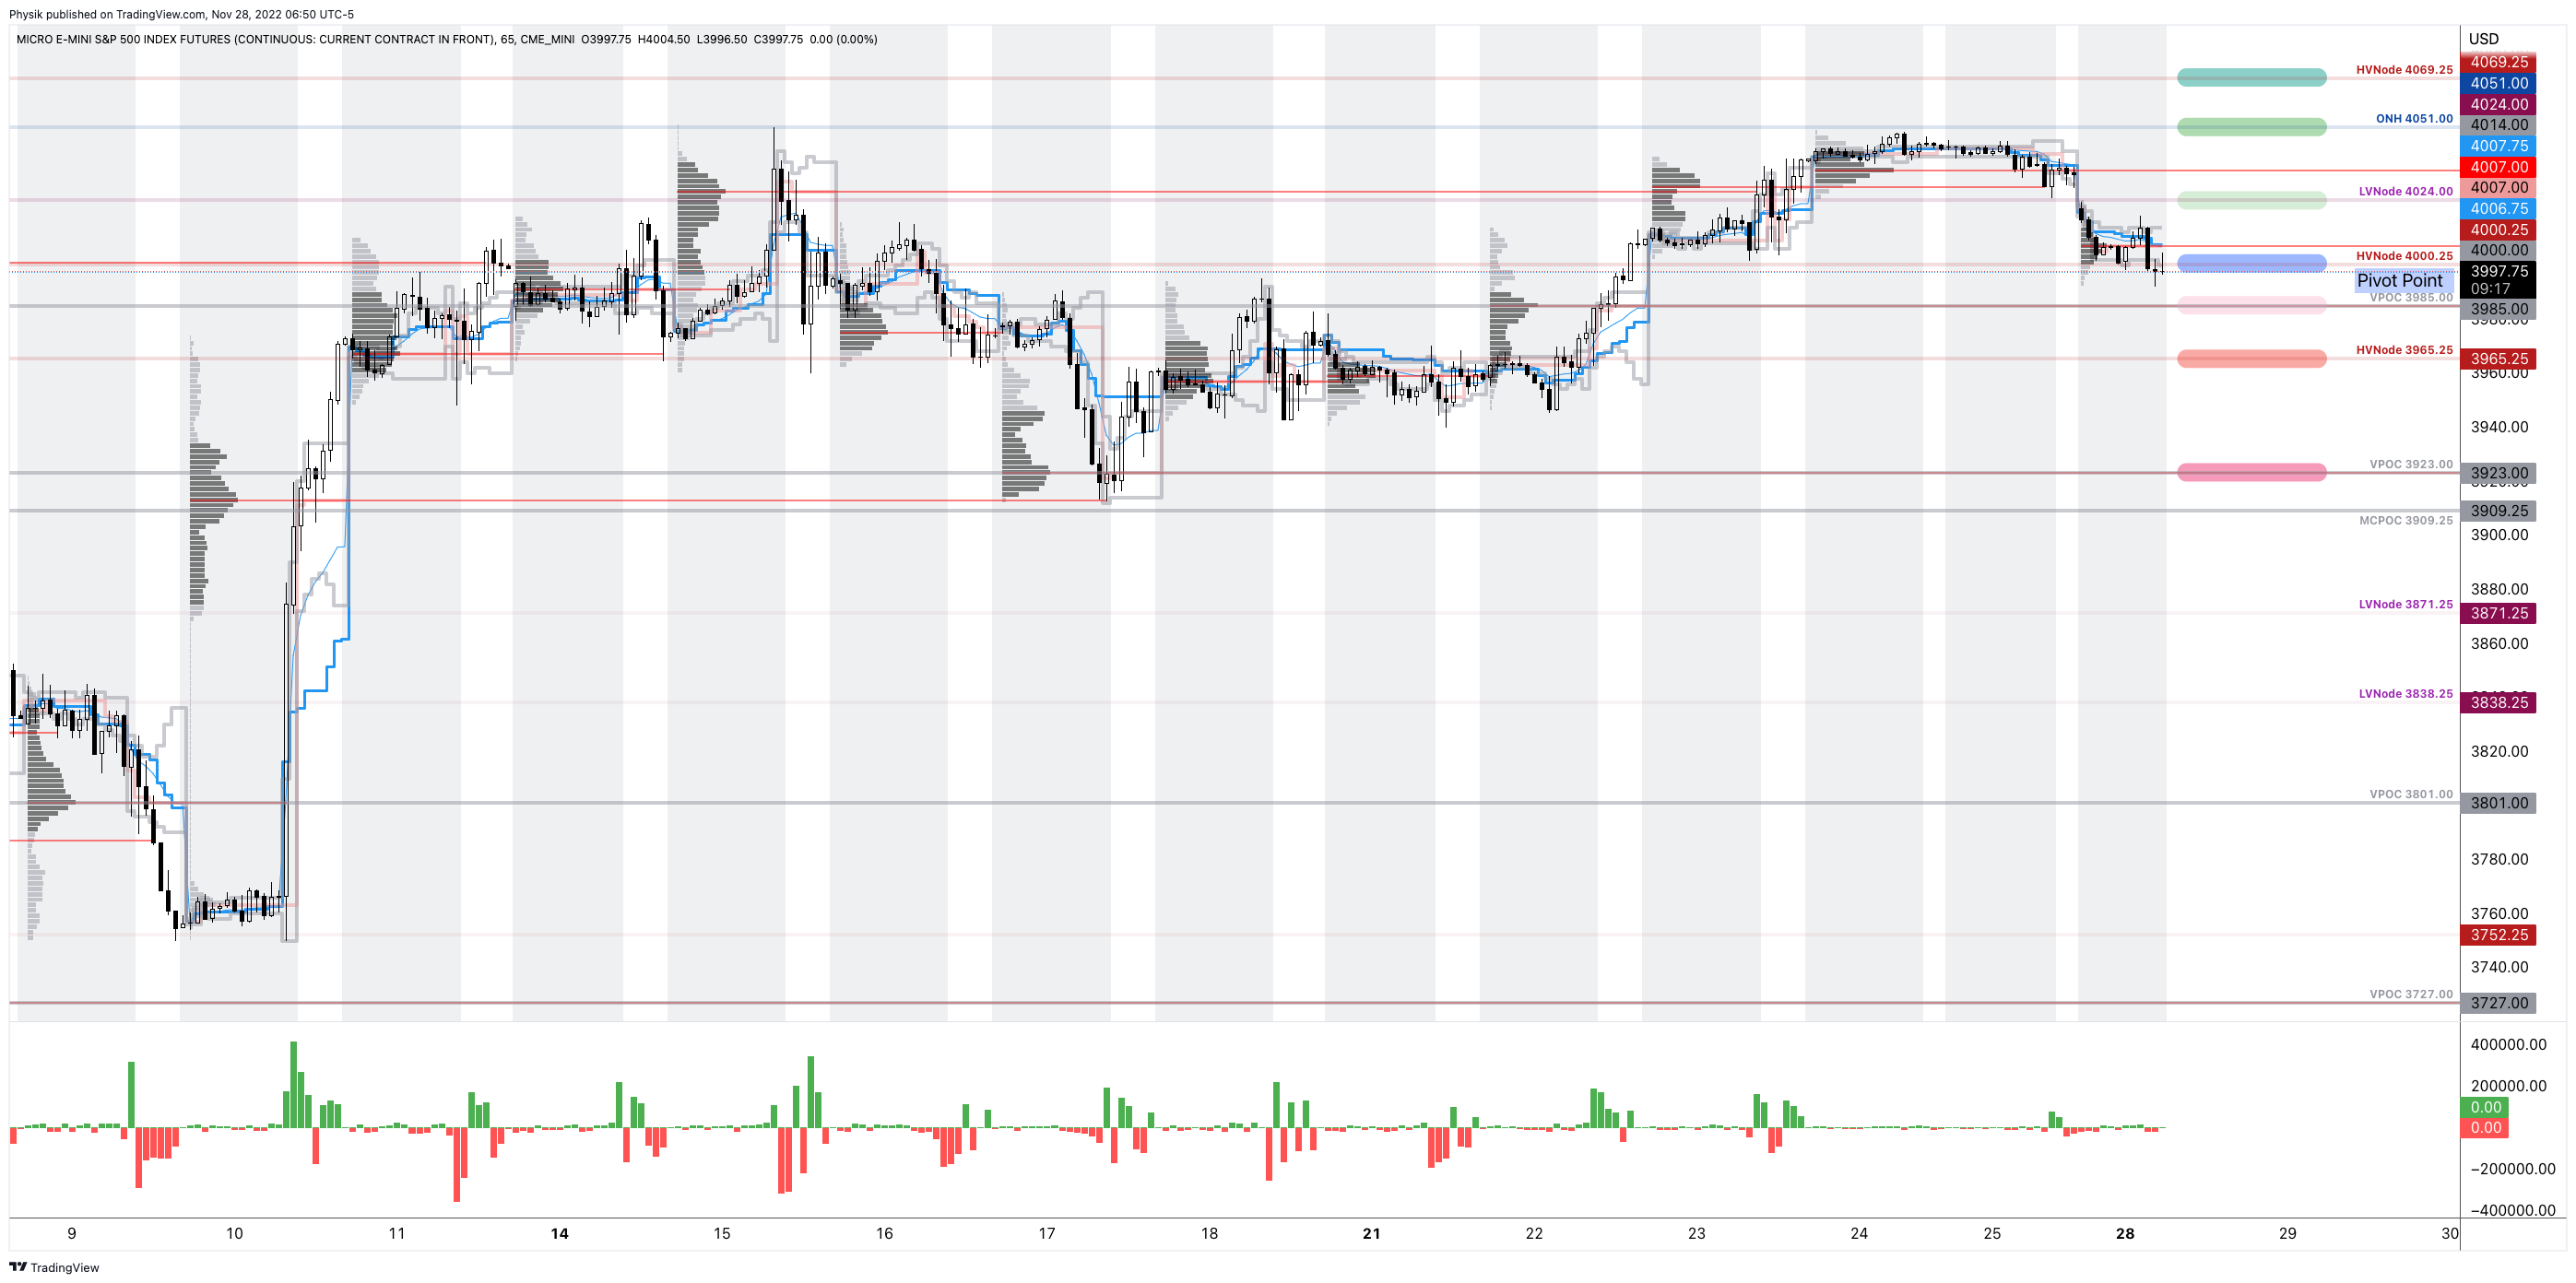
As of 6:45 AM ET, Monday’s regular session (9:30 AM – 4:00 PM ET), in the S&P 500, is likely to open in the lower part of a negatively skewed overnight inventory, outside of prior-range and -value, suggesting a potential for immediate directional opportunity.
Our S&P 500 pivot for today is $4,000.25.
Key levels to the upside include $4,024.00, $4,051.00, and $4,069.25.
Key levels to the downside include $3,985.00, $3,965.25, and $3,923.00.
Click here to load today’s key levels into the web-based TradingView platform. All levels are derived using the 65-minute timeframe. New links are produced, daily.
Graphic: 65-minute profile chart of the Micro E-mini S&P 500 Futures.
Definitions
Overnight Rally Highs (Lows): Typically, there is a low historical probability associated with overnight rally-highs (lows) ending the upside (downside) discovery process.
Volume Areas: A structurally sound market will build on areas of high volume (HVNodes). Should the market trend for long periods of time, it will lack sound structure, identified as low volume areas (LVNodes). LVNodes denote directional conviction and ought to offer support on any test.
If participants were to auction and find acceptance into areas of prior low volume (LVNodes), then future discovery ought to be volatile and quick as participants look to HVNodes for favorable entry or exit.
POCs: POCs are valuable as they denote areas where two-sided trade was most prevalent in a prior day session. Participants will respond to future tests of value as they offer favorable entry and exit.
MCPOCs: POCs are valuable as they denote areas where two-sided trade was most prevalent over numerous day sessions. Participants will respond to future tests of value as they offer favorable entry and exit.
About
After years of self-education, strategy development, mentorship, and trial-and-error, Renato Leonard Capelj began trading full-time and founded Physik Invest to detail his methods, research, and performance in the markets.
Capelj also writes options market analyses at SpotGamma and is a Benzinga journalist.
The daily brief is a free glimpse into the prevailing fundamental and technical drivers of U.S. equity market products. Join the 300+ that read this report daily, below!
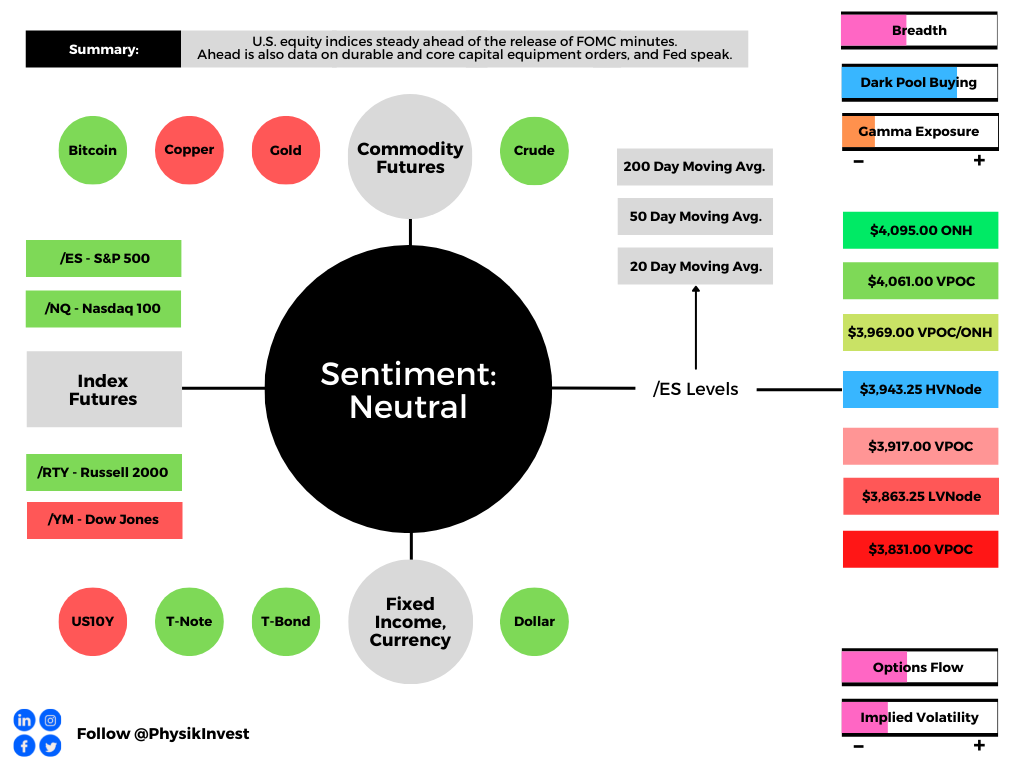
Overnight, equity index futures were steady alongside commodities and bonds. This is ahead of the release of minutes from a Federal Reserve (Fed) policy meeting.
In the news were advertising and social media firms. Snap Inc (NYSE: SNAP) warned of slower growth and deterioration in the macro-environment. Its peers Meta Platforms Inc (NASDAQ: FB), Alphabet Inc (NASDAQ: GOOGL), and Twitter Inc (NYSE: TWTR) also saw weakness.
China’s COVID Zero commitment likely nudges it off a path to achieve economic targets “by a large margin for the first time ever,” as Bloomberg explains.
This is as China and Russia have conducted one of their largest joint air drills “to send their own political, economic and military message to the international community,” much of which is at Davos, Switzerland doing thought exercises.
In a recent podcast, Pippa Malmgren, who is a former White House adviser and economist, well said, particularly in reference to some of the tension abroad, that “autocracy is not working well,” and “[y]ou go to war because … you have a domestic objective.”
Thought it was interesting. Give it a listen, here.
And, finally, Michael Burry of the “Big Short” sent a cryptic tweet alluding to what is likely the risk of another financial collapse.
Moreover, ahead is data on durable goods and core capital equipment orders (8:30 AM ET). Later, the Fed publishes the minutes of its last policy meeting (2:00 PM ET).
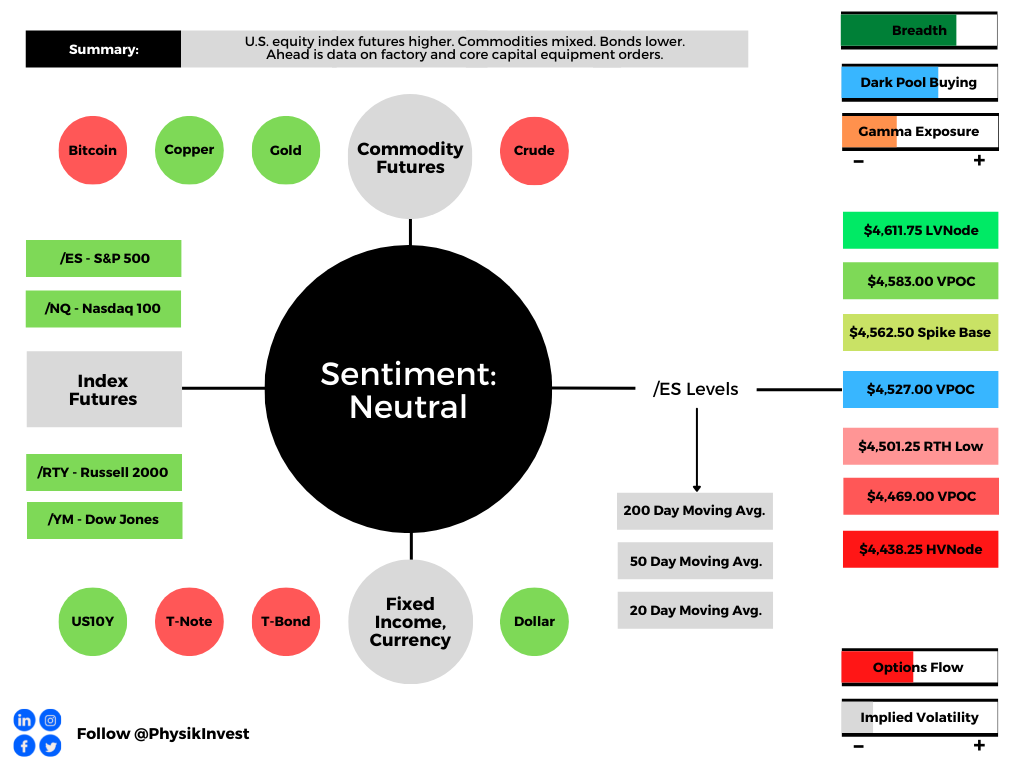
Graphic updated 6:10 AM ET. Sentiment Neutral if expected /ES open is inside of the prior day’s range. /ES levels are derived from the profile graphic at the bottom of the following section. Levels may have changed since initially quoted; click here for the latest levels. SqueezeMetrics Dark Pool Index (DIX) and Gamma (GEX) calculations are based on where the prior day’s reading falls with respect to the MAX and MIN of all occurrences available. A higher DIX is bullish. At the same time, the lower the GEX, the more (expected) volatility. Learn the implications of volatility, direction, and moneyness. SHIFT data used for S&P 500 (INDEX: SPX) options activity. Note that options flow is sorted by the call premium spent; if more positive, then more was spent on call options. Breadth reflects a reading of the prior day’s NYSE Advance/Decline indicator. VIX reflects a current reading of the CBOE Volatility Index (INDEX: VIX) from 0-100.
What To Expect
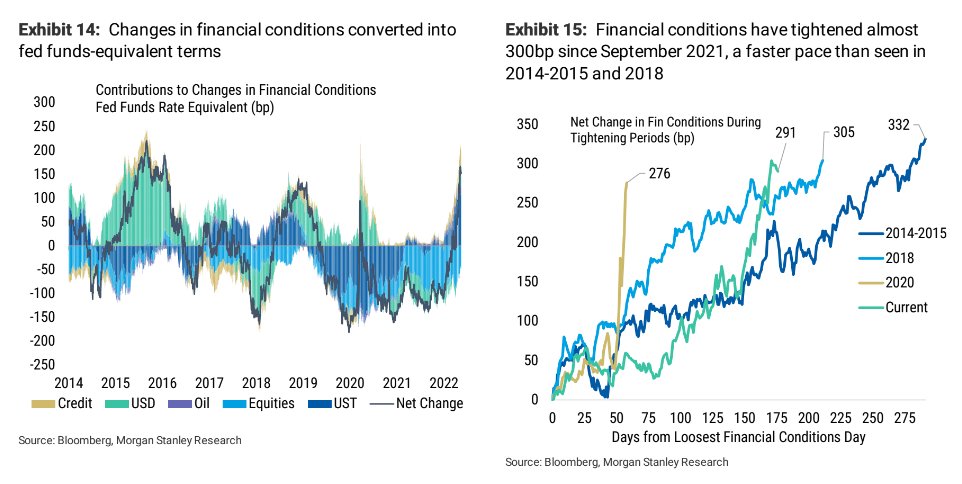
Fundamental: The Fed will issue policy meeting minutes that may provide clarity with respect to its intent to hike and reduce the size of its balance sheet.
In focus, per ex-Fed insider Ellen Meade, is “the rate path, the expected economic conditions, and what policymakers want to see from the data before they slow the pace of tightening.”
“The minutes may tell us they see the tightening in conditions this time around as greater than in earlier cycles. If that’s the case, then they may judge that they don’t need to raise the funds rate by as much this time around.”
Graphic: Via Morgan Stanley (NYSE: MS) research.
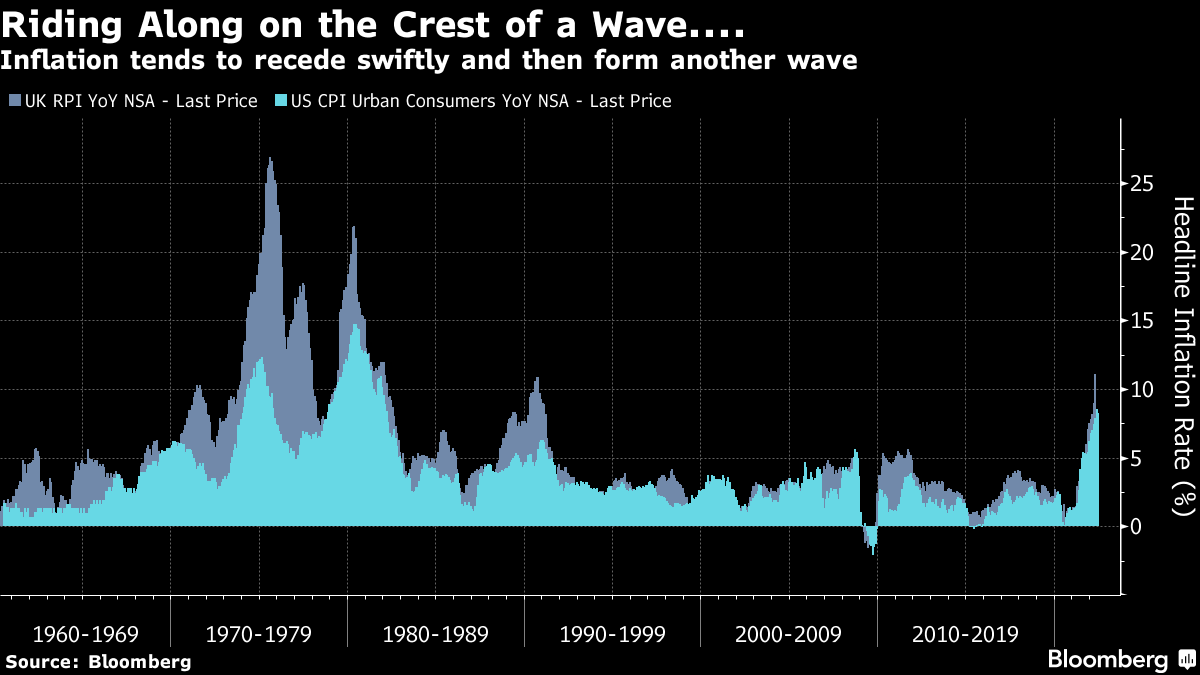
John Authers notes, however, that “inflation tends to move in waves” and it doesn’t, usually, “plateau and stay there.”
“That suggests that even though the focus is already shifting to whether there is evidence of a growth slowdown,” he added, in a statement echoed by Meade who is betting on slower “GDP growth, below its longer-run rate, and a rise in the unemployment rate, perhaps to its longer-run median rate or slightly above.”
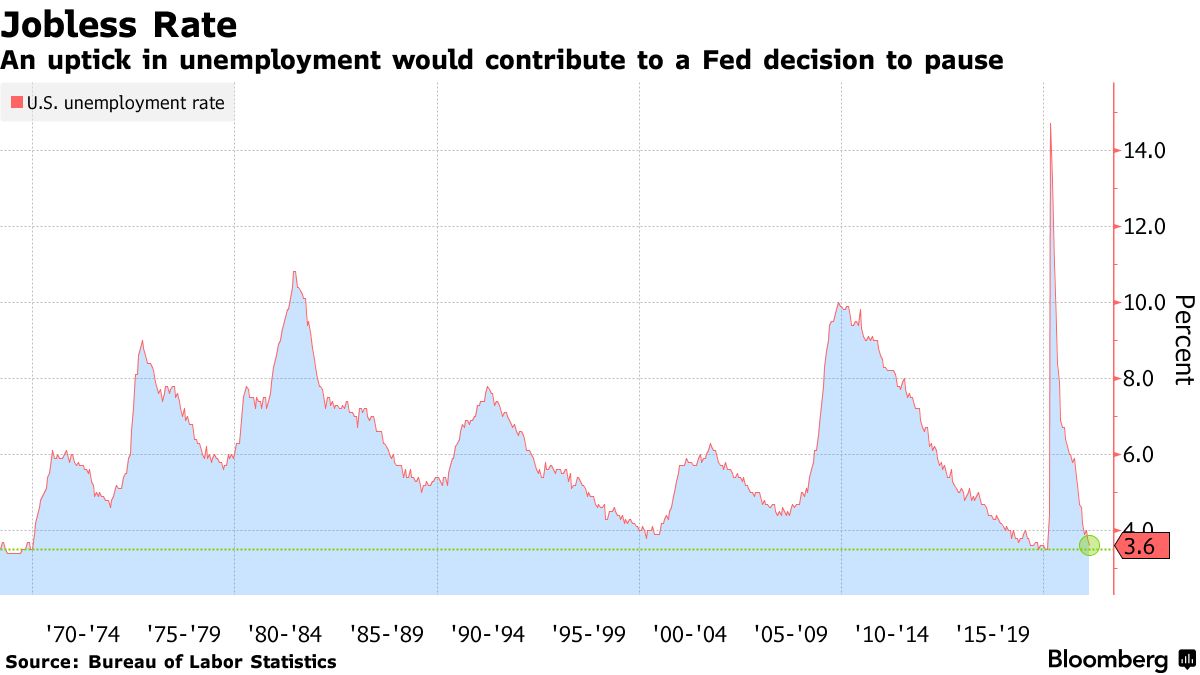
Pursuant to those last remarks, the Fed’s Raphael Bostic is already floating a pause to rate hikes near September if inflation falls more than expected over the summer.
As Diane Swonk of Grant Thorton explains, “Policy works with a lag. The Fed wants to catch up but not outrun the market in its effort to tighten credit market conditions.”
Graphic: Via Bloomberg.
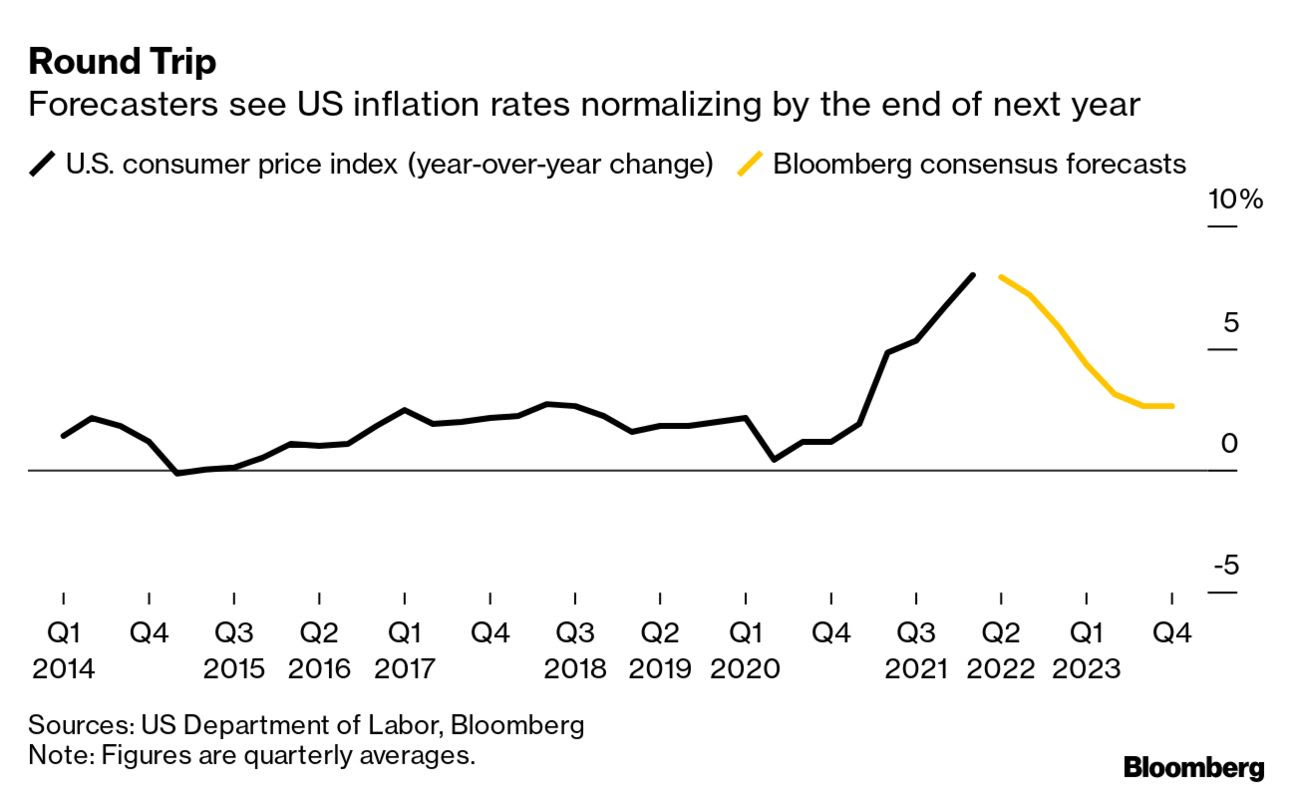
Futures First analyst Rishi Mishra, who is also the author of the “On Another Note” newsletter, suggests the Federal Open Market Committee may, rather, hone in on monthly changes with annual inflation still elevated.
“This brings down inflation expectations into a range where the Fed feels comfortable about de-anchoring risks,” Mishra said.
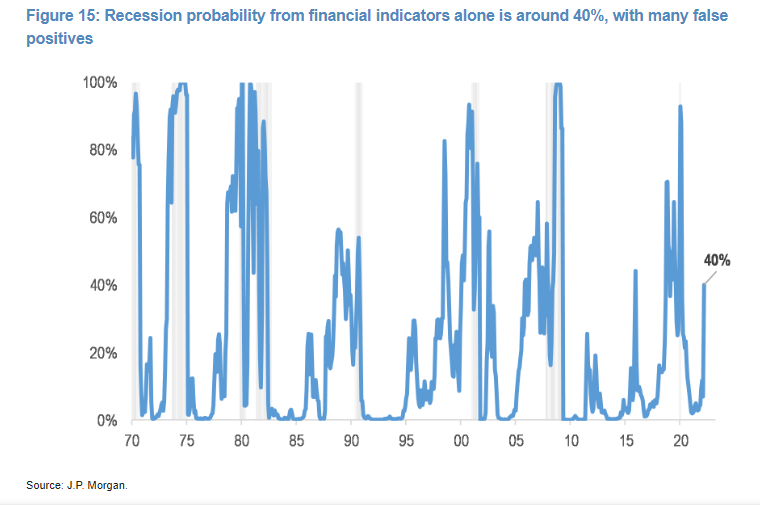
Graphic: Via JPMorgan Chase & Co (NYSE: JPM). Taken from Bloomberg. Though, potentially, “premature,” JPM’s model tracking the S&P 500, credit spreads and yield curve implies a 40% chance of a recession.
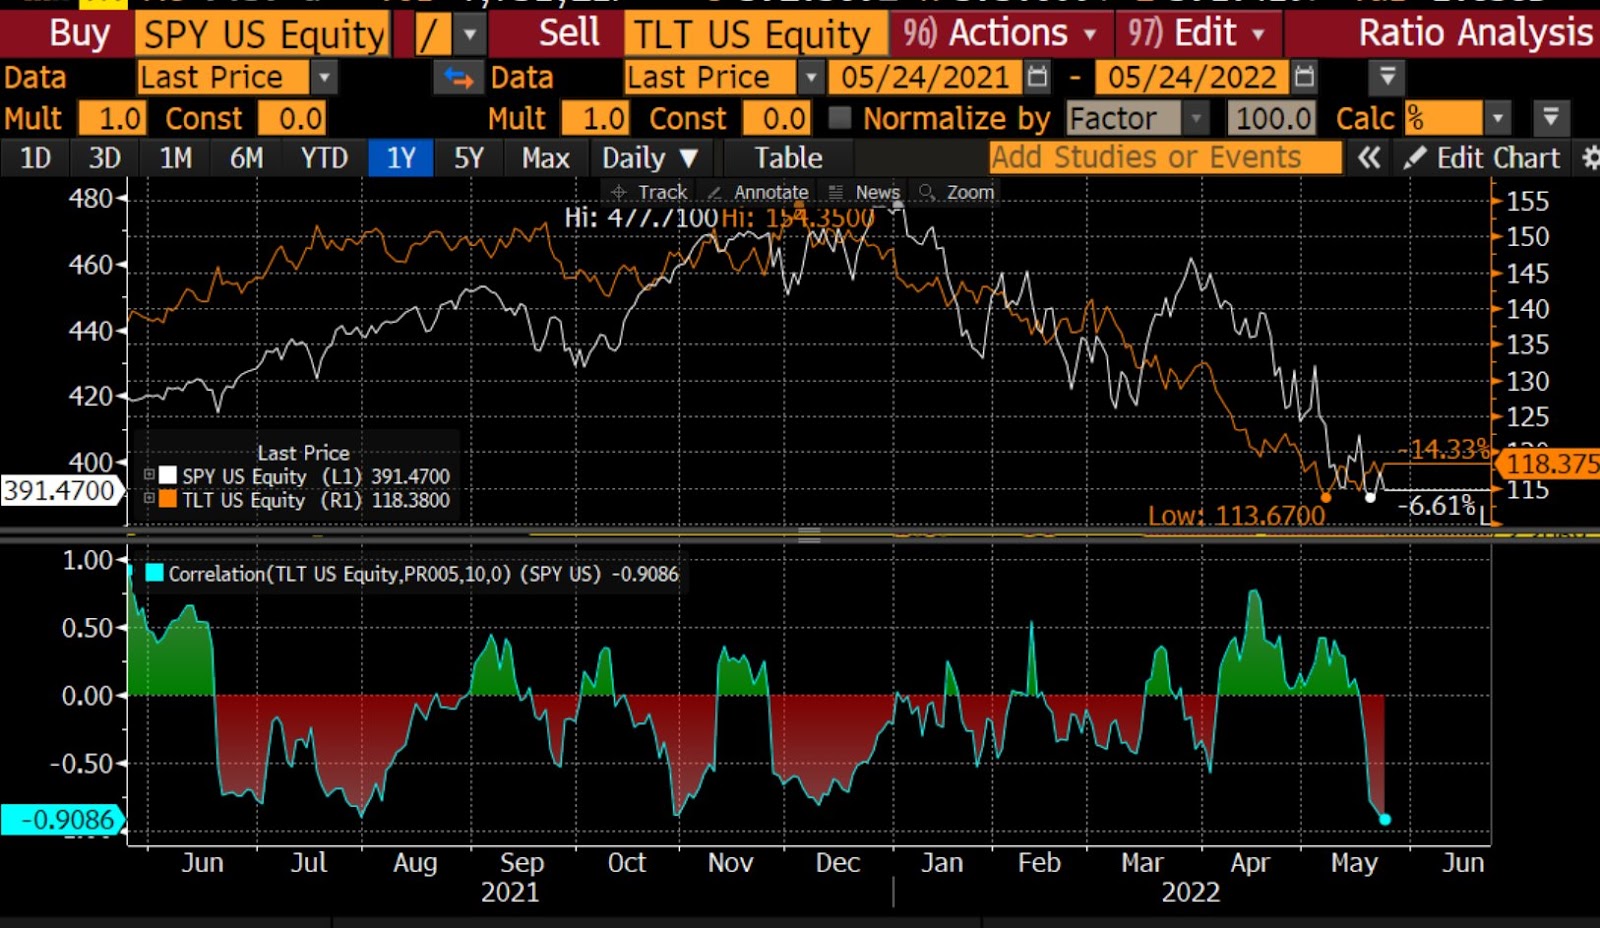
JPM’s Marko Kolanovic adds: “We have gone from a situation where both stocks and bonds were sold on the back of de-leveraging, to a situation where bonds rallied as stocks fell, nudging stock/bond correlations toward a more normal (negative) level.”
“We do indeed think this is where things could be gradually heading, but we acknowledge this is not likely to play out in a linear way.”
Graphic: Via @MrBlonde_macro. “Stock/bond correlation negative over the last 10 days. Some ‘normalization’ in cross-market relationships can be a source of relief.” The flip happened with 10-year yields at or above 3%.
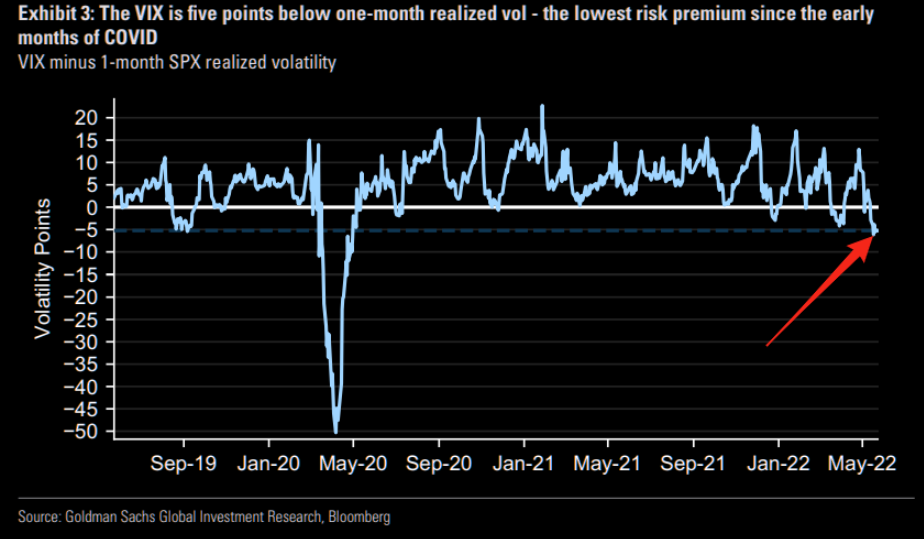
Positioning: In yesterday’s in-depth write-up, we talked about the underperformance of implied volatility (IVOL), relative to that which is realized (RVOL).
Dennis Davitt of Millbank Dartmoor Portsmouth had explained that the “RVOL of the underlying S&P 500 is above 27% … with IVOL of options trading between 24%-27%,” which translates to a VIX at 30%.
Graphic: Via Goldman Sachs Group Inc (NYSE: GS). Taken from The Market Ear.
So, essentially, it makes more sense to have exposure to underlying markets, synthetically (i.e., own options).
This, though, merits a bit more clarification (as I do not want it to be construed as if I was buying, systemically, bets on the downside). The opposite, actually.
Moreover, this was stated in the context of a market that is “(1) stretched and (2) near a critical inflection which we see at $3,700.00 SPX,” per SpotGamma. Separately, investors are bidding “skew on the call side” amid their “fear of missing on the upside.”
That’s when it makes sense to buy closer to at-the-money (ATM) and sell farther from ATM, or out-of-the-money (OTM). For instance, a margin intensive but low cost call +1 [ATM] x -2 [OTM] ratio spread.
Note, however, that width and timing are everything. Too much time or too narrow may result in asymmetric losses when the demand for upside bets further out in price and time bids the skew that you’re short, relative to the at-the-money volatility you own.

I’m willing to talk through this via email, if interested. Ping me at renato@physikinvest.com. I’m mindful that if I do post actual trade ideas, people may take them without knowing how to size and manage them, accordingly. Big yikes!
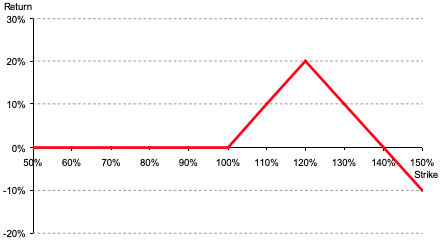
Goldman validates this thesis: “Even though the VIX’s reaction to recent spot downside has been mild, its high starting point leaves vol high overall, and we like strategies with a short volatility bias, including put selling and 1×2 call spread overlays.”
Graphic: Via Banco Santander SA (NYSE: SAN) research, the return profile, at expiry, of a classic 1×2 (long 1, short 2 further away) ratio spread.
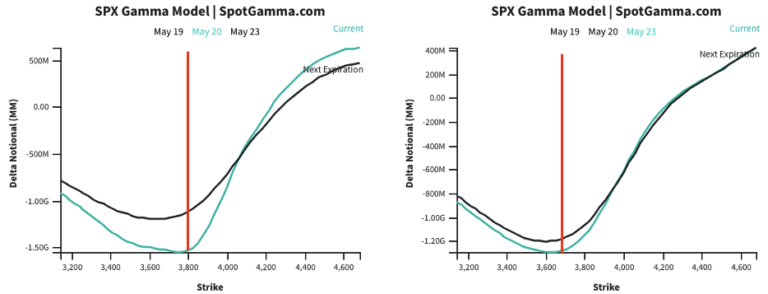
Further, though SpotGamma assigns an edge to lower prices until the June FOMC and OPEX, “markets (which are already ‘fully loaded’ with puts) [are likely] pressured by liquidity providers’ hedging [at most] down to $3,700.00,” the area where that added pressure from hedging cools.
Graphic: Via SpotGamma.
Technical: As of 6:15 AM ET, Wednesday’s regular session (9:30 AM – 4:00 PM ET), in the S&P 500, will likely open in the lower part of a balanced overnight inventory, just inside of prior-range and -value, suggesting a limited potential for immediate directional opportunity.
In the best case, the S&P 500 trades higher; activity above the $3,943.25 HVNode puts in play the $3,969.00 ONH. Initiative trade beyond the ONH could reach as high as the $4,061.00 VPOC and $4,095.00 ONH, or higher.
In the worst case, the S&P 500 trades lower; activity below the $3,943.25 HVNode puts in play the $3,917.00 VPOC. Initiative trade beyond the VPOC could reach as low as the $3,863.25 LVNode and $3,831.00 VPOC, or lower.
Click here to load today’s key levels into the web-based TradingView charting platform. Note that all levels are derived using the 65-minute timeframe. New links are produced, daily.
Graphic: 65-minute profile chart of the Micro E-mini S&P 500 Futures.
Considerations: Push-and-pull, as well as responsiveness near key-technical areas (discernable visually on a chart), suggests technically-driven traders with shorter time horizons are very active.
Such traders often lack the wherewithal to defend retests.
Large participants (who often move by committee) seldom respond to key technical inflections. It is their activity that often results in poor reliability of our technical levels.
Sometimes, the better trade is to wait for the larger participants’ entry and use the expansion of the range as a confirmation of a new trend.
Catalysts to consider include the release of Federal Open Market Committee (FOMC) minutes, Wednesday.
Definitions
Overnight Highs And Lows (ONH and ONL): Typically, there is a low historical probability associated with overnight rally-highs (lows) ending the upside (downside) discovery process.
Volume Areas: A structurally sound market will build on areas of high volume (HVNodes). Should the market trend for long periods of time, it will lack sound structure, identified as low volume areas (LVNodes). LVNodes denote directional conviction and ought to offer support on any test.
If participants were to auction and find acceptance into areas of prior low volume (LVNodes), then future discovery ought to be volatile and quick as participants look to HVNodes for favorable entry or exit.
POCs: POCs are valuable as they denote areas where two-sided trade was most prevalent in a prior day session. Participants will respond to future value tests as they offer favorable entry and exit.
About
After years of self-education, strategy development, mentorship, and trial-and-error, Renato Leonard Capelj began trading full-time and founded Physik Invest to detail his methods, research, and performance in the markets.
Capelj also develops insights around impactful options market dynamics at SpotGamma and is a Benzinga reporter.
In no way should the materials herein be construed as advice. Derivatives carry a substantial risk of loss. All content is for informational purposes only.
The Daily Brief is a free glimpse into the prevailing fundamental and technical drivers of U.S. equity market products. Join the 200+ that read this report daily, below!
Editor’s Note: Hey team, thanks again for your reading of this daily newsletter. Due to travel commitments, I will not be writing reports consistently for the rest of this month.
Don’t expect any updates until Monday, April 11, 2022. Thereafter, coverage may be sporadic for the rest of the month.
What Happened
Overnight, equity index futures were higher after exploring lower, briefly. Commodities were mixed while bonds were lower and implied volatility measures were bid.
In terms of news, the European Union said it was interested in penalizing Russia, further, for its actions in Ukraine. This is as China battles new COVID-19 sub-strains.
Ahead is data on factory and core capital equipment orders (10:00 AM ET).
Graphic updated 5:45 AM ET. Sentiment Neutral if expected /ES open is inside of the prior day’s range. /ES levels are derived from the profile graphic at the bottom of the following section. Levels may have changed since initially quoted; click here for the latest levels. SqueezeMetrics Dark Pool Index (DIX) and Gamma (GEX) calculations are based on where the prior day’s reading falls with respect to the MAX and MIN of all occurrences available. A higher DIX is bullish. At the same time, the lower the GEX, the more (expected) volatility. Learn the implications of volatility, direction, and moneyness. SHIFT data used for S&P 500 (INDEX: SPX) options activity. Note that options flow is sorted by the call premium spent; if more positive, then more was spent on call options. Breadth reflects a reading of the prior day’s NYSE Advance/Decline indicator. VIX reflects a current reading of the CBOE Volatility Index (INDEX: VIX) from 0-100.
What To Expect
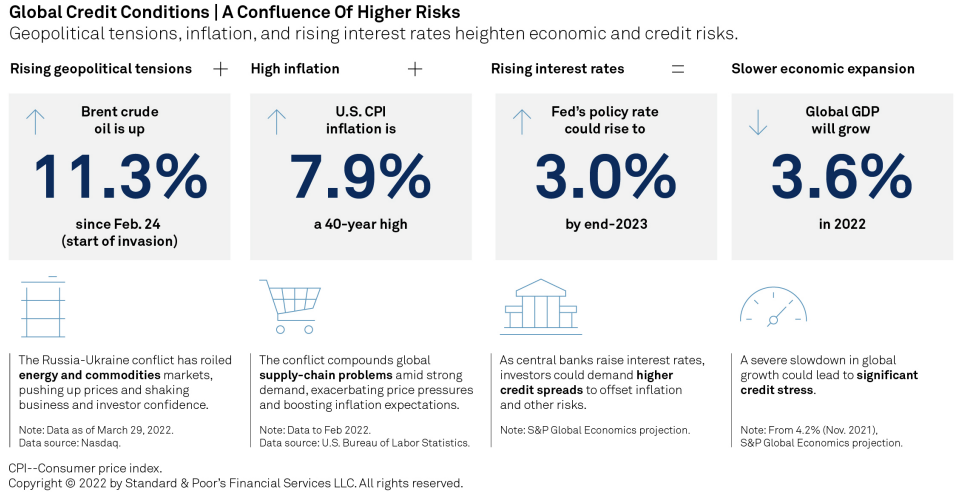
Fundamental: In the face of geopolitical tension, supply pressures, and inflation, consumer sentiment is at or below pandemic levels, prompting the Federal Reserve (Fed) to destimulate.
Graphic: Via S&P Global Inc (NYSE: SPGI) research. “Confluence Of Risks Halts Positive Credit Momentum.
“It has entered 2008-09 territory and is not far from all-time lows in the ‘80s when inflation and interest rates hit double digits,” ARK Invest’s Catherine Wood explained in a Twitter discussion on yield-curve inversions and aggressive action by the Federal Reserve, as well as inflation.
“The economy succumbed to recession in each of those periods. Europe and China are also in difficult straits. The Fed seems to be playing with fire.”
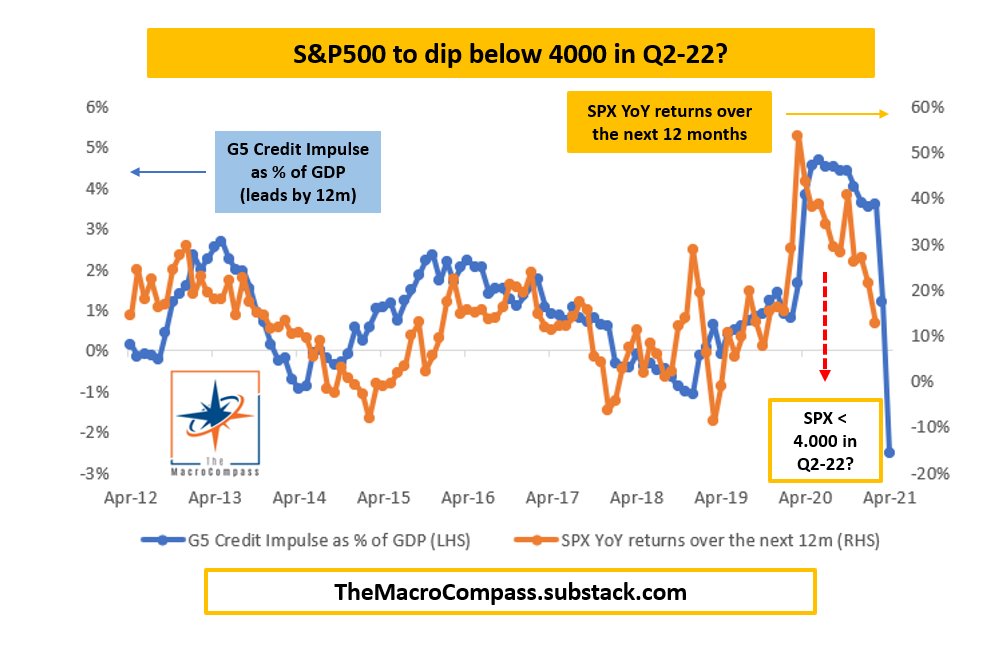
In accordance, the Macro Compass’ Alfonso Peccatiello explains that his credit impulse metrics, which lead economic activity and risk asset performance, imply a slowdown in earnings.
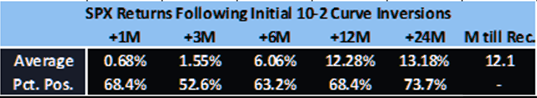
Still, in spite of these metrics, on average, recessions happen 12 to 24 months after the first yield curve inversions, according to Jefferies Financial Group Inc (NYSE: JEF).
Post-inversion S&P 500 performance, actually, is often positive.
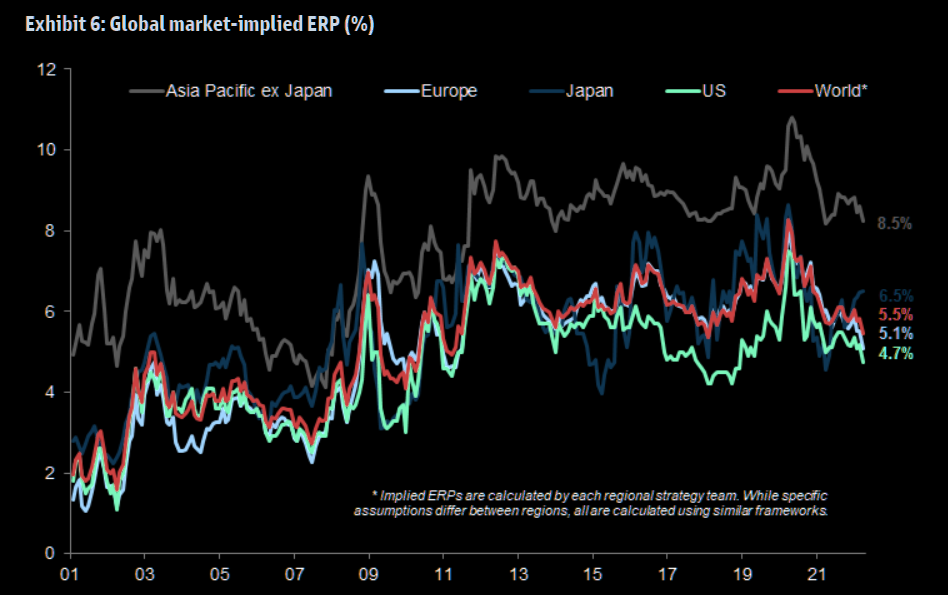
Bolstering the call for positive equity market performance are strong seasonality trends during Fed-rate-hike episodes, a contraction in equity risk premia, and “still accommodative” monetary policy, per explanations by rates strategist Rishi Mishra.
Graphic: Via Goldman Sachs Group Inc (NYSE: GS). Taken from The Market Ear. “Equities are a real asset as they make a claim on nominal GDP. In the post-financial crisis era, weak economic activity and lower inflation pushed down nominal GDP, raising the equity risk premium and reducing the bond term premium. So as long as economies grow, revenues and dividends should also grow. The dividend yield can be thought of as a real yield. Equity risk premia have started to decline in the post COVID cycle but remain higher than in the pre-financial crisis era.”
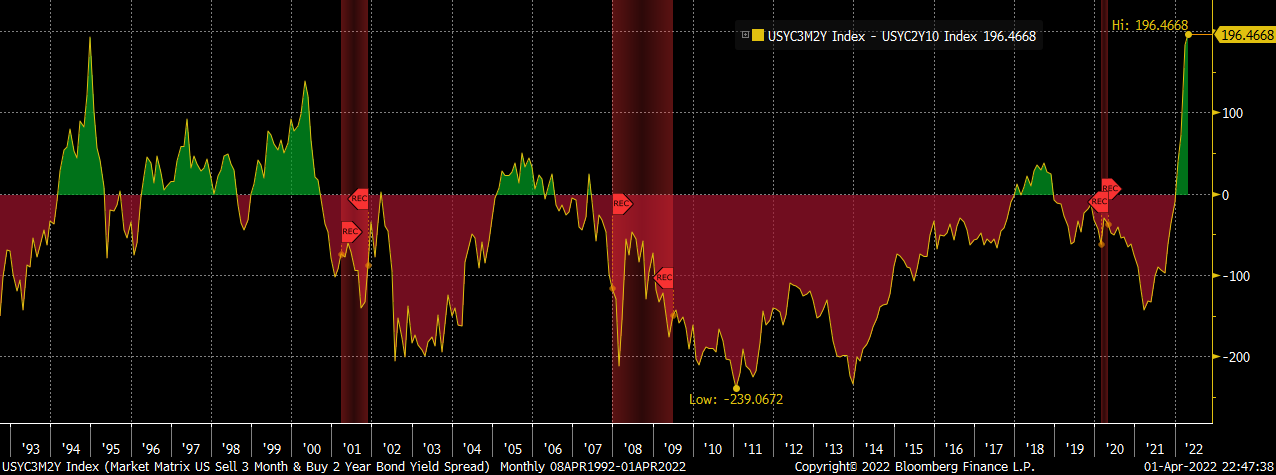
“[T]he 3ms2s vs 2s10s spread (or the 3m2s10s fly) is the widest it has been since the end of 1994. The widening of this fly is indicative of the fact that while the Fed shifted its guidance from dovish to extremely hawkish, the policy is still accommodative.”
Positioning: The equity market’s ferocious end-of-March rally, which placed the S&P 500 back above a key go/no-go level – the 200-period simple moving average – may have been in part the result of institutional investors purchasing equities ahead of quarterly reporting.
“Remember that stocks settle T+2, meaning that shares are actually owned by buyers two business days after they are purchased in the market,” says Interactive Brokers’ Group Inc (NASDAQ: IBKR) Steve Sosnick.
“That means that institutions who wanted to show stock positions on their quarterly reports would have needed to purchase those shares no later than Tuesday the 29th. The sharp end-of-day runups that we saw on Monday and Tuesday had the hallmarks of aggressive institutional buying.”
According to Deutsche Bank AG (NYSE: DB) analyses, “[a]ggregate equity positioning has now risen off the lows but only to the 22nd percentile and is still well below neutral.”
That said, quarter-end rebalances and options expirations (OPEX) likely do little to upset the balance of trade. Based on a lot of the insights shared in this letter, barring some exogenous event, the market is in a position to drift or balance.
This, as a result, may solicit a “stronger impulse to chase the rally,” at which point JPMorgan Chase & Co (NYSE: JPM) strategists say they would “generally be more concerned.”
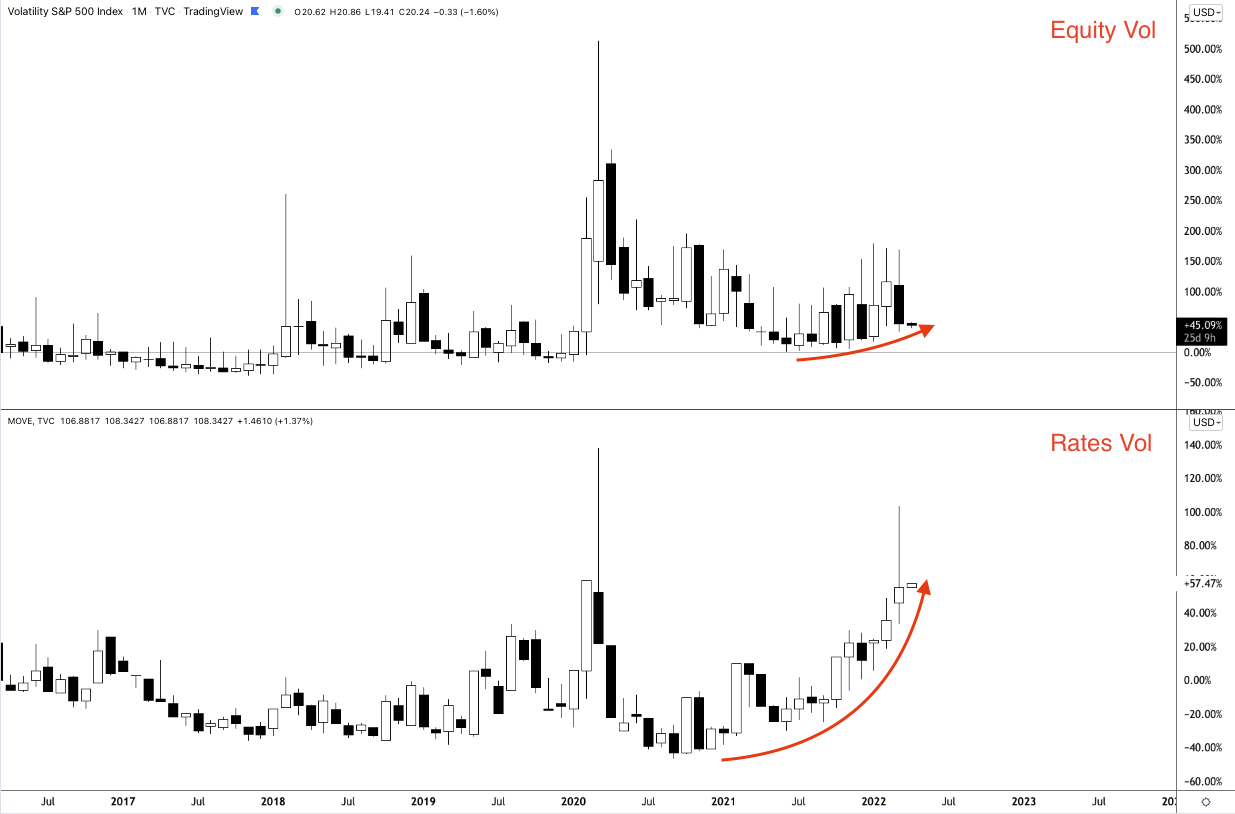
A collapse (or convergence) in volatility metrics for different asset classes (like the Merrill Lynch Options Volatility Estimate [INDEX: MOVE] and Cboe Volatility Index [INDEX: VIX]) would bolster the “drift or balance” thesis.
Graphic: Via Physik Invest.
Technical: As of 5:45 AM ET, Monday’s regular session (9:30 AM – 4:00 PM ET), in the S&P 500, will likely open in the upper part of a positively skewed overnight inventory, inside of prior-range and -value, suggesting a limited potential for immediate directional opportunity.
In the best case, the S&P 500 trades higher; activity above the $4,527.00 untested point of control (VPOC) puts in play the $4,562.50 spike base. Initiative trade beyond the spike base could reach as high as the $4,583.00 VPOC and $4,611.75 low volume area (LVNode), or higher.
In the worst case, the S&P 500 trades lower; activity below the $4,527.00 VPOC puts in play the $4,501.25 regular trade low (RTH Low). Initiative trade beyond the RTH Low could reach as low as the $4,469.00 VPOC and $4,438.25 HVNode, or lower.
Considerations: Spikes often mark the beginning of a break from value. Spikes higher (lower) are validated by trade at or above (below) the spike base (i.e., the origin of the spike).
In a spike up (down) situation, trade below (above) the spike base, negates the buying (selling).
Click here to load today’s key levels into the web-based TradingView charting platform. Note that all levels are derived using the 65-minute timeframe. New links are produced, daily.
Graphic: 65-minute profile chart of the Micro E-mini S&P 500 Futures.
The price strength in the SP500 lately has been impressive. But it is not even being confirmed (yet) by a higher high in the HY Bond A-D Line. That is less than impressive. pic.twitter.com/6X6DlXksol
Volume Areas: A structurally sound market will build on areas of high volume (HVNodes). Should the market trend for long periods of time, it will lack sound structure, identified as low volume areas (LVNodes). LVNodes denote directional conviction and ought to offer support on any test.
If participants were to auction and find acceptance into areas of prior low volume (LVNodes), then future discovery ought to be volatile and quick as participants look to HVNodes for favorable entry or exit.
POCs: POCs are valuable as they denote areas where two-sided trade was most prevalent in a prior day session. Participants will respond to future tests of value as they offer favorable entry and exit.
About
After years of self-education, strategy development, mentorship, and trial-and-error, Renato Leonard Capelj began trading full-time and founded Physik Invest to detail his methods, research, and performance in the markets.
Capelj also develops insights around impactful options market dynamics at SpotGamma and is a Benzinga reporter.
In no way should the materials herein be construed as advice. Derivatives carry a substantial risk of loss. All content is for informational purposes only.
Editor’s Note: The Daily Brief is a free glimpse into the prevailing fundamental and technical drivers of U.S. equity market products. Join the 200+ that read this report daily, below!
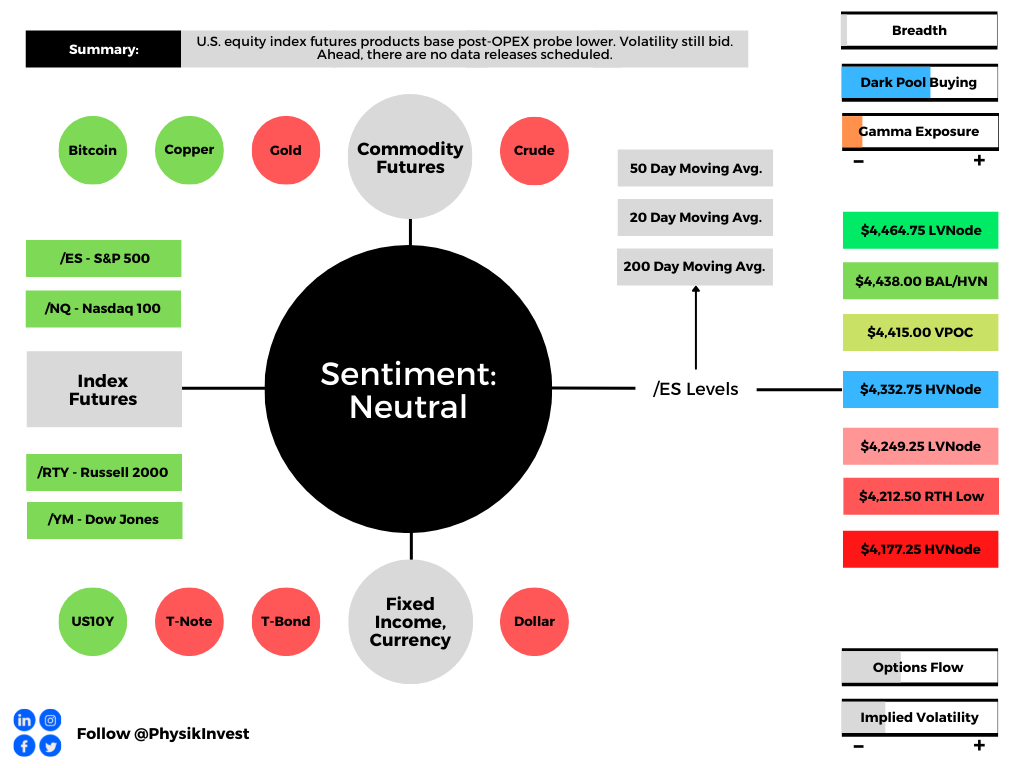
Overnight, equity index futures traded sideways to higher after Monday’s post-options expiration (OPEX) probe lower. Ahead, there are no data releases scheduled.
Graphic updated 6:15 AM ET. Sentiment Neutral if expected /ES open is inside of the prior day’s range. /ES levels are derived from the profile graphic at the bottom of the following section. Levels may have changed since initially quoted; click here for the latest levels. SqueezeMetrics Dark Pool Index (DIX) and Gamma (GEX) calculations are based on where the prior day’s reading falls with respect to the MAX and MIN of all occurrences available. A higher DIX is bullish. At the same time, the lower the GEX, the more (expected) volatility. Learn the implications of volatility, direction, and moneyness. SHIFT data used for S&P 500 (INDEX: SPX) options activity. Note that options flow is sorted by the call premium spent; if more positive, then more was spent on call options. Breadth reflects a reading of the prior day’s NYSE Advance/Decline indicator. VIX reflects a current reading of the CBOE Volatility Index (INDEX: VIX) from 0-100.
What To Expect
Fundamental: At what point are monetary tightening and geopolitical tensions priced in?
According to some strategists, such as JPMorgan Chase & Co’s (NYSE: JPM) Marko Kolanovic, the sell-off is overdone and, if anything, Ukraine tensions “would likely prompt a dovish reassessment.”
“Short-term rates markets have likely moved too far vs. what CBs will ultimately deliver in hikes this year,” he adds. “We expect risky asset markets to rebound as they digest these risks and sentiment improves, aided by inflows from systematic investors and corporate buybacks.”
In the worst case, though, pursuant to notes by peers in the industry, Kolanovic nods to the fact that if selling were to continue, there would likely be a point the would Fed reassess tightening.
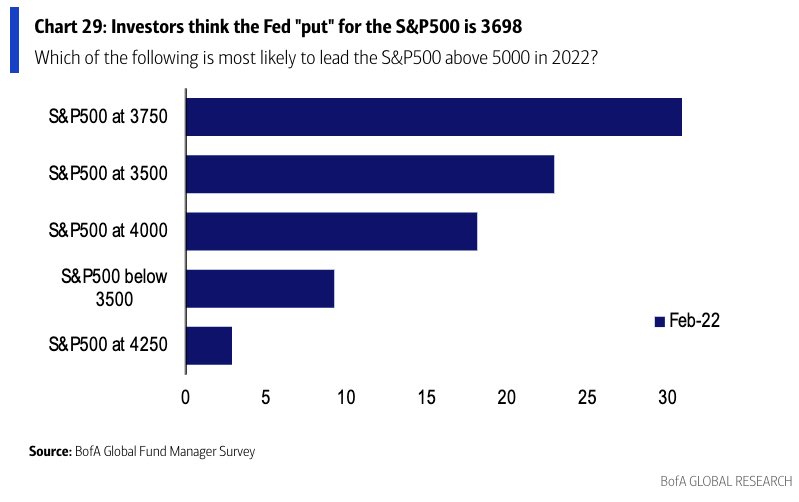
Basically, in the worst case, there is the potential that further selling invokes the so-called “Fed put,” which is about 15% below current prices.
“[R]isk is being repriced to fit the world where real rates are a lot higher, and the Fed put (is) much lower thanks to the Fed’s need to fight inflation,” says rates strategist Rishi Mishra.
Graphic: Via Bank of America Corporation (NYSE: BAC). Retrieved from Callum Thomas.
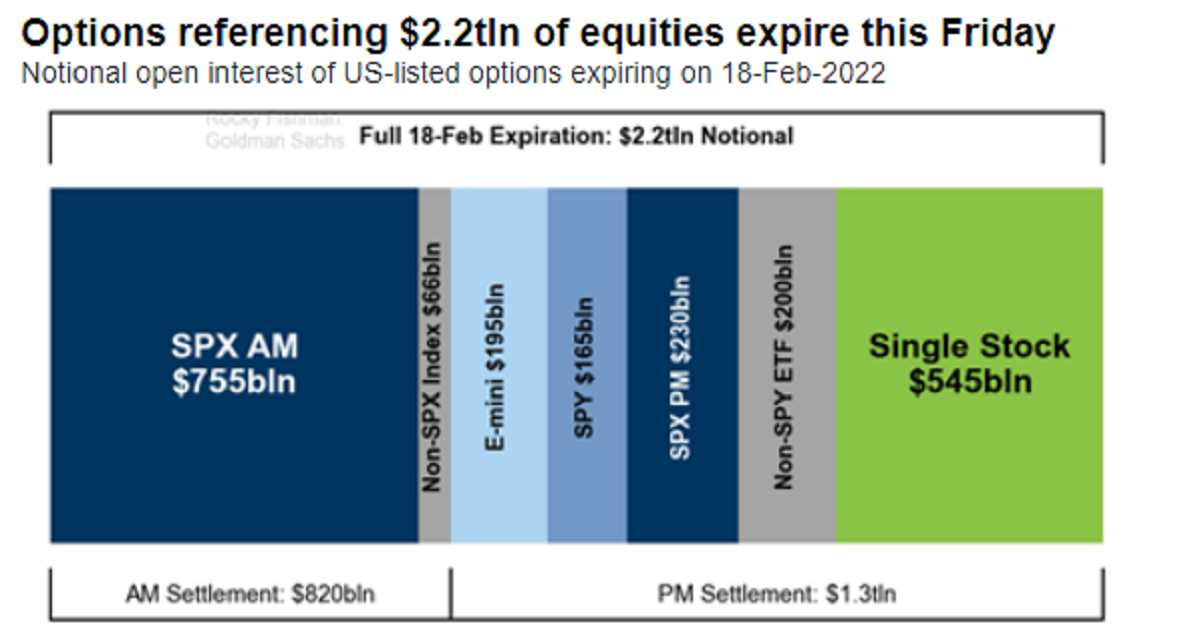
Positioning: Markets stabilize after last week’s large monthly options expiration (OPEX).
Graphic: Via Goldman Sachs Group Inc (NYSE: GS). Taken from Bloomberg.
Per Bloomberg, that event saw the roll-off of nearly $2.2 trillion in options. In the past, this event had bullish implications (i.e., markets rose into OPEX). That is not the case, really, any longer.
It is participants’ increased awareness of the implications of options and OPEX has resulted in a front running; according to SqueezeMetrics, “People didn’t know about the OpEx week effect (in this case, largely charm). Now everyone and their mother knows about it.”
For context, charm is a measure of an options delta’s change with respect to the passage of time. As time passes, delta “bleeds” as options decay.
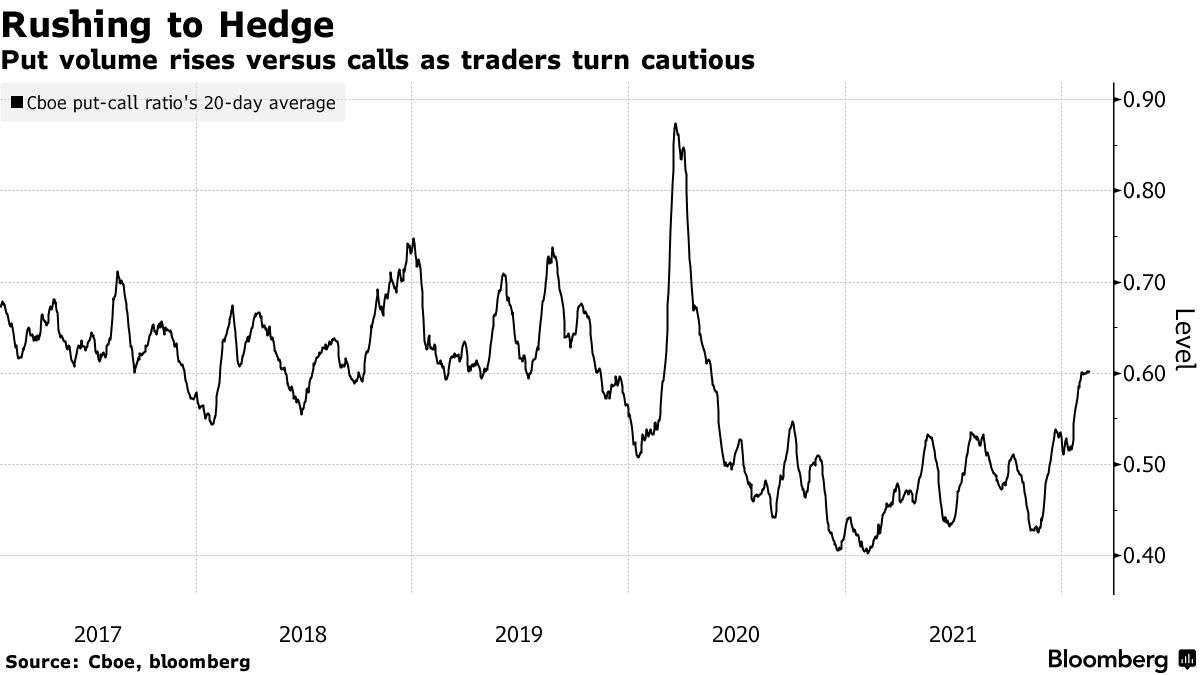
As most participants, at least at the index level, own protection, the counterparties to this trade are short protection. These counterparties, therefore, have positive exposure to delta (i.e., as index falls [rises], position loses [makes] money) and negative exposure to gamma, or delta (directional) sensitivity to underlying price changes (i.e., as the index moves against short option exposure, losses are multiplied).
Moreover, given the growth of options volumes, participants’ heavy demand for protection matters more, to put simply. Counterparties, in light of this recent drop, pressured markets with their hedging. The decay (and eventual expiry) of this protection marks options deltas down.
Graphic: Rising put volumes coincide with early 2022 market sell-off.
To re-hedge, counterparties buy back short stock and futures hedges. This supportive action is what has been front-run; the bullishness of the event happens days and weeks prior.
The unwind of these hedges now, as seen Friday-Tuesday, often culminates in a post-OPEX low. That “means chase-y accelerant flows from dealer hedging into moves and creating overshoots in both directions,” Nomura Holdings Inc’s (NYSE: NMR) Charlie McElligott wrote.
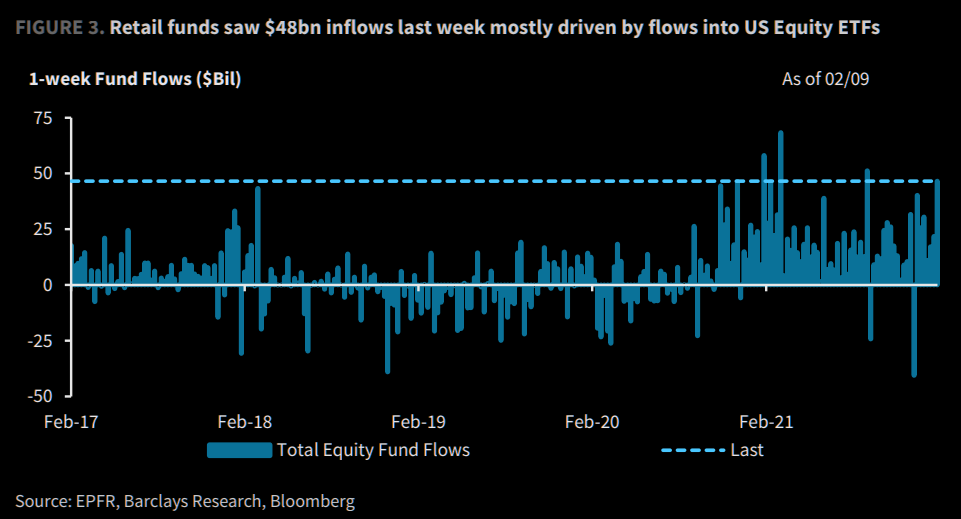
Taken together, according to SpotGamma, though “post-OPEX, the removal of linear short (-delta) hedges [to put-heavy exposures] may further bolster attempts higher, … [t]he removal of downside (put) protection may also open the door for weakness in a case where some outside (fundamental) event solicits real-money selling and a new demand for protection.”
Graphic: Via EPFR, Barclays, and Bloomberg. Taken from The Market Ear.
“The market looks fairly well hedged and it’s why up until today we’ve had little follow-through on the downside despite negative headlines,” Danny Kirsch, head of options at Piper Sandler Companies (NYSE: PIPR), said in an interview.
“We’ll see if things open up after the February expiry.”
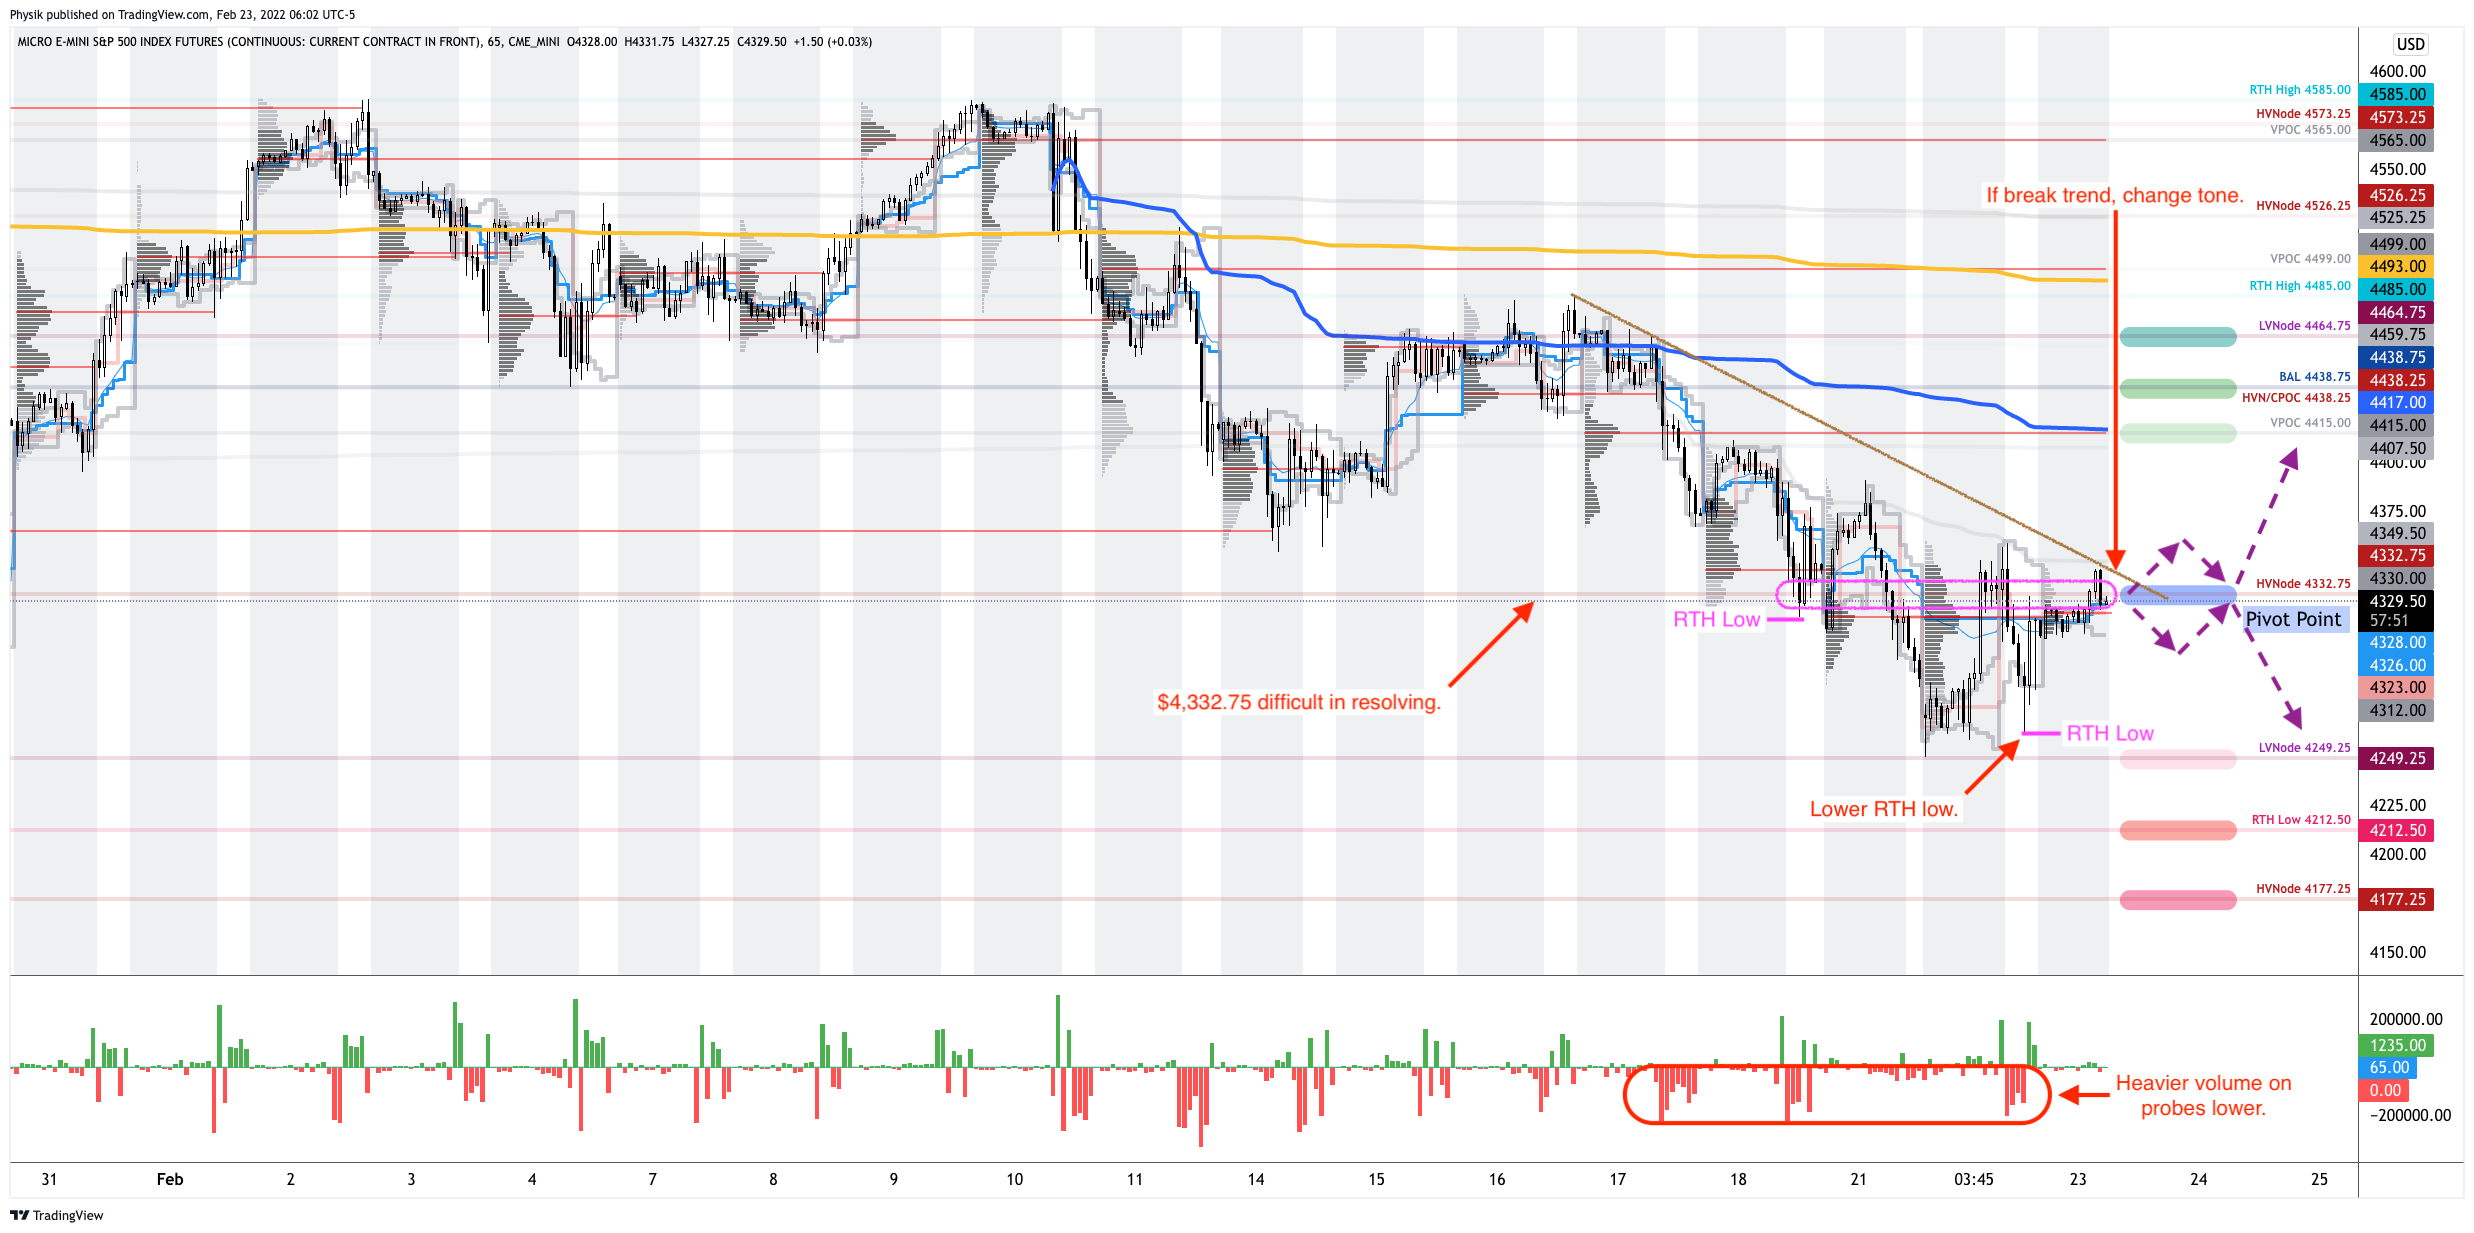
Technical: As of 6:30 AM ET, Wednesday’s regular session (9:30 AM – 4:00 PM ET), in the S&P 500, will likely open in the upper part of its overnight inventory, inside of prior-range and -value, suggesting a limited potential for immediate directional opportunity.
In the best case, the S&P 500 trades higher; activity above the $4,332.75 high volume area (HVNode) puts in play the $4,415.00 untested point of control (VPOC). Initiative trade beyond the VPOC could reach as high as the $4,438.00 key response area and $4,464.00 low volume area (LVNode), or higher.
In the worst case, the S&P 500 trades lower; activity below the $4,332.75 HVNode puts in play the $4,249.00 LVNode. Initiative trade beyond the LVNode could reach as low as the $4,212.50 regular trade low (RTH Low) and $4,177.25 HVNode, or lower.
Click here to load today’s key levels into the web-based TradingView charting platform. Note that all levels are derived using the 65-minute timeframe. New links are produced, daily.
Graphic: 65-minute profile chart of the Micro E-mini S&P 500 Futures.
What People Are Saying
Seriously, guys.
The ''bad news = good news'' narrative for markets doesn't work if the Fed is tightening amidst a slowdown and a military escalation risk.
Volume Areas: A structurally sound market will build on areas of high volume (HVNodes). Should the market trend for long periods of time, it will lack sound structure, identified as low volume areas (LVNodes). LVNodes denote directional conviction and ought to offer support on any test.
If participants were to auction and find acceptance into areas of prior low volume (LVNodes), then future discovery ought to be volatile and quick as participants look to HVNodes for favorable entry or exit.
Liquidation Breaks: The profile shape suggests participants were “too” long and had poor
Vanna: The rate at which the delta of an option changes with respect to volatility.
Charm: The rate at which the delta of an option changes with respect to time.
Options: If an option buyer was short (long) stock, he or she would buy a call (put) to hedge upside (downside) exposure. Option buyers can also use options as an efficient way to gain directional exposure.
POCs: POCs are valuable as they denote areas where two-sided trade was most prevalent in a prior day session. Participants will respond to future tests of value as they offer favorable entry and exit.
About
After years of self-education, strategy development, mentorship, and trial-and-error, Renato Leonard Capelj began trading full-time and founded Physik Invest to detail his methods, research, and performance in the markets.
Capelj is also a Benzinga finance and technology reporter interviewing the likes of Shark Tank’s Kevin O’Leary, JC2 Ventures’ John Chambers, FTX’s Sam Bankman-Fried, and ARK Invest’s Catherine Wood, as well as a SpotGamma contributor developing insights around impactful options market dynamics.
Disclaimer
Physik Invest does not carry the right to provide advice.
In no way should the materials herein be construed as advice. Derivatives carry a substantial risk of loss. All content is for informational purposes only.