Physik Invest’s Daily Brief is read by thousands of subscribers. You, too, can join this community to learn about the fundamental and technical drivers of markets.
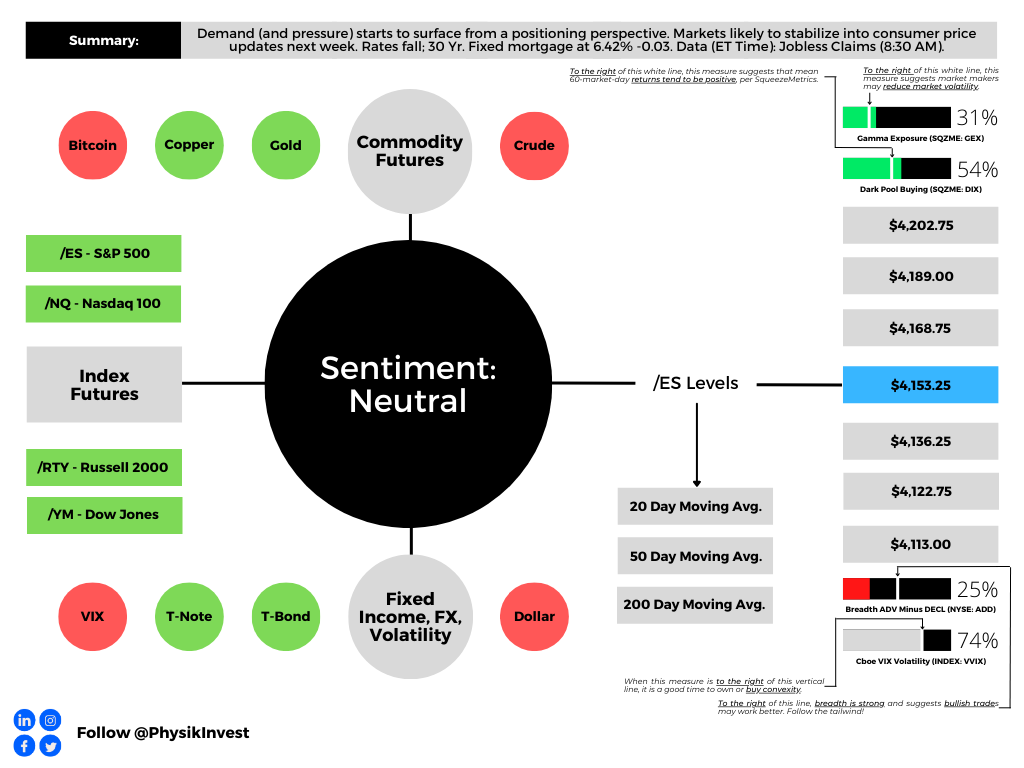
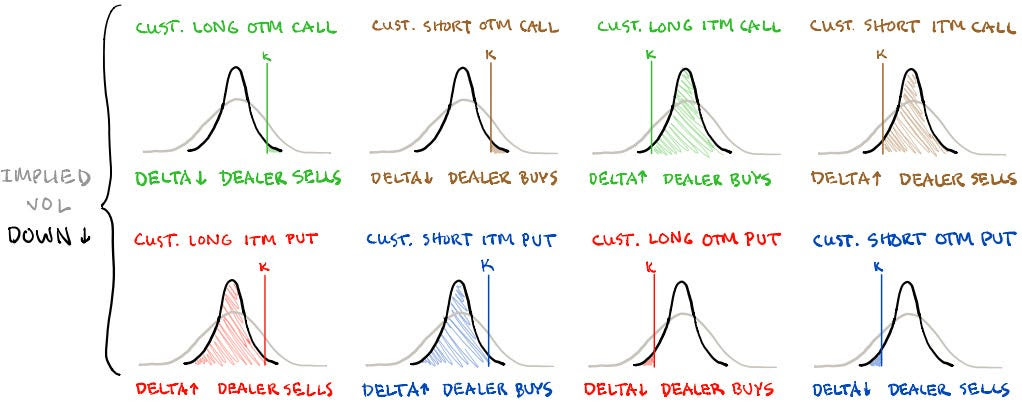
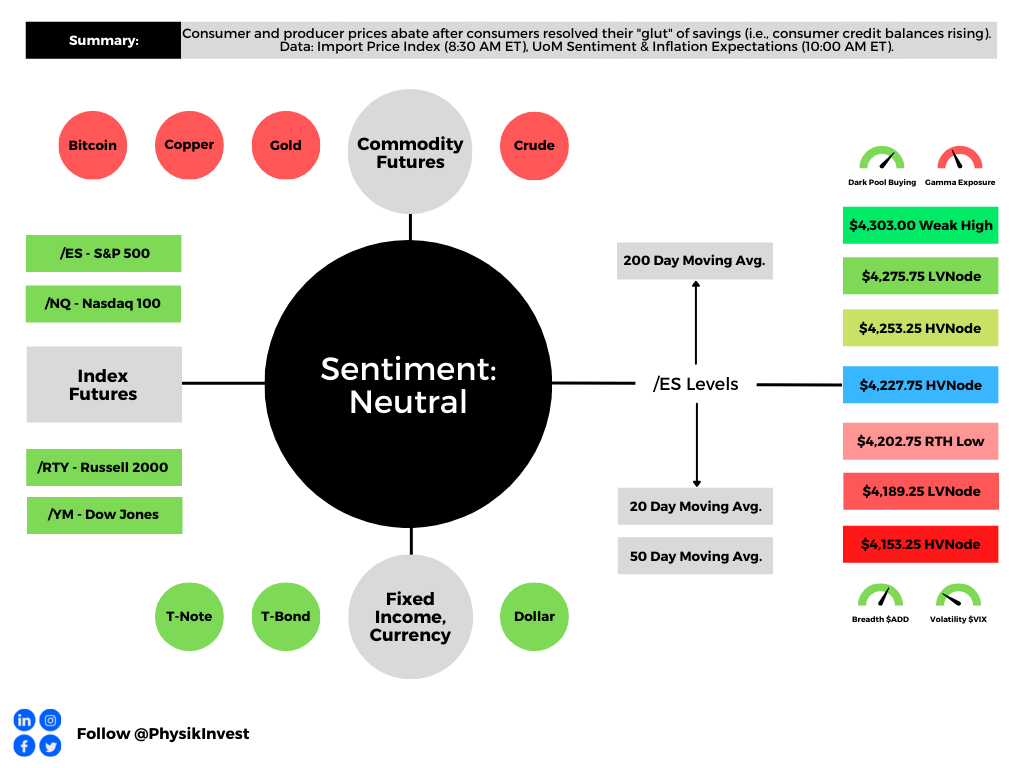
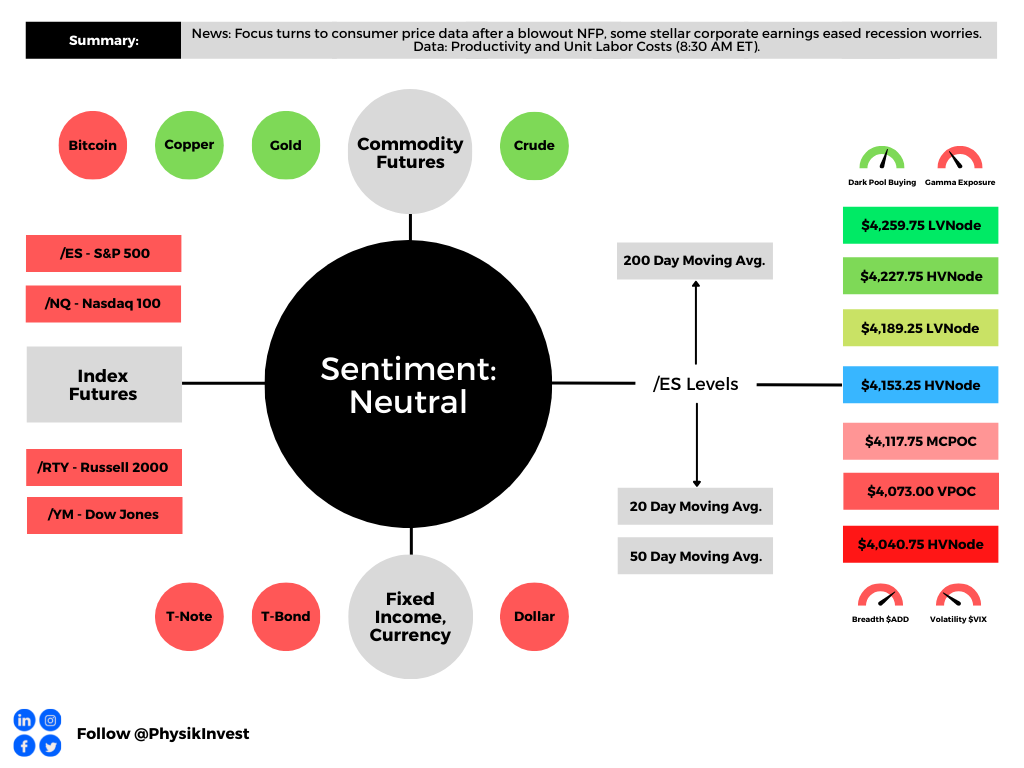
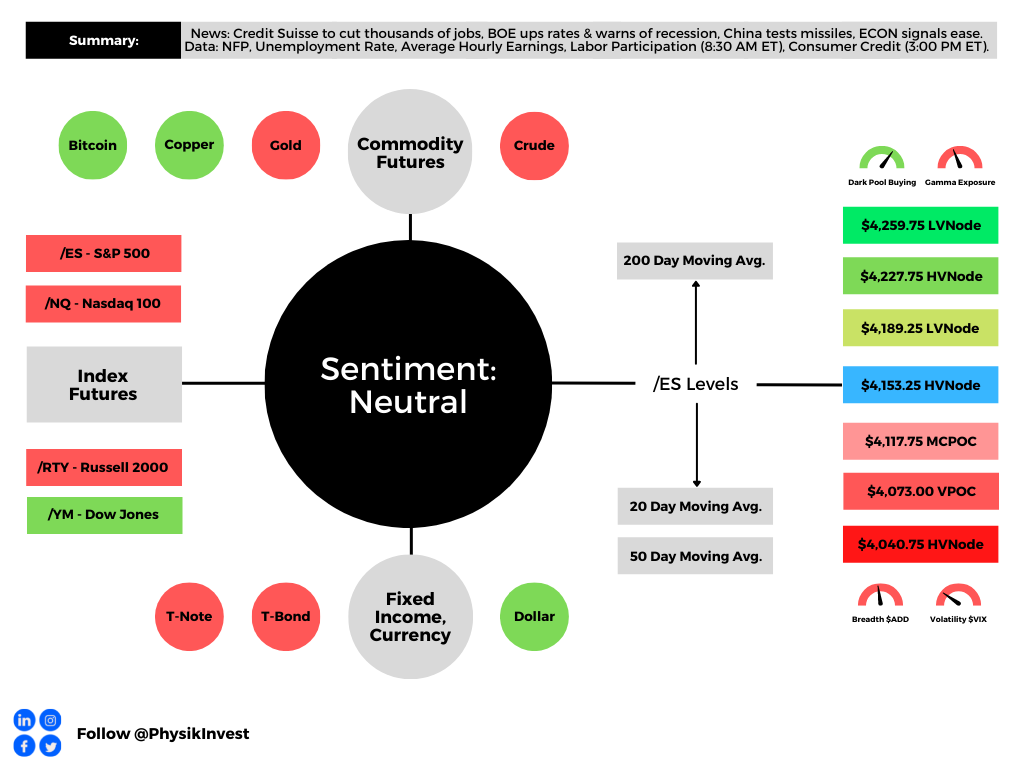
Graphic updated 7:20 AM ET. Sentiment Neutral if expected /ES open is inside of the prior day’s range. /ES levels are derived from the profile graphic at the bottom of this letter. Click here for the latest levels. SqueezeMetrics Dark Pool Index (DIX) and Gamma (GEX) with the latter calculated based on where the prior day’s reading falls with respect to the MAX and MIN of all occurrences available. A higher DIX is bullish. At the same time, the lower the GEX, the more (expected) volatility. Click to learn the implications of volatility, direction, and moneyness. Breadth reflects a reading of the prior day’s NYSE Advance/Decline indicator. The CBOE VIX Volatility Index (INDEX: VVIX) reflects the attractiveness of owning volatility.
Positioning
The cross-cutting forces on inflation are set to net out says Bob Elliott, the CIO at Unlimited. The former Bridgewater Associates executive thinks short-term inflation pressures are skewed upward, and that new data suggests “the respite in inflation … is probably going to fade and higher numbers are going to print.”
In short, disinflation from oil prices and the amelioration of supply chains “cannot persist, and that’s what we’re seeing now. It looks like those upward pressures on inflation are moving faster than the pace that services prices and housing costs are moving down.”
Consequently, there is a potential for broad inflation measures to remain higher for longer, hence the thinking that the Federal Reserve (Fed) indeed stays tougher on inflation for longer (i.e., higher rates for longer). This would support traders’ recent desire to bet large on downside movement next week when the Consumer Price Index (CPI) is set to update.
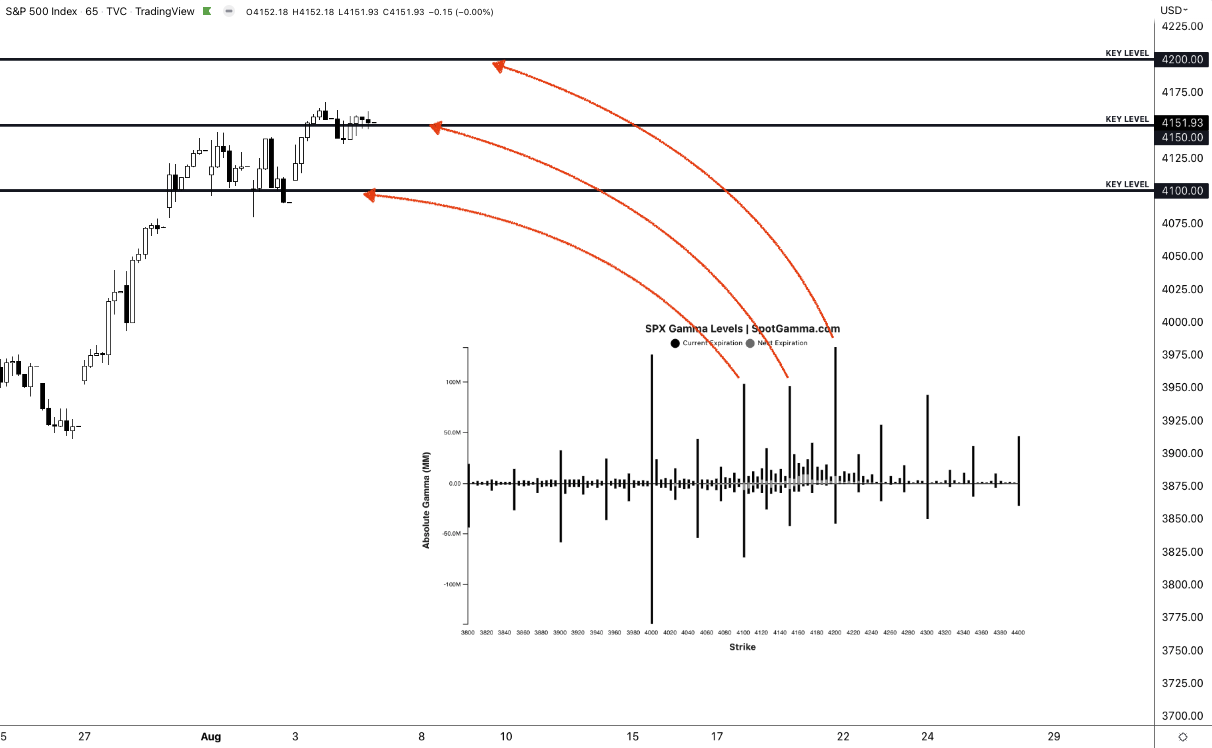
Publicized by Kai Volatility’s Cem Karsan and Damped Spring’s Andy Constan, some trader(s) bought to open 24,000 put options at the $4,050.00 S&P 500 (FUTURE: /ES) strike expiring February 17, 2023. The trade coincided with market makers selling to open “roughly 7,200 [/ES] futures contracts worth roughly $1.5 billion.” This “caused the local low,” Constan, who also worked at Bridgewater (and your letter writer had the honor of interviewing before), explained.
This trade, and others like it, compounded the pressures of the dealers selling their existing stock and futures “to re-hedge their call options exposures that are declining in value.”
Graphic: Retrieved from SqueezeMetrics.
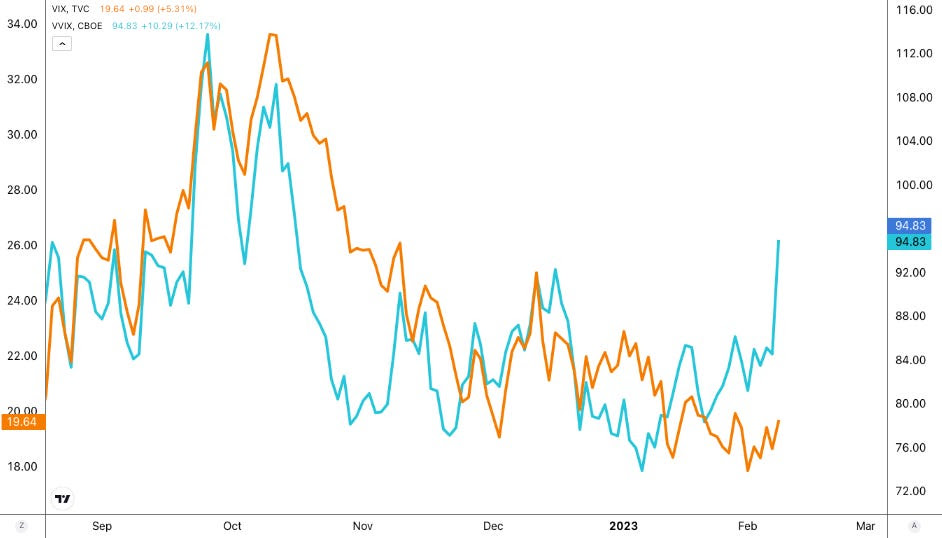
Accordingly, the Cboe Volatility Index (INDEX: VIX) is bid, as is the Cboe VIX Volatility Index (INDEX: VVIX), which your letter writer talked about in a SpotGamma note last night. Basically, traders are hedging more, and this is observed by previously low readings of convexity moving higher. Still, given that there is still some time to CPI, there’s potential for “current prices the SPX trades at [to] appear sticky for lack of better phrasing,” SpotGamma explained; pre-CPI, traders often sell short-term volatility as a bet on limited movement. It’s the post-CPI expirations in which implied volatility (IVOL) is wound and will serve as a catalyst for a fast move higher or lower.
Graphic: Retrieved from TradingView. Blue = VVIX. Orange = VIX.
So, in the short-term, there may be some pinning, followed by an expansion of range into the mid-February (2/17) monthly options expiration (OpEx). This event likely puts the market in a precarious position and at the whims of macro-type repositioning, which may be bearish based on the insights this letter has covered in the past.
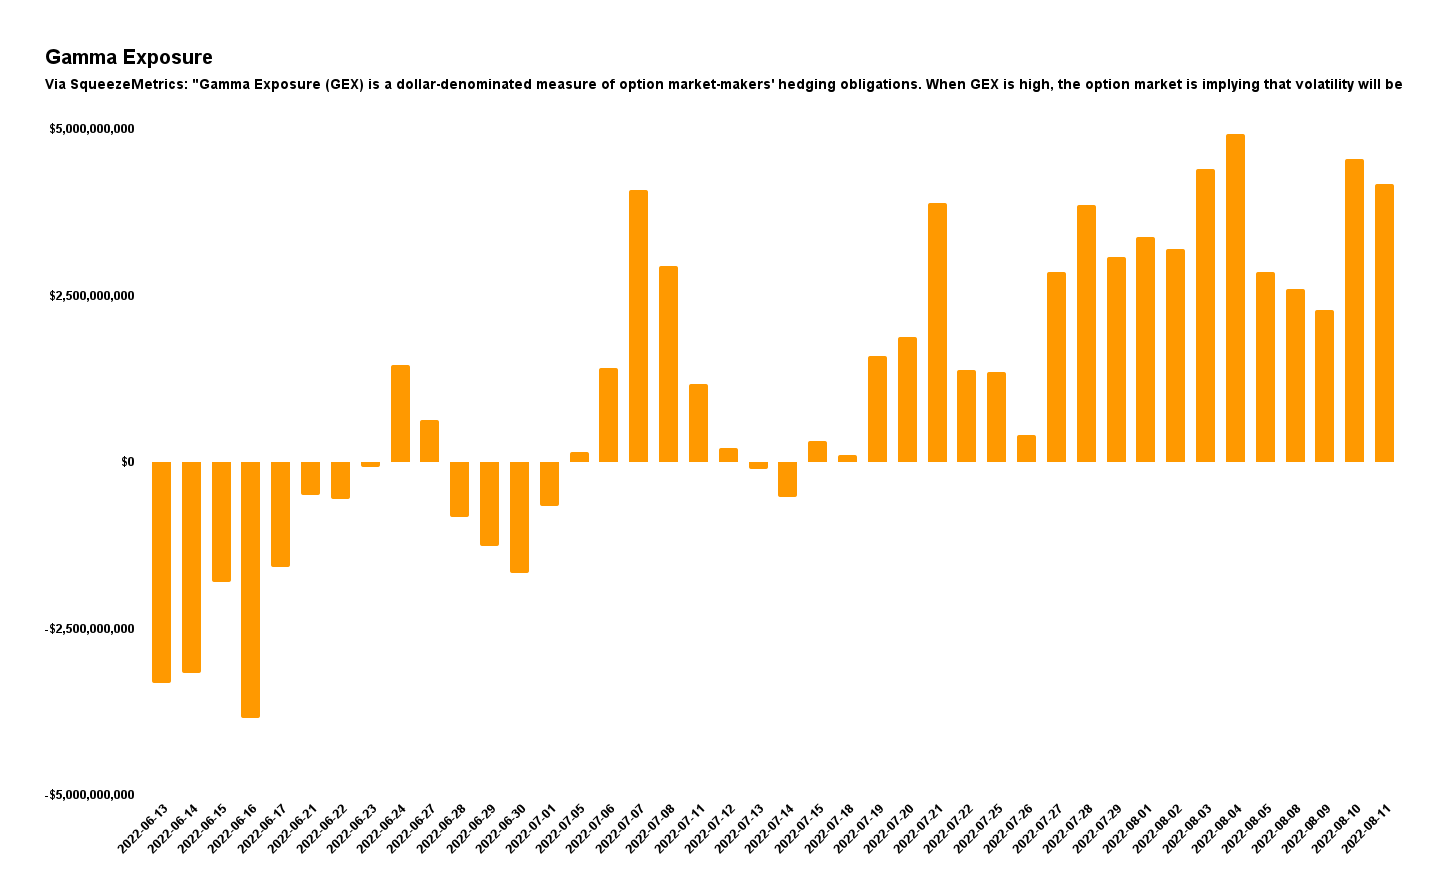
Graphic: Retrieved from Physik Invest. Data from SqueezeMetrics. Gamma exposure is set to fall in mid-February, and this may result in less support from the options market.
Trades that look and are working well include those that use short-call vertical credits to finance long-put vertical debits out months from now. For instance, for every two units of short call verticals (SOLD -1 VERTICAL SPX 100 19 MAY 23 [AM] 4150/4200 CALL), your letter writer is looking to own one unit of the long put vertical (BUY +1 VERTICAL SPX 100 16 JUN 23 [AM] 3450/3350 PUT). Remember that your letter writer may not necessarily think the market will trade that far, rather it may be a bet on IVOL repricing.
A case study on last week’s ultra-successful call ratio spreads is coming soon. Take care and watch your risk!
Technical
As of 7:20 AM ET, Thursday’s regular session (9:30 AM – 4:00 PM ET), in the S&P 500, is likely to open in the upper part of a positively skewed overnight inventory, inside of the prior day’s range, suggesting a limited potential for immediate directional opportunity.
The S&P 500 pivot for today is $4,168.75.
Key levels to the upside include $4,189.00, $4,202.75, and $4,214.25.
Key levels to the downside include $4,153.25, $4,136.25, and $4,122.75.
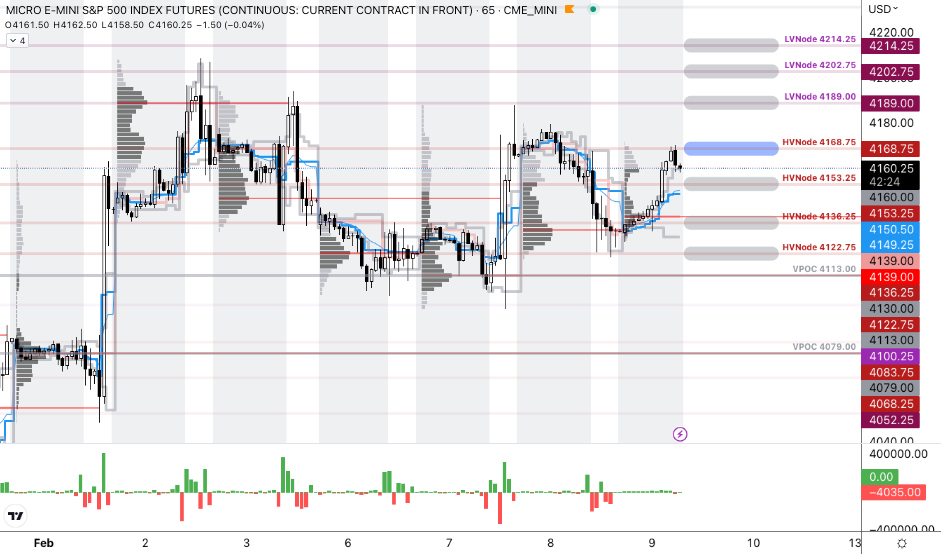
Disclaimer: Click here to load the updated key levels via the web-based TradingView platform. New links are produced daily. Quoted levels likely hold barring an exogenous development.
Graphic: 65-minute profile chart of the Micro E-mini S&P 500 Futures.
Definitions
Volume Areas: Markets will build on areas of high-volume (HVNodes). Should the market trend for a period of time, this will be identified by a low-volume area (LVNodes). The LVNodes denote directional conviction and ought to offer support on any test.
If participants auction and find acceptance in an area of a prior LVNode, then future discovery ought to be volatile and quick as participants look to the nearest HVNodes for more favorable entry or exit.
About
The author, Renato Leonard Capelj, works in finance and journalism.
Capelj spends the bulk of his time at Physik Invest, an entity through which he invests and publishes free daily analyses to thousands of subscribers. The analyses offer him and his subscribers a way to stay on the right side of the market. Separately, Capelj is an options analyst at SpotGamma and an accredited journalist.
The daily brief is a free glimpse into the prevailing fundamental and technical drivers of U.S. equity market products. Join the 900+ that read this report daily, below!
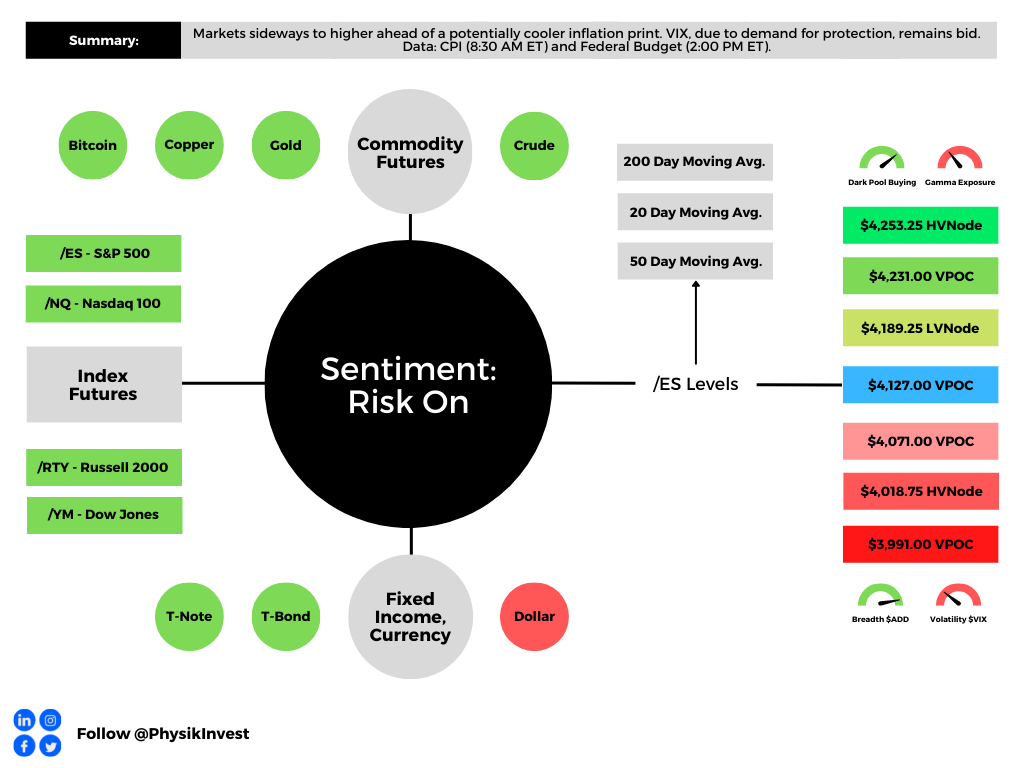
Graphic updated 7:45 AM ET. Sentiment Risk-On if expected /ES open is above the prior day’s range. /ES levels are derived from the profile graphic at the bottom of the following section. Levels may have changed since initially quoted; click here for the latest levels. SqueezeMetrics Dark Pool Index (DIX) and Gamma (GEX) calculations are based on where the prior day’s reading falls with respect to the MAX and MIN of all occurrences available. A higher DIX is bullish. At the same time, the lower the GEX, the more (expected) volatility. Learn the implications of volatility, direction, and moneyness. Breadth reflects a reading of the prior day’s NYSE Advance/Decline indicator. VIX reflects a current reading of the CBOE Volatility Index (INDEX: VIX) from 0-100.
Fundamental
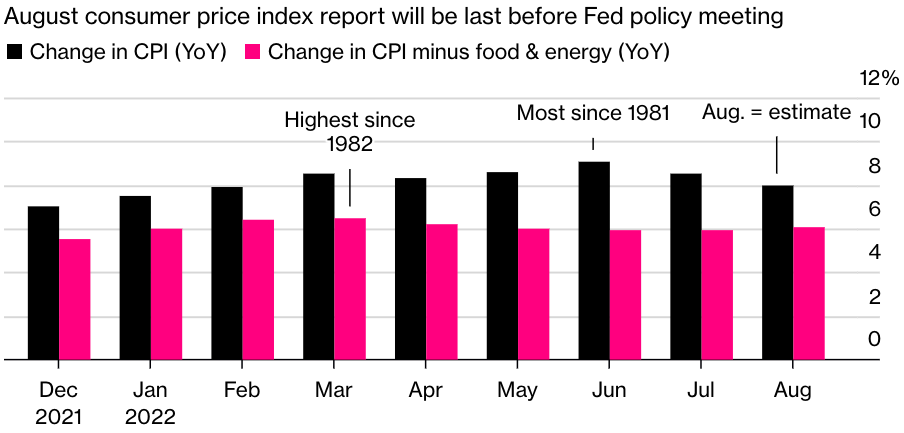
Today, traders get inflation updates. These will help drive perceptions regarding monetary policy.
Expected is an 8.1% rise year-over-year (YoY) and 0.1% fall month-over-month (MoM). In July, these numbers were 8.5% and 0.0%, respectively.
Core CPI (which excludes food and energy) is expected to rise by a rate higher than in July, 6.1% YoY and 0.3% MoM, respectively.
Mattering most is core inflation, which the Fed has more control over. If lower than expected, that may warrant some appetite for risk.
Notwithstanding, prior to July’s release, the average movement in the S&P 500, after CPI, was -1.27%. Still, though, the expectation is that August data will show improvement.
“The market has concluded that both the ECB and even the Fed, despite their protestations otherwise, are both being viewed as data-dependent,” Peter Tchir of Academy Securities said.
“I cannot see any scenario where the market doesn’t decide that CPI is heading the right direction and … [this] should allow markets to continue to enjoy the strength.”
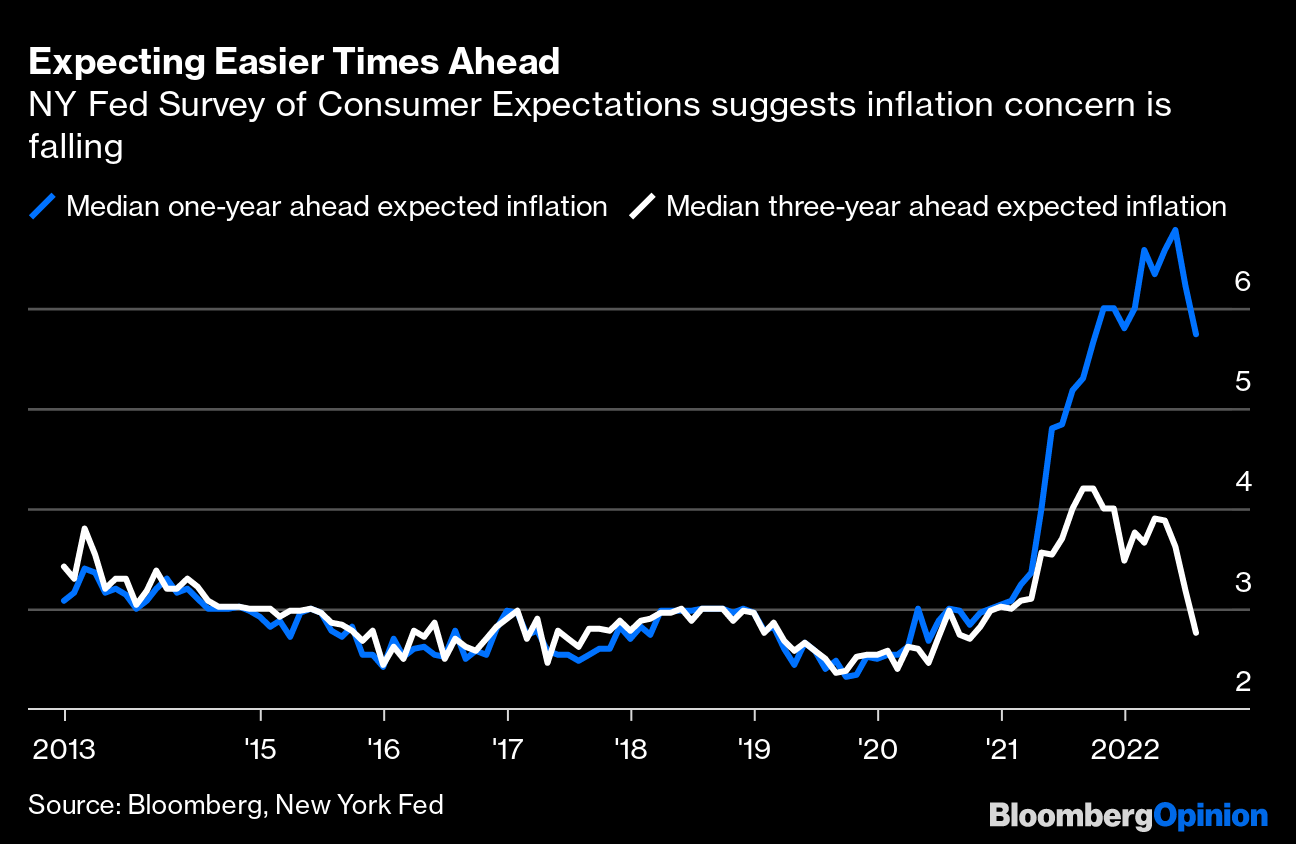
Graphic: Retrieved from Bloomberg. “Stronger evidence that a wage-price spiral can indeed be avoided came from Monday’s publication of the New York Fed’s latest Survey of Consumer Expectations.”
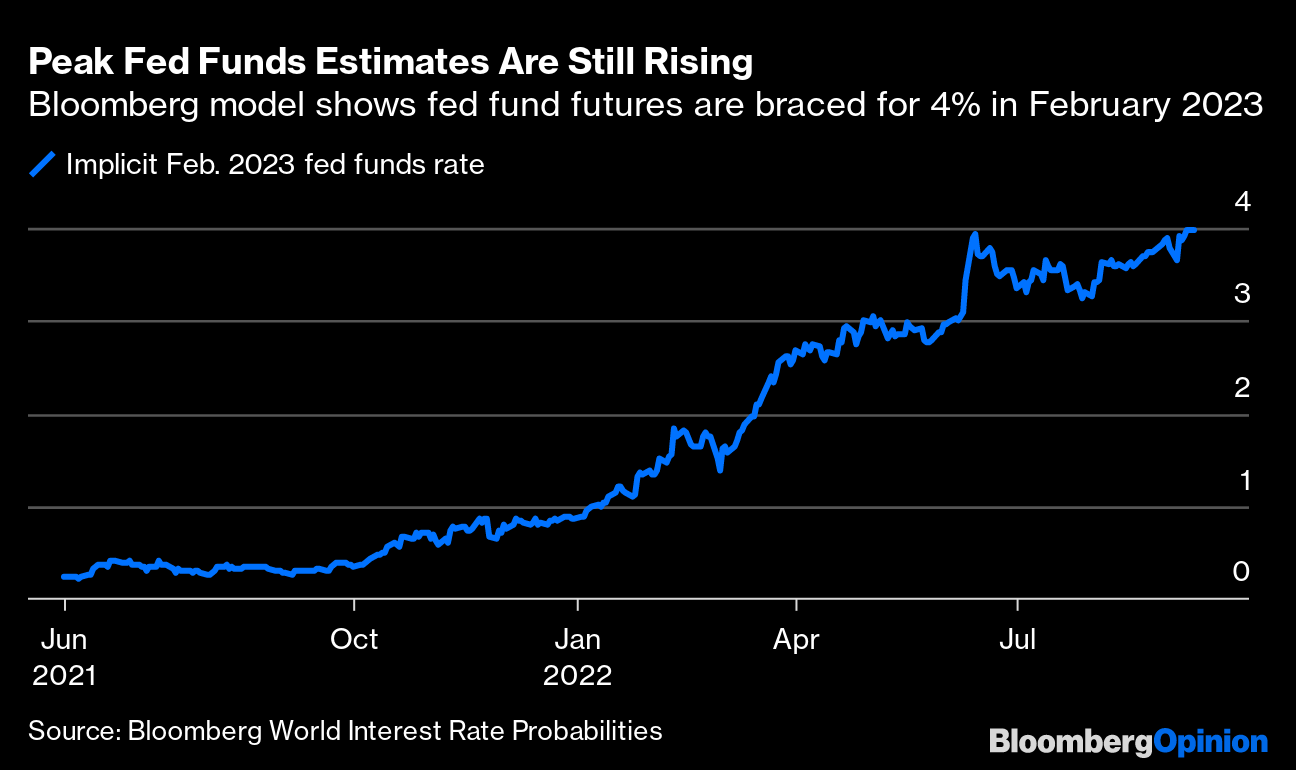
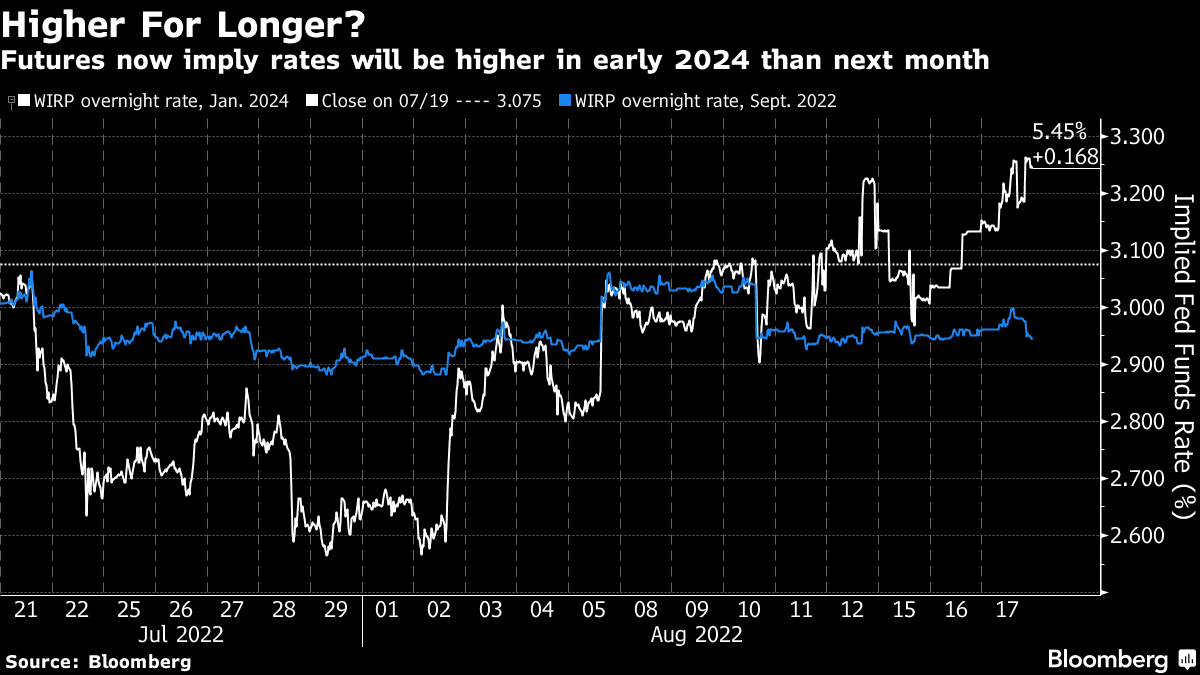
At this point, in spite of the prospects of inflation continuing to cool, expectations regarding Fed (Federal Reserve) action remain sticky with the fed funds futures pricing a peak in rates of 4%.
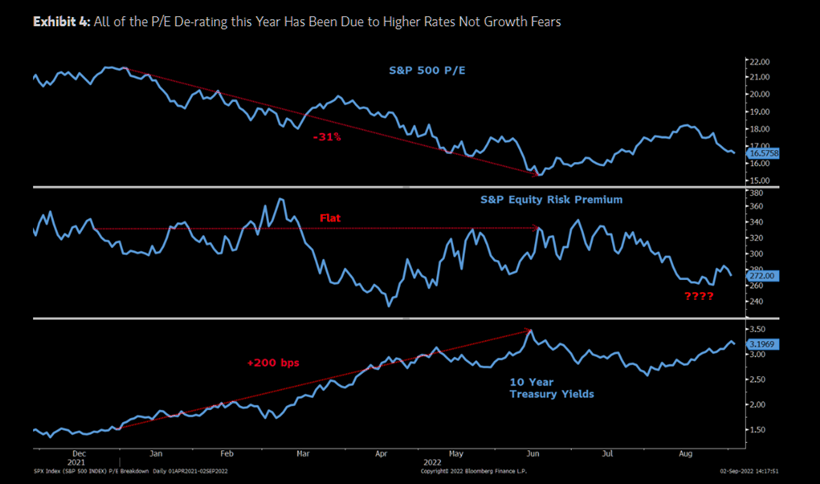
Graphic: Retrieved from Bloomberg.
Unchanged, all else equal, this means markets have accounted for the rise in interest rates and their impact on valuations. From hereon, further de-rating is not out of the question, particularly if inflation continues to rise and/or growth fears materialize, as some like Fitch Ratings believe.
Graphic: Retrieved from The Market Ear. Via Morgan Stanley (NYSE: MS). “MS Research thinks the lows for this bear market will likely arrive in the fourth quarter with 3,400 the minimum downside and 3,000 the low if a recession arrives.”
According to Fitch, a decline in corporate profits is likely to speed up in the coming quarters, and this will highlight economic slowing (below-trend GDP growth) that leads to a 2023 recession.
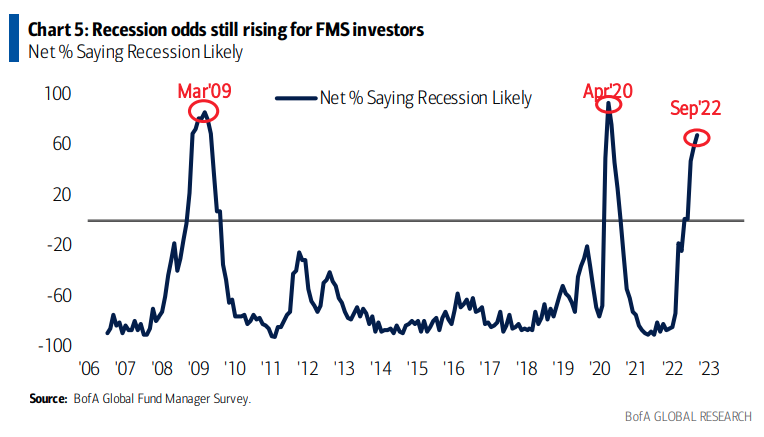
Graphic: Retrieved from Bloomberg, via Bank of America Corporation (NYSE: BAC). “Bank of America … remains ‘fundamentally and patiently bearish.’”
To quote CFO Dive, “Downward revisions to consensus expectations for earnings next year ‘will likely accelerate as monetary tightening continues to reduce inflation and growth slows.’”
Thus far, the economy has shrunk 0.6% in the second quarter, after slumping 1.6% in the first, which is “the common definition of a recession” despite the continued growth of the economy as shown by other metrics like “nonfarm employment, consumer spending, industrial production, and weekly hours worked.”
Positioning
As of 7:45 AM ET, Tuesday’s expected volatility, via the Cboe Volatility Index (INDEX: VIX), sits at ~1.24%. Net gamma exposures increasing may promote some market stability.
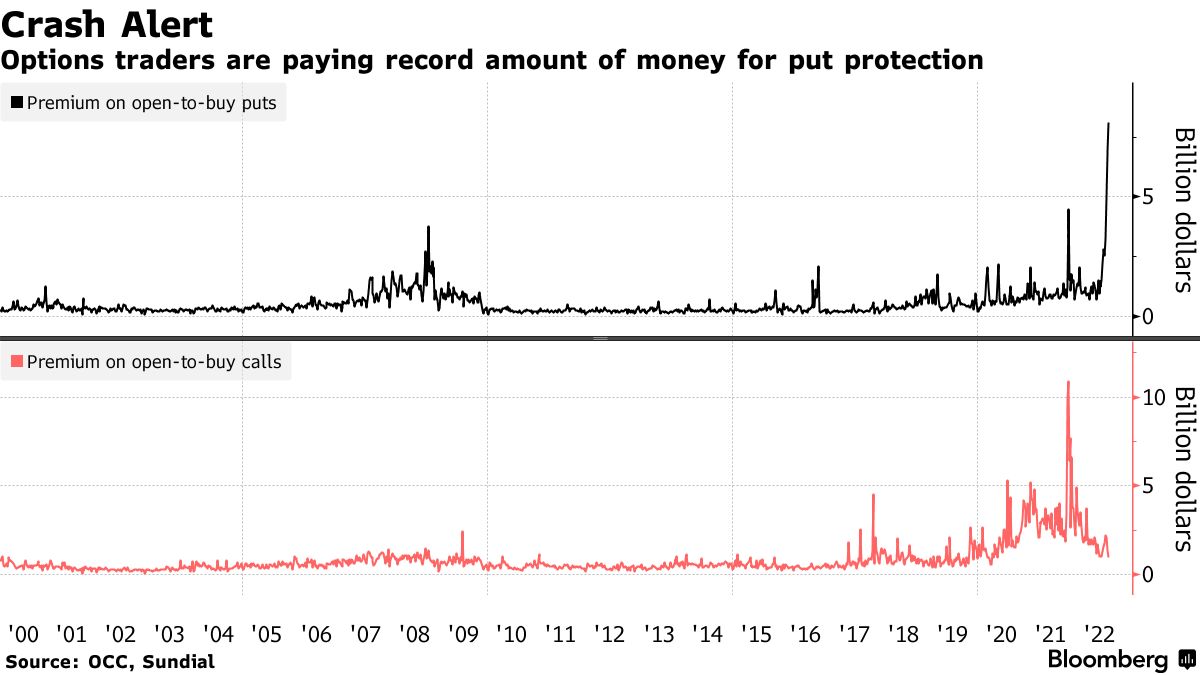
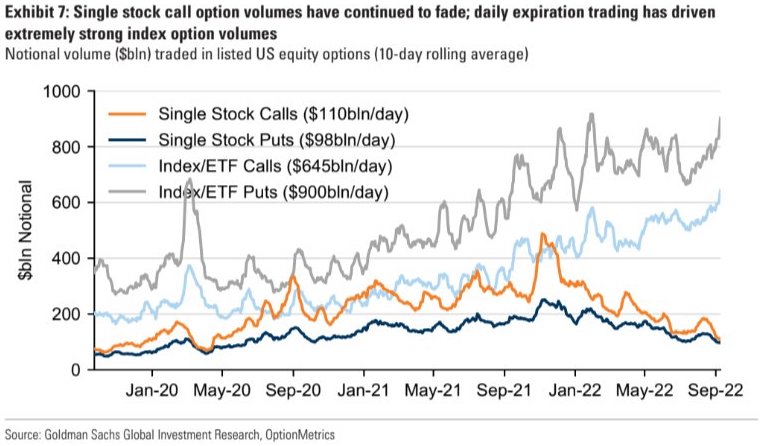
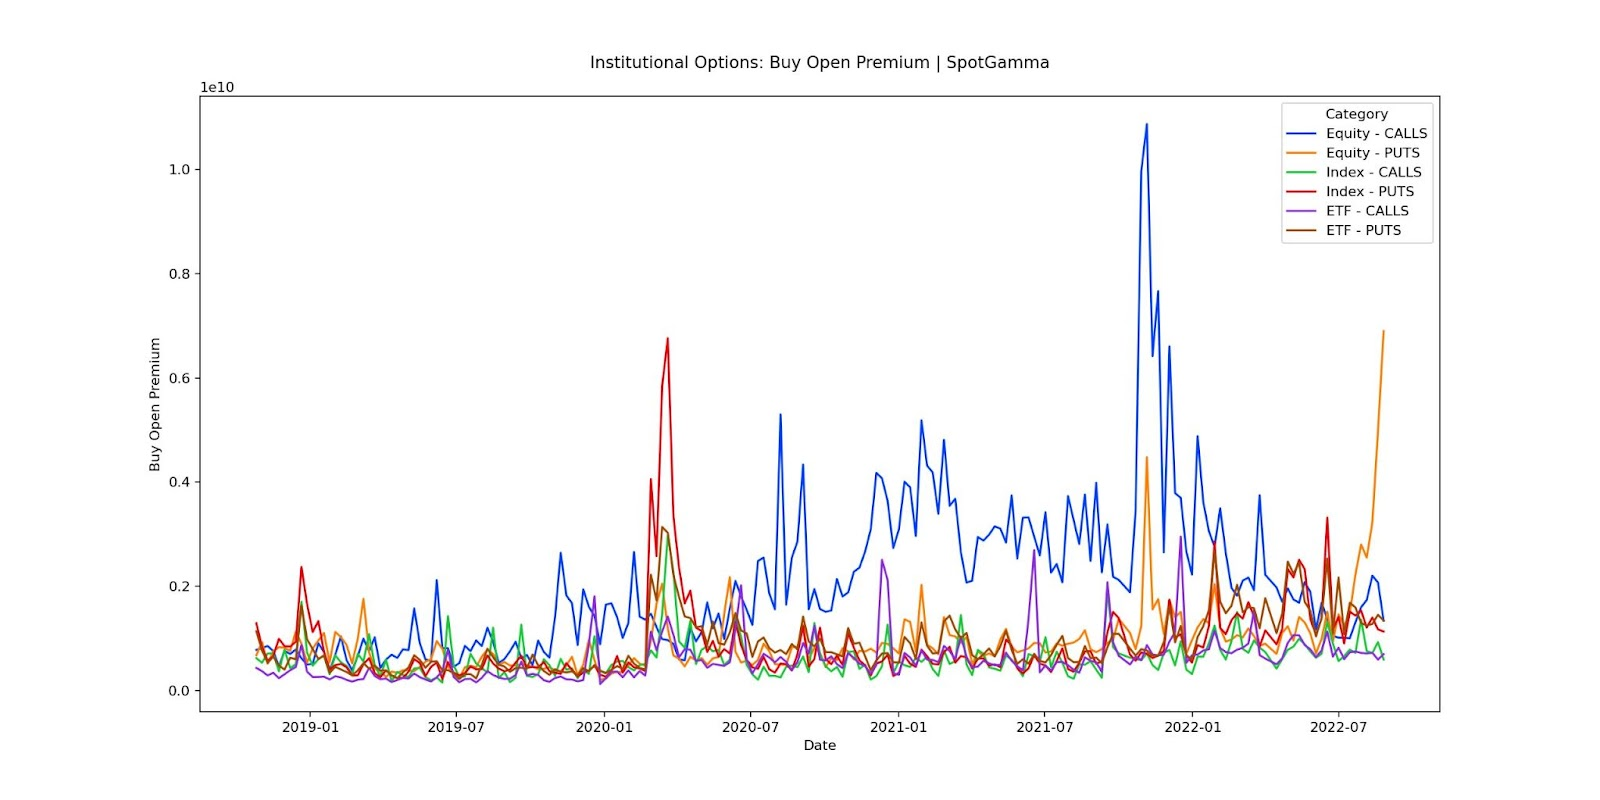
It’s the case that there is this trend in demand for equity downside put options protection. This is evidenced by figures of open interest, volume, as well as bid implied volatility (IVOL) metrics like the Cboe Volatility Index (INDEX: VIX).
“They’re buying protection against a crash at a pace unlike anything the market has ever seen,” said Jason Goepfert, chief research officer at Sundial. This is as Nomura Holdings Inc’s (NYSE: NMR) Charlie McElligott says more traders are taking shots amid “hawkish global central bank escalations,” and tightening measures of liquidity, among other things.
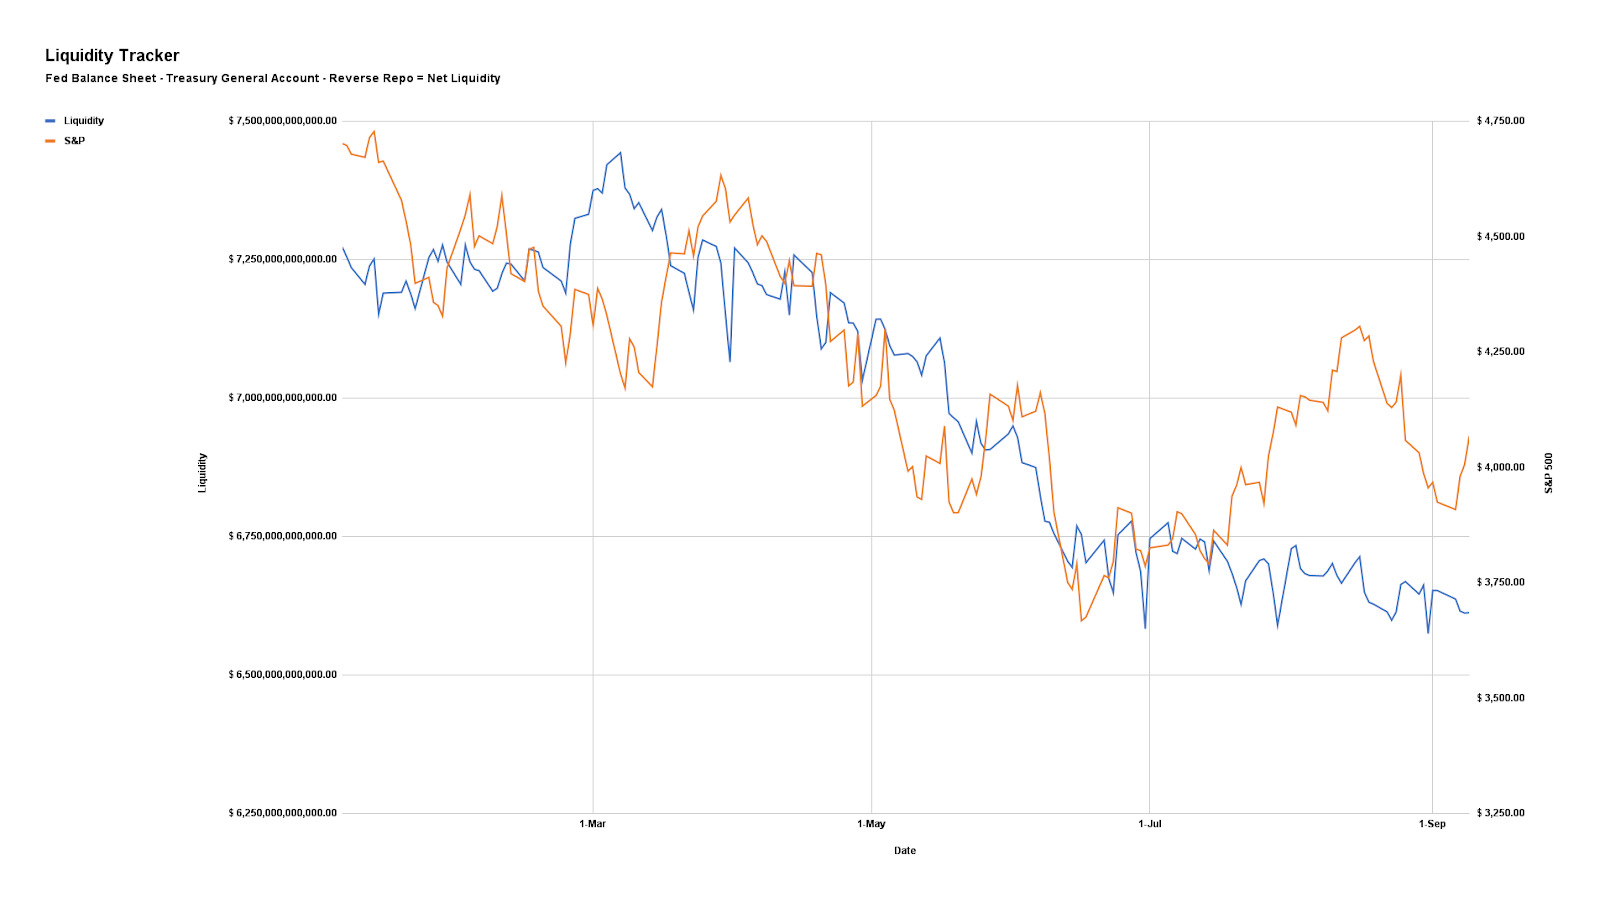
Graphic: Via Physik Invest. Data compiled by @jkonopas623. Fed Balance Sheet data, here. Treasury General Account Data, here. Reverse Repo data, here. NL = BS – TGA – RRP.
Goepfert adds that the “massive hedging activity” feels “unsettling.” That has to do with what the reaction to that protection entails should markets drop lower and IVOL increase, accordingly.
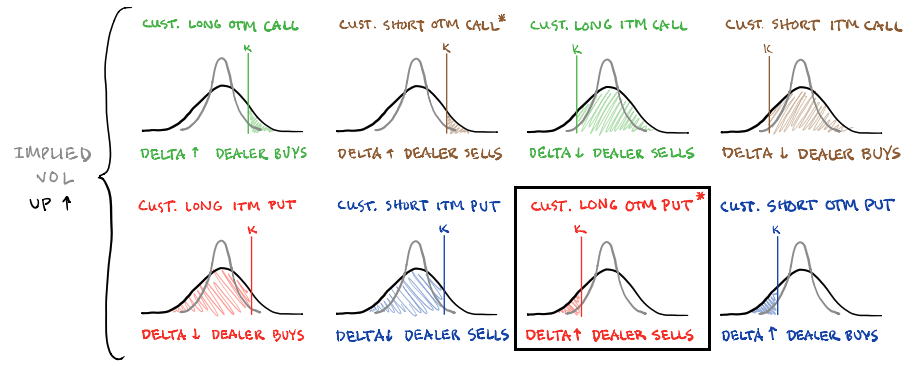
Graphic: Retrieved from SqueezeMetrics. Learn the implications of volatility, direction, and moneyness.
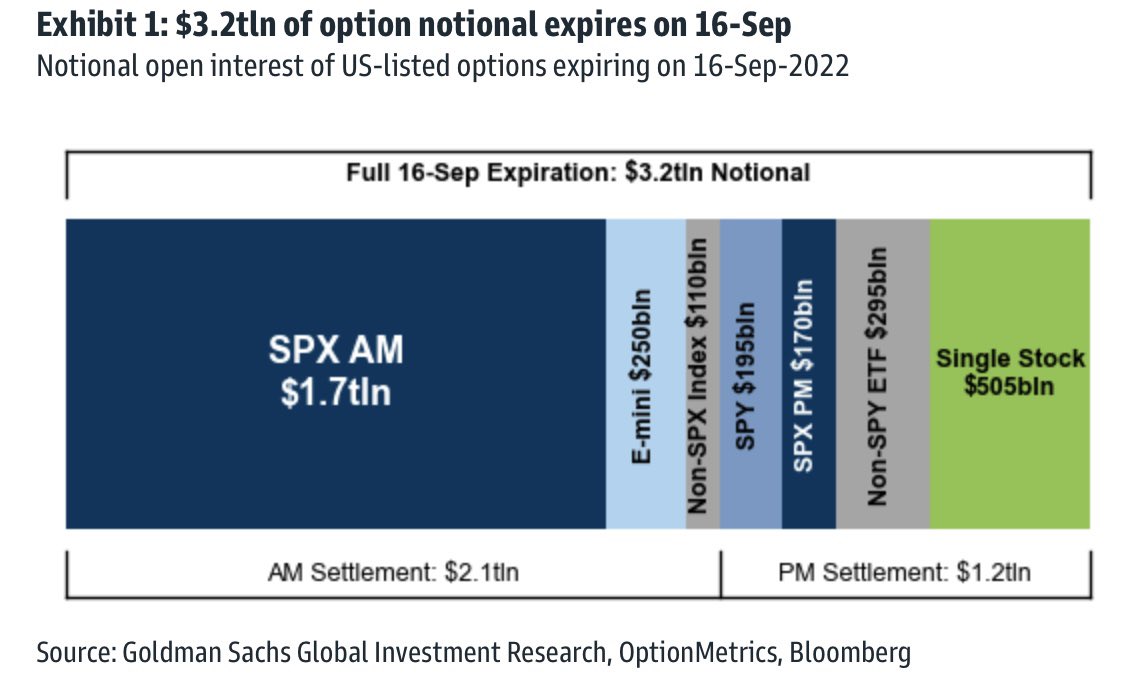
Notwithstanding, should nothing bad happen, the activity, which is structured in soon-to-expire options, will quickly fall out of favor (as will the probability of those options paying out). Liquidity providers, on the other side of those trades, will reduce their negative Delta (short futures and stock) hedges which may further add support to markets.
Graphic: Retrieved from Goldman Sachs Group Inc (NYSE: GS).
The concern is that soon after this big options expiration passes, new fear and demand for protection may feed into another bout of weakness as traders rush to re-protect and liquidity providers add pressure in their hedging, accordingly.
Graphic: Retrieved from Goldman Sachs Group Inc (NYSE: GS).
Technical
As of 7:00 AM ET, Tuesday’s regular session (9:30 AM – 4:00 PM ET), in the S&P 500, is likely to open in the upper part of a positively skewed overnight inventory, outside of prior-range and -value, suggesting a potential for immediate directional opportunity.
In the best case, the S&P 500 trades higher.
Any activity above the $4,127.00 VPOC puts into play the $4,189.25 LVNode. Initiative trade beyond the LVNode could reach as high as the $4,231.00 VPOC and $4,253.25 HVNode, or higher.
In the worst case, the S&P 500 trades lower.
Any activity below the $4,127.00 VPOC puts into play the $4,071.00 VPOC. Initiative trade beyond the VPOC could reach as low as the $4,018.75 HVNode and $3,991.00 VPOC, or lower.
Click here to load today’s key levels into the web-based TradingView charting platform. Note that all levels are derived using the 65-minute timeframe. New links are produced, daily.
Graphic: 65-minute profile chart of the Micro E-mini S&P 500 Futures.
Definitions
Volume Areas: A structurally sound market will build on areas of high volume (HVNodes). Should the market trend for long periods of time, it will lack sound structure, identified as low volume areas (LVNodes). LVNodes denote directional conviction and ought to offer support on any test.
If participants were to auction and find acceptance into areas of prior low volume (LVNodes), then future discovery ought to be volatile and quick as participants look to HVNodes for favorable entry or exit.
POCs: POCs are valuable as they denote areas where two-sided trade was most prevalent in a prior day session. Participants will respond to future tests of value as they offer favorable entry and exit.
MCPOCs: POCs are valuable as they denote areas where two-sided trade was most prevalent over numerous day sessions. Participants will respond to future tests of value as they offer favorable entry and exit.
About
After years of self-education, strategy development, mentorship, and trial-and-error, Renato Leonard Capelj began trading full-time and founded Physik Invest to detail his methods, research, and performance in the markets.
Capelj also develops insights around impactful options market dynamics at SpotGamma and is a Benzinga reporter.
In no way should the materials herein be construed as advice. Derivatives carry a substantial risk of loss. All content is for informational purposes only.
Investors foresaw weakness before the 2022 equity market decline in response to the coming monetary tightening. They repositioned and hedged their equity downside with allocations to commodities and options, colloquially referred to as volatility.
The commodity exposure worked well, while the volatility exposure did not. Consequently, the 2022 equity market decline was unlike many before. The monetization and counterparty hedging of existing customer options hedges and the sale of short-dated options, particularly in some single names where implied volatility or IVOL was rich, lent to lackluster volatility performance. Some may have observed tameness among IVOL measures such as the Cboe Volatility Index or VIX.
“One-year variance swaps or implied volatility on an at-the-money S&P 500 put option would trade somewhere in the neighborhood of 25 to 30%,” said Michael Green of Simplify Asset Management. “That implies a level of daily price movement that is difficult to achieve.”
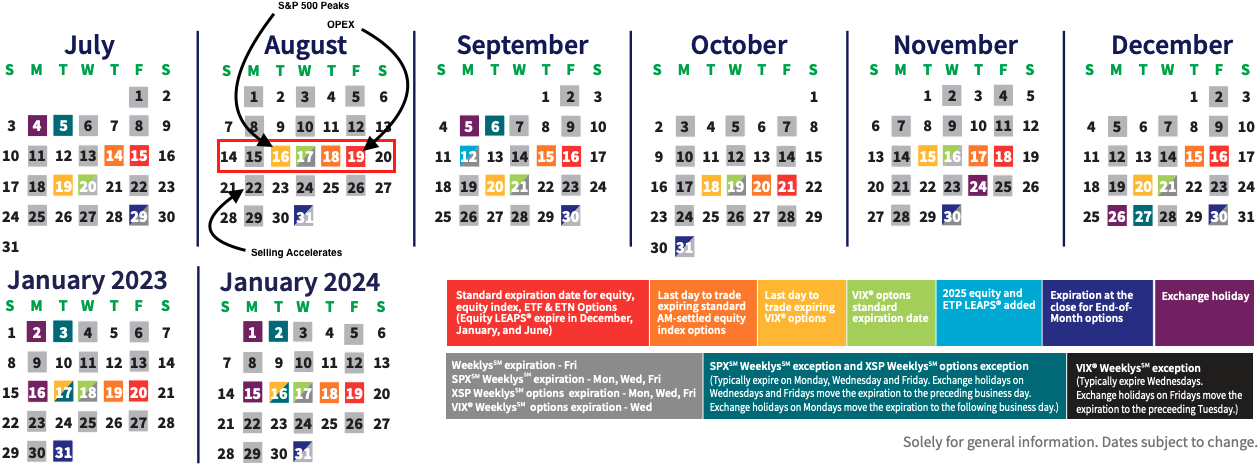
Eventually, entering August 2022, entities were getting squeezed out of these trades that did not work. The market advanced as participants rotated out of options and commodities; a macro-type re-leveraging ensued on improvements in inflation data, an earnings season that was better than expected, and “crazy tax receipts,” among other things. In August 2022, the advance climaxed the week of monthly options expiry or OpEx, as shown below.
Graphic: Retrieved from Cboe Global Markets Inc (BATS: CBOE).
Why did the advance climax the week of OpEx? Well, heading into that particular week of OpEx, markets were rising quickly, and call options (i.e., bets on the market upside) were highly demanded.
Graphic: Updated 8/15/2022. Retrieved from SqueezeMetrics.
Those on the other side of the call option trades (i.e., counterparties) thus hedged in a supportive manner (i.e., counterparties sell calls to customers and buy underlying to hedge exposure).
Eventually, traders’ activity in soon-to-expire options concentrated at specific strikes – particularly $4,300.00 in the S&P 500 – while IVOL trended lower. The counterparty’s response, then, did more to support prices and reduce movement. That is because, with time passing and volatility declining, options Gamma (i.e., the sensitivity of an option to direction) became more positive; the range of spot prices across which Delta (i.e., options exposure to direction) shifts rapidly shrunk. When options Gamma exposure is more positive, market movements may positively impact the counterparty’s position (i.e., movement benefits them). However, if the counterparty is not interested in realizing that benefit, it may hedge in a manner that dulls the market’s movement. This is partly what happened in the late stages of the August rally. After the S&P 500 hit $4,300.00, the near-vertical price rise sputtered. Soon, follow-on support, from a fundamental (e.g., liquidity) and volatility perspective, would worsen following OpEx.
Graphic: Via Physik Invest. Fed Balance Sheet data, here. Treasury General Account Data, here. Reverse Repo data, here.
Why the removal/weakening of support? OpEx would trigger “a big shift in market positioning,” Nomura Holdings Inc’s (NYSE: NMR) Charlie McElligott explained at the time.
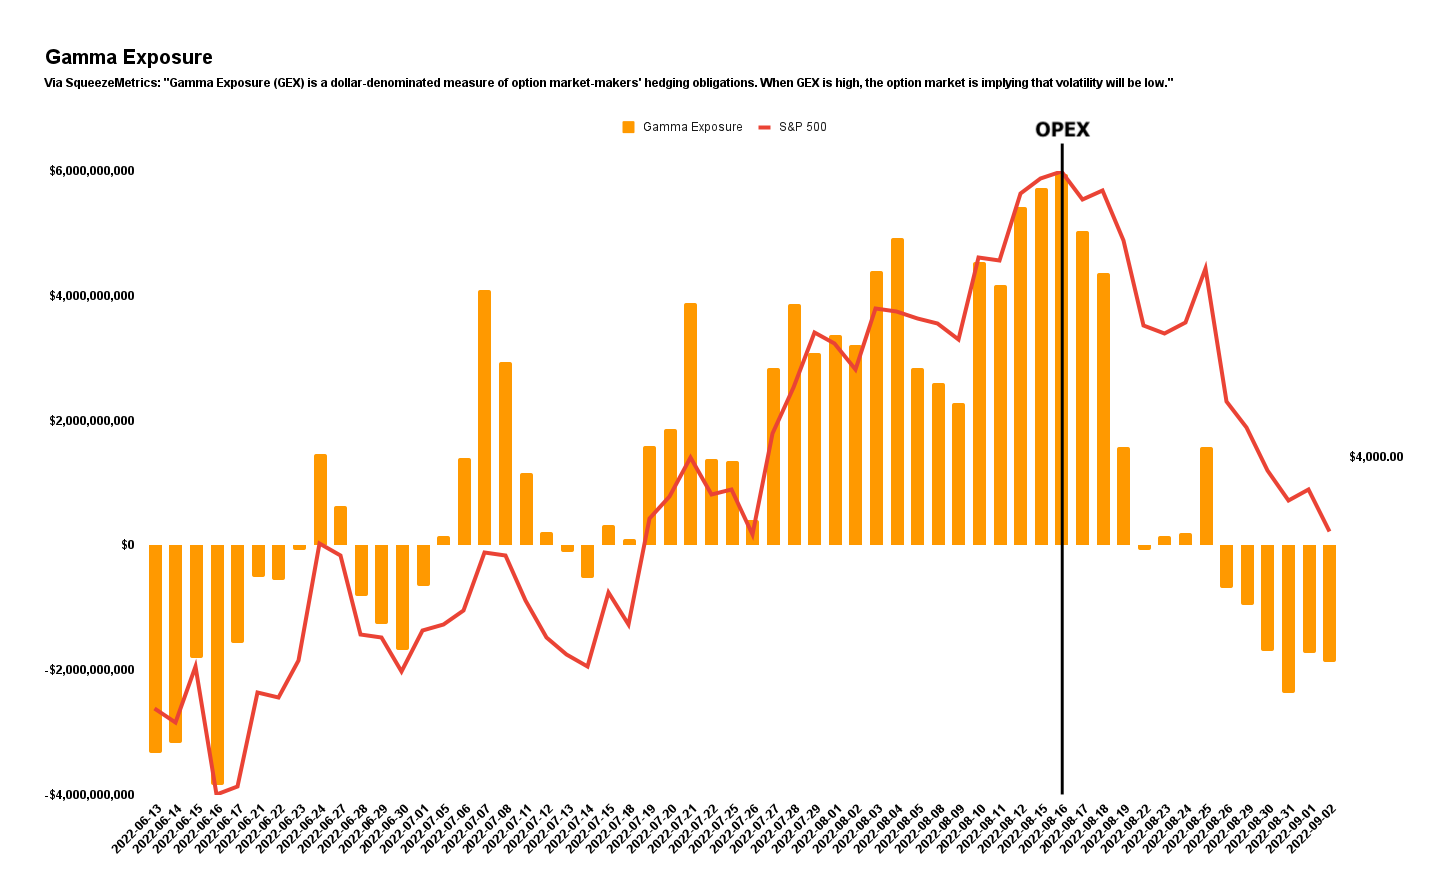
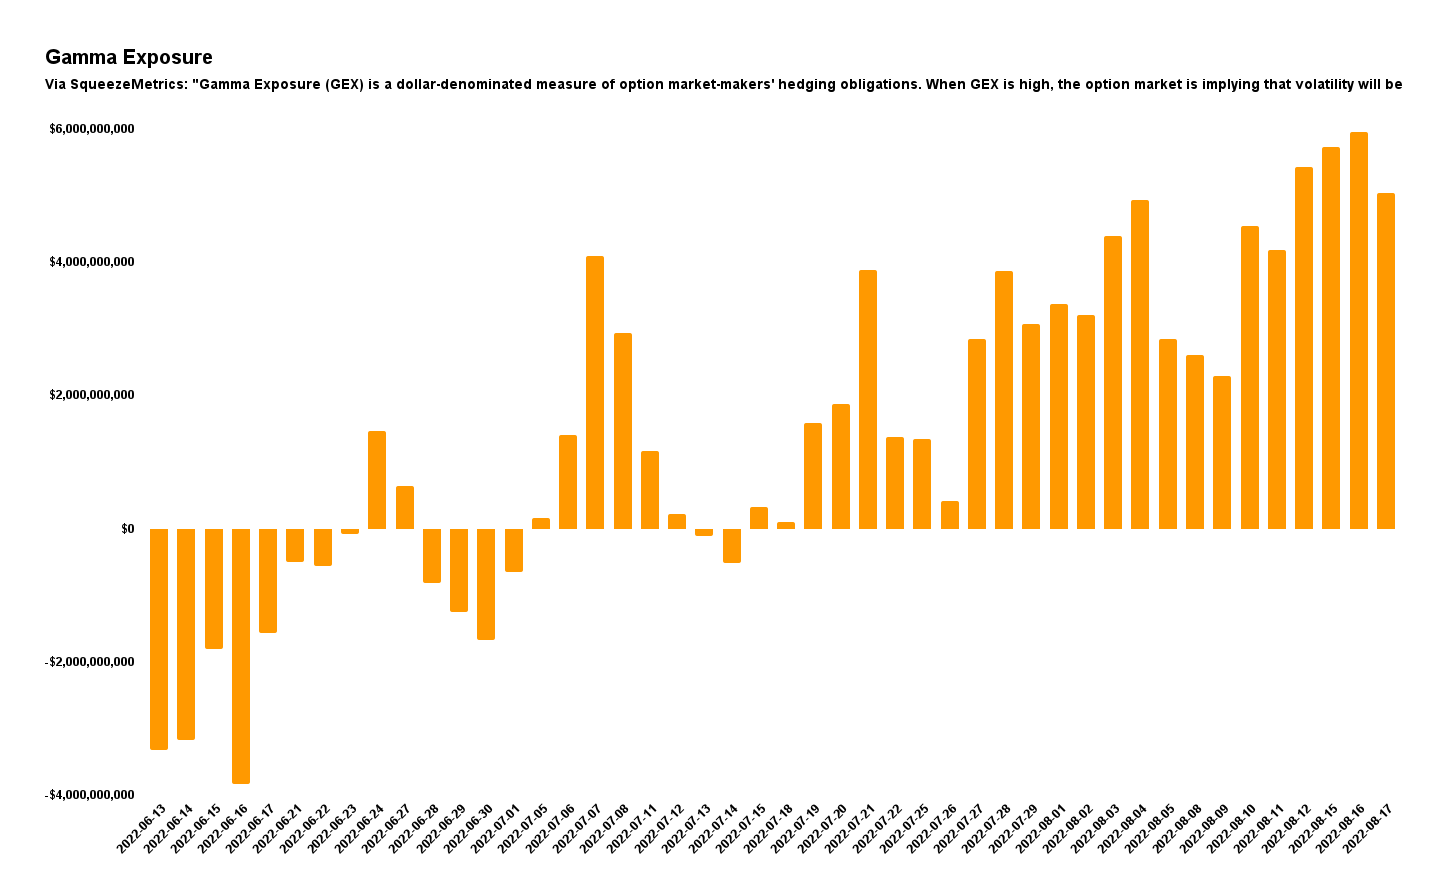
In short, participants’ failure to roll forward their expiring bets on market upside coincided with a message that the Federal Reserve (Fed) would stay tough on inflation. After OpEx, those same bets prompting counterparties to stem volatility and bolster equity upside were removed (i.e., expire). We can visualize this by the drop in Gamma exposures post-OpEx, as shown below.
Graphic: Created by Physik Invest. Data by SqueezeMetrics.
Accordingly, August OpEx, combined with technical and fundamental contexts prompting funds to “reload[] on short sales,” shocked the market into a higher volatility and negative Gamma environment. In this negative Gamma environment, put options, through which the vast majority of participants speculate on lower prices and protect their downside, solicited far more pressure from counterparties. If markets continued trading lower, traders would likely continue rotating into those put options, further bolstering pressure from counterparties. This happened, as shown below.
Graphic: Retrieved from SpotGamma. “There was a huge surge in large trader put buying in the equities space last week as per the OCC data.”
Demand for put options protection was bid IVOL. To hedge against this demand for protection and rising IVOL, counterparties sold underlying, compounding bearish fundamental flows.
Graphic: Retrieved from SqueezeMetrics. Learn the implications of volatility, direction, and moneyness.
In late August, new data suggested September would have “a very large options position as it is a quarterly OpEx,” SpotGamma said. With positioning “put heavy,” a slide lower, and an increase in IVOL was likely to drive continued counterparty “shorting” with little “relief until Jackson Hole.”
Based on this information, Physik Invest sought to initiate trades, expecting markets to trade lower and more volatile.
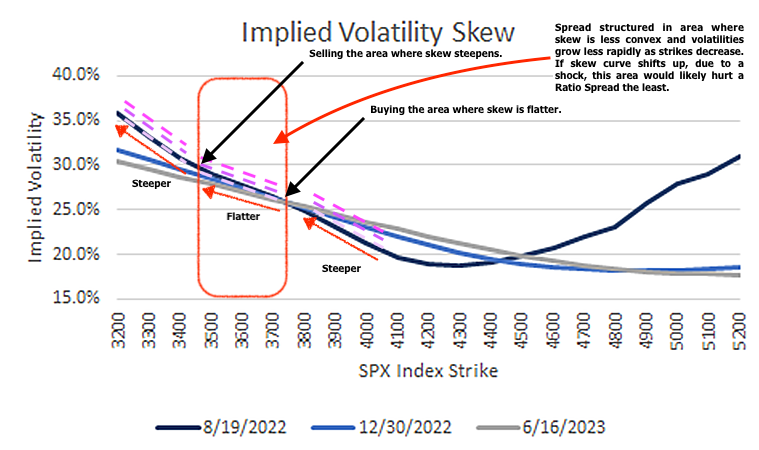
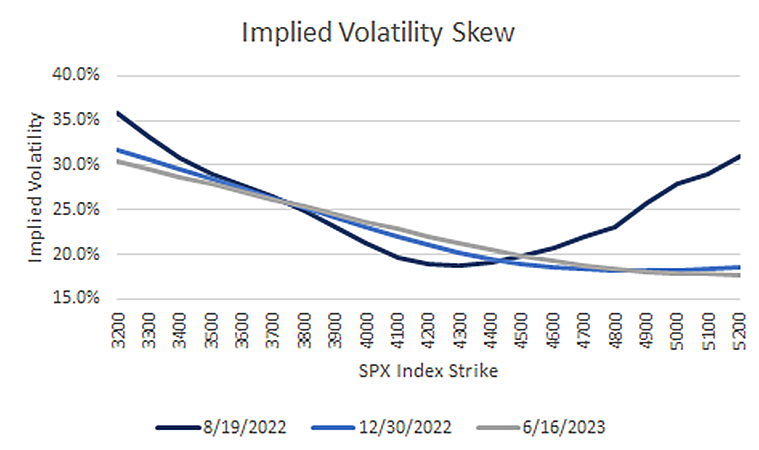
Call option premiums appeared attractive in mid-August, partly due to interest rates, while IVOL metrics seemingly hit a lower bound. This was observable via a quick check of skew, a plot of IVOL for options across different strike prices. Usually, skew, on the S&P 500, shows a smirk, not a smile. This meant it was likely that short-dated, wide Put Ratio Spreads had little to lose in a sideways-to-higher market environment. Additionally, call Vertical Spreads above the market were relatively more expensive.
Graphic: Retrieved from Cboe Global Markets Inc (BATS: CBOE). Updated August 17, 2022. Skew steepened into $3,700.00 and below $3,500.00 in the S&P 500.
Given the above context, the following analysis unpacks how Physik Invest traded options tied to the S&P 500 leading up to and through the August 19 OpEx into the Jackson Hole Economic Symposium.
Note: Click here to view all transactions for all accounts involved.
Sequence 1:
Through August 12, 2022, after a volatility skew smile was observed, the following positions were initiated while the S&P 500 was still trending higher for a net $7,616.68 credit.
Positions were structured in a way that would potentially net higher credits had the index moved lower.
SOLD 10 1/2 BACKRATIO SPX 100 (Weeklys) 26 AUG 22 3700/3500 PUT @ ~$0.13 Credit
SOLD 3 VERTICAL SPX 100 21 OCT 22 [AM] 4300/4350 CALL @ ~$25.10 Credit
Sequence 2:
While the S&P 500 was trading near $4,300.00 resistance, by 8/19/2022, all aforementioned Ratio Put Spread positions were rolled forward for a $452.26 credit.
The trades netted a $15,032.78 profit after commissions and fees.
The max loss (absent some unforeseen events) sat at ~$6,790.00 if the S&P 500 closed above $4,350.00 in October. Because the Ratio Put Spreads were initiated at no cost, any loss would have resulted from the trade’s Vertical Spread component if the market went higher.
Overall, this trade netted more than a 200% return; its profit was more than two times the initial debit risk, making it a multi-bagger.
Reflection:
Heading into the trades, it was the case that IVOL performed poorly during much of the 2022 decline. This would likely remain the case on any subsequent drop; hence, the ultra-wide and short-dated Ratio Put Spread.
Despite the Ratio Put Spread exposing the position to negative Delta and positive Gamma (i.e., the trade makes money if the market moves lower, all else equal), if implied skew became more convex (i.e., implied volatilities grow more rapidly as strike prices decrease), the position could have been a giant loser. So, if the flatter part of the skew curve (where the position was structured) became more convex (i.e., rose), which is not something that was anticipated would happen, then the only recourse would have been to (1) close the position or (2) sell (i.e., add static negative Delta in) futures and correlated ETFs. In the second case, the trade would have allowed time to work (i.e., let Theta work) and become a potential winner.
Additionally, under Physik Invest’s risk protocol, more Short Put Ratio Spread units could have been initiated on the transition into Sequence 2. These units could have been held through Labor Day and monetized for up to an additional ~$4.00 credit per unit.
Though additional units of the Vertical Spreads could not have been added due to the strict limits to debit risks, there were still months left to that particular trade component. With lower prices expected, there was little reason the Verticals should have been removed fast.
In the future, should the context from a fundamental and volatility perspective remain the same, Physik Invest could potentially re-enter a similar position only on a rally.
The daily brief is a free glimpse into the prevailing fundamental and technical drivers of U.S. equity market products. Join the 800+ that read this report daily, below!
Graphic updated 7:20 AM ET. Sentiment Neutral if expected /ES open is inside of the prior day’s range. /ES levels are derived from the profile graphic at the bottom of the following section. Levels may have changed since initially quoted; click here for the latest levels. SqueezeMetrics Dark Pool Index (DIX) and Gamma (GEX) calculations are based on where the prior day’s reading falls with respect to the MAX and MIN of all occurrences available. A higher DIX is bullish. At the same time, the lower the GEX, the more (expected) volatility. Learn the implications of volatility, direction, and moneyness. Breadth reflects a reading of the prior day’s NYSE Advance/Decline indicator. VIX reflects a current reading of the CBOE Volatility Index (INDEX: VIX) from 0-100.
Hey team – the Daily Briefwill bepaused until August 29, at least, due to Renato’s travel commitments.
Apologies and thank you for the support!
Positioning
As of 7:20 AM ET, Thursday’s expected volatility, via the Cboe Volatility Index (INDEX: VIX), sits at ~1.05%. Net Gamma exposures (generally) rising may promote tighter trading ranges.
Graphic: Via Physik Invest. Data retrieved from SqueezeMetrics.
As an aside, real quick, in a rising market, characterized by demand for call options, those who are on the other side of options trades, hedge in a manner that may bolster the upside (i.e., the naive theory is that if customers buy calls, then counterparties sell calls + buy stock to hedge).
That said, if IVOL drops, liquidity providers’ out-of-the-money (in-the-money) Delta exposures drop (rise) and, thus, they will sell (buy) underlying hedges which may pressure (support) the advance or play into pinning action, as seen over the past week or so at the $4,300.00 options strike, at which there is a lot of open interest and volume, in the S&P 500.
Read: The Implied Order Book by SqueezeMetrics for a sort-of detailed primer on this.
Graphic: Updated 8/15/2022. Retrieved from SqueezeMetrics.
Given realized (RVOL) and implied (IVOL) volatility measures, as well as skew, it is beneficial to be a buyer of options structures to protect against (potential) downside (e.g., S&P 500 [INDEX: SPX] +1 x -2 Short Ratio Put Spread | 200+ Points Wide | 15-30 DTE | @ $0.00 or better).
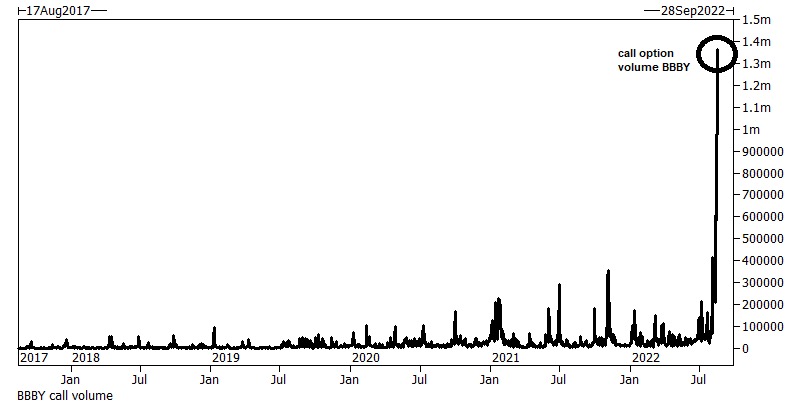
This is not to say that call options, which we said could “outperform” their Delta (i.e., exposure to direction) weeks ago, are out of favor (note: this is the case for something such as an SPX, not a Bed Bath & Beyond Inc [NASDAQ: BBBY]).
Graphic: Retrieved from Corey Hoffstein. Via Goldman Sachs Group Inc (NYSE: GS).
No! On the contrary, Goldman Sachs Group Inc (NYSE: GS) strategists say “call premiums are attractive.” This is “evidenced by [their] GS-EQMOVE model which estimates 33% probability of a 1-month 5% up-move versus only 13% implied by the options market.”
A quick check of implied volatility skew, which is a plot of the implied volatility levels for options across different strike prices, shows a smile in the shortest of tenors, rather than a usual smirk.
Graphic: Retrieved from Cboe Global Markets Inc (BATS: CBOE).
Given this, the options with strike prices above current market prices are seemingly more pricey than those that have more time to expiration. One could think about structuring something like a Short Ratio Call Spread or, even, a Long Call Calendar Spread at or above current prices.
In the latter, any sideways-to-higher movement would allow for that spread to expand for profit.
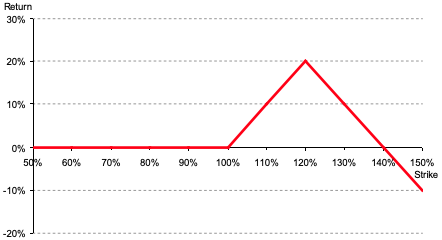
Graphic: Via Banco Santander SA (NYSE: SAN) research, the return profile, at expiry, of a classic 1×2 (long 1, short 2 further away) ratio spread.
Context: Participants’ proactive hedging of positive Delta equity exposure, via negative Delta put option exposures, as well as the monetization of those hedges into the decline, resulted in poor performance in IVOL metrics like the Cboe Volatility Index (INDEX: VIX).
Therefore, per the Cboe, it’s the case that “since the launch of the VIX Index, the past six-month period has been the weakest for volatility in 29 years, relative to similar [SPX] price moves.”
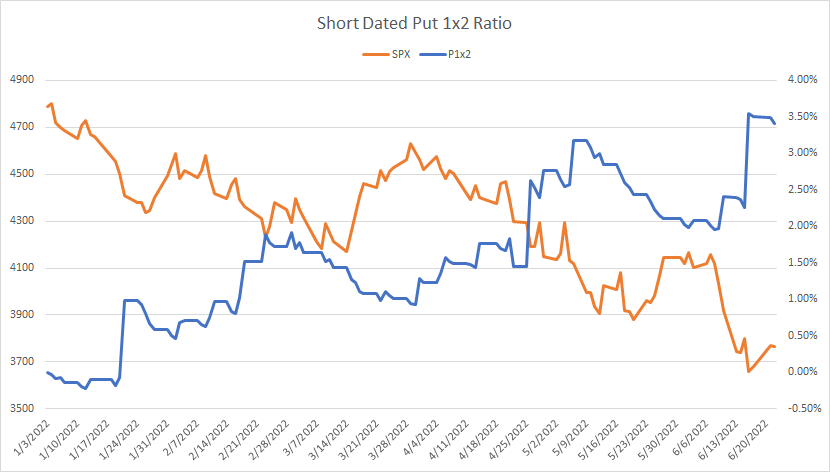
Accordingly, its structures we thought would work best, given the potential for measured selling, which others thought would carry a lot of risks, such as Short Ratio Put Spreads, that performed best, seen below.
Graphic: Via Pat Hennessy. “[T]he performance of short-dated 1×2 put ratios in SPX this year. Despite being short the tail, the grind lower has been well captured by this trade structure.”
Moreover, it’s the case that after a nearly 20% multi-month run, higher, markets are stretched.
To continue this pace would require, per JPMorgan Chase & Co (NYSE: JPM) strategists, a continued interest in demand for positive Delta exposure via equity or options, lower prints of consumer price data, as well as a dovish Federal Reserve (Fed) inflection.
The former we see now via call option volumes. The latter, not so much as the Federal Open Market Committee (FOMC) minutes “left the door open to another ‘unusually large’ increase at the next meeting in September,” in spite of a commitment to dial back if the data supported.
Graphic: Via Physik Invest. Data compiled by @jkonopas623. Fed Balance Sheet data, here. Treasury General Account Data, here. Reverse Repo data, here. NL = BS – TGA – RRP.
Presently, retail sales are steady, and supply pressures, though starting to ease, remain, bolstering inflation which the Fed is ultimately trying to stop from becoming entrenched.
Though there are fundamental contexts we are leaving out (e.g., negative earnings revisions, Chinese retail, industrial output, and investment data missing which prompted an easing, the use of tools like Treasury buybacks to ease disruptions via Fed-action, as well as increasing recession odds), in short, the focus should be on the technicals which actually make us money.
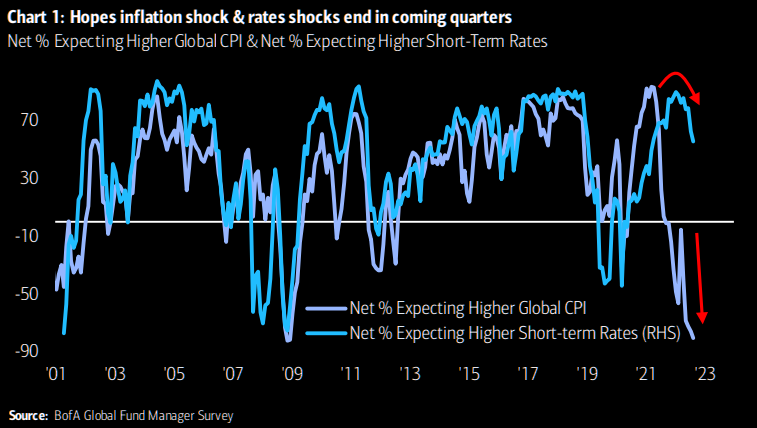
Graphic: Retrieved from The Market Ear. Via Bank of America Corporation (NYSE: BAC).
And, presently, on the heels of macro- and volatility-type re-leveraging, per Deutsche Bank AG (NYSE: DB) the technical contexts are bullish.
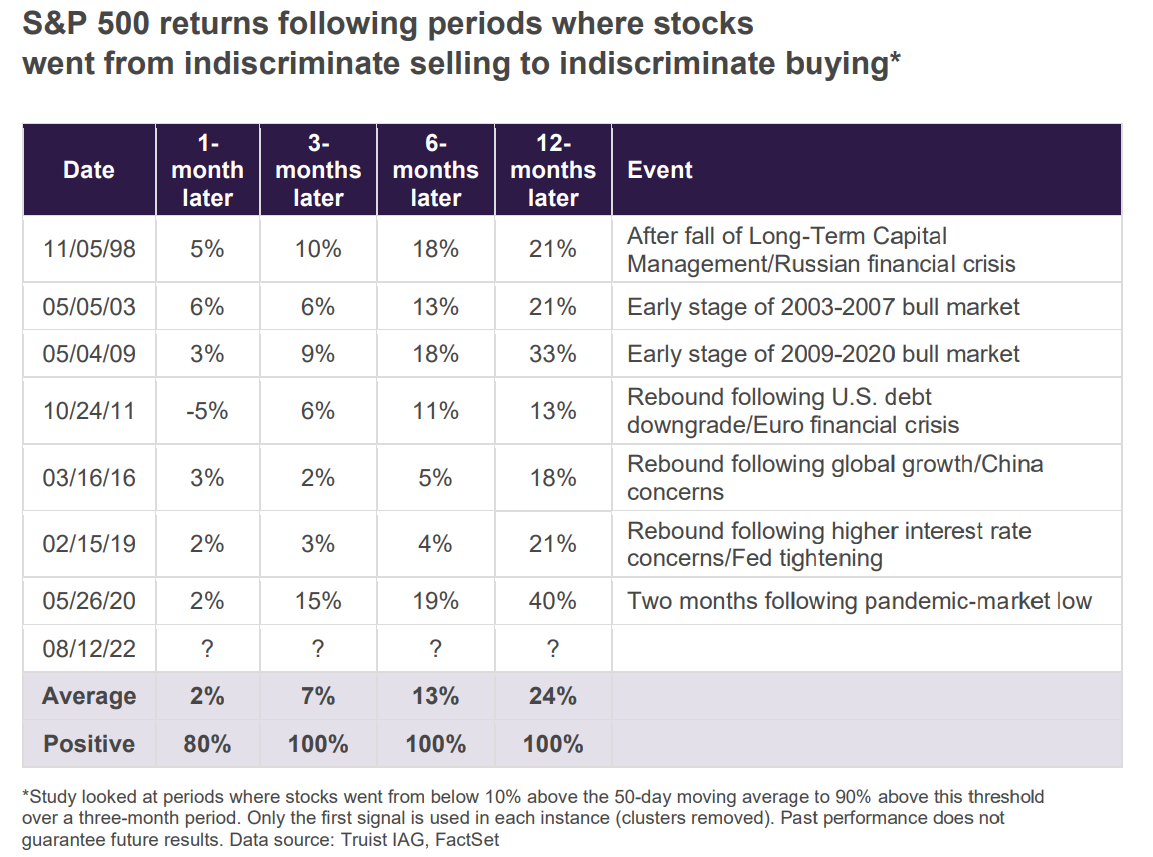
Keith Lerner, the co-chief investment officer and chief market strategist at Truist Financial Corporation’s (NYSE: TFC) Advisory Services puts it all well:
“Even if the Fed does pivot, they are less likely to support the markets as quickly as they have in the past given the scar tissue left behind as a result of the inflation challenges of the past year… The market rally over the past four weeks has been nothing short of impressive. Such strong buying pressure following indiscriminate selling has historically been a very positive sign for the market, often following important market bottoms. This is a welcome sign. Still, other factors in our work are less supportive. Indeed, markets are not only fighting the Fed, but the most aggressive global monetary tightening cycle in decades.”
Graphic: Retrieved from Bloomberg. Via Truist Financial Corporation (NYSE: TFC).
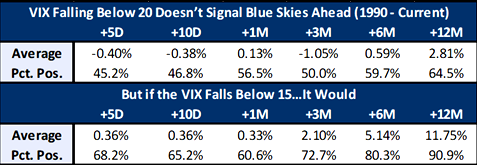
Beyond this, from a volatility perspective, we’d look for the VIX to sink below 15 to increase our optimism over a “sustained [and] better-than-typical” rally, per Jefferies Financial Group Inc (NYSE: JEF). Look at this last remark through the lens of participation on the part of traders who employ volatility-targeting strategies, for instance.
Graphic: Retrieved from The Market Ear. Via Jefferies Financial Group Inc (NYSE: JEF).
Technical
As of 7:20 AM ET, Thursday’s regular session (9:30 AM – 4:00 PM ET), in the S&P 500, is likely to open in the middle part of a balanced overnight inventory, inside of prior-range and -value, suggesting a limited potential for immediate directional opportunity.
In the best case, the S&P 500 trades higher.
Any activity above the $4,273.00 VPOC puts into play the $4,294.25 HVNode. Initiative trade beyond the HVNode could reach as high as the $4,337.00 VPOC and $4,393.75 HVNode, or higher.
In the worst case, the S&P 500 trades lower.
Any activity below the $4,273.00 VPOC puts into play the $4,253.25 HVNode. Initiative trade beyond the HVNode could reach as low as the $4,231.00 VPOC and $4,202.75 RTH Low, or lower.
Click here to load today’s key levels into the web-based TradingView charting platform. Note that all levels are derived using the 65-minute timeframe. New links are produced, daily.
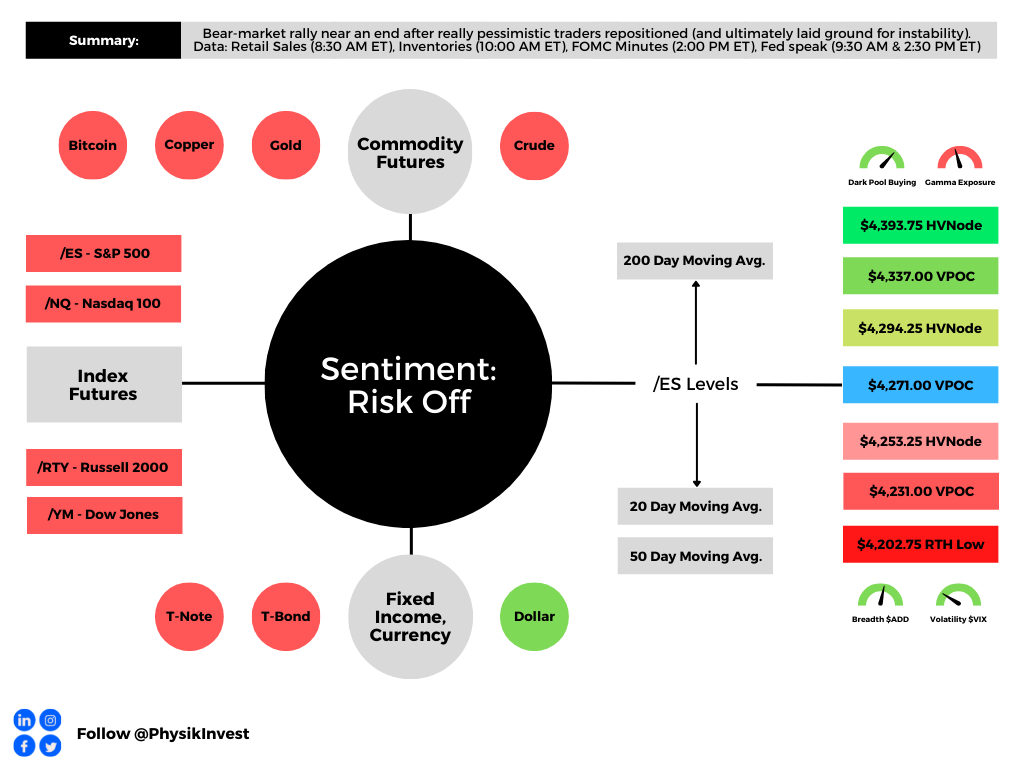
Graphic: 65-minute profile chart of the Micro E-mini S&P 500 Futures.
Considerations: Responsiveness near key-technical areas (that are discernable visually on a chart), suggests technically-driven traders with short time horizons are very active.
Such traders often lack the wherewithal to defend retests and, additionally, the type of trade may be indicative of the other time frame participants waiting for more information to initiate trades.
Definitions
Volume Areas: A structurally sound market will build on areas of high volume (HVNodes). Should the market trend for long periods of time, it will lack sound structure, identified as low volume areas (LVNodes). LVNodes denote directional conviction and ought to offer support on any test.
If participants were to auction and find acceptance into areas of prior low volume (LVNodes), then future discovery ought to be volatile and quick as participants look to HVNodes for favorable entry or exit.
POCs: POCs are valuable as they denote areas where two-sided trade was most prevalent in a prior day session. Participants will respond to future tests of value as they offer favorable entry and exit.
Gamma: Gamma is the sensitivity of an option to changes in the underlying price. Dealers that take the other side of options trades hedge their exposure to risk by buying and selling the underlying. When dealers are short-gamma, they hedge by buying into strength and selling into weakness. When dealers are long-gamma, they hedge by selling into strength and buying into weakness. The former exacerbates volatility. The latter calms volatility.
Vanna: The rate at which the delta of an option changes with respect to volatility.
Charm: The rate at which the delta of an option changes with respect to time.
About
After years of self-education, strategy development, mentorship, and trial-and-error, Renato Leonard Capelj began trading full-time and founded Physik Invest to detail his methods, research, and performance in the markets.
Capelj also develops insights around impactful options market dynamics at SpotGamma and is a Benzinga reporter.
In no way should the materials herein be construed as advice. Derivatives carry a substantial risk of loss. All content is for informational purposes only.
The daily brief is a free glimpse into the prevailing fundamental and technical drivers of U.S. equity market products. Join the 800+ that read this report daily, below!
Graphic updated 7:00 AM ET. Sentiment Risk-Off if expected /ES open is below the prior day’s range. /ES levels are derived from the profile graphic at the bottom of the following section. Levels may have changed since initially quoted; click here for the latest levels. SqueezeMetrics Dark Pool Index (DIX) and Gamma (GEX) calculations are based on where the prior day’s reading falls with respect to the MAX and MIN of all occurrences available. A higher DIX is bullish. At the same time, the lower the GEX, the more (expected) volatility. Learn the implications of volatility, direction, and moneyness. Breadth reflects a reading of the prior day’s NYSE Advance/Decline indicator. VIX reflects a current reading of the CBOE Volatility Index (INDEX: VIX) from 0-100.
Fundamental
Working through some in-depth coverage for this fundamental section. Report back, soon.
Positioning
As of 7:00 AM ET, Wednesday’s expected volatility, via the Cboe Volatility Index (INDEX: VIX), sits at ~1.07%. Tighter ranges, as a result of a sticky, long-gamma environment (in which the participants, who are on the other side of customer trades, hedge in a manner that takes from volatility) are likely to remain.
The potential for trading ranges to expand increases after large options expiries this week.
Further, given where realized (RVOL) and implied (IVOL) volatility measures are, as well as skew, it is beneficial to be a buyer of options structures. It is weeks prior to this near-vertical price rise that we mulled rotating into dynamic (options) bets and structures lined up against some key resistances.
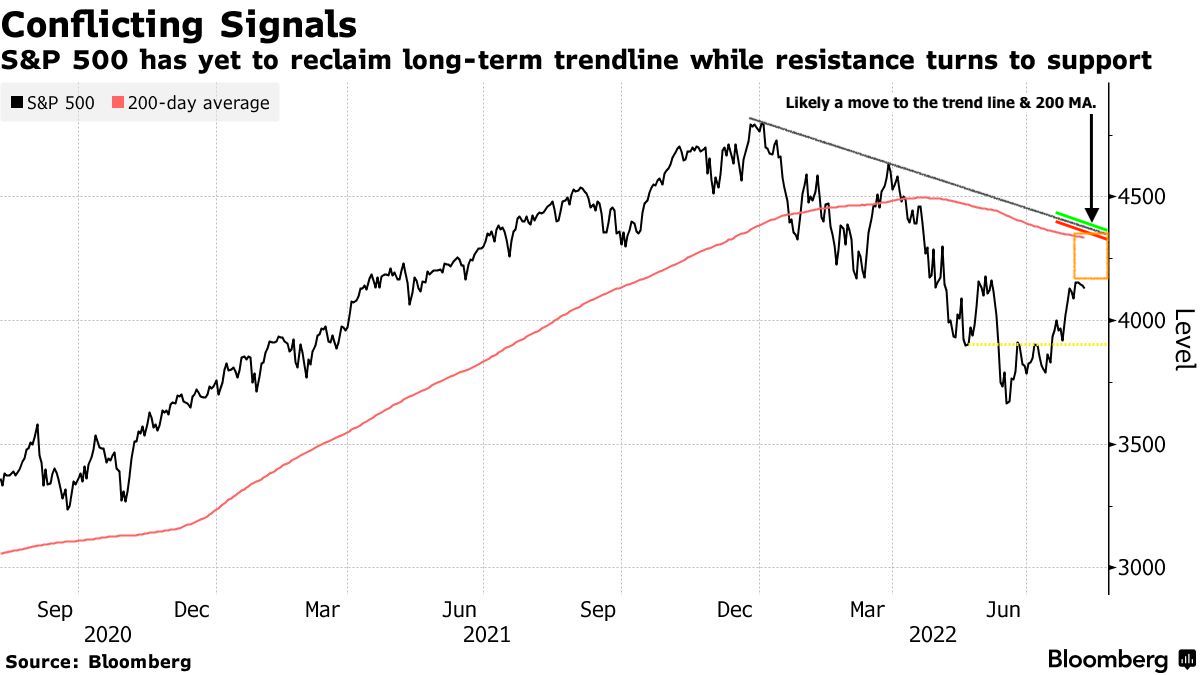
Graphic: Retrieved from Bloomberg. Drawn on by Physik Invest.
Moreover, where are we, right now?
As well explained in the Daily Brief for July 21, 2022, heading into the 2022 decline, institutions repositioned and hedged, even allocating to “commodity trend following,” per our Daily Brief for July 15, 2022, which worked well the first two quarters.
The monetization and counterparty hedging of existing customer hedges, as well as the sale of short-dated volatility, particularly in some of the single names where there was “rich” volatility, into the fall, lent to lackluster performance in equity IVOL and index mean reversion.
This trend came to an end as entities were squeezed out of trades not working (i.e., participants rotated out of volatility and commodities). This, alongside a re-leveraging on inflation cooling and better-than-expected earnings, bolstered a historic near-vertical price rise in equity markets.
Graphic: Retrieved from The Market Ear. Via Goldman Sachs Group Inc.
Continuing to bolster the near-vertical price rise is a rotation into bets on upside (call options). It is the hedging of this exposure, by counterparties, that can add to the follow-on buying (i.e., in selling a call option, the liquidity provider will, all else equal, buy underlying stock).
Graphic: Updated 8/15/2022. Retrieved from SqueezeMetrics.
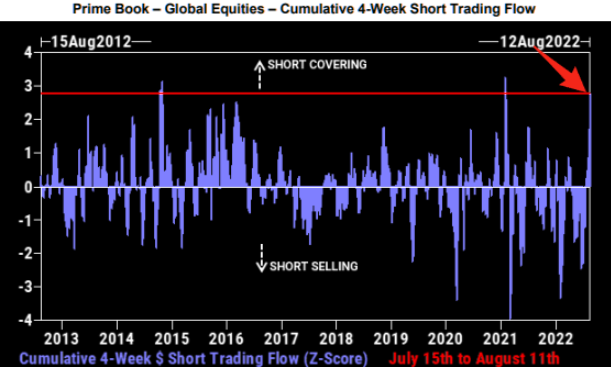
Accordingly, participants have been squeezed out of their (put) volatility hedges, “on the equity side,” and are now “less and less hedged,” as Kai Volatility’s Cem Karsan explains.
Given this, the “market can really begin to respond to the core macro factors.”
It is the case that when the macro re-leveraging ceases, and the present supportive volatility conditions ease, “the incremental effects” of liquidity (i.e., quantitative easing and tightening) may set the stage for a rollover.
Graphic: Via Physik Invest. Data compiled by @jkonopas623. Fed Balance Sheet data, here. Treasury General Account Data, here. Reverse Repo data, here. NL = BS – TGA – RRP.
If during this rollover, some shock was to surface, then the demand for hedges may assist in an “untethering” in IVOL, “one of the most supportive things into the decline,” Karsan explained.
Graphic: Retrieved from SqueezeMetrics. Learn the implications of volatility, direction, and moneyness.
So, what’s the takeaway?
The near-vertical price rise (alongside reports of better-than-expected earnings and the potential that inflation is beginning to cool) is sputtering. Follow-on support from a desire by participants to participate in upside synthetically and continued re-leveraging may ease in the next weeks.
Technical
As of 7:00 AM ET, Wednesday’s regular session (9:30 AM – 4:00 PM ET), in the S&P 500, is likely to open in the lower part of a negatively skewed overnight inventory, outside of prior-range and -value, suggesting a potential for immediate directional opportunity.
In the best case, the S&P 500 trades higher.
Any activity above the $4,271.00 VPOC puts into play the $4,294.25 HVNode. Initiative trade beyond the HVNode could reach as high as the $3,337.00 VPOC and $4,393.75 HVNode, or higher.
In the worst case, the S&P 500 trades lower.
Any activity below the $4,271.00 VPOC puts into play the $4,253.25 HVNode. Initiative trade beyond the HVNode could reach as low as the $4,231.00 VPOC and $4,202.75 RTH Low, or lower.
Click here to load today’s key levels into the web-based TradingView charting platform. Note that all levels are derived using the 65-minute timeframe. New links are produced, daily.
Graphic: 65-minute profile chart of the Micro E-mini S&P 500 Futures.
Considerations: Responsiveness near key-technical areas (that are discernable visually on a chart), suggests technically-driven traders with short time horizons are very active.
Such traders often lack the wherewithal to defend retests and, additionally, the type of trade may be indicative of the other time frame participants waiting for more information to initiate trades.
Definitions
Volume Areas: A structurally sound market will build on areas of high volume (HVNodes). Should the market trend for long periods of time, it will lack sound structure, identified as low volume areas (LVNodes). LVNodes denote directional conviction and ought to offer support on any test.
If participants were to auction and find acceptance into areas of prior low volume (LVNodes), then future discovery ought to be volatile and quick as participants look to HVNodes for favorable entry or exit.
POCs: POCs are valuable as they denote areas where two-sided trade was most prevalent in a prior day session. Participants will respond to future tests of value as they offer favorable entry and exit.
About
After years of self-education, strategy development, mentorship, and trial-and-error, Renato Leonard Capelj began trading full-time and founded Physik Invest to detail his methods, research, and performance in the markets.
Capelj also develops insights around impactful options market dynamics at SpotGamma and is a Benzinga reporter.
In no way should the materials herein be construed as advice. Derivatives carry a substantial risk of loss. All content is for informational purposes only.
The daily brief is a free glimpse into the prevailing fundamental and technical drivers of U.S. equity market products. Join the 750+ that read this report daily, below!
Graphic updated 7:00 AM ET. Sentiment Neutral if expected /ES open is inside of the prior day’s range. /ES levels are derived from the profile graphic at the bottom of the following section. Levels may have changed since initially quoted; click here for the latest levels. SqueezeMetrics Dark Pool Index (DIX) and Gamma (GEX) calculations are based on where the prior day’s reading falls with respect to the MAX and MIN of all occurrences available. A higher DIX is bullish. At the same time, the lower the GEX, the more (expected) volatility. Learn the implications of volatility, direction, and moneyness. Breadth reflects a reading of the prior day’s NYSE Advance/Decline indicator. VIX reflects a current reading of the CBOE Volatility Index (INDEX: VIX) from 0-100.
Fundamental
We’ll skip the fundamentals section, today, and do an in-depth review, sometime next week.
Positioning
As of 7:00 AM ET, Friday’s expected volatility, via the Cboe Volatility Index (INDEX: VIX), sits at ~1.06%. Net gamma exposures generally rising may promote tighter trading ranges.
Graphic: Via Physik Invest. Data retrieved from SqueezeMetrics.
As stated yesterday, it may be beneficial for traders to shift their focus to dynamic structures. In other words, be a buyer of options structures (i.e., replace static directional exposures or Delta with those that are dynamic).
This is (1) due to where realized (RVOL) and implied (IVOL) volatility measures, and skew.
Graphic: Retrieved from Interactive Brokers Group Inc’s (NASDAQ: IBKR) Trader Workstation.
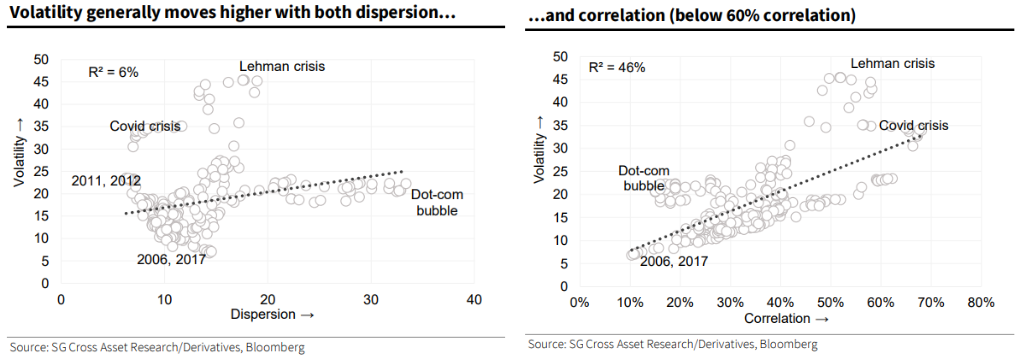
As well as (2) increased average stock correlation and lower return dispersion which, per Societe Generale SA (OTC: SCGLY) research, make stock picking hard(er).
It can be the case that Delta hedging becomes easier, too, as one asset, in a more correlated environment, can better offset the first-order sensitivities elsewhere.
Graphic: Retrieved from Bloomberg. Via Societe Generale.
The reason why?
In regards to the correlation and dispersion remark, that’s more to do with the risk-off sentiment and the impact of tightening liquidity affecting all risk assets, basically.
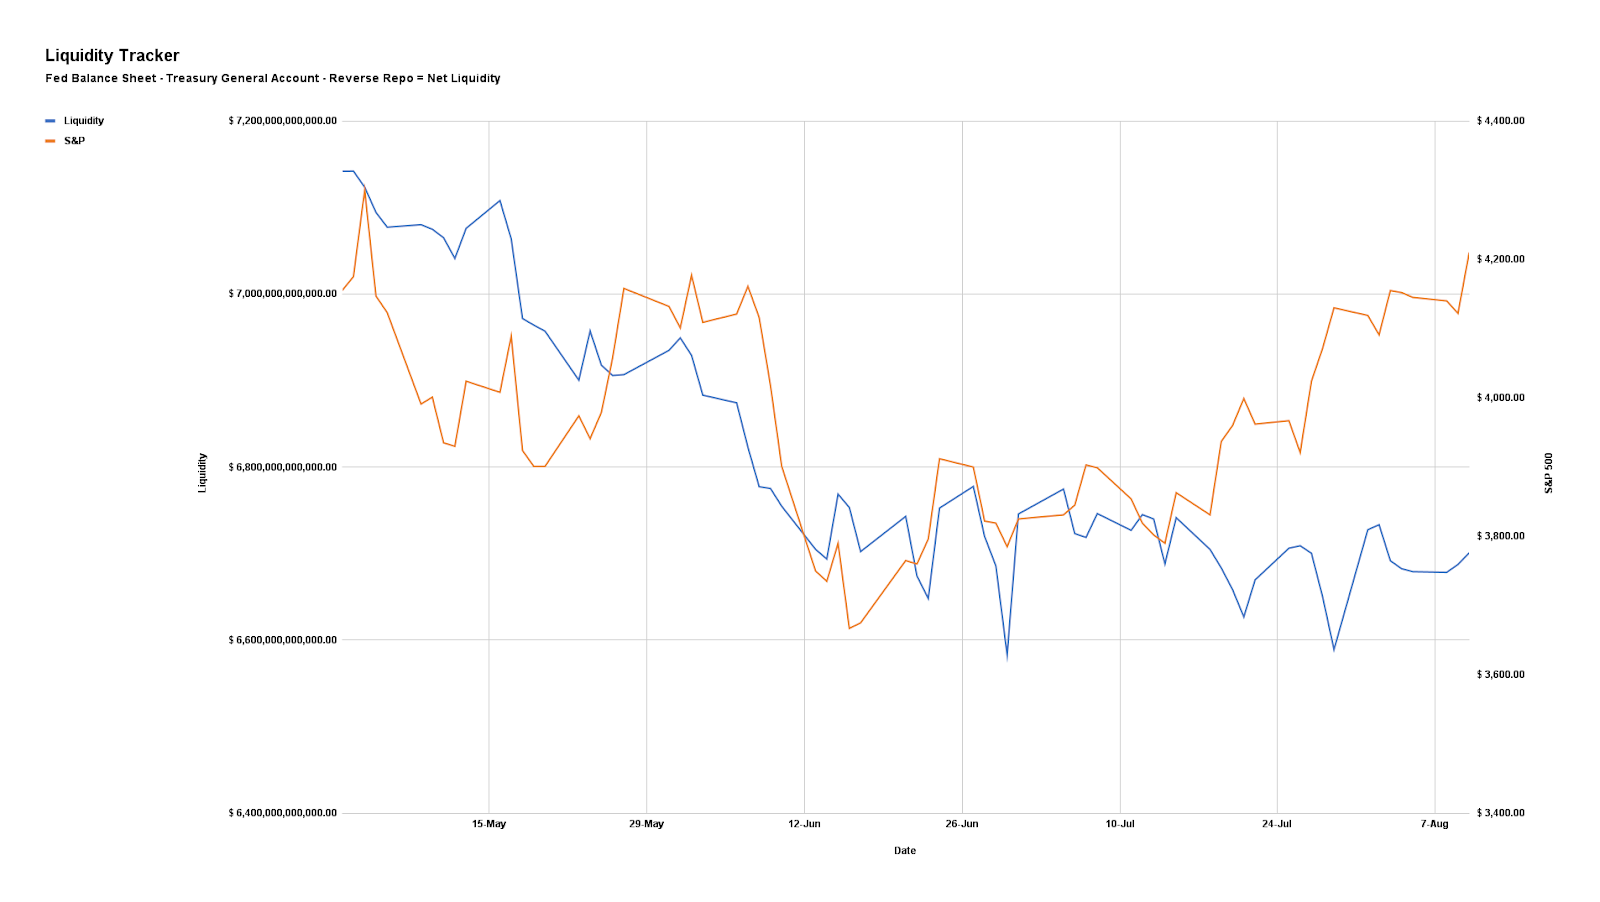
Graphic: Via PhysikInvest. Data compiled by @jkonopas623. Fed Balance Sheet data, here. Treasury General Account Data, here. Reverse Repo data, here. NL = BS – TGA – RRP.
Regarding the volatility issue (RVOL, IVOL, and skew), that’s more to do with hedging trends.
Essentially, the monetization and counterparty hedging of existing customer hedges, as well as the sale of short-dated volatility, particularly in some of the single names where there was “rich” volatility, into the fall, lent to lackluster performance in IVOL and index mean reversion.
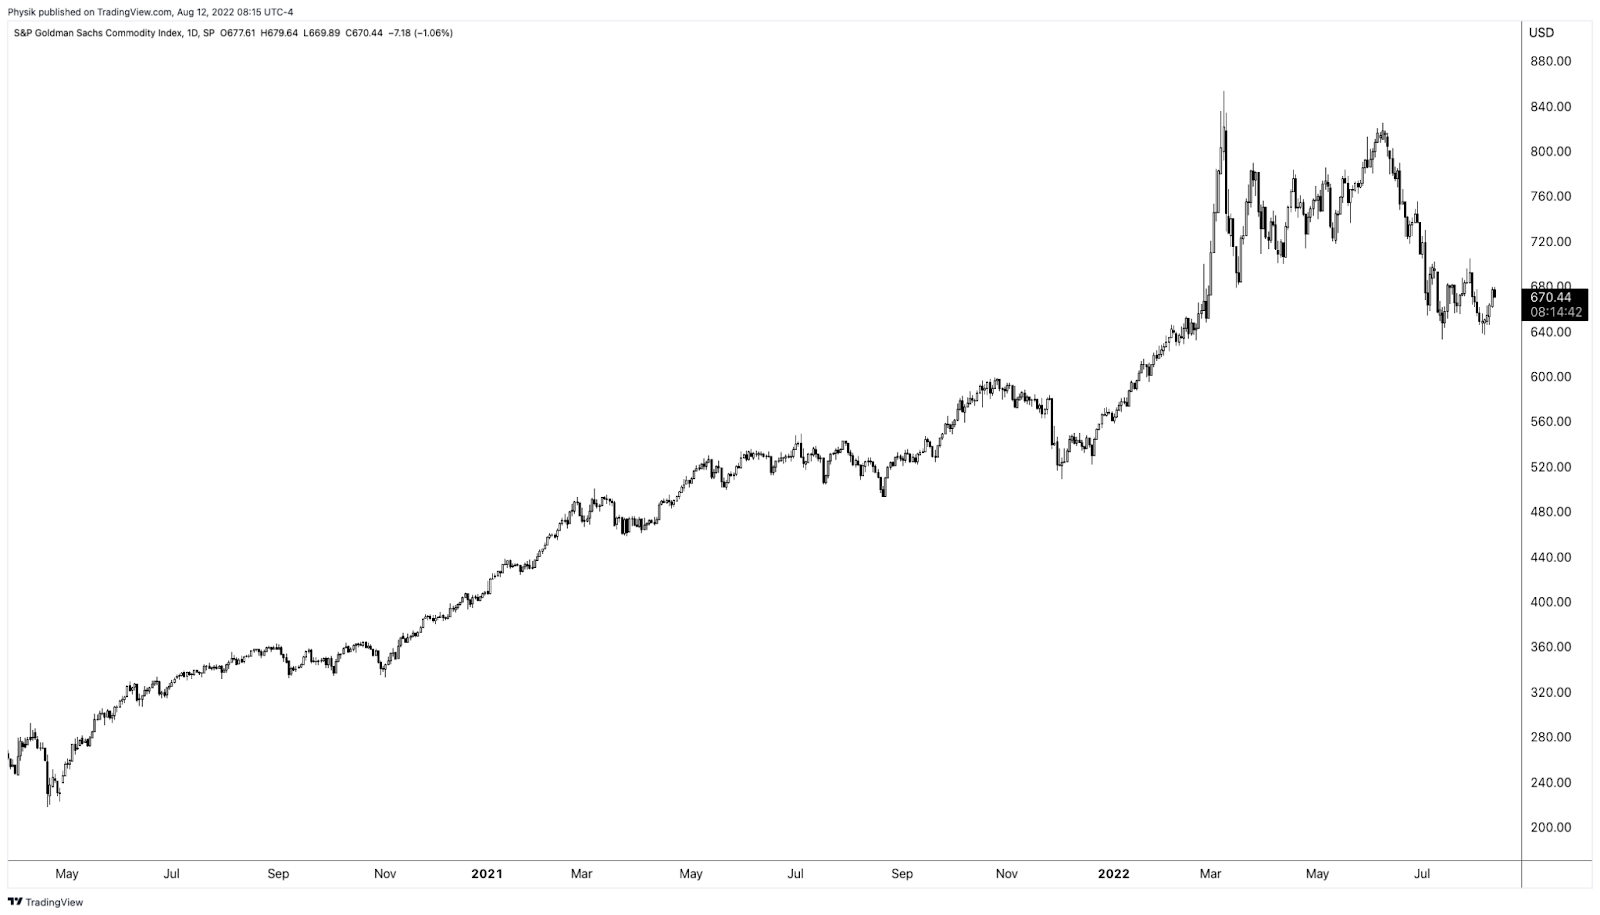
Accordingly, “if commodities are not performing … as a hedge, that opens the door,” to markets falling and traders demand equity volatility hedges, per The Ambrus Group’s Kris Sidial.
Learn about options dealer flows, inflation, and investing in a changing world with Cem Karsan.
Graphic: Retrieved by Physik Invest from TradingView. S&P Goldman Sachs Commodity Index.
Adding, per to SpotGamma, “a lot of the boost from volatility compression has played out. With IVOL at a lower bound, it may be opportune to replace static Delta bets for those that are dynamic (i.e., long option exposures) and have less to lose in this lower volatility environment.”
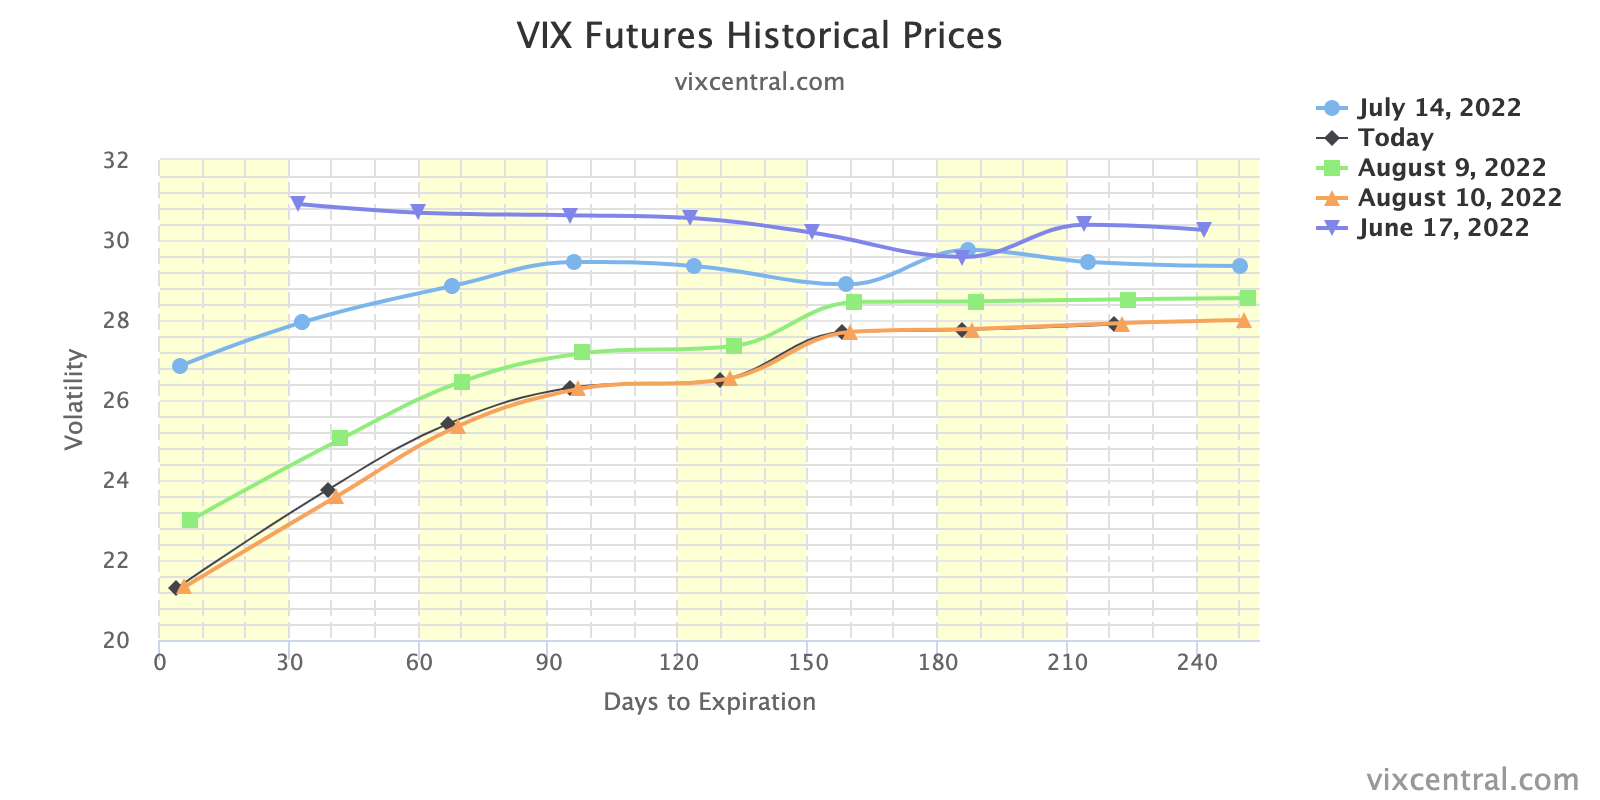
Graphic: Retrieved from Vix Central. The term structure of IVOL.
“In a case where market participants see the Fed keeping its commitment to aggressive monetary policy action, negative Delta options exposures may outperform static short equity (bets on the downside).”
Graphic: Retrieved from Bloomberg. “Thursday’s message was that on mature reflection, the progress on the economy didn’t justify taking the stock market any higher than it was at the start of the day.”
If bullish, sample structures to consider, given a smiley skew, include low- or zero-cost bullish call ratio spreads, against the trend resistances in products like the S&P 500 (INDEX: SPX).
Graphic: Retrieved from Bloomberg. Drawn on by Physik Invest.
Technical
As of 7:00 AM ET, Friday’s regular session (9:30 AM – 4:00 PM ET), in the S&P 500, is likely to open in the middle part of a nearly balanced overnight inventory, inside of prior-range and -value, suggesting a limited potential for immediate directional opportunity.
In the best case, the S&P 500 trades higher.
Any activity above the $4,227.75 HVNode puts into play the $4,253.25 HVNode. Initiative trade beyond the latter could reach as high as the $4,275.75 LVNode and $4,303.00 Weak High, or higher.
In the worst case, the S&P 500 trades lower.
Any activity below the $4,227.75 HVNode puts into play the $4,202.75 RTH Low. Initiative trade beyond the RTH Low could reach as low as the $4,189.25 LVNode and $4,153.25 HVNode, or lower.
Click here to load today’s key levels into the web-based TradingView charting platform. Note that all levels are derived using the 65-minute timeframe. New links are produced, daily.
Graphic: 65-minute profile chart of the Micro E-mini S&P 500 Futures.
Definitions
Volume Areas: A structurally sound market will build on areas of high volume (HVNodes). Should the market trend for long periods of time, it will lack sound structure, identified as low volume areas (LVNodes). LVNodes denote directional conviction and ought to offer support on any test.
If participants were to auction and find acceptance into areas of prior low volume (LVNodes), then future discovery ought to be volatile and quick as participants look to HVNodes for favorable entry or exit.
POCs: POCs are valuable as they denote areas where two-sided trade was most prevalent in a prior day session. Participants will respond to future tests of value as they offer favorable entry and exit.
MCPOCs: POCs are valuable as they denote areas where two-sided trade was most prevalent over numerous day sessions. Participants will respond to future tests of value as they offer favorable entry and exit.
Volume-Weighted Average Prices (VWAPs): A metric highly regarded by chief investment officers, among other participants, for quality of trade. Additionally, liquidity algorithms are benchmarked and programmed to buy and sell around VWAPs.
About
After years of self-education, strategy development, mentorship, and trial-and-error, Renato Leonard Capelj began trading full-time and founded Physik Invest to detail his methods, research, and performance in the markets.
Capelj also develops insights around impactful options market dynamics at SpotGamma and is a Benzinga reporter.
In no way should the materials herein be construed as advice. Derivatives carry a substantial risk of loss. All content is for informational purposes only.
The daily brief is a free glimpse into the prevailing fundamental and technical drivers of U.S. equity market products. Join the 750+ that read this report daily, below!
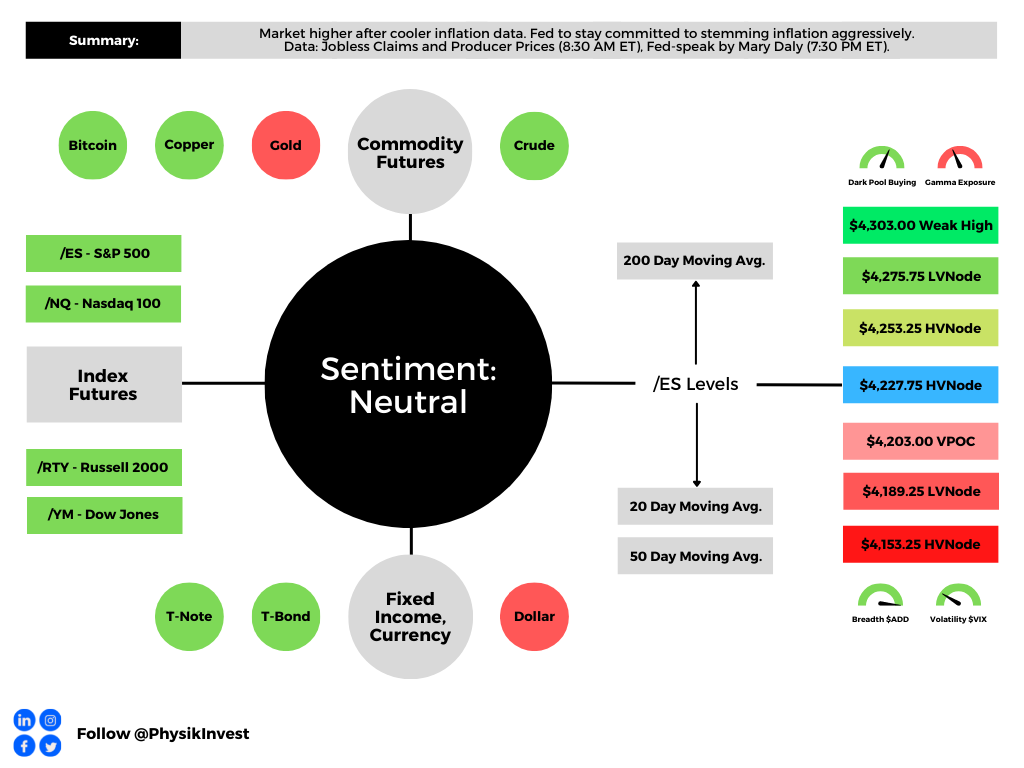
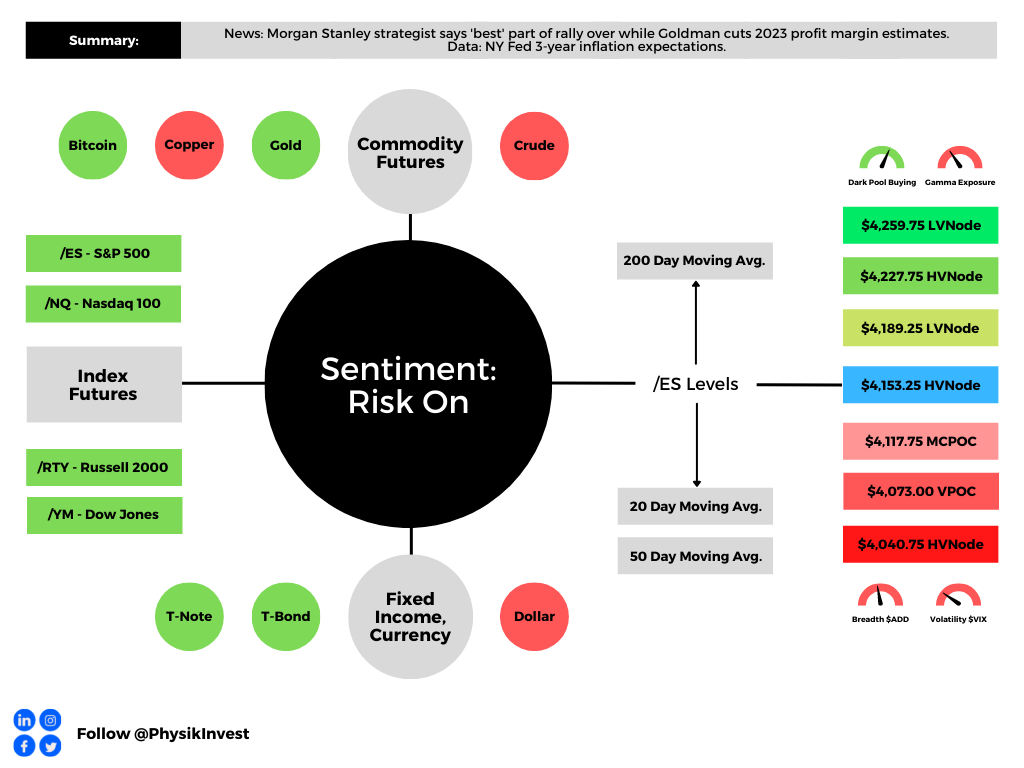
Graphic updated 7:30 AM ET. Sentiment Risk-On if expected /ES open is above the prior day’s range. /ES levels are derived from the profile graphic at the bottom of the following section. Levels may have changed since initially quoted; click here for the latest levels. SqueezeMetrics Dark Pool Index (DIX) and Gamma (GEX) calculations are based on where the prior day’s reading falls with respect to the MAX and MIN of all occurrences available. A higher DIX is bullish. At the same time, the lower the GEX, the more (expected) volatility. Learn the implications of volatility, direction, and moneyness. Breadth reflects a reading of the prior day’s NYSE Advance/Decline indicator. VIX reflects a current reading of the CBOE Volatility Index (INDEX: VIX) from 0-100.
Fundamental
Equity market rally spurred by cooler a Consumer Price Index (CPI).
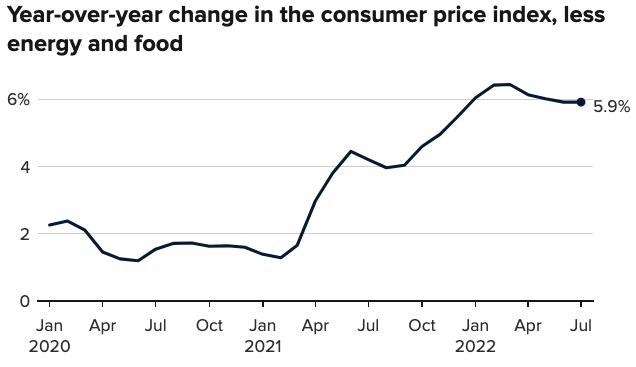
Expected was an 8.7% rise year-over-year (YoY) and 0.2% month-over-month (MoM). Core CPI (which excludes food and energy) was to rise by 6.1% YoY and 0.5% MoM, respectively.
Officially, the headline number rose to 8.5%. The core CPI rose 5.9% YoY and 0.3% MoM, meaning the March peak remains (6.5% YoY, then).
Participants responded positively to the number, as expected could happen in a case where the CPI printed lower.
As I talked about in yesterday’s morning letter and in a SpotGamma note, with easing inflation:
(1) investors may command a lower rate of return for their purchasing power and (2) lower rates (if policymakers were to become less aggressive) do less to negatively impact discounted cash flows and the ability to finance future growth.
It is the case that immediately after the release of the CPI, traders dramatically shifted their bets on monetary action.
Previously, it was thought a 75 to 100 basis point hike would follow the report. Now, there are higher odds, as priced by the market, that there is a 25 to 50 basis point hike.
Graphic: Retrieved from CME Group Inc (NASDAQ: CME).
“I think the market is a bit overly giddy on this CPI number and it’s probably unlikely that the [Federal Reserve] (Fed) will start to ease up and take a less hawkish stance,” The Ambrus Group’s Kris Sidial put forth.
“The increase in risk assets somewhat gives the Fed the green light to be able to move more swiftly with a hawkish tone.”
Accordingly, the Fed’s Mary Daly said it is too early to declare victory in the inflation fight (and rightfully so), signaling, however, that she may support a slower pace of hikes.
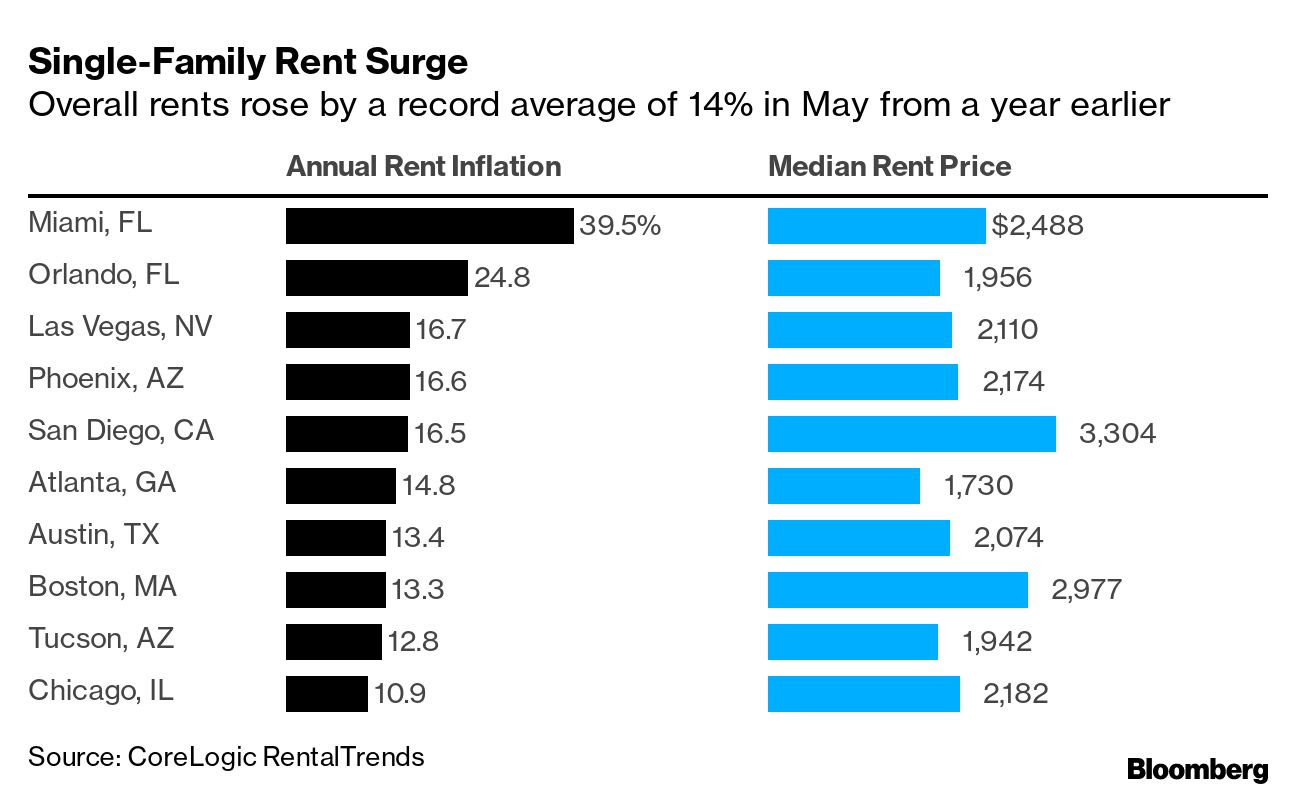
This is as home buyers and renters, in some areas, are seeing large hikes in prices. For instance, per one Bloomberg article, a Miami native saw their rent increase “by $650 to $2,400.00 a month,” forcing them to search for new places to live.
The Ambrus Group’s Sidial adds:
“Inflation is one of those things that is difficult to control when it’s out [of] the bag (historically). I think the Fed understands this and if they have the opportunity to tame it, while not completely obliterating risk assets, it seems like a perfect scenario.”
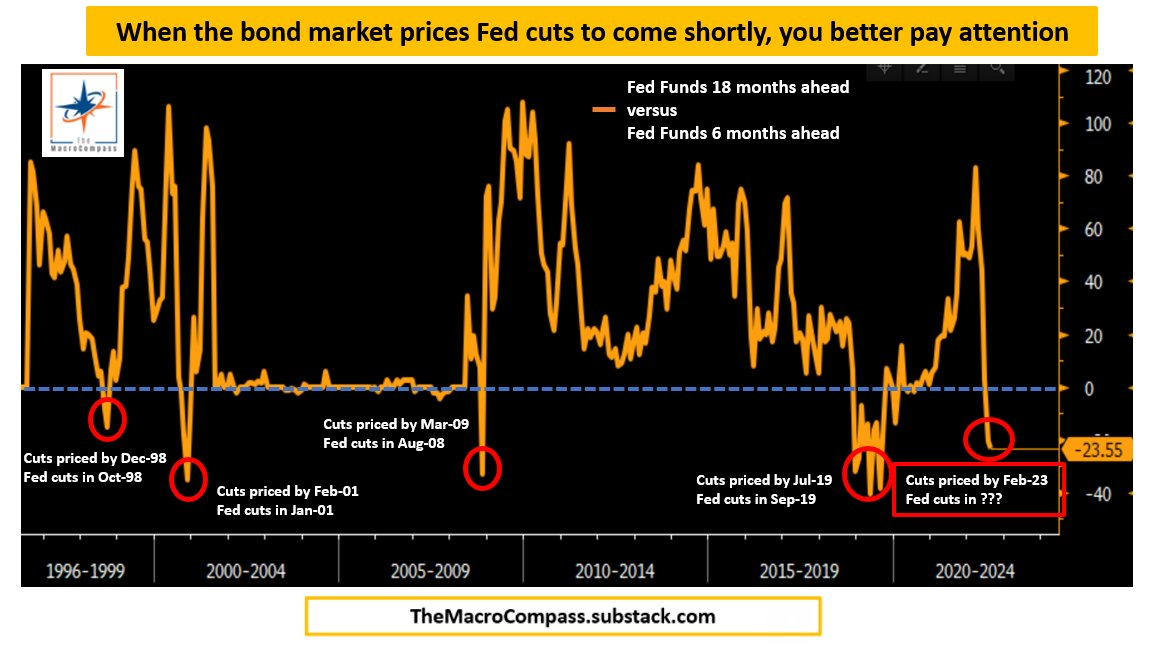
Ultimately, farther out in time, some metrics, which have incredible success in forecasting pivots, show the Fed likely to cut in 2023, shortly following the aggressive hiking cycle.
Graphic: Retrieved from Alfonso Peccatiello of The Macro Compass.
On the topic of (eventual) declines and slowing in the risk assets (like housing), “in most cases today, a borrower with 60 points of equity in their property, even facing moderate declines in their current home price, are not a big default risk,” explains Dan Ivascyn of PIMCO.
“A lot of what we like in the market today is seasoned-type risk that benefits from the multi-years of home price appreciation, and therefore is much less sensitive to what goes on from this point forward.”
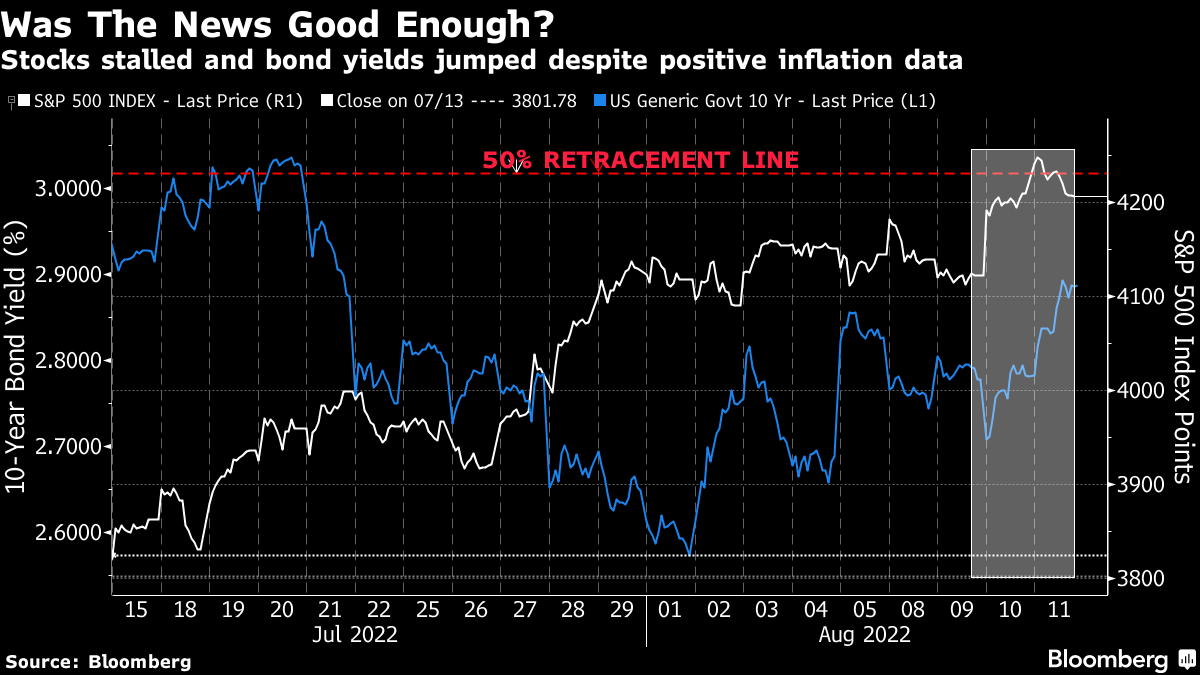
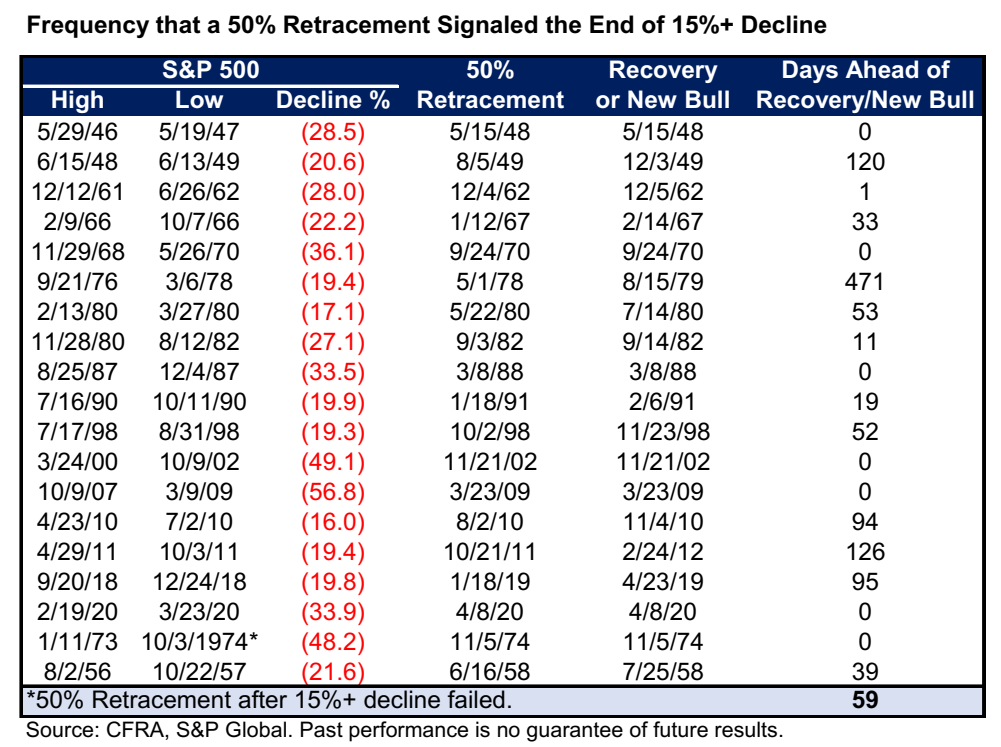
From an S&P 500 (INDEX: SPX) perspective, the index has basically recouped half its losses for the year. This often came after the bear lows were in.
Graphic: Retrieved from Bloomberg.
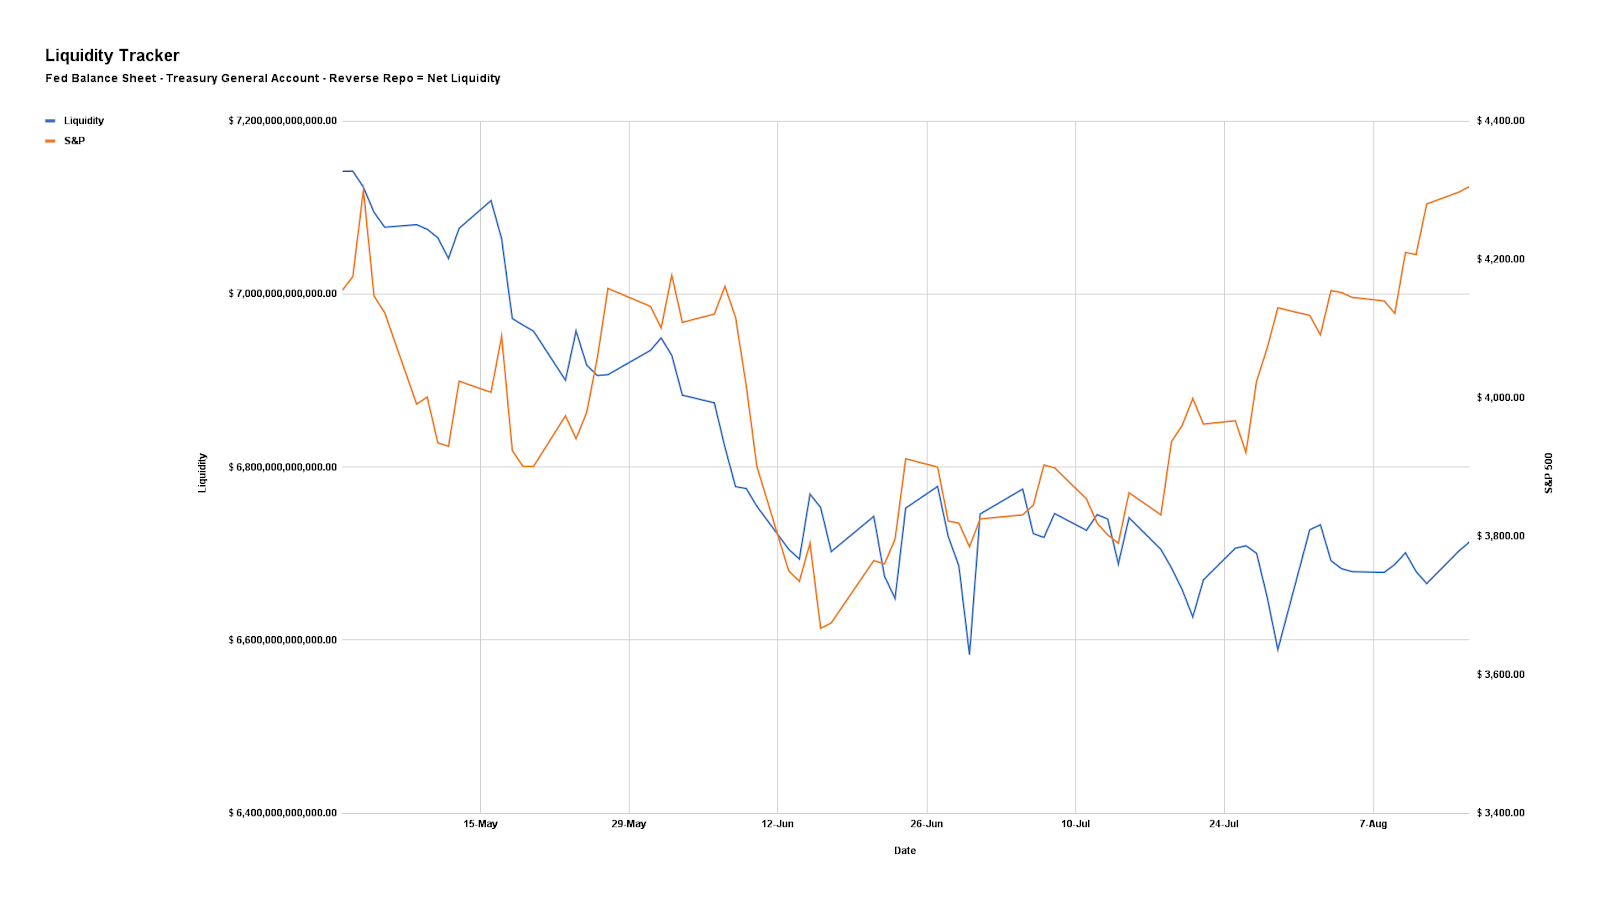
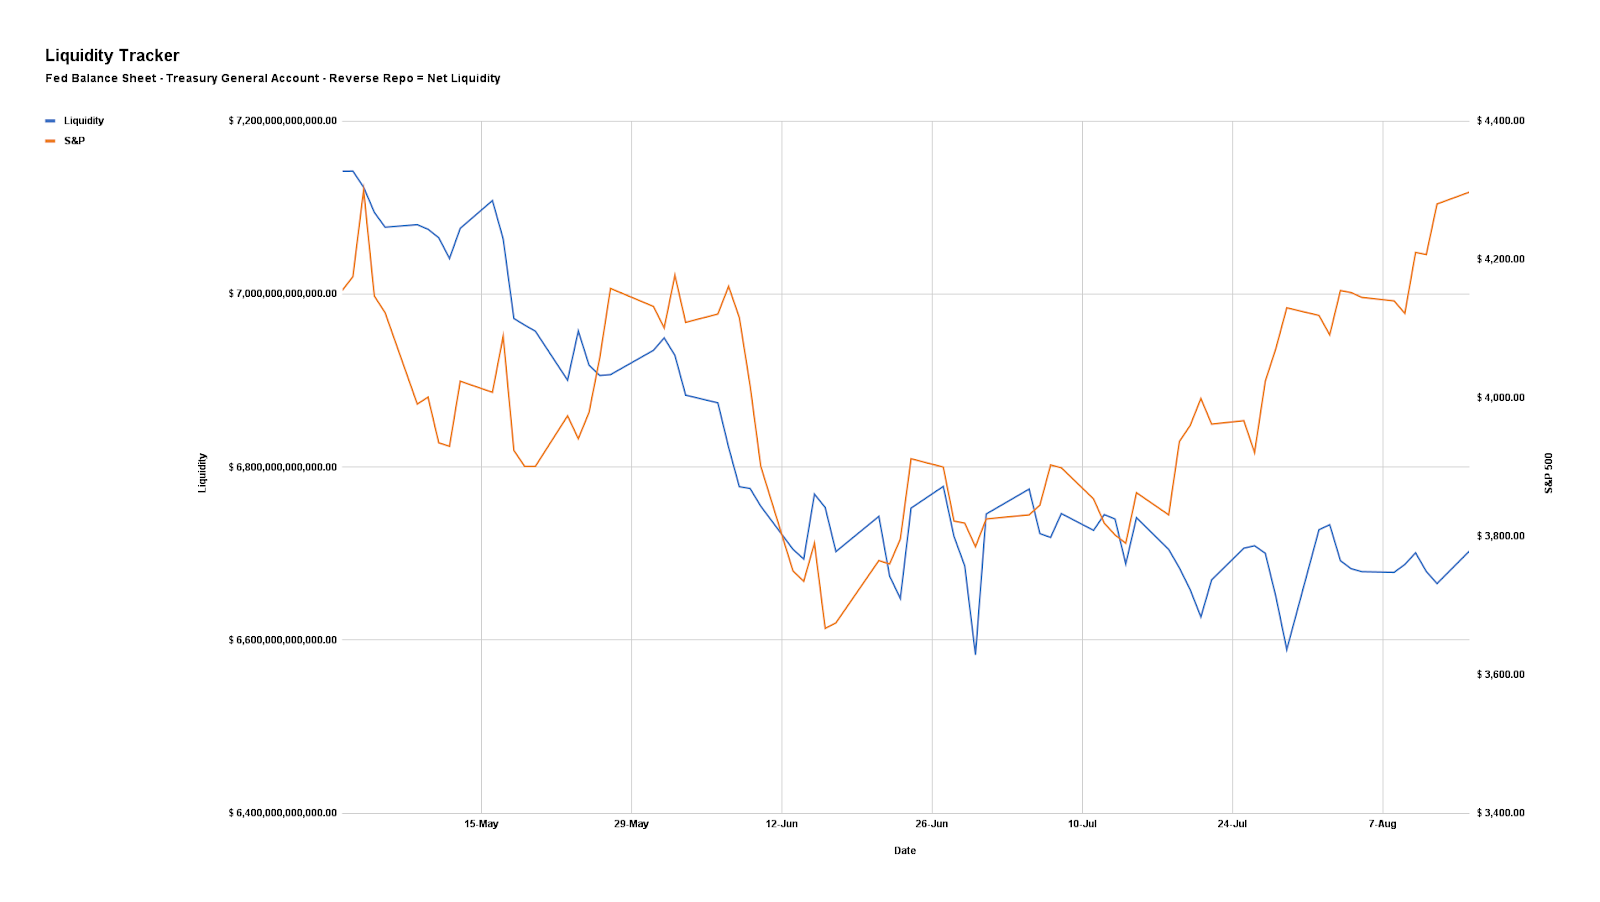
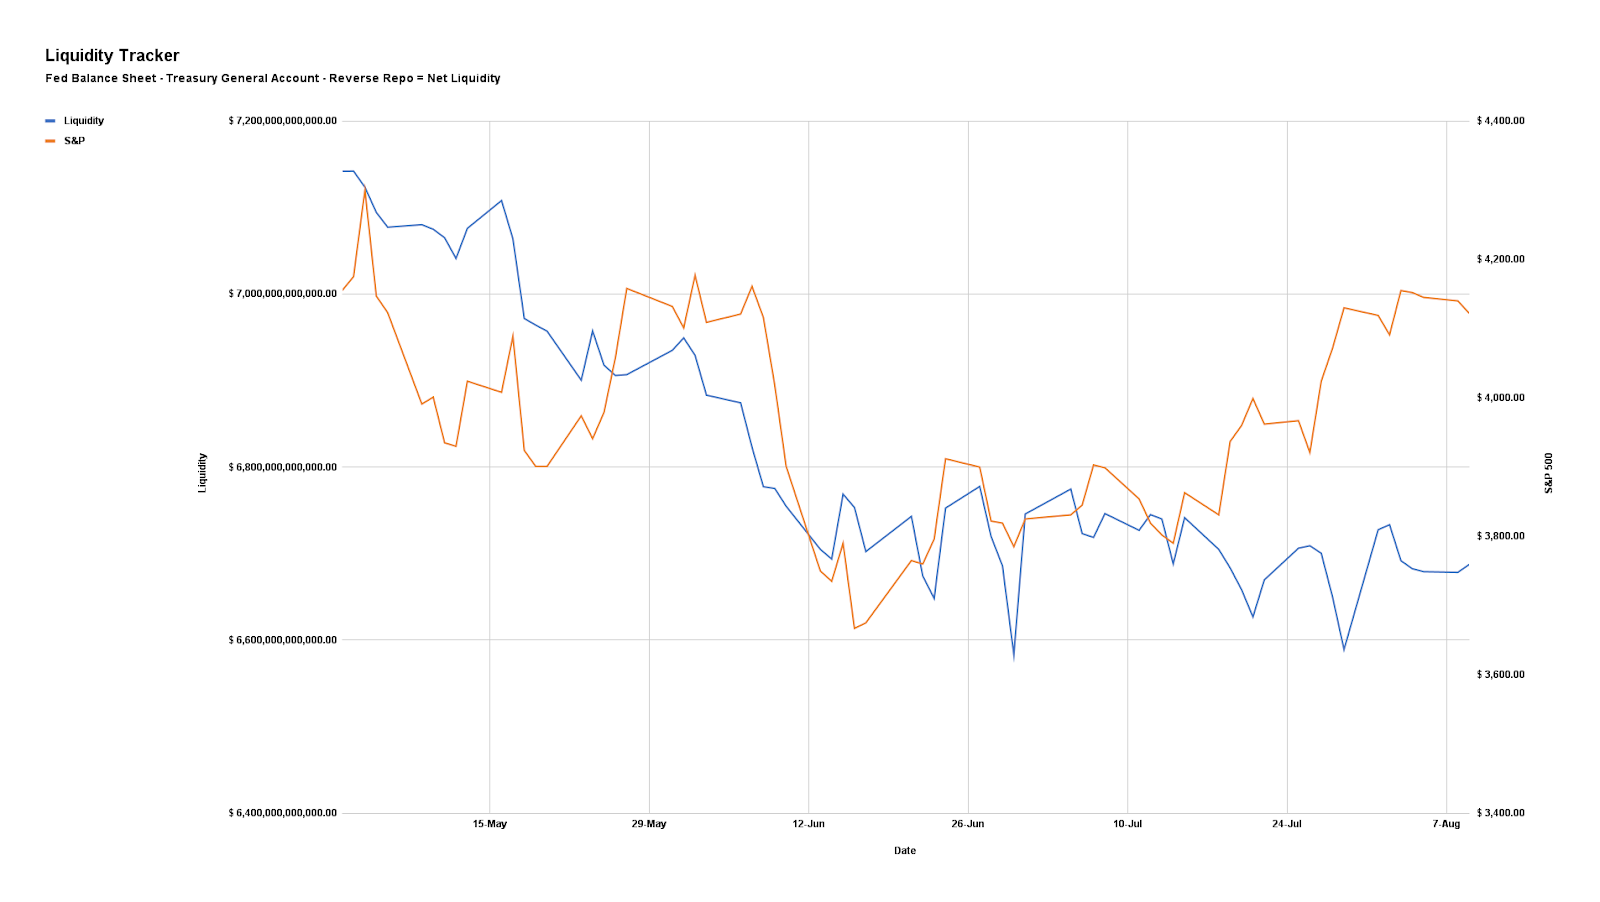
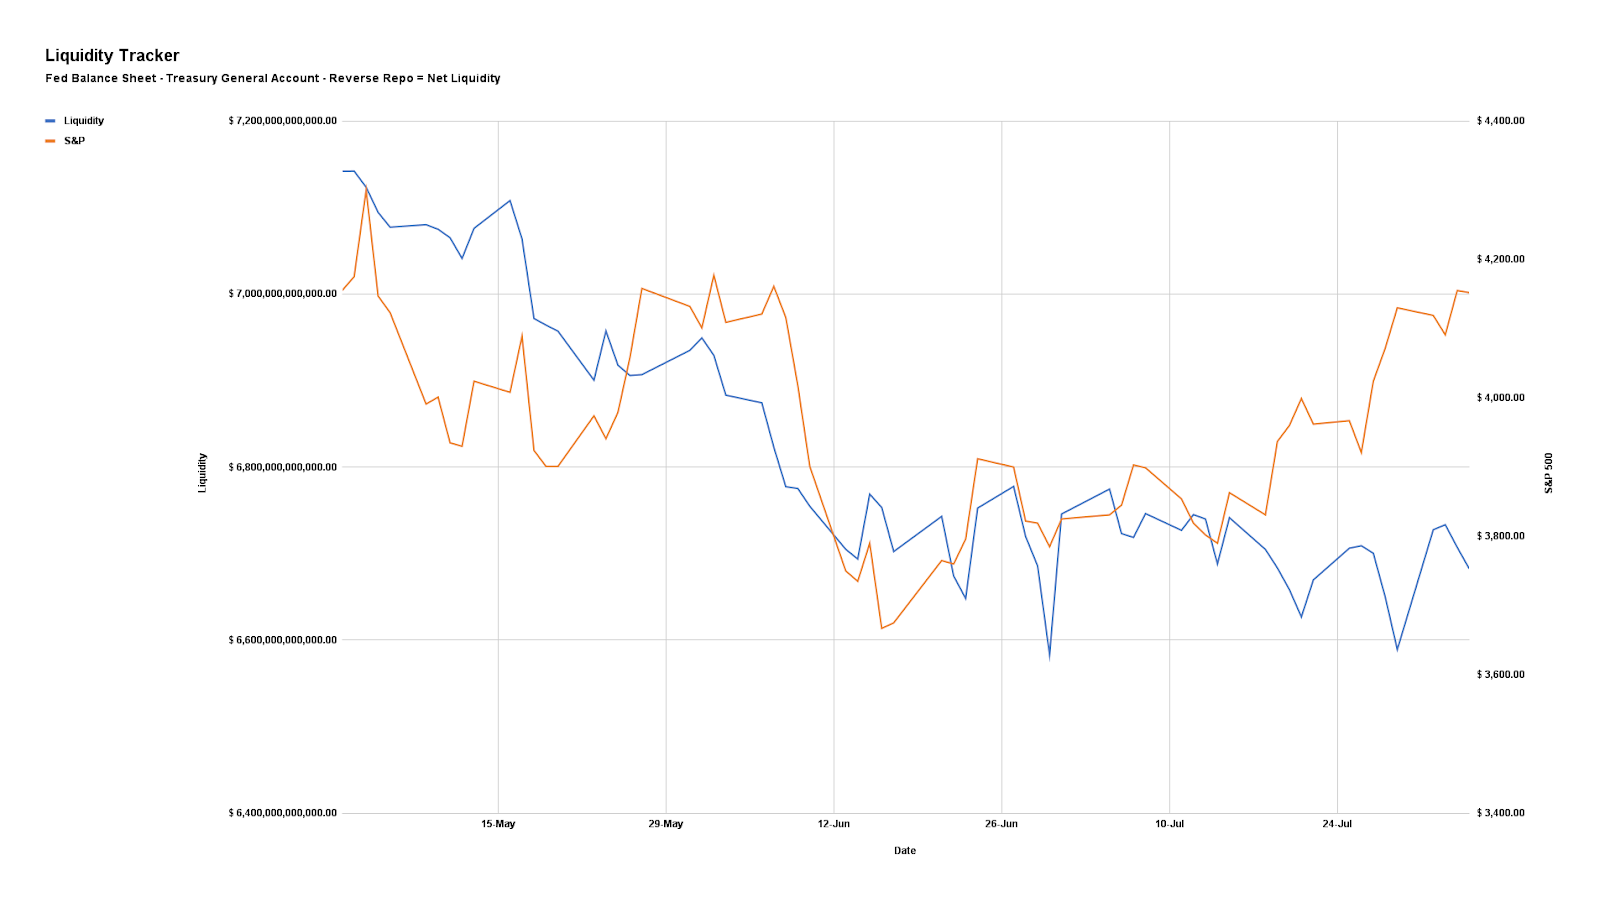
Notwithstanding, here’s our updated liquidity tracker that is monitoring the “preeminent driver of markets during the post-crisis decade.”
Graphic: Via Physik Invest. Data compiled by @jkonopas623. Fed Balance Sheet data, here. Treasury General Account Data, here. Reverse Repo data, here. NL = BS – TGA – RRP.
Positioning
As of 7:15 AM ET, Thursday’s expected volatility, via the Cboe Volatility Index (INDEX: VIX), sits at ~1.04%. Net gamma exposures increasing may promote tighter trading ranges.
Given where realized (RVOL) and implied (IVOL) volatility measures are, as well as skew, it is beneficial to be a buyer of options structures (i.e., replacing static directional exposures or delta with those that are dynamic) tied to the broader measures we follow like the S&P 500 (given increased average stock correlation and lower return dispersion).
The reason why?
Per SpotGamma: “From an options perspective, a lot of the boost from volatility compression has played out. With implied volatility at a lower bound, it may be opportune to replace static delta bets for those that are dynamic (i.e., long option exposures) and have less to lose in this lower volatility environment.”
“In a case where market participants see the Fed keeping its commitment to aggressive monetary policy action, negative delta options exposures may outperform static short equity (bets on the downside).”
Technical
As of 7:30 AM ET, Thursday’s regular session (9:30 AM – 4:00 PM ET), in the S&P 500, is likely to open in the upper part of a positively skewed overnight inventory, outside of prior-range and -value, suggesting a potential for immediate directional opportunity.
In the best case, the S&P 500 trades higher.
Any activity above the $4,227.75 HVNode puts into play the $4,253.25 HVNode. Initiative trade beyond the latter could reach as high as the $4,275.75 LVNode and $4,303.00 Weak High, or higher.
In the worst case, the S&P 500 trades lower.
Any activity below the $4,227.75 HVNode puts into play the $4,203.00 VPOC. Initiative trade beyond the VPOC could reach as low as the $4,189.25 LVNode and $4,153.25 HVNode, or lower.
Click here to load today’s key levels into the web-based TradingView charting platform. Note that all levels are derived using the 65-minute timeframe. New links are produced, daily.
Graphic: 65-minute profile chart of the Micro E-mini S&P 500 Futures.
Definitions
Volume Areas: A structurally sound market will build on areas of high volume (HVNodes). Should the market trend for long periods of time, it will lack sound structure, identified as low volume areas (LVNodes). LVNodes denote directional conviction and ought to offer support on any test.
If participants were to auction and find acceptance into areas of prior low volume (LVNodes), then future discovery ought to be volatile and quick as participants look to HVNodes for favorable entry or exit.
POCs: POCs are valuable as they denote areas where two-sided trade was most prevalent in a prior day session. Participants will respond to future tests of value as they offer favorable entry and exit.
MCPOCs: POCs are valuable as they denote areas where two-sided trade was most prevalent over numerous day sessions. Participants will respond to future tests of value as they offer favorable entry and exit.
Volume-Weighted Average Prices (VWAPs): A metric highly regarded by chief investment officers, among other participants, for quality of trade. Additionally, liquidity algorithms are benchmarked and programmed to buy and sell around VWAPs.
About
After years of self-education, strategy development, mentorship, and trial-and-error, Renato Leonard Capelj began trading full-time and founded Physik Invest to detail his methods, research, and performance in the markets.
Capelj also develops insights around impactful options market dynamics at SpotGamma and is a Benzinga reporter.
In no way should the materials herein be construed as advice. Derivatives carry a substantial risk of loss. All content is for informational purposes only.
The daily brief is a free glimpse into the prevailing fundamental and technical drivers of U.S. equity market products. Join the 750+ that read this report daily, below!
Graphic updated 6:35 AM ET. Sentiment Neutral if expected /ES open is inside of the prior day’s range. /ES levels are derived from the profile graphic at the bottom of the following section. Levels may have changed since initially quoted; click here for the latest levels. SqueezeMetrics Dark Pool Index (DIX) and Gamma (GEX) calculations are based on where the prior day’s reading falls with respect to the MAX and MIN of all occurrences available. A higher DIX is bullish. At the same time, the lower the GEX, the more (expected) volatility. Learn the implications of volatility, direction, and moneyness. Breadth reflects a reading of the prior day’s NYSE Advance/Decline indicator. VIX reflects a current reading of the CBOE Volatility Index (INDEX: VIX) from 0-100.
Fundamental
Pardon the light read, today!
Jefferies Financial Group Inc (NYSE: JEF) analyses suggest that after the S&P 500’s nearly two standard deviation rally, outcomes are quite large in both directions.
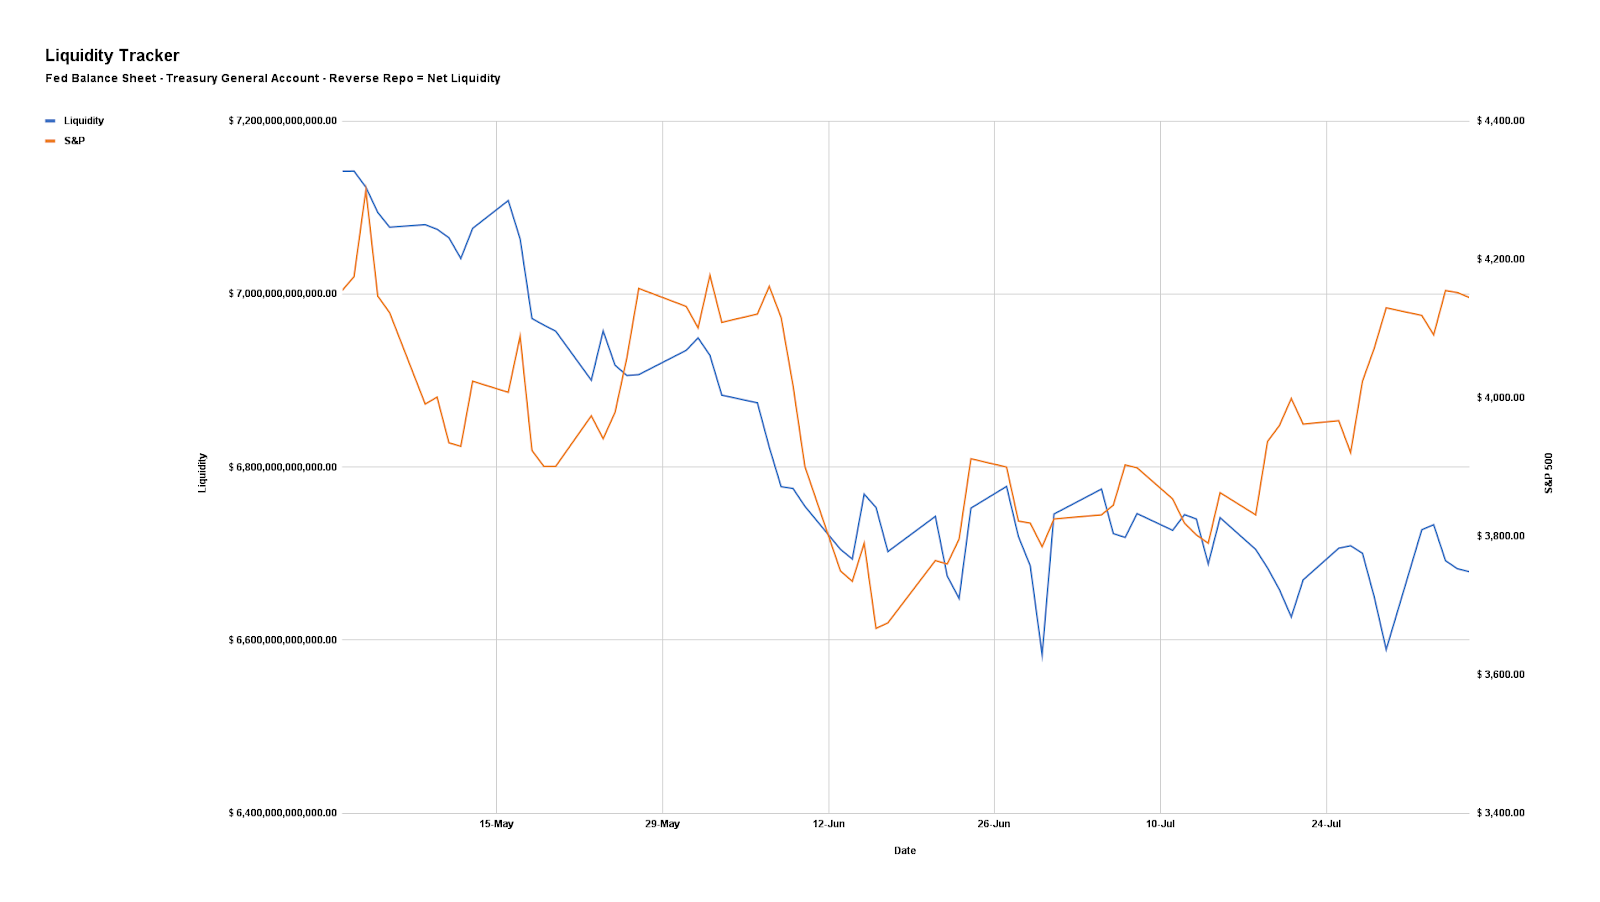
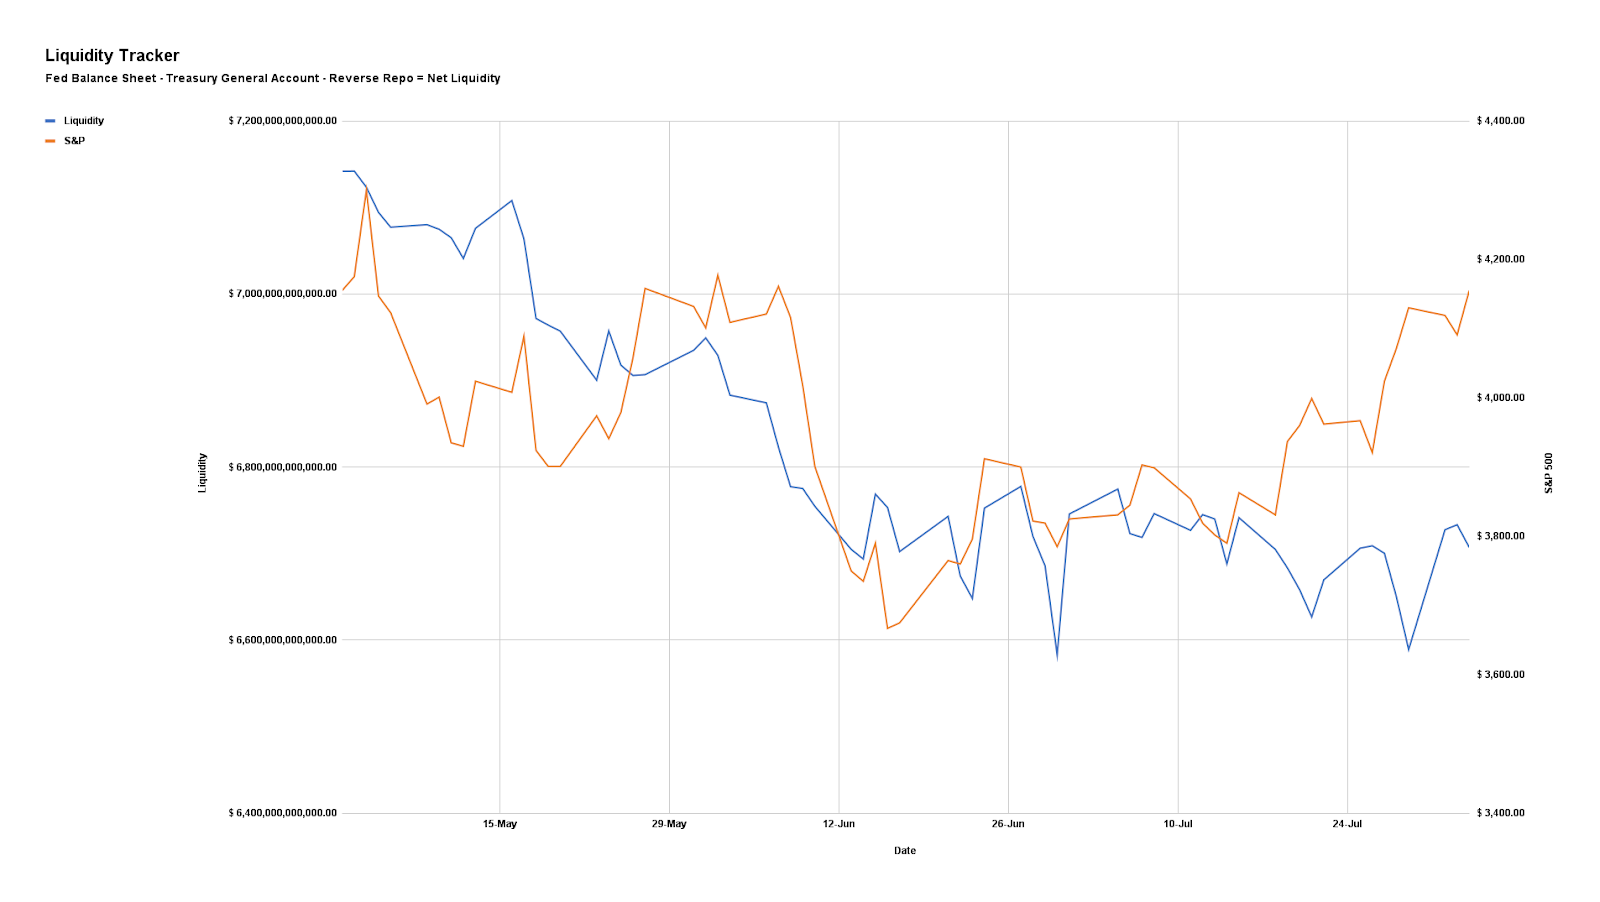
However, “when the six-month performance into the rally is negative, there is a much greater chance of negative outcomes,” The Market Ear summarizes.
Graphic: Via Physik Invest. Data compiled by @jkonopas623. Fed Balance Sheet data, here. Treasury General Account Data, here. Reverse Repo data, here. NL = BS – TGA – RRP.
What is bolstering this relief rally?
This relief is the product of a “knee-jerk re-leveraging flow,” as explained by some, bolstered by a “cohort of quantitative-based investment strategies [buying] equities when volatility is lower.”
From hereon, some, like JPMorgan Chase & Co (NYSE: JPM) strategists, see equities rising on “robust corporate earnings [and] … better-than-feared economic data,” all the while others, from Morgan Stanley (NYSE: MS) and Goldman Sachs Group Inc (NYSE: GS), don’t see corporate profit margins expanding into 2023 because of “sticky cost pressures and receding demand.”
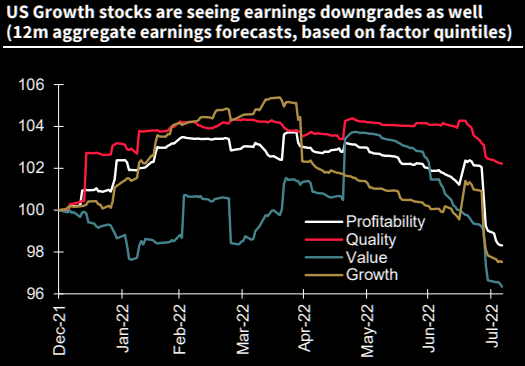
Graphic: Retrieved from The Market Ear. Via MS Research. Margins are in trouble “over the next several quarters … [as this is] the mirror image of what happened in 2020-21 when companies had extreme pricing power and costs were lagging.”
That said, however, MS explains said that “the next leg lower may have to wait until September when [their] negative operating leverage thesis is more reflected in earnings estimates.”
Graphic: Retrieved from The Market Ear. Via Societe Generale SA (OTC: SCGLY). “Not only are central banks not there to backstop markets as they have been in recent years, but Growth stock profits are proving somewhat fragile as well.”
The outlooks by corporates are far more positive, though, it appears.
Tesla Inc (NASDAQ: TSLA) CEO Elon Musk explained the trend in commodity prices is down, “which suggests we are past peak inflation.” This is as Loews Corporation (NYSE: L) CEO Jim Tisch says that the “significant reduction in inflation in the coming 6 to 12 months” should help avoid a “truly damaging wage-price inflation spiral that was so problematic in the 1970s.”
Full employment, healing supply chains, and easier consumer spending is among the factors balancing commitments to tighten and, potentially, put the economy on an “L” trajectory (i.e., drop and flatline for a period), as explained in our August 3 letter.
Graphic: Retrieved from Bloomberg. Data via Realtor.com. “The [Fed’s] effort to curb inflation by raising benchmark interest rates has put the brakes on the pandemic housing frenzy.”
Positioning
As of 6:35 AM ET, Tuesday’s expected volatility, via the Cboe Volatility Index (INDEX: VIX), sits at ~1.14%. Net gamma exposures decreasing may promote larger trading ranges.
Given the market environment, read the August 5 letter for an in-depth take on how to position for the next move higher or lower, while lowering costs (and potential losses), if wrong.
Technical
As of 6:25 AM ET, Tuesday’s regular session (9:30 AM – 4:00 PM ET), in the S&P 500, is likely to open in the lower part of a negatively skewed overnight inventory, inside of prior-range and -value, suggesting a limited potential for immediate directional opportunity.
In the best case, the S&P 500 trades higher.
Any activity above the $4,153.25 HVNode puts into play the $4,189.25 LVNode. Initiative trade beyond the LVNode could reach as high as the $4,227.75 HVNode and $4,259.75 LVNode, or higher.
In the worst case, the S&P 500 trades lower.
Any activity below the $4,153.25 HVNode puts into play the $4,117.75 MCPOC. Initiative trade beyond the MCPOC could reach as low as the $4,073.00 VPOC and $4,040.75 HVNode, or lower.
Click here to load today’s key levels into the web-based TradingView charting platform. Note that all levels are derived using the 65-minute timeframe. New links are produced, daily.
Graphic: Updated 8/8/2022. 65-minute profile chart of the Micro E-mini S&P 500 Futures.
Considerations: Responsiveness near key-technical areas (that are discernable visually on a chart), suggests technically-driven traders with short time horizons are very active.
Such traders often lack the wherewithal to defend retests and, additionally, the type of trade may be indicative of the other time frame participants waiting for more information to initiate trades.
Definitions
Volume Areas: A structurally sound market will build on areas of high volume (HVNodes). Should the market trend for long periods of time, it will lack sound structure, identified as low volume areas (LVNodes). LVNodes denote directional conviction and ought to offer support on any test.
If participants were to auction and find acceptance into areas of prior low volume (LVNodes), then future discovery ought to be volatile and quick as participants look to HVNodes for favorable entry or exit.
POCs: POCs are valuable as they denote areas where two-sided trade was most prevalent in a prior day session. Participants will respond to future tests of value as they offer favorable entry and exit.
MCPOCs: POCs are valuable as they denote areas where two-sided trade was most prevalent over numerous day sessions. Participants will respond to future tests of value as they offer favorable entry and exit.
Volume-Weighted Average Prices (VWAPs): A metric highly regarded by chief investment officers, among other participants, for quality of trade. Additionally, liquidity algorithms are benchmarked and programmed to buy and sell around VWAPs.
About
After years of self-education, strategy development, mentorship, and trial-and-error, Renato Leonard Capelj began trading full-time and founded Physik Invest to detail his methods, research, and performance in the markets.
Capelj also develops insights around impactful options market dynamics at SpotGamma and is a Benzinga reporter.
In no way should the materials herein be construed as advice. Derivatives carry a substantial risk of loss. All content is for informational purposes only.
The daily brief is a free glimpse into the prevailing fundamental and technical drivers of U.S. equity market products. Join the 750+ that read this report daily, below!
Graphic updated 7:45 AM ET. Sentiment Risk-On if expected /ES open is above the prior day’s range. /ES levels are derived from the profile graphic at the bottom of the following section. Levels may have changed since initially quoted; click here for the latest levels. SqueezeMetrics Dark Pool Index (DIX) and Gamma (GEX) calculations are based on where the prior day’s reading falls with respect to the MAX and MIN of all occurrences available. A higher DIX is bullish. At the same time, the lower the GEX, the more (expected) volatility. Learn the implications of volatility, direction, and moneyness. Breadth reflects a reading of the prior day’s NYSE Advance/Decline indicator. VIX reflects a current reading of the CBOE Volatility Index (INDEX: VIX) from 0-100.
Fundamental
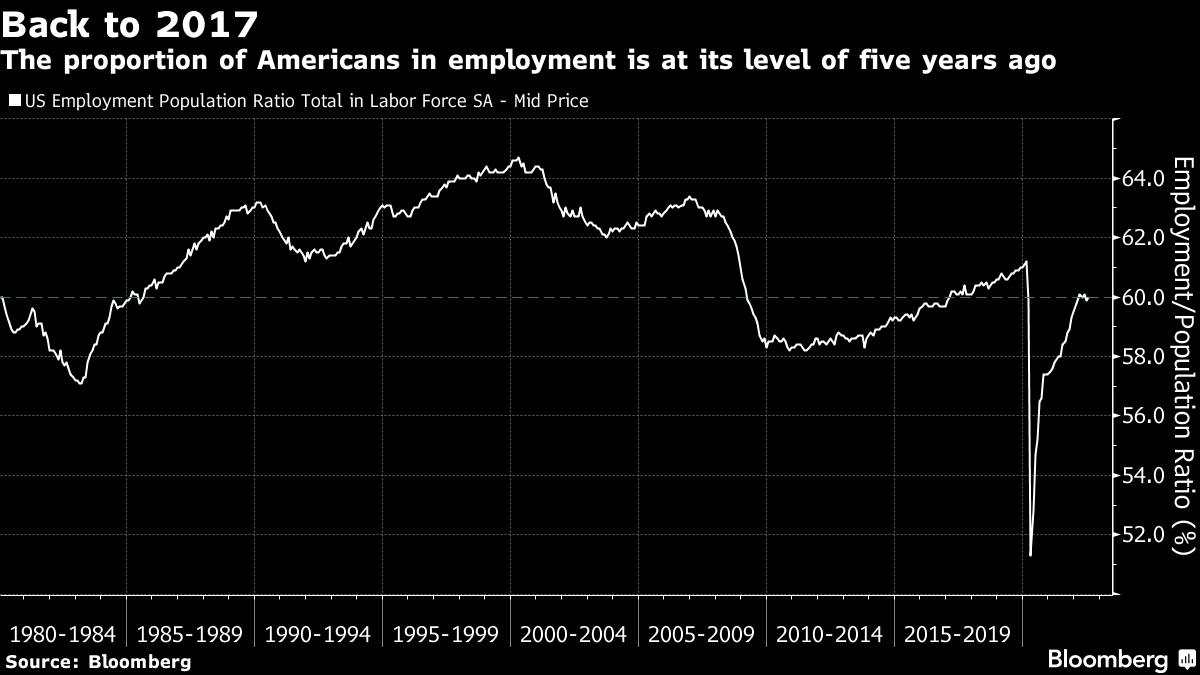
In a non-farm payroll update, it was shown that the US added more than two times the jobs many economists thought it would.
“Some of this is driven by a reduced participation rate – a smaller portion of the population seeking work and showing up in unemployment data,” Bloomberg’s John Authers explained.
Graphic: Retrieved from Bloomberg.
“It now becomes much easier for the Federal Reserve (Fed) to [continue] rais[ing] rates. If the employment market is still strengthening, while inflation remains its highest in decades, it’s hard to see why it shouldn’t.”
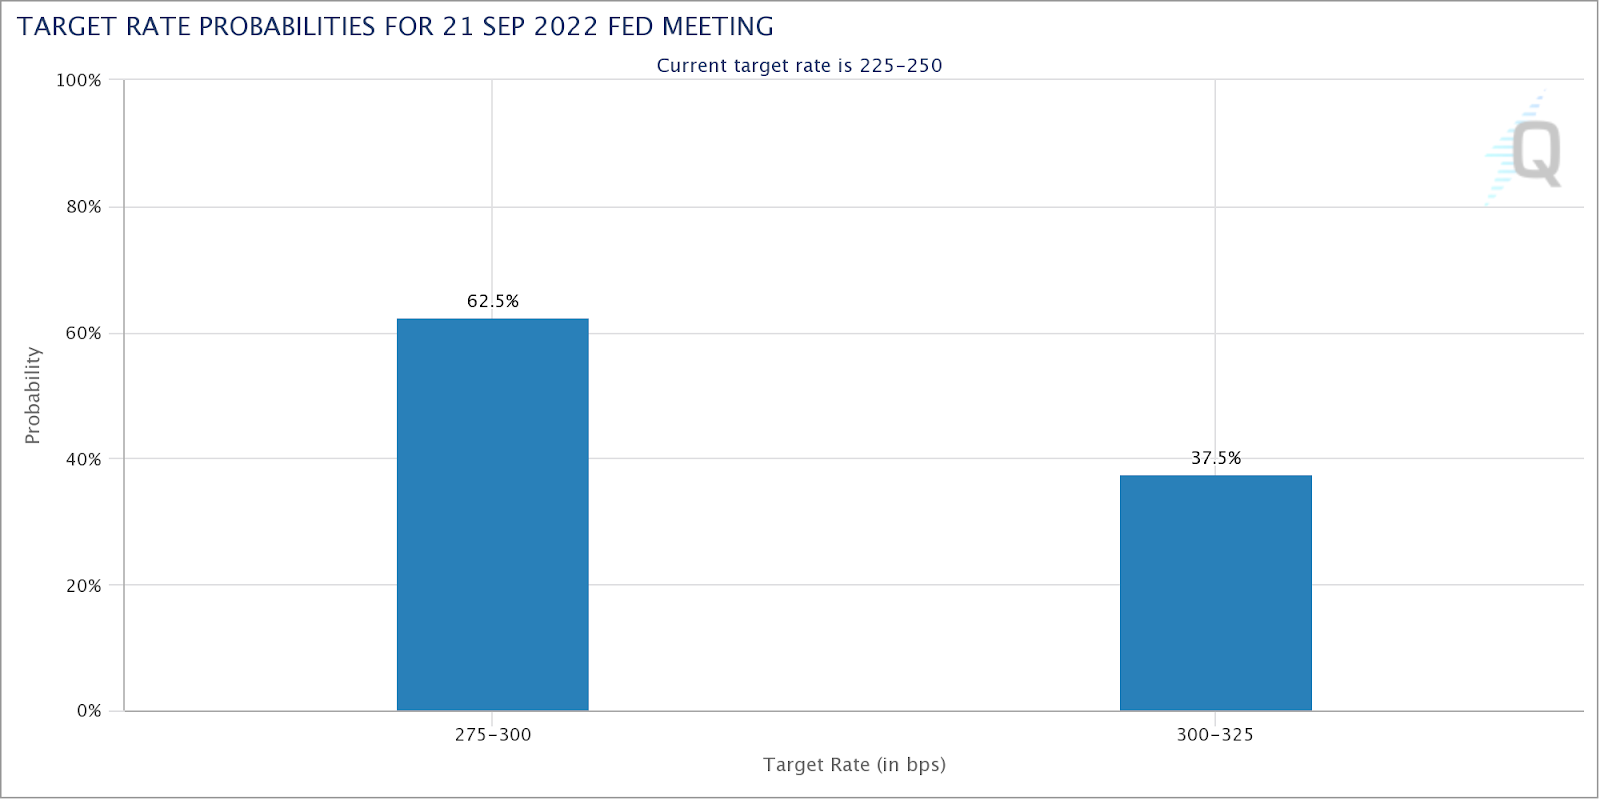
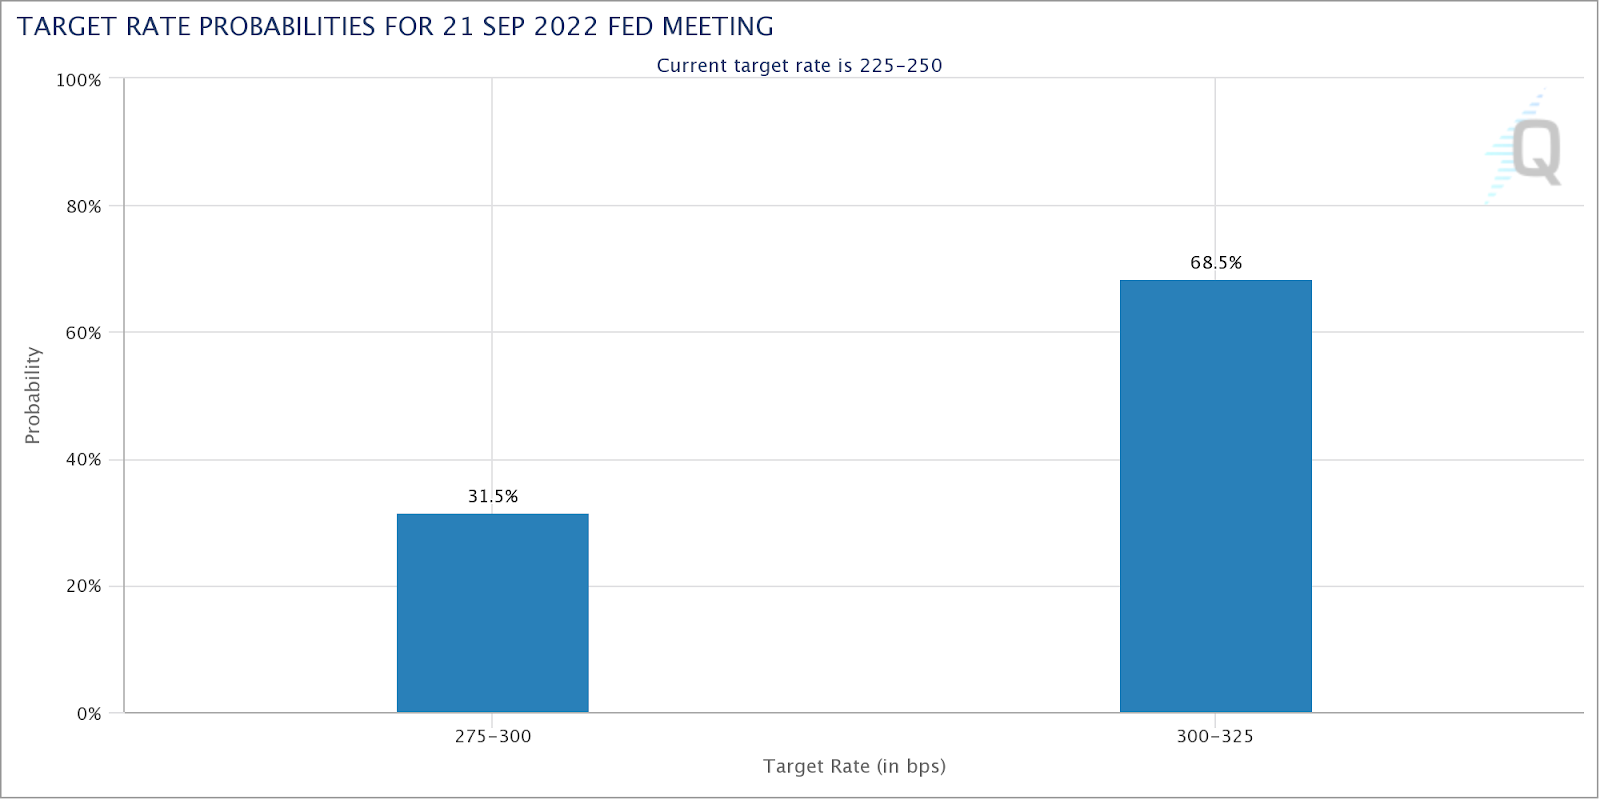
Accordingly, market participants are pricing a greater than 50% chance of the target Fed Funds rate increasing by 75 to 100 basis points to a target range of 300 and 325 basis points, up from 225 and 250 right now.
Graphic: Retrieved from CME Group Inc’s (NASDAQ: CME) FedWatch tool.
Therefore, in addition to this (projected tax increases, the expected high coupon issuance/QT doubling in September and Q4, and the like), the “knee jerk re-leveraging flow [is likely to] not survive,” per Damped Spring’s Andy Constan.
Additionally, Morgan Stanley (NYSE: MS) and Goldman Sachs Group Inc’s (NYSE: GS) strategists, both express an outlook at odds with the recent market rally on the back of “better-than-feared second-quarter earnings.”
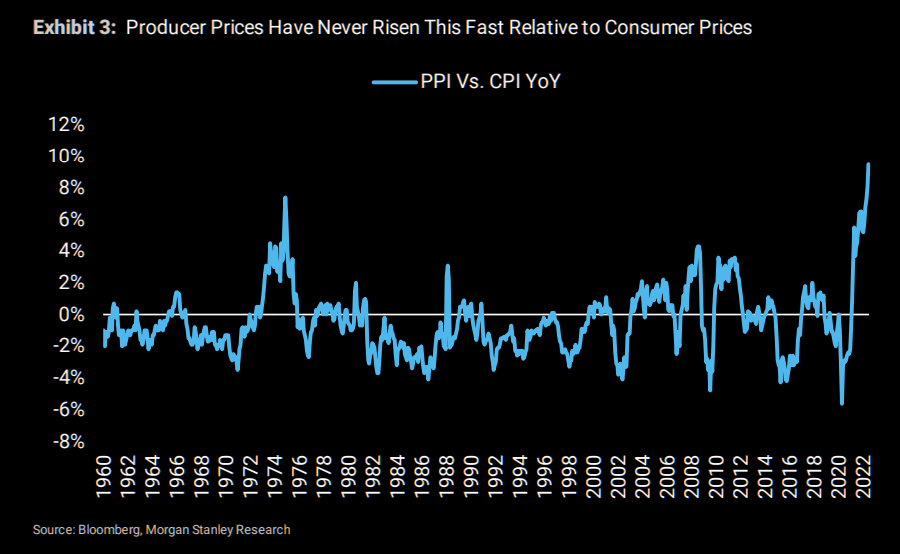
Per MS’s Michael Wilson, the expectation profit margins will continue to expand into 2023 is “unrealistic due to sticky cost pressures and receding demand.”
“While prices to the end consumer are still rising at a rapid clip, prices for producers are rising at double the pace.”
GS’s David Kostin concurs and expects net margins to drop ~25 basis points in every sector led by energy, health care, and materials, Bloomberg summarizes.
Graphic: Via Physik Invest. Data compiled by @jkonopas623. Fed Balance Sheet data, here. Treasury General Account Data, here. Reverse Repo data, here. NL = BS – TGA – RRP.
On the topic of geopolitical conflict, which we talked a lot about in the August 3 letter, the US’s Nancy Pelosi visited Taiwan last week prompting Chinese military exercises in the region.
Overall, it is likely not in China’s best interest to press the conflict much further,” Authers puts forth. “Taiwan’s role in the world’s electronics industry means that the global economic impact of any conflict could dwarf the disruptions of the last two years sparked by the pandemic.”
These disruptions would pain the world, including China.
Positioning
As of 6:40 AM ET, Monday’s expected volatility, via the Cboe Volatility Index (INDEX: VIX), sits at ~1.13%. Net gamma exposures decreasing may help with an expansion of range.
Given where realized (RVOL) and implied (IVOL) volatility measures are, as well as skew, it is beneficial to be a buyer of complex options structures (e.g., back spread).
For concision, we quote SpotGamma: “It’s the case when the fuel from a drop in option implied volatility is spent, as well as the sticky open interest at current prices rolls off, that options-related hedging does less to keep markets pinned.”
Technical
As of 6:40 AM ET, Monday’s regular session (9:30 AM – 4:00 PM ET), in the S&P 500, is likely to open in the upper part of a positively skewed overnight inventory, outside of prior-range and -value, suggesting a potential for immediate directional opportunity.
In the best case, the S&P 500 trades higher.
Any activity above the $4,153.25 HVNode puts into play the $4,189.25 LVNode. Initiative trade beyond the LVNode could reach as high as the $4,227.75 HVNode and $4,259.75 LVNode, or higher.
In the worst case, the S&P 500 trades lower.
Any activity below the $4,153.25 HVNode puts into play the $4,117.75 MCPOC. Initiative trade beyond the MCPOC could reach as low as the $4,073.00 VPOC and $4,040.75 HVNode, or lower.
Click here to load today’s key levels into the web-based TradingView charting platform. Note that all levels are derived using the 65-minute timeframe. New links are produced, daily.
Graphic: 65-minute profile chart of the Micro E-mini S&P 500 Futures.
Considerations: Responsiveness near key-technical areas (that are discernable visually on a chart), suggests technically-driven traders with short time horizons are very active.
Such traders often lack the wherewithal to defend retests and, additionally, the type of trade may be indicative of the other time frame participants waiting for more information to initiate trades.
Definitions
Volume Areas: A structurally sound market will build on areas of high volume (HVNodes). Should the market trend for long periods of time, it will lack sound structure, identified as low volume areas (LVNodes). LVNodes denote directional conviction and ought to offer support on any test.
If participants were to auction and find acceptance into areas of prior low volume (LVNodes), then future discovery ought to be volatile and quick as participants look to HVNodes for favorable entry or exit.
POCs: POCs are valuable as they denote areas where two-sided trade was most prevalent in a prior day session. Participants will respond to future tests of value as they offer favorable entry and exit.
MCPOCs: POCs are valuable as they denote areas where two-sided trade was most prevalent over numerous day sessions. Participants will respond to future tests of value as they offer favorable entry and exit.
Volume-Weighted Average Prices (VWAPs): A metric highly regarded by chief investment officers, among other participants, for quality of trade. Additionally, liquidity algorithms are benchmarked and programmed to buy and sell around VWAPs.
About
After years of self-education, strategy development, mentorship, and trial-and-error, Renato Leonard Capelj began trading full-time and founded Physik Invest to detail his methods, research, and performance in the markets.
Capelj also develops insights around impactful options market dynamics at SpotGamma and is a Benzinga reporter.
In no way should the materials herein be construed as advice. Derivatives carry a substantial risk of loss. All content is for informational purposes only.
The daily brief is a free glimpse into the prevailing fundamental and technical drivers of U.S. equity market products. Join the 750+ that read this report daily, below!
Graphic updated 7:00 AM ET. Sentiment Neutral if expected /ES open is inside of the prior day’s range. /ES levels are derived from the profile graphic at the bottom of the following section. Levels may have changed since initially quoted; click here for the latest levels. SqueezeMetrics Dark Pool Index (DIX) and Gamma (GEX) calculations are based on where the prior day’s reading falls with respect to the MAX and MIN of all occurrences available. A higher DIX is bullish. At the same time, the lower the GEX, the more (expected) volatility. Learn the implications of volatility, direction, and moneyness. Breadth reflects a reading of the prior day’s NYSE Advance/Decline indicator. VIX reflects a current reading of the CBOE Volatility Index (INDEX: VIX) from 0-100.
Fundamental
Shortened fundamentals section, today.
It’s the case that from mid-2020 to late-2021, as well explained by Damped Spring’s Andy Constan, the decline in risk premiums boosted assets, across the board.
Then, when “the drumbeats of quantitative tightening (QT) sounded on December 29,” the expansion in risk premiums bolstered a rotation out of risk.
Per Constan, conditions are unchanged.
The “knee jerk re-leveraging flow [] will not survive the high coupon issuance/QT doubling of the September and Q4. Fade the [fear of missing out] until Turkey day when Santa comes to town.”
Graphic: Via Physik Invest. Data compiled by @jkonopas623. Fed Balance Sheet data, here. Treasury General Account Data, here. Reverse Repo data, here. NL = BS – TGA – RRP.
Positioning
As of 7:00 AM ET, Thursday’s expected volatility, via the Cboe Volatility Index (INDEX: VIX), sits at ~1.14%. Net gamma exposures are increasing which may promote tighter ranges.
Further, given where realized (RVOL) and implied (IVOL) volatility are, as well as skew, it is beneficial to be a buyer of options structures (e.g., put back spread and/or call ratio spread).
Here is some context.
Per past letters, such as the Daily Brief for August 2, the monetization and counterparty hedging of existing customer volatility (i.e., options) hedges, as well as the sale of short-dated volatility, particularly in some single stocks where there was “rich” volatility into the fall, lent to lackluster performance in IVOL and index mean reversion.
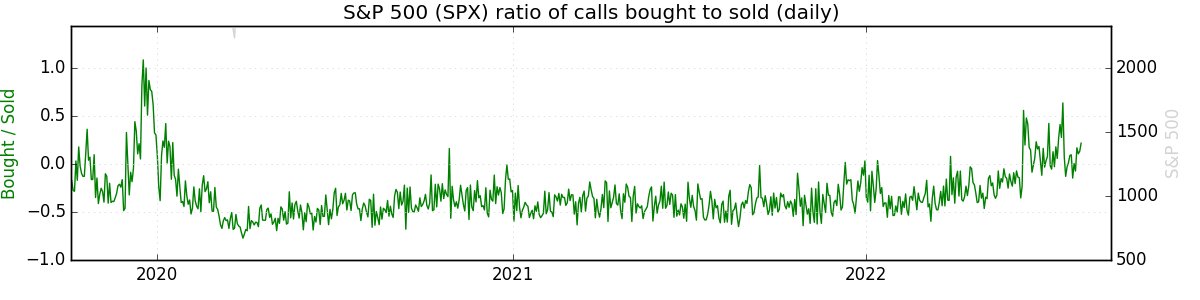
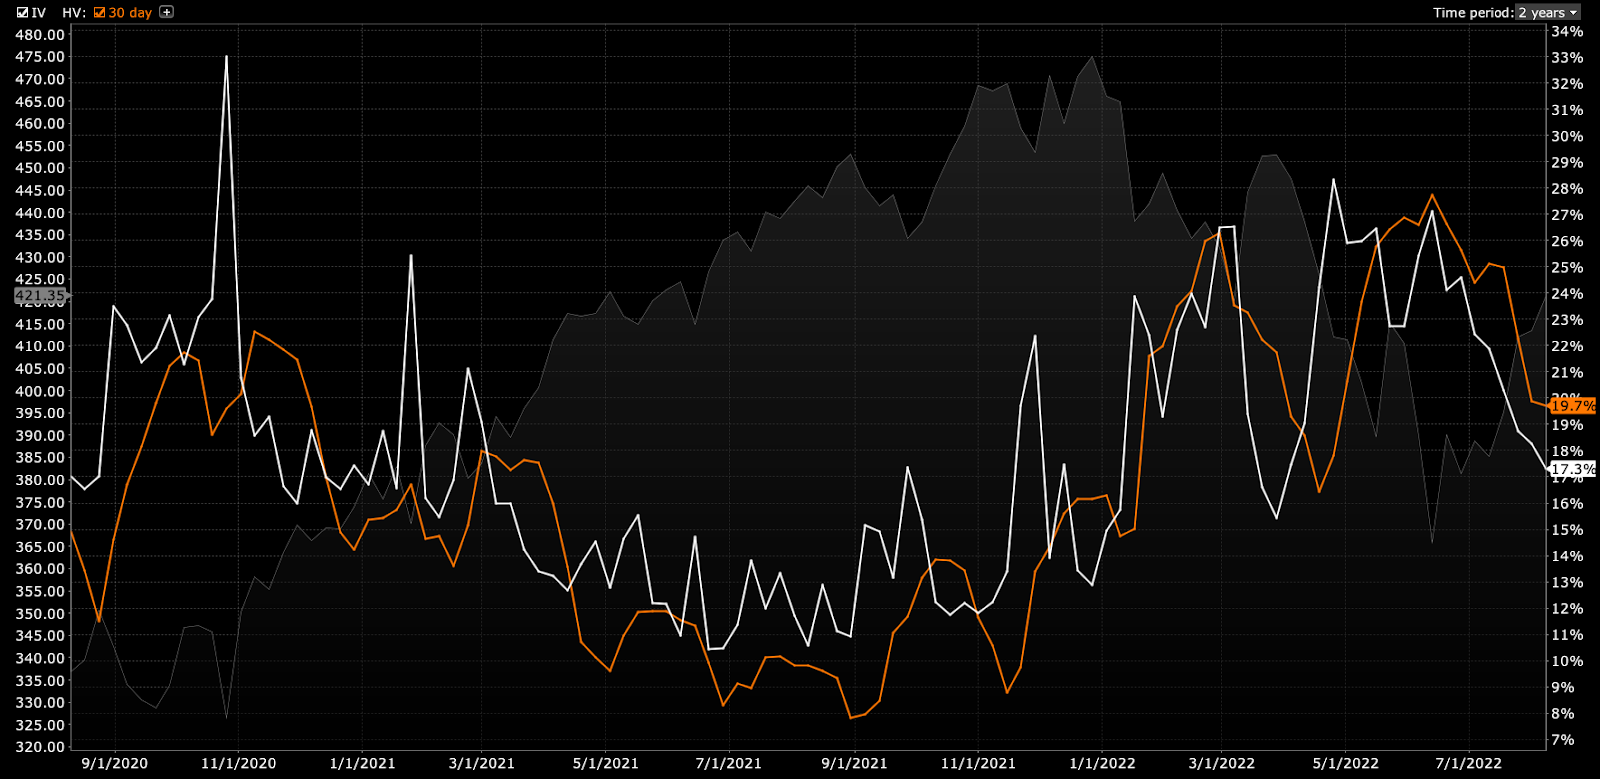
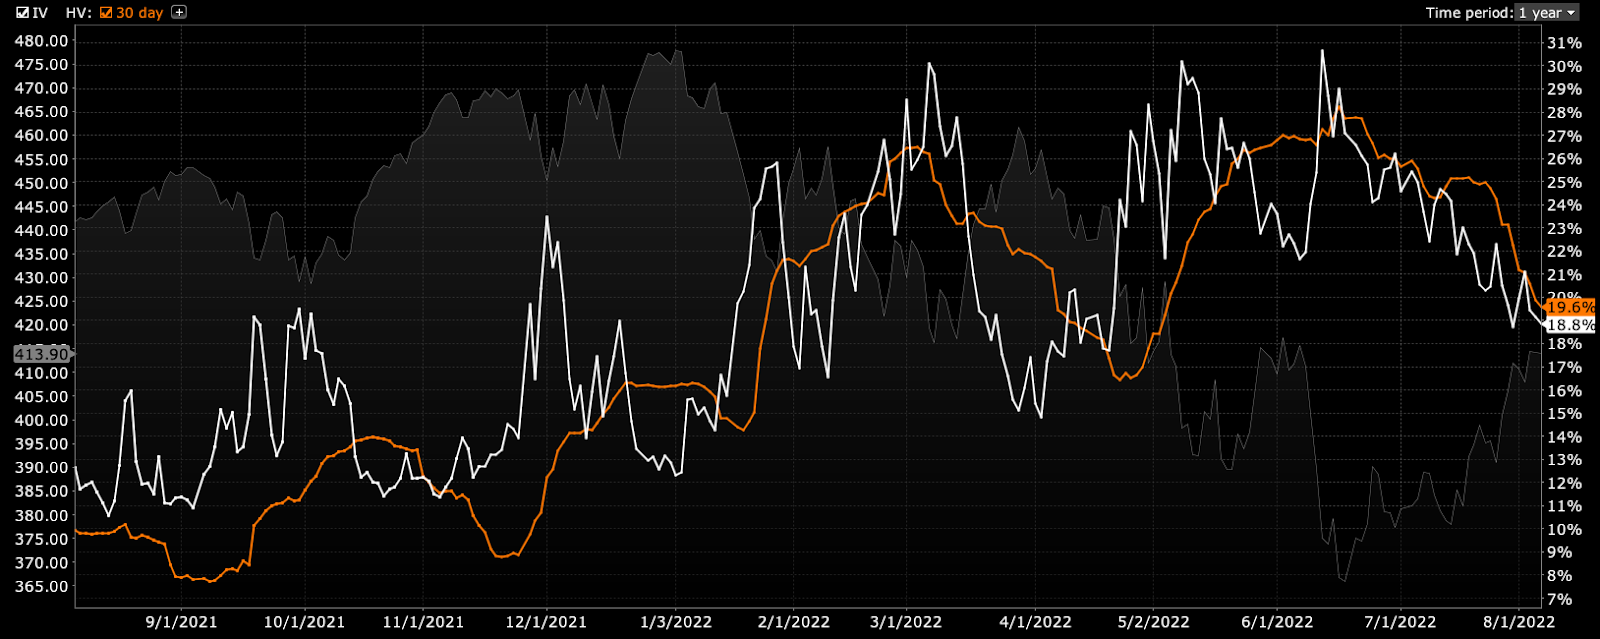
Graphic: RVOL (orange) versus IVOL (white) on the S&P 500 (INDEX: SPX).
These forces have only grown and are, presently, adding to the stickiness of the move higher.
Well – though naive – if we take participants as trading similar to the way they do historically (i.e., buying stocks and hedging by selling calls and buying puts), the counterparty is left with a bullish trade (i.e., short put, long call).
Depending on (A) where the market is in relation to this exposure, as well as (B) where this exposure is more concentrated, the call or put side may solicit increased hedging activities.
Today, with markets trading higher and participants becoming increasingly active on the call side, the counterparties have a trade that is (becoming increasingly) bullish; positive delta (i.e., exposure to direction) and gamma (i.e., rate of change of exposure to direction) are growing.
Further, knowing that participants are concentrating their bets on options close to current market prices, which are very short-dated (and with little time to expiration), the counterparty’s exposure is way more sensitive to changes in direction because options can go from having a lot of value to very little in a small window (of time and movement).
In other words, it is a fact that an option that is at the money can go from having a near 50% chance of expiring in the money to 0%. However, if the time to expiry is shorter, then the speed at which these options may go from a near 50% chance of expiring in the money to 0% rises.
That’s probably one of the simplest ways one could explain put it.
Therefore (with activity becoming more concentrated at options strikes near current price, all the while IVOL continues to fall), into weakness, counterparties lean toward buying (selling) dips (rips).
Adding:
If you (like a counterparty) own a call option and want no exposure to the positive payoff when the market moves higher, you sell the underlying asset (e.g., stock, future).
If the market is sideways and slightly lower, while volatility is generally trending lower, as it is recently, and your option declines in value, then you must rebalance your hedge. So, you would buy (cover) some of your existing short stock and futures position to rebalance your deltas.
Moreover, the trends above may be coming to an end as entities are squeezed out of trades that aren’t working (i.e., participants continue to rotate out of poor-performing volatility and commodities).
Accordingly, Kai Volatility’s Cem Karsan explains that markets can, now, as that suppressive options activity fades, potentially, “really begin to respond to the core macro factors.”
Here’s why.
Should markets experience a shock (e.g., China and U.S. tensions escalate), the new demand for hedges may result in an “untethering” in IVOL, which was “one of the most supportive things into the decline,” Karsan explained.
That means that now is the best time to rotate into call options that are outperforming “their delta to the upside.”
Graphic: Via Banco Santander SA (NYSE: SAN) research, the return profile, at expiry, of a classic 1×2 (long 1, short 2 further away) ratio spread.
You may ask: what’s bolstering some of the market’s strength, in the shorter term?
In spite of negative macro narratives, as IVOL continues to decline and options, in general, are less sought after per their poor performance, what’s providing an added boost is the “cohort of quantitative-based investment strategies [buying] equities when volatility is lower,” according to statements by the Wall Street Journal.
“This year, these so-called systematic strategies have exited the market to historically low levels, meaning they have plenty of buying power.”
Much more next week! Talk soon.
Technical
As of 7:00 AM ET, Thursday’s regular session (9:30 AM – 4:00 PM ET), in the S&P 500, is likely to open in the middle part of a balanced overnight inventory, just inside of prior-range and -value, suggesting a limited potential for immediate directional opportunity.
In the best case, the S&P 500 trades higher.
Any activity above the $4,153.25 HVNode puts into play the $4,189.25 LVNode. Initiative trade beyond the LVNode could reach as high as the $4,227.75 HVNode and $4,259.75 LVNode, or higher.
In the worst case, the S&P 500 trades lower.
Any activity below the $4,153.25 HVNode puts into play the $4,117.75 MCPOC. Initiative trade beyond the MCPOC could reach as low as the $4,073.00 VPOC and $4,040.75 HVNode, or lower.
Click here to load today’s key levels into the web-based TradingView charting platform. Note that all levels are derived using the 65-minute timeframe. New links are produced, daily.
Graphic: 65-minute profile chart of the Micro E-mini S&P 500 Futures.
Considerations: Responsiveness near key-technical areas (that are discernable visually on a chart), suggests technically-driven traders with short time horizons are very active.
Such traders often lack the wherewithal to defend retests and, additionally, the type of trade may be indicative of the other time frame participants waiting for more information to initiate trades.
Definitions
Volume Areas: A structurally sound market will build on areas of high volume (HVNodes). Should the market trend for long periods of time, it will lack sound structure, identified as low volume areas (LVNodes). LVNodes denote directional conviction and ought to offer support on any test.
If participants were to auction and find acceptance into areas of prior low volume (LVNodes), then future discovery ought to be volatile and quick as participants look to HVNodes for favorable entry or exit.
POCs: POCs are valuable as they denote areas where two-sided trade was most prevalent in a prior day session. Participants will respond to future tests of value as they offer favorable entry and exit.
MCPOCs: POCs are valuable as they denote areas where two-sided trade was most prevalent over numerous day sessions. Participants will respond to future tests of value as they offer favorable entry and exit.
Volume-Weighted Average Prices (VWAPs): A metric highly regarded by chief investment officers, among other participants, for quality of trade. Additionally, liquidity algorithms are benchmarked and programmed to buy and sell around VWAPs.
About
After years of self-education, strategy development, mentorship, and trial-and-error, Renato Leonard Capelj began trading full-time and founded Physik Invest to detail his methods, research, and performance in the markets.
Capelj also develops insights around impactful options market dynamics at SpotGamma and is a Benzinga reporter.
In no way should the materials herein be construed as advice. Derivatives carry a substantial risk of loss. All content is for informational purposes only.