The daily brief is a free glimpse into the prevailing fundamental and technical drivers of U.S. equity market products. Join the 300+ that read this report daily, below!
What Happened
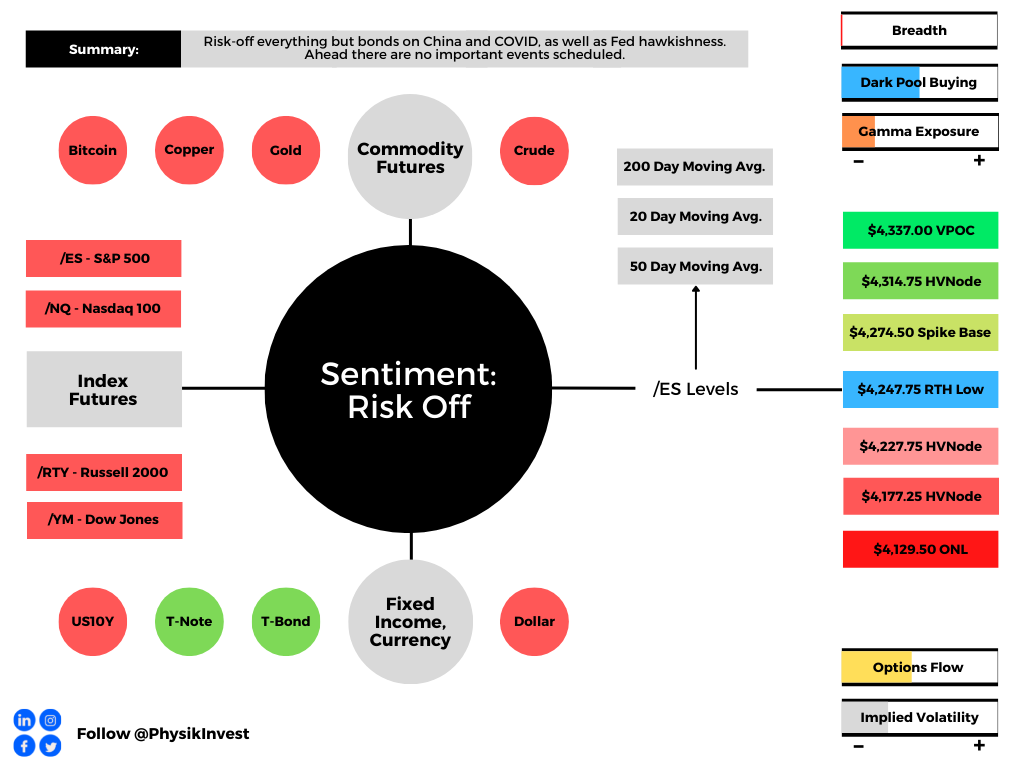
Overnight, equity index futures continued lower after breaking a multi-day consolidation late yesterday afternoon.
This is amid growth concerns and the European Central Bank (ECB) decision to end asset purchases this month and commit to a 25-basis-point interest rate hike at its next meeting, setting the stage for further rate hikes, potentially 50-basis-points or higher.
Ahead are updates to consumer prices (8:30 AM ET), which may shed further clarity on the path of the Federal Reserve’s policies. Later are updates to consumer sentiment and inflation expectations (10:00 AM ET), as well as the budget balance (2:00 PM ET).
What To Expect
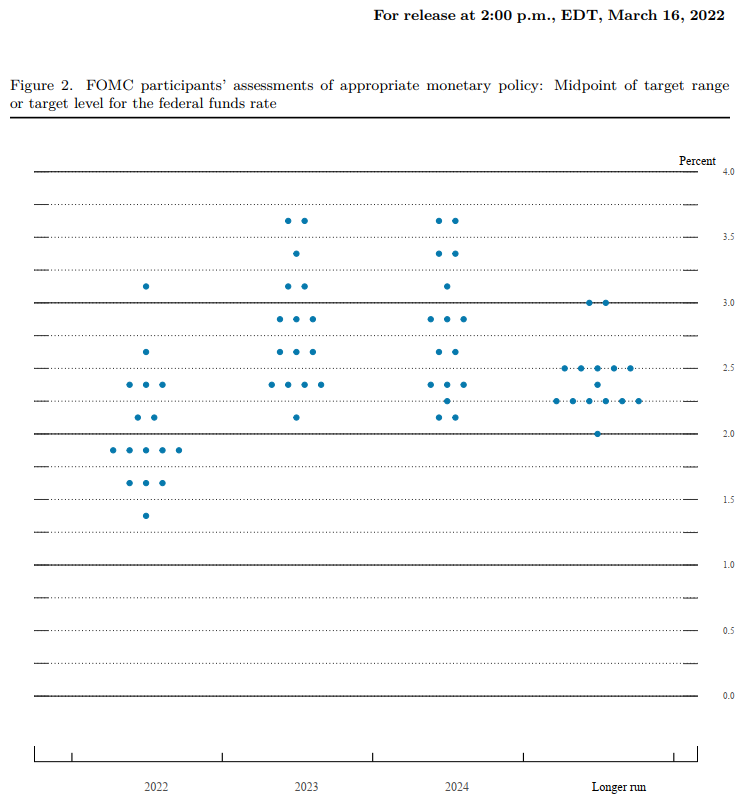
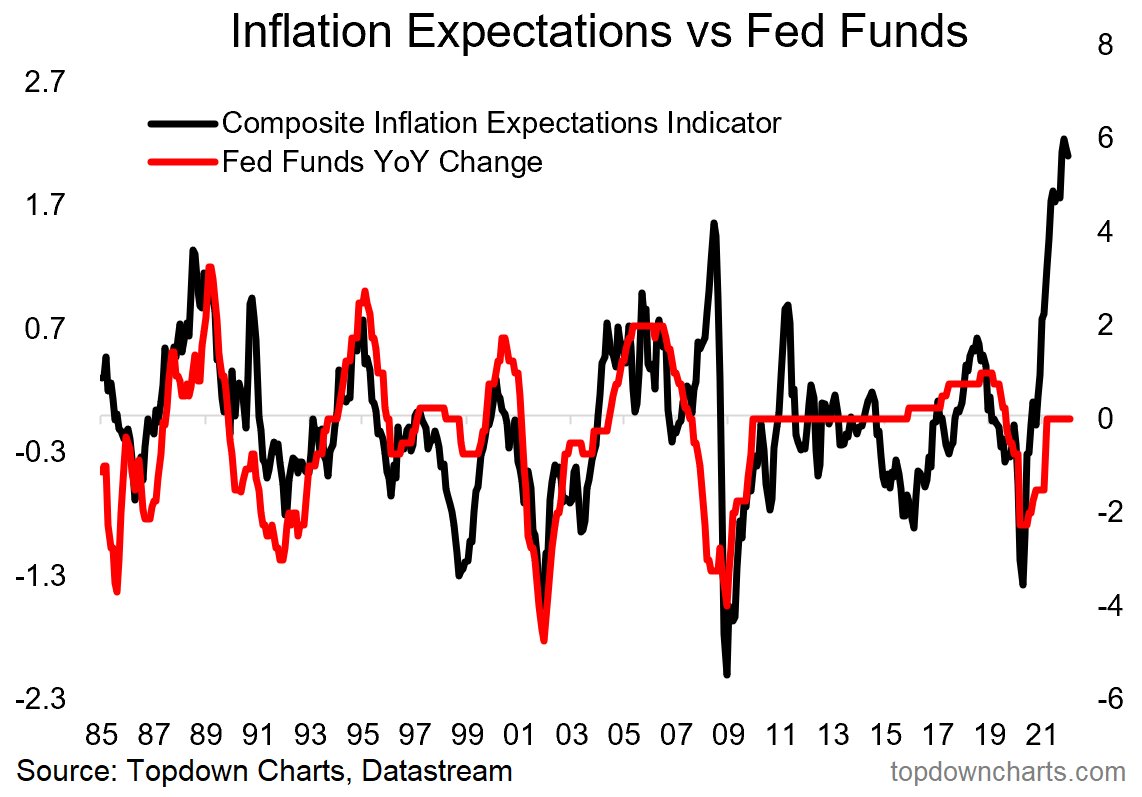
Fundamental: The CPI report is a driver of perceptions regarding future Fed activity.
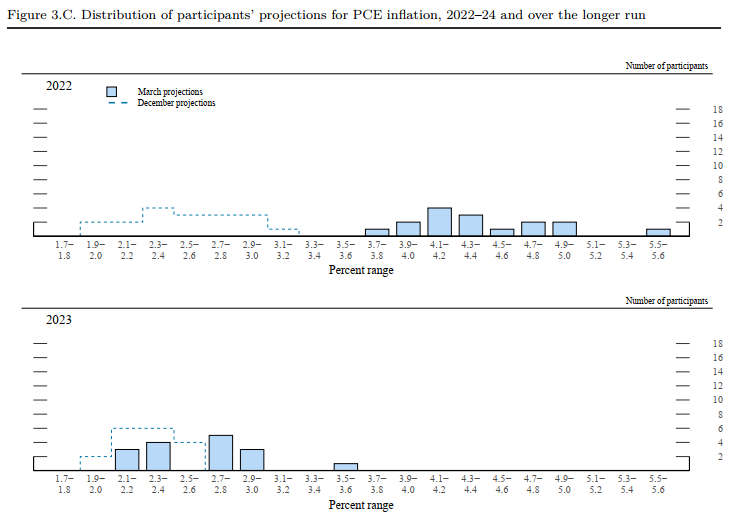
Expected is an 8.2% rise year-over-year (YoY) and 0.7% month-over-month (MoM). In April, these numbers were 8.3% and 0.3%, respectively.
Core CPI (which excludes food and energy) is expected to rise by a rate lower than in April, 5.9% YoY and 0.5% MoM, respectively.
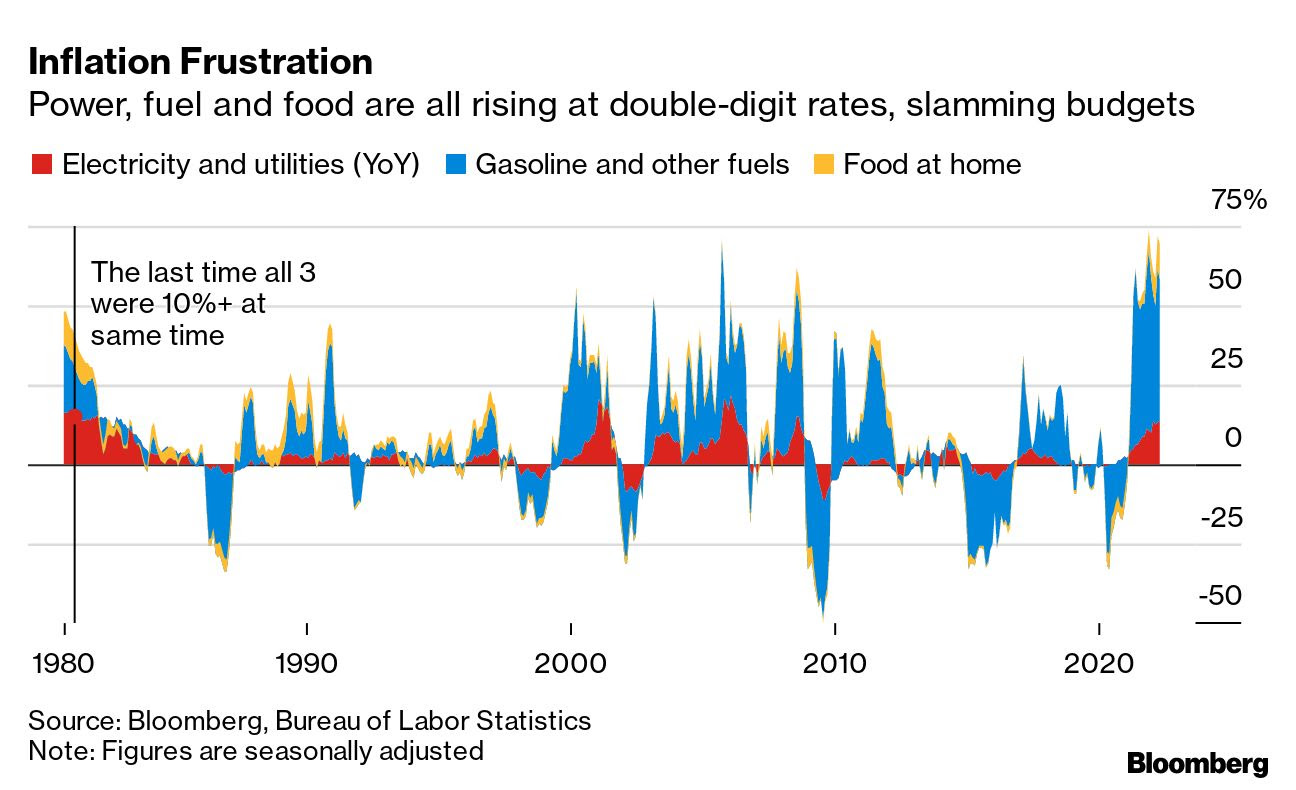
What matters most is the latter – core inflation – which the Fed has more control over. If lower than expected, that may warrant more appetite for risk.
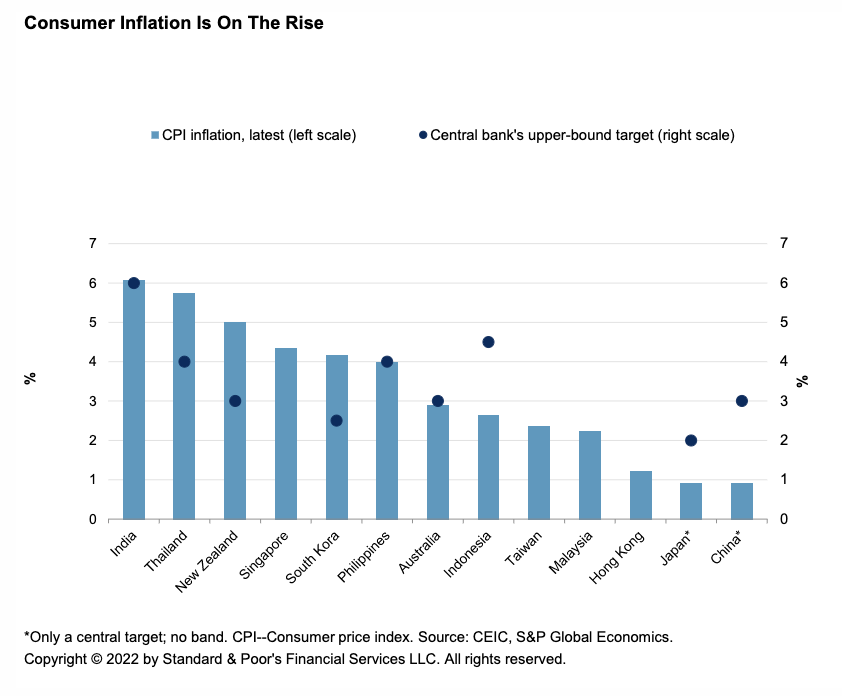
“While inflation in some parts of the world [is] yet to peak, there are at least some signs emerging that we may not be too far off in terms of a turning point,” adds Khoon Goh of Australia & New Zealand Banking Group ADR (OTC: ANZBY).
Bloomberg reports semiconductor prices are now down 14% from the middle of last year. Also, the spot rate for shipping containers fell 26% while fertilizer prices are 24% below their record.
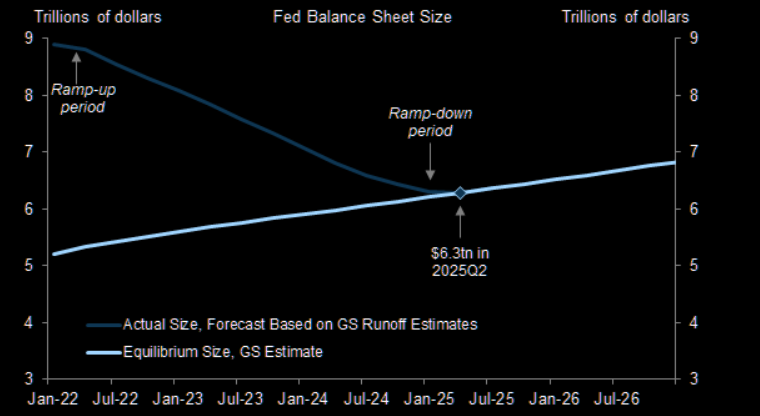
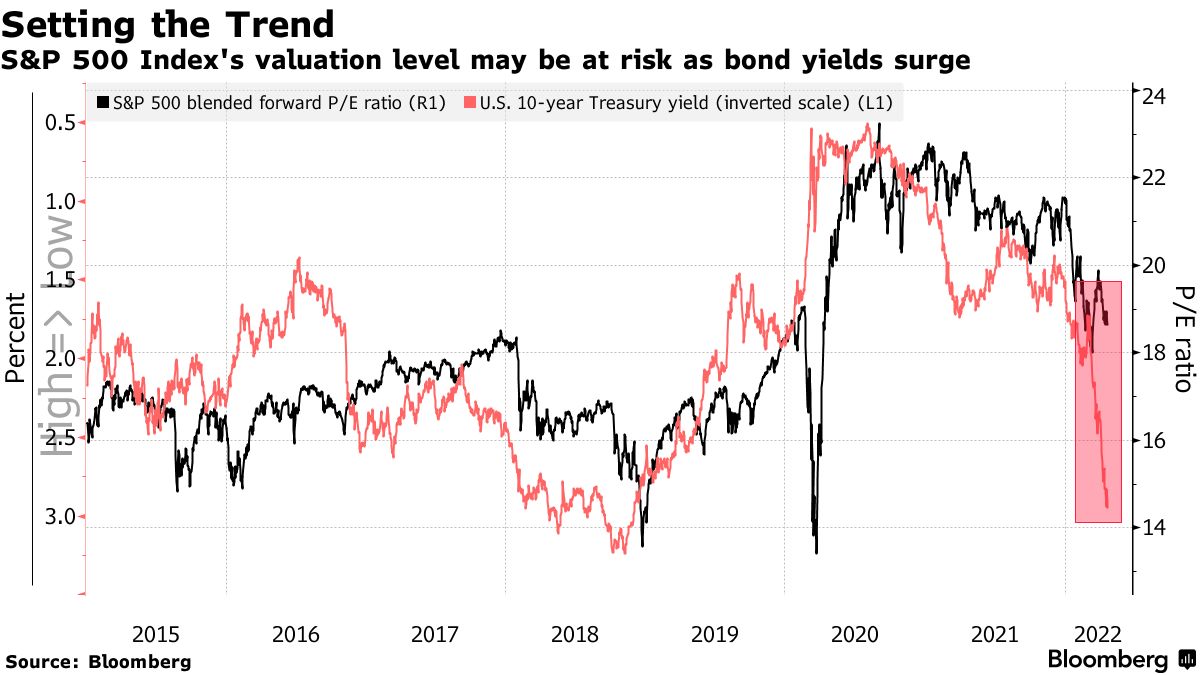
Still, the commitment to aggressive contractionary monetary policies is likely to remain. This reduction of liquidity and credit has consequences on the real economy and asset prices which rose and kept the deflationary pressures of monetary intervention at bay.
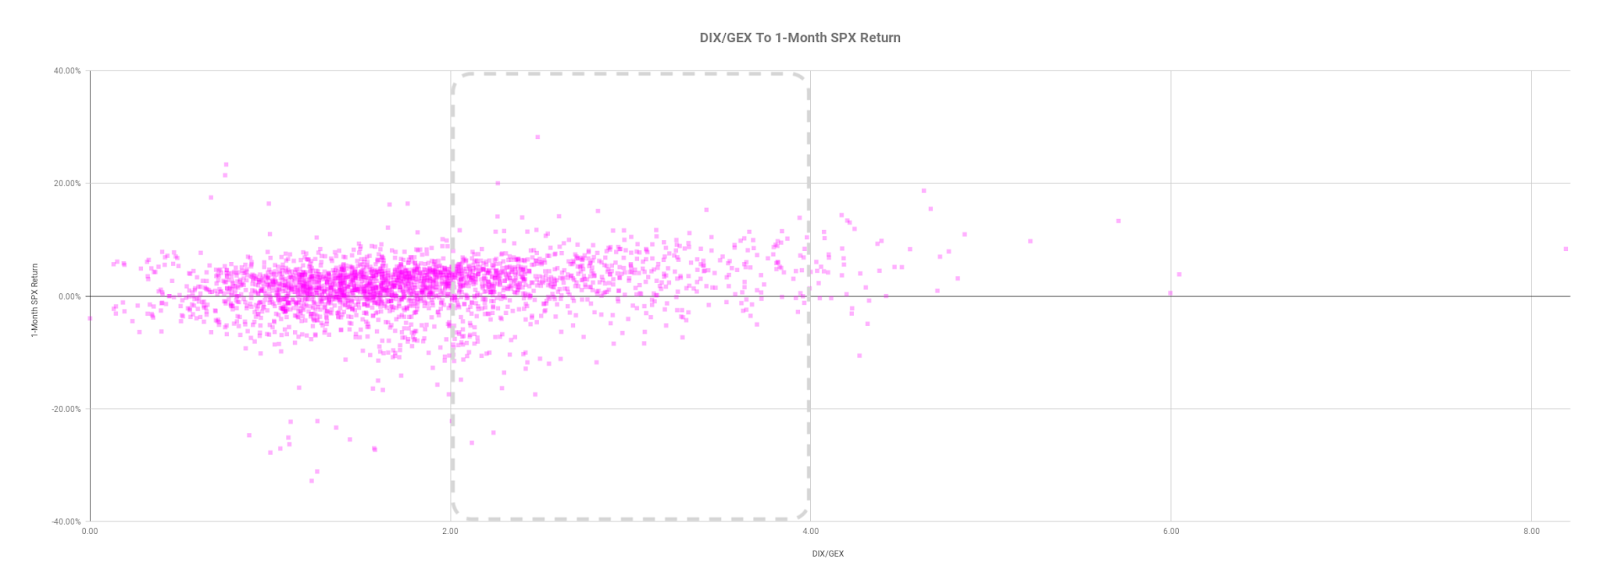
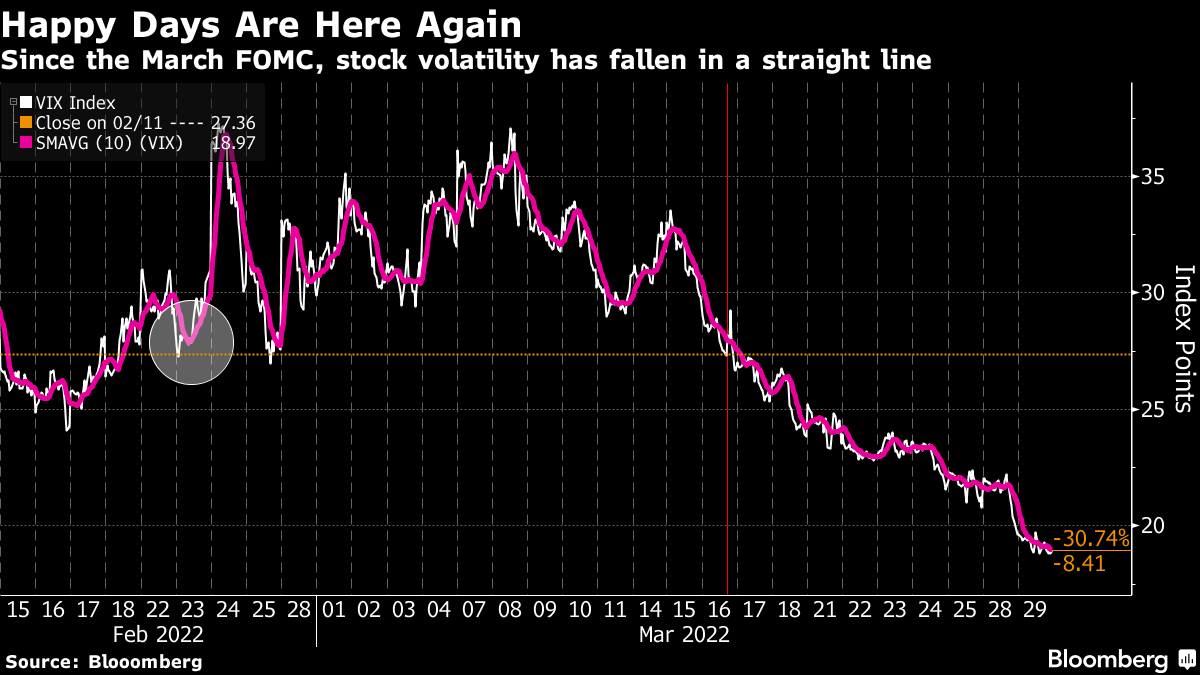
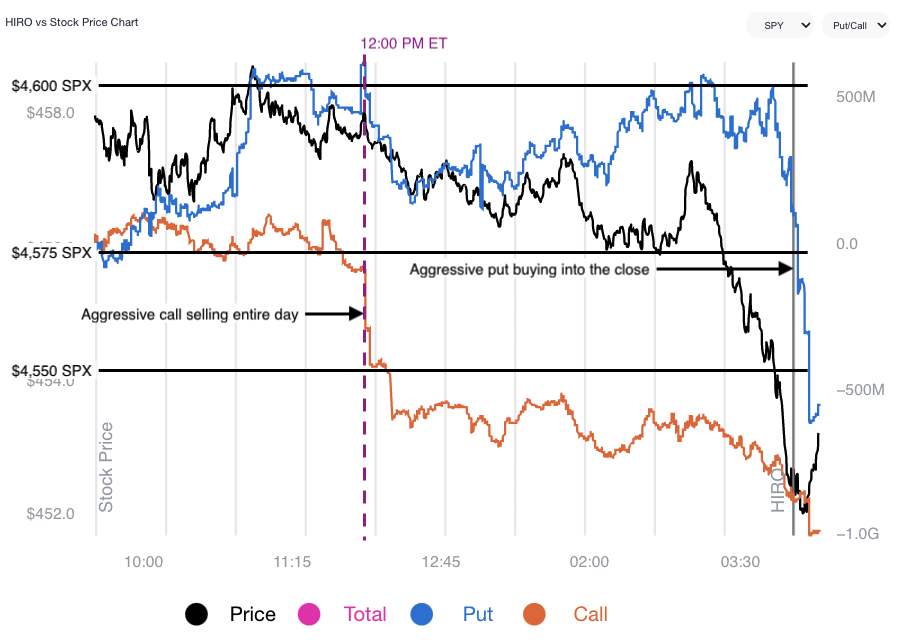
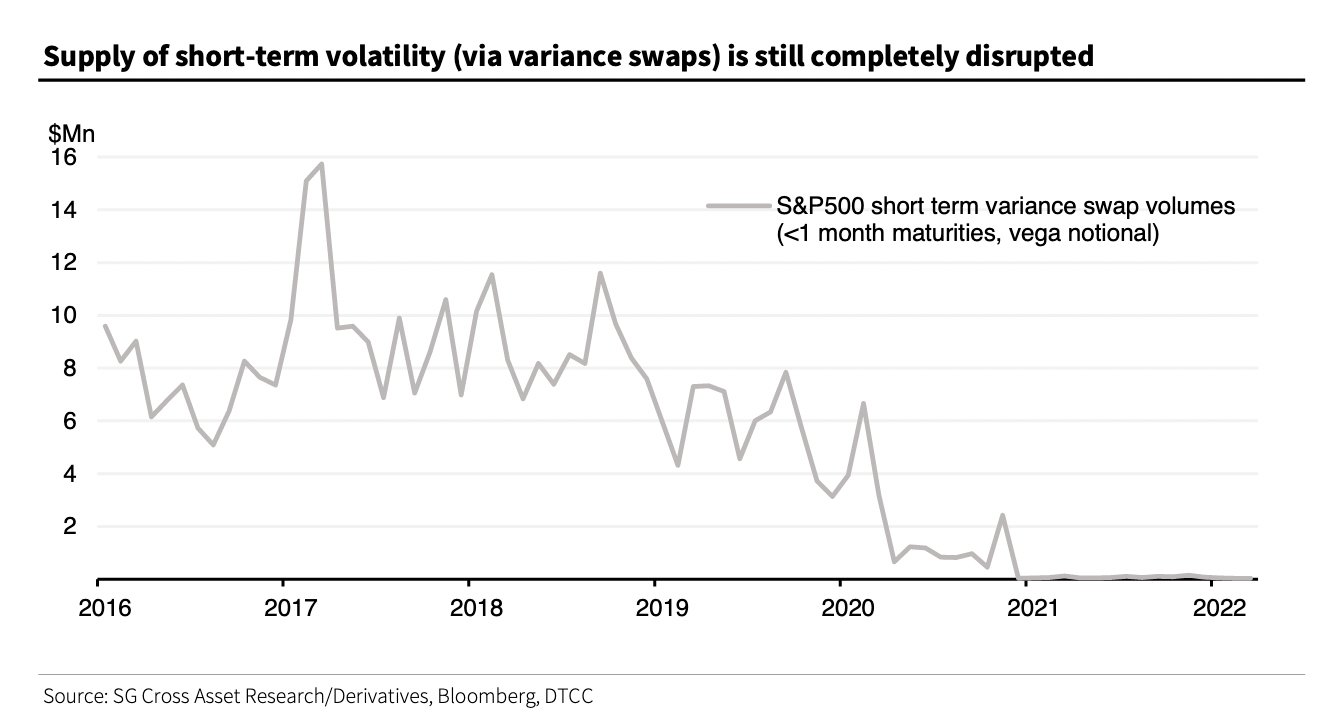
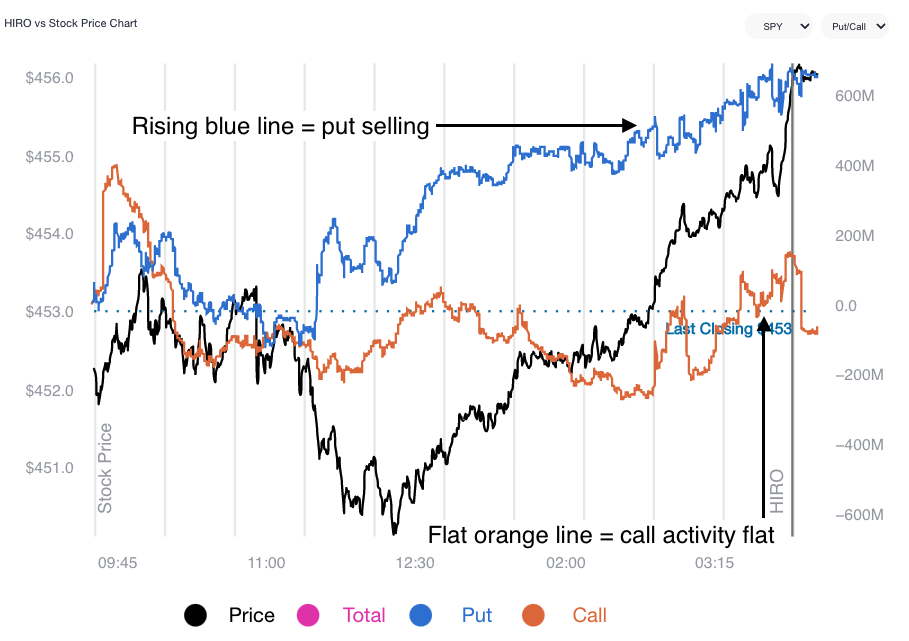
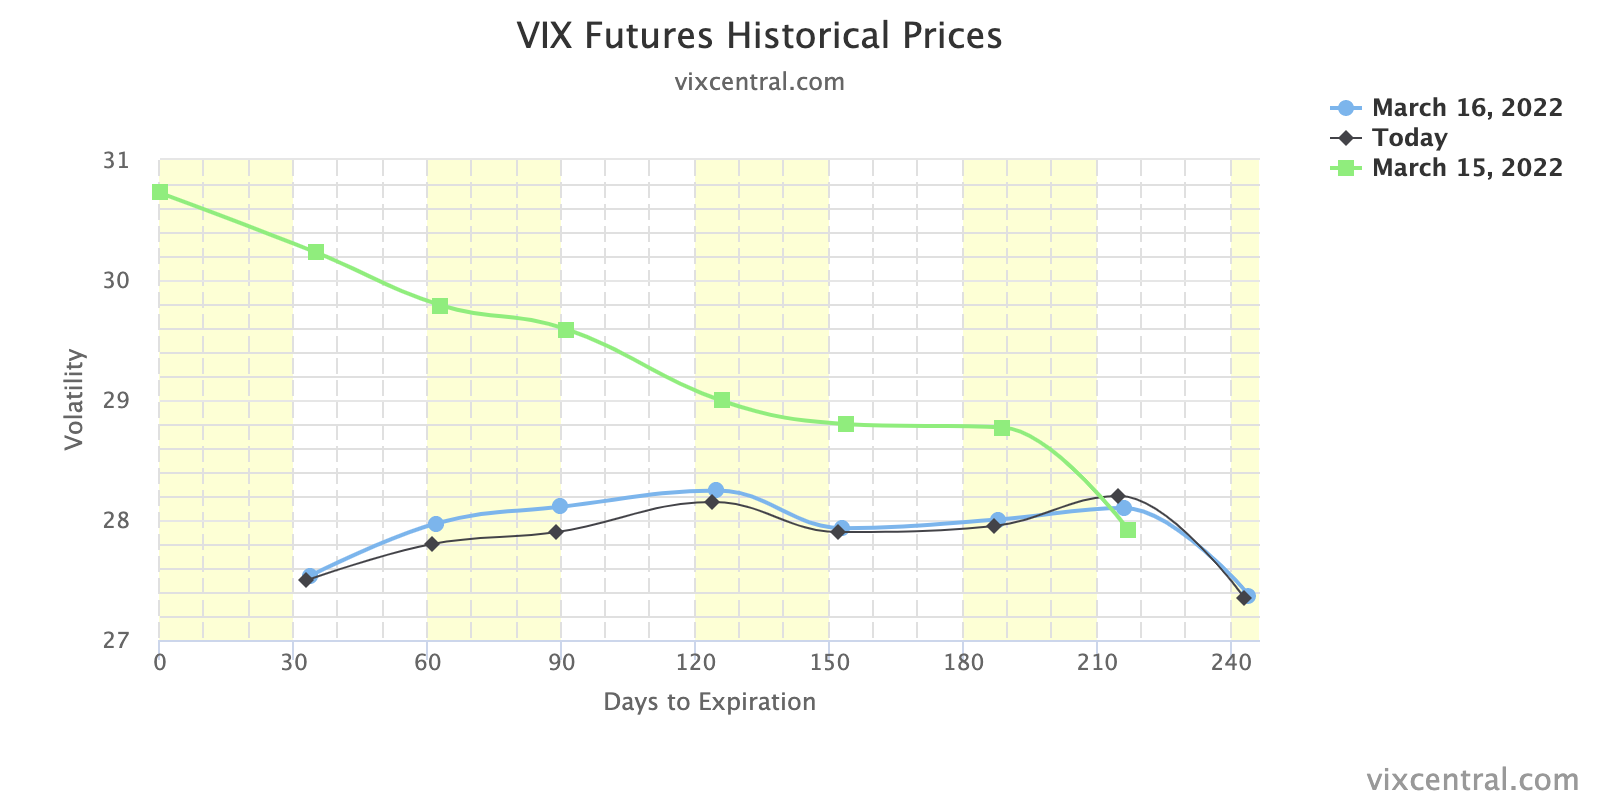
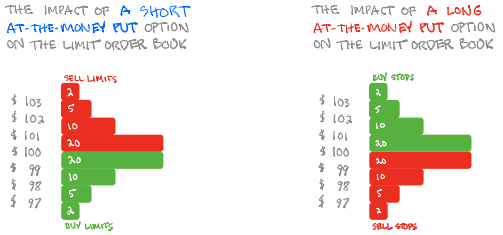
Positioning: It remains profitable to own options structures as implied (IVOL) underprices the volatility which is realized (RVOL).
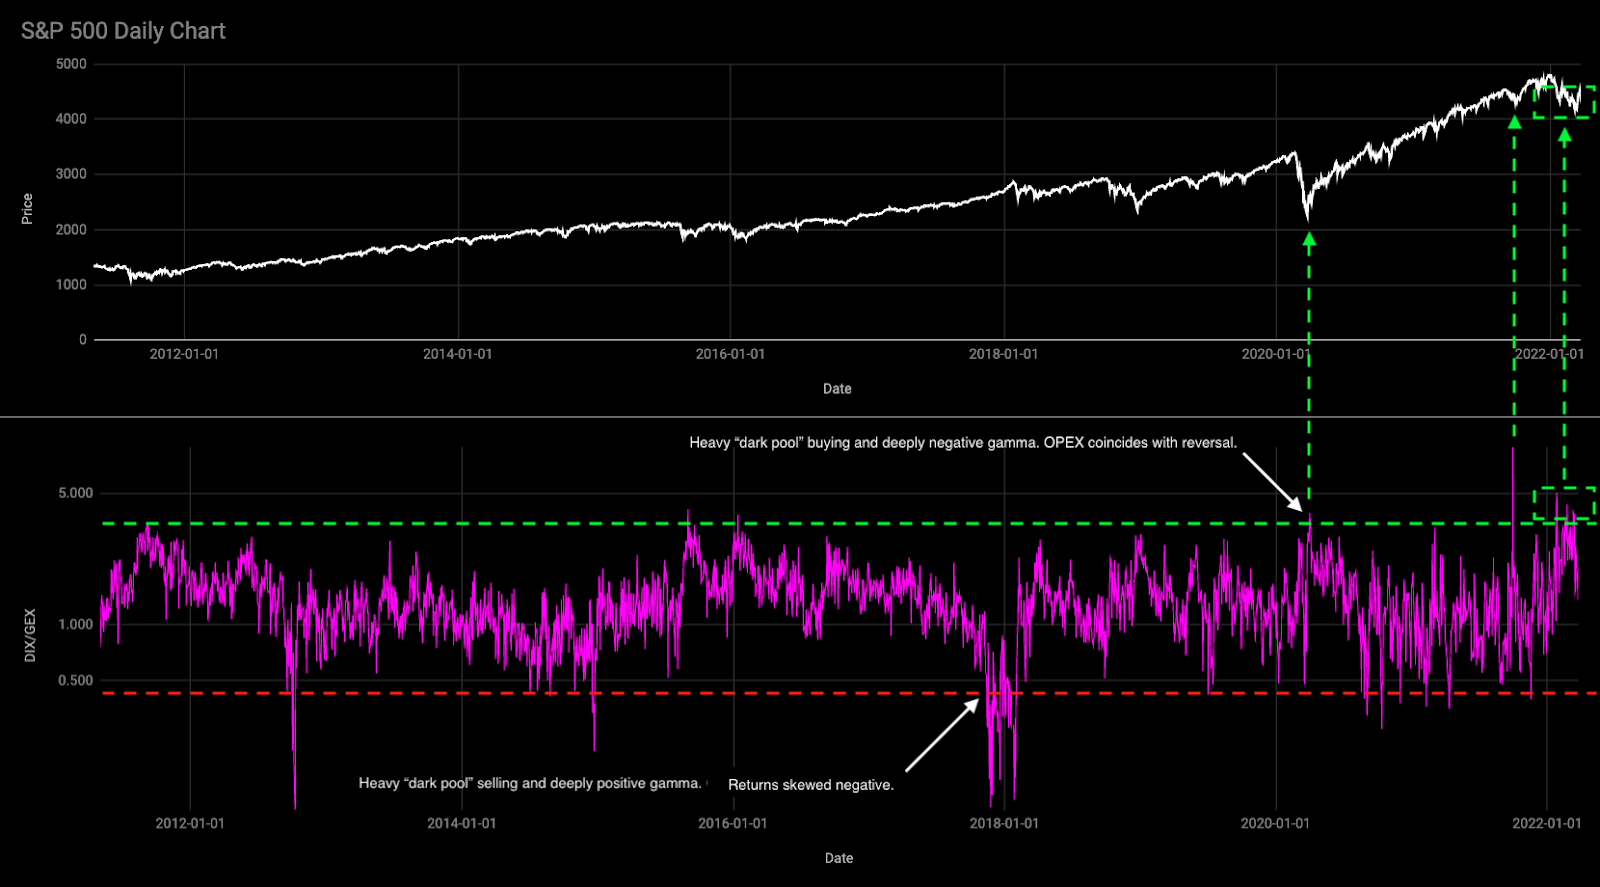
This is the result of what options analytics service SqueezeMetrics suggests is an “absolute slamming” (i.e., sale of options) that’s compressing IVOL in shorter-dated tenors.
It is “[o]nly rational to consider a bulk of them as put underwrites, because completely irrational otherwise.”
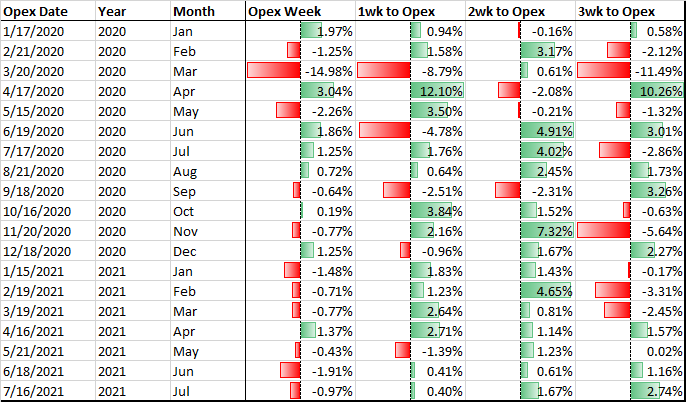
Important to note that this is in the context of next week’s large options expirations.
Into those events, typically, the frontrunning of delta hedging flows with respect to changes in time (charm), mainly, and volatility (vanna) provide an added boost.
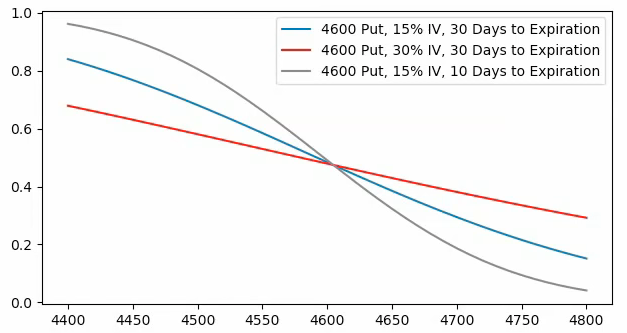
As stated Monday, however, the marginal impact of further volatility compression, since IVOL was falling from already low levels, was likely to do less to bolster equity upside.
A lot of the supportive action happened in the days and weeks prior, hence the comments on owning options.
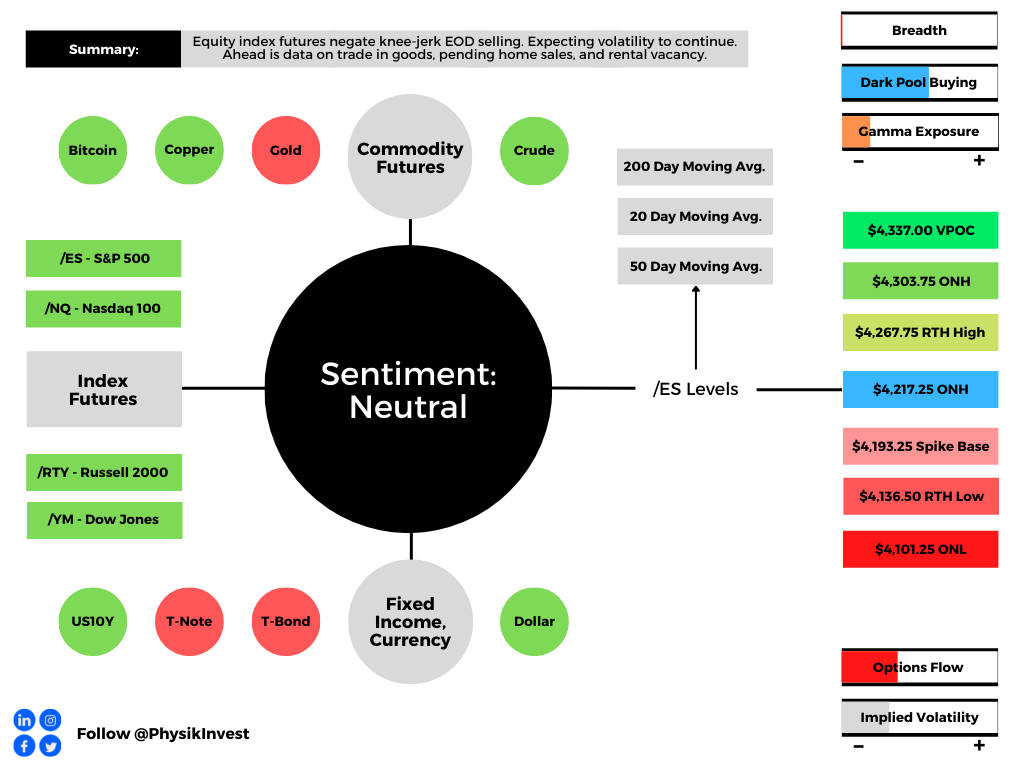
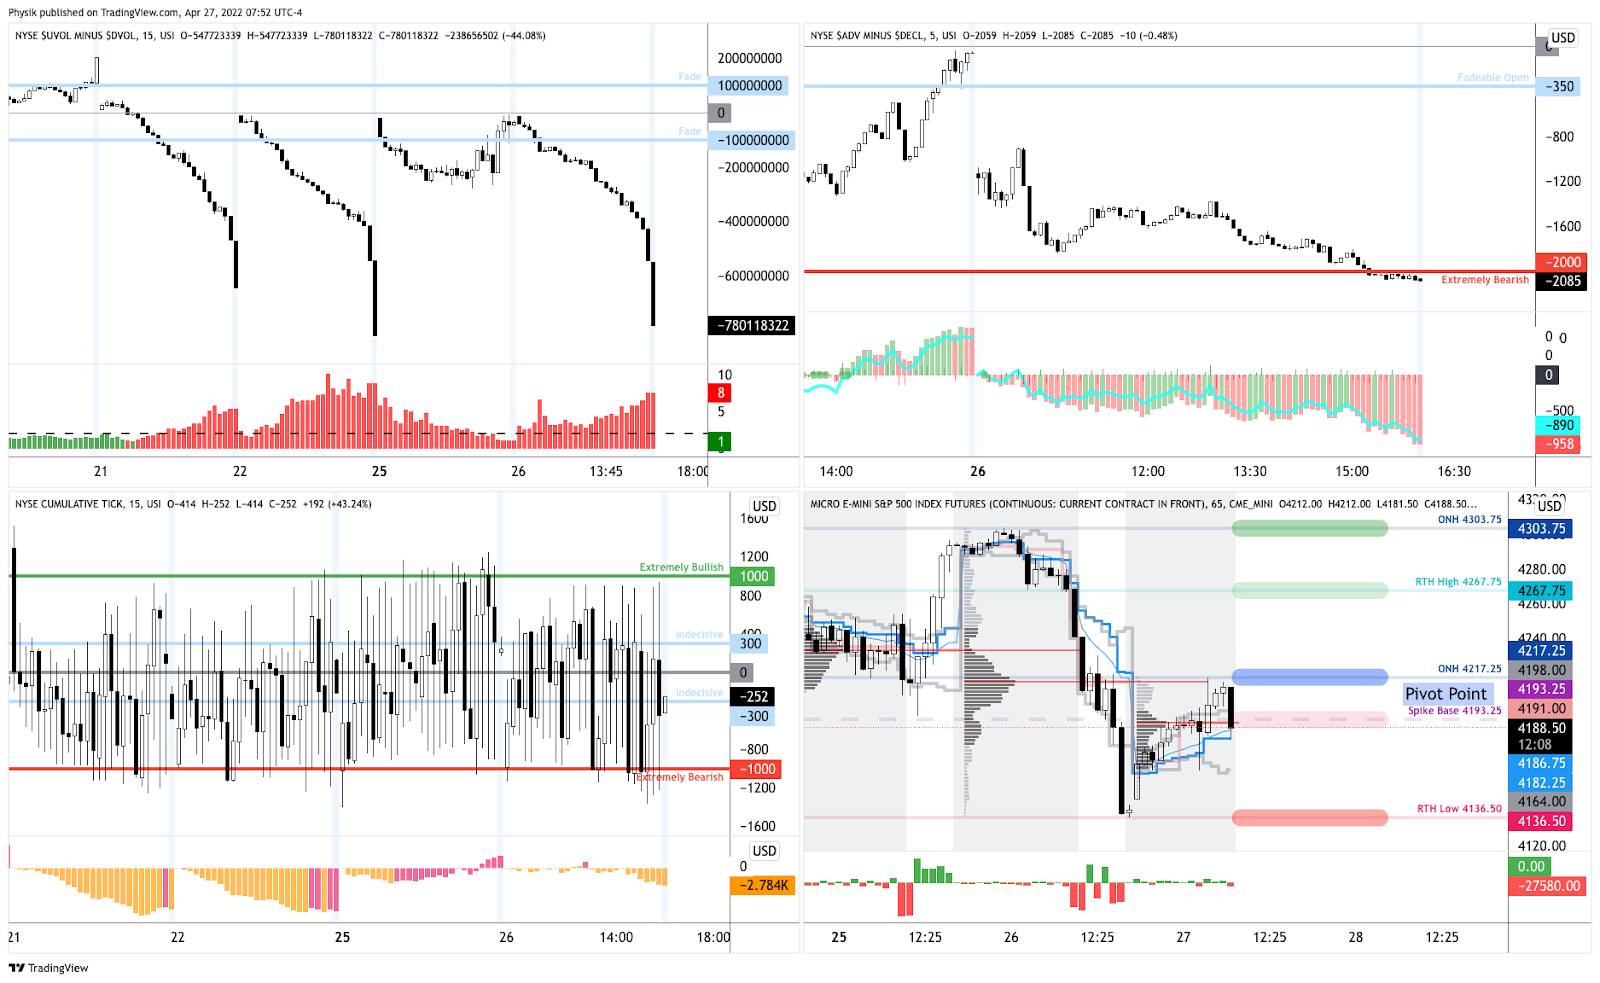
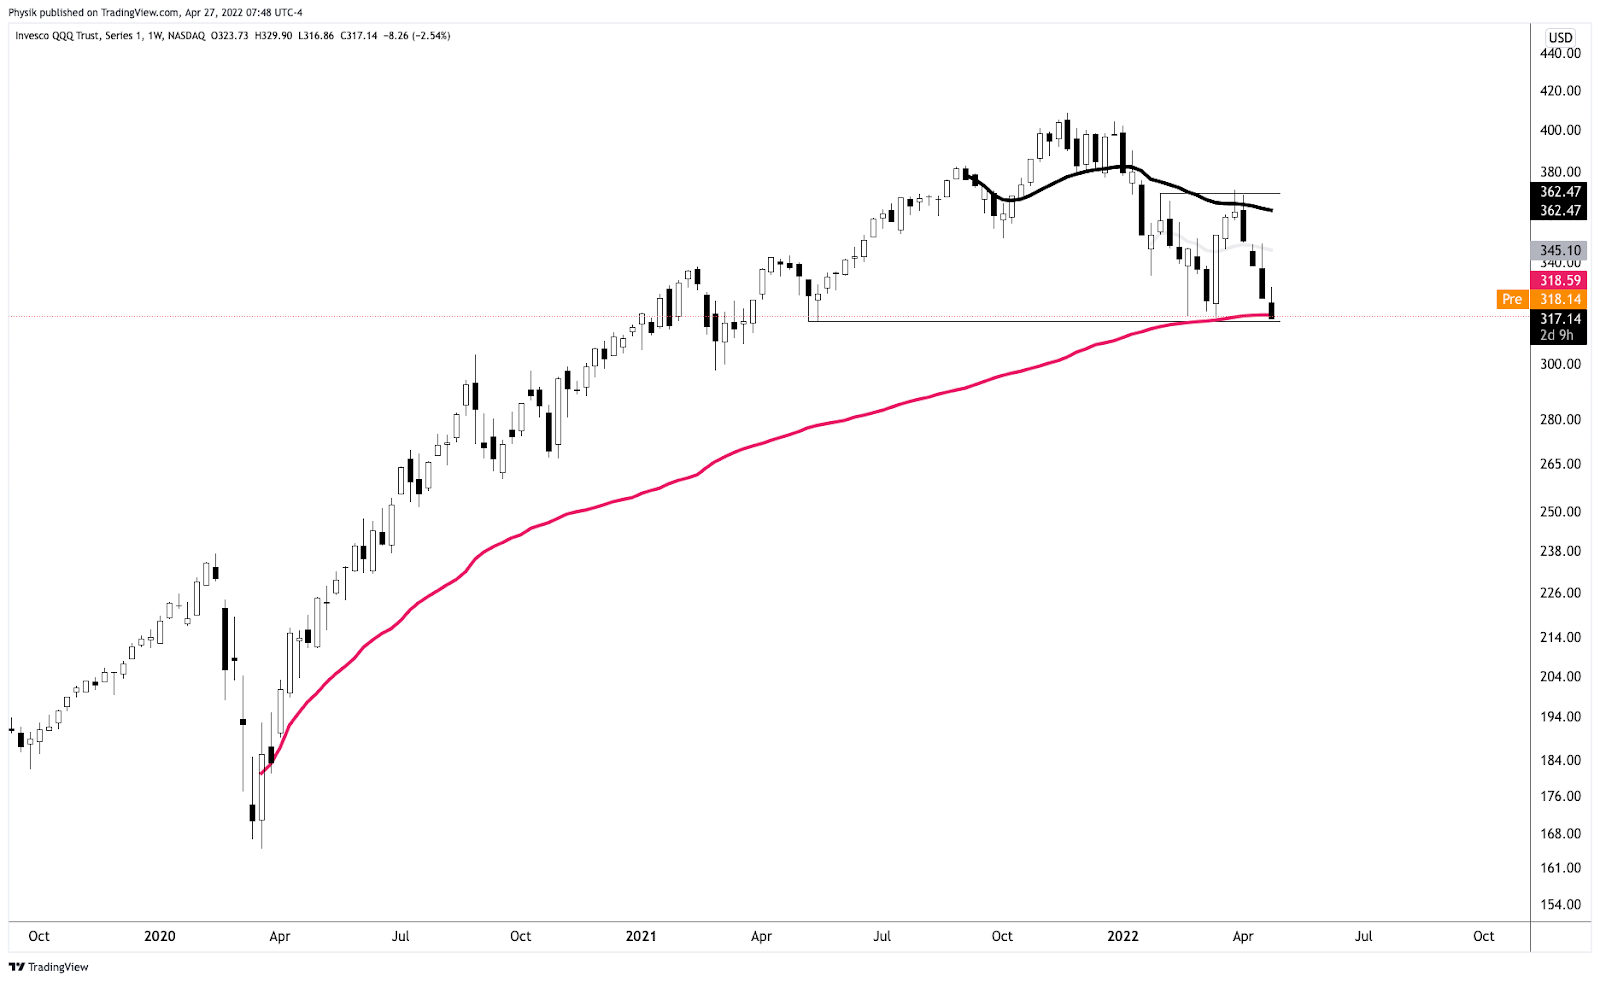
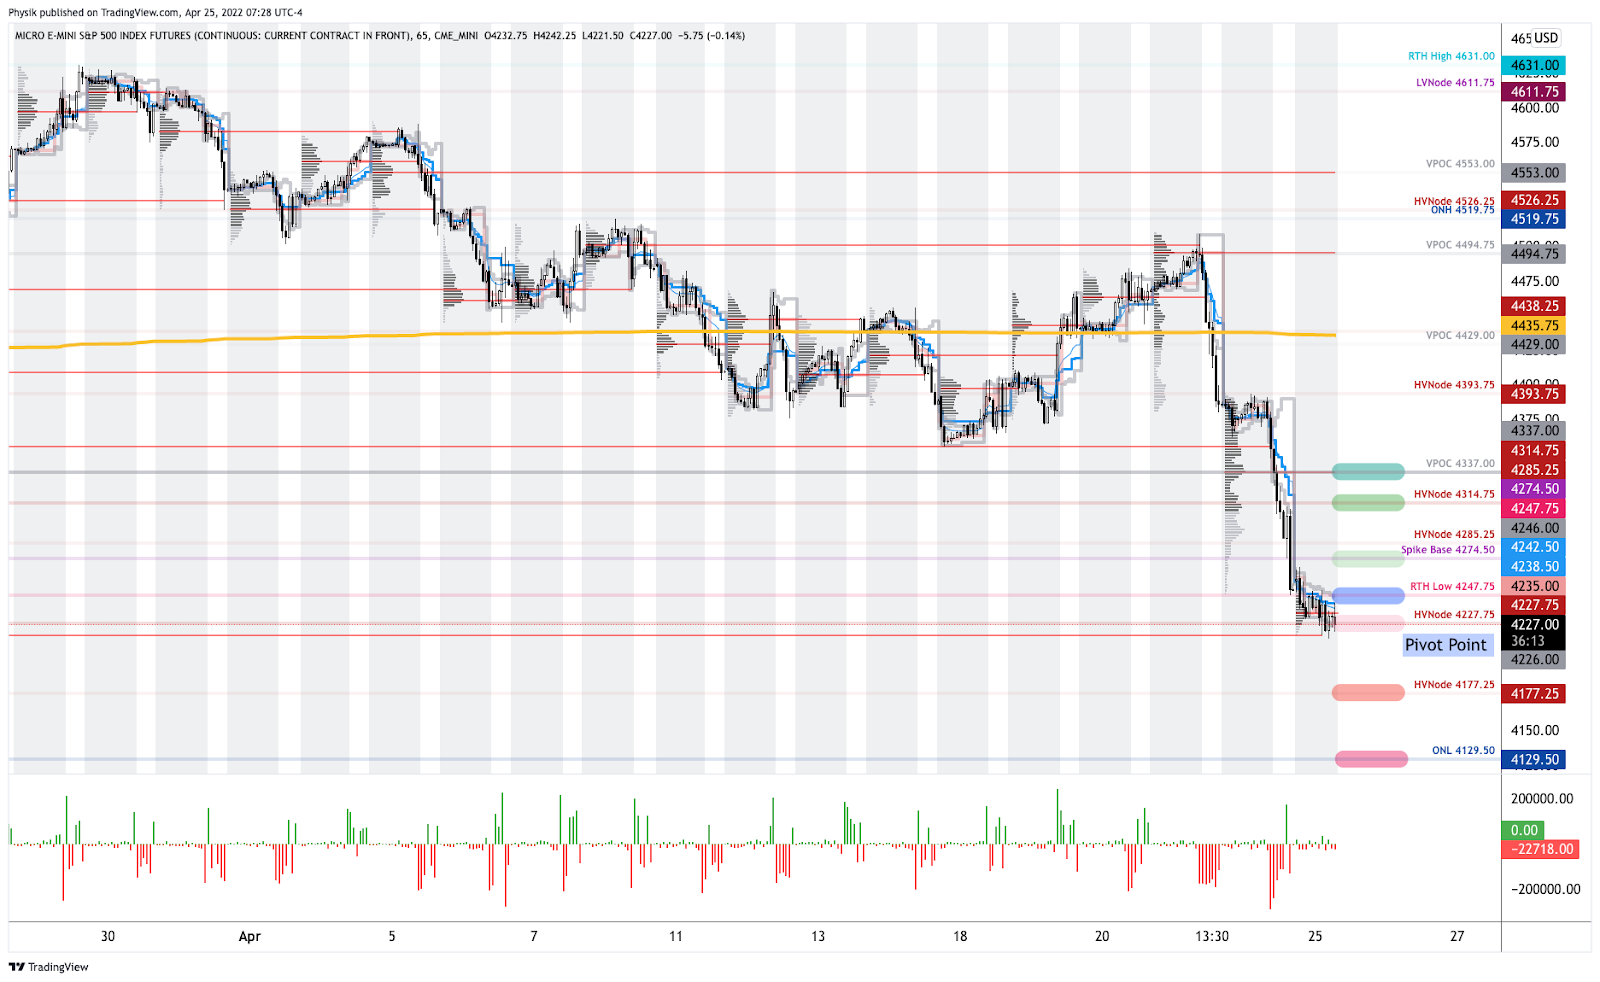
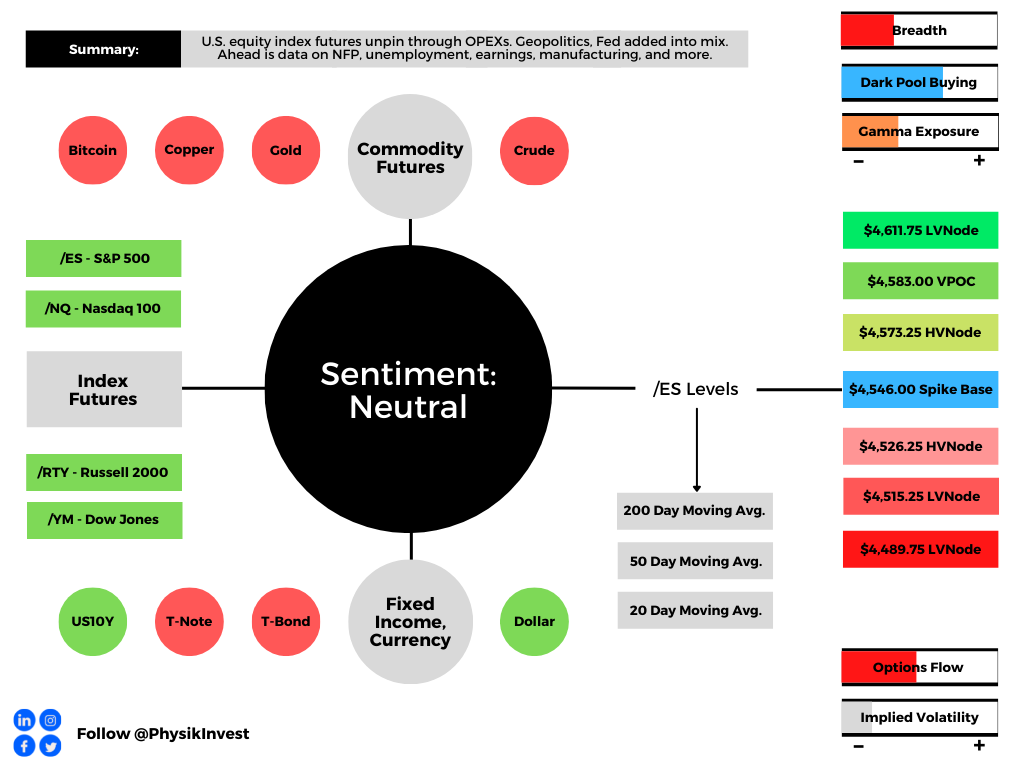
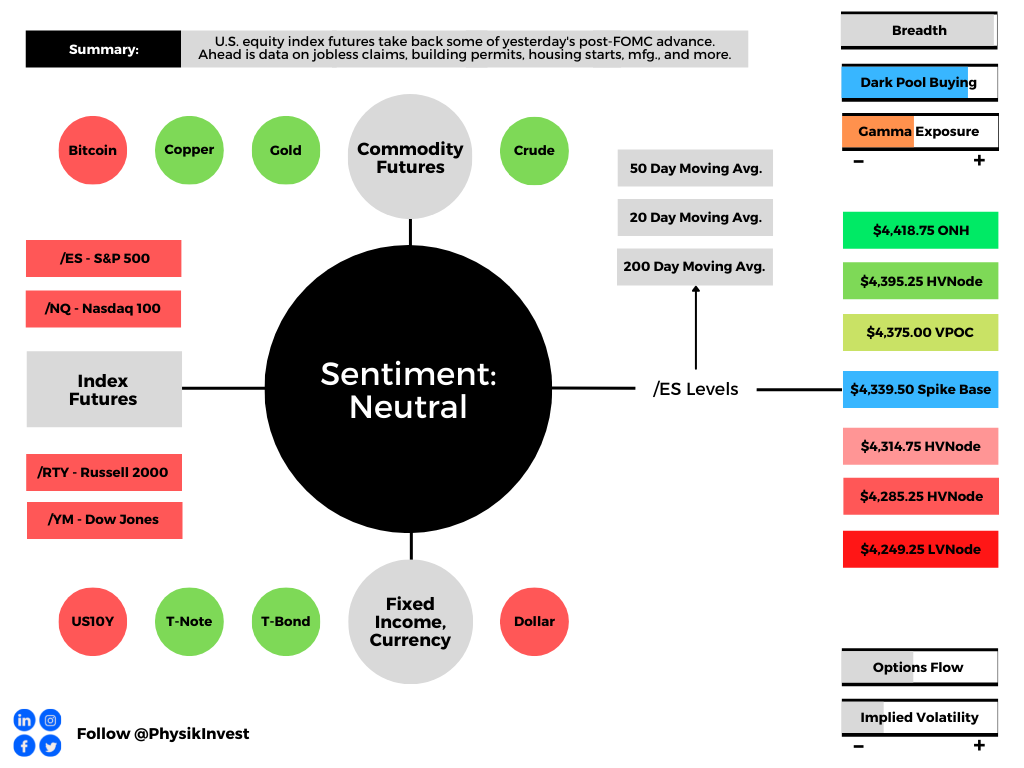
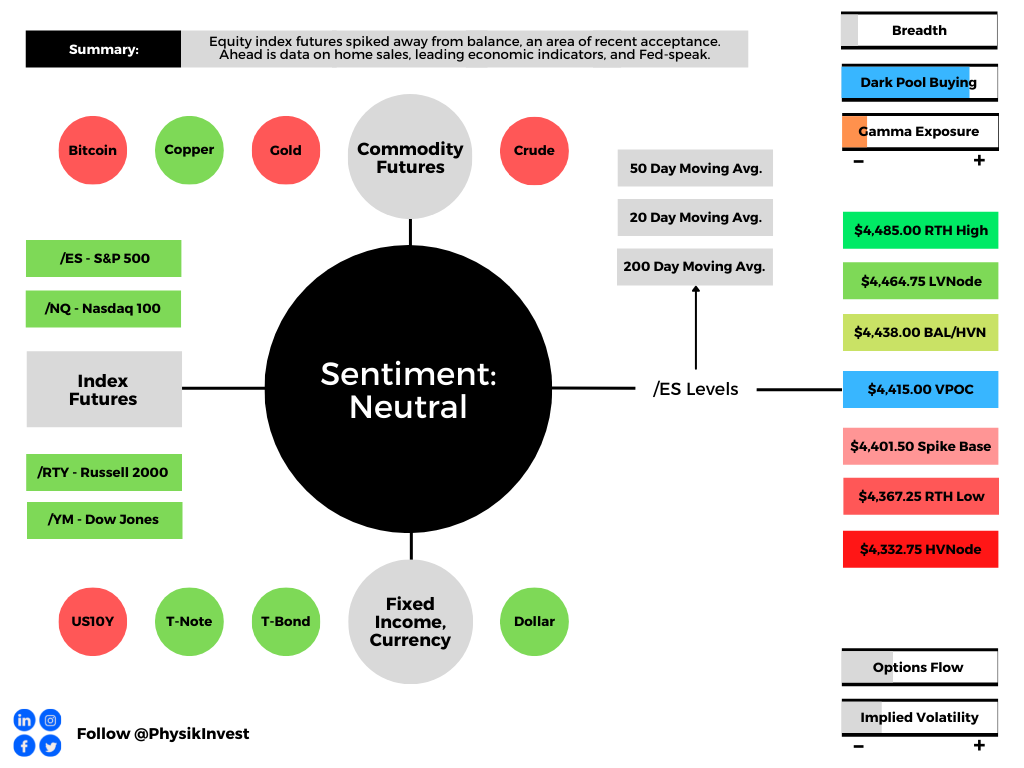
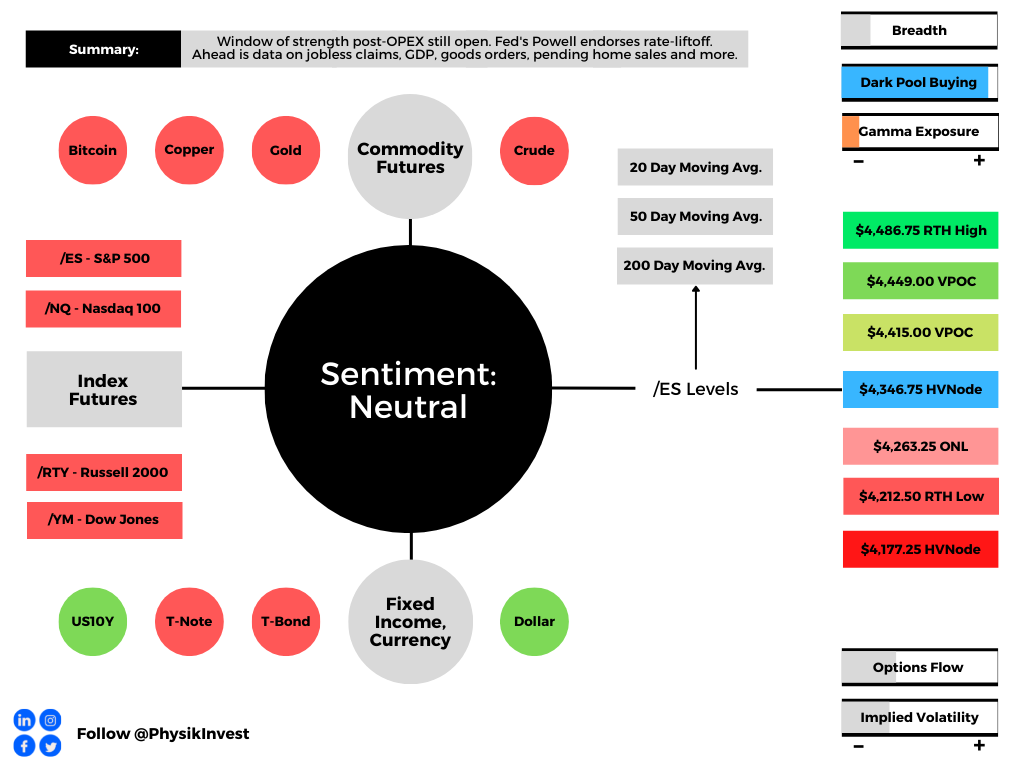
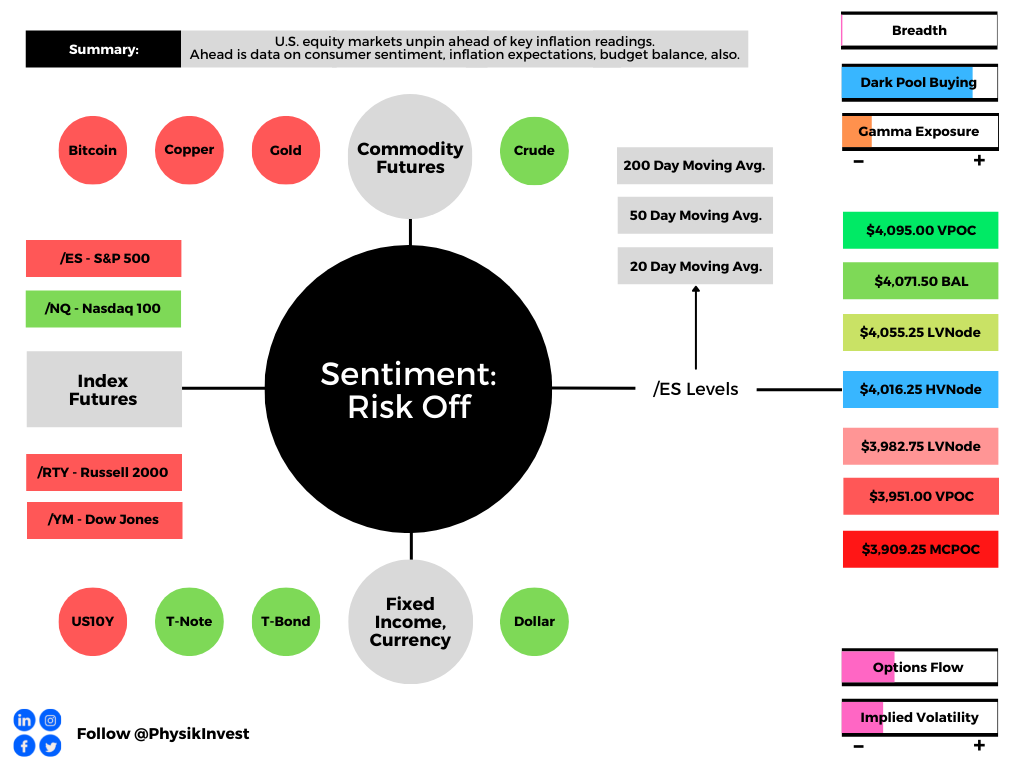
Technical: As of 6:30 AM ET, Friday’s regular session (9:30 AM – 4:00 PM ET), in the S&P 500, will likely open in the lower part of a negatively skewed overnight inventory, outside of prior-range and -value, suggesting a potential for immediate directional opportunity.
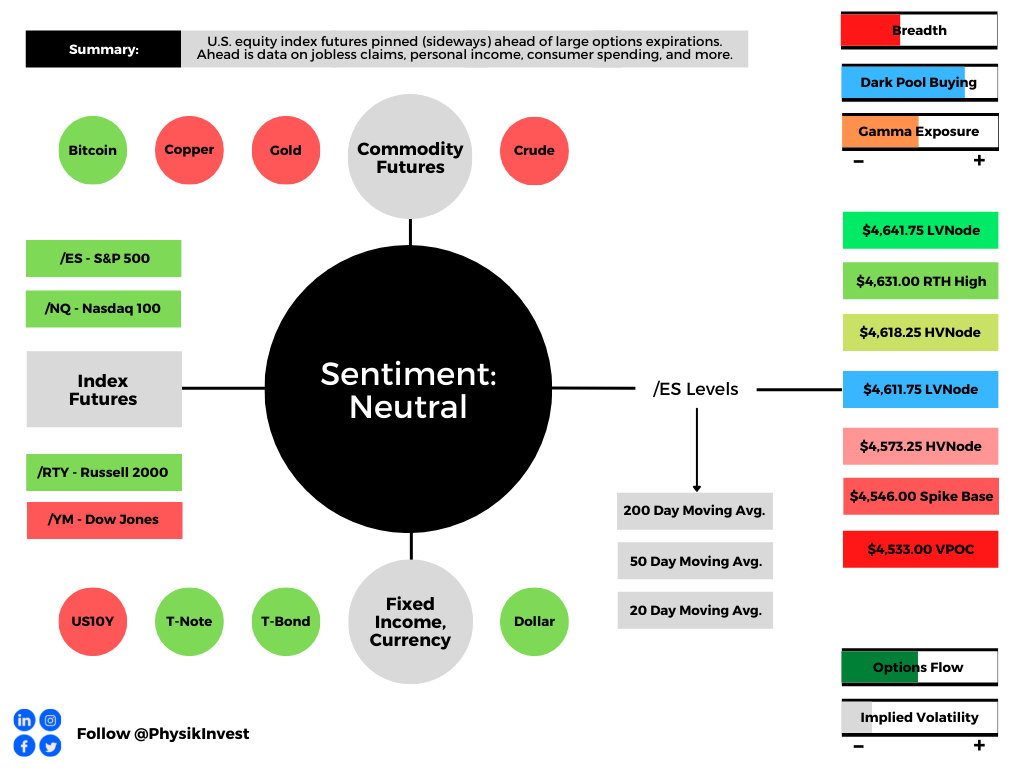
In the best case, the S&P 500 trades higher; activity above the $4,016.25 HVNode puts in play the $4,055.25 LVNode. Initiative trade beyond the LVNode could reach as high as the $4,071.50 BAL and $4,095.00 VPOC, or higher.
In the worst case, the S&P 500 trades lower; activity below the $4,016.25 HVNode puts in play the $3,982.75 LVNode. Initiative trade beyond the LVNode could reach as low as the $3,951.00 VPOC and $3,909.25 MCPOC, or lower.
Click here to load today’s key levels into the web-based TradingView charting platform. Note that all levels are derived using the 65-minute timeframe. New links are produced, daily.

Standard Balance-Break + Gap Scenarios: A change in the market (i.e., the transition from two-time frame trade, or balance, to one-time frame trade, or trend) is occurring.
Monitor for acceptance (i.e., more than 1-hour of trade) outside of the balance area.
Leaving value behind on a gap-fill or failing to fill a gap (i.e., remaining outside of the prior session’s range) is a go-with indicator.
Rejection (i.e., return inside of balance) portends a move to the opposite end of the balance.
Definitions
Volume Areas: A structurally sound market will build on areas of high volume (HVNodes). Should the market trend for long periods of time, it will lack sound structure, identified as low volume areas (LVNodes). LVNodes denote directional conviction and ought to offer support on any test.
If participants were to auction and find acceptance into areas of prior low volume (LVNodes), then future discovery ought to be volatile and quick as participants look to HVNodes for favorable entry or exit.
Point Of Control: POCs are valuable as they denote areas where two-sided trade was most prevalent in a prior day session. Participants will respond to future tests of value as they offer favorable entry and exit.
Micro Composite Point Of Control: POCs are valuable as they denote areas where two-sided trade was most prevalent over numerous day sessions. Participants will respond to future tests of value as they offer favorable entry and exit.
Volume-Weighted Average Prices (VWAPs): A metric highly regarded by chief investment officers, among other participants, for quality of trade. Additionally, liquidity algorithms are benchmarked and programmed to buy and sell around VWAPs.
About
After years of self-education, strategy development, mentorship, and trial-and-error, Renato Leonard Capelj began trading full-time and founded Physik Invest to detail his methods, research, and performance in the markets.
Capelj also develops insights around impactful options market dynamics at SpotGamma and is a Benzinga reporter.
Some of his works include conversations with ARK Invest’s Catherine Wood, investors Kevin O’Leary and John Chambers, FTX’s Sam Bankman-Fried, Kai Volatility’s Cem Karsan, The Ambrus Group’s Kris Sidial, among many others.
Disclaimer
In no way should the materials herein be construed as advice. Derivatives carry a substantial risk of loss. All content is for informational purposes only.