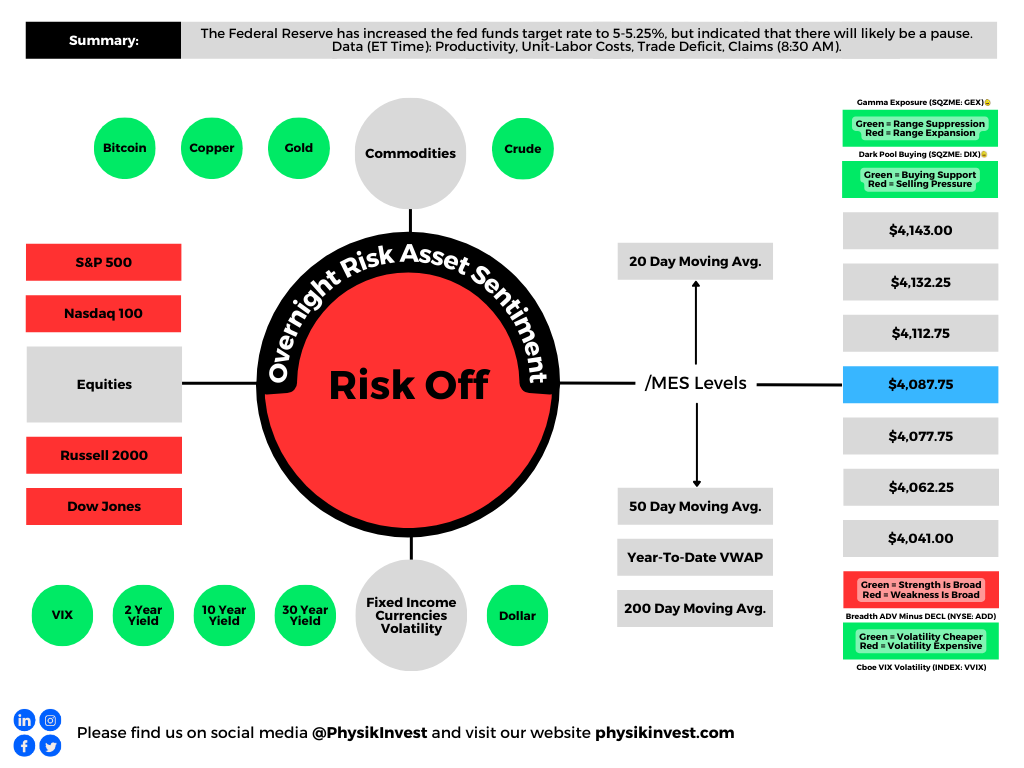
The Federal Reserve moved the fed funds target rate by 25 basis points to 5-5.25%. They also indicated a likely pause.
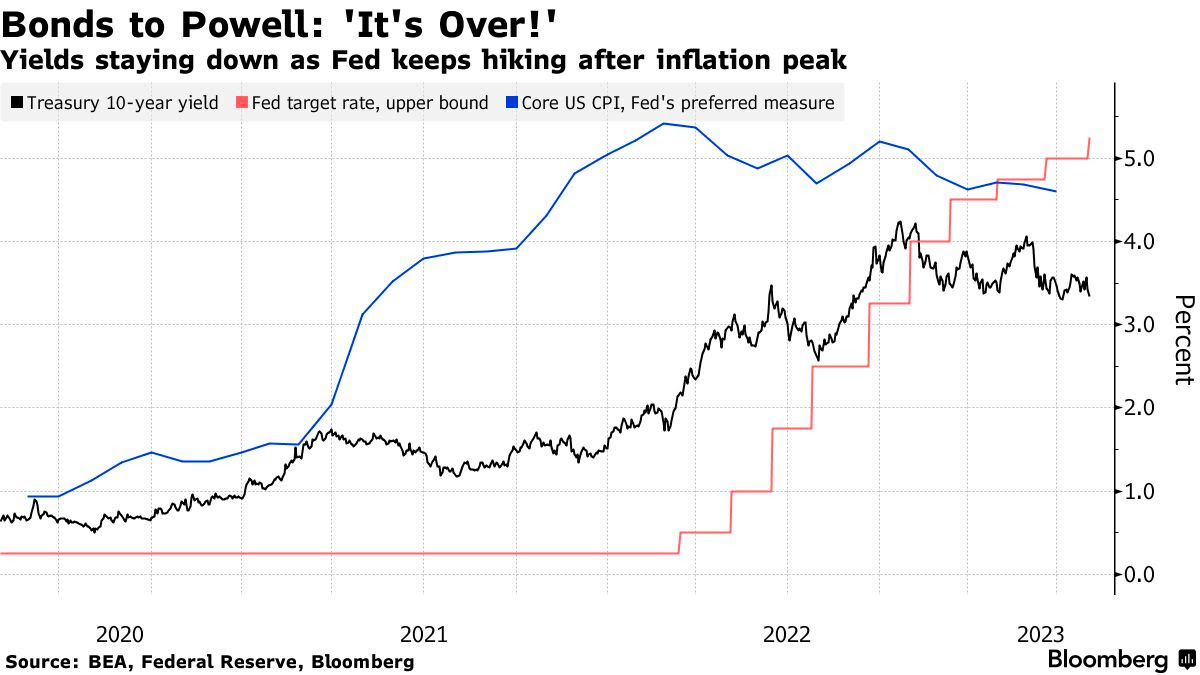
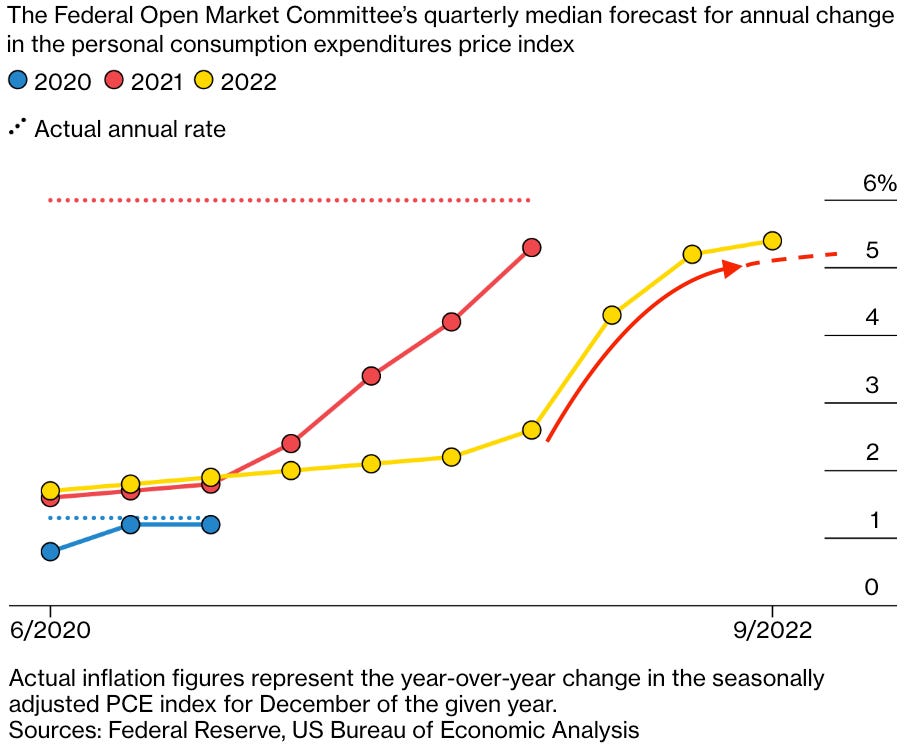
“Over the last 30+ years, every time fed funds were raised above the levels of core sticky inflation, policy turned out to be restrictive enough to cool inflationary pressures back to 2% or below,” explained Alfonso Peccatiello. “By summer, core sticky inflation should be trending in the 4% annualized area while fed funds will be sitting at 5% – and history suggests that means the Fed has tightened enough.”
Following a wait-and-see period, which Peccatiello thinks may last about five months, Powell said rates might loosen; measures indicate that financial conditions are tight, leading to predictions of negative economic consequences and cuts.
Graphic: Retrieved from Bloomberg.
“Chairman Powell’s message remains sobering — the Fed’s policy rates will only come down with a greater economic slowdown or credit crunch from tightening bank lending standards,” said Yung-Yu Ma of BMO Wealth Management. “The equity market has faded in the wake of Chairman Powell’s press conference. The market may be realizing that there’s a fine line between getting the rate cuts it wants and maintaining an economic trajectory that doesn’t invoke buyer’s remorse. A classic case of be careful what you wish for.”
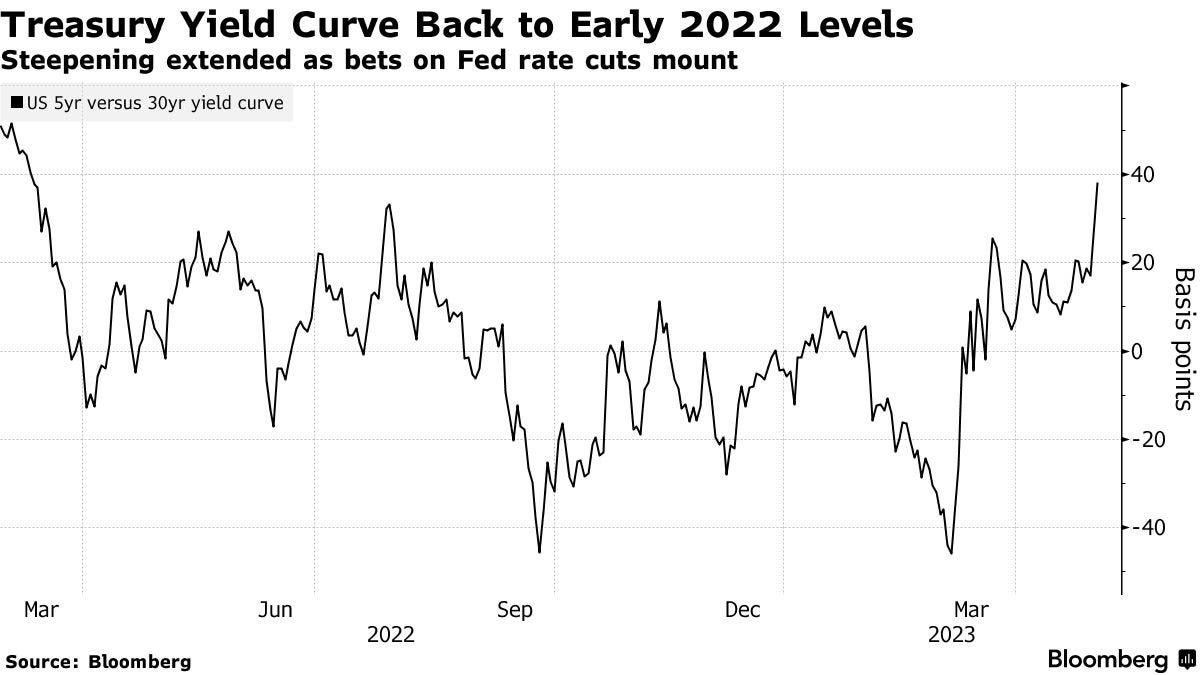
Graphic: Retrieved from Charles Schwab Inc-owned (NYSE: SCHW) thinkorswim platform. Three-Month SOFR Futures (FUTURE: /SR3). Implied interest rate = 100 – future price; the implied interest rate calculated using the 3-month SOFR future is an annualized rate. Based on the shape of the curve, /SR3 trader’s price an easing in the coming months.
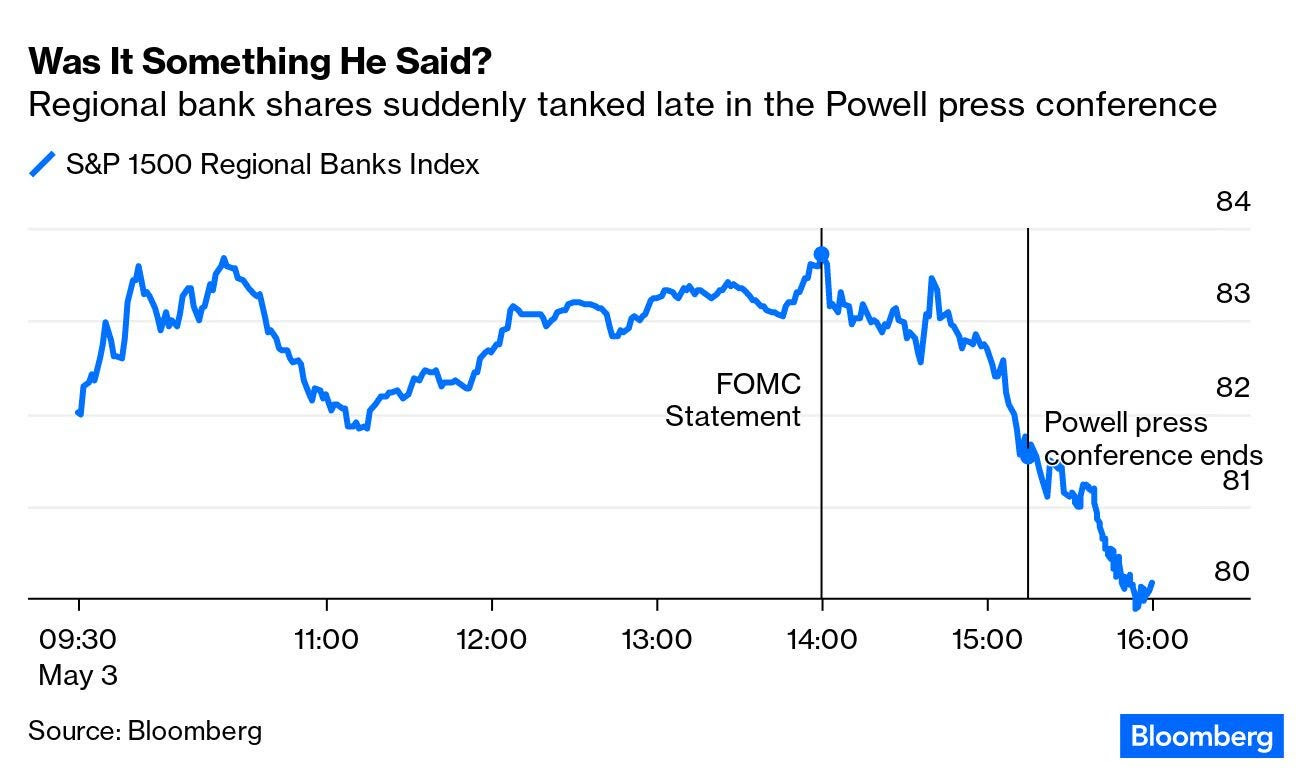
Markets closed lower after the Fed’s decision, amid PacWest Bancorp’s (NASDAQ: PACW) examination of strategic options, including a possible sale, confirming that the problem of high bond yields is still around in the banking sector.
“It looks like the markets are moving from one bank to the other, and vulnerable deer in the herd are being kicked off,” Dennis Lockhart, a former Atlanta Fed President, said. “But I would like to believe that Jay Powell has information that suggests that the situation is contained or containable.”
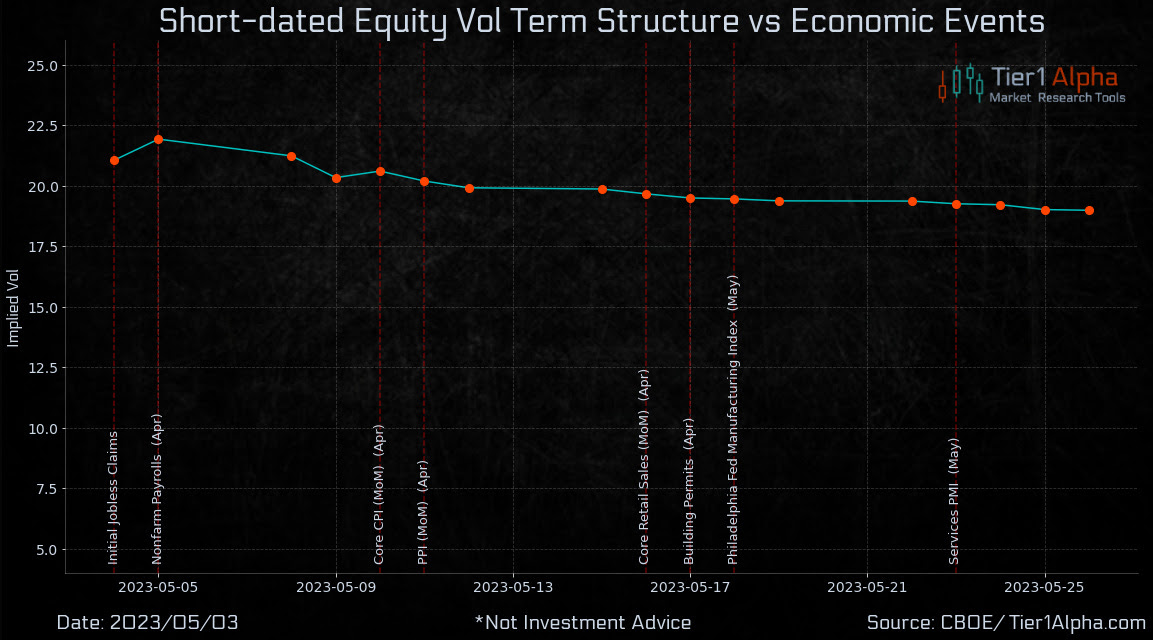
Graphic: Retrieved from Tier1Alpha. Measure suggests traders’ fears and demands to protect/speculate on movement are higher (but restrained) after rate hike, a pressure on underlying markets that could be a catalyst for upside, too, if volatility were to compress/fall again.
As explained in recent letters and our detailed trade structuring report, the markets may trade stronger for longer. However, the risks grow “as recessionary conditions proliferate.” Some, including Andy Constan of Damped Spring Advisors, think a hard landing is 100% a likely outcome over the long term, while, over the short term, our recent letters point to context that may keep markets contained.
As a reminder, there will be only updates to levels tomorrow and Monday. Stay well.
Graphic: Retrieved from Sergei Perfiliev. A persistent spread in realized and implied volatility may contain markets.
About
Welcome to the Daily Brief by Physik Invest, a soon-to-launch research, consulting, trading, and asset management solutions provider. Learn about our origin story here, and consider subscribing for daily updates on the critical contexts that could lend to future market movement.
Separately, please don’t use this free letter as advice; all content is for informational purposes, and derivatives carry a substantial risk of loss. At this time, Capelj and Physik Invest, non-professional advisors, will never solicit others for capital or collect fees and disbursements. Separately, you may view this letter’s content calendar at this link.
Physik Invest’s Daily Brief is read by thousands of subscribers. You, too, can join this community to learn about the fundamental and technical drivers of markets.
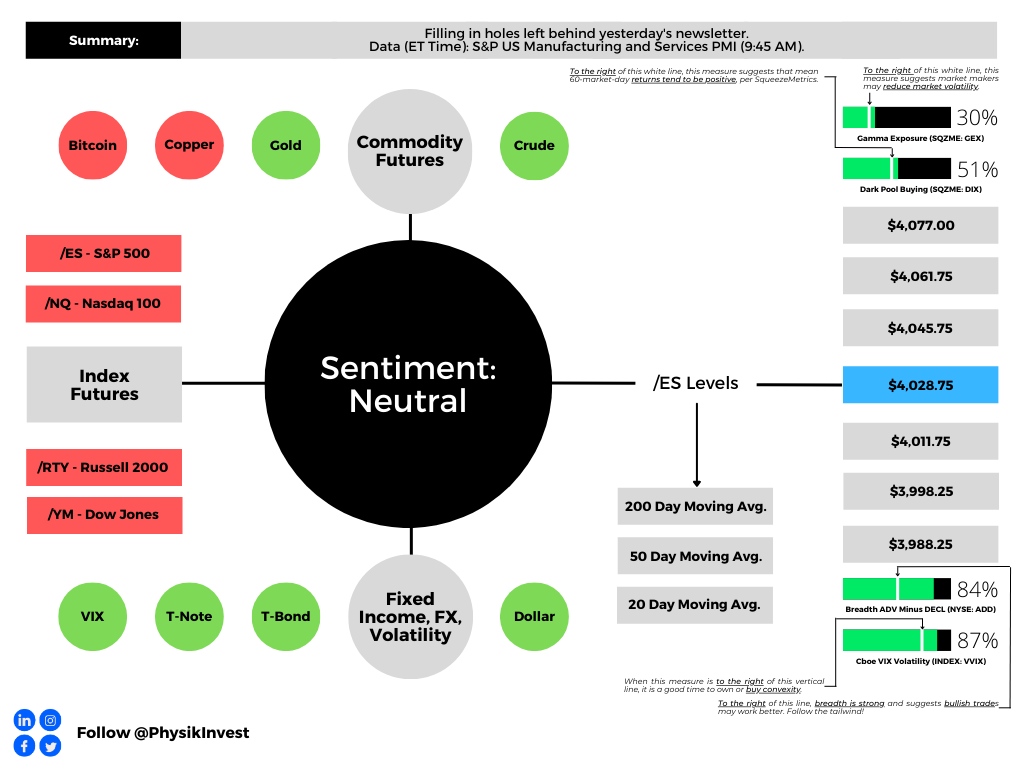
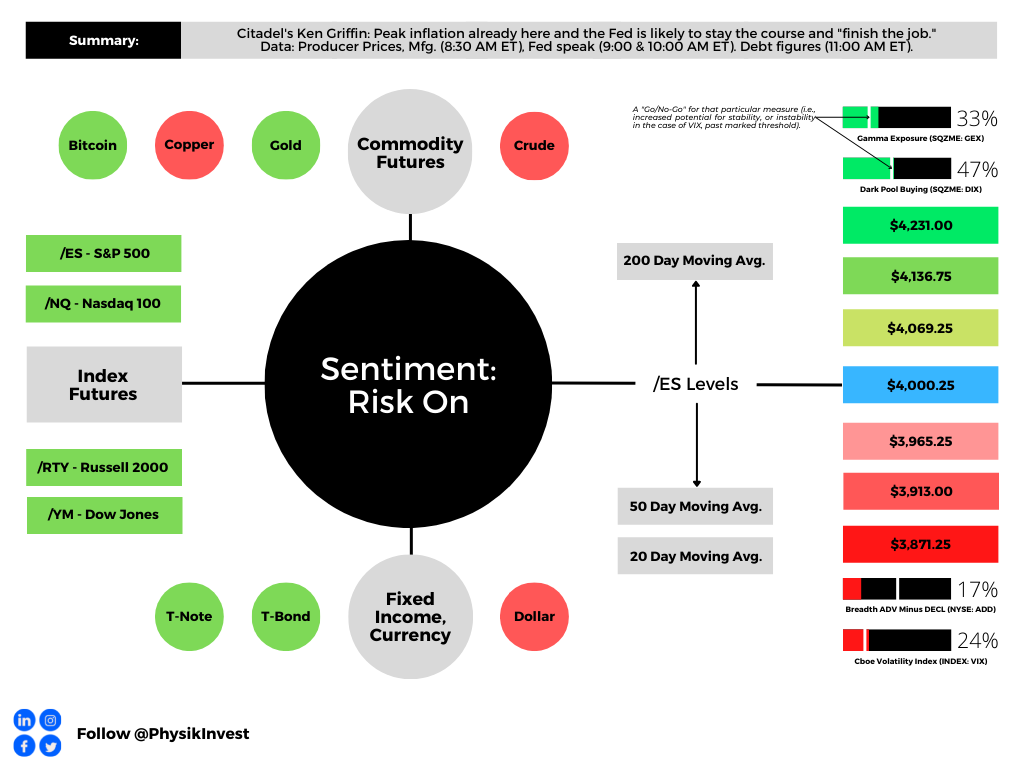
Graphic updated 7:55 AM ET. Sentiment Risk-Off if expected /ES open is below the prior day’s range. /ES levels are derived from the profile graphic at the bottom of this letter. Click here for the latest levels. SqueezeMetrics Dark Pool Index (DIX) and Gamma (GEX) with the latter calculated based on where the prior day’s reading falls with respect to the MAX and MIN of all occurrences available. A higher DIX is bullish. At the same time, the lower the GEX, the more (expected) volatility. Click to learn the implications of volatility, direction, and moneyness. Breadth reflects a reading of the prior day’s NYSE Advance/Decline indicator. The CBOE VIX Volatility Index (INDEX: VVIX) reflects the attractiveness of owning volatility.
Fundamental
To kick off this week, we’ll do a short recap of last week and, then, go into more depth over the coming days. Thanks for tuning in (and subscribing if you’re new). Have a great rest of your day!
As a recap, markets were strong last week with follow-on strength, in part, coming from the options complex; implied volatility (IVOL) shifting lower and the trade of short-dated options were likely two big market boosters. Trades that worked really well included structures long call options closer to current market prices and short call options farther from current market prices.
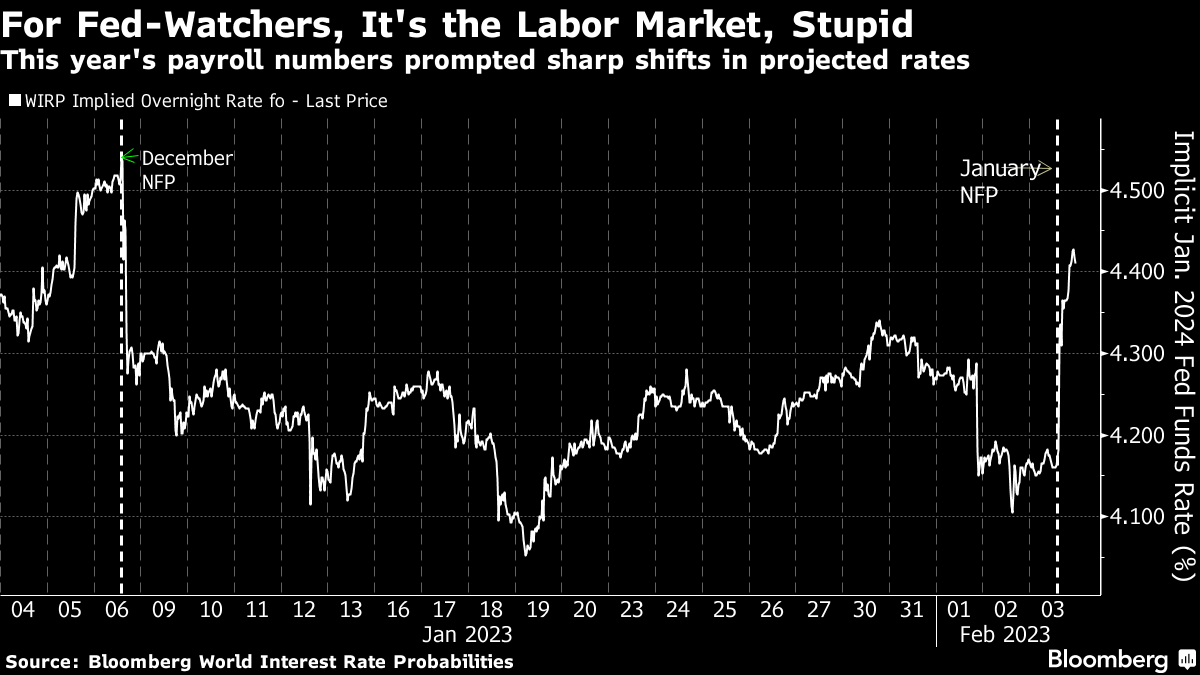
Investors were optimistic about the fact that “[i]nflation was coming down, the US was slowing down faster than Europe, and rates would soon be nudging down as the Federal Reserve [or Fed] aimed to ease the economy into a reasonably ‘soft’ landing,” Bloomberg’s John Authers said. However, “on Friday morning, the facts changed.”
Data is pointing to job creation, and this is likely to put upward pressure on inflation. Accordingly, traders are pricing higher rates, again; “the unemployment data, on its face, implied that rates short and long would have to rise because money remains too cheap,” Authers added. This news bolstered the selling heading into Monday.
Graphic: Retrieved from Bloomberg.
As The Macro Compass’ Alfonso Peccatiello summarized, “a bear market rally starts by squeezing out shorts [and] it extends through some narrative that seems to validate price action (2001: worst is behind; 2023: soft landing). In the end though, to morph into a new bull market it needs fundamentals and/or the Fed, [but it appears] you have neither in 2023.”
Positioning
Notwithstanding the equity market’s potential to stay strong into the mid-February timeframe as some strategists think (which we summarized in last week’s letters), with longer-dated SPX IVOL cheap, still “attractive trades include selling rich call verticals to finance put verticals.”
Technical
As of 7:45 AM ET, Monday’s regular session (9:30 AM – 4:00 PM ET), in the S&P 500, is likely to open in the lower part of a negatively skewed overnight inventory, outside of the prior day’s range, suggesting a potential for immediate directional opportunity.
The S&P 500 pivot for today is $4,122.75.
Key levels to the upside include $4,136.75, $4,147.00, and $4,165.75.
Key levels to the downside include $4,100.25, $4,079.00, and $4,052.25.
Disclaimer: Click here to load the updated key levels via the web-based TradingView platform. New links are produced daily. Quoted levels likely hold barring an exogenous development.
Graphic: 65-minute profile chart of the Micro E-mini S&P 500 Futures.
Definitions
Volume Areas: Markets will build on areas of high-volume (HVNodes). Should the market trend for a period of time, this will be identified by a low-volume area (LVNodes). The LVNodes denote directional conviction and ought to offer support on any test.
If participants auction and find acceptance in an area of a prior LVNode, then future discovery ought to be volatile and quick as participants look to the nearest HVNodes for more favorable entry or exit.
POCs: Areas where two-sided trade was most prevalent in a prior day session. Participants will respond to future tests of value as they offer favorable entry and exit.
About
The author, Renato Leonard Capelj, works in finance and journalism.
Capelj spends the bulk of his time at Physik Invest, an entity through which he invests and publishes free daily analyses to thousands of subscribers. The analyses offer him and his subscribers a way to stay on the right side of the market. Separately, Capelj is an options analyst at SpotGamma and an accredited journalist.
Physik Invest’s Daily Brief is read by thousands of subscribers. You, too, can join this community to learn about the fundamental and technical drivers of markets.
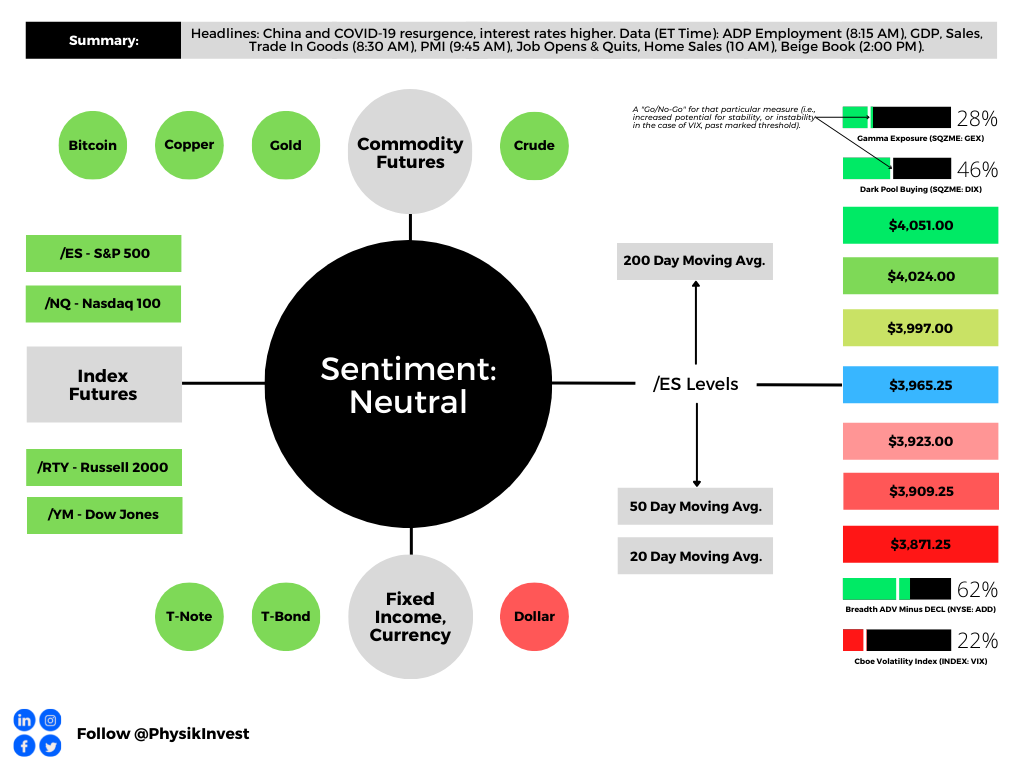
Graphic updated 7:00 AM ET. Sentiment Neutral if expected /ES open is inside of the prior day’s range. /ES levels are derived from the profile graphic at the bottom of this letter. Click here for the latest levels. SqueezeMetrics Dark Pool Index (DIX) and Gamma (GEX) with the latter calculated based on where the prior day’s reading falls with respect to the MAX and MIN of all occurrences available. A higher DIX is bullish. At the same time, the lower the GEX, the more (expected) volatility. Click to learn the implications of volatility, direction, and moneyness. Breadth reflects a reading of the prior day’s NYSE Advance/Decline indicator. The CBOE VIX Volatility Index (INDEX: VVIX) reflects the attractiveness of owning volatility.
Administrative
Monday’s letter had some holes. Let’s try to fill them in, today, and get a fuller picture.
Summary of today’s letter: though the real economy may be strong, sticky inflation likely results in higher rates for longer, as well as quantitative tightening. This is not good for the financial economy. Some suggest the equity market rally persists into mid-February before further weaknesses appear. Read on for more.
Fundamental
Many sentiment and positioning indicators are bearish.
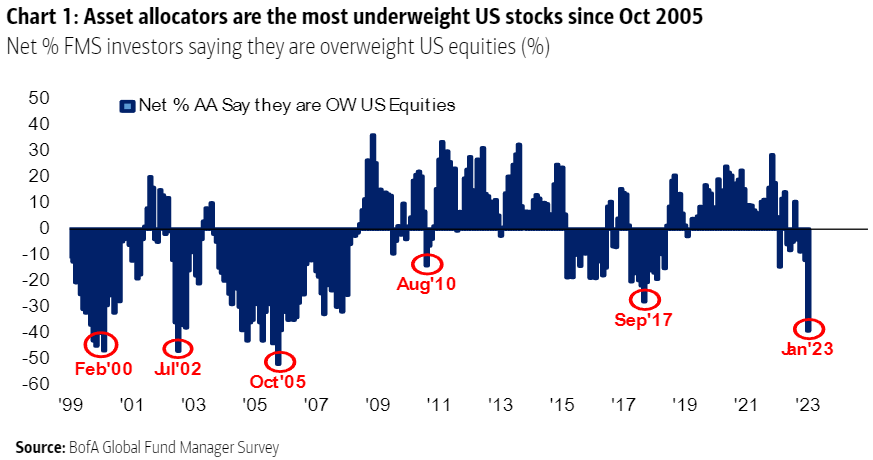
For instance, surveys by Bank of America Corporation (NYSE: BAC) point to allocators being very underweight US stocks. Also, investors are reporting some of their biggest one-month exits from stocks since BAC started surveying.
Graphic: Retrieved from BAC via Bloomberg’s John Authers.
The consensus is turning more bearish, we see, and some of this letter’s most quoted voices maintain that markets (not necessarily the economy) are in for more weakness.
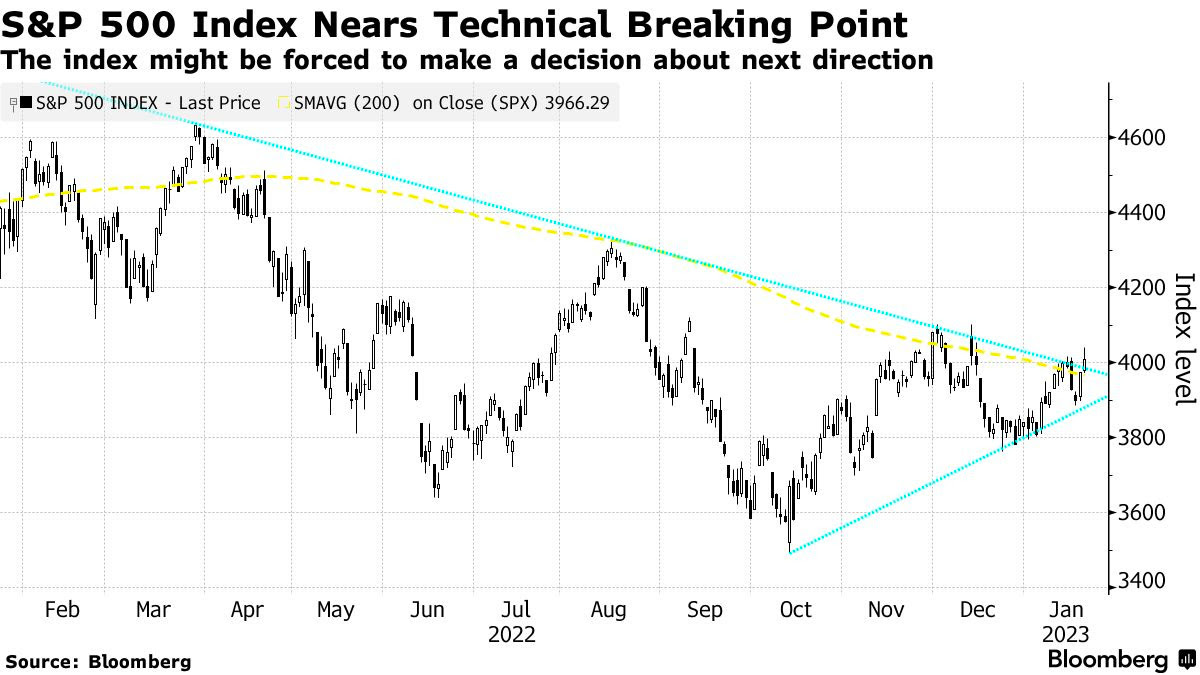
That is in the face of a severely depressed S&P 500 (INDEX: SPX) crossing above key areas denoting technical resistance, a signal for trend-followers to get involved on the long side (i.e., buy stocks) Kai Volatility’s Cem Karsan explained in a video last week.
Equity market strength drivers, Karsan said, include China reopening and increasing stimulus, Europe’s not-so-bad winter, and little worsening of conflicts (e.g., Ukraine and Russia situation).
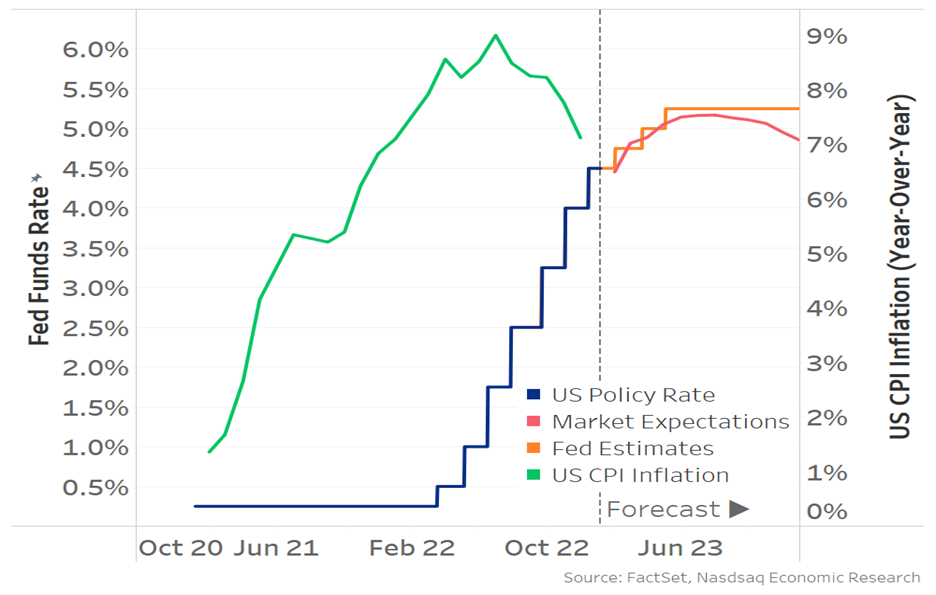
Adding, as The Macro Compass’ Alfonso Peccatiello said, the bond market thinks the Fed will not hike into a recession. Inflation likely “slows down to 2.5% quickly, [with] the Fed cutting rates to neutral (and never below). [That’s] not recessionary pricing. It’s immaculate disinflation pricing.”
The base case is a landing that’s soft.
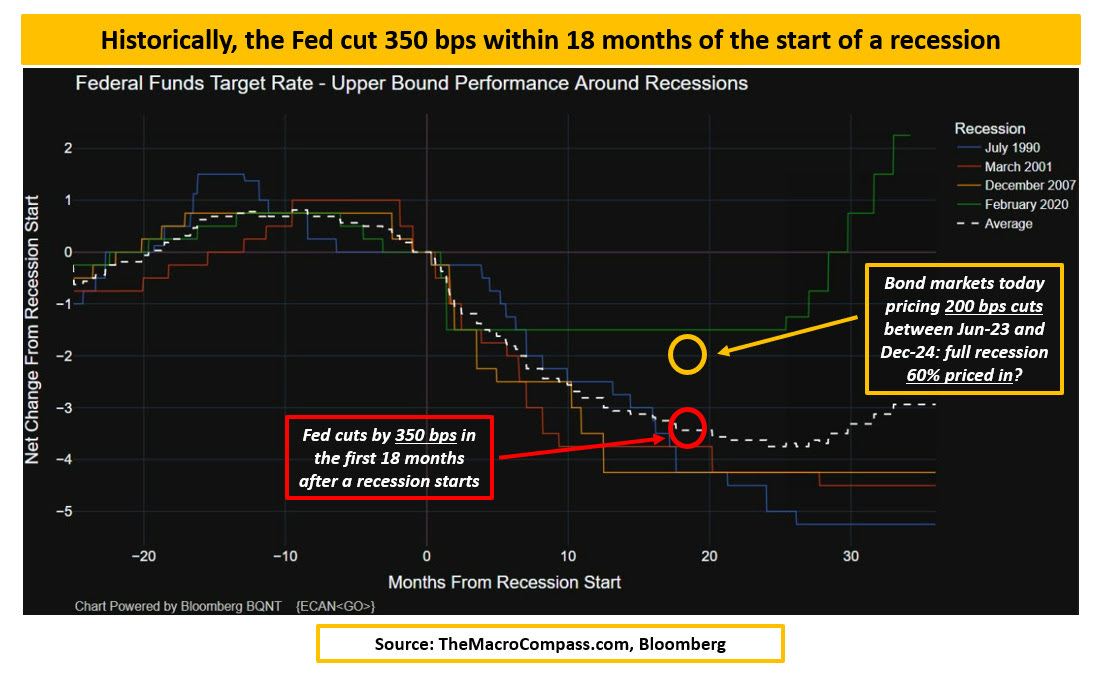
To elaborate, the data shows the Fed cut by about 350 basis points or so within 18 months of the start of a recession, Peccatiello said. Now, the markets are pricing a mid-2023 pivot with about 200 basis points of cuts between 2023 and 2024.
Graphic: Retrieved from Nasdaq Inc (NASDAQ: NDAQ).
“That must mean the bond market’s base case (60%) is a recession,” Peccatiello said, noting that the Fed Funds is not pricing “below reasonable estimates of neutral rate (2.25-2.75% in nominal terms)” in the next 2-5 years. That means this would be the first time ever the US is in a recession and the Fed doesn’t cut rates below neutral.”
And, though downside earnings revisions are happening, the “2023 EPS consensus at $225 implies a +4% earnings growth this year [while] in [past] recessionary episodes the average EPS decline is instead -30%.”
“[C]yclical sectors and countries are outperforming defensive,” and there is little fear and desire to protect against far-reaching weakness. “Protection in the S&P 500 is at the cheapest levels in 2 years” as evidenced by “the implied volatility in 20% out-of-the-money SPX puts … trading in the lowest” percentiles.
But, as Karsan implied in his recent appearance, there’s a disconnect. The economy is not the stock market, and the liquidity context is poor, which many may not recognize.
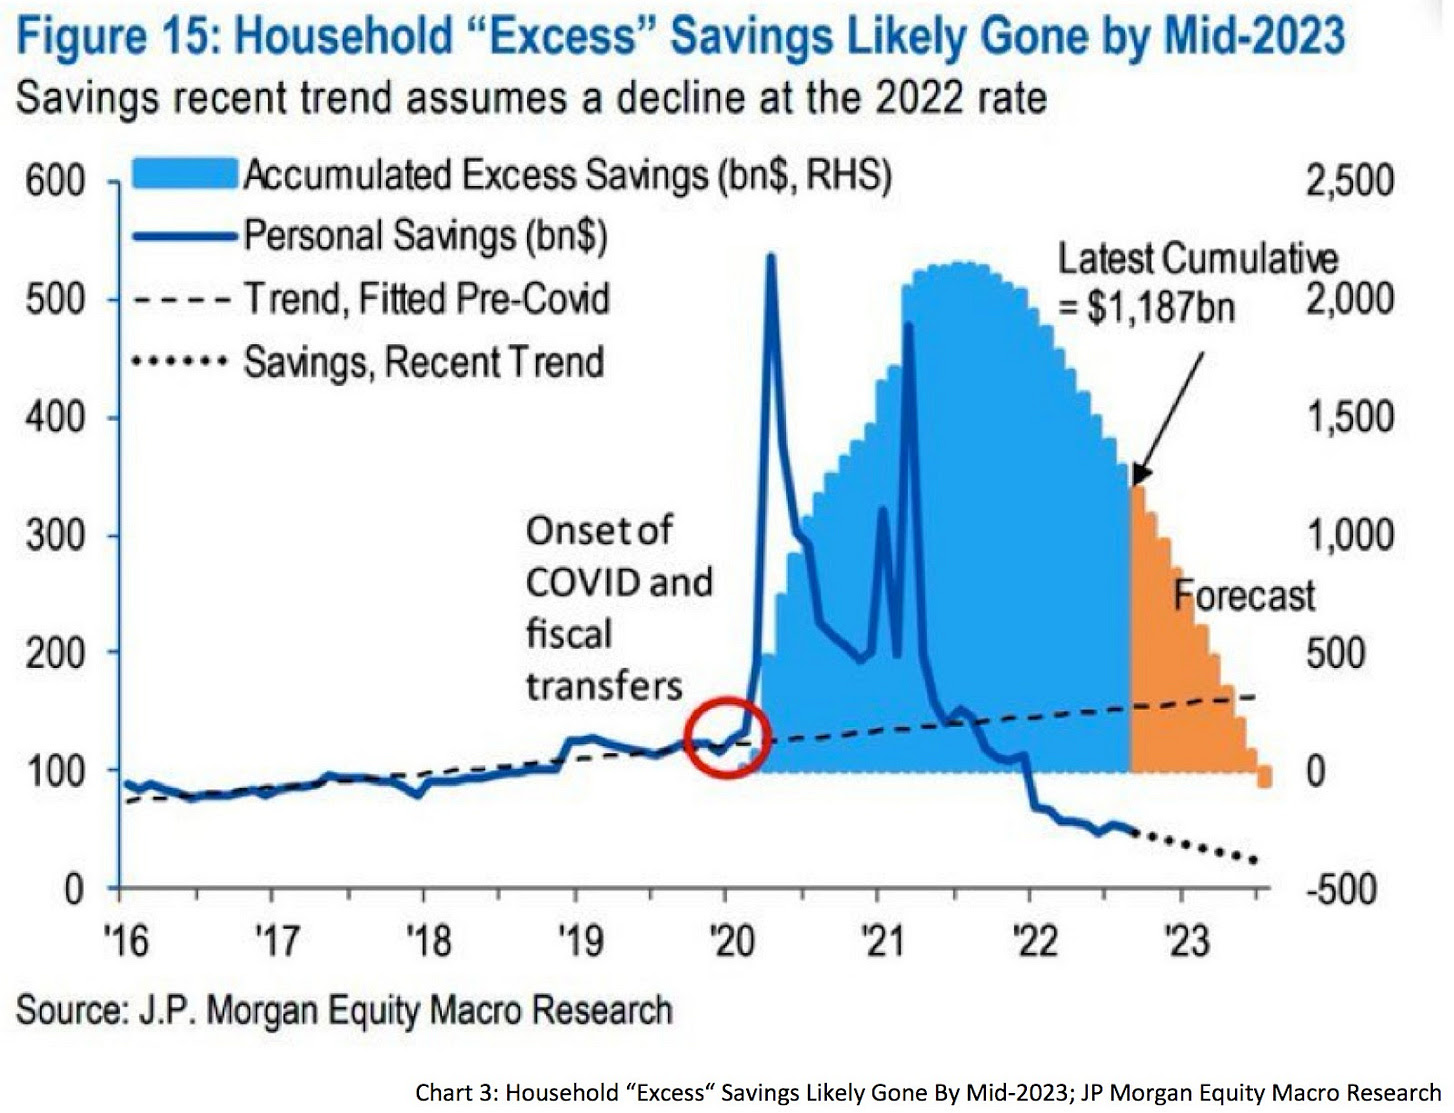
The economy performing well due to China reopening and strong demand among businesses surveyed, consumers’ savings excesses, persistent credit boom, and a strong labor market suggest inflation lasts longer.
Consequently, interest rates remain higher for longer and quantitative tightening is likely to persist. This is not so good for the financial economy.
Graphic: Retrieved from JPMorgan Chase & Co (NYSE: JPM) via Fabian Wintersberger.
“[B]lindly trusting the bond market could end badly,” Fabian Wintersberger added, noting that “recent bear market rallies in stocks and bonds will reverse” eventually.
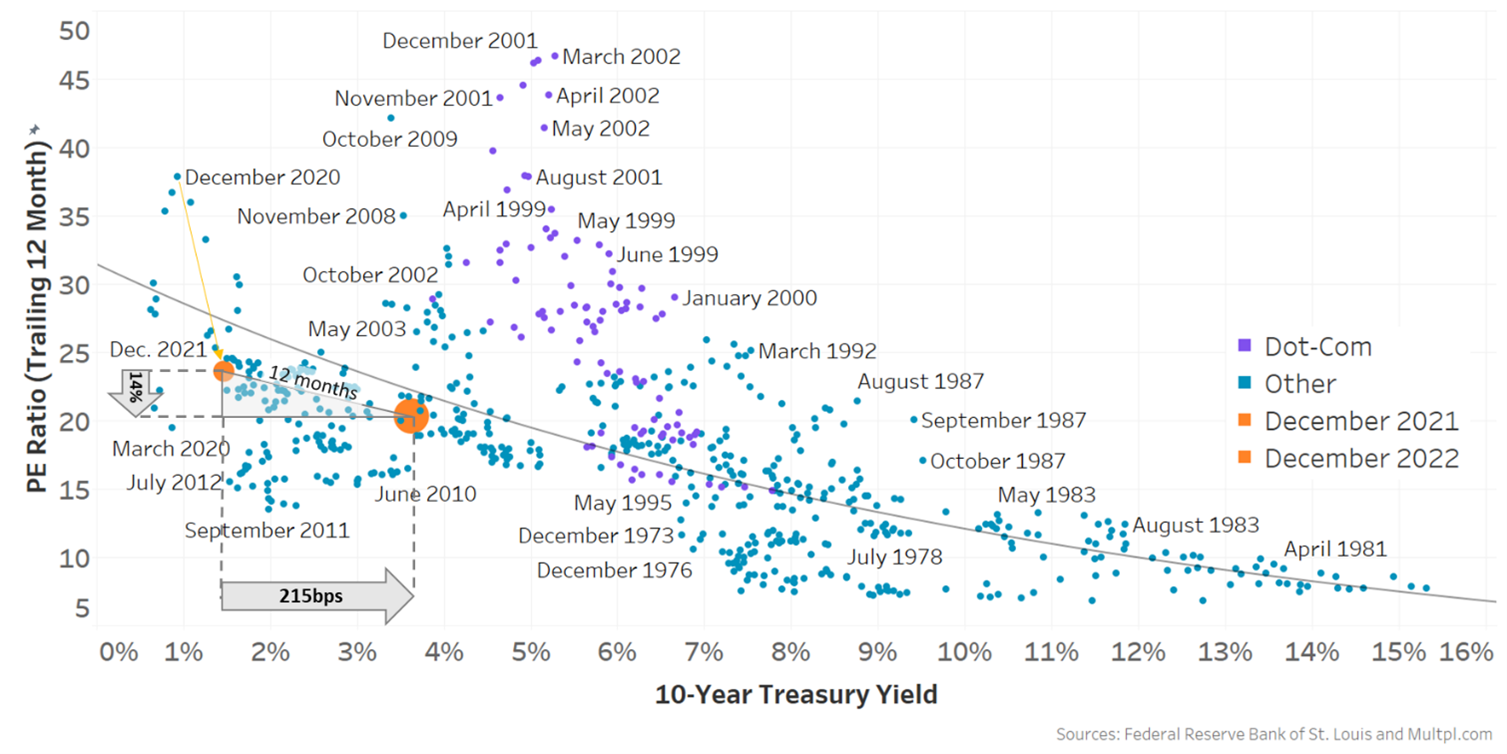
Karsan appears to agree: though green shoots are likely to push better than expected economic performance, the Fed “is in a box” and this rally likely ends in early spring.
Graphic: Retrieved from Nasdaq Inc (NASDAQ: NDAQ). Note that “[h]igher rates act as a headwind for valuations – prices should fall if earnings don’t change [and] increased earnings make PEs (valuations) fall and make stocks look more attractive.” Currently, “the market is currently pricing in a year where rates and earnings don’t change much … inflation could stay elevated [with China reopening and supply chain re-shoring] which means rates should too.”
For now, the break of the 200-day moving average is a significant impetus since it’s a level many watch (i.e., technicals matter if enough people look at them). The chase is manifesting an SPX up, Cboe Volatility Index (INDEX: VIX) up dynamic (i.e., those who fear they may miss a rally bid volatility while the underlying market trades higher).
The Daily Brief for January 13 said “the more depressed technology names to the upside for debits [looked] attractive.”
Accordingly, Tesla Call Ratio Spreads have performed really well.
The 1/2 BACKRATIO TSLA 100 17 FEB 23 160/180 CALL is pricing in excess of a $1.00 credit to close, up about 400% in the span of 14 days or so.
A push likely lasts until mid-February, after which a window for weakness may open, particularly with the liquidity context (see the below video) no longer as supportive. However, if the market consolidates for a period after, this would be bullish.
To end, the median projection puts the S&P 500 at a level above $4,000.00 by year-end with the worst estimate putting the index at $3,000.00.
Joseph Wang explained, also, that there is an “increasing probability of a second bout of inflation, an issue in the 1970s that the Fed is keen to avoid … [by] retighten[ing] financial conditions … through its balance sheet” with an extended quantitative tightening or QT maintained “even if policy rates are cut.”
Given that QT is the flow of capital out of capital markets, this context presents more pressure on the financial economy (not necessarily the real economy).
Technical
As of 6:55 AM ET, Tuesday’s regular session (9:30 AM – 4:00 PM ET), in the S&P 500, is likely to open in the bottom part of a negatively skewed overnight inventory, inside of prior-range and -value, suggesting a limited potential for immediate directional opportunity.
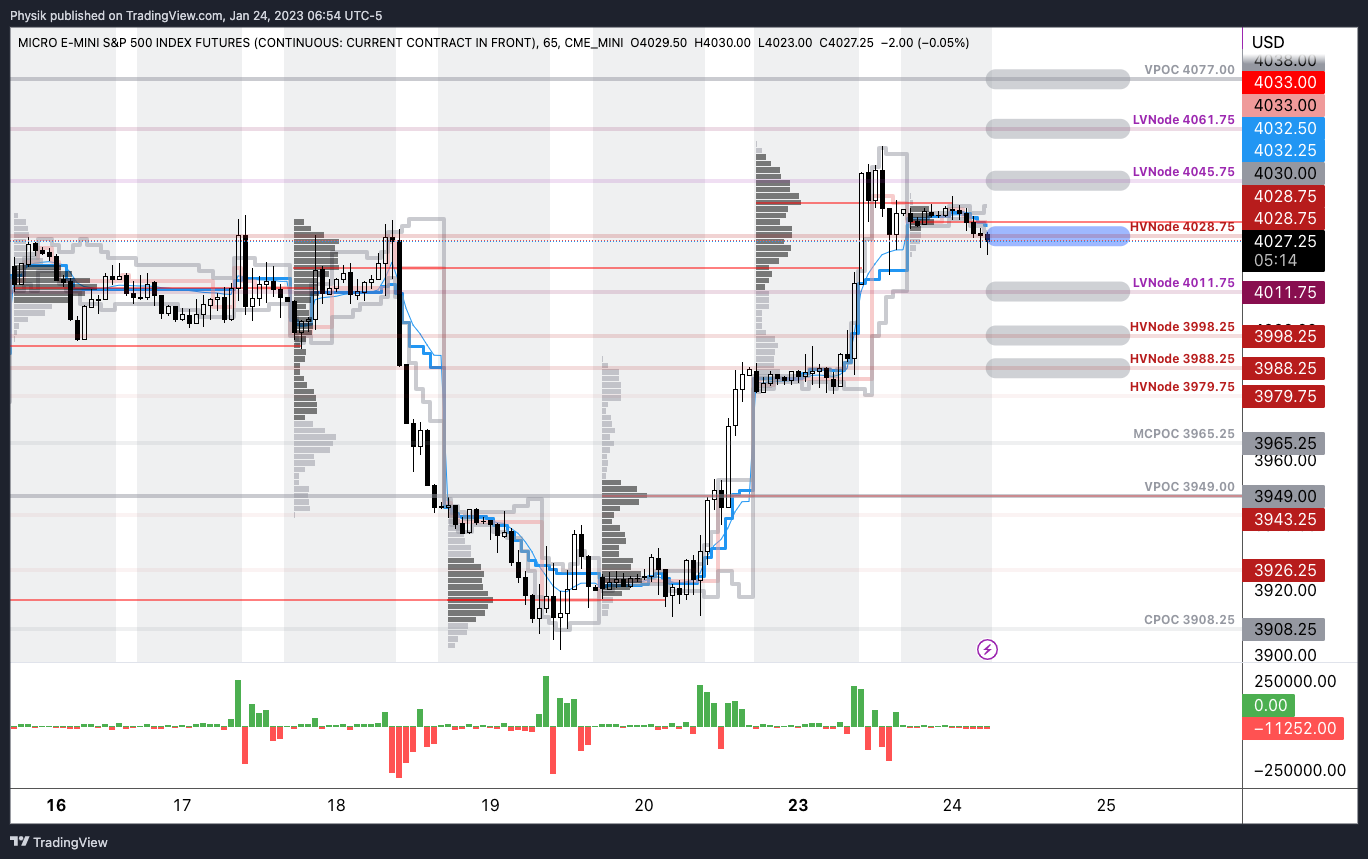
Our S&P 500 pivot for today is $4,028.75.
Key levels to the upside include $4,045.75, $4,061.75, and $4,077.00.
Key levels to the downside include $4,011.75, $3,998.25, and $3,988.25.
Click here to load updated key levels into the web-based TradingView platform. All levels are derived using the 65-minute timeframe. New links are produced, daily.
Graphic: 65-minute profile chart of the Micro E-mini S&P 500 Futures.
Definitions
Volume Areas: Markets will build on areas of high-volume (HVNodes). Should the market trend for long periods of time, it will be identified by low-volume areas (LVNodes). LVNodes denote directional conviction and ought to offer support on any test.
If participants auction and find acceptance in an area of a prior LVNode, then future discovery ought to be volatile and quick as participants look to HVNodes for favorable entry or exit.
Vanna: The rate at which the delta of an option changes with respect to implied volatility.
Charm: The rate at which the delta of an option changes with respect to time.
POCs: Denote areas where two-sided trade was most prevalent in a prior day session. Participants will respond to future tests of value as they offer favorable entry and exit.
Options: Options offer an efficient way to gain directional exposure.
If an option buyer was short (long) stock, he or she could buy a call (put) to hedge upside (downside) exposure. Additionally, one can spread, or buy (+) and sell (-) options together, strategically.
Commonly discussed spreads include credit, debit, ratio, back, and calendar.
Credit: Sell -1 option closer to the money. Buy +1 option farther out of the money.
Debit: Buy +1 option closer to the money. Sell -1 option farther out of the money.
Ratio: Buy +1 option closer to the money. Sell -2 options farther out of the money.
Back: Sell -1 option closer to the money. Buy +2 options farther out of the money.
Calendar: Sell -1 option. Buy +1 option farther out in time, at the same strike.
In the most basic way, if bullish (bearish), sell at-the-money put (call) credit spread and/or buy a call (put) debit/ratio spread structured around target price. Alternatively, if the expected directional move is great (small), opt for a back spread (calendar spread). Also, if credit spread, seek to capture 50-75% of the premium collected. If debit spread, seek to capture 2-300% of the premium paid.
Be cognizant of risk exposure.
Negative (positive) Delta = synthetic short (long).
Negative (positive) Gamma = movement hurts (helps)
Negative (positive) Theta = time decay hurts (helps).
In short, Renato Leonard Capelj is an economics graduate working in finance and journalism.
Capelj spends most of his time as the founder of Physik Invest through which he invests and publishes daily analyses to subscribers, some of whom represent well-known institutions.
Separately, Capelj is an equity options analyst at SpotGamma and an accredited journalist interviewing global leaders in business, government, and finance.
Physik Invest’s Daily Brief is read by thousands of subscribers. You, too, can join this community to learn about the fundamental and technical drivers of markets.
Graphic updated 7:20 AM ET. Sentiment Neutral if expected /ES open is inside of the prior day’s range. /ES levels are derived from the profile graphic at the bottom of this letter. Levels may have changed since initially quoted; click here for the latest levels. SqueezeMetrics Dark Pool Index (DIX) and Gamma (GEX) with the latter calculated based on where the prior day’s reading falls with respect to the MAX and MIN of all occurrences available. A higher DIX is bullish. At the same time, the lower the GEX, the more (expected) volatility. Click to learn the implications of volatility, direction, and moneyness. Breadth reflects a reading of the prior day’s NYSE Advance/Decline indicator. VIX reflects a current reading of the CBOE Volatility Index (INDEX: VIX) from 0-100.
Administrative
For the first time in a while, I am able to catch up to and focus more on active trading, hence the earlier letter, today. What a crazy past few months. Almost back to normal!
We will issue a content calendar, soon, revealing the dates letters are likely to be published and the content that may be covered.
That said, due to the writer’s travel commitments, from 12/6 to 12/9 and 12/12 to 12/16 there will be no commentaries. If any queries, or if you are local to New York City or Paris, ping renato@physikinvest.com or Renato Capelj#8625 on Discord.
Fundamental
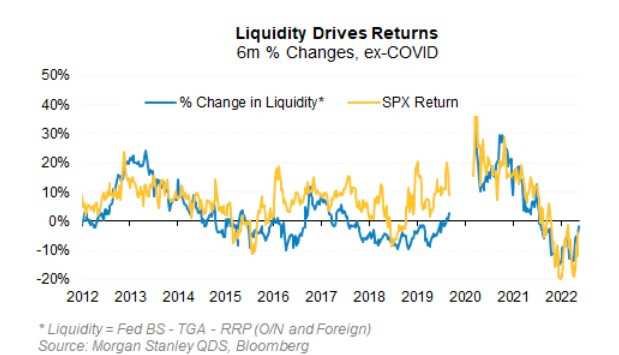
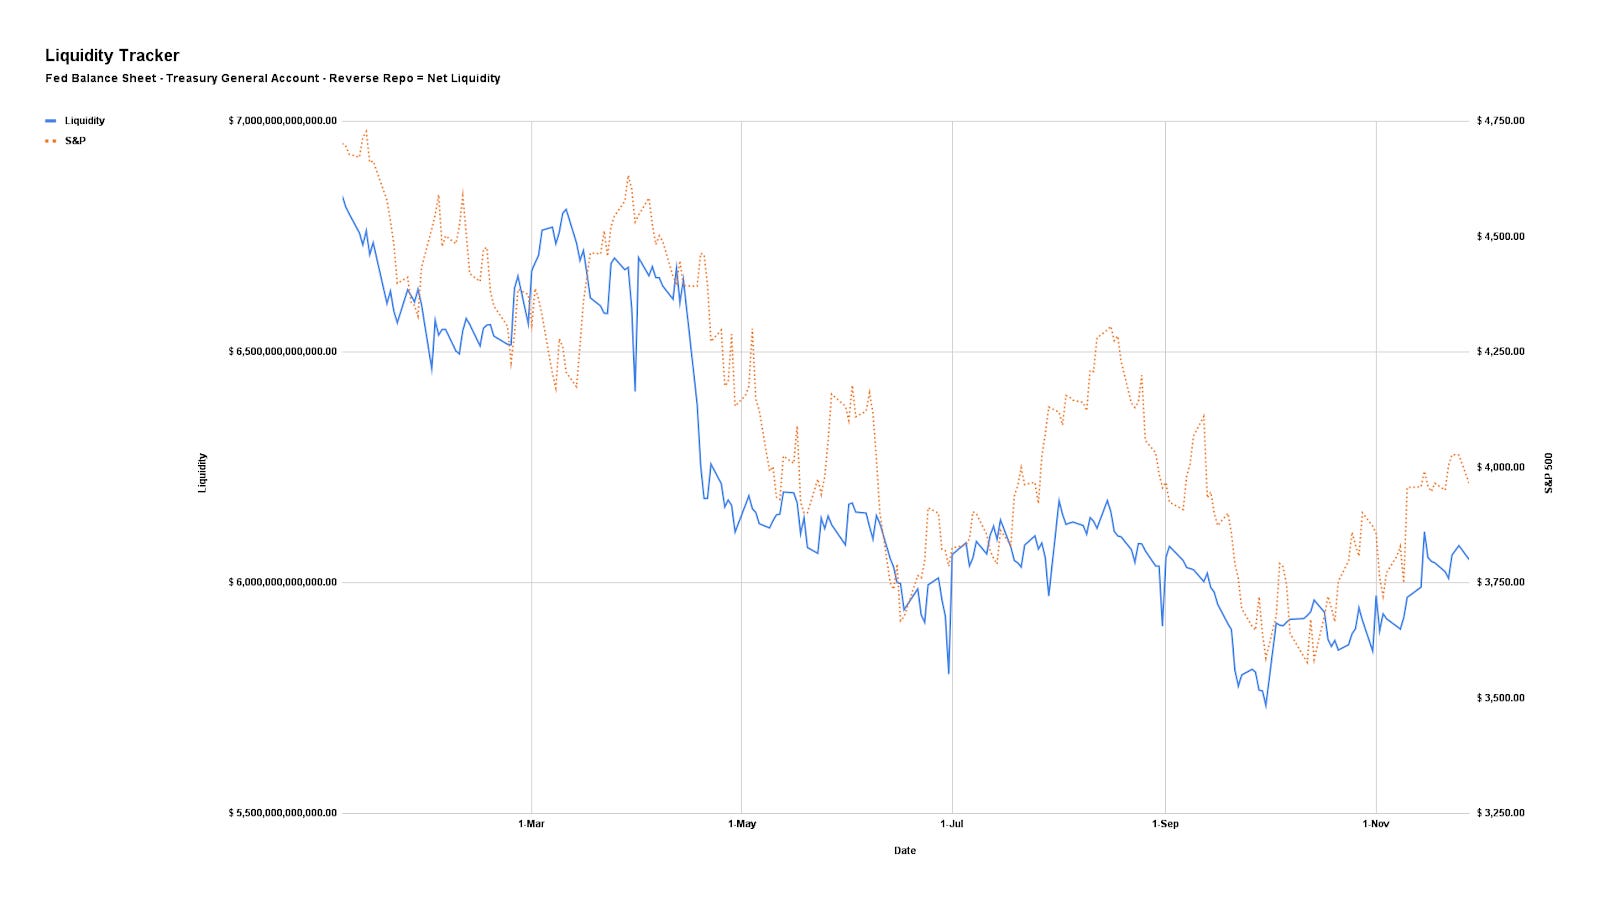
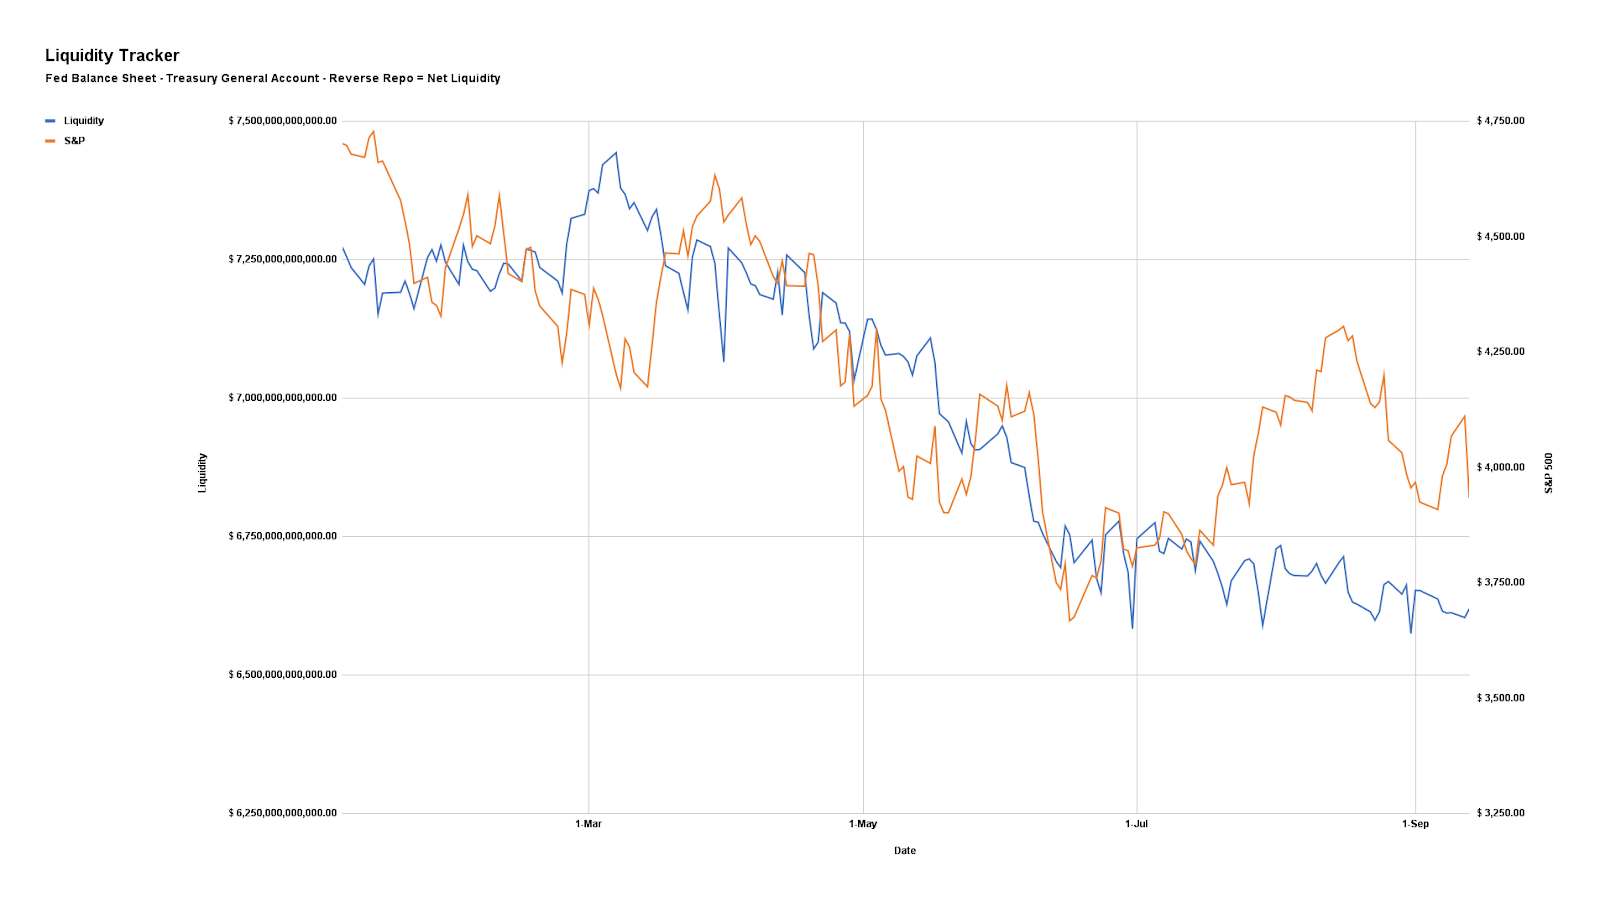
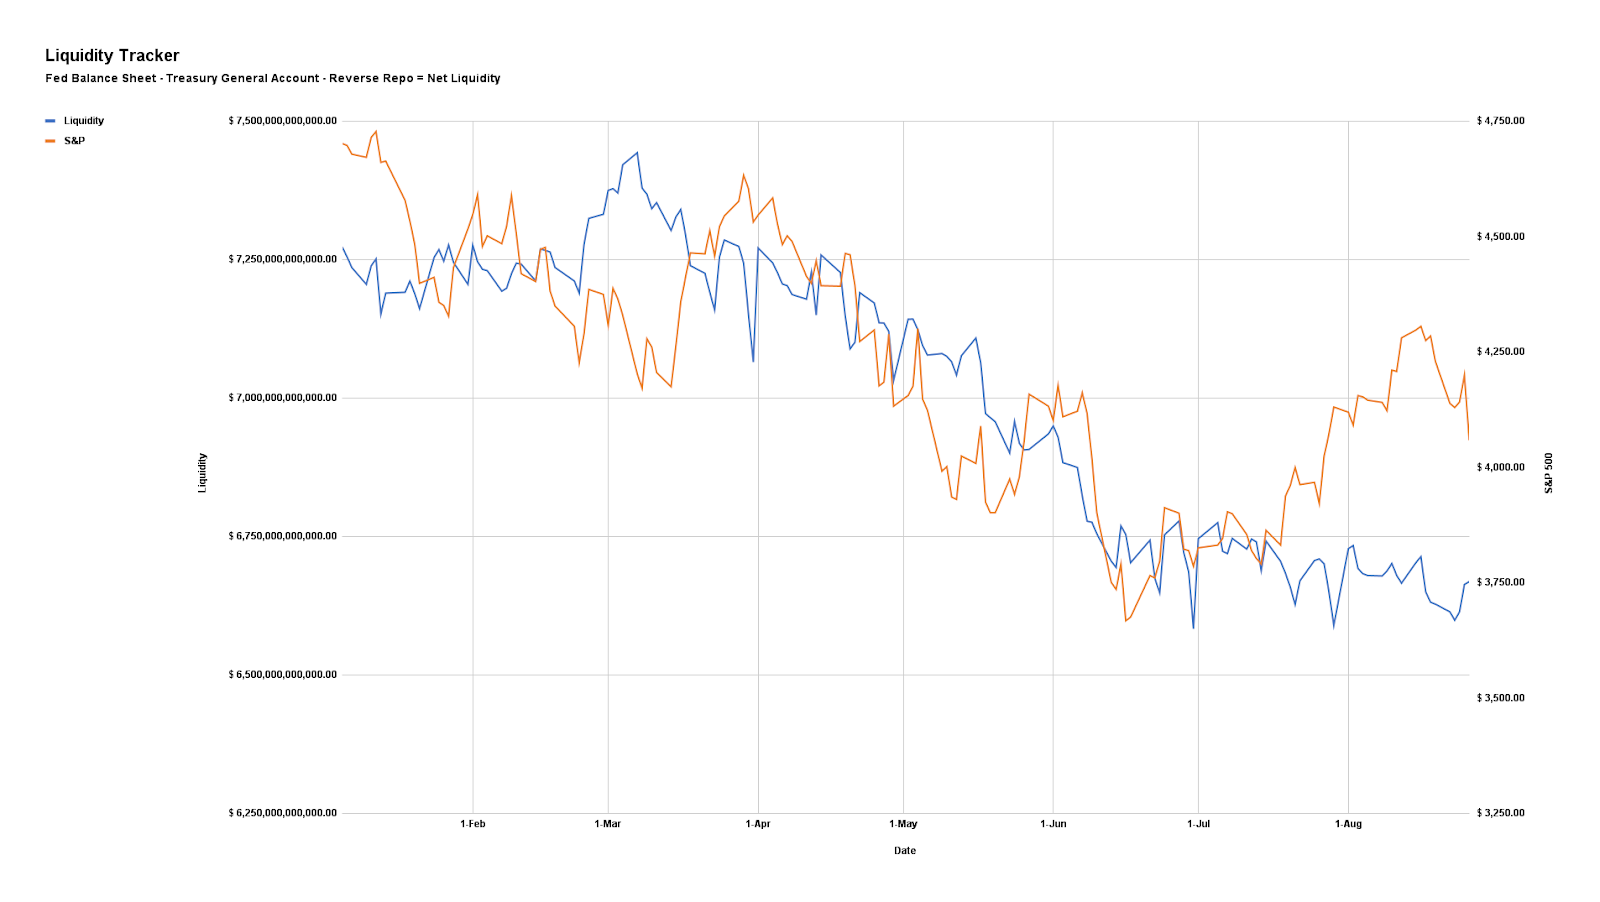
In many ways, the opposite of what happened to bolster a rally across risk assets like equities and crypto is happening, now. As unpacked in detail across letters including our Daily Brief for October 5, 2022, liquidity measures are in a near-lockstep fall with the S&P 500 (INDEX: SPX).
The correlation between so-called net liquidity described further below, and the S&P 500, over the past ten years is about 0.70 and explains more than half of the movement in price-earings multiples over the past decade.
Detailed in previous letters was how processes like quantitative tightening manifest themselves as less demand for assets; per Fabian Wintersberger, central bankers must “recycle bonds into the markets on an unprecedented scale, which could easily lead to lower bond prices/higher yields” causing a “reflux of capital to safe-haven assets, like treasuries.”
Adding, “the Fed has [only] reduced its holdings by 1.5% by letting bonds mature on its balance sheet. If they want to reduce the balance sheet back to the level of 2020, it needs to reduce it by 41%; … [therefore], [i]f history is any guide, the stock market has yet to face its most significant problems in such a scenario.”
Morgan Stanley’s (NYSE: MS) trading team agrees, per a recent Bloomberg article on a looming bear case for the S&P 500.
Though “rate increases get all the blame for this year’s bear market” and a projected “slowdown in the pace of rate hikes” helping “equities emerge from the yearlong bear, … the S&P 500 will drop as much as 15% by March, based on historic patterns and projected money flows,” which major inputs include “changes in the Fed’s balance sheet (BS); the Treasury General Account (TGA), or Treasury cash held at the central bank; and Reverse Repo Facilities (RRP), or cash parked at the Fed by money market funds and others.”
Graphic: Retrieved from Bloomberg. Inflation increases are easing.
In other words, net liquidity is the Fed’s BS less TGA and RRP. See the below graphic.
Accordingly, “a rise in Fed’s balance sheet means an expansion in liquidity that bodes well for stocks, while an increase in TGA or RRP suggests a contraction in liquidity.”
Based on the QT pace ($95 billion per month) and forecasts the Treasury cash balance will “rise by $200 billion into yearend, … [amounting] to a squeezing of liquidity that alone implies an 8% drop for the S&P 500 by the end of December.”
Graphic: Via Physik Invest. Data compiled by @jkonopas623. Fed Balance Sheet data, here. Treasury General Account Data, here. Reverse Repo data, here. NL = BS – TGA – RRP.
In summary, “there’s no longer enough money to finance [the] production of those goods and to support a stock market that’s still far from cheap.”
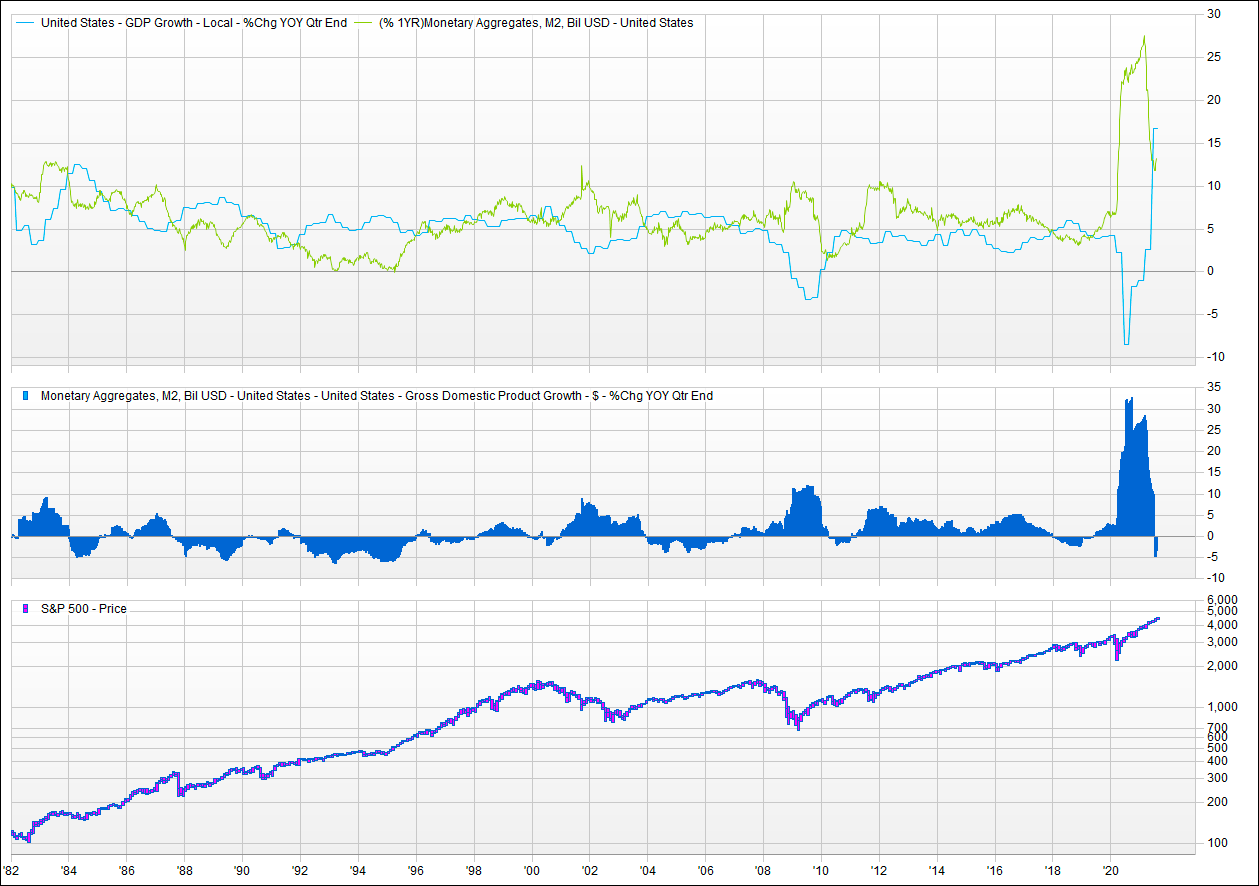
Graphic: Retrieved from VettaFi. “If the supply of money (in aggregate, M2) is higher than the demand for money (represented by nominal GDP), then there is “excess” liquidity that can and will find its way into asset prices. Furthermore, if the growth of money supply exceeds the growth of GDP, that excess liquidity builds, and there is more of it to find its way into more asset prices. In theory, the inverse would also hold true. If the growth of GDP exceeds the growth of money supply, then excess liquidity is being consumed by the demand for money. In this scenario, the real economy is feeding on liquidity that was once flowing into asset prices.”
Positioning
As we said earlier this week (November 29, 2022, and November 28, 2022), it’s not a terrible time to hedge, and selling volatility, blindly, on either side of the market, is not a great trade.
As SpotGamma put well, yesterday, implied volatility (IVOL) is at a low meaning “it makes sense to buy volatility and put on trades that make money if the market moves” but leverage the skew to sell “options to cut down the cost of waiting for that movement to happen.”
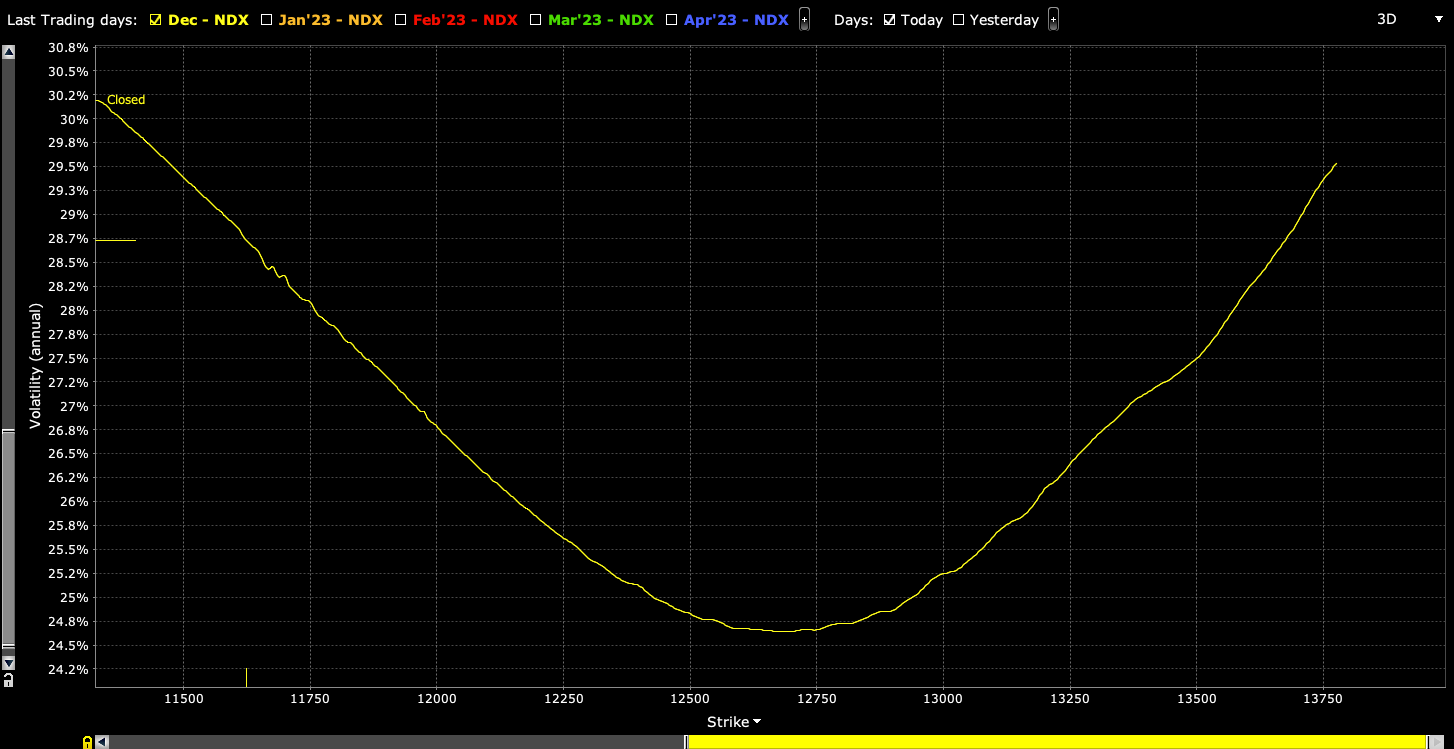
In our letter, yesterday, we highlighted Nasdaq 100 (INDEX: NDX) volatility skew and showed it was smile-shaped, rather than the typical smirk-shaped reverse pattern, making for some great trades to the upside. Through steeper call volatility skew – a result of traders positioning for an upside move – we can use the richness of further away calls to reduce the cost of our bets on the market upside.
Graphic: Updated 11/28/2022. Retrieved from Interactive Brokers (NASDAQ: IBKR). Nasdaq 100 (INDEX: NDX) volatility skew resembles the so-called smile.
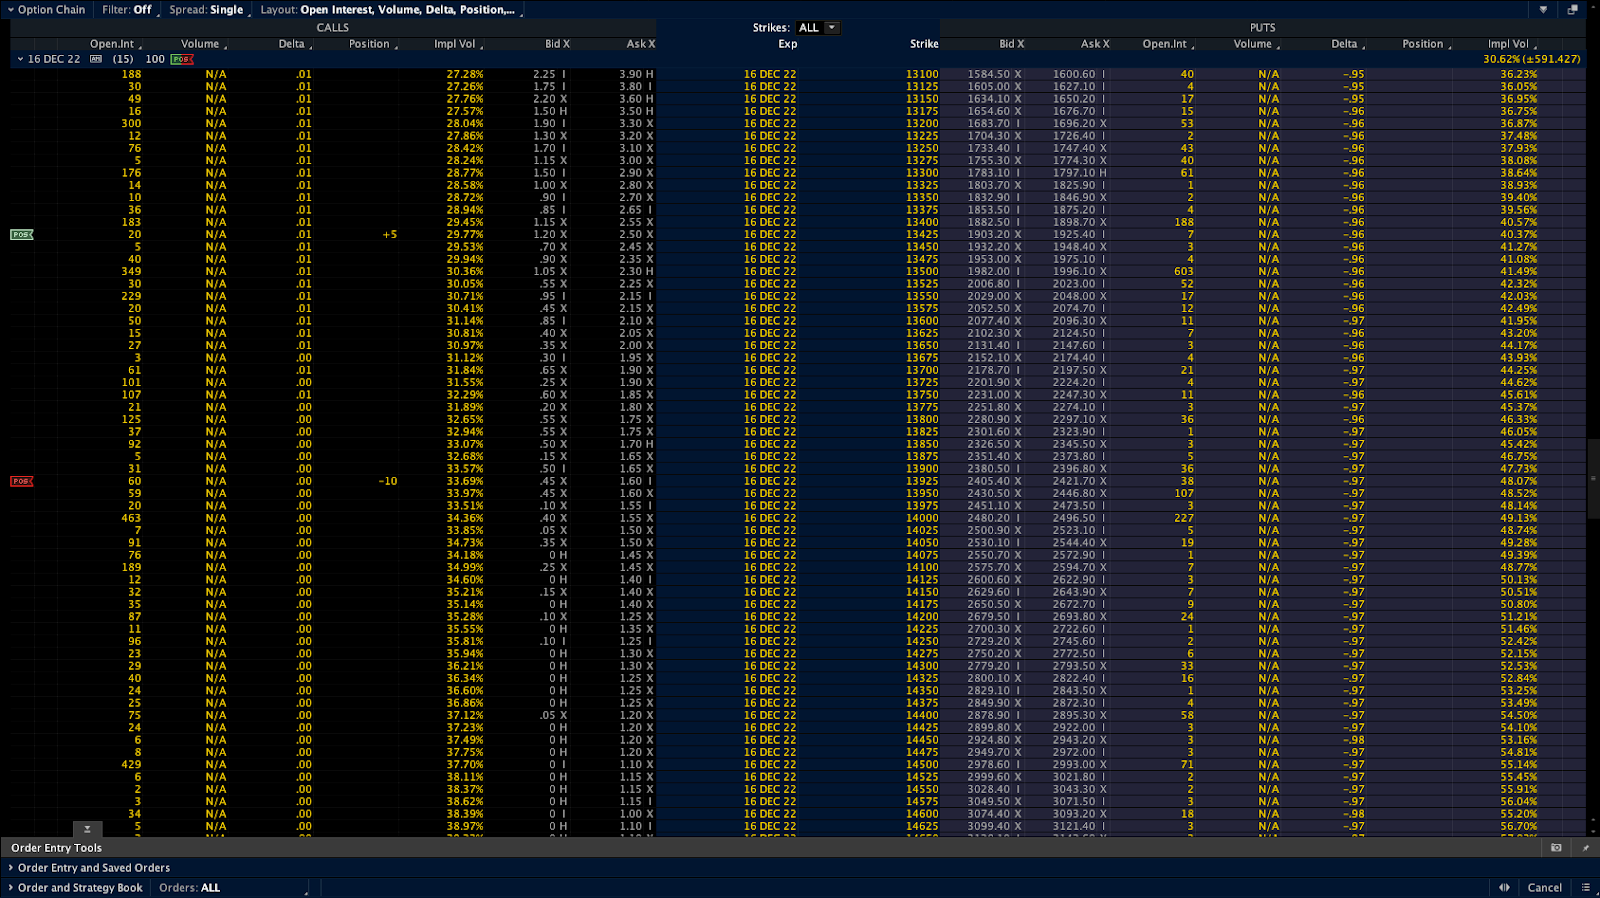
For instance, low-cost 500-1000 points wide call ratio spreads (buy the closer leg, sell two of the farther legs) expiring in fifteen days may work well (e.g., SELL -1 1/2 BACKRATIO NDX 100 16 DEC 22 [AM] 13425/13925 CALL @.20 CR LMT). The immediate concern with these strategies is your exposure to Delta (i.e., direction) and Gamma (i.e., does movement make you money).
Graphic: Retrieved from the Charles Schwab Corporation-owned (NYSE: SCHW) thinkorswim platform. Nasdaq 100 options prices.
If you are exposed to +Delta and +Gamma, your trade makes money in an increasing way as the market rises, barring any other changes (e.g., passage of time, increases in volatility, etc).
If you are exposed to -Delta and -Gamma, your trade loses money in an increasing way as the market rises, barring any other changes. Should the movement happen quickly, and volatility rise, which is not likely, then that worsens the situation.
This is not advice but a framework for how to act on the theory we talk about on a daily basis. In short, don’t sell calls and puts blindly. Adding, the above trade may not provide safe exposure to the market upside or downside. Given the sideways trade and contraction in ranges, we aim to be well-positioned for a move from low to high volatility. Stay safe and watch your risk.
Noting, should you sell IVOL, the market trade lower, and the demand for IVOL rises, you may be left in an awkward position; big market drops statistically add to the likelihood of more drops.
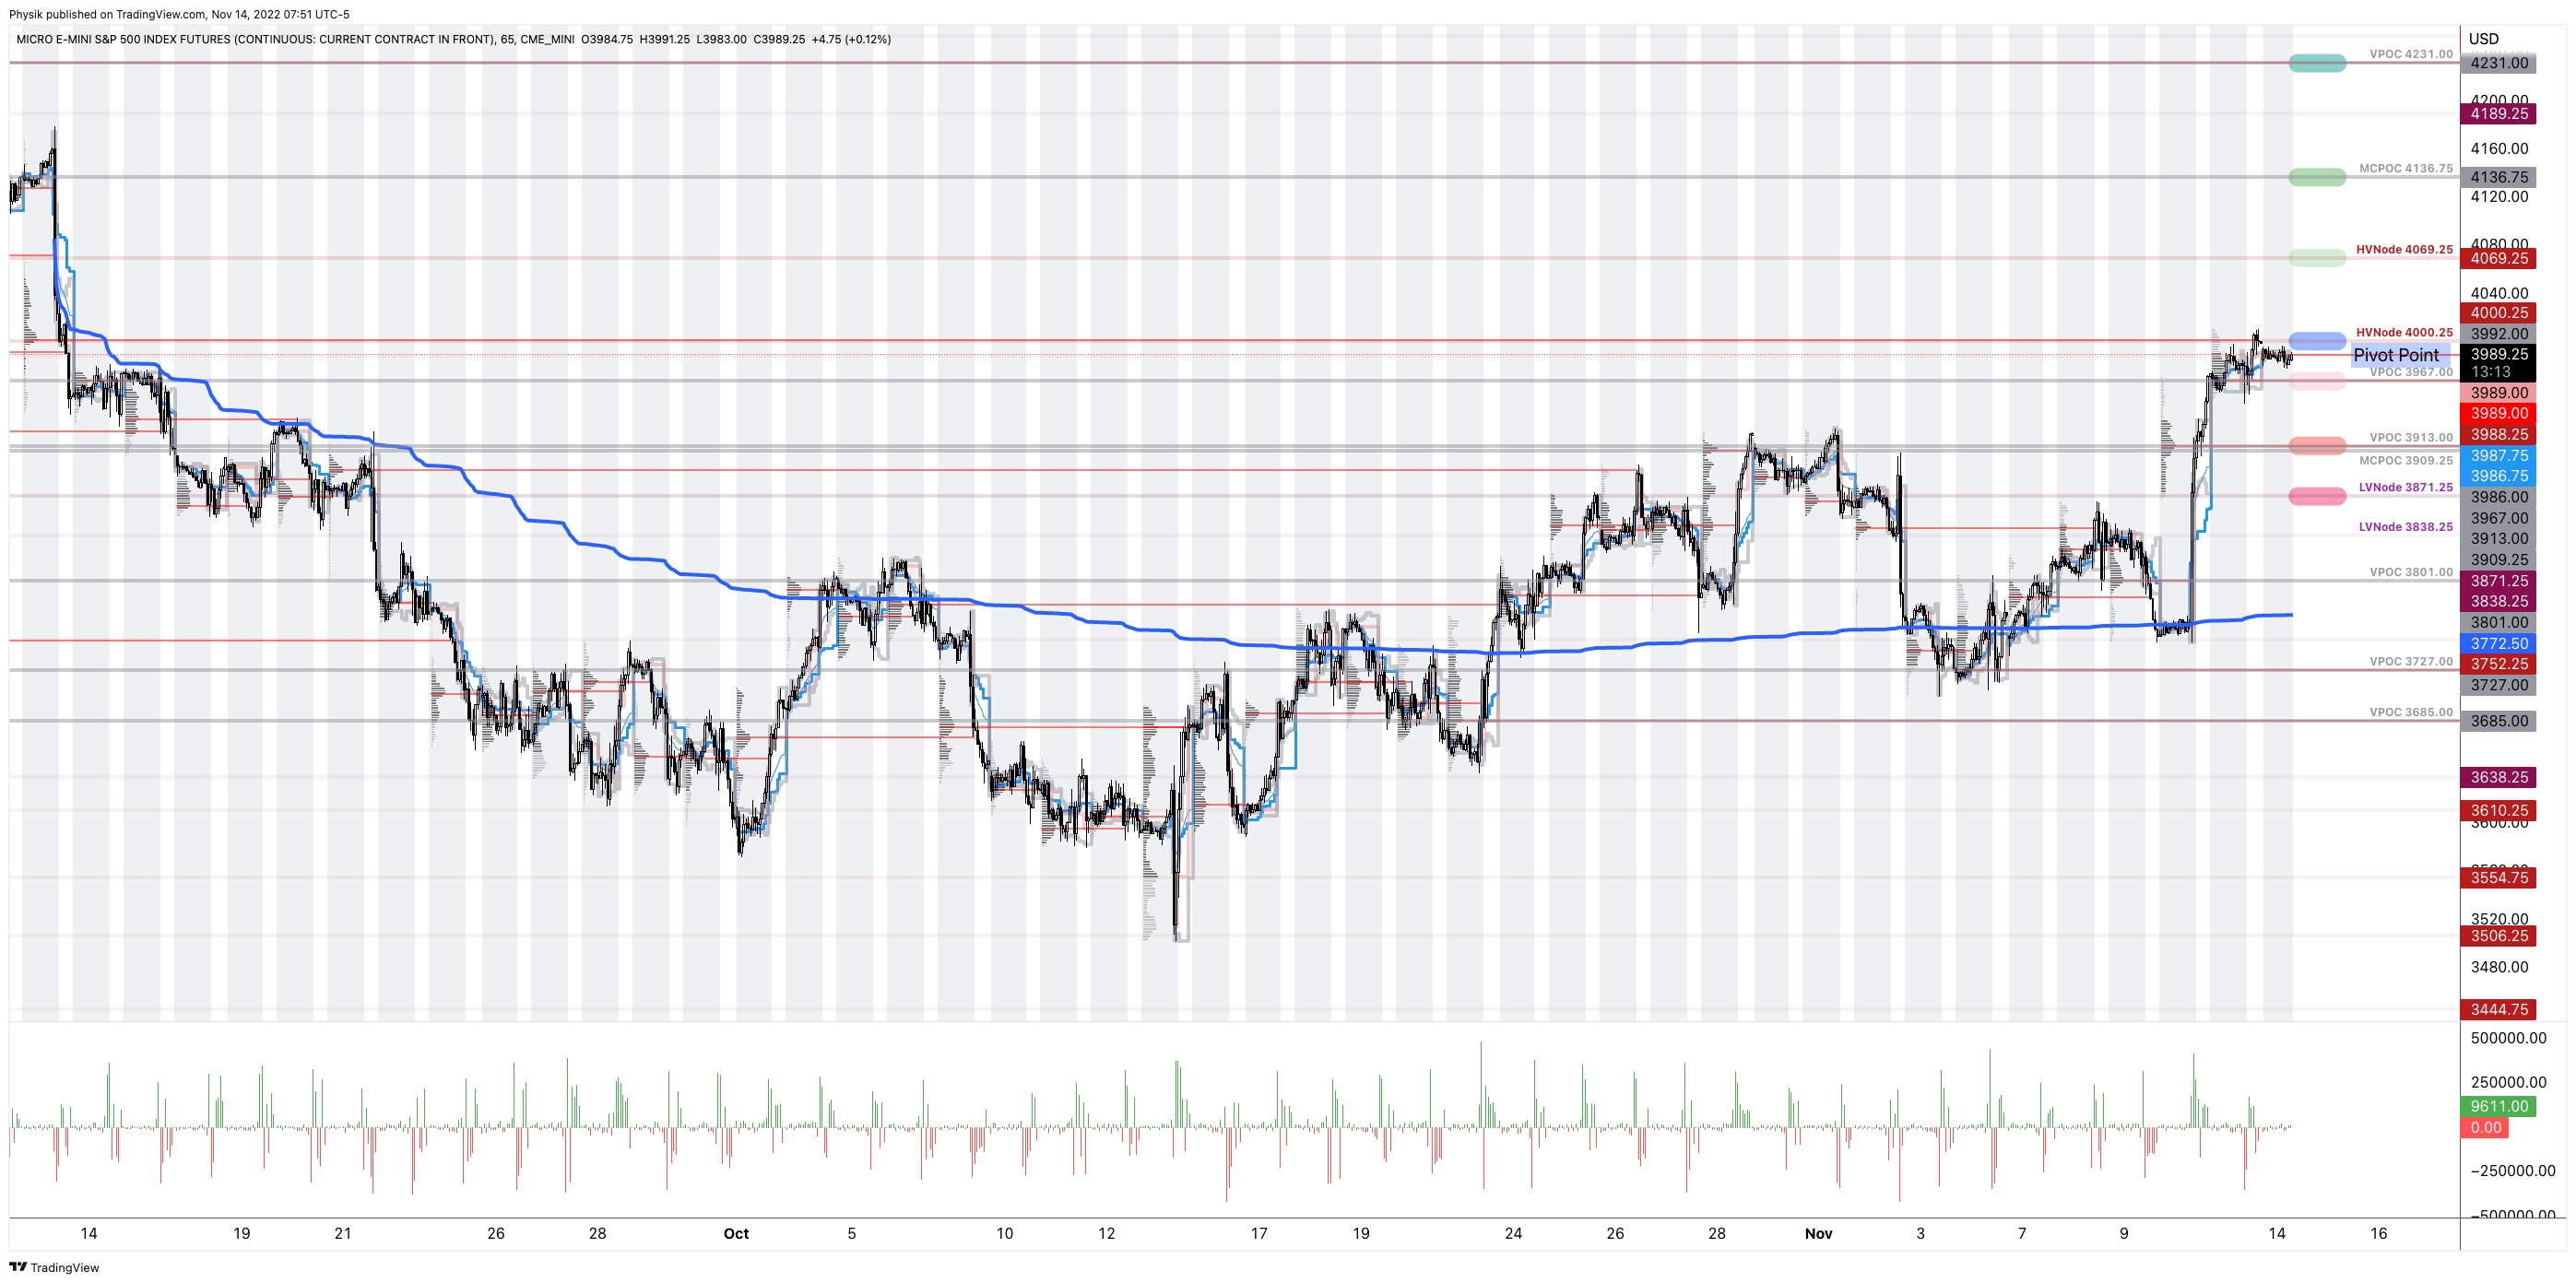
As of 7:15 AM ET, Wednesday’s regular session (9:30 AM – 4:00 PM ET), in the S&P 500, is likely to open in the upper part of a positively skewed overnight inventory, inside of prior-range and -value, suggesting a limited potential for immediate directional opportunity.
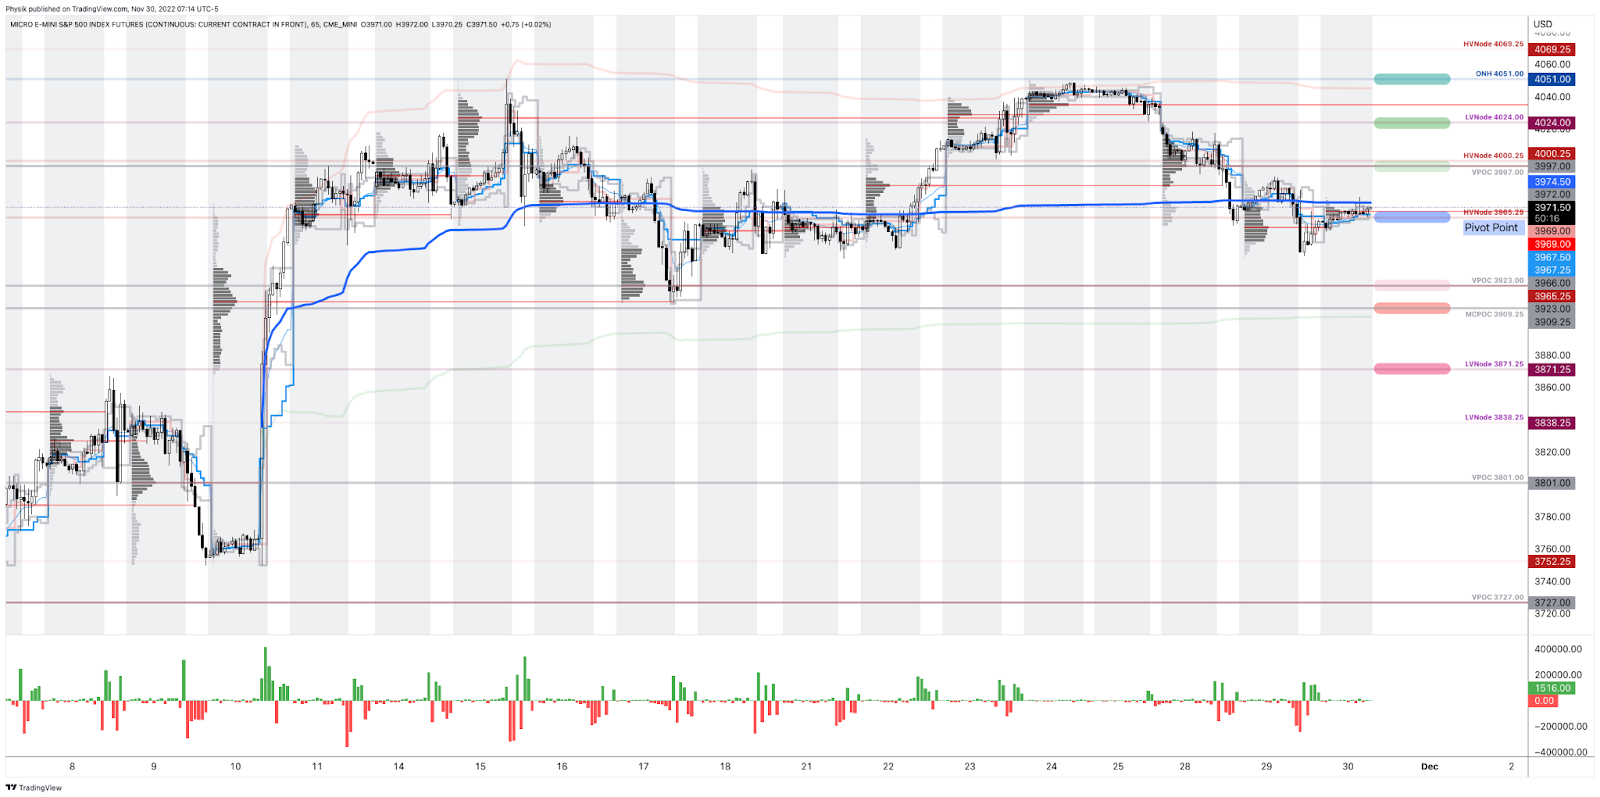
Our S&P 500 pivot for today is $3,965.25.
Key levels to the upside include $3,997.00, $4,024.00, and $4,051.00.
Key levels to the downside include $3,923.00, $3,909.25, and $3,871.25.
Click here to load today’s key levels into the web-based TradingView platform. All levels are derived using the 65-minute timeframe. New links are produced, daily.
Graphic: 65-minute profile chart of the Micro E-mini S&P 500 Futures.
Definitions
Volume Areas: Markets will build on areas of high-volume (HVNodes). Should the market trend for long periods of time, it will be identified by low-volume areas (LVNodes). LVNodes denote directional conviction and ought to offer support on any test.
If participants auction and find acceptance in an area of a prior LVNode, then future discovery ought to be volatile and quick as participants look to HVNodes for favorable entry or exit.
Gamma: The sensitivity of an option’s Delta to changes in the underlying asset’s price.
Volga: The sensitivity of an option’s Vega to changes in the underlying’s implied volatility.
POCs: Denote areas where two-sided trade was most prevalent in a prior day session. Participants will respond to future tests of value as they offer favorable entry and exit.
MCPOCs: Denote areas where two-sided trade was most prevalent over numerous sessions. Participants will respond to future tests of value as they offer favorable entry and exit.
Volume-Weighted Average Prices (VWAPs): A metric highly regarded by chief investment officers, among other participants, for quality of trade. Additionally, liquidity algorithms are benchmarked and programmed to buy and sell around VWAPs.
About
In short, an economics graduate working in finance and journalism.
Capelj spends most of his time as the founder of Physik Invest through which he invests and publishes daily analyses to subscribers, some of whom represent well-known institutions.
Separately, Capelj is an equity options analyst at SpotGamma and an accredited journalist interviewing global leaders in business, government, and finance.
Physik Invest’s Daily Brief is read by over 1,200 people. To join this community and learn about the fundamental and technical drivers of markets, subscribe below.
Graphic updated 9:00 AM ET. Sentiment Risk-On if expected /ES open is above the prior day’s range. /ES levels are derived from the profile graphic at the bottom of this letter. Levels may have changed since initially quoted; click here for the latest levels. SqueezeMetrics Dark Pool Index (DIX) and Gamma (GEX) with the latter calculated based on where the prior day’s reading falls with respect to the MAX and MIN of all occurrences available. A higher DIX is bullish. At the same time, the lower the GEX, the more (expected) volatility. Click to learn the implications of volatility, direction, and moneyness. Breadth reflects a reading of the prior day’s NYSE Advance/Decline indicator. VIX reflects a current reading of the CBOE Volatility Index (INDEX: VIX) from 0-100.
Fundamental
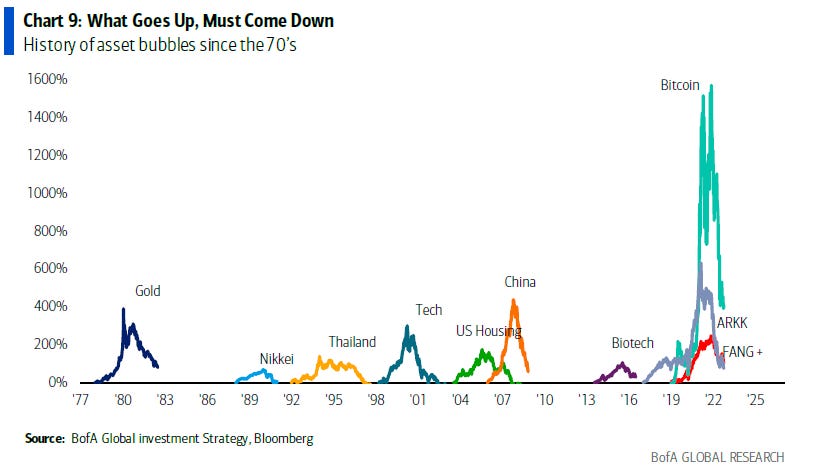
S&P Global Inc (NYSE: SPGI) put it really well in a recent update comparing today to the events of the mid-to-late 1630s. Dutch tulip bulbs traded as high as $750,000 per bulb (today’s money) before collapsing to near-zero.
That’s akin to what happened with the non-fungible token (NFT) craze of the late 2010s and early 2020s. Pictures of rocks sold for millions as recently as last year. Those pictures are worthless, now, and this has done a bit to dent the ecosystem’s apparent value, as well.
Graphic: Retrieved from Bank of America Corporation (NYSE: BAC) via @LanceRoberts.
What’s going on to cause this:
It’s basically the case that easy money policies enabled market participants to borrow and fund longer-duration bets on ideas with (potential) promise in the future.
Financial asset investments, too, were far more attractive, and that’s why we saw the asset inflation accelerate, followed by goods and services inflation that was bolstered by chokepoints and trends (e.g., deglobalization via supply chain security and geopolitics) and, ultimately, prompted policymakers to pivot.
i always used to assume the large sophisticated crypto firms were mostly focused on the high risk-adjusted-return relative value arb opportunities in the space: cross exchange arb, cash-futures basis; etc
FTX (CRYPTO: FTT) is among the victims of this pivot. It’s apparent that the events surrounding the collapse of crypto ecosystems months back prompted a so-called “credit crunch,” an insider close to FTX’s leadership explained.
“Many loaners suddenly recalled all of their loans just to see who was still liquid. Alameda lost a lot from giving out loans to firms [that] defaulted. Alameda was now, also, on the hook for money they didn’t have since they had given a lot of the loan money to FTX or had lost it loaning to now bankrupt counterparties. [Founder and CEO Sam Bankman-Fried] had two choices at this point, let Alameda get liquidated or send user money from FTX to ensure Alameda’s survival.”
Apart from “strong governance and transparency [to] grow in importance as the cryptocurrency industry attempts to reassure investors and customers, … regulation of cryptocurrency markets, which was already a matter of serious debate, could accelerate,” SPGI explained, noting that some “other areas of the decentralized finance [or DeFi] market may be affected. And lastly, these contagion effects are unlikely to ripple into traditional finance [or TradFi].”
Check out Reuters (FTX bankruptcy filings in, French central bank wants quick regulation) and The Information (Startups should prepare for ‘second order fallout’ from FTX collapse).
Simplify Asset Management’s Michael W. Green (who we quoted in the past for his perspective and belief that we are in “a dot-com type collapse” that’s happened “underneath the surface of the indices which is [a result of] … passive flows supporting the largest stocks within the index, whereas the smaller stocks can be influenced to a greater extent by [] discretionary managers”) said a likely result is a Central Bank Digital Currency (CBDC) and an “almost certain … change in the monetary system,” echoing what Kai Volatility’s Cem Karsan said a long-time ago: “I don’t see … a clear window where cryptocurrency is not subject to constraints and I think it’s highly likely that we move towards a digital dollar.”
CBDCs are highly controversial per my chats with the likes of Edge & Node’s Tegan Kline. She said they could “be used as a mass surveillance tool. Leaders have done little to invalidate her beliefs given their recent discussions on, for example, using CBDCs to derive “carbon footprint.”
That means having a read on where people are “traveling, how are they traveling, what are they eating, what are they consuming … This is something we’re working on,” leaders have put forth.
The point of this all is as follows:
As many may know, “there’s no ultimate buyer” in spaces like crypto and DeFi, as ex-Goldman Sachs Group Inc (NYSE: GS) emerging market FX and yield trader Seraphim Czecker, who is now heading risk and product management at Euler Labs, said.
It’s that and the persistent interest in illiquid products that leave the door open to manipulation. Barring illiquidity, “if there’s a 10 or 15 standard deviation move, the liquidity will allow for … you [to] offload those assets quickly.”
However, that’s not the widespread case.
“For example, look at what happened in the UK with the pension funds and margin calls. That is a classic DeFi strategy. You take your bonds and borrow cash against them. Then, you put it back into bonds and loop it a couple of times. That way, you have a leveraged interest rate exposure. That’s the same principle of lending staked Ethereum (CRYPTO: ETH), borrowing ETH, and doing it a couple of times.”
So, there may be “second order fallout” amid all this tightening. Markets, everywhere, are to de-rate. Ultimately, there’s probably a pivot to happen, in the future, with many leaders and strategists in finance unable to agree whether that (pivot) is the result of a recession.
Ukraine central bank says it is preparing banking system for blackouts. It is also suddenly clear that Ukraine might have had $ in FTX. They had partnered w FTX on donations. https://t.co/oZSOchz8bI + https://t.co/sDpXGNGuNn
“To take the foot off the brake right now and not finish the job, I think it’s the absolute worst mistake that the Fed could possibly make,” Citadel’s Ken Griffin said at the Bloomberg New Economy Forum in Singapore. In spite of Citadel seeing a recession averted, Griffin said: “I am finding it a bit hard to believe we are not going to have a recessionat that point of time, sometime in the middle to back half of 2023,” adding this year finishes with “modest growth.”
Those in agreement include Stanley Druckenmiller, who once managed George Soros’ funds. “You don’t even need to talk about Black Swans to be worried here. To me, the risk-reward of owning assets doesn’t make a lot of sense,” Druckenmiller said.
“When you make a mistake, you got to admit you’re wrong and move on that nine or 10 months, that [policymakers] just sat there and bought $120 billion in bonds,” he added. The “repercussions of that are going to be with us for a long, long time.”
Positioning
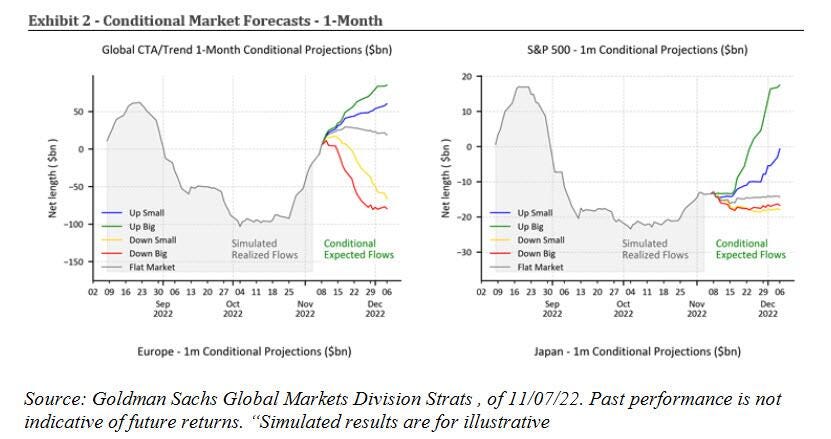
From a positioning perspective, much of what we’ve discussed in past notes is still true. Among others, Goldman Sachs Group Inc calculates up to $40 billion in buying over the next weeks with more than $80 billion of buying in an up market.
Graphic: Retrieved from @LanceRoberts. “Goldman calculates a whopping $38 billion to buy over the next week and substantially more (green line) if the market is up big. The chart below shows that the bank expects more than +$79 billion of net buying over the month.”
This is pursuant to our statements on the compression of implied volatility (evidenced by a shift lower in the term structure, particularly at the front end where options are most sensitive) compounding macro-type repositioning, with follow-on support coming from the reach for “Deltas and leverage” to the upside (call options).
Graphic: Retrieved from Goldman Sachs Group Inc (NYSE: GS).
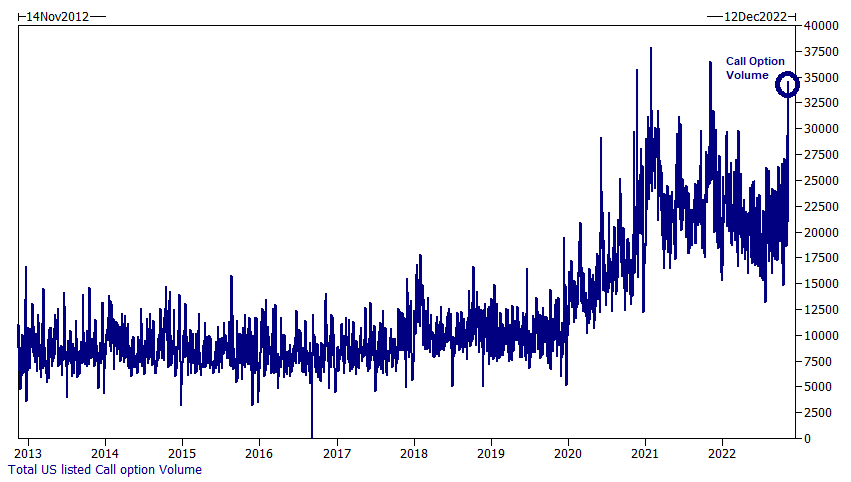
As Alfonso Peccatiello of The Macro Compass puts it well: “incentive schemes drive people to be much more willing to pay and chase upside.”
Preferred are “convex structures” that would benefit from rallies.
However, in traders’ monetization of put protection they owned, as well as reach for upside calls (to not miss out on a potential reversal), skew is at its lows.
Graphic: Retrieved from The Ambrus Group’s Kris Sidial. “2017 is a year that is notorious for extremely low implied and realized vol. It is fascinating to see how insanely low the call-side volatility has been this year. There is low vol and then there is, in the gutter low vol.”
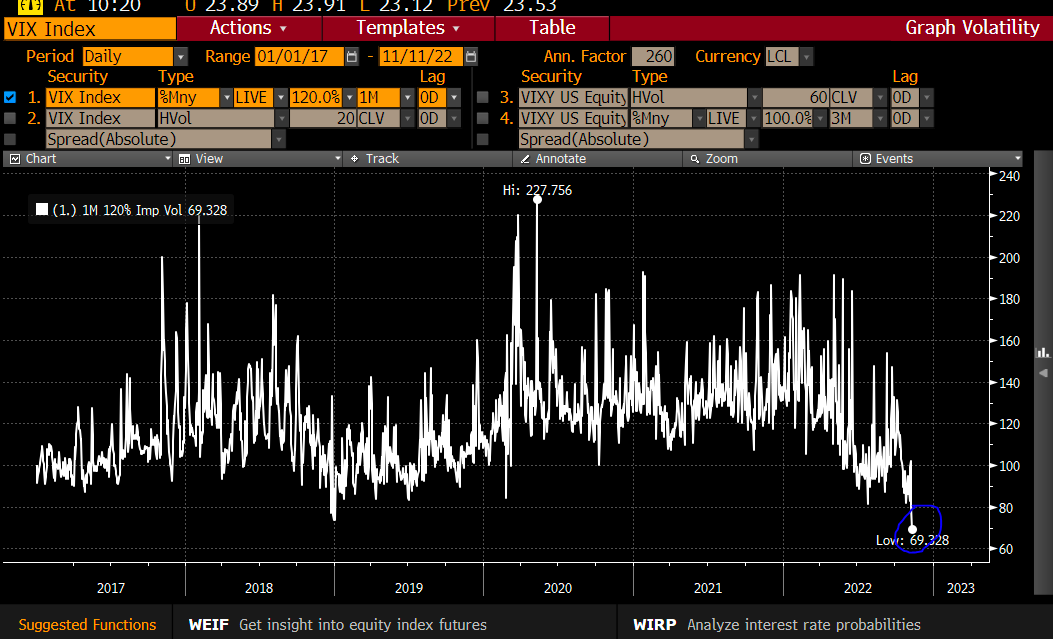
If the assumption is that “further tightening monetary policy and draining liquidity off the market might cause some problems down the road,” per Fabian Wintersberger, downside convexity (bets that trade non-linearly to changes in underlying price and volatility) are attractive.
Graphic: Retrieved from Banco Santander SA (NYSE: SAN).
Trades that may be attractive include collars, as well explained in a recent thread by IPS Strategic Capital’s Pat Hennessy.
“[T]he combination of historically flat skew [and] the highest rates we’ve seen in 15 years makes longer dated collars an attractive trade for those who are worried about the performance of stocks over the next year but do not want to sell or try timing the market.”
Technical
As of 9:00 AM ET, Tuesday’s regular session (9:30 AM – 4:00 PM ET), in the S&P 500, is likely to open in the upper part of a positively skewed overnight inventory, outside of prior-range and -value, suggesting a potential for immediate directional opportunity.
Our S&P 500 pivot for today is $4,000.25.
Key levels to the upside include $4,069.25, $4,136.75, and $4,231.00.
Key levels to the downside include $3,965.25, $3,913.00, and $3,871.25.
Click here to load today’s key levels into the web-based TradingView platform. All levels are derived using the 65-minute timeframe. New links are produced, daily.
Graphic: 65-minute profile chart of the Micro E-mini S&P 500 Futures.
Definitions
Volume Areas: A structurally sound market will build on areas of high volume (HVNodes). Should the market trend for long periods of time, it will lack sound structure, identified as low volume areas (LVNodes). LVNodes denote directional conviction and ought to offer support on any test.
If participants were to auction and find acceptance into areas of prior low volume (LVNodes), then future discovery ought to be volatile and quick as participants look to HVNodes for favorable entry or exit.
POCs: POCs are valuable as they denote areas where two-sided trade was most prevalent in a prior day session. Participants will respond to future tests of value as they offer favorable entry and exit.
MCPOCs: POCs are valuable as they denote areas where two-sided trade was most prevalent over numerous day sessions. Participants will respond to future tests of value as they offer favorable entry and exit.
About
After years of self-education, strategy development, mentorship, and trial-and-error, Renato Leonard Capelj began trading full-time and founded Physik Invest to detail his methods, research, and performance in the markets.
Capelj also develops insights around impactful options market dynamics at SpotGamma and is a Benzinga journalist.
Graphic updated 7:45 AM ET. Sentiment Neutral if expected /ES open is inside of the prior day’s range. /ES levels are derived from the profile graphic at the bottom of the following section. Levels may have changed since initially quoted; click here for the latest levels. SqueezeMetrics Dark Pool Index (DIX) and Gamma (GEX) calculations are based on where the prior day’s reading falls with respect to the MAX and MIN of all occurrences available. A higher DIX is bullish. At the same time, the lower the GEX, the more (expected) volatility. Learn the implications of volatility, direction, and moneyness. Breadth reflects a reading of the prior day’s NYSE Advance/Decline indicator. VIX reflects a current reading of the CBOE Volatility Index (INDEX: VIX) from 0-100.
Administrative
Setting the stage for what we will unpack further later this week. Mainly key talking points, today, coupled with a few aesthetic changes, if you have not noticed already (e.g., graphic above).
Fundamental
A less eventful couple of days, albeit uncertainty remains. On the geopolitical front, an easing of conflict appeared with Biden and Xi stressing their need to get ties back on track. That is adding to Russia’s withdrawal from Kherson, Ukraine.
Regarding crypto, a focus for some of last week’s letters, the happenings are awing. Allegedly FTX “transferred billions of dollars in customer assets to their trading firm Alameda,” Substack newsletter Market Sentiment had written.
“Of the $16 billion that customers had deposited into FTX, close to $10 billion was transferred over to Alameda … using its own coin FTT as collateral for borrowing the real coins deposited by customers, … [and this meant that the scheme] heavily depended on the value of FTT.”
As a an aside, we will soon feature a conversation with a former emerging FX and yields trader at Goldman Sachs Group Inc (NYSE: GS) who now works in DeFi. We will unpack the recent volatility, its driver, and follow-on implications.
Here’s one quote:
“For example, look at what happened in the UK with the pension funds and margin calls. That is a classic DeFi strategy. You take your bonds and borrow cash against them. Then, you put it back into bonds and loop it a couple of times. That way, you have a leveraged interest rate exposure. That’s the same principle of lending staked ETH, borrowing ETH, and doing it a couple of times.”
It was allegations about the firms’ relationship, as well as allegations by competitors, that ultimately incited an implosion and bankruptcy. In short, per his posts on betting and Kelly criterion, founder Sam Bankman-Fried (SBF) showed a risk tolerance “far outside” the normal.
For more on the debacle, check out the Daily Brief published on November 10, 2022, as well as the letter published on November 9, 2022.
The aforementioned is in light of liquidity being “sucked out of the market,” said Fabian Wintersberger; a continued “withdrawal of liquidity might lead to a real, systemic crisis in conventional financial markets,” which we’ve pondered before.”
Positioning
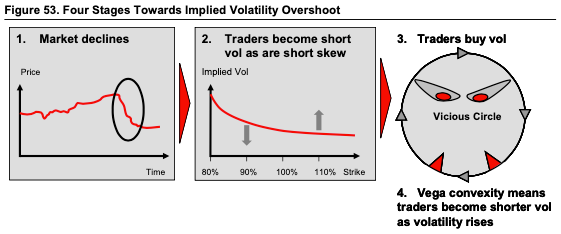
Markets have rallied, recently. In short, as we talked about before and, now, fellow letter writers, including Alfonso Peccatiello of The Macro Compass, confirm, the pace of the market’s rally is, in part, the result of “technical and institutional reasons.”
In our letters last week, we said the compression of implied volatility, evidenced by a shift lower in the volatility term structure, particularly at the front end where options are most sensitive, was to add to any macro-type repositioning, with follow-on buying support coming from the reach for “Deltas and leverage” to the upside (call options).
Peccatiello offers an interesting explanation: “[A]t this point of the year incentive schemes drive people to be much more willing to pay and chase upside.” Preferred are the “convex structures” that would benefit from “outsized” rallies. In traders’ monetization of put protection they owned, as well as reach for upside calls (to not miss out on a potential reversal), skew is at lows and, if the assumption is that “further tightening monetary policy and draining liquidity off the market might cause some problems down the road,” per Wintersberger, bets that pay when markets trade lower are attractive.
Adding, a big takeaway, though not discussed explicitly above (but in past letters), we’ll see a loss of structural support from hedging flows; ultimately, the very poor hedging that’s going on, heading into the next rally, is going to set the stage for a large tail. Traders, who aren’t as well hedged, will seek protection and this will pressure markets, adding to any macro-type selling.
In the coming letters, we’ll go into more detail and discuss how to structure a new trade on this information, such as the one unpacked in a recent case study of ours.
Technical
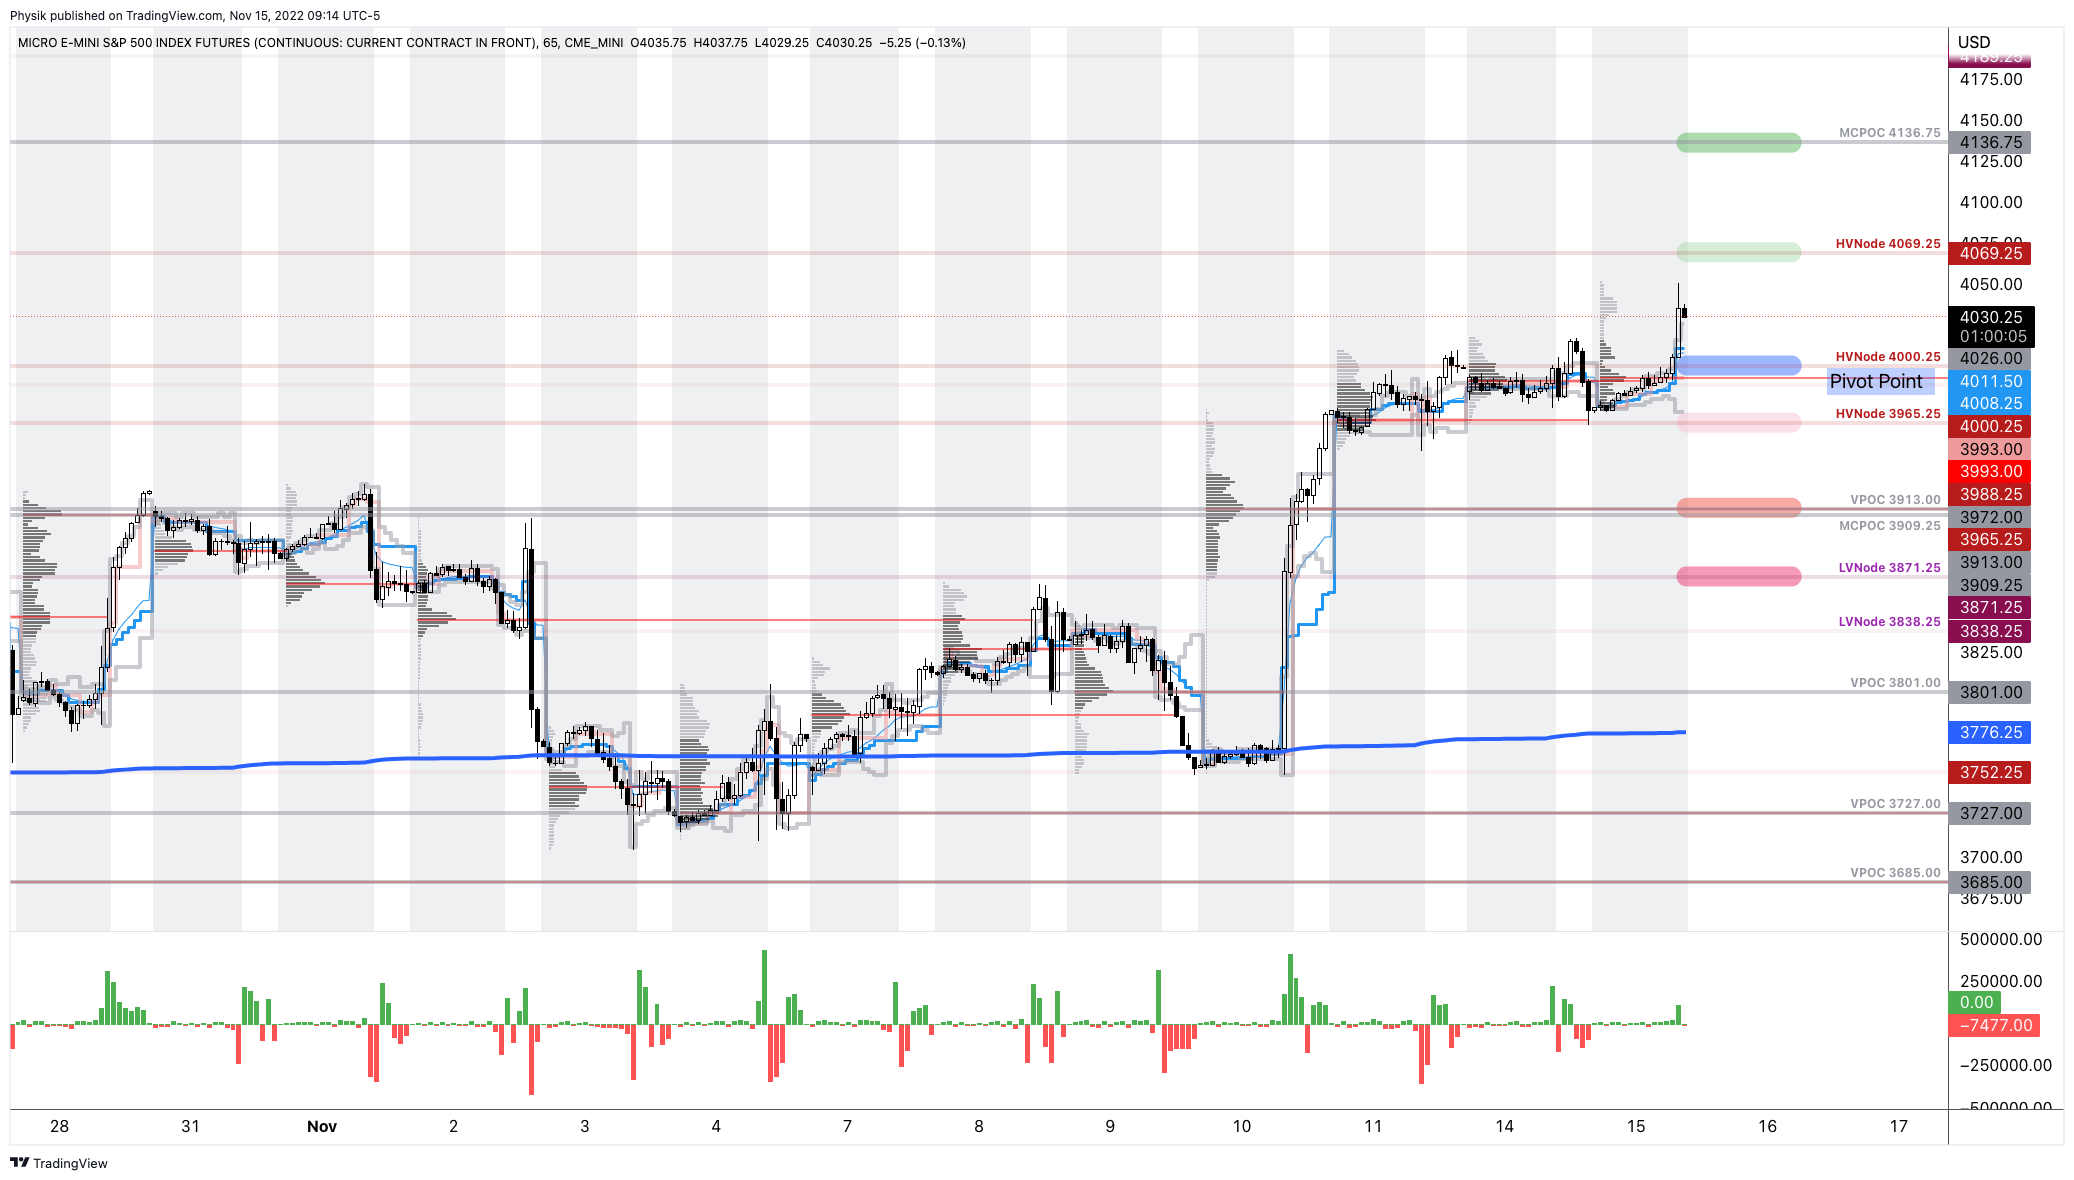
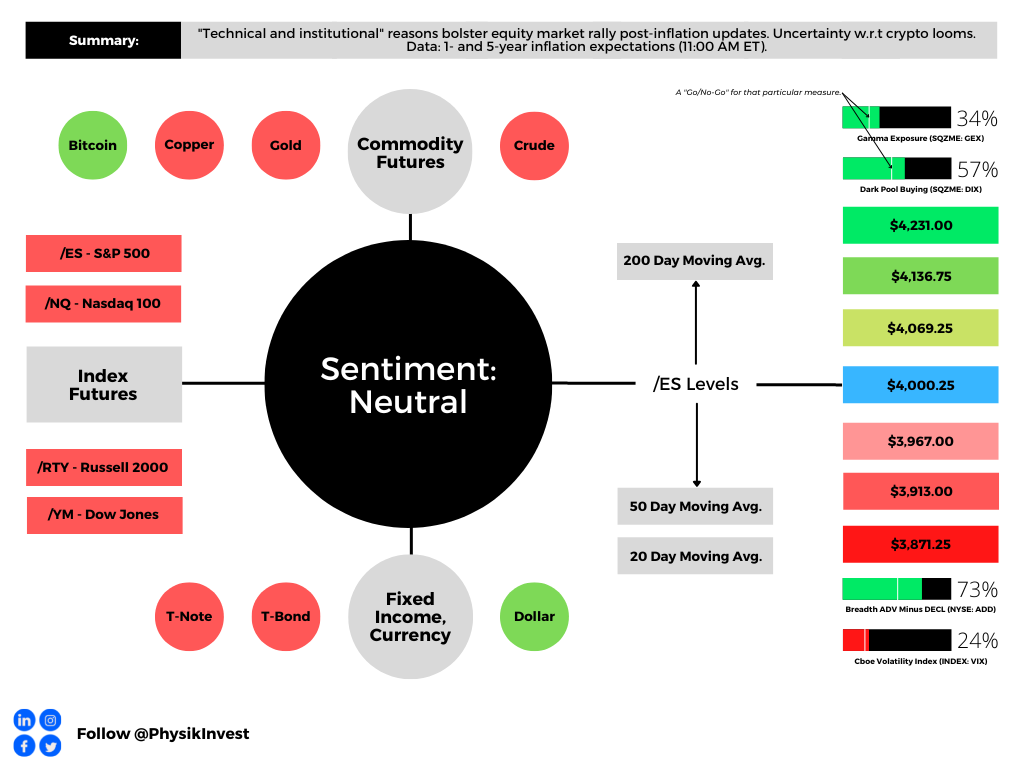
As of 7:45 AM ET, Monday’s regular session (9:30 AM – 4:00 PM ET), in the S&P 500, is likely to open in the middle part of a balanced overnight inventory, inside of prior-range and -value, suggesting a limited potential for immediate directional opportunity.
Our S&P 500 pivot for today is $4,000.25.
Key levels to the upside include $4,069.25, $4,136.75, and $4,231.00.
Key levels to the downside include $3,967.00, $3,913.00, and $3,871.25.
Click here to load today’s key levels into the web-based TradingView platform. All levels are derived using the 65-minute timeframe. New links are produced, daily.
Graphic: 65-minute profile chart of the Micro E-mini S&P 500 Futures. Check out this refresher on the shape of volume profiles.
About
After years of self-education, strategy development, mentorship, and trial-and-error, Renato Leonard Capelj began trading full-time and founded Physik Invest to detail his methods, research, and performance in the markets.
Capelj also develops insights around impactful options market dynamics at SpotGamma and is a Benzinga journalist.
The daily brief is a free glimpse into the prevailing fundamental and technical drivers of U.S. equity market products. Join the 900+ that read this report daily, below!
Graphic updated 7:45 AM ET. Sentiment Neutral if expected /ES open is inside of the prior day’s range. /ES levels are derived from the profile graphic at the bottom of the following section. Levels may have changed since initially quoted; click here for the latest levels. SqueezeMetrics Dark Pool Index (DIX) and Gamma (GEX) calculations are based on where the prior day’s reading falls with respect to the MAX and MIN of all occurrences available. A higher DIX is bullish. At the same time, the lower the GEX, the more (expected) volatility. Learn the implications of volatility, direction, and moneyness. Breadth reflects a reading of the prior day’s NYSE Advance/Decline indicator. VIX reflects a current reading of the CBOE Volatility Index (INDEX: VIX) from 0-100.
Administrative
Apologies – yesterday the above graphic was not properly updated. The sentiment reading was incorrect, as were a couple of other figures. Separately, a lighter note, today, followed by more in-depth stuff currently being worked on in the coming sessions. Thanks!
Fundamental
First – going to refer everyone to yesterday’s letter, a conversation between Joseph Wang and Andy Constan, as well as some updates Cem Karsan of Kai Volatility made. That is, in part, a primer for what we will be talking more about, soon.
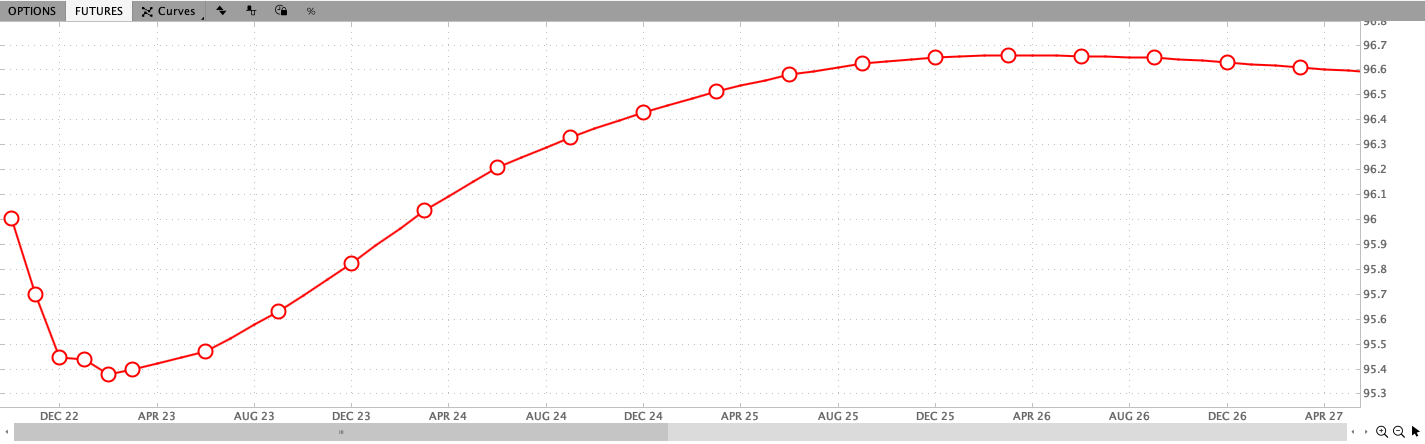
Next – we have futures markets pricing rate a peak in the overnight rate at ~4.6% in February of 2023. From thereon, rate cuts are implied.
Graphic: Via Charles Schwab Corporation’s (NYSE: SCHW) TD Ameritrade thinkorswim. Observed is the Eurodollar, the interest offered on U.S. dollar-denominated deposits held at banks outside of the U.S. (i.e., participants’ outlook on interest rates).
It’s becoming the consensus that “[f]or hikes to reduce inflation, they need to hurt growth,” Jean Boivin and Alex Brazier of BlackRock Inc (NYSE: BLK) explained.
“There is no way around this,” they add. “We estimate it would require a deep recession in the U.S., with around as much as 2% hit to growth in the U.S., and 3 million more unemployed, and an even deeper recession in Europe.”
It’s the impact of rising rates and quantitative tightening (the latter which will compound the impacts of the former) that are part of the toolkit used to cool the sticky inflation.
Graphic: Via Physik Invest. Data compiled by @jkonopas623. Fed Balance Sheet data, here. Treasury General Account Data, here. Reverse Repo data, here. NL = BS – TGA – RRP.
Ray Dalio, of Bridgewater Associates LP, said that rates rising “toward the higher end of the 4.5% to 6% range … will bring private sector credit growth down, which will bring private sector spending and, hence, the economy down with it.”
Accordingly, equity prices could plunge upwards of 20%, as a result.
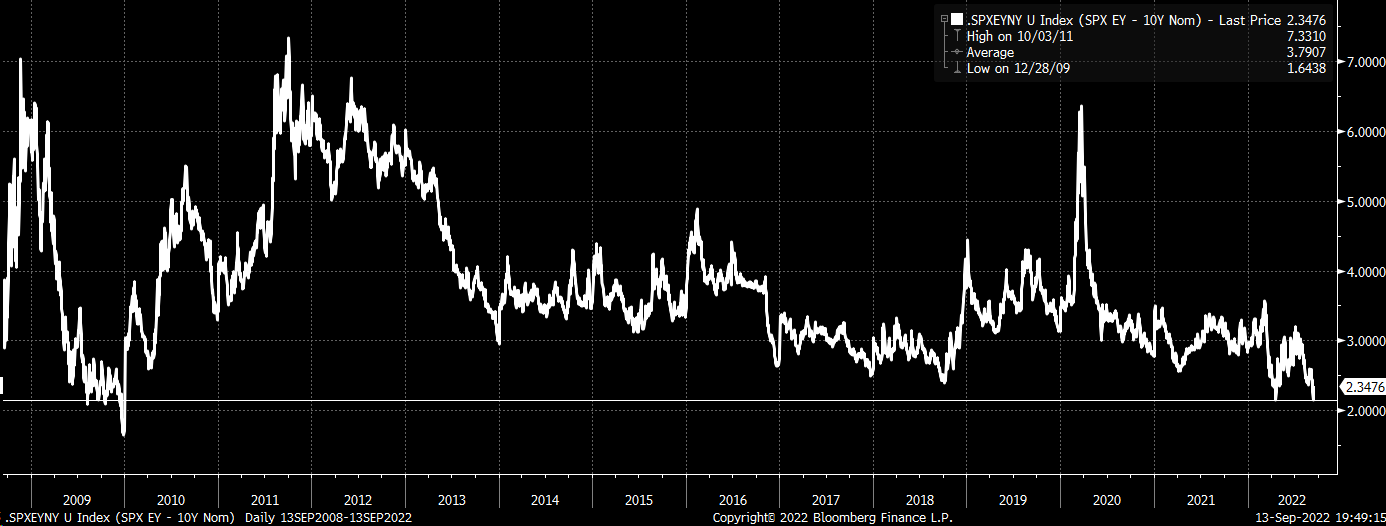
Graphic: Retrieved from Bloomberg via Michael J. Kramer. “What is amazing is how expensive this market is relative to rates. The spread between the S&P 500 Earnings yield and the 10-Yr nominal rate is at multi-year lows.”
Further, per Bloomberg’s John Authers, it’s the case that “[a]ll major global synchronized crises ended with moderate inflation and low growth; that hasn’t been reached yet.” Separately, a peak in inflation “doesn’t come close to guaranteeing equity gains.”
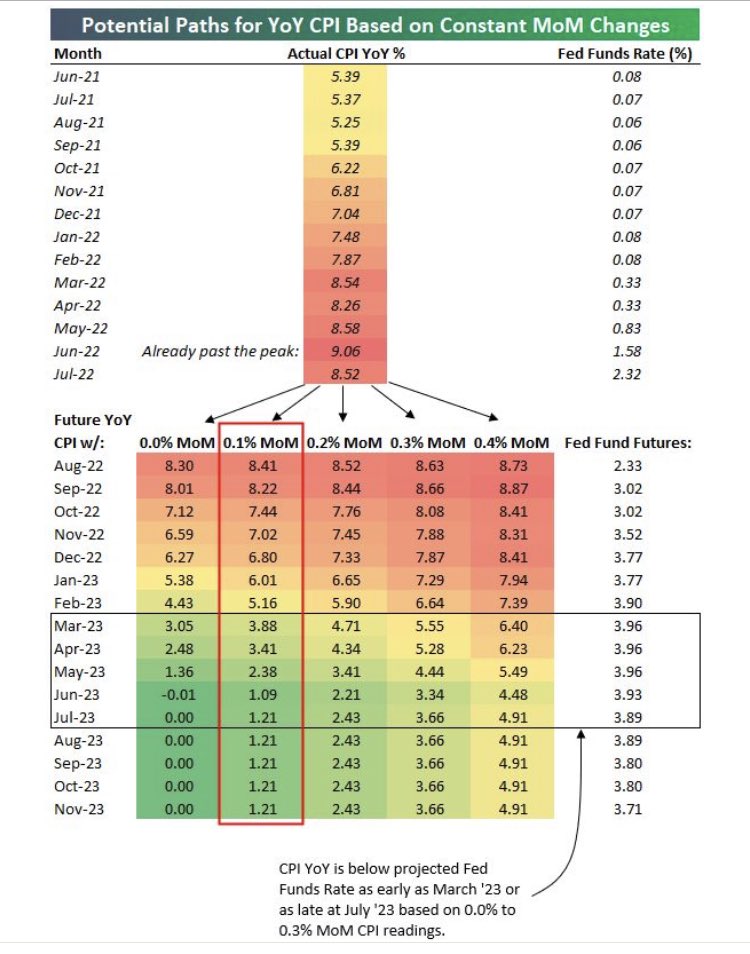
The pivot will come when there’s a “sustainable path to 2% (not 3 or 4%) inflation” and a “fed funds that is greater than CPI for a few quarters,” explained Alfonso Peccatiello of The Macro Compass.
“The timing mostly depends [on] the MoM CPI ahead,” he added, pointing to a graphic that suggests “there is no ‘pivot’ earlier than mid-2023, and it could well be later. Looking at the SOFR curve, that’s also what’s roughly priced in.”
Graphic: Retrieved from Bespoke Investment Group via Alfonso Peccatiello.
Positioning
Ahead of a multi-derivative expiry, markets are trading sideways to lower. Demands to protect equity downside (with puts), compounded macro-type selling earlier this week.
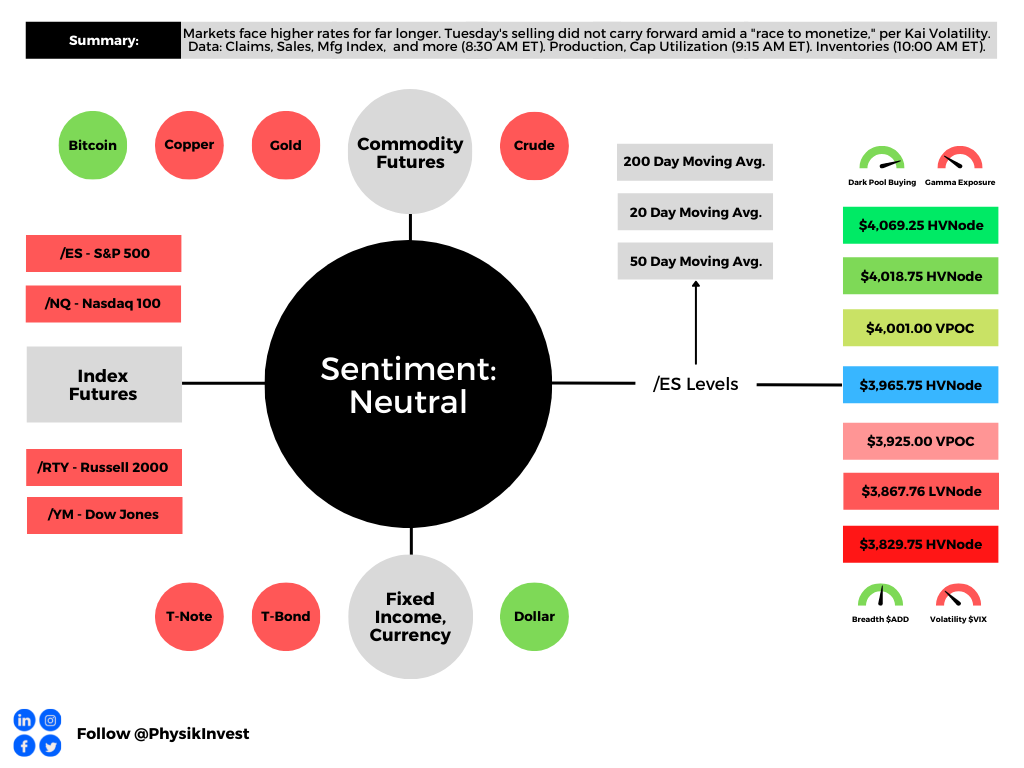
Now, with traders well hedged, Kai Volatility’s Cem Karsan put forth that there is a “race to monetize,” which is lending to “relatively flat” trade and “lack of follow-through.”
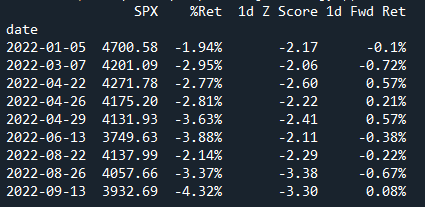
Graphic: Retrieved from Pat Hennessy. “Every large down move in SPX this year (quantified by <= -2 Zscore) has been followed by a relatively flat day/lack of follow through. Any ideas as to why this is?”
From hereon, as we said, a lot of the exposure demanded is short-dated. Should that exposure not be rolled forward in time, and allowed to expire, “SPX/ES dealers [who] are well hedged,” will unwind their hedges which may drive bullishness “through OpEx,” added Karsan.
Notwithstanding, this “has [the] potential to drive a tail post” OpEx. In [the] tech/meme market melt-up of 2020-2021, positioning was [the] exact opposite.”
Technical
As of 7:45 AM ET, Thursday’s regular session (9:30 AM – 4:00 PM ET), in the S&P 500, is likely to open in the middle part of a balanced overnight inventory, inside of prior-range and -value, suggesting a limited potential for immediate directional opportunity.
In the best case, the S&P 500 trades higher.
Any activity above the $3,965.75 HVNode puts into play the $4,001.00 VPOC. Initiative trade beyond the VPOC could reach as high as the $4,018.75 and $4,069.25 HVNodes, or higher.
In the worst case, the S&P 500 trades lower.
Any activity below the $3,965.75 HVNode puts into play the $3,925.00 VPOC. Initiative trade beyond the VPOC could reach as low as the $3,867.75 LVNode and $3,829.75 HVNode, or lower.
Click here to load today’s key levels into the web-based TradingView charting platform. Note that all levels are derived using the 65-minute timeframe. New links are produced, daily.
Graphic: 65-minute profile chart of the Micro E-mini S&P 500 Futures.
Definitions
Volume Areas: A structurally sound market will build on areas of high volume (HVNodes). Should the market trend for long periods of time, it will lack sound structure, identified as low volume areas (LVNodes). LVNodes denote directional conviction and ought to offer support on any test.
If participants were to auction and find acceptance into areas of prior low volume (LVNodes), then future discovery ought to be volatile and quick as participants look to HVNodes for favorable entry or exit.
POCs: POCs are valuable as they denote areas where two-sided trade was most prevalent in a prior day session. Participants will respond to future tests of value as they offer favorable entry and exit.
MCPOCs: POCs are valuable as they denote areas where two-sided trade was most prevalent over numerous day sessions. Participants will respond to future tests of value as they offer favorable entry and exit.
About
After years of self-education, strategy development, mentorship, and trial-and-error, Renato Leonard Capelj began trading full-time and founded Physik Invest to detail his methods, research, and performance in the markets.
Capelj also develops insights around impactful options market dynamics at SpotGamma and is a Benzinga reporter.
In no way should the materials herein be construed as advice. Derivatives carry a substantial risk of loss. All content is for informational purposes only.
The daily brief is a free glimpse into the prevailing fundamental and technical drivers of U.S. equity market products. Join the 850+ that read this report daily, below!
Graphic updated 8:30 AM ET. Sentiment Neutral if expected /ES open is inside of the prior day’s range. /ES levels are derived from the profile graphic at the bottom of the following section. Levels may have changed since initially quoted; click here for the latest levels. SqueezeMetrics Dark Pool Index (DIX) and Gamma (GEX) calculations are based on where the prior day’s reading falls with respect to the MAX and MIN of all occurrences available. A higher DIX is bullish. At the same time, the lower the GEX, the more (expected) volatility. Learn the implications of volatility, direction, and moneyness. Breadth reflects a reading of the prior day’s NYSE Advance/Decline indicator. VIX reflects a current reading of the CBOE Volatility Index (INDEX: VIX) from 0-100.
Positioning
In our last letter, it was put forth that markets were stretched after a ~20% multi-month advance on macro-type re-leveraging flows (given such things as a strong earnings season) and rotation out of volatility and commodity hedges.
To continue the advance, needed was more macro re-leveraging and demand for positive Delta exposure via equity or options, lower prints of consumer price data, as well as maintenance of a dovish Federal Reserve (Fed) undertone, among other things.
As an aside, participants’ dumping of poor-performing hedges (which we talked about in our last letter) left them “less hedged” and markets far more susceptible to “core macro factors” like “the incremental effects” of liquidity, a negative at present, particularly after OPEX or August monthly options expiration.
Graphic: Via Physik Invest. Data compiled by @jkonopas623. Fed Balance Sheet data, here. Treasury General Account Data, here. Reverse Repo data, here. NL = BS – TGA – RRP. According to The Macro Compass’ Alfonso Peccatiello, “QT is about to accelerate and the friendly dynamics behind the Fed balance sheet composition which helped risk assets stage a comeback rally in July are likely to fade away in Q4.”
And so, when the Fed’s Jerome Powell gave a message that they would stay tough on the war against inflation, the context was set for much larger trading ranges and increased potential for downside volatility.
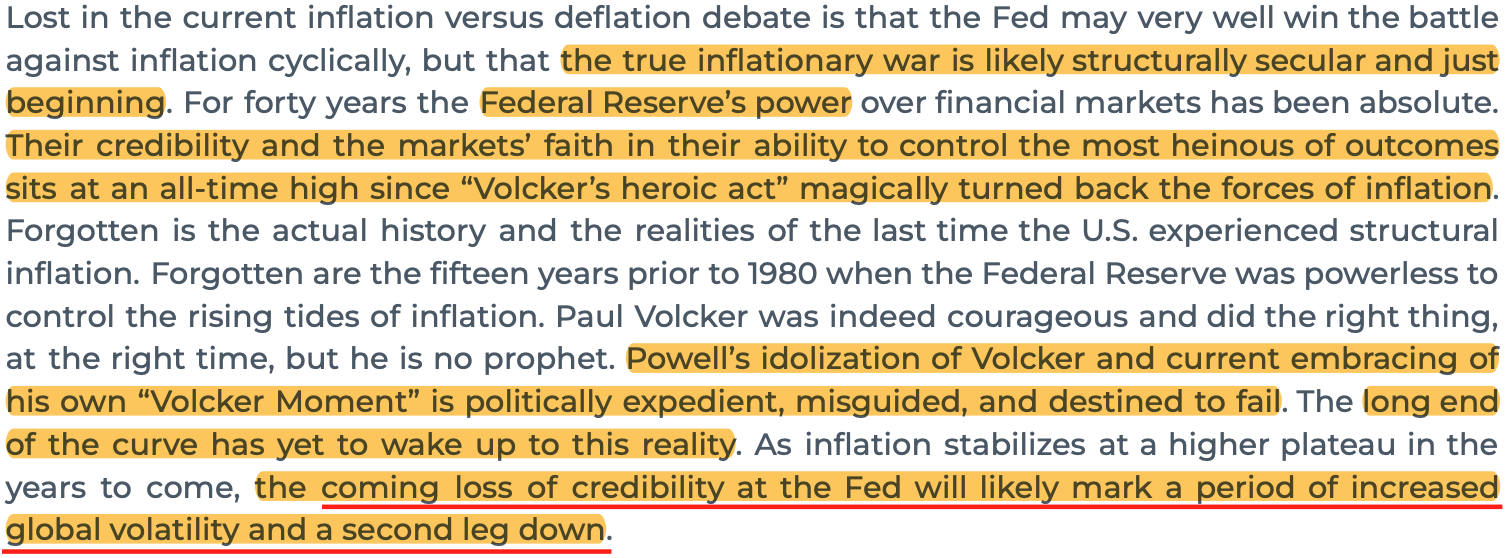
Graphic: Text retrieved from Kai Volatility’s Second Quarter (2022) Market Commentary And Outlook. Annotated by Physik Invest’s Renato Leonard Capelj. Read about the second leg down phenomenon, here.
During the subsequent rollover, the shock from Fed comments bolstered demand for protection (i.e., options) and boosted implied volatility, accordingly.
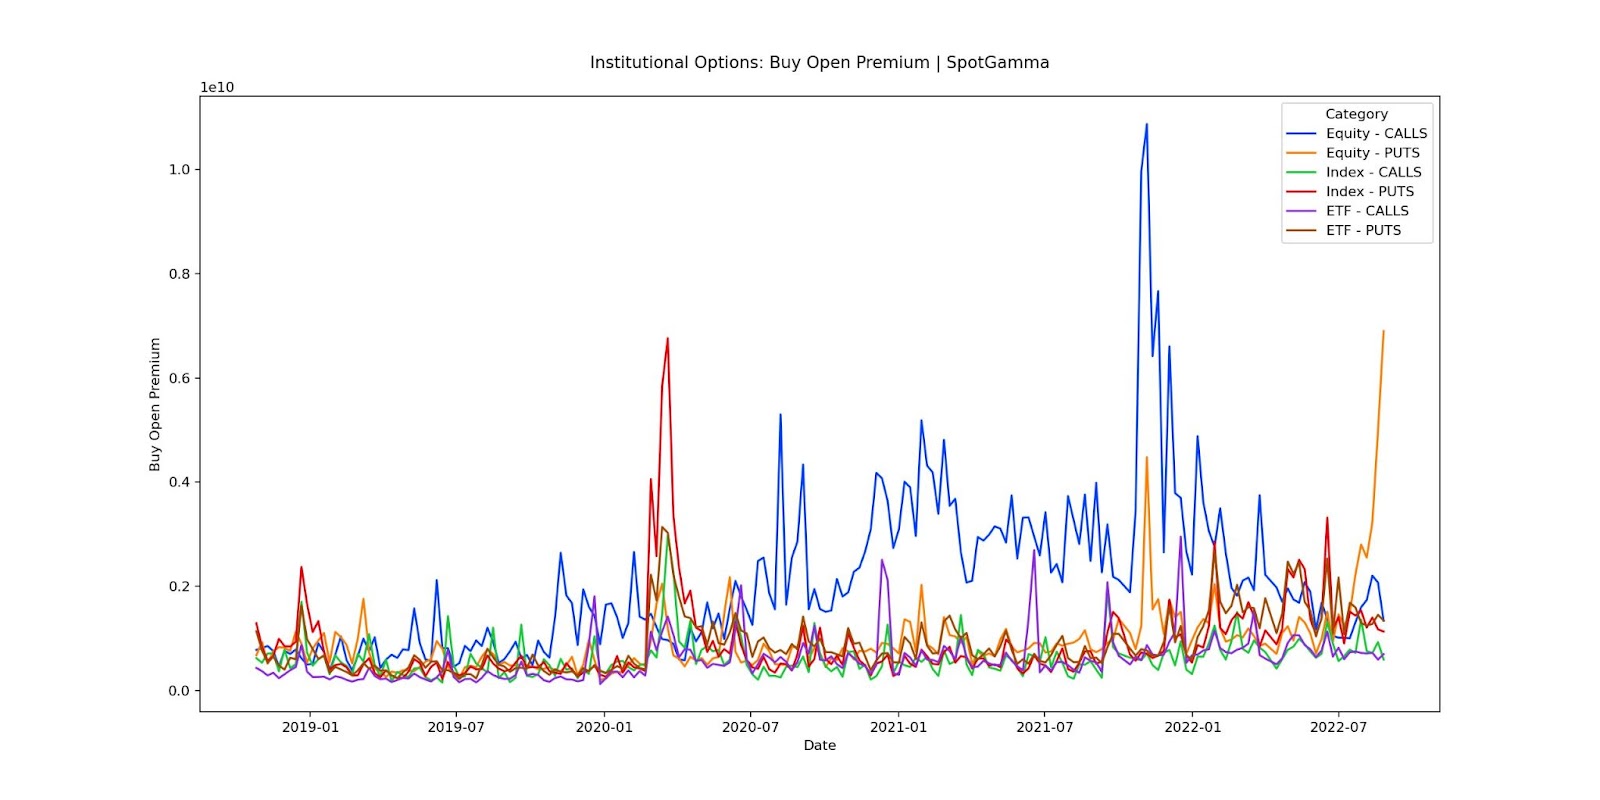
Graphic: Retrieved from SpotGamma. “There was a huge surge in large trader put buying in the equities space last week as per the OCC data.”
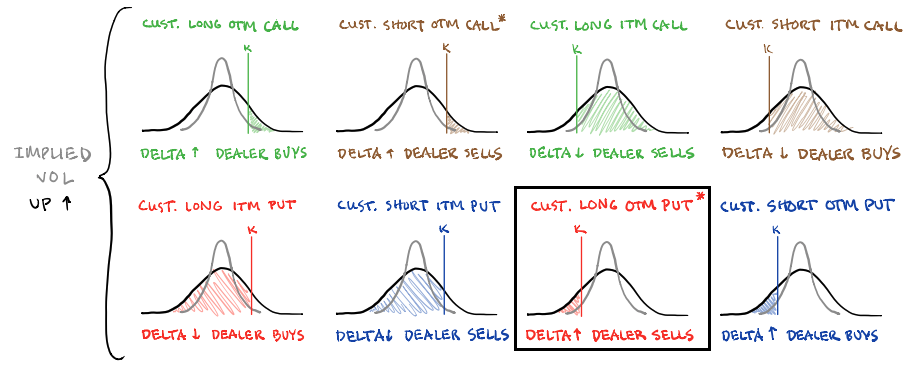
The reason being is that in a falling market, characterized by demand for put options, those who are on the other side of options trades, hedge in a manner that may pressure the market (i.e., the theory is that if customers buy puts, then counterparties sell puts + sell stock to hedge).
Graphic: Retrieved from SqueezeMetrics. Learn the implications of volatility, direction, and moneyness.
In our August 18, 2022 letter, we suggested wide Short Ratio Put Spreads would offer traders cheap but efficient exposure across very short time horizons. That trade panned out and, now, traders should be looking to monetize (i.e., turn to cash) these bets into any further declines.
Technical
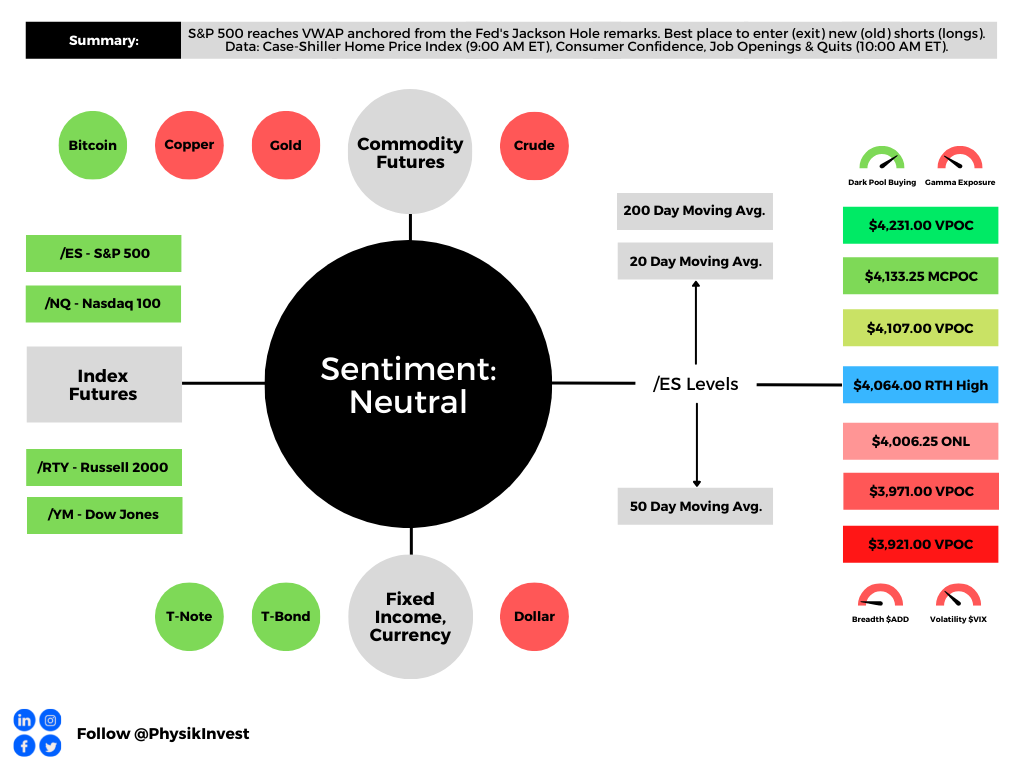
As of 8:30 AM ET, Tuesday’s regular session (9:30 AM – 4:00 PM ET), in the S&P 500, is likely to open in the upper part of a positively skewed overnight inventory, just inside of prior-range and -value, suggesting a limited potential for immediate directional opportunity.
In the best case, the S&P 500 trades higher.
Any activity above the $4,064.00 RTH High pivot puts into play the $4,107.00 VPOC. Initiative trade beyond the VPOC could reach as high as the $4,133.25 and $4,231.00 POCs, or higher.
In the worst case, the S&P 500 trades lower.
Any activity below the $4,064.00 RTH High pivot puts into play the $4,006.25 ONL. Initiative trade beyond the ONL could reach as low as the $3,971.00 and $3,921.00 POCs, or lower.
Click here to load today’s key levels into the web-based TradingView charting platform. Note that all levels are derived using the 65-minute timeframe. New links are produced, daily.
Graphic: 65-minute profile chart of the Micro E-mini S&P 500 Futures.
Definitions
Overnight Rally Highs (Lows): Typically, there is a low historical probability associated with overnight rally-highs (lows) ending the upside (downside) discovery process.
Volume Areas: A structurally sound market will build on areas of high volume (HVNodes). Should the market trend for long periods of time, it will lack sound structure, identified as low volume areas (LVNodes). LVNodes denote directional conviction and ought to offer support on any test.
If participants were to auction and find acceptance into areas of prior low volume (LVNodes), then future discovery ought to be volatile and quick as participants look to HVNodes for favorable entry or exit.
Gamma: Gamma is the sensitivity of an option to changes in the underlying price. Dealers that take the other side of options trades hedge their exposure to risk by buying and selling the underlying. When dealers are short-gamma, they hedge by buying into strength and selling into weakness. When dealers are long-gamma, they hedge by selling into strength and buying into weakness. The former exacerbates volatility. The latter calms volatility.
POCs: POCs are valuable as they denote areas where two-sided trade was most prevalent in a prior day session. Participants will respond to future tests of value as they offer favorable entry and exit.
MCPOCs: POCs are valuable as they denote areas where two-sided trade was most prevalent over numerous day sessions. Participants will respond to future tests of value as they offer favorable entry and exit.
Volume-Weighted Average Prices (VWAPs): A metric highly regarded by chief investment officers, among other participants, for quality of trade. Additionally, liquidity algorithms are benchmarked and programmed to buy and sell around VWAPs.
About
After years of self-education, strategy development, mentorship, and trial-and-error, Renato Leonard Capelj began trading full-time and founded Physik Invest to detail his methods, research, and performance in the markets.
Capelj also develops insights around impactful options market dynamics at SpotGamma and is a Benzinga reporter.
In no way should the materials herein be construed as advice. Derivatives carry a substantial risk of loss. All content is for informational purposes only.
The daily brief is a free glimpse into the prevailing fundamental and technical drivers of U.S. equity market products. Join the 800+ that read this report daily, below!
Graphic updated 7:30 AM ET. Sentiment Neutral if expected /ES open is inside of the prior day’s range. /ES levels are derived from the profile graphic at the bottom of the following section. Levels may have changed since initially quoted; click here for the latest levels. SqueezeMetrics Dark Pool Index (DIX) and Gamma (GEX) calculations are based on where the prior day’s reading falls with respect to the MAX and MIN of all occurrences available. A higher DIX is bullish. At the same time, the lower the GEX, the more (expected) volatility. Learn the implications of volatility, direction, and moneyness. Breadth reflects a reading of the prior day’s NYSE Advance/Decline indicator. VIX reflects a current reading of the CBOE Volatility Index (INDEX: VIX) from 0-100.
Fundamental
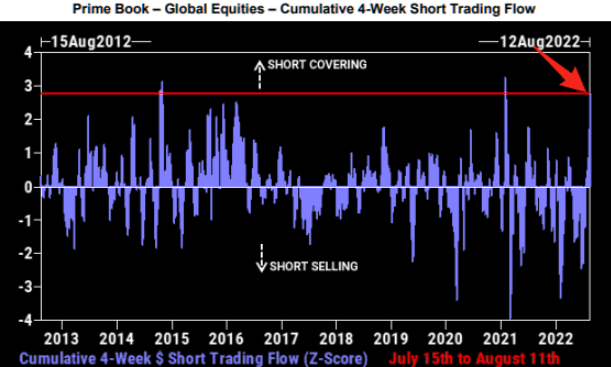
According to Goldman Sachs Group Inc (NYSE: GS) Prime Services, this is the third largest short-covering rally in three years.
Graphic: Retrieved from The Market Ear. Via Goldman Sachs Group Inc.
The rally, as discussed in past commentaries, is, in part, the result of “volatility-target funds” and “trend-following funds” getting back into the market as volatility falls, sentiment and data on jobs improve, as well as cooler-than-expected inflation figures.
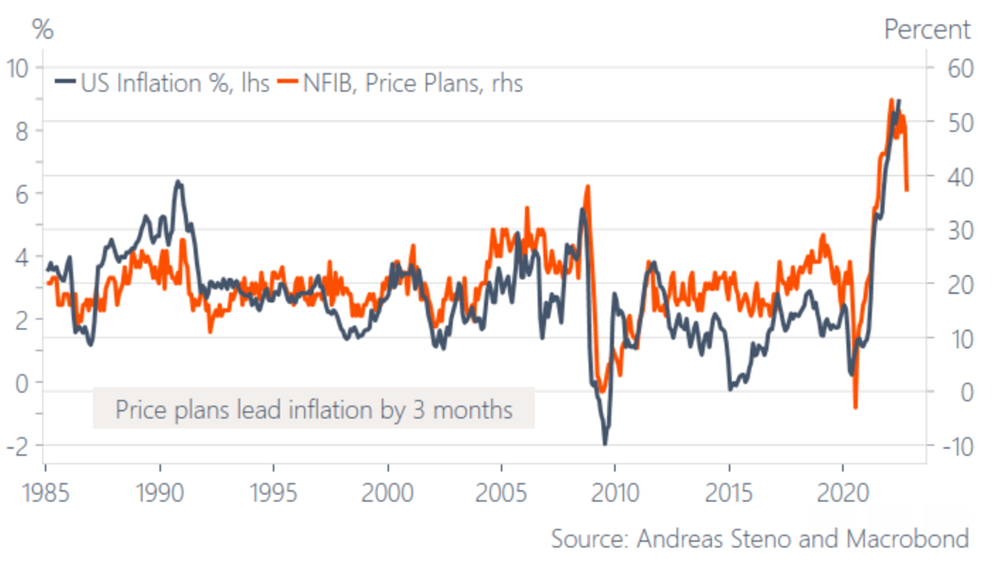
Graphic: Retrieved from Stenos Signals. “Unless SMEs are lying, inflation has peaked for now … Will it change the market psychology?”
“The machines seem hell-bent on pushing the financial conditions easing trade,” said Dennis DeBusschere, the founder of 22V Research.
“Machines are eating the words from the Fed speakers for breakfast.”
Graphic: Retrieved from Bloomberg. “The issue is the giant pool of systematic funds that moves in and out of the market based on how turbulent prices are. With peace at hand of late amid a four-week rally, so-called volatility-target funds and similar strategies such as risk parity are buying between $2 billion to $4 billion of stocks per day, according to an estimate by JPMorgan Chase & Co.’s Kate Gandolfo.”
Notwithstanding, JPMorgan Chase & Co (NYSE: JPM) estimates overall CTA exposures remain subdued. To incite ultra-impactful “buy signals” the S&P 500 would have to rise to $4,400.00.
This “would prompt CTAs to step up buying” and, potentially, turn “‘max long’ on stocks, buying probably $100 billion to $200 billion across various trend-following strategies.”
Though the S&P 500 has yet to retake the $4,400.00 level, likely to remain as support until the end of the week, at least, are options hedging flows, which we talked about last week.
“That can last perhaps another 100 days if volatility stays low,” JPM’s Kate Gandolfo suggested.
For context, at least at the index level, customers are short call, long put against their equity. In a rising market, the call side solicits increased hedging on the part of counterparties.
If counterparties are long the call, and the market is rising (falling), they must sell (buy) underlying to re-hedge. This can further contain realized volatility and support the market.
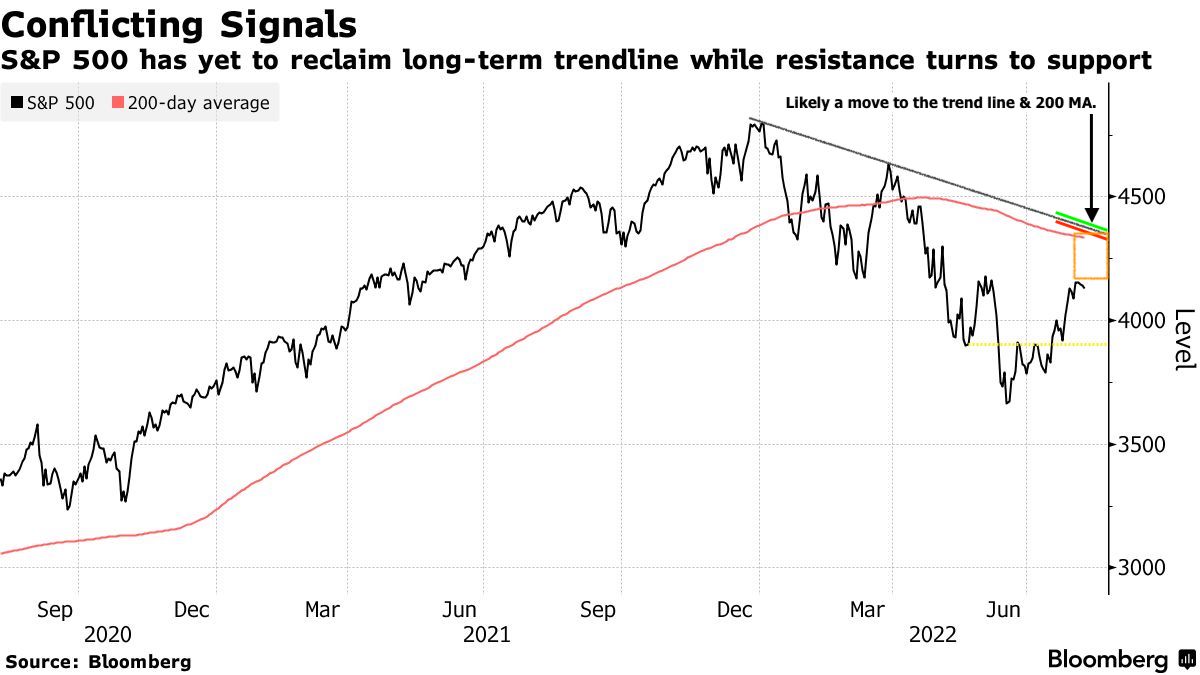
To act on this information, you are best off shrinking your timeframe and using if/then statements to put on trades. For instance, if the market rises past the downtrend line in the S&P 500, then the 2022 equity bear market is over. We should bias ourselves long, at that point.
Graphic: Retrieved from Bloomberg. Drawn on by Physik Invest.
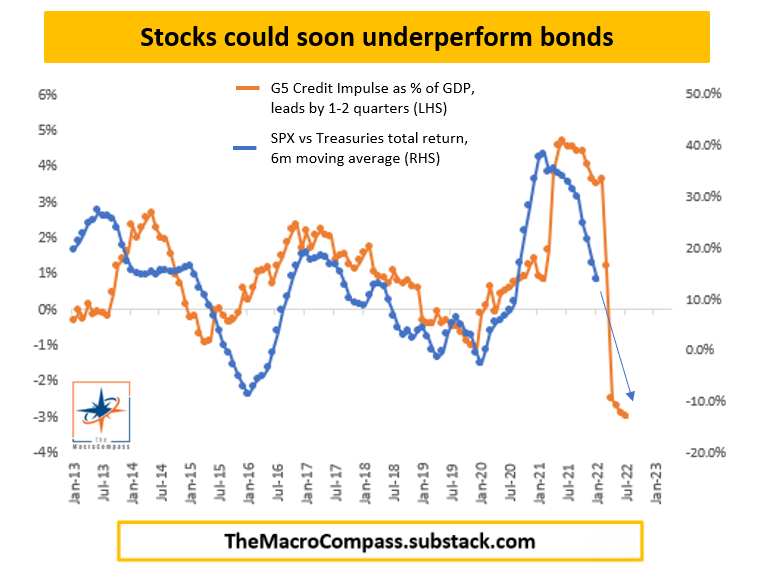
Accordingly, over a larger horizon, its growth impulses, as well as the availability of credit and liquidity determine whether a market’s movements have legs.
Accordingly, “in the 1970s, the peak in inflation proved THE timing to load up on risk assets, but the missing link is a bottoming growth cycle,” Andreas Steno Larsen explained.
“The swiftly weakening growth cycle may rather be the EXACT reason why inflation has started to fade.”
In fact, Credit Suisse Group AG’s (NYSE: CS) Zoltan Pozsar sees inflation as a longer-lasting structural issue as “the pillars of the low inflation world – [de-globalization and populism] – are changing.”
As Crossmark Global Investments’ Victoria Fernandez puts it well, “We have probably reached peak inflation, but the stickiness of the inflation that remains (i.e., rents) keeps pressure on the Fed and therefore the markets.”
“We expected a summer rally due to better-than-expected earnings, but we aren’t satisfied that this is sustainable. A soft landing is still achievable, but we still anticipate volatility with so many unknowns out there.”
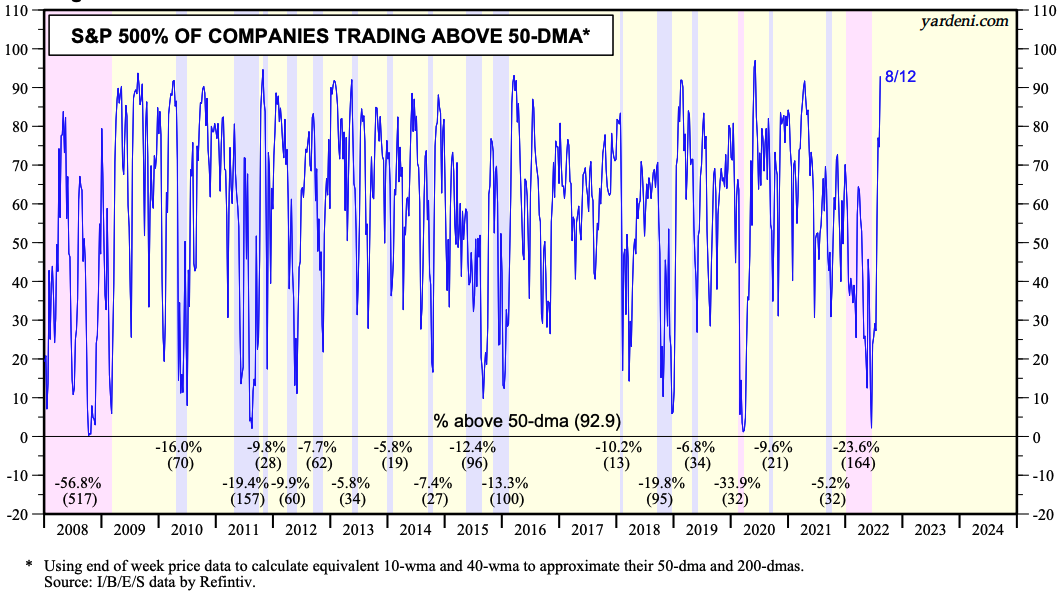
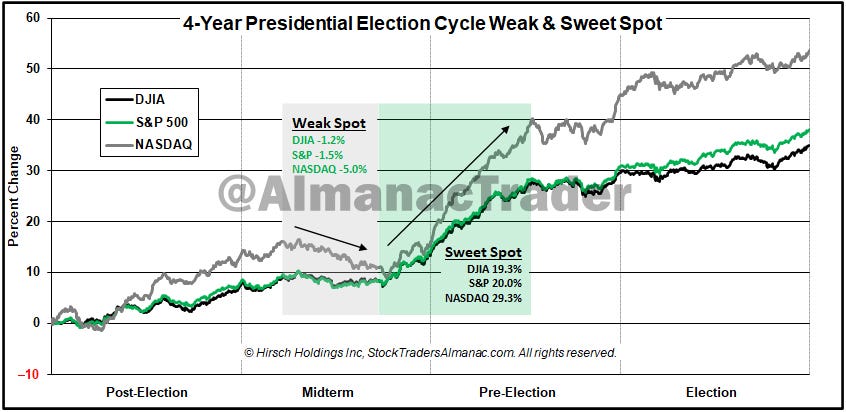
Graphic: Retrieved from Callum Thomas’ Weekly S&P 500 ChartStorm. The “seasonal/cycle outlook is for a lower low or retest of the lows over the next three months as we are in the worst two months of the year and are smack dab in the *Weak Spot* of the 4-Year Cycle”
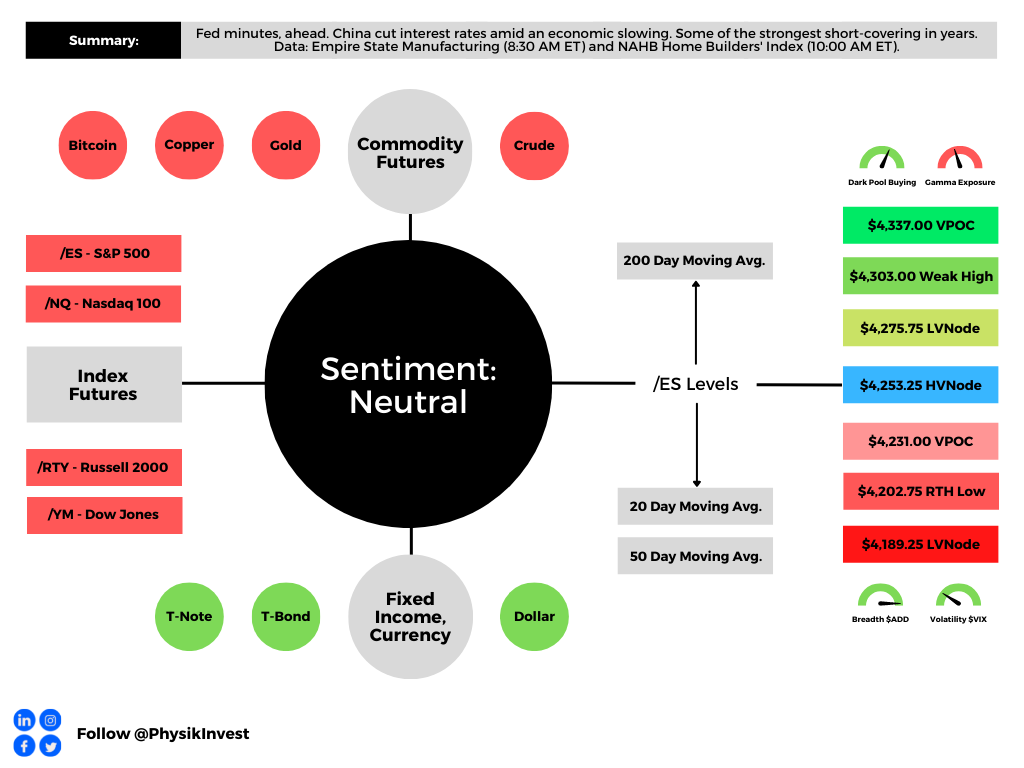
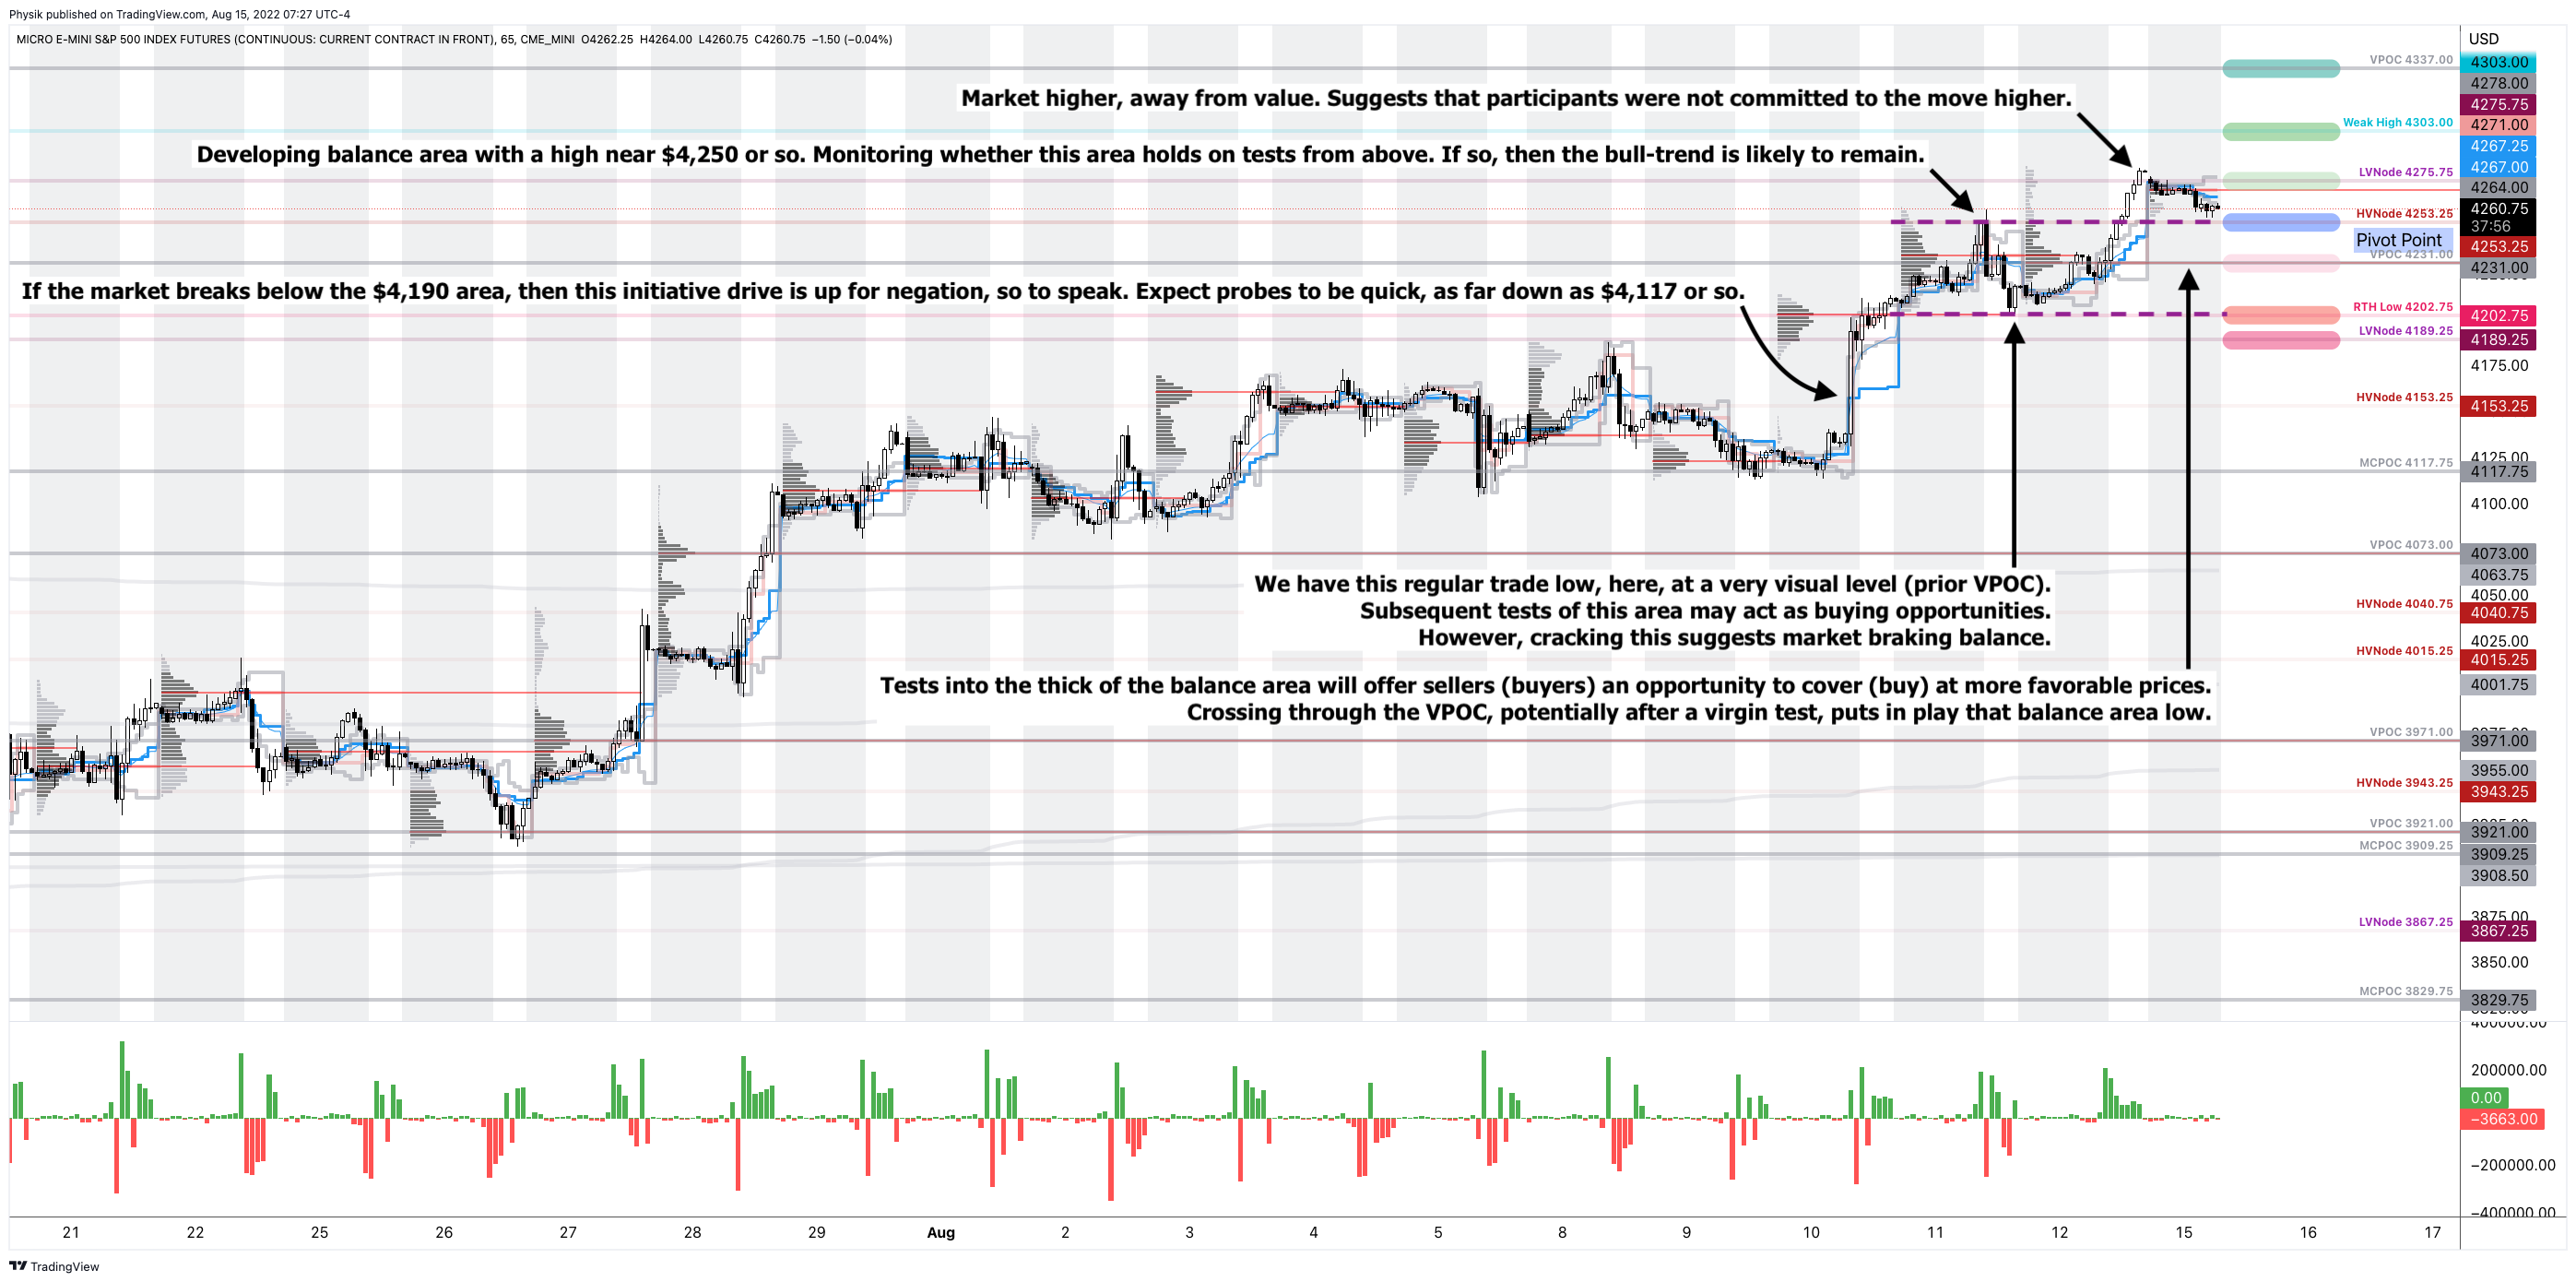
As of 7:30 AM ET, Monday’s regular session (9:30 AM – 4:00 PM ET), in the S&P 500, is likely to open in the lower part of a negatively skewed overnight inventory, inside of prior-range and -value, suggesting a limited potential for immediate directional opportunity.
In the best case, the S&P 500 trades higher.
Any activity above the $4,253.25 HVNode puts into play the $4,275.75 LVNode. Initiative trade beyond the LVNode could reach as high as the $4,303.00 Weak High and $4,337.00 VPOC, or higher.
In the worst case, the S&P 500 trades lower.
Any activity below the $4,253.25 HVNode puts into play the $4,231.00 VPOC. Initiative trade beyond the VPOC could reach as low as the $4,202.75 RTH Low and $4,189.25 LVNode, or lower.
Click here to load today’s key levels into the web-based TradingView charting platform. Note that all levels are derived using the 65-minute timeframe. New links are produced, daily.
Graphic: 65-minute profile chart of the Micro E-mini S&P 500 Futures.
Definitions
Volume Areas: A structurally sound market will build on areas of high volume (HVNodes). Should the market trend for long periods of time, it will lack sound structure, identified as low volume areas (LVNodes). LVNodes denote directional conviction and ought to offer support on any test.
If participants were to auction and find acceptance into areas of prior low volume (LVNodes), then future discovery ought to be volatile and quick as participants look to HVNodes for favorable entry or exit.
POCs: POCs are valuable as they denote areas where two-sided trade was most prevalent in a prior day session. Participants will respond to future tests of value as they offer favorable entry and exit.
MCPOCs: POCs are valuable as they denote areas where two-sided trade was most prevalent over numerous day sessions. Participants will respond to future tests of value as they offer favorable entry and exit.
Volume-Weighted Average Prices (VWAPs): A metric highly regarded by chief investment officers, among other participants, for quality of trade. Additionally, liquidity algorithms are benchmarked and programmed to buy and sell around VWAPs.
About
After years of self-education, strategy development, mentorship, and trial-and-error, Renato Leonard Capelj began trading full-time and founded Physik Invest to detail his methods, research, and performance in the markets.
Capelj also develops insights around impactful options market dynamics at SpotGamma and is a Benzinga reporter.
In no way should the materials herein be construed as advice. Derivatives carry a substantial risk of loss. All content is for informational purposes only.
The daily brief is a free glimpse into the prevailing fundamental and technical drivers of U.S. equity market products. Join the 750+ that read this report daily, below!
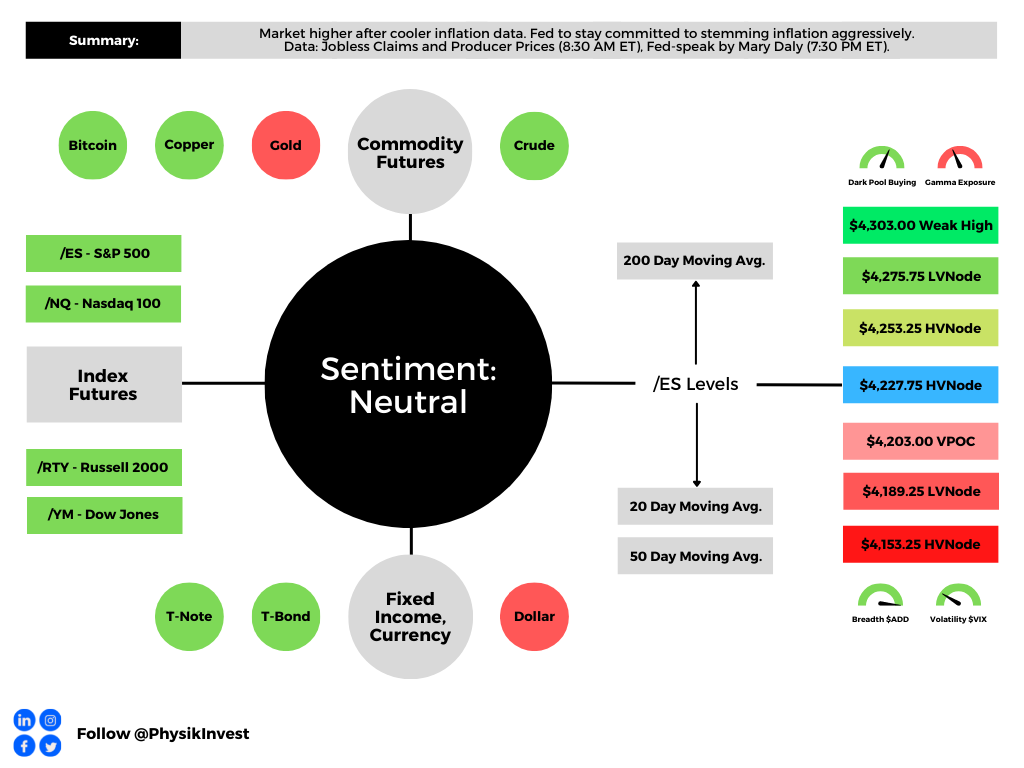
Graphic updated 7:30 AM ET. Sentiment Risk-On if expected /ES open is above the prior day’s range. /ES levels are derived from the profile graphic at the bottom of the following section. Levels may have changed since initially quoted; click here for the latest levels. SqueezeMetrics Dark Pool Index (DIX) and Gamma (GEX) calculations are based on where the prior day’s reading falls with respect to the MAX and MIN of all occurrences available. A higher DIX is bullish. At the same time, the lower the GEX, the more (expected) volatility. Learn the implications of volatility, direction, and moneyness. Breadth reflects a reading of the prior day’s NYSE Advance/Decline indicator. VIX reflects a current reading of the CBOE Volatility Index (INDEX: VIX) from 0-100.
Fundamental
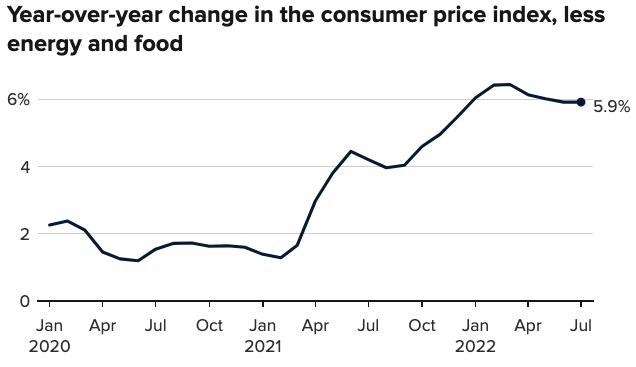
Equity market rally spurred by cooler a Consumer Price Index (CPI).
Expected was an 8.7% rise year-over-year (YoY) and 0.2% month-over-month (MoM). Core CPI (which excludes food and energy) was to rise by 6.1% YoY and 0.5% MoM, respectively.
Officially, the headline number rose to 8.5%. The core CPI rose 5.9% YoY and 0.3% MoM, meaning the March peak remains (6.5% YoY, then).
Participants responded positively to the number, as expected could happen in a case where the CPI printed lower.
As I talked about in yesterday’s morning letter and in a SpotGamma note, with easing inflation:
(1) investors may command a lower rate of return for their purchasing power and (2) lower rates (if policymakers were to become less aggressive) do less to negatively impact discounted cash flows and the ability to finance future growth.
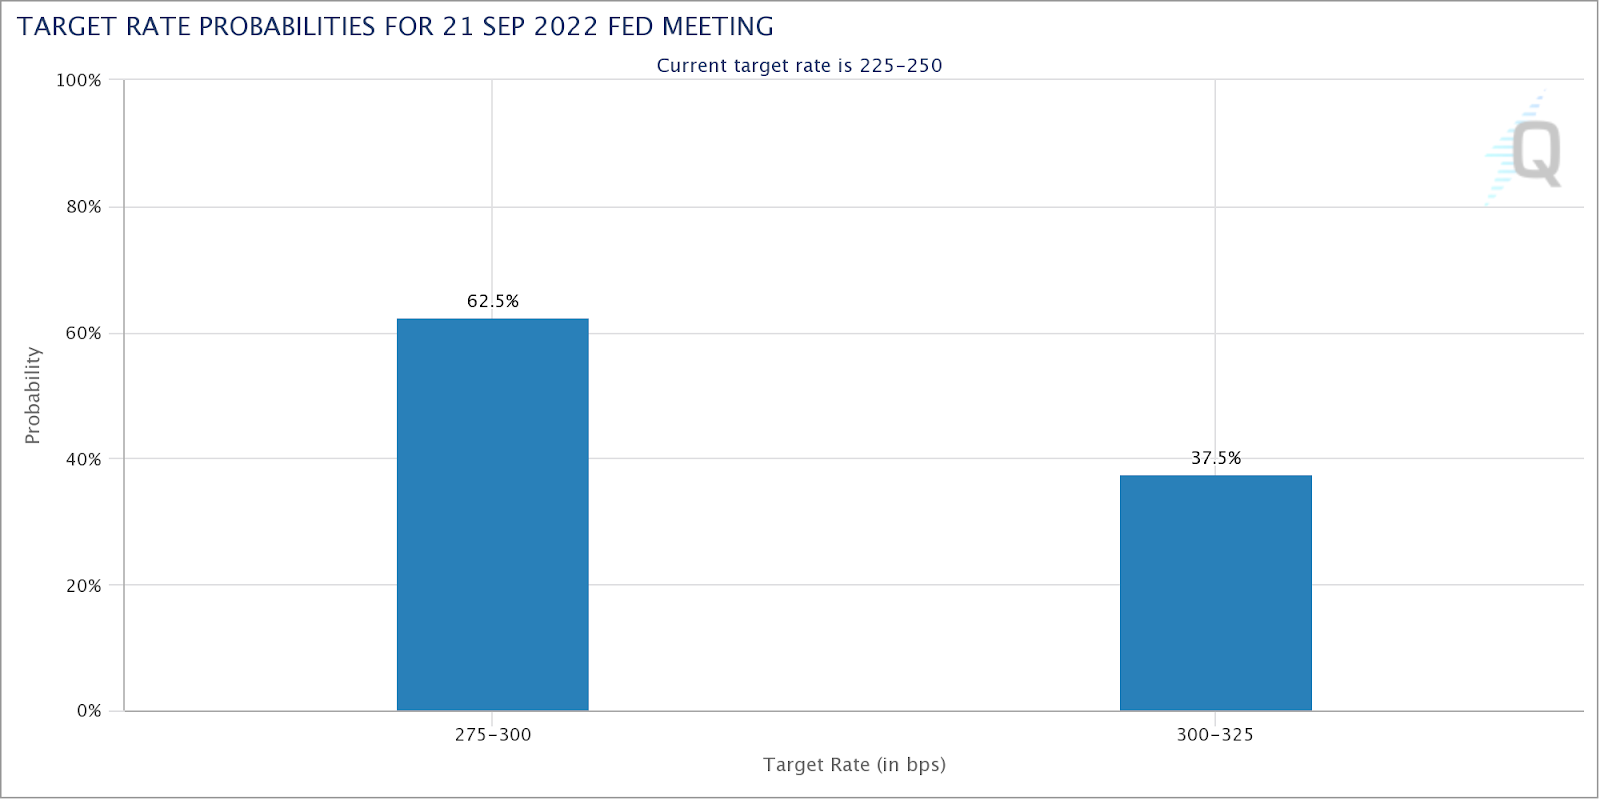
It is the case that immediately after the release of the CPI, traders dramatically shifted their bets on monetary action.
Previously, it was thought a 75 to 100 basis point hike would follow the report. Now, there are higher odds, as priced by the market, that there is a 25 to 50 basis point hike.
Graphic: Retrieved from CME Group Inc (NASDAQ: CME).
“I think the market is a bit overly giddy on this CPI number and it’s probably unlikely that the [Federal Reserve] (Fed) will start to ease up and take a less hawkish stance,” The Ambrus Group’s Kris Sidial put forth.
“The increase in risk assets somewhat gives the Fed the green light to be able to move more swiftly with a hawkish tone.”
Accordingly, the Fed’s Mary Daly said it is too early to declare victory in the inflation fight (and rightfully so), signaling, however, that she may support a slower pace of hikes.
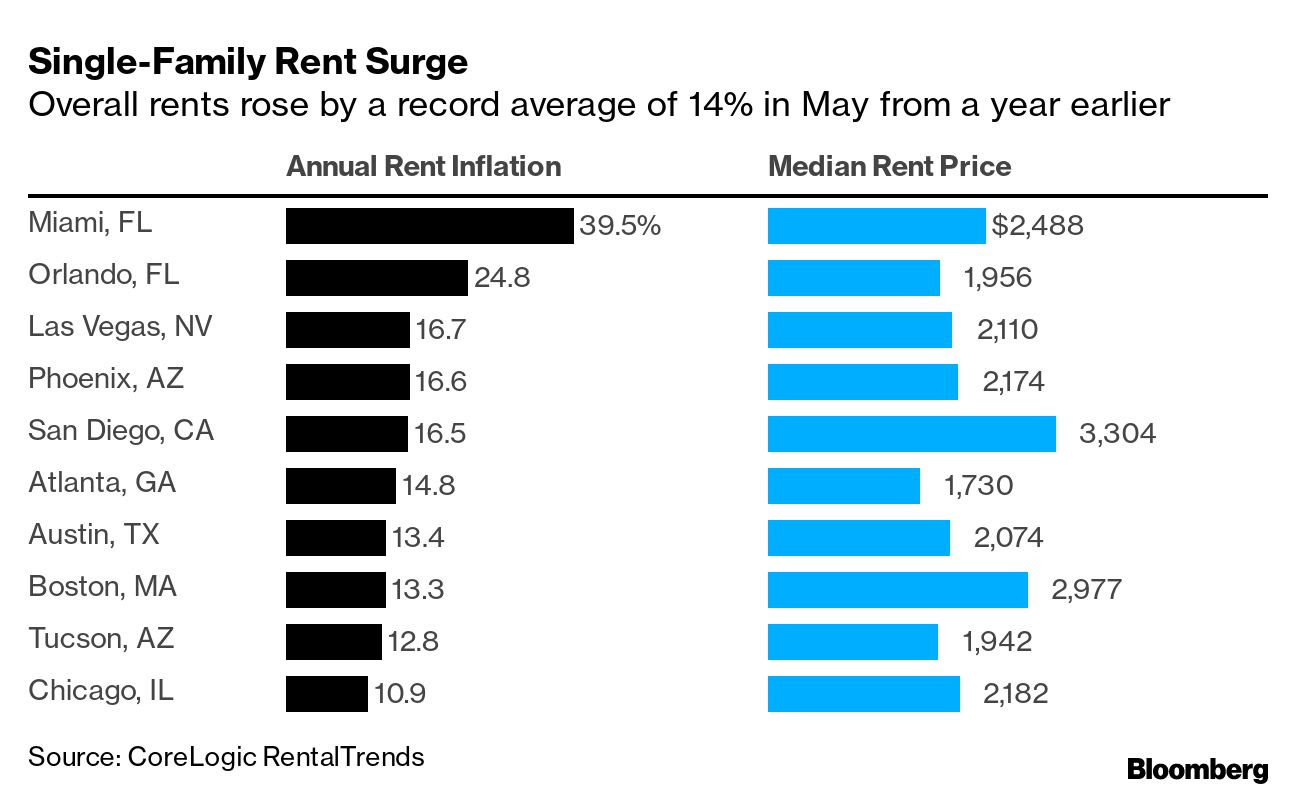
This is as home buyers and renters, in some areas, are seeing large hikes in prices. For instance, per one Bloomberg article, a Miami native saw their rent increase “by $650 to $2,400.00 a month,” forcing them to search for new places to live.
The Ambrus Group’s Sidial adds:
“Inflation is one of those things that is difficult to control when it’s out [of] the bag (historically). I think the Fed understands this and if they have the opportunity to tame it, while not completely obliterating risk assets, it seems like a perfect scenario.”
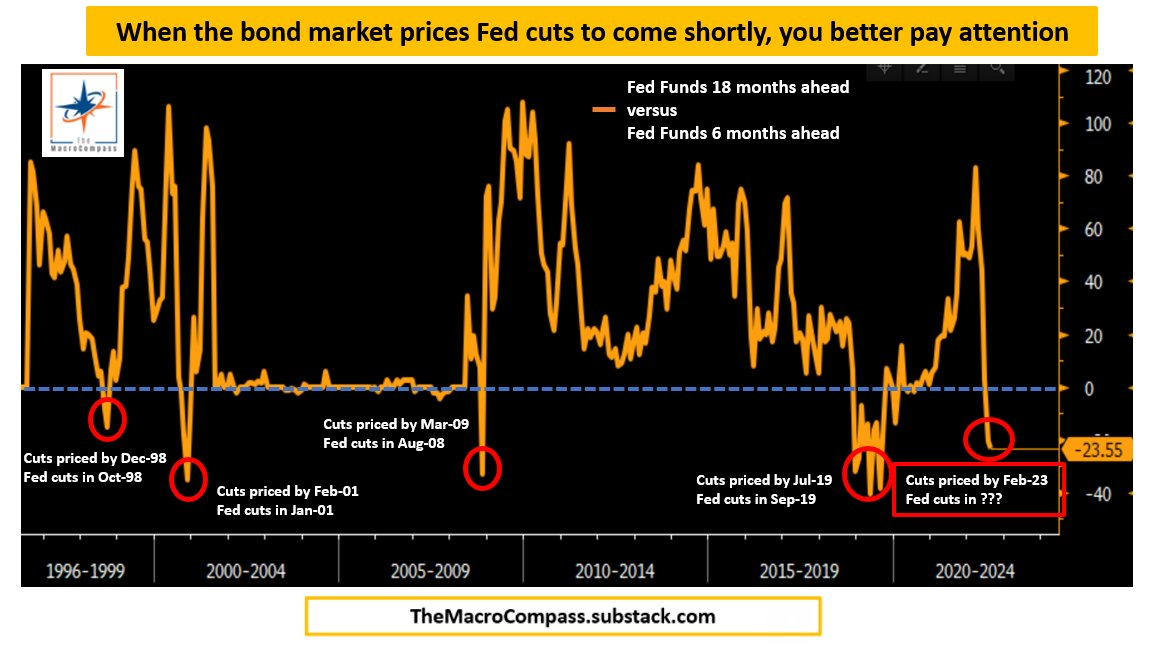
Ultimately, farther out in time, some metrics, which have incredible success in forecasting pivots, show the Fed likely to cut in 2023, shortly following the aggressive hiking cycle.
Graphic: Retrieved from Alfonso Peccatiello of The Macro Compass.
On the topic of (eventual) declines and slowing in the risk assets (like housing), “in most cases today, a borrower with 60 points of equity in their property, even facing moderate declines in their current home price, are not a big default risk,” explains Dan Ivascyn of PIMCO.
“A lot of what we like in the market today is seasoned-type risk that benefits from the multi-years of home price appreciation, and therefore is much less sensitive to what goes on from this point forward.”
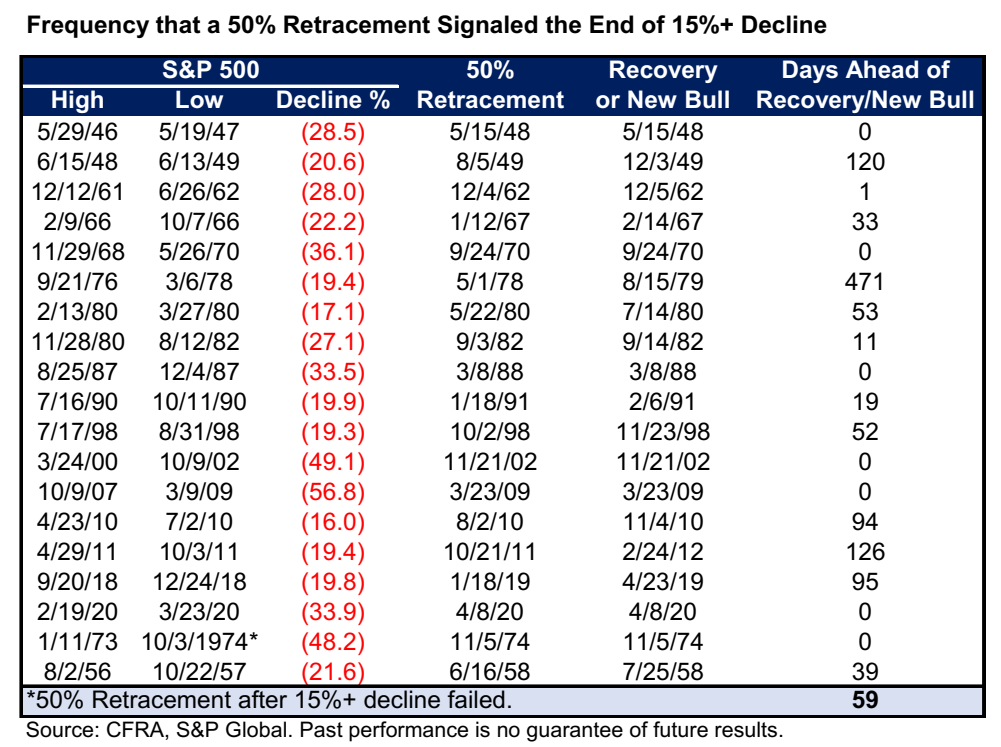
From an S&P 500 (INDEX: SPX) perspective, the index has basically recouped half its losses for the year. This often came after the bear lows were in.
Graphic: Retrieved from Bloomberg.
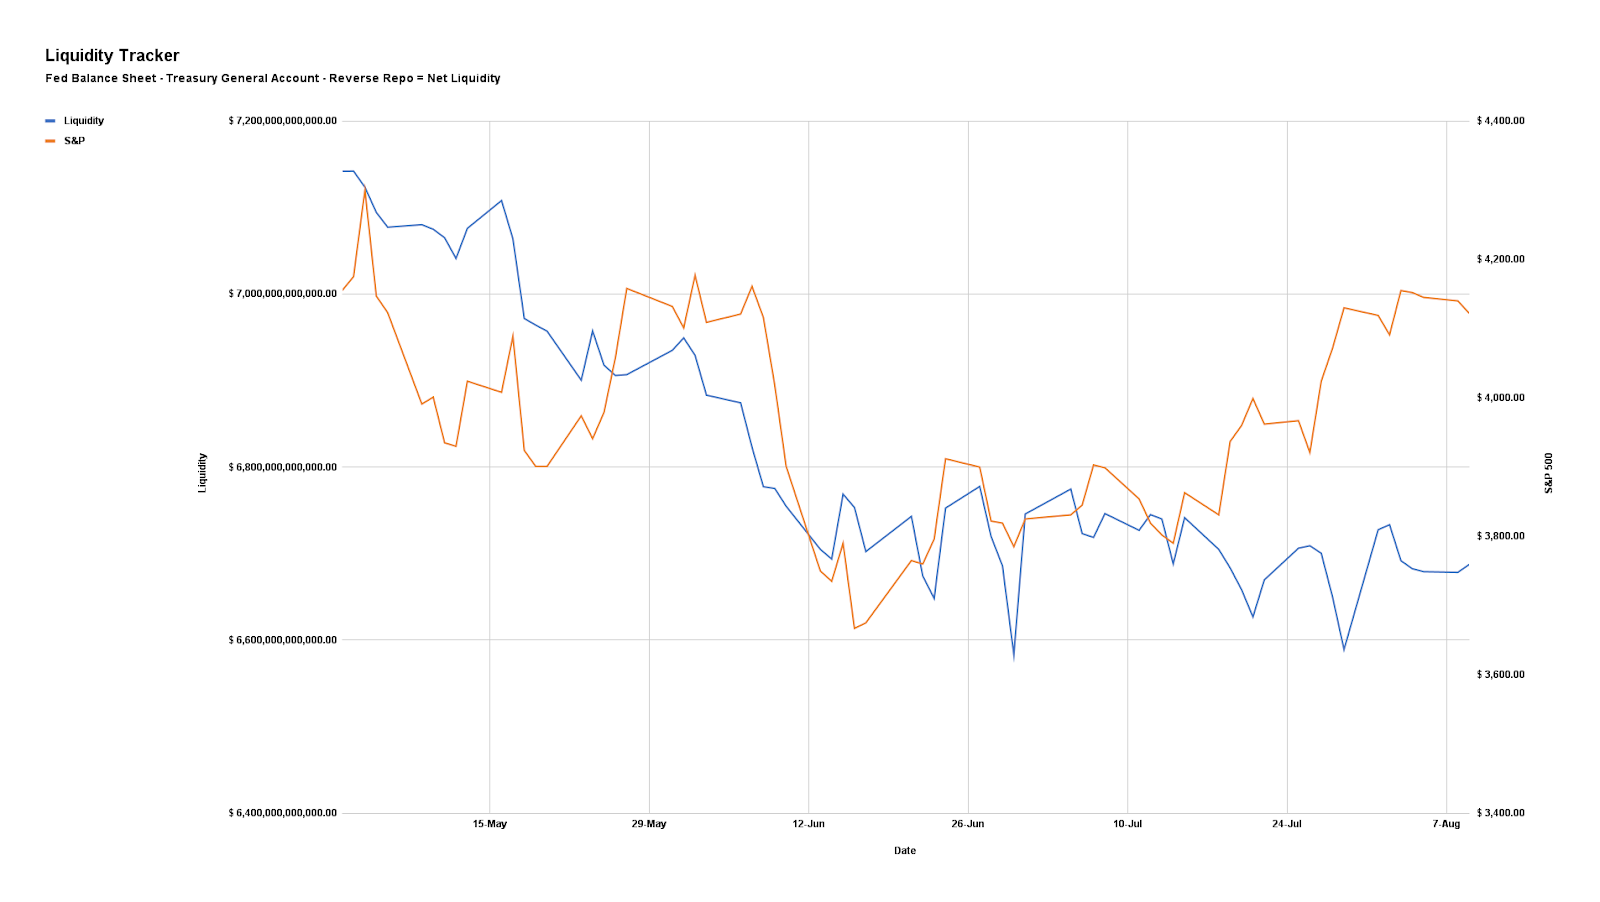
Notwithstanding, here’s our updated liquidity tracker that is monitoring the “preeminent driver of markets during the post-crisis decade.”
Graphic: Via Physik Invest. Data compiled by @jkonopas623. Fed Balance Sheet data, here. Treasury General Account Data, here. Reverse Repo data, here. NL = BS – TGA – RRP.
Positioning
As of 7:15 AM ET, Thursday’s expected volatility, via the Cboe Volatility Index (INDEX: VIX), sits at ~1.04%. Net gamma exposures increasing may promote tighter trading ranges.
Given where realized (RVOL) and implied (IVOL) volatility measures are, as well as skew, it is beneficial to be a buyer of options structures (i.e., replacing static directional exposures or delta with those that are dynamic) tied to the broader measures we follow like the S&P 500 (given increased average stock correlation and lower return dispersion).
The reason why?
Per SpotGamma: “From an options perspective, a lot of the boost from volatility compression has played out. With implied volatility at a lower bound, it may be opportune to replace static delta bets for those that are dynamic (i.e., long option exposures) and have less to lose in this lower volatility environment.”
“In a case where market participants see the Fed keeping its commitment to aggressive monetary policy action, negative delta options exposures may outperform static short equity (bets on the downside).”
Technical
As of 7:30 AM ET, Thursday’s regular session (9:30 AM – 4:00 PM ET), in the S&P 500, is likely to open in the upper part of a positively skewed overnight inventory, outside of prior-range and -value, suggesting a potential for immediate directional opportunity.
In the best case, the S&P 500 trades higher.
Any activity above the $4,227.75 HVNode puts into play the $4,253.25 HVNode. Initiative trade beyond the latter could reach as high as the $4,275.75 LVNode and $4,303.00 Weak High, or higher.
In the worst case, the S&P 500 trades lower.
Any activity below the $4,227.75 HVNode puts into play the $4,203.00 VPOC. Initiative trade beyond the VPOC could reach as low as the $4,189.25 LVNode and $4,153.25 HVNode, or lower.
Click here to load today’s key levels into the web-based TradingView charting platform. Note that all levels are derived using the 65-minute timeframe. New links are produced, daily.
Graphic: 65-minute profile chart of the Micro E-mini S&P 500 Futures.
Definitions
Volume Areas: A structurally sound market will build on areas of high volume (HVNodes). Should the market trend for long periods of time, it will lack sound structure, identified as low volume areas (LVNodes). LVNodes denote directional conviction and ought to offer support on any test.
If participants were to auction and find acceptance into areas of prior low volume (LVNodes), then future discovery ought to be volatile and quick as participants look to HVNodes for favorable entry or exit.
POCs: POCs are valuable as they denote areas where two-sided trade was most prevalent in a prior day session. Participants will respond to future tests of value as they offer favorable entry and exit.
MCPOCs: POCs are valuable as they denote areas where two-sided trade was most prevalent over numerous day sessions. Participants will respond to future tests of value as they offer favorable entry and exit.
Volume-Weighted Average Prices (VWAPs): A metric highly regarded by chief investment officers, among other participants, for quality of trade. Additionally, liquidity algorithms are benchmarked and programmed to buy and sell around VWAPs.
About
After years of self-education, strategy development, mentorship, and trial-and-error, Renato Leonard Capelj began trading full-time and founded Physik Invest to detail his methods, research, and performance in the markets.
Capelj also develops insights around impactful options market dynamics at SpotGamma and is a Benzinga reporter.
In no way should the materials herein be construed as advice. Derivatives carry a substantial risk of loss. All content is for informational purposes only.