Good Morning! I hope you had a great weekend and enjoy today’s letter. I would be so honored if you could comment and/or share this post. Cheers!
Risk appetite in the last months was fueled by the emergence of a “goldilocks disinflation thesis,” describes Marko Kolanovic of JPMorgan Chase & Co. This thesis envisions a no-recession scenario where central banks cut rates early, especially in the lead-up to elections.
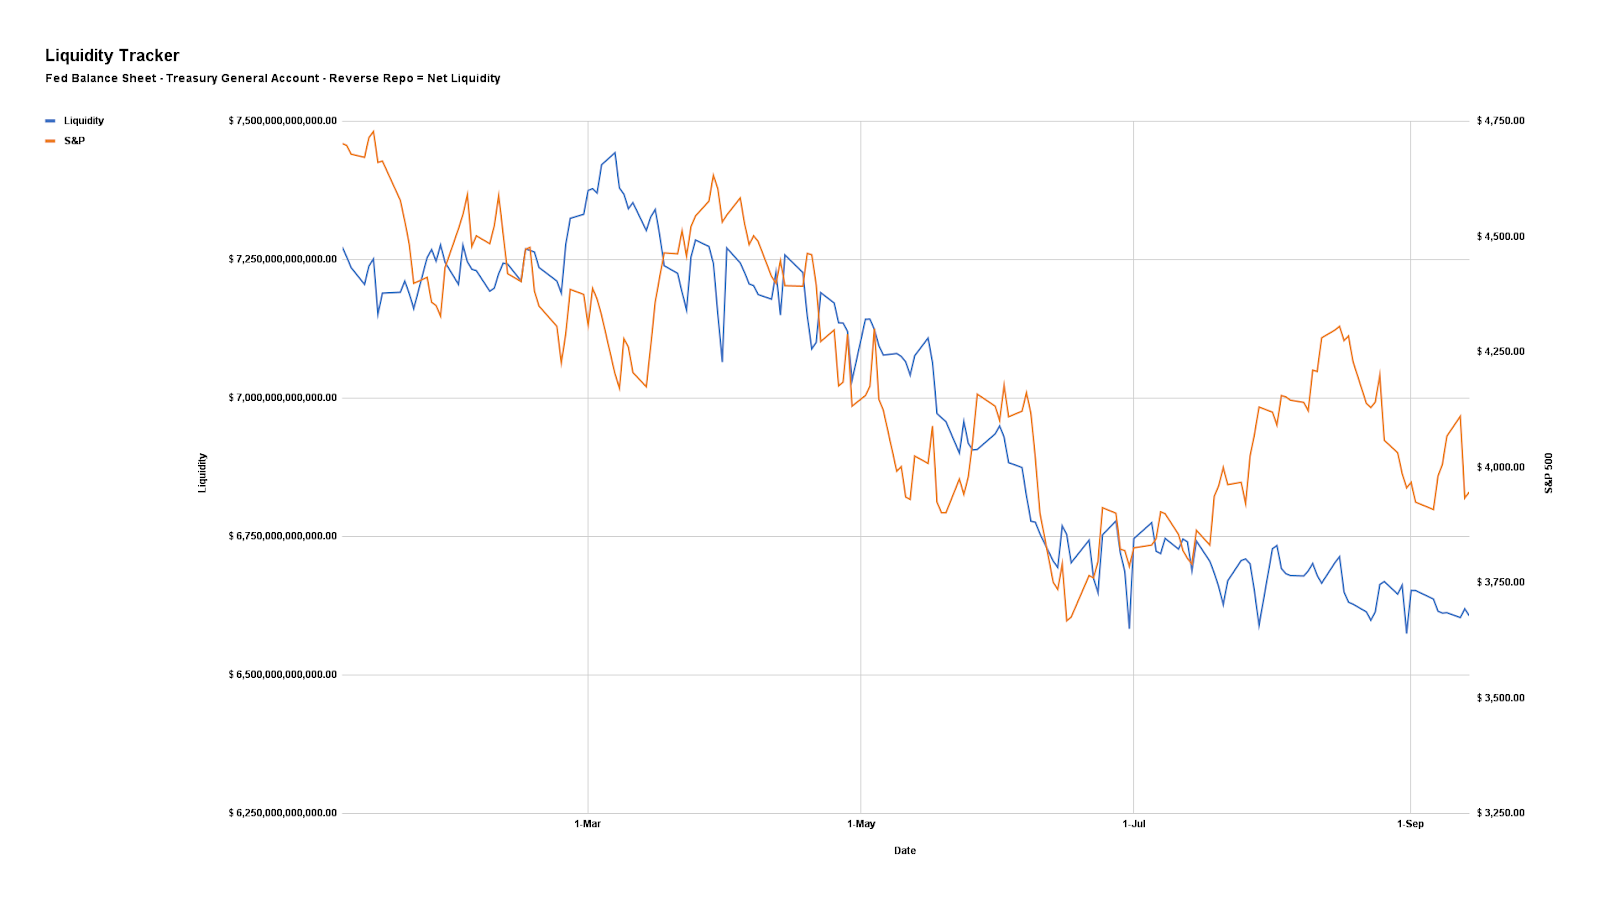
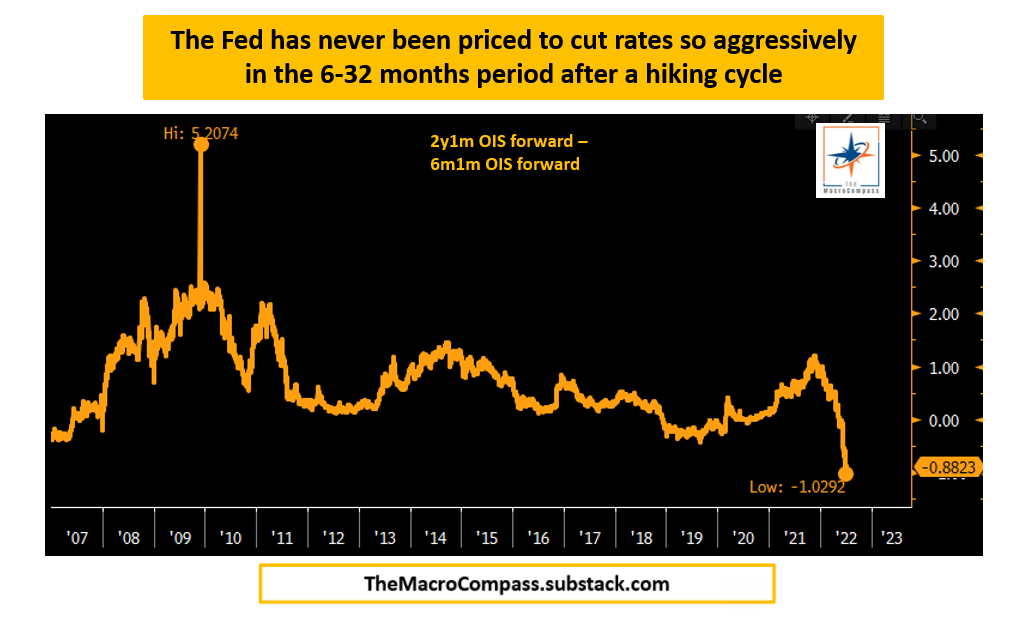
The market is banking on such anticipatory movement by the Federal Reserve, pricing five rate cuts and the target interest rate moving from 525-550 to 400-425 basis points by year-end. With the backdrop of easing liquidity conditions through 2025 and continuing economic growth, equity investors are positioning for a broader rally. This has led to churn and a loss of momentum.

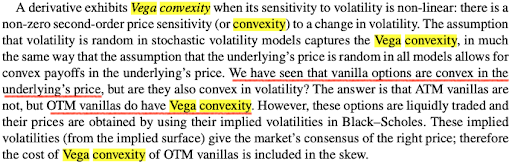
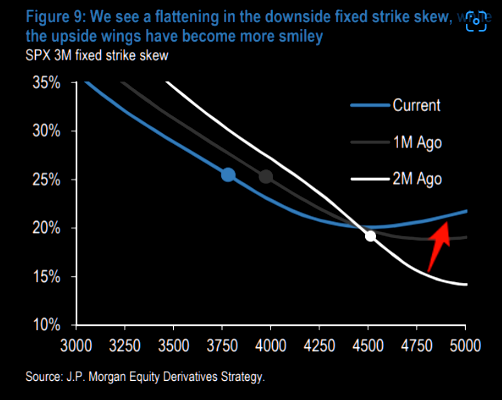
Though historical trends encourage optimism, Kolanovic is concerned markets are overlooking geopolitical events, such as the Houthi shipping attacks, exercises near the Suwałki Gap, and Russia’s testing of electronic warfare. Despite these potential disruptors, atypically low volatility skew and implied correlation indicate a lack of market responsiveness and positioning for less movement.
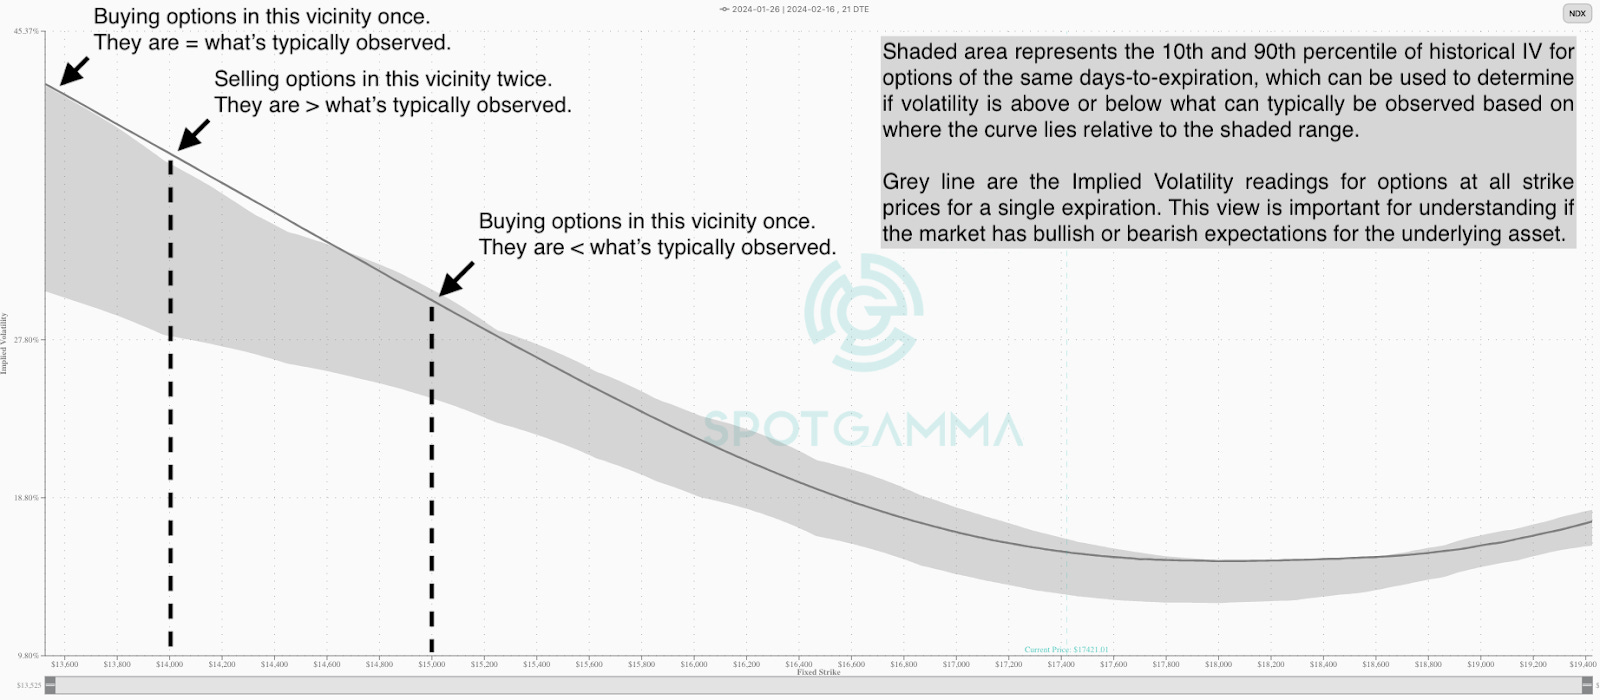
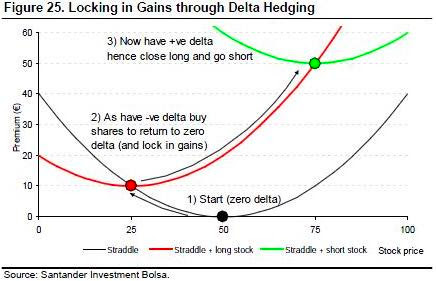
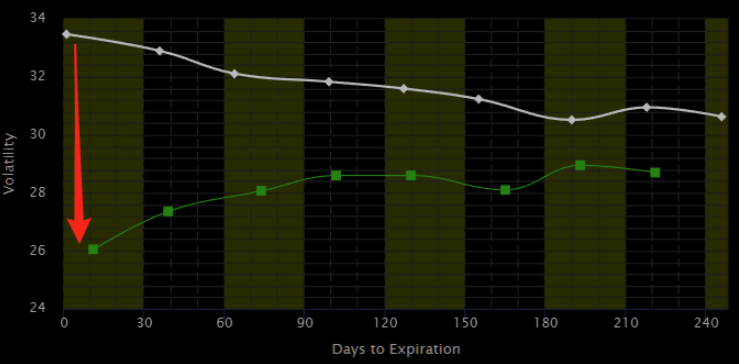
Recall skew reflects a scenario where increased market volatility disproportionately impacts farther away strike options due to losses from more frequent delta rebalancing in a moving market, leading option sellers to assign higher implied volatility to those strikes to compensate for increased risk. The relationship between index volatility and its components involves both individual volatilities and correlation, with implied correlation as a valuable indicator for pricing dynamics between index options and their components and trading volatility dispersion.
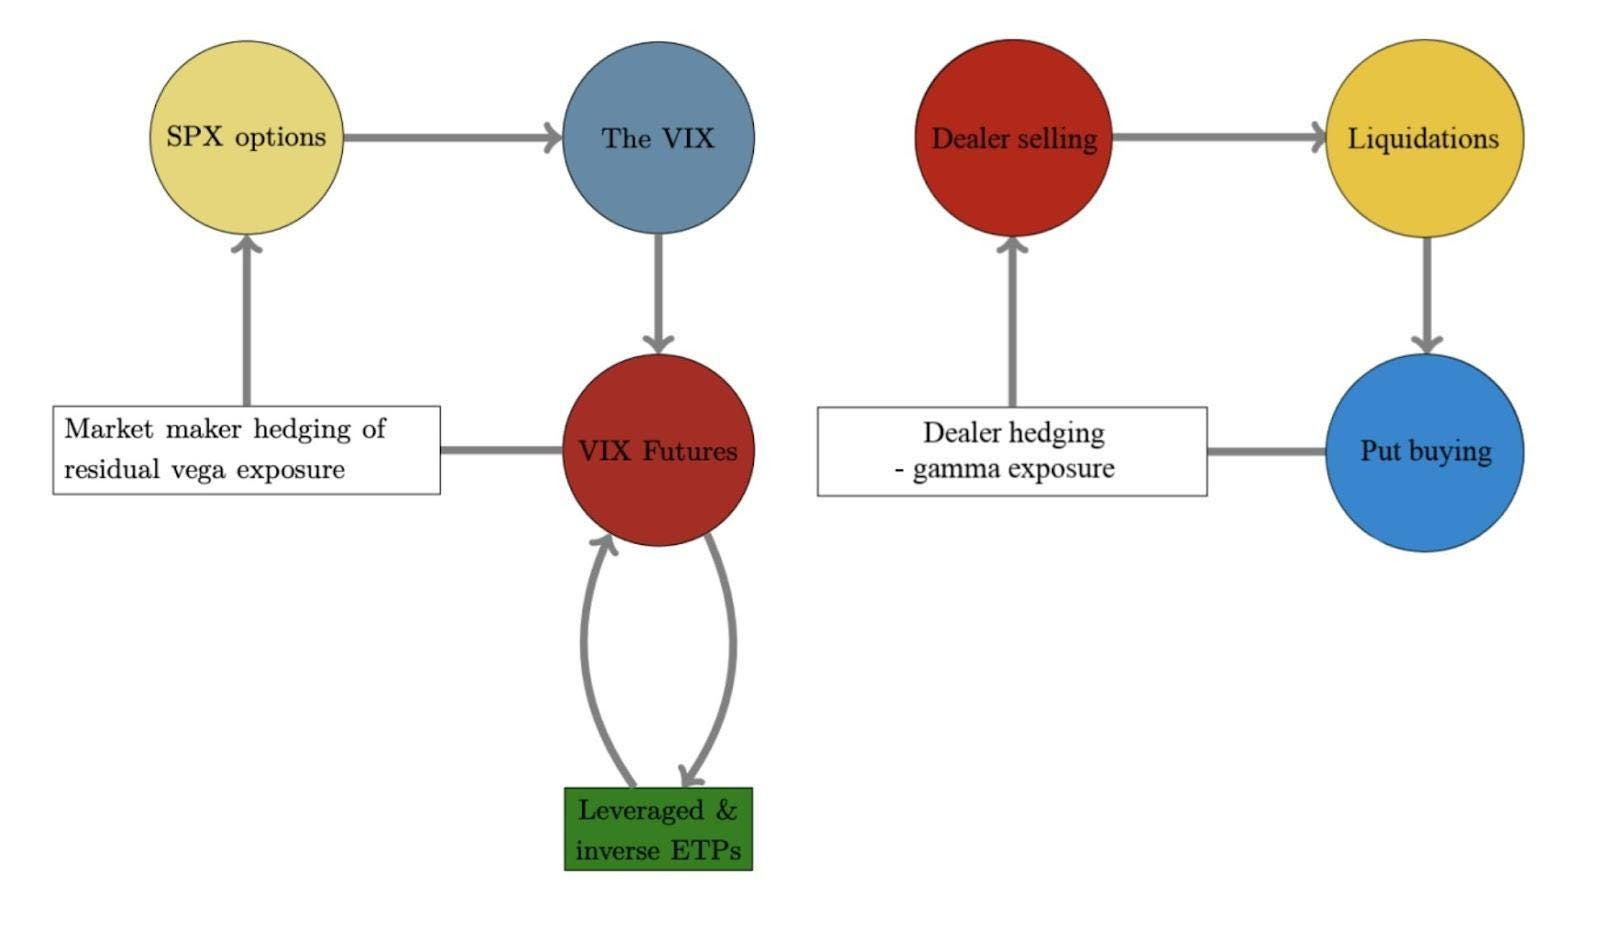
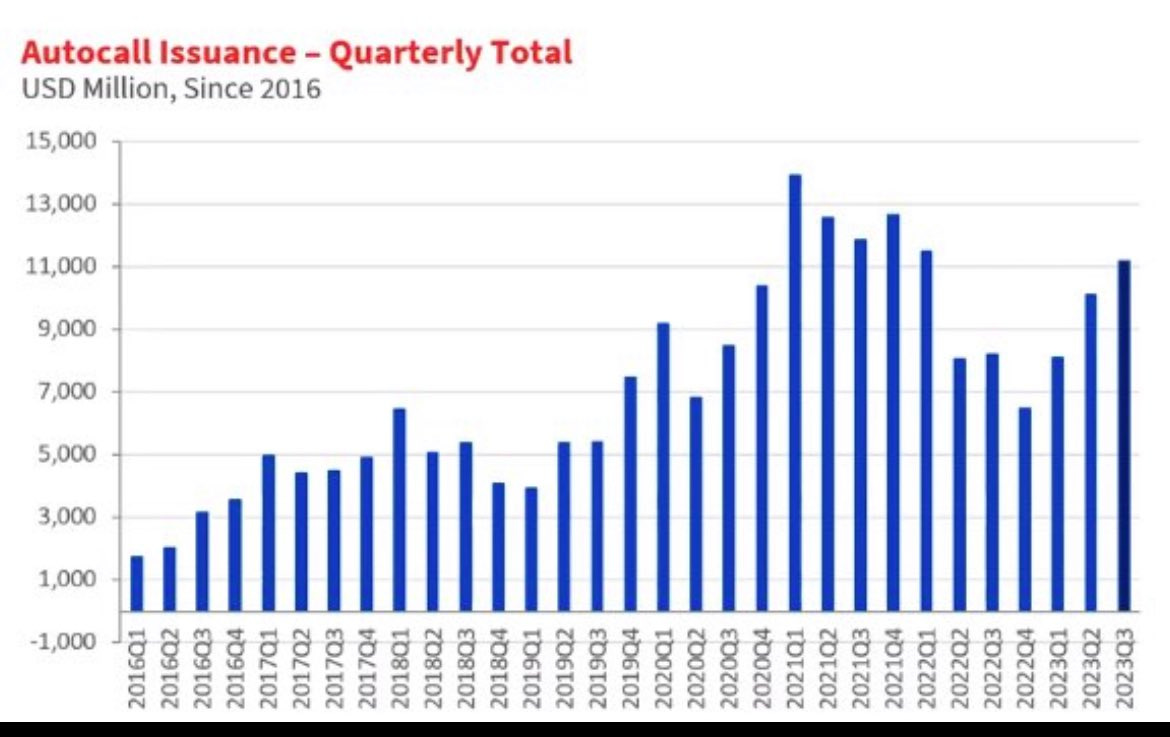
Appearing on The Market Huddle, Kai Volatility’s Cem Karsan emphasized the impact of more structured product issuance and investor volatility selling on index levels, describing how it pins the index and lowers correlation. When a dealer, bank, or market maker on the other side owns options, they need to buy the market when it goes down and sell when it goes up, keeping the index tight and realized volatility low. Much less of this, or even the opposite, is happening in single stocks, so they aren’t experiencing the same level of suppression.
“As dealers buy and sell index exposure, market makers will attempt to keep the index level and the underlying basket in line via arbitrage constraints,” Newfound Research well explained in their Liquidity Cascades paper. “If dealer hedging has suppressed index-level volatility, but underlying components are still exhibiting idiosyncratic volatility, then the only reconciliation is a decline in correlation.”
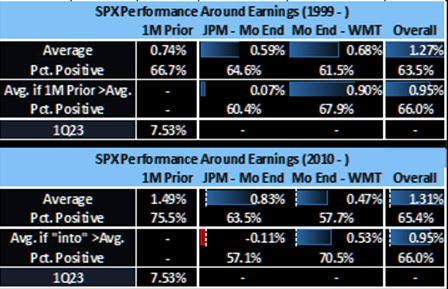
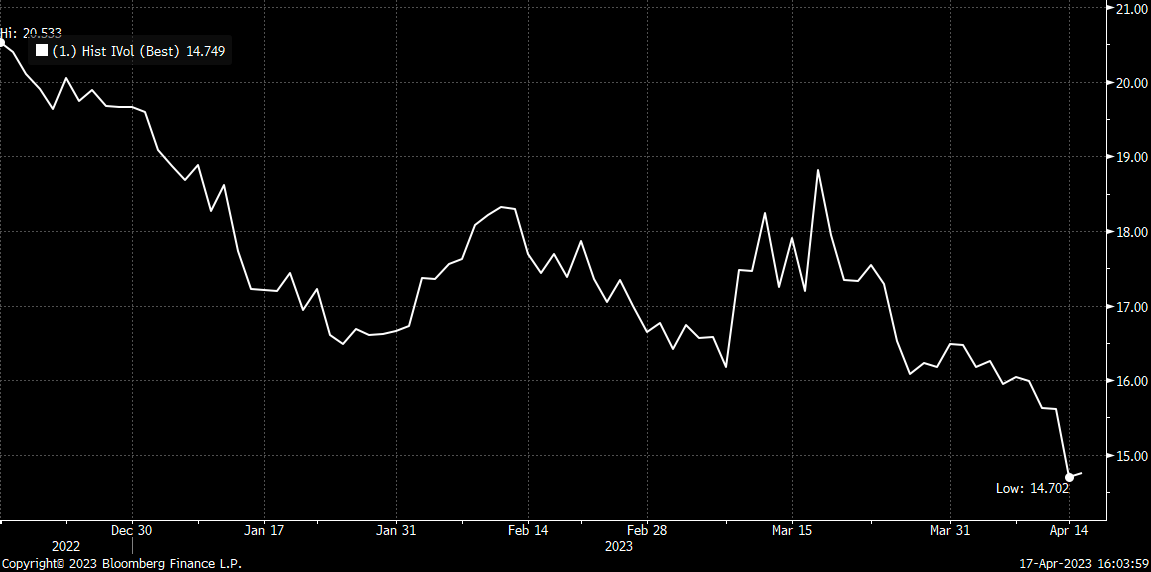
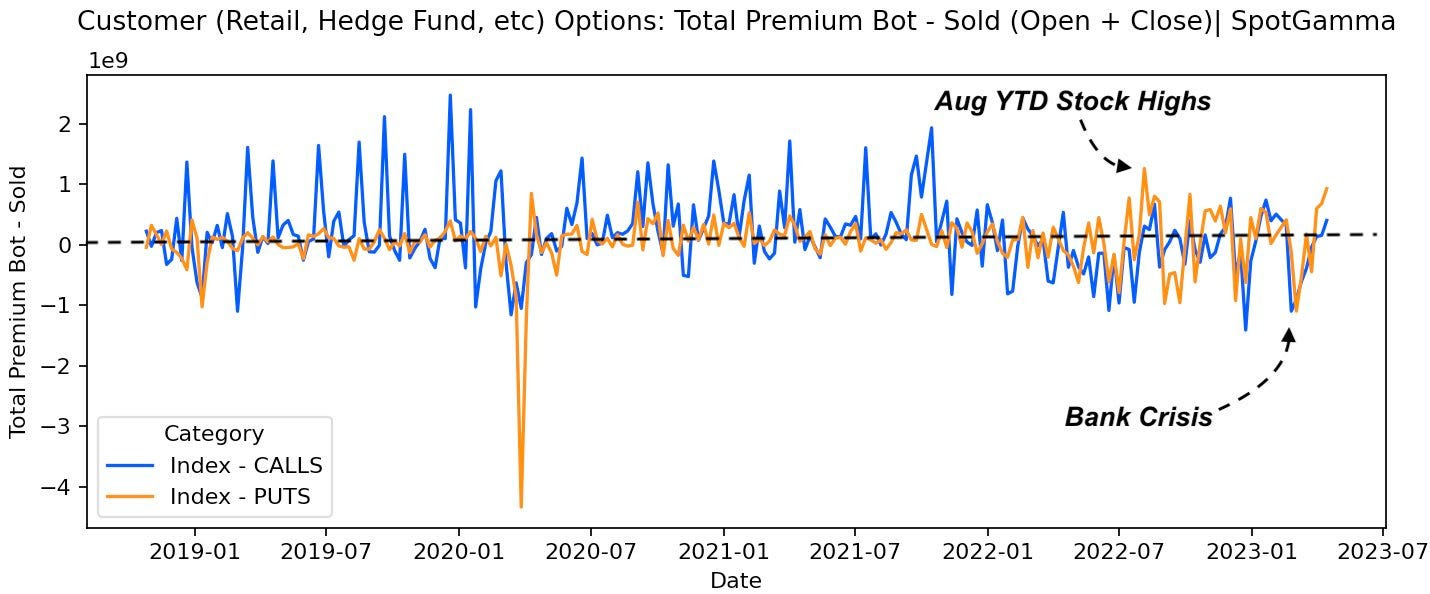
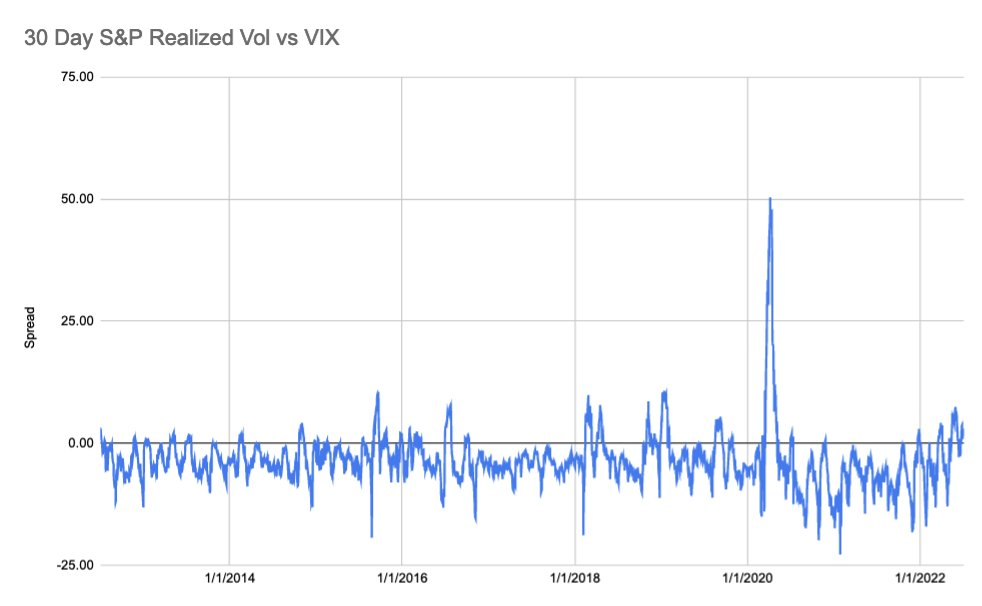
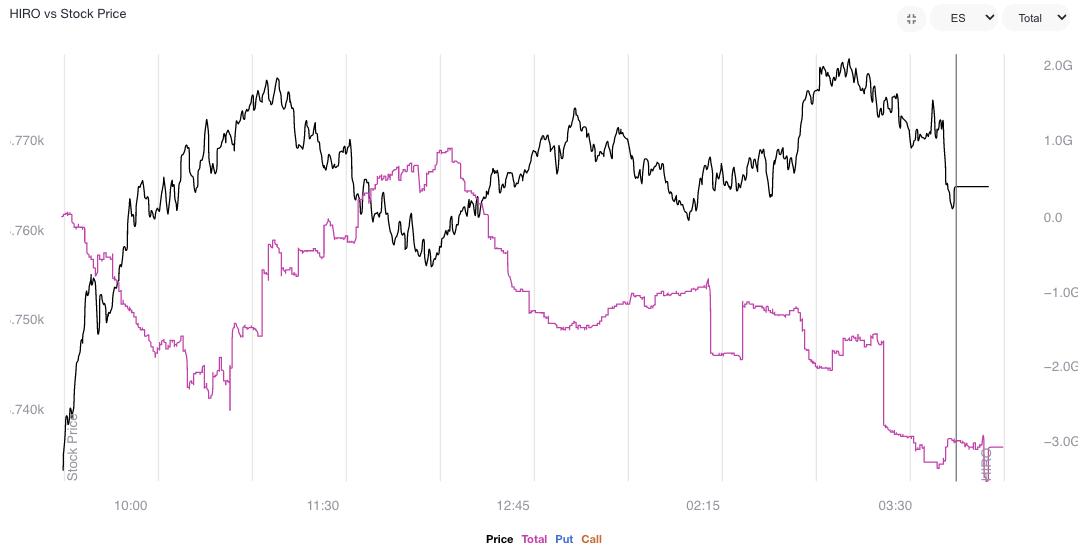
SpotGamma’s Brent Kochuba weighs in, noting low correlation typically aligns with interim stock market highs, presenting a potential cause for caution. Examining data since January 2018, Kochuba points out that the SPX’s average close-to-close change is 88 basis points, with the open-to-close average at 70 basis points. This analysis suggests the current SPX implied volatility (IV) is relatively low. While low IV levels can persist, the concern arises as current readings hint at overbought conditions.
“These low IVs can last for some time, but the general point here is that current readings are starting to suggest overbought conditions as index vols are priced for risk-less perfection, and single stock vols expand due to upside call chasing.”

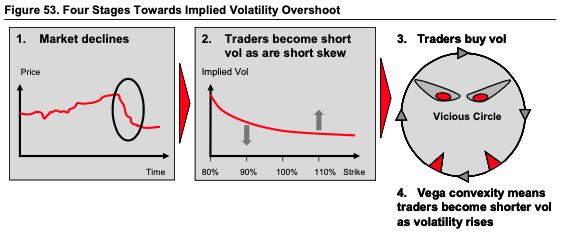
Nomura Cross-Asset Macro Strategist Charlie McElligott explains selling volatility, which continues to attract money as it’s been profitable, is a stabilizing trade in most cases. Kris Sidial, Co-Chief Investment Officer at The Ambrus Group, warns it may end spectacularly in his most recent appearances. The situation in China is a cautionary example, where stock volatility triggered a destructive selling cycle as market participants grappled with structured product risk management.

Accordingly, for those who perceive a meaningful chance of movement, there is value in owning options, Goldman Sachs Group says, noting they expect more movement than is priced.

Karsan, drawing parallels to the unwind of short volatility and dispersion trade from February to March of 2020, says the still-crowded trade can be compared to two sumo wrestlers or colossal plates on the Earth’s core exerting immense pressure against each other. While the trade may appear balanced and continue far longer, the accumulated pressures pose significant risks.

Major crashes happen when entities must trade volatility and options. Often, the trigger is the inability to cover the margin and meet regulatory requirements, causing a cascading effect.
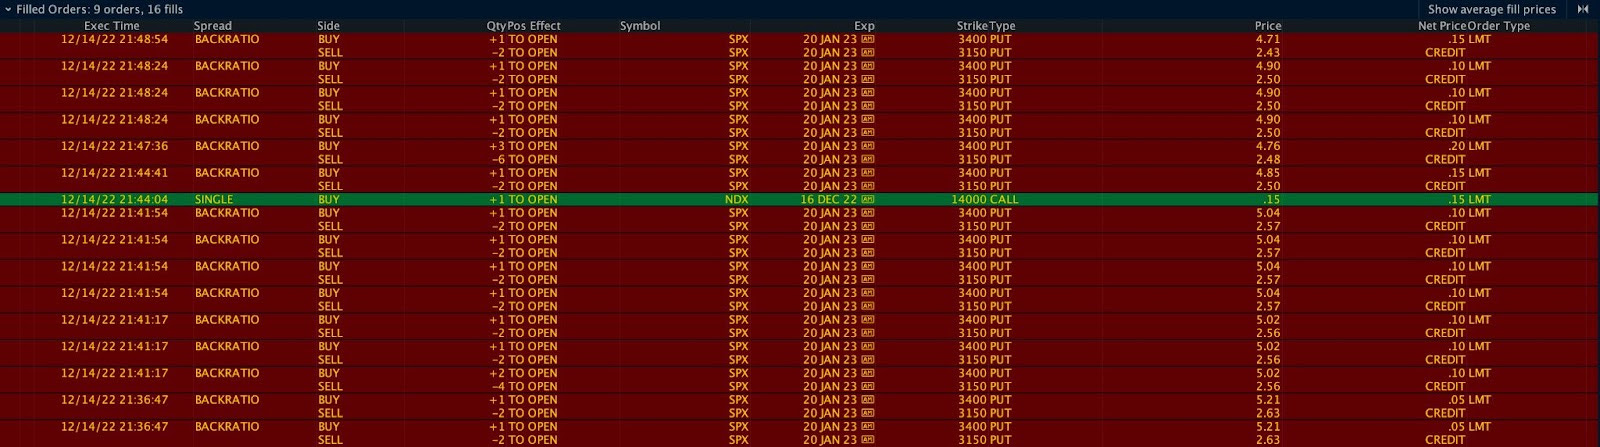
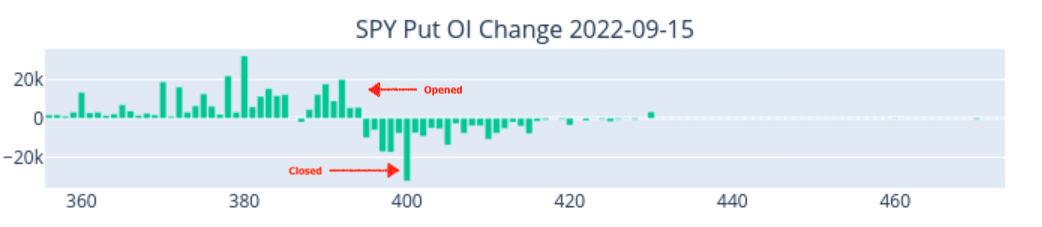
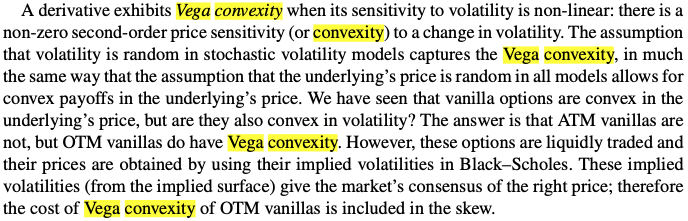
Karsan, drawing on 25 years of experience, notes a precursor to a crash is a weakening supply of margin puts, particularly the highly convex and far out-of-the-money ones. These options play a significant role during stressful market periods, acting as indicators and drivers of impending crashes. The focus is on their convexity rather than whether they will be in the money, as the margin requirements become a determining factor in their impact on market dynamics. History shows a minor catalyst can lead to a dramatic unwind, turning one week to expiry $0.05 to $0.15 S&P 500 put options into $10.00 overnight.
“Prior to the XIV crash day, … going into the close the last hour, we saw nickel, ten, and five-cent options trade up to about $0.50 and $0.70. They really started to pop in the last hour. And then, the next day, we opened up and they were worth $10.00. You don’t see them go from a nickel to $0.50 very often. If you do, don’t sell them. Buy them, which is the next trade.”

Setting aside the pessimistic narrative, the current scenario favors continued ownership of risk assets. Cautious optimism surrounds this week’s Quarterly Refunding Announcement (QRA), “depending on how much bill issuance is scaled back and on the absolute funding needs,” CrossBorder Capital explained, coupled with Fed-speak and anticipation of cutting interest rates on falling inflation later this year. Still, according to Unlimited Funds ‘ Bob Elliott, predicting outcomes following this week’s releases lacks an advantage; instead, in this environment of churn, momentum loss, and indicators like low correlation and volatility, last week’s trades for managing potential downside stick out, particularly vis-à-vis volatility skew.