Good Morning! I hope you had a great weekend and enjoy today’s letter. I would be so honored if you could comment and/or share this post. Cheers!
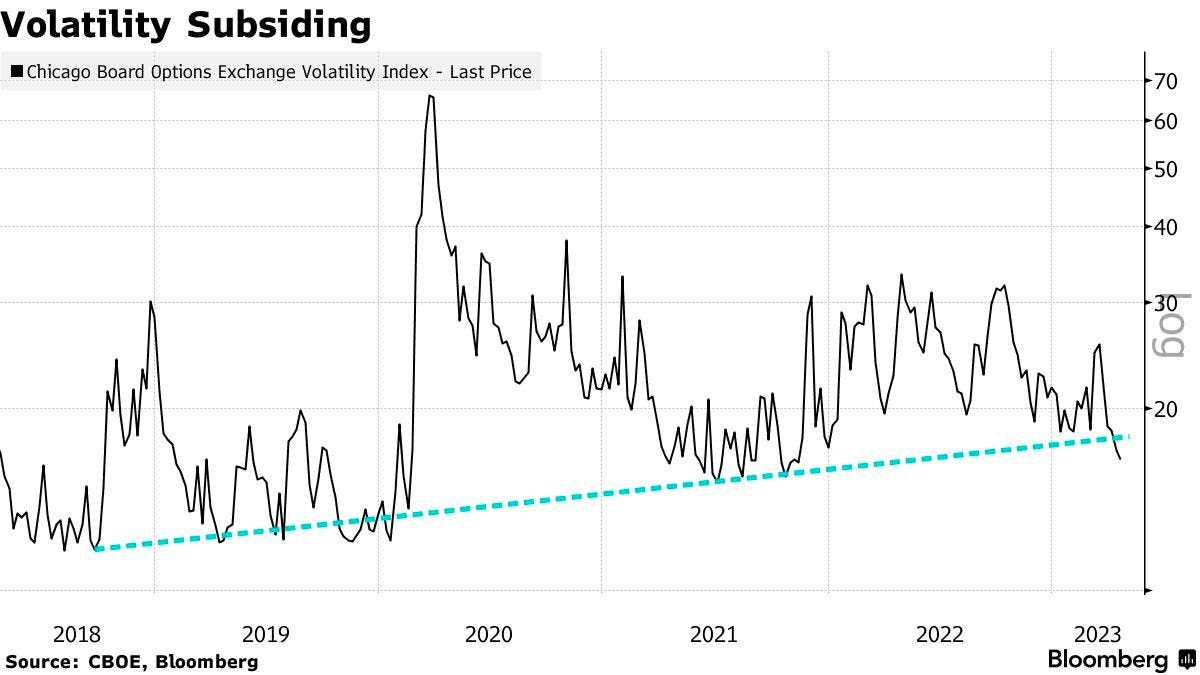
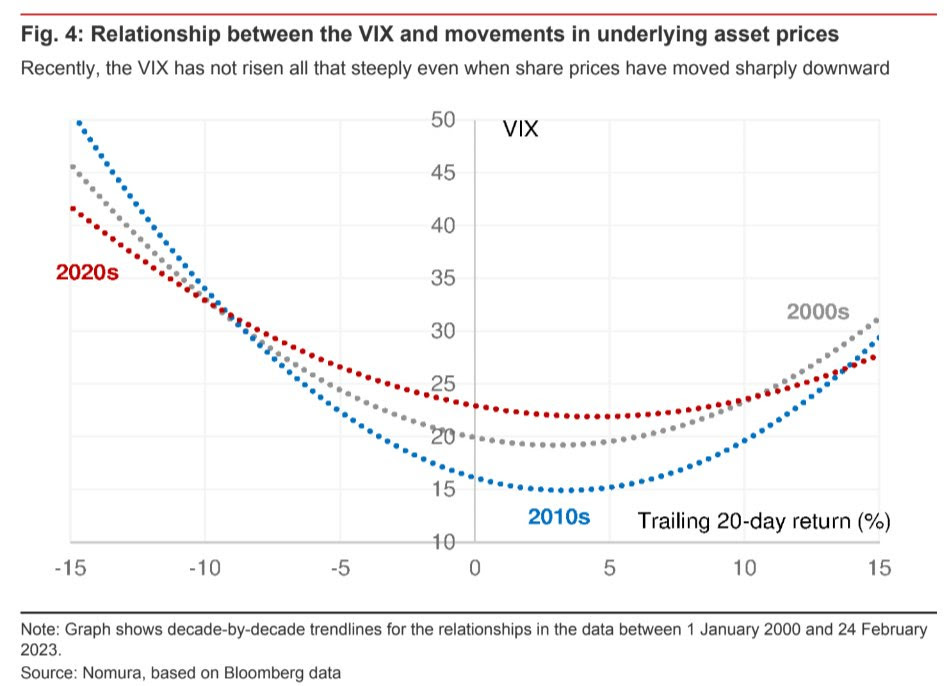
While scrolling through online news, some may relate to the idea that, sometimes, a lot can happen quickly. In other words, “There are decades where nothing happens, and there are weeks where decades happen.” This feeling was especially noticeable during last week’s “Volmageddon” anniversary, when the VIX skyrocketed, causing significant market disruptions. Skeptics and worriers were vocal about everything, from problems in how markets work to possible economic and political troubles.

A highlight was Tucker Carlson’s interview with Russian President Vladimir Putin. Throughout the conversation, besides uncovering insights into the Ukraine conflict’s ties to Poland, it became evident that not only the BRICS nations (Brazil, Russia, India, China, and South Africa) but also other countries like Saudi Arabia, Egypt, Ethiopia, Iran, and the United Arab Emirates, collectively representing over 30% of global GDP and 45% of the world’s population, are diminishing their dependence on the US dollar.

Putin suggested that the US effectively undermines the dollar, misusing its position as the issuer of the world’s primary reserve currency. This shift, previously discussed in our newsletters on January 4 and 5 of 2023, reflects broader changes in the global economy, carrying significant implications for the future. Let’s break down how.
Countries that share ideological alignment with BRICS are actively working to decrease their dependence on the US dollar and mitigate risks associated with (potential) sanctions. One practice involves trading resources for development without relying on US dollars for funding. For example, China securing oil at discounts by utilizing its renminbi currency allows Gulf Cooperation Council (GCC) nations to convert it into investments, development projects, and gold. Further implementing central bank digital currencies (CBDCs) streamlines interstate payments, an alternative to the Western-dominated financial system.
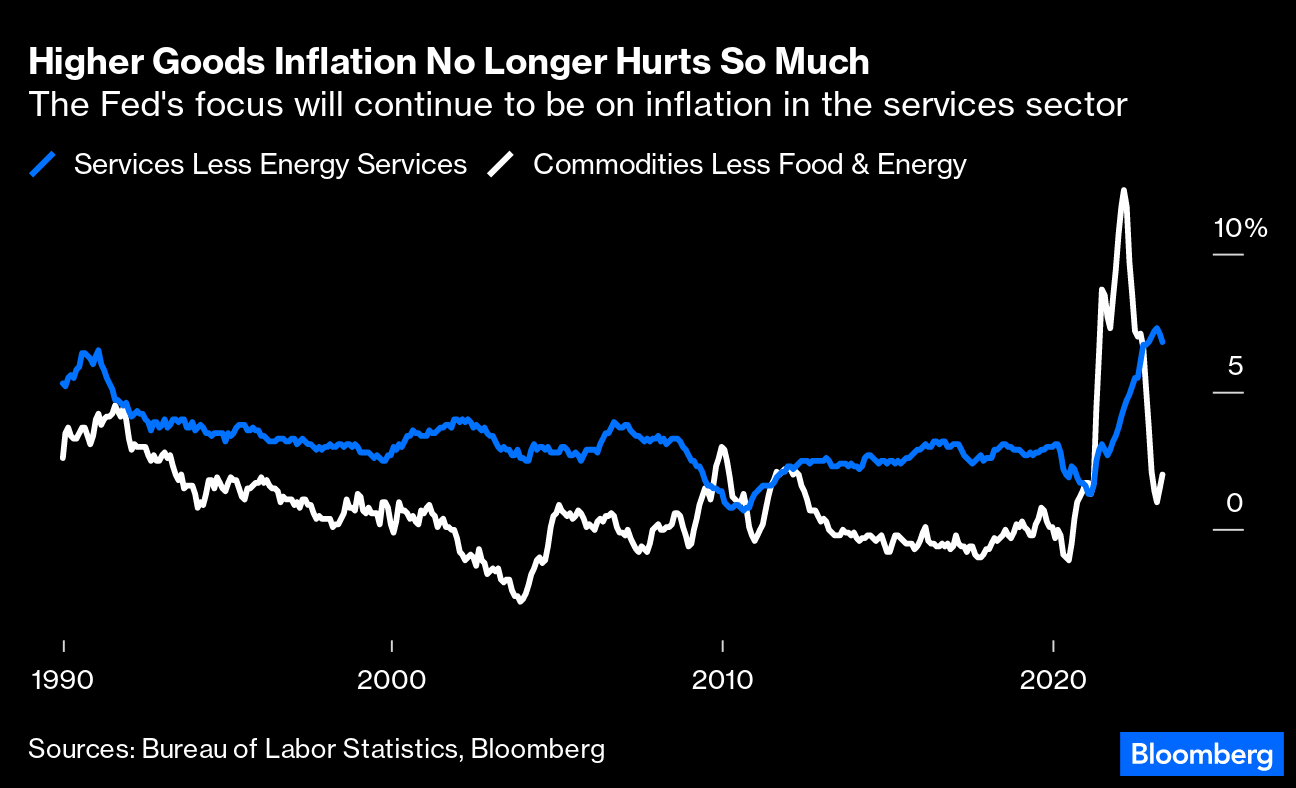
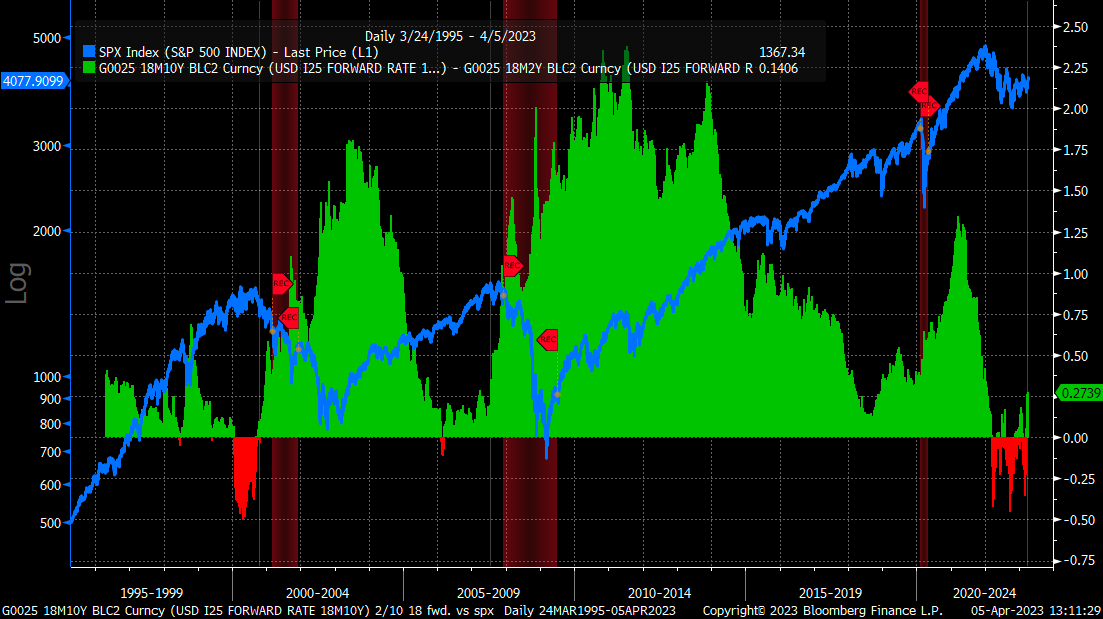
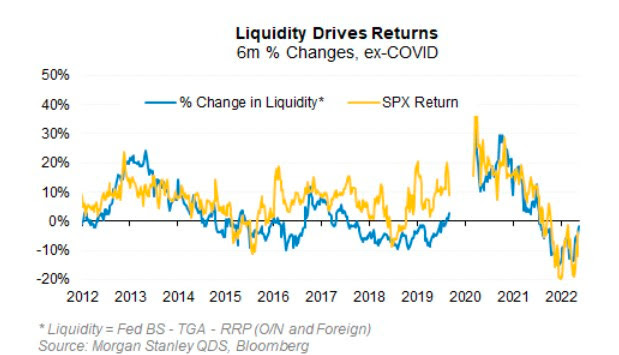
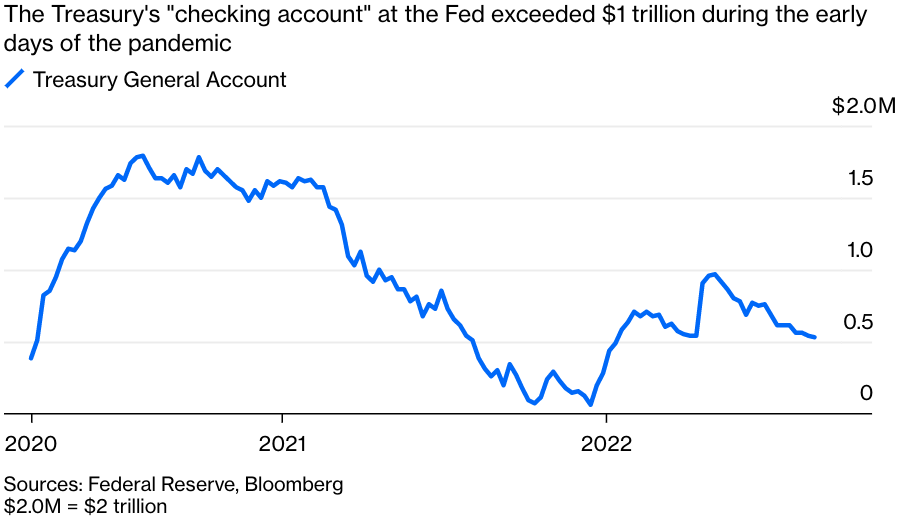
This gradually diminishing dependence on the West complicates challenges like inflation. Nations can boost their weights in currency baskets by encumbering and re-exporting commodities in strict supply. Accordingly, as Zoltan Pozsar shares, “the US dollar and Treasury securities will likely be dealing with issues they never had to deal with before: less demand, not more; more competition, not less.” Monetary policymakers can’t fight this trend alone; instead, for one, Western governments can boost energy production (not just productivity), states Rana Foroohar, global business columnist and associate editor at the Financial Times.
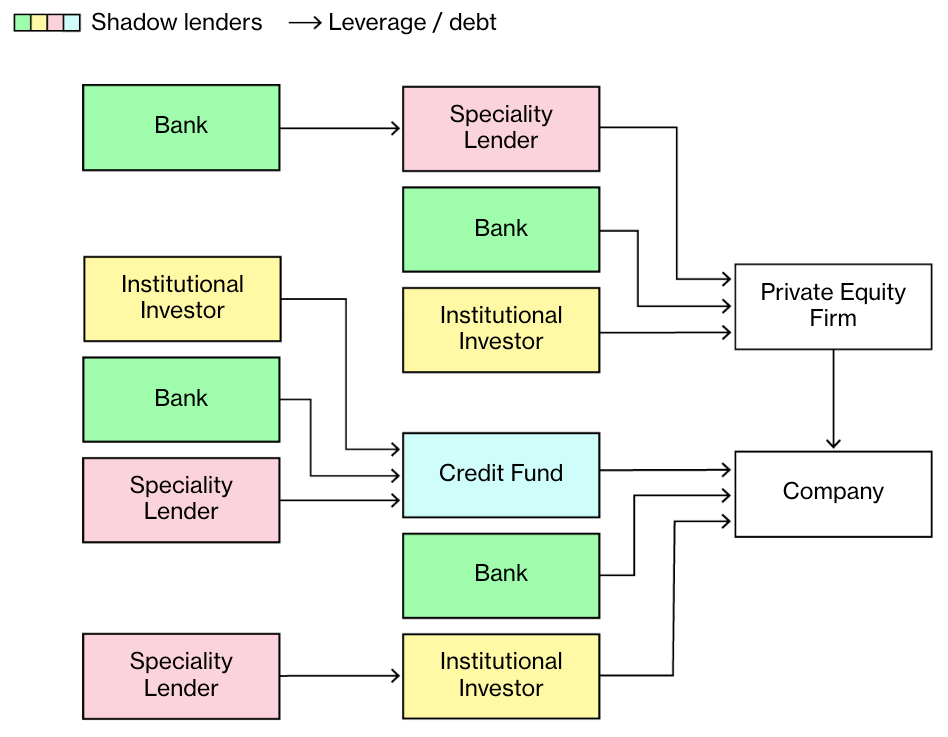
“Petrodollars also accelerated the creation of a more speculative, debt-fuelled economy in the US, as banks flush with cash created all sorts of new financial ‘innovations,’ and an influx of foreign capital allowed the US to maintain a larger deficit,” shared Foroohar. “That trend may now start to go into reverse. Already, there are fewer foreign buyers for US Treasuries. If the petroyuan takes off, it would feed the fire of de-dollarisation. China’s control of more energy reserves and the products that spring from them could be an important new contributor to inflation in the West. It’s a slow-burn problem.”
Regarding the market functioning narratives, David Einhorn, founder of Greenlight Capital, believes markets are fundamentally flawed, blaming the rise of passive investing and algorithmic trading. According to Einhorn, these methods prioritize short-term profits over long-term value creation.
To explain, we consider Nvidia’s case. Over the past five years, its weighting in the S&P 500 increased by 3.7%. This growth was driven by active managers who recognized the company’s value and bought shares, consequently boosting its market capitalization. This increase in market capitalization, in turn, elevated the stock’s weighting in the index.

Passive funds create a problem because they purchase stocks regardless of price when they receive new investments, as Bloomberg’s John Authers explains. Ultimately, “Passive decreases the inelasticity of a stock as it grows in market cap,” Simplify’s Michael Green shares. “Lower inelasticity, more extreme price response to the same volume of flow.”
As a company’s value increases, passive funds buy more of its stock, increasing prices. This trend is particularly concerning in the technology sector, where the flow of funds into passive investments pushes those stocks even further from value, stoking bubble fears.
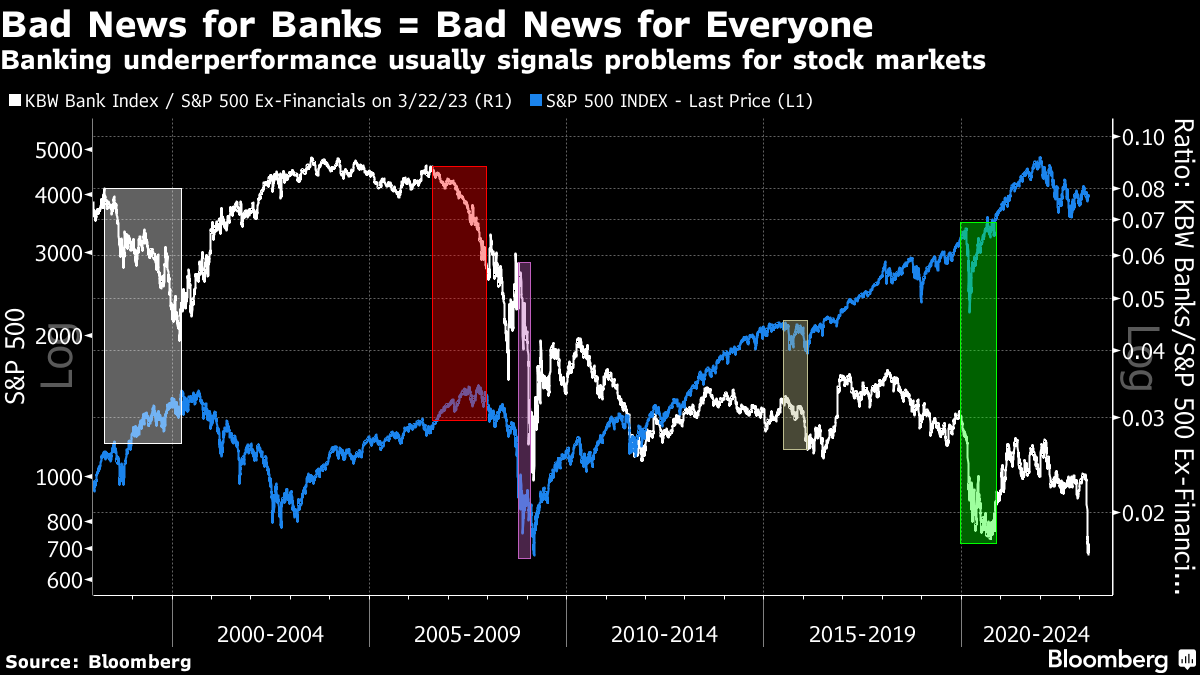
Moreover, weakness beneath the surface is hidden, as seen in the comparison between the stocks above their 50-day moving average and the S&P 500.

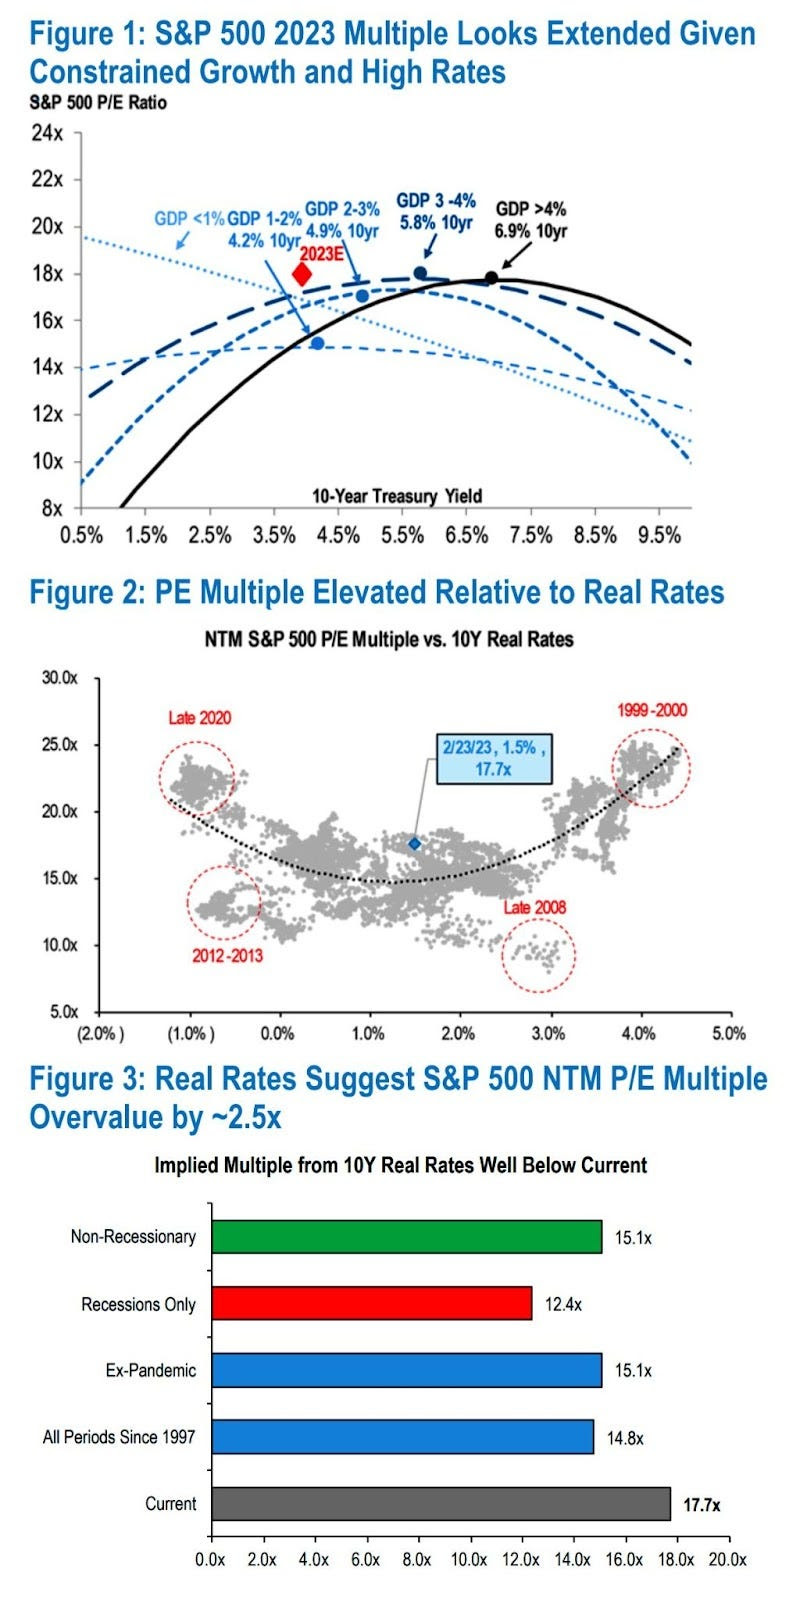
The US stock market is approximately 70% of the world’s total market value, despite the US economy contributing less than 20% to global economic output, Authers adds.
“These valuations cannot make sense,” he elaborates. Markets imply that “over the next 20 years, less than 20% of the world economy will earn three times more profits than the remaining 70%,” Charles Gave of Gavekal Research says. It is a significant multi-decade bet on a small portion of the global economy generating most profits, primarily through the sustained dominance of technology giants.

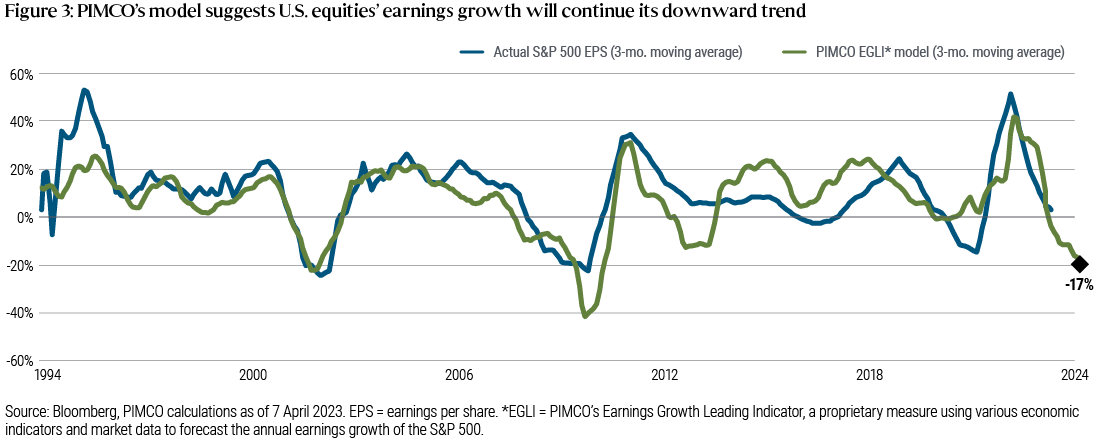
Despite the strength and profitability of these companies persisting, with firms beating earnings estimates by about a margin of 7%, says Nasdaq economist Phil Mackintosh, whether their fundamentals alone justify such continued dominance is questioned.
Still, many experienced fund managers, who would typically bet against tech stocks, are refraining from doing so. Einhorn highlighted the costliness of taking such positions due to passive investing. As a result, his fund has shifted focus towards companies with lower market capitalizations relative to earnings and strong cash flows to support share buybacks.
According to Damped Spring Advisors’ Andy Constan, the trend towards indexation will continue as all investors have not fully embraced passive investing. If everyone were to adopt passive investing fully and no one bought stocks outside the S&P 500, companies not in the index would lose access to the public market, impacting funding for PE/VC markets and capital formation.
Though index investing may eventually face challenges as money moves from expensive stocks to cheaper, non-indexed ones, we can stick with it. Even if active managers do better than the index and counteract the distortions caused by passive investing, many of their stocks are still in those indexes. Again, more of a reason to invest in index funds.
A similar reasoning can be applied to the growing short volatility trade, which the likes of The Ambrus Group’s Kris Sidial have generated much buzz around.
Even though volatility was very low in 2017, the smart move was to sell it. As Sidial explains, volatility can have two modes. If you sold volatility in late 2017 to early 2018 when the VIX was in the 9-11 range, you made money because it tends to cluster. There’s a time when it’s wise for traders to take risks and go against the flow to make profits. However, there’s also a time when the flow is too big, dangerous, and not sensitive to price, and it doesn’t make sense to take that risk by buying low volatility and hoping for a big win, he shared in a recent update.
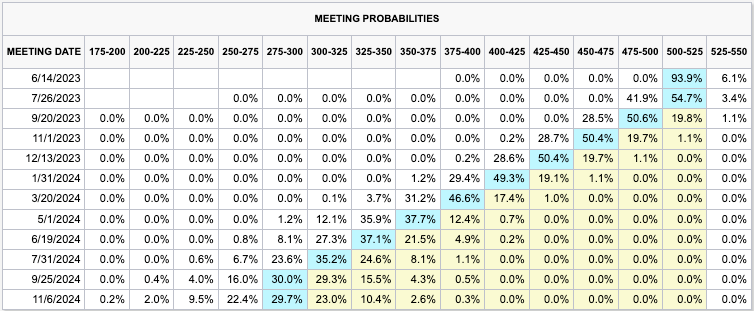
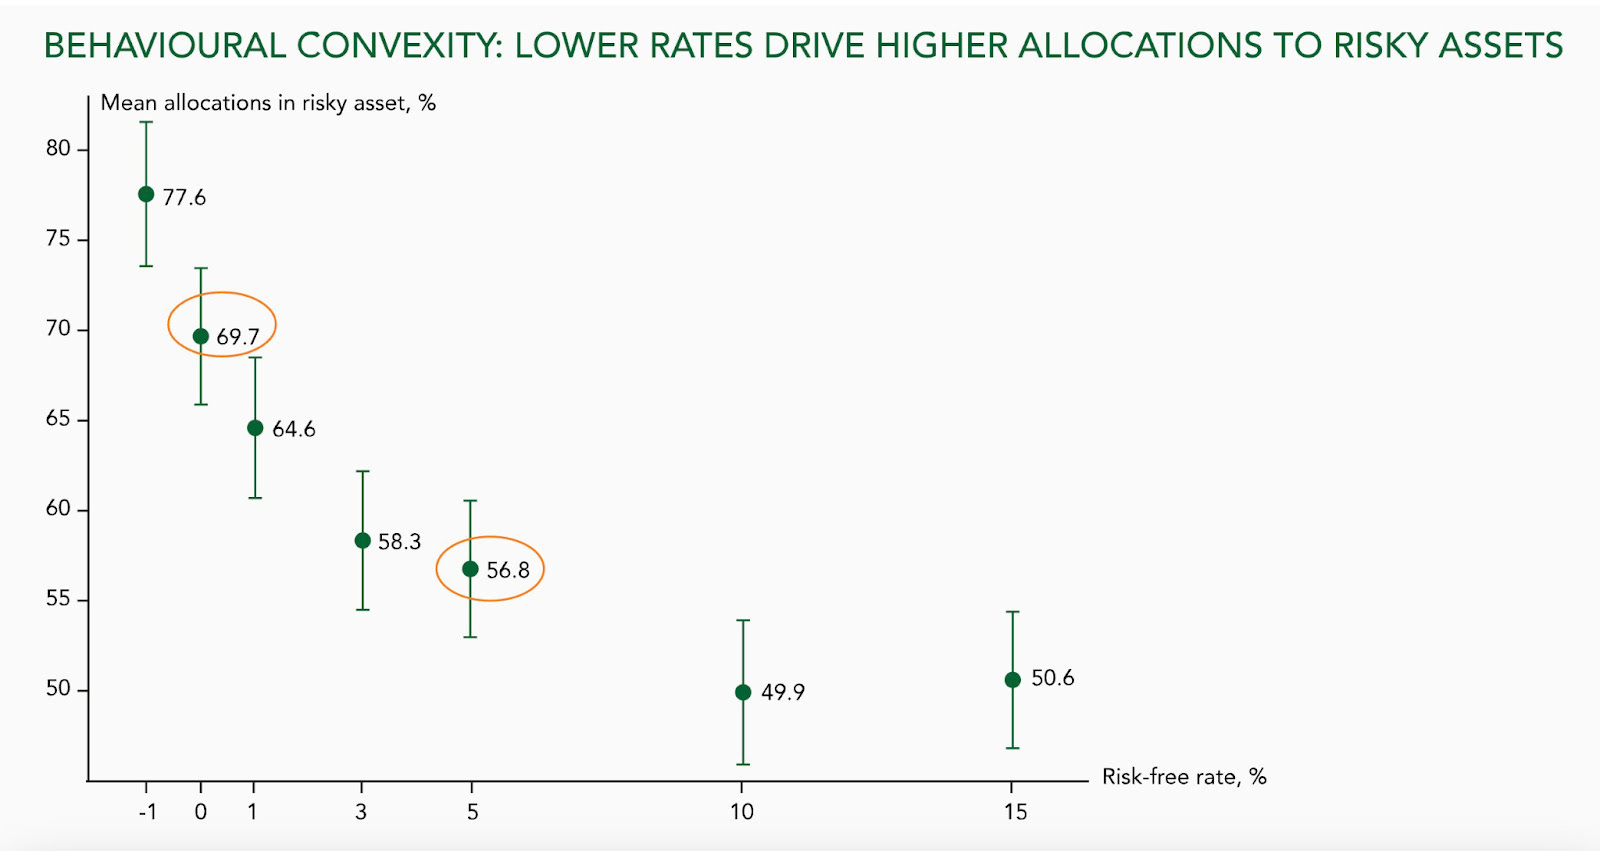
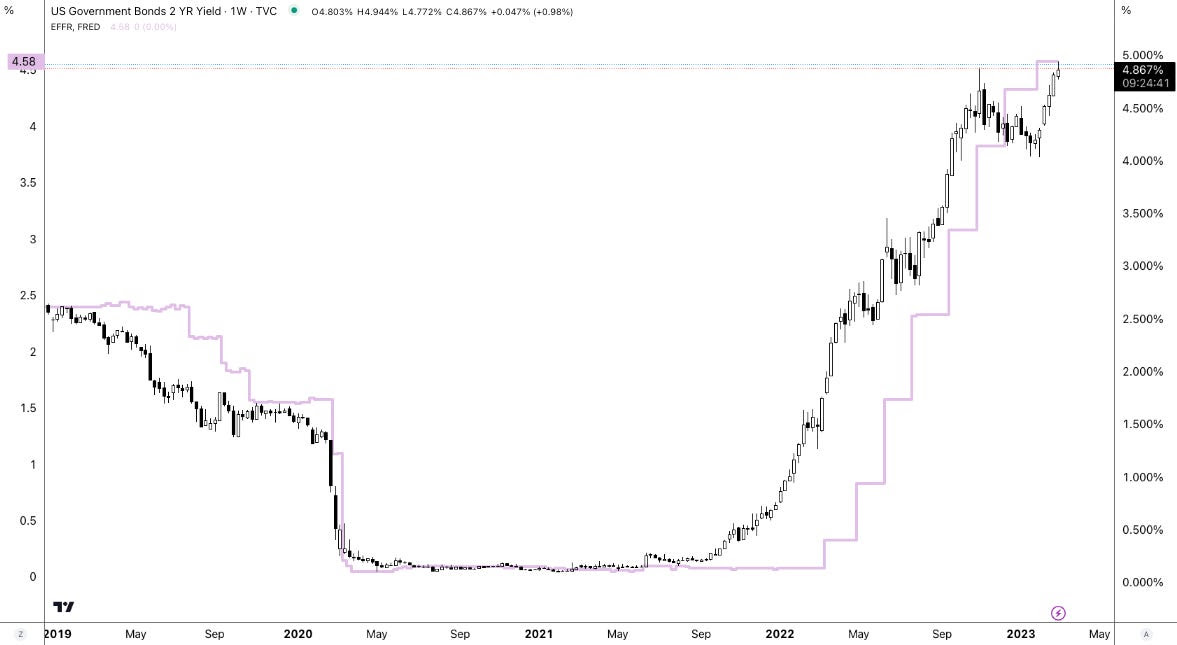
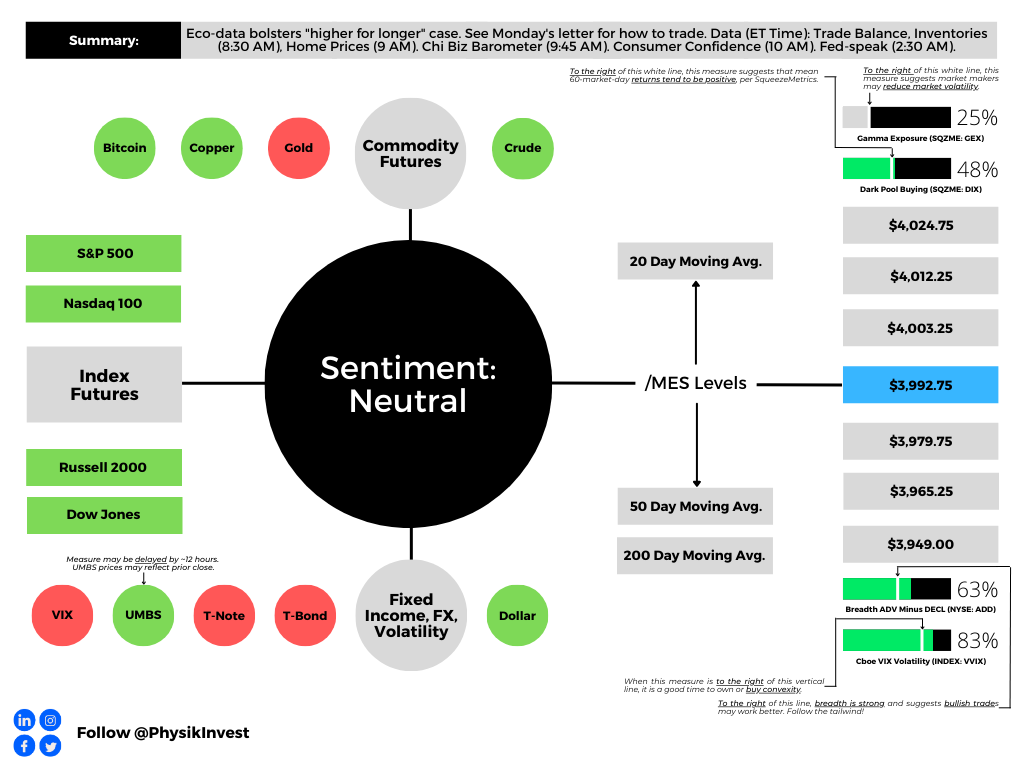
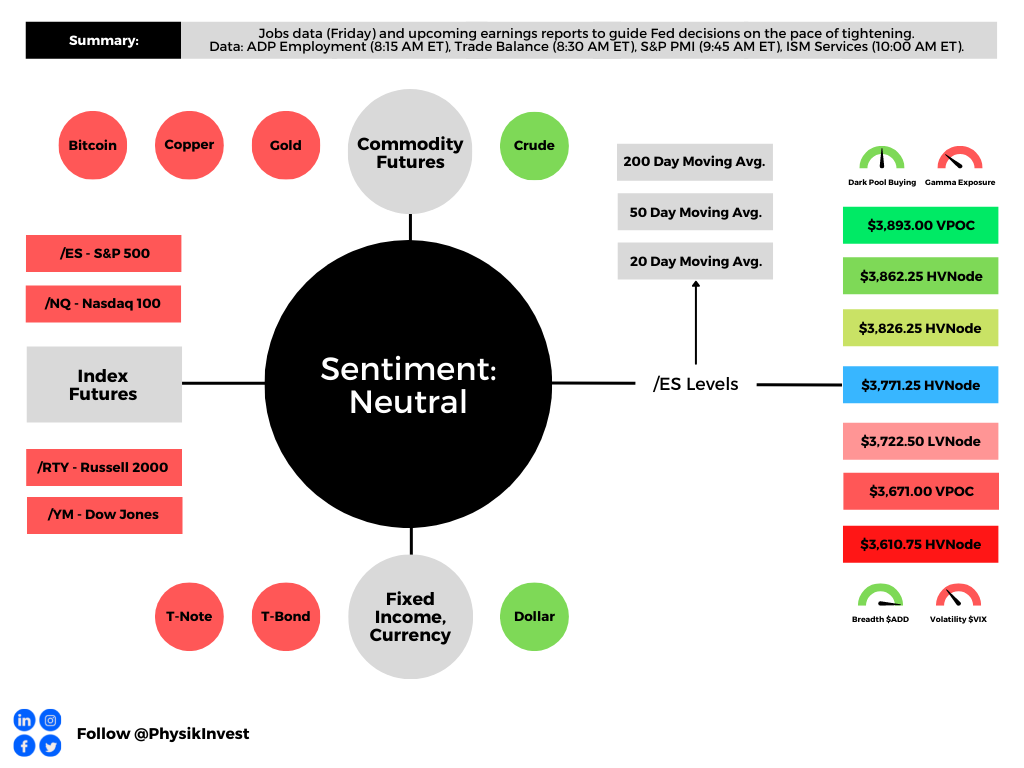
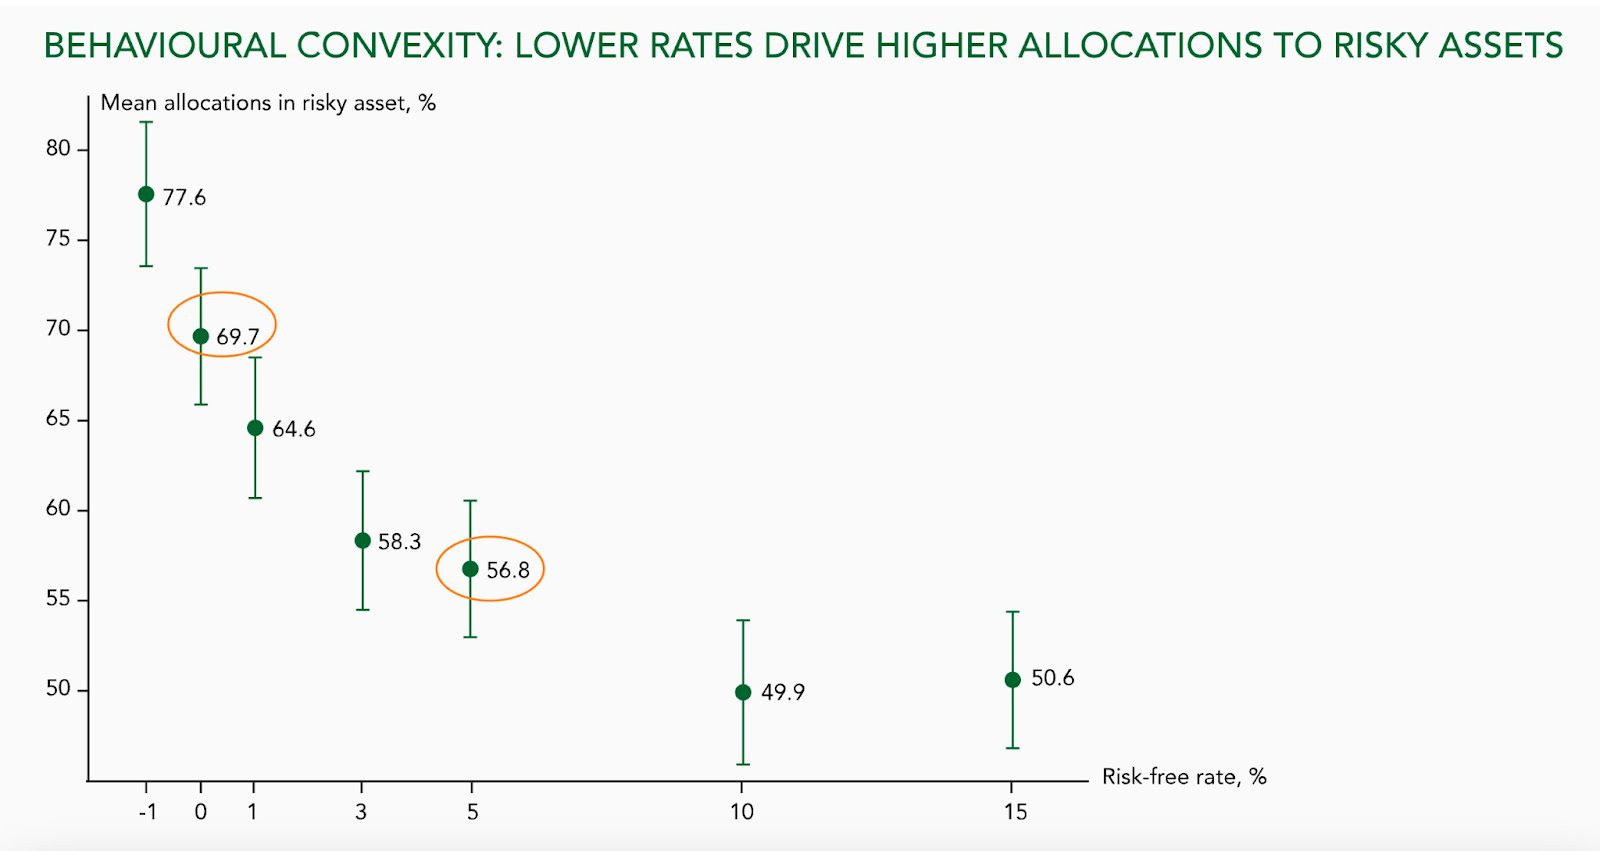
At this point in the newsletter, it’s apparent that timing matters. Manufacturing and employment appear strong, and overall, the economy is in a good place in the short- to medium-term, with above-zero rates contributing to the solid economic growth.

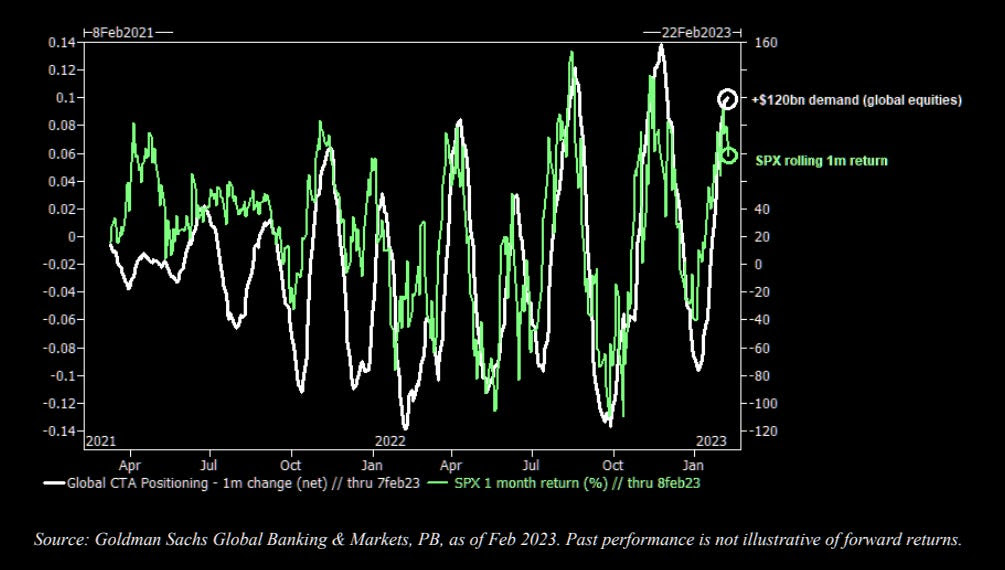
The context states rates and stocks can stay higher for longer. On the flip side, we know volatility can stay lower longer, though its falling from lower and lower levels has less of a positive impact on stocks. Positioning is stretched, and the focus is shifting from worries about missed opportunities to safeguarding against potential downturns.

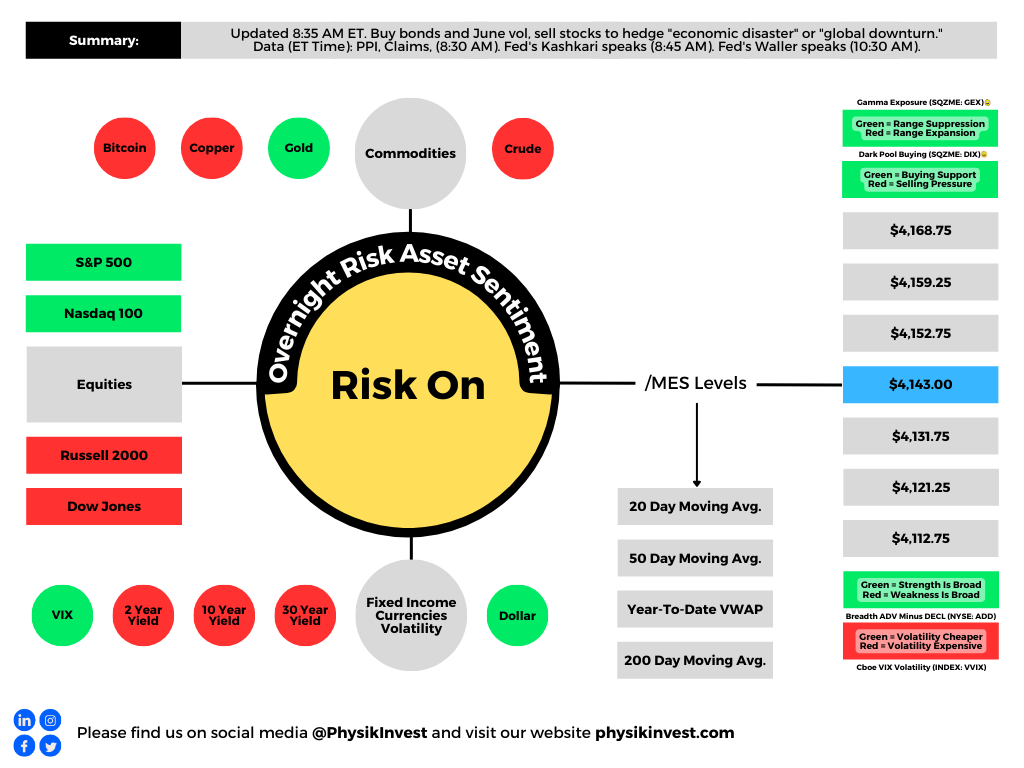
“We tend to see this type of movement before a reversal,” Kai Volatility’s Cem Karsan says, noting that volatility may rise, with the S&P 500 peaking as high as $5,100. “The speed of the move starts getting more accelerated towards the top because people start betting against, saying, ‘this is crazy, these values are too high, and the market needs to come down.’”
What Karsan describes is a more combustible situation arising from the market and volatility syncing.

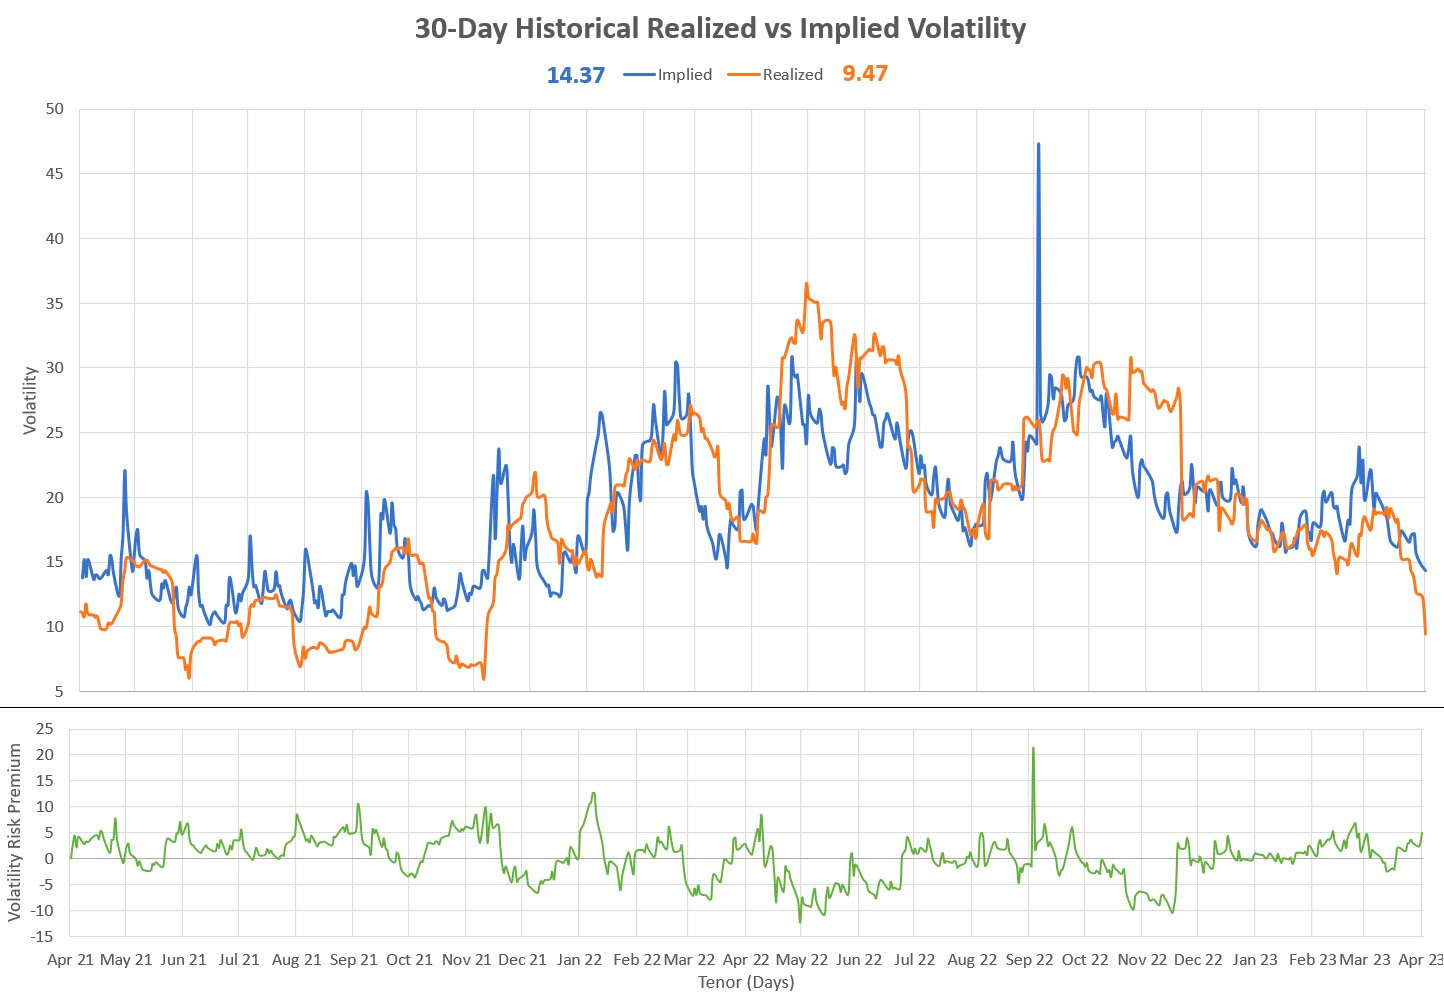
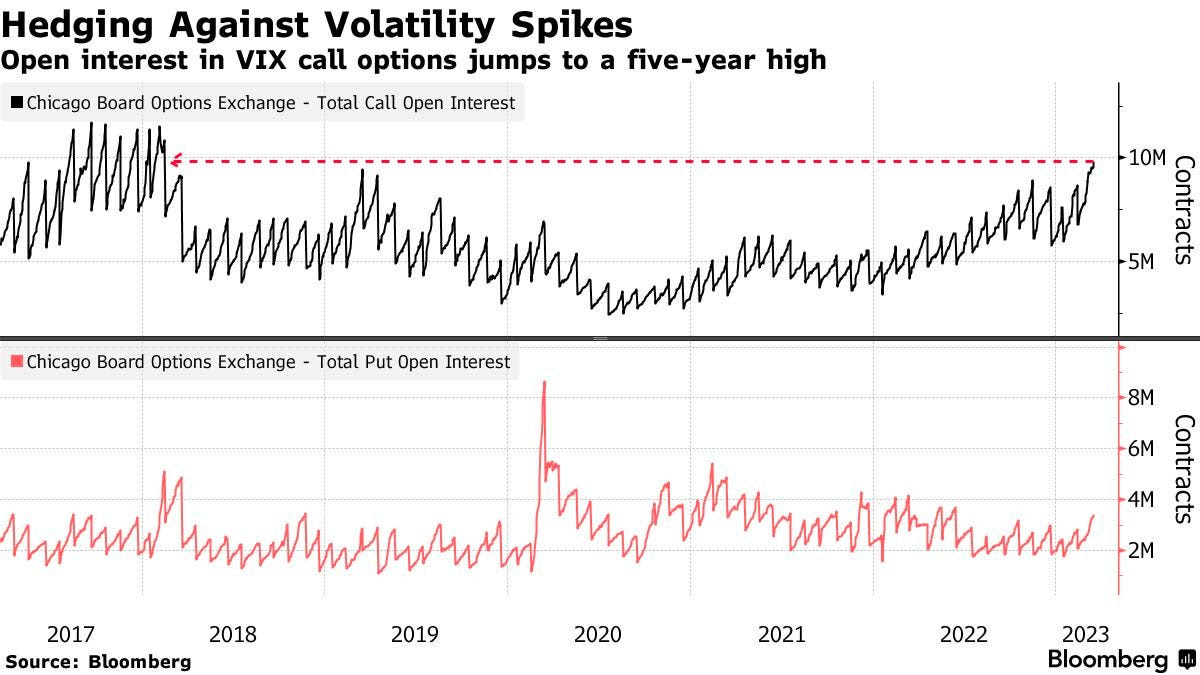
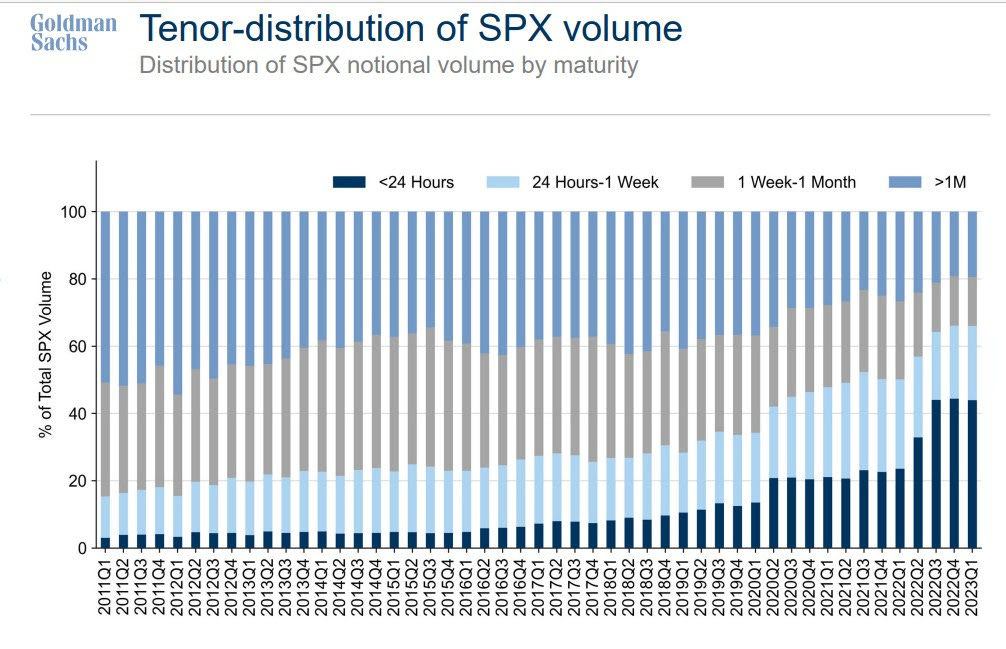
To measure potential volatility, check the options market. Calls usually have lower implied volatility (IVOL) than puts. As the market rises, IVOL typically drops, reflected in broader IVOL measures like the VIX. If these broad IVOL measures rise, it suggests fixed-strike volatility is also rising. If this persists, it could unsettle dealers, leading them to reduce their exposure to volatility, boosting the momentum and whipsaw.
More demand for calls means counterparties take on more risk, hedged with underlying asset purchases. If this hedging support is withdrawn, it may increase vulnerability to a downturn. Still, we must remember that it’s an election year, and there could be more monetary and fiscal support for any weakness.
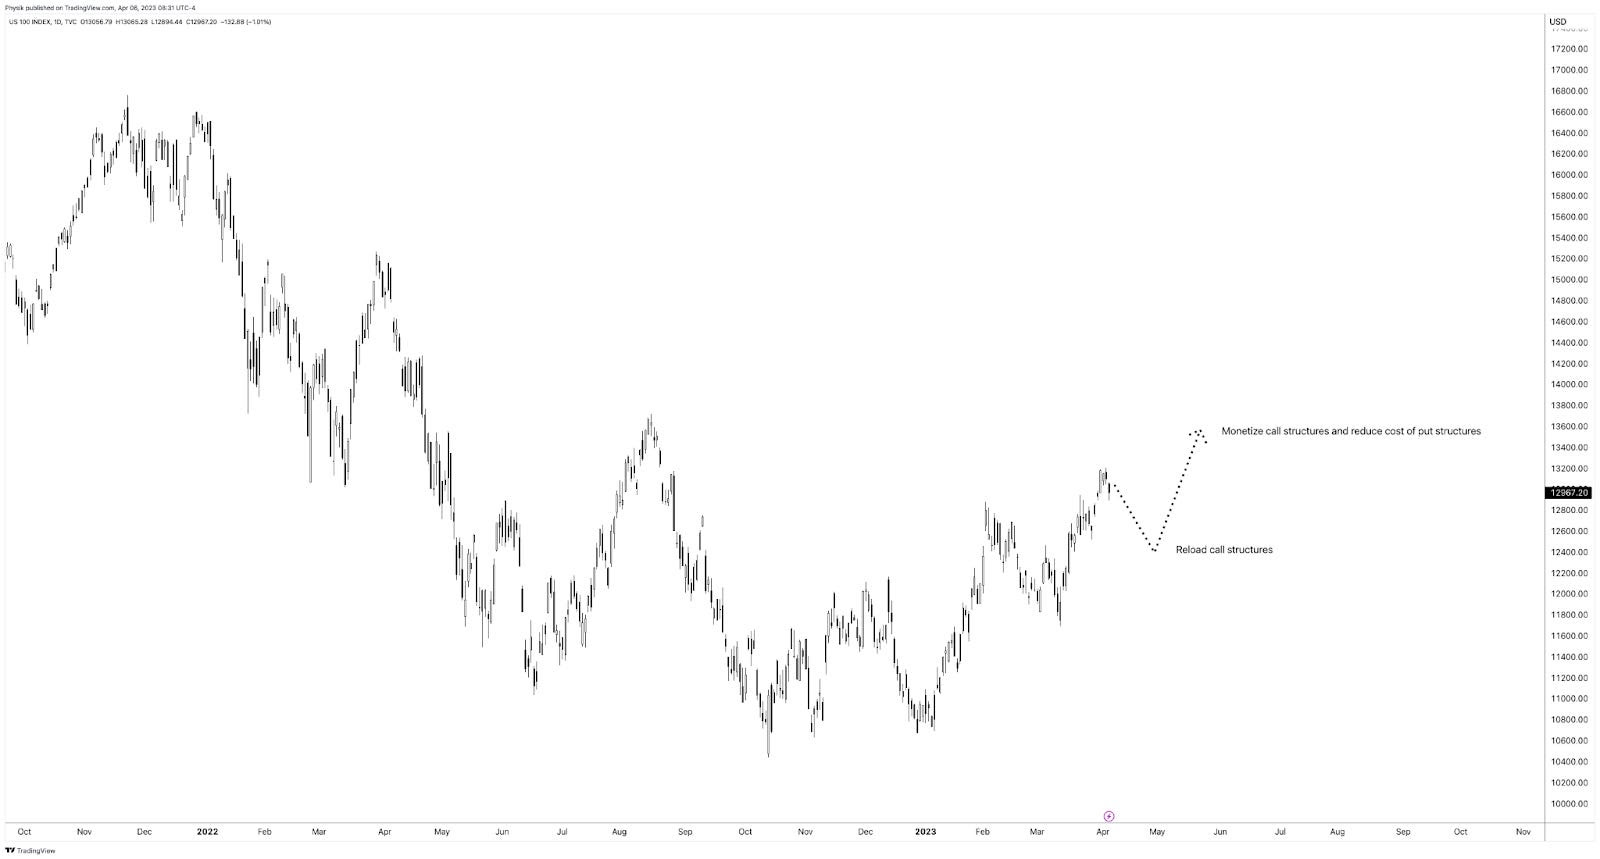
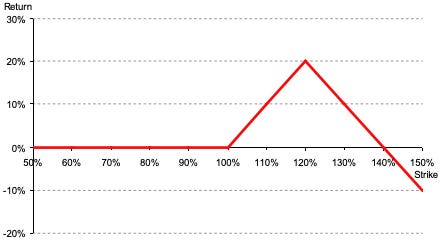
As George Soros said, “It’s not whether you’re right or wrong that’s important, but how much money you make when you’re right and how much you lose when you’re wrong.” Given the low volatility environment and the performance of skew with such aggressive equity positioning and divergences beneath the surface of the indexes, consider the lower-cost structures we’ve discussed in newsletters, minimizing equity losses by employing the appropriate unbalanced spread.