Categories
Commentary

Daily Brief For December 20, 2022

Physik Invest’s Daily Brief is read by thousands of subscribers. You, too, can join this community to learn about the fundamental and technical drivers of markets.

Graphic updated 9:45 AM ET AM ET. Sentiment Neutral if expected /ES open is inside of the prior day’s range. /ES levels are derived from the profile graphic at the bottom of this letter. Levels may have changed since initially quoted; click here for the latest levels. SqueezeMetrics Dark Pool Index (DIX) and Gamma (GEX) with the latter calculated based on where the prior day’s reading falls with respect to the MAX and MIN of all occurrences available. A higher DIX is bullish. At the same time, the lower the GEX, the more (expected) volatility. Click to learn the implications of volatility, direction, and moneyness. Breadth reflects a reading of the prior day’s NYSE Advance/Decline indicator. VIX reflects a current reading of the CBOE Volatility Index (INDEX: VIX) from 0-100.

Fundamental

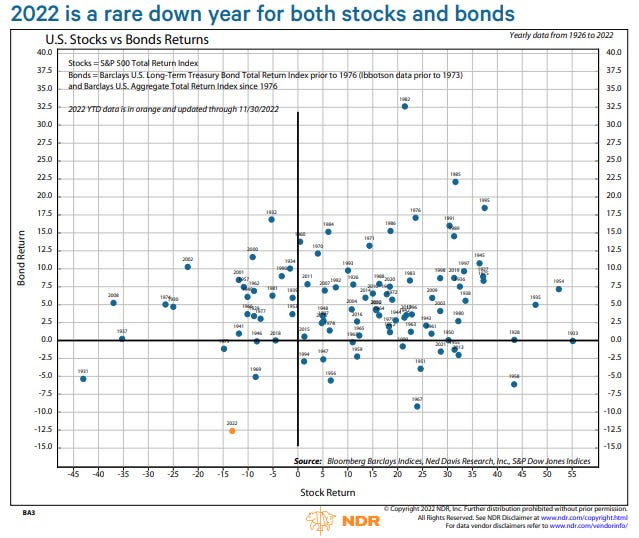
In a well-put statement by Tier1Alpha, “2022 was not a ‘classic’ bear market accompanying an earnings recession and economic slowdown, but rather a ‘rebalancing channel’ bear market.”

Essentially, as the Federal Reserve (Fed) raises interest rates and bond prices fall, equities are sold and “a ‘bear market’ occurs due to portfolio rebalancing,” as Michael Green well explained in a recent interview.

Graphic: Retrieved from Ned Davis Research via Bloomberg.

Further, some of the most sensitive (beaten) stocks have been in the technology and innovation sectors and, according to one article by Bloomberg’s John Authers, that’s not surprising.

Graphic: ARK Innovation ETF (NYSE: ARKK) via TradingView.

“These companies are prone to fears of rising interest rates, especially since many of them are valued based on their projected profits far into the future. As the Federal Reserve presses on with its most aggressive tightening of monetary policy in decades, the future profits of tech firms will be worth far less at these higher interest rates. And with recession calls growing louder, it might just spell more trouble ahead for these firms.”

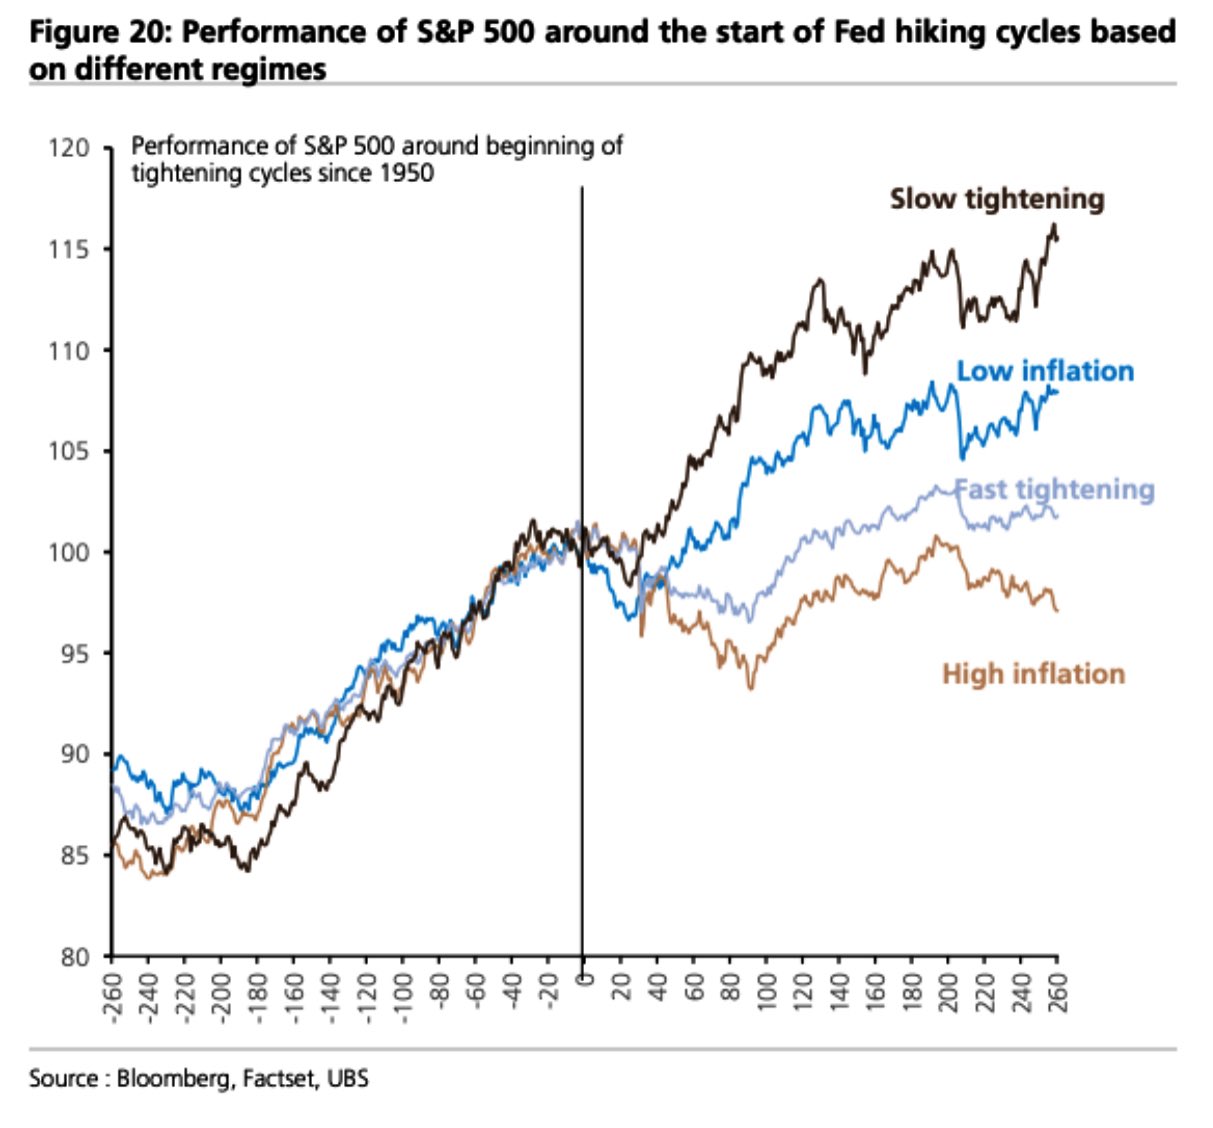
Moving on, given the rule of thumb – “past inflation spikes have never been vanquished until the federal funds rate exceeds the inflation rate” – in the realm of possibilities is a “crash … signaling to the Fed that they have raised rates enough.”

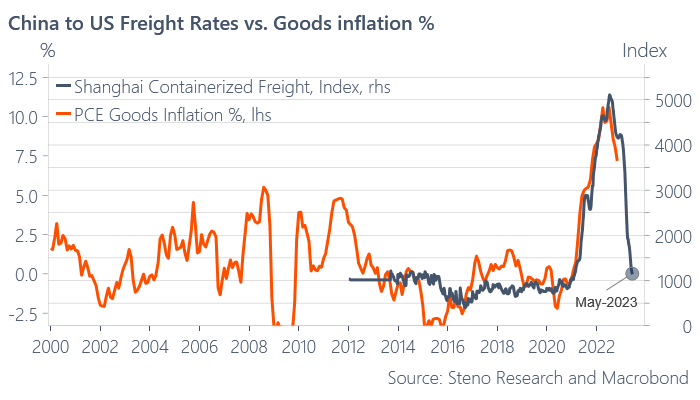
Likewise, per an article by Andreas Steno Larsen making the case for a comeback in deflation, equities have yet to price the negative EPS growth we’re likely to see.

Graphic: Retrieved from Andreas Steno Larsen.

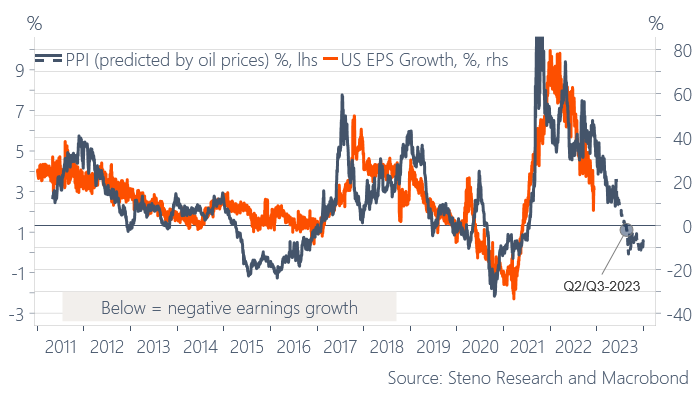
“Those who find a lower inflation print a good opportunity to buy risk assets should look away now,” Steno Larsen said. “Remember that the PPI (and the CPI for that matter) is a leading indicator for EPS … if we allow the oil future to predict PPI, then we are in for negative EPS.”

Graphic: Retrieved from Academy Securities’ Peter Tchir via Bloomberg.

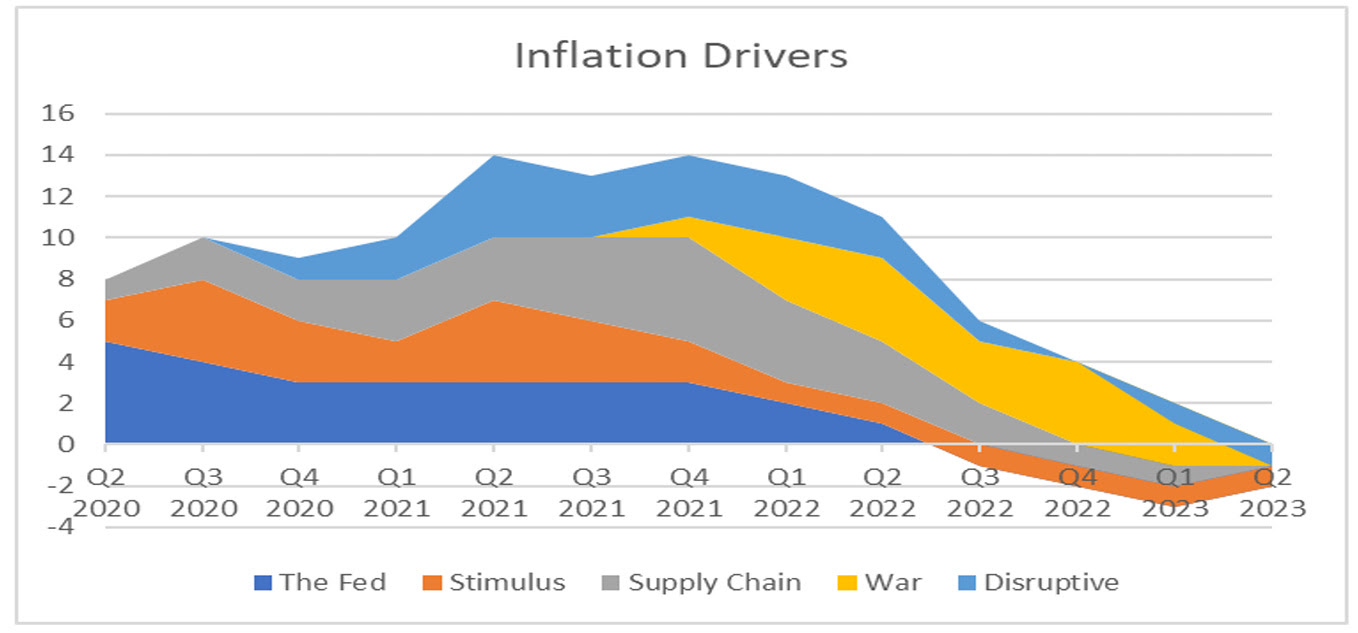
Adding, Steno Larsen is in the camp that thinks “the 1970s playbook is intact.” When “the disinflation in goods spills over to services through the spring of 2023, … the Fed will pivot,” he explained.

Graphic: Retrieved from Andreas Steno Larsen.

Some come off as less pessimistic, though. The Fed is to ease sooner than expected; quantitative tightening (QT) is not likely to run its course, Joseph Wang said.

To explain, “an ideal QT would drain liquidity in the overall financial system while keeping liquidity in the banking sector above a minimum threshold. That is only possible if the bulk of the liquidity drained is sourced from the $2T RRP, which holds funds owned by money market funds. MMFs could facilitate QT by withdrawing funds from the RRP to invest in the growing supply of Treasury bills, but recent data suggests they have lost interest in bills. Households [which include hedge funds] appear to have replaced MMFs as the marginal buyer of bills and are funding their purchases out of funds held in the banking sector. This suggests QT may lower banking sector liquidity below the Fed’s comfort level much earlier than anticipated.”

Hence, the downside that has yet to happen may prove not to be as material. A potential consequence, as Steno Larsen sees, is “double inflation,” bolstered by inflationary deglobalization trends that may accelerate.

For equities, “a revisit of the $3,500.00-$3,600.00 zone should be on the cards for S&P 500,” he said, while other markets, like housing, may see drawdowns reaching “15-20%” in the base case.

We’ll go into more depth on certain points next week. Hope this was a great way to set the stage for future conversations.

Technical

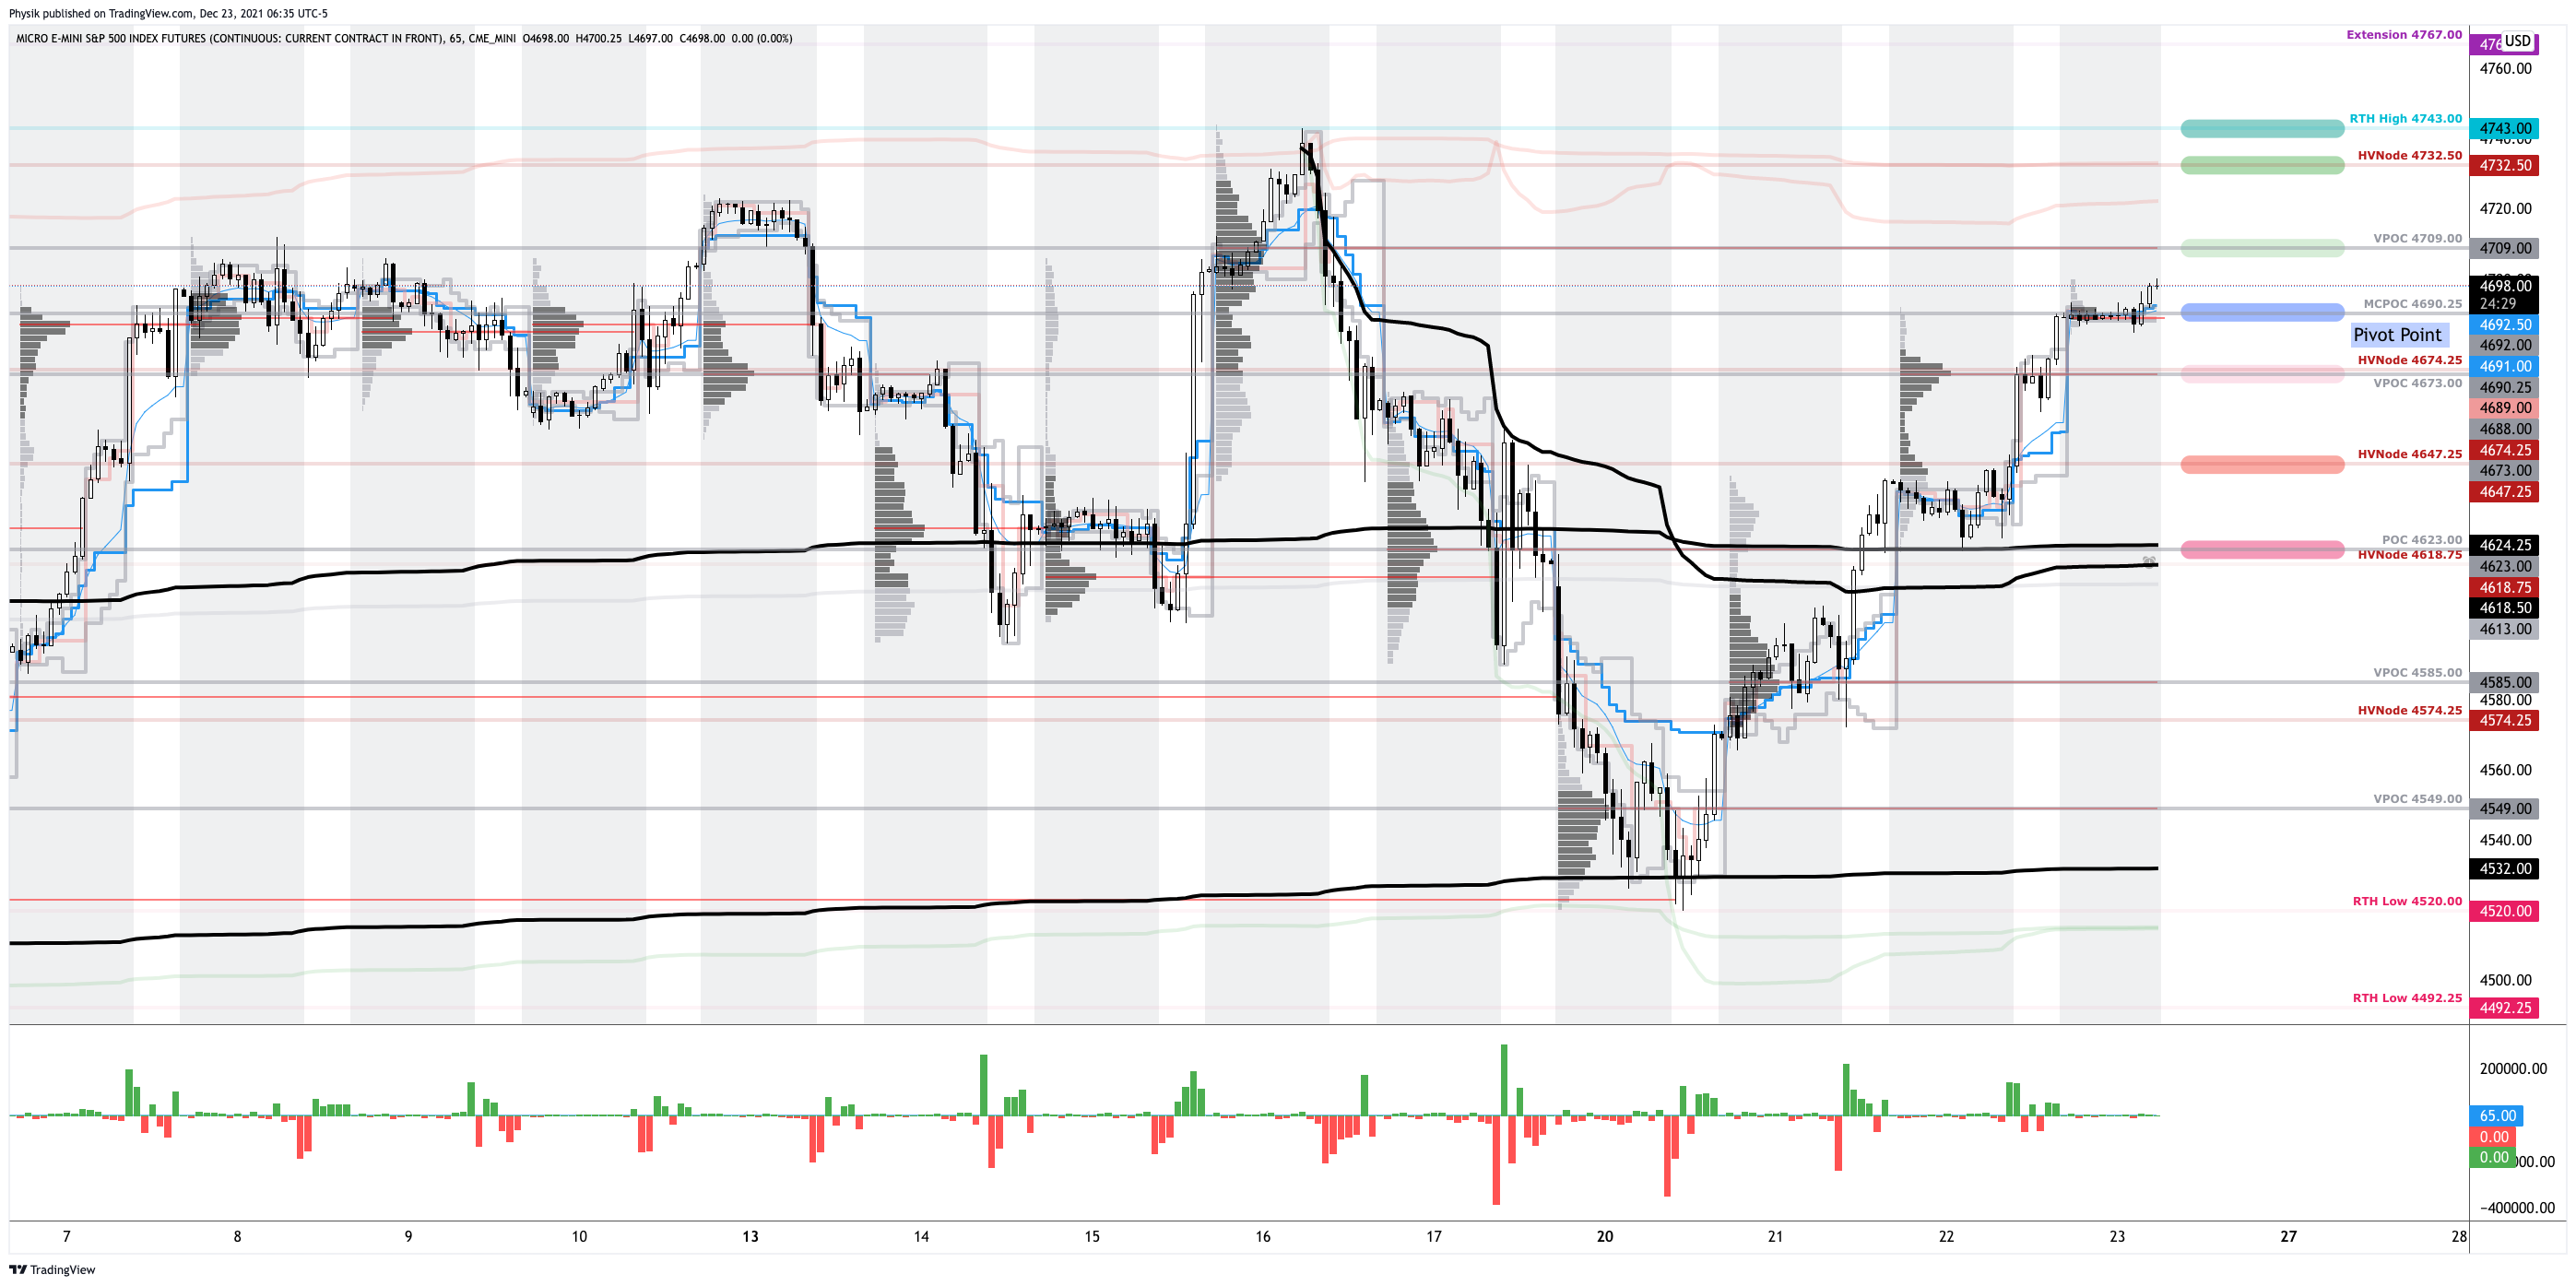
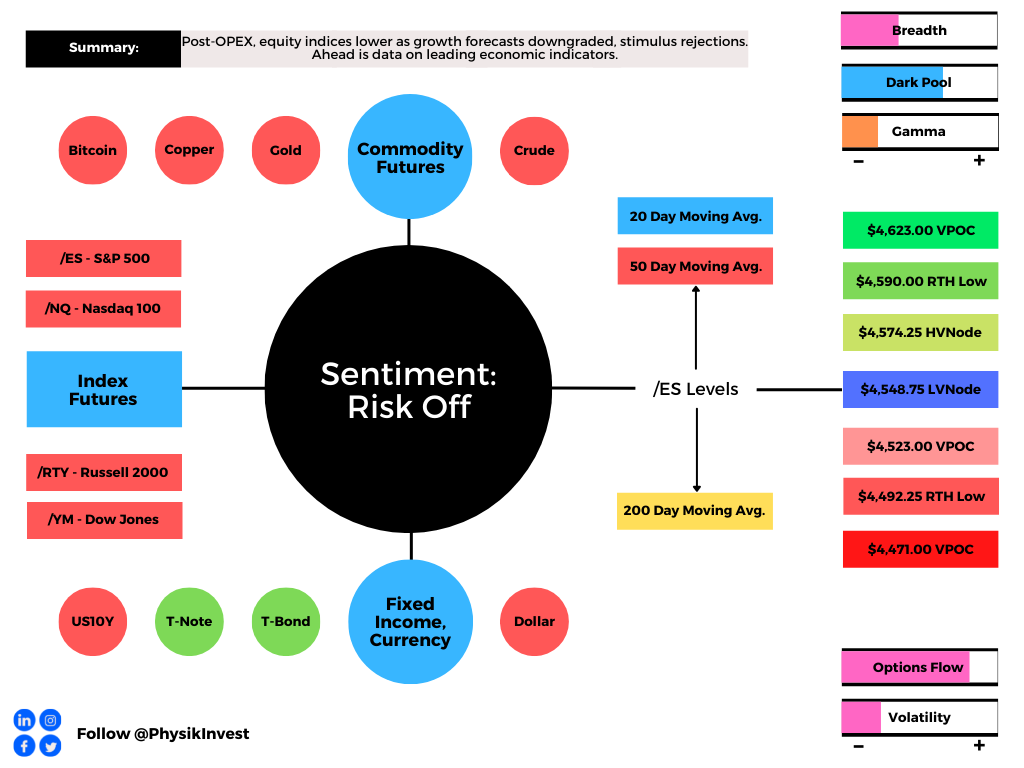
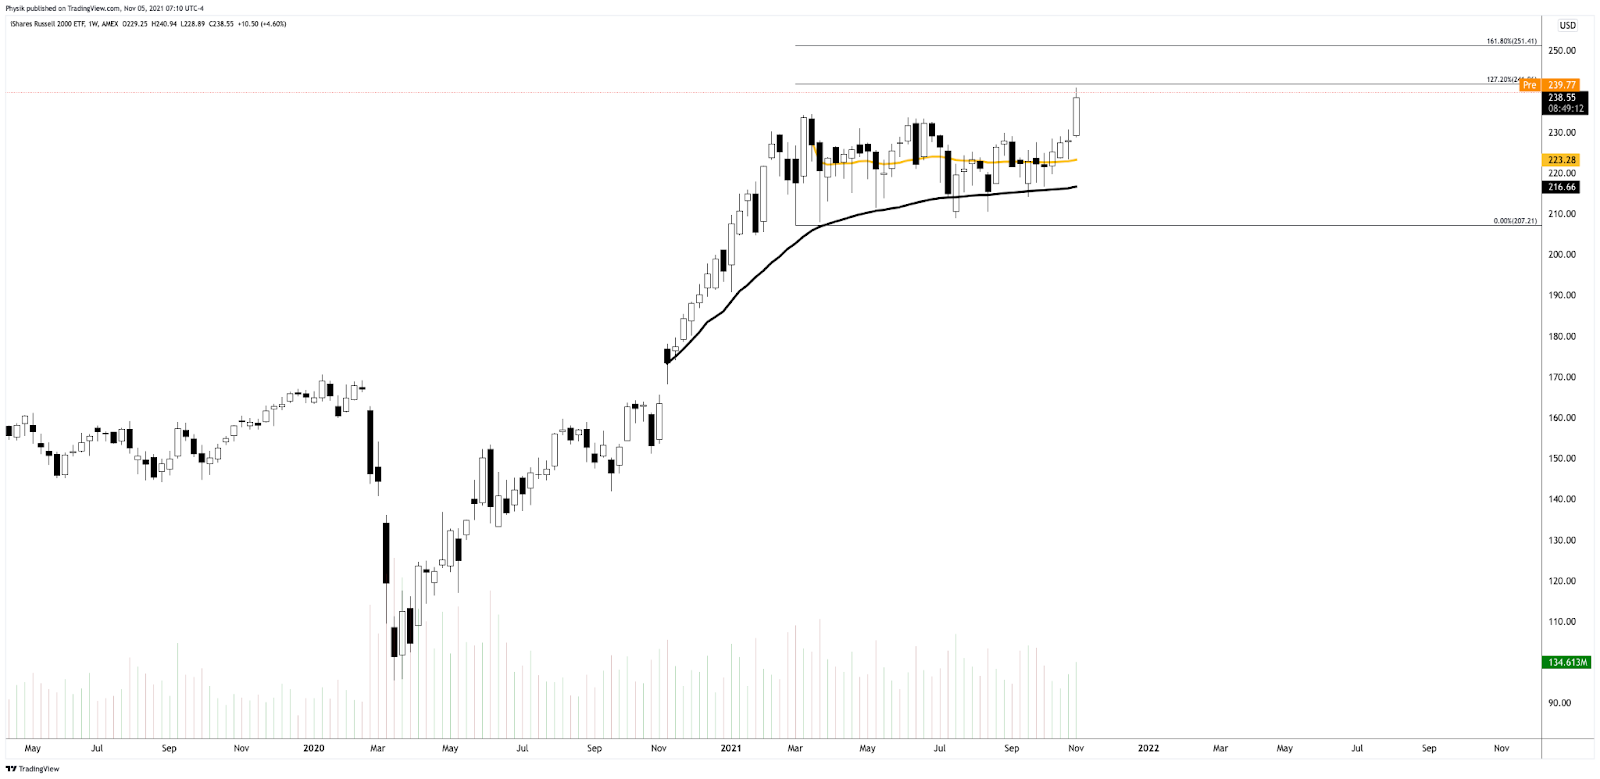
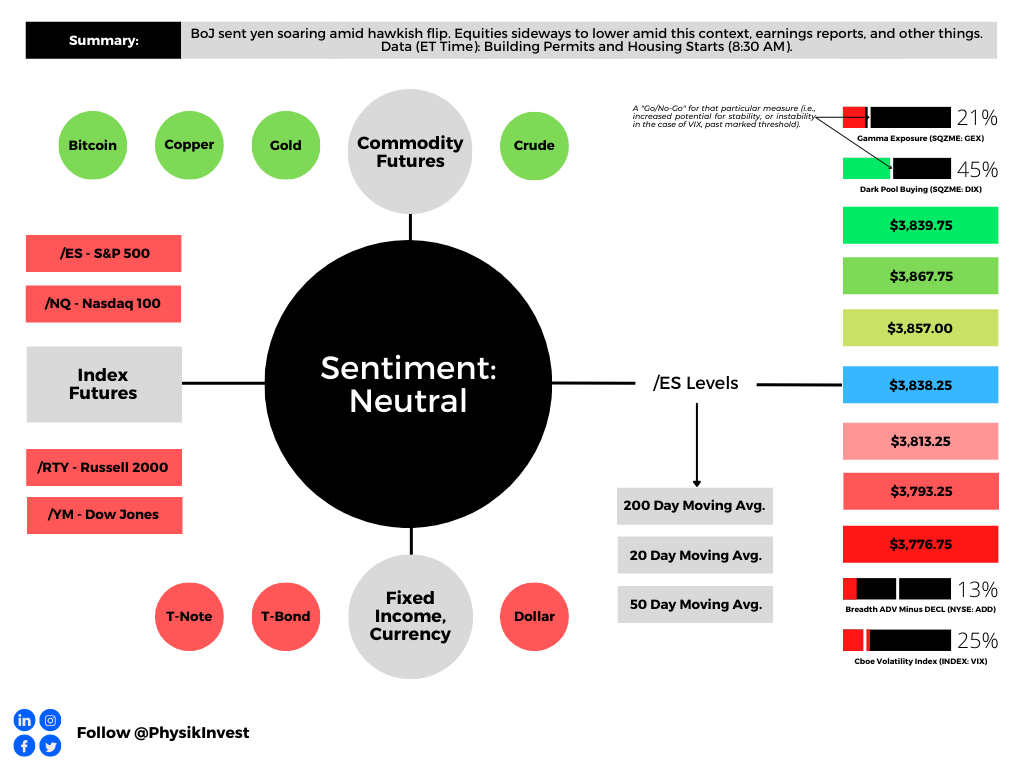
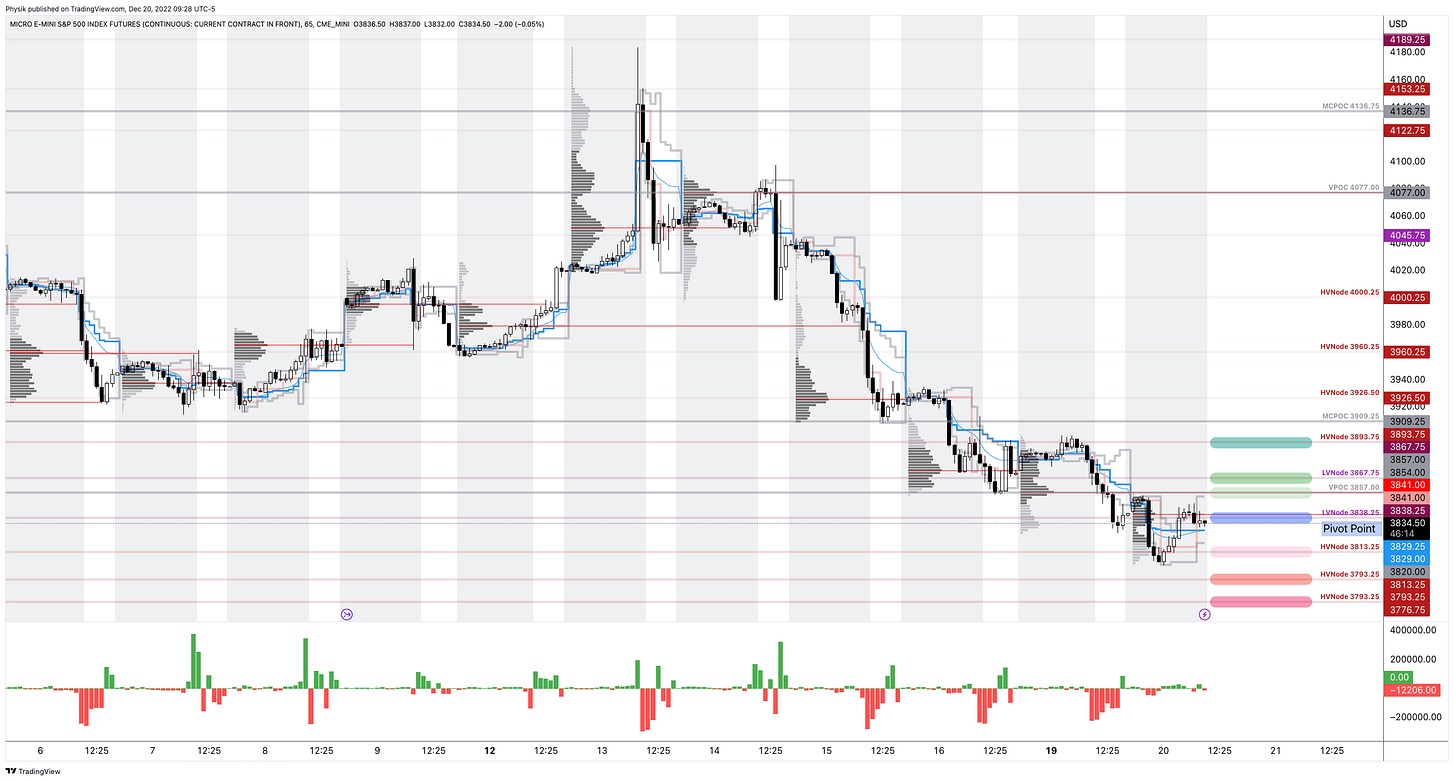
As of 9:25 AM ET, Tuesday’s regular session (9:30 AM – 4:00 PM ET), in the S&P 500, is likely to open in the upper part of a negatively skewed overnight inventory, inside of prior-range and -value, suggesting a limited potential for immediate directional opportunity.

Our S&P 500 pivot for today is $3,838.25. 

Key levels to the upside include $3,857.00, $3,867.75, and $3,893.75. 

Key levels to the downside include $3,813.25, $3,793.25, and $3,776.75.

Click here to load today’s key levels into the web-based TradingView platform. All levels are derived using the 65-minute timeframe. New links are produced, daily.

Graphic: 65-minute profile chart of the Micro E-mini S&P 500 Futures.

Definitions

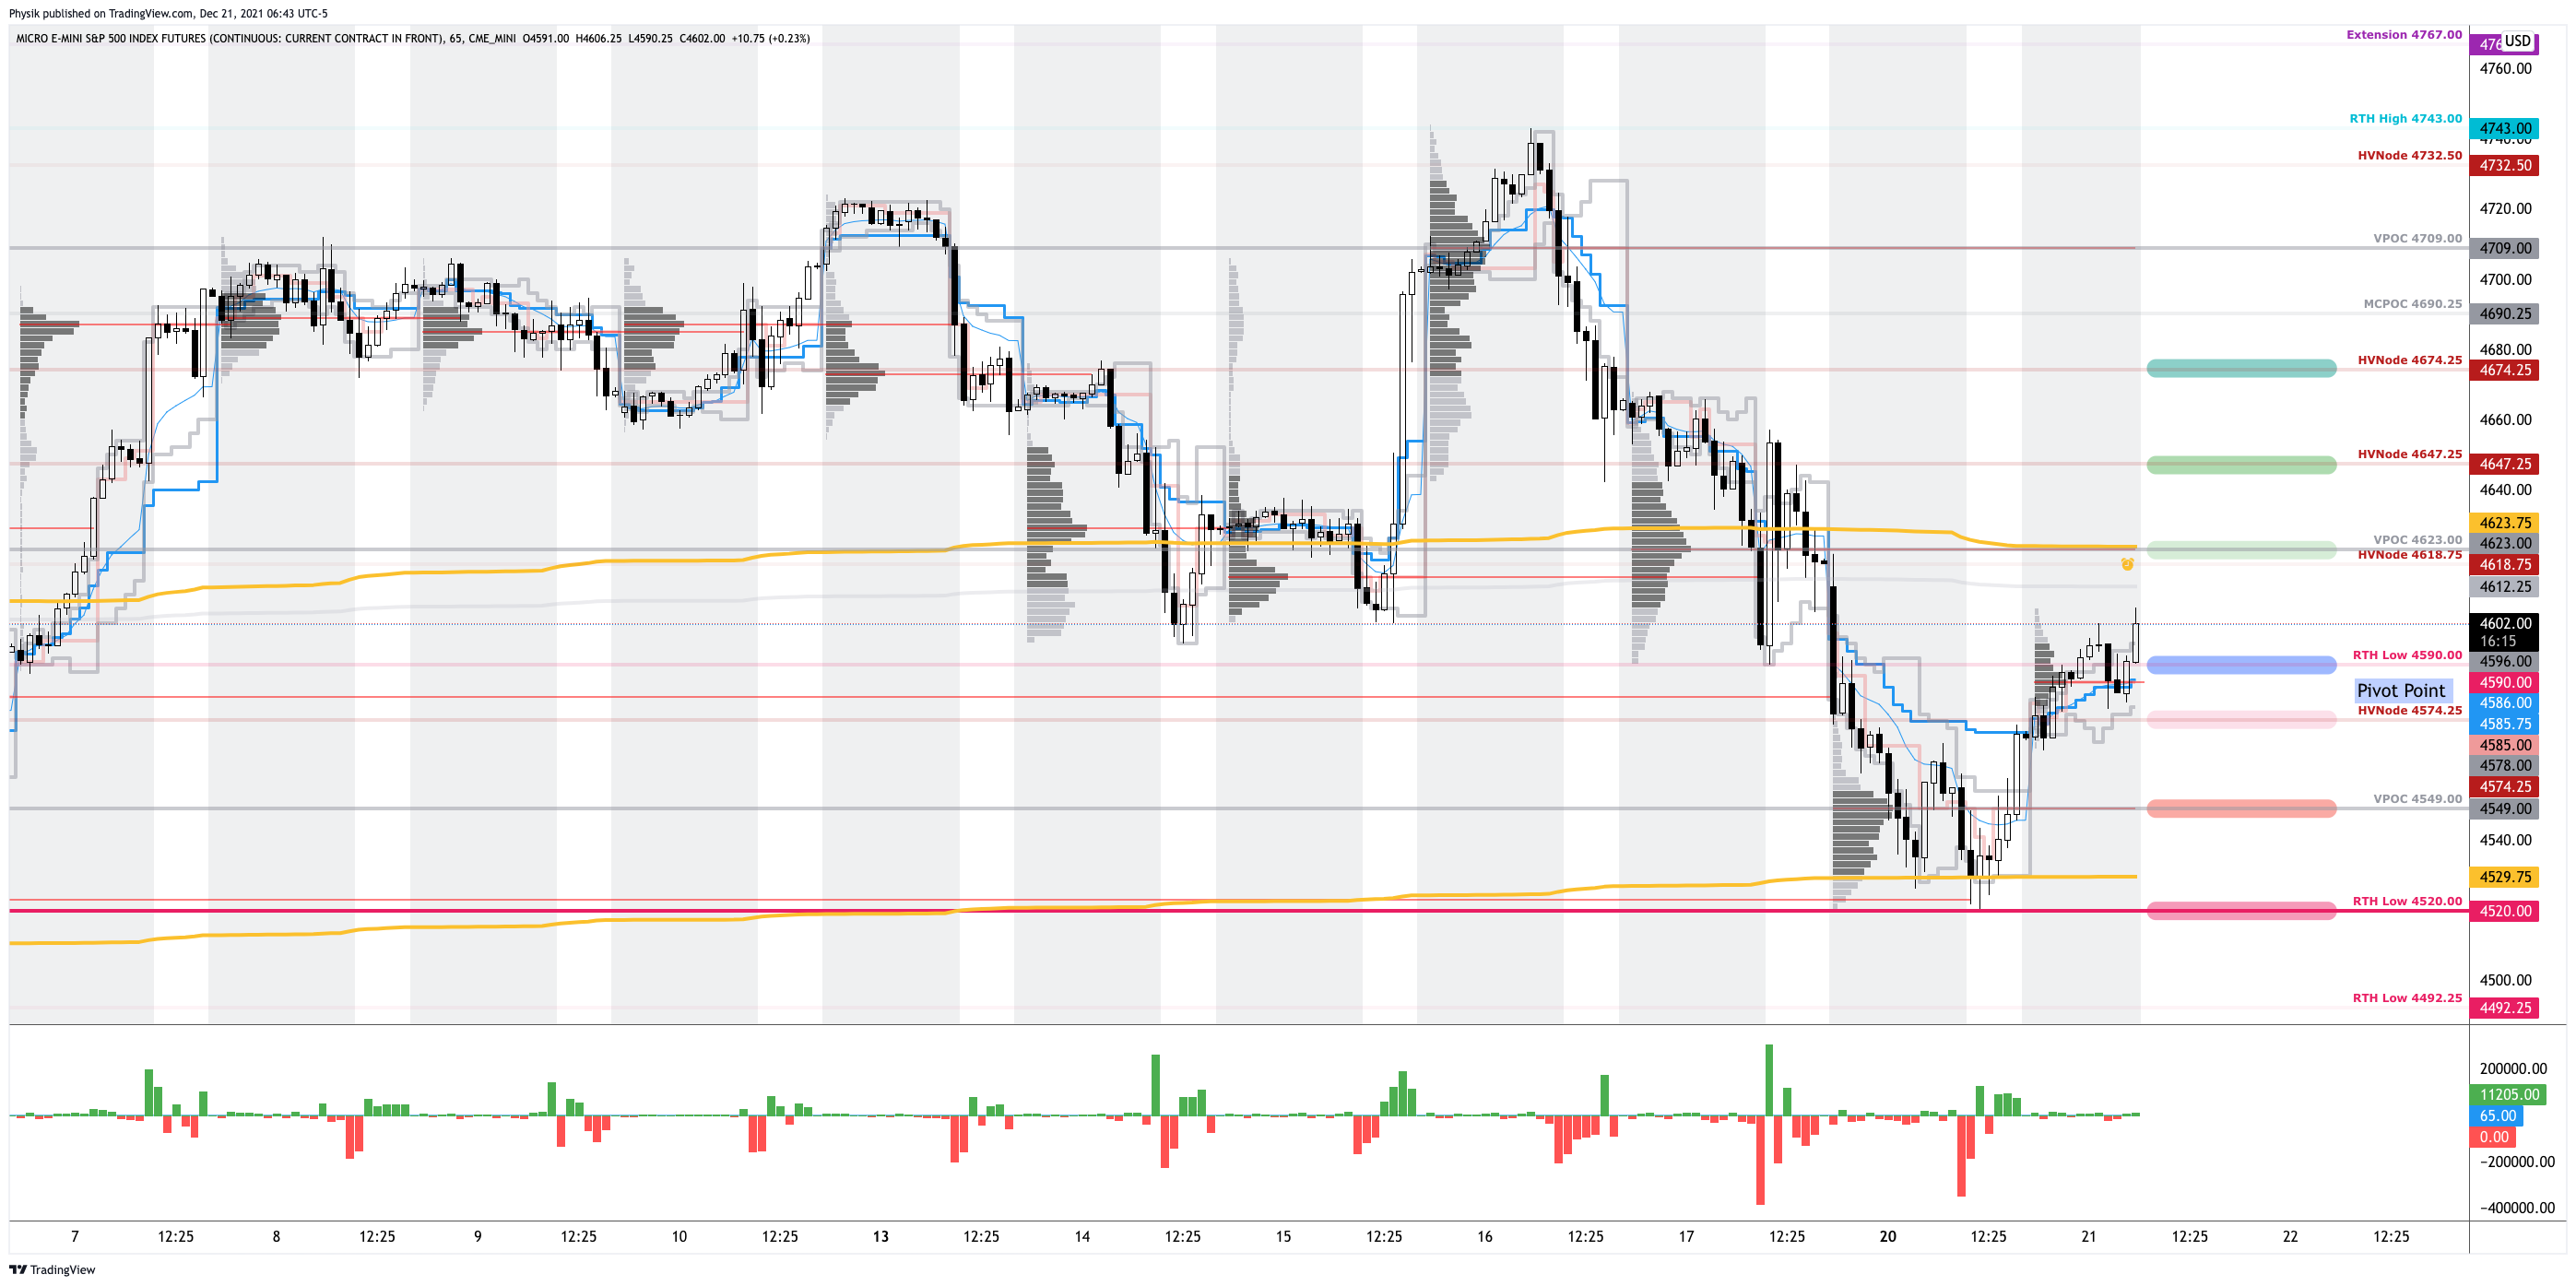
Volume Areas: Markets will build on areas of high-volume (HVNodes). Should the market trend for long periods of time, it will be identified by low-volume areas (LVNodes). LVNodes denote directional conviction and ought to offer support on any test.

If participants auction and find acceptance in an area of a prior LVNode, then future discovery ought to be volatile and quick as participants look to HVNodes for favorable entry or exit.

POCs: Denote areas where two-sided trade was most prevalent in a prior day session. Participants will respond to future tests of value as they offer favorable entry and exit.


About

In short, an economics graduate working in finance and journalism.

Capelj spends most of his time as the founder of Physik Invest through which he invests and publishes daily analyses to subscribers, some of whom represent well-known institutions.

Separately, Capelj is an equity options analyst at SpotGamma and an accredited journalist interviewing global leaders in business, government, and finance.

Past works include conversations with investor Kevin O’Leary, ARK Invest’s Catherine Wood, FTX’s Sam Bankman-Fried, Lithuania’s Minister of Economy and Innovation Aušrinė Armonaitė, former Cisco chairman and CEO John Chambers, and persons at the Clinton Global Initiative.

Contact

Direct queries to renato@physikinvest.com or Renato Capelj#8625 on Discord.

Calendar

You may view this letter’s content calendar at this link.

Disclaimer

Do not construe this newsletter as advice. All content is for informational purposes.

Categories
Methodology

Theory Applied: Contextualizing Recent Market Volatility

With SpotGamma, Physik Invest’s Renato Leonard Capelj unpacks recent market movements from an options positioning perspective.

Coverage includes the following:

  • Definition and application of first and second order options greeks.
  • Implications of the November and December options expirations.
  • How current positioning may dictate trade in Q1 2022 and beyond.
  • Expert commentary and much more!

Click below to learn more!

Categories
Commentary

Daily Brief For December 23, 2021

What Happened

Led by the Russell 2000, overnight, equity index futures continued higher while commodities were mixed and bonds were a touch lower. Friday, December 24, markets are closed.

Pursuant to comments made earlier this week, volatility was sold aggressively; the CBOE Volatility Index (INDEX: VIX) dropped ~9.00. This coincides with a compression in the VIX’s term structure, and that has so-called bullish/supportive implications.

Ahead is data on jobless claims, personal income, consumer spending, inflation, disposable income, goods orders (8:30 AM ET), as well as new home sales, University of Michigan sentiment, and five-year inflation expectations (10:00 AM ET).

Graphic updated 6:40 AM ET. Sentiment Risk-On if expected /ES open is above the prior day’s range. /ES levels are derived from the profile graphic at the bottom of the following section. Levels may have changed since initially quoted; click here for the latest levels. SqueezeMetrics Dark Pool Index (DIX) and Gamma (GEX) calculations are based on where the prior day’s reading falls with respect to the MAX and MIN of all occurrences available. A higher DIX is bullish. At the same time, the lower the GEX, the more (expected) volatility. Learn the implications of volatility, direction, and moneyness. SHIFT data used for S&P 500 (INDEX: SPX) options activity. Note that options flow is sorted by the call premium spent; if more positive then more was spent on call options. Breadth reflects a reading of the prior day’s NYSE Advance/Decline indicator. VIX reflects a current reading of the CBOE Volatility Index (INDEX: VIX) from 0-100.

What To Expect

On lackluster intraday breadth and divergent market liquidity metrics, the best case outcome occurred, via the S&P 500’s spike close higher, away from intraday value, the levels at which participants found it most favorable to transact.

This activity, which marks the continuation of an earlier trend change, is built on poor structure. 

That, ultimately, adds to technical instability.

Why? If you haven’t noticed, the levels quoted daily in this particular commentary seem to be holding to the tick. Given the persistence of mechanical responses to key technical levels, visually-driven, weaker-handed participants (which seldom bear the wherewithal to defend retests) carry a heavier hand in recent price discovery. 

Via volume profile analysis, we see a plethora of low-volume pockets – voids, if you will – that likely hold virgin tests. As stated, yesterday, successful penetration portends follow-through given the participants that were most active at those technical levels. Caution is warranted.

Graphic: Divergent delta (i.e., non-committed buying as measured by volume delta or buying and selling power as calculated by the difference in volume traded at the bid and offer) in SPDR S&P 500 ETF Trust (NYSE: SPY), one of the largest ETFs that track the S&P 500 index, via Bookmap. The readings are supportive of responsive trade (i.e., rotational trade that suggests current prices offer favorable entry and exit; the market is in balance).

Context: According to Ryan Detrick of LPL Financial, the “official Santa Claus Rally starts this Monday (last 5 days of the year and the first two of the following year).”

The 7 days (after this Monday) are up nearly 79% of the time. 

However, in the past 5 occurrences, “Jan was also in the red and Q1 been weak as well.”

Graphic: LPL Financial on the so-called Santa Claus rally.

This activity comes after last week’s weighty “quad-witching” and ahead of the December “Quarterlys” expiry.

The exposure that rolled (and is to roll) off was “put-heavy.”

Participants’ commitment to capital at strikes lower in price and out in time – in the face of weak breadth and bearish fundamental developments – in single stocks, fed into the indices, also. 

According to SpotGamma, the December 17 expiration cleared quite a bit of negative delta (e.g., the ARK Innovation ETF [NYSE: ARKK] had $1.5 billion in notional put delta expire).

This opened a window of strength and realized volatility, wherein positive fundamental forces and dealers’ covering of hedges could bolster any recovery.

So, it is this week’s collapse in implied volatility (and associated collapse in term structure), coupled with the pending management of large S&P positions, and relentless, seasonally-aligned “passive buying support,” which brought positive flows bolstering this “Santa Claus rally.”

Graphic: Shift Search data suggests participants are likely initiating box spreads and rolling their call exposure out in time (as much as 6 months).

Notwithstanding, as mentioned, yesterday, Goldman Sachs Group (NYSE: GS) saw “options selling strategies as attractive in the near term,” estimating “a 12% probability of a 1-month 5% down-move in the SPX in this economic environment based on [the] GS-EQMOVE model.”

“Options are pricing a 22% probability of that size move indicating that puts are overvalued.”

As noted Tuesday, the commitment of capital on lower volatility results in counterparties taking on more exposure to positive gamma. The growth in positive gamma (as the data is showing) will be offset through the dealers’ supply of liquidity, pressuring the price discovery process.

Note: As a position’s delta rises with stock or index price rises, gamma (or how an option’s delta is expected to change given a change in the underlying) is added to the delta.

This is while many products are in lower liquidity and short-gamma (wherein an options delta decreases with stock prices rises and increases when stock prices drop) in which moves are more erratic.

Therefore, coming into weighty options expirations, correlations may be off (as that is the only reconciliation in an environment where, at the index level, hedging pressures are sticky, whereas elsewhere they aren’t).

Thereafter, participants ought to monitor the sides and levels capital is committed for clues as to where we go next. Continued compression of volatility, as well as a commitment to options higher in prices and further out in time, supports upward price discovery.

Graphic: Via The Market Ear, “There have been five prior years since 1953 (when we went to the 5-day trading week) that have seen December as the most volatile month: 1973, 1978, 1985, 1995, and 2018. The January following these five prior years was BIG positive four out of five times, with January 2019 seeing the biggest gain.”

Weakness (alongside a commitment to strikes lower in price and out in time) likely sets the market up for another round of instability, as realized in late November and early December.

Graphic: A compression in the VIX term structure would provide markets with a boost.

Expectations: As of 6:30 AM ET, Thursday’s regular session (9:30 AM – 4:00 PM ET), in the S&P 500, will likely open in the upper part of a positively skewed overnight inventory, outside of prior-range and -value, suggesting a potential for immediate directional opportunity.

Spike Rules In Play: Spike’s mark the beginning of a break from value. Spikes higher (lower) are validated by trade at or above (below) the spike base (i.e., the origin of the spike). 

The spike base is $4,678.50. Below bearish (change in tone). Above bullish (status quo).

In the best case, the S&P 500 trades sideways or higher; activity above the $4,690.75 micro composite point of control (MCPOC) puts in play the $4,709.00 untested point of control (VPOC). Initiative trade beyond the VPOC could reach as high as the $4,732.50 high volume area (HVNode) and $4,743.00 regular trade high (RTH High), or higher.

In the worst case, the S&P 500 trades lower; activity below the $4,690.25 MCPOC puts in play the $4,673.00 VPOC. Initiative trade beyond the VPOC could reach as low as the $4,647.25 HVNode and $4,623.00 POC, or lower.

Click here to load today’s key levels into the web-based TradingView charting platform. Note that all levels are derived using the 65-minute timeframe. New links are produced, daily.
Graphic: 65-minute profile chart of the Micro E-mini S&P 500 Futures. Learn about the profile.

Definitions

Volume Areas: A structurally sound market will build on areas of high volume (HVNodes). Should the market trend for long periods of time, it will lack sound structure, identified as low volume areas (LVNodes). LVNodes denote directional conviction and ought to offer support on any test. 

If participants were to auction and find acceptance into areas of prior low volume (LVNodes), then future discovery ought to be volatile and quick as participants look to HVNodes for favorable entry or exit.

POCs: POCs are valuable as they denote areas where two-sided trade was most prevalent in a prior day session. Participants will respond to future tests of value as they offer favorable entry and exit.

MCPOCs: POCs are valuable as they denote areas where two-sided trade was most prevalent over numerous day sessions. Participants will respond to future tests of value as they offer favorable entry and exit.

Significance Of Prior ATHs, ATLs: Prices often encounter resistance (support) at prior highs (lows) due to the supply (demand) of old business. These areas take time to resolve. Breaking and establishing value (i.e., trading more than 30-minutes beyond this level) portends continuation.

Price Discovery (One-Timeframe Or Trend): Elongation and range expansion denotes a market seeking new prices to establish value, or acceptance (i.e., more than 30-minutes of trade at a particular price level). 

Volume-Weighted Average Prices (VWAPs): A metric highly regarded by chief investment officers, among other participants, for quality of trade. Additionally, liquidity algorithms are benchmarked and programmed to buy and sell around VWAPs.

About

After years of self-education, strategy development, and trial-and-error, Renato Leonard Capelj began trading full-time and founded Physik Invest to detail his methods, research, and performance in the markets.

Additionally, Capelj is a Benzinga finance and technology reporter interviewing the likes of Shark Tank’s Kevin O’Leary, JC2 Ventures’ John Chambers, and ARK Invest’s Catherine Wood, as well as a SpotGamma contributor, helping develop insights around impactful options market dynamics.

Disclaimer

At this time, Physik Invest does not carry the right to provide advice. In no way should the materials herein be construed as advice. Derivatives carry a substantial risk of loss. All content is for informational purposes only.

Categories
Commentary

Daily Brief For December 21, 2021

What Happened

After Monday’s post-options expiration (OPEX) positioning reset, equity index futures traded higher alongside no impactful news developments.

The rate-sensitive and growth-heavy Russell 2000 and Nasdaq 100 led the advance, a change in tone. The S&P 500 was up nearly 1.00% in early trade while volatility came in, markedly, with the CBOE Volatility Index printing 21 versus 27, yesterday.

Ahead is data on the current account deficit (8:30 AM ET).

Graphic updated 6:40 AM ET. Sentiment Risk-On if expected /ES open is above the prior day’s range. /ES levels are derived from the profile graphic at the bottom of the following section. Levels may have changed since initially quoted; click here for the latest levels. SqueezeMetrics Dark Pool Index (DIX) and Gamma (GEX) calculations are based on where the prior day’s reading falls with respect to the MAX and MIN of all occurrences available. A higher DIX is bullish. At the same time, the lower the GEX, the more (expected) volatility. Learn the implications of volatility, direction, and moneyness. SHIFT data used for S&P 500 (INDEX: SPX) options activity. Note that options flow is sorted by the call premium spent; if more positive then more was spent on call options. Breadth reflects a reading of the prior day’s NYSE Advance/Decline indicator. VIX reflects a current reading of the CBOE Volatility Index (INDEX: VIX) from 0-100.

What To Expect

On weak intraday breadth and divergent market liquidity metrics, the best case outcome occurred; responsive buyers surfaced at key areas of resting liquidity.

The response just so happened to coincide with the $4,523.00 /ES untested point of control (VPOC). This technically-sensitive trade seems to suggest that weaker-handed participants, which act on visual cues, are very much in control.

Moreover, the overnight follow-through on that buying resulted in a large gap that places the S&P 500 back in prior range, a clear rejection of Monday’s bearish price exploration.

Graphic: Divergent delta (i.e., non-committed selling as measured by volume delta or buying and selling power as calculated by the difference in volume traded at the bid and offer) in SPDR S&P 500 ETF Trust (NYSE: SPY), one of the largest ETFs that track the S&P 500 index, via Bookmap. The readings are supportive of responsive trade (i.e., rotational trade that suggests current prices offer favorable entry and exit; the market is in balance).

Context: Have to keep it short, today, sorry!

In recapping yesterday’s on-point write-up, the thesis is as follows: divergent breadth, and what remained of “put-heavy” positioning, coupled with recent fundamental developments, fed into lower index prices.

According to the options modeling and analysis service SpotGamma, the December 17 options expiration (OPEX) cleared quite a bit of negative delta (e.g., the ARK Innovation ETF [NYSE: ARKK] had $1.5 billion in notional put delta expire) which, in theory, should open a window of strength and realized volatility, wherein positive fundamental forces and dealers’ covering of hedges would bolster any recovery.

With breadth still to recover, early expansion of range, this week, placed major products at key visual support; to note, responsive buying by short-term, visual traders seldom are defended.

At the same time, presented were dynamics such as the eventual management of big S&P positions, and relentless, seasonally-aligned “passive buying support,” in the face of expectations there will be “the strongest quarterly nominal [economic] growth in more than three decades.”

Graphic: Positively skewed return distribution amidst “natural, passive buying,” and supportive positioning metrics. Data SqueezeMetrics. Graph via Physik Invest.

Data Trek made comments with respect to the path of earnings surprises, a factor behind the persistence of this year’s S&P 500 rally; “This week’s upward revisions should have the same ability to backstop equities as we wrap up the year. The operative word is ‘should’, of course, and we do expect further volatility this week.”

With participants flush with cash, so to speak, will FOMO (fear of missing out) sentiment appear?

Net flows into global equity funds, out of cash equivalents, is one indicator to watch.

Graphic: Via The Market Ear. “Net flows into global equity funds rebounded in the week ending December 15 (+$32bn vs +$11bn the prior week) due to a surge in demand for US-dedicated products. Money market fund assets declined by $40bn.”

Expectations: As of 6:40 AM ET, Tuesday’s regular session (9:30 AM – 4:00 PM ET), in the S&P 500, will likely open in the upper part of a positively skewed overnight inventory, outside of prior-range and -value, suggesting a potential for immediate directional opportunity.

Gap Scenarios: Gaps ought to fill quickly. Should they not, that’s a signal of strength; do not fade. Leaving value behind on a gap-fill or failing to fill a gap (i.e., remaining outside of the prior session’s range) is a go-with indicator.

Auctioning and spending at least 1-hour of trade back in the prior range suggests a lack of conviction; in such a case, do not follow the direction of the most recent initiative activity.

In the best case, the S&P 500 trades sideways or higher; activity above the $4,590.00 regular trade low (RTH Low) puts in play the $4,623.00 VPOC. Initiative trade beyond the VPOC could reach as high as the $4,647.25 and $4,674.25 high volume area (HVNode), or higher.

In the worst case, the S&P 500 trades lower; activity below the $4,590.00 RTH Low puts in play the $4,574.25 high volume area (HVNode). Initiative trade beyond the HVNode could reach as low as the $4,549.00 VPOC and $4,520.00 RTH Low, or lower.

Click here to load today’s key levels into the web-based TradingView charting platform. Note that all levels are derived using the 65-minute timeframe. New links are produced, daily.
Graphic: 65-minute profile chart of the Micro E-mini S&P 500 Futures. Learn about the profile.

What People Are Saying

Definitions

Volume Areas: A structurally sound market will build on areas of high volume (HVNodes). Should the market trend for long periods of time, it will lack sound structure, identified as low volume areas (LVNodes). LVNodes denote directional conviction and ought to offer support on any test. 

If participants were to auction and find acceptance into areas of prior low volume (LVNodes), then future discovery ought to be volatile and quick as participants look to HVNodes for favorable entry or exit.

POCs: POCs are valuable as they denote areas where two-sided trade was most prevalent in a prior day session. Participants will respond to future tests of value as they offer favorable entry and exit.

Volume-Weighted Average Prices (VWAPs): A metric highly regarded by chief investment officers, among other participants, for quality of trade. Additionally, liquidity algorithms are benchmarked and programmed to buy and sell around VWAPs.

Rates: Low rates have to potential to increase the present value of future earnings making stocks, especially those that are high growth, more attractive. To note, inflation and rates move inversely to each other. Low rates stimulate demand for loans (i.e., borrowing money is more attractive).

About

After years of self-education, strategy development, and trial-and-error, Renato Leonard Capelj began trading full-time and founded Physik Invest to detail his methods, research, and performance in the markets.

Additionally, Capelj is a Benzinga finance and technology reporter interviewing the likes of Shark Tank’s Kevin O’Leary, JC2 Ventures’ John Chambers, and ARK Invest’s Catherine Wood, as well as a SpotGamma contributor, helping develop insights around impactful options market dynamics.

Disclaimer

At this time, Physik Invest does not carry the right to provide advice. In no way should the materials herein be construed as advice. Derivatives carry a substantial risk of loss. All content is for informational purposes only.

Categories
Commentary

Daily Brief For December 20, 2021

What Happened

Overnight, equity index futures auctioned sideways to lower with growth-heavy and rate-sensitive names bearing the brunt of the move.

This is as Goldman Sachs Group (NYSE: GS) economists reduced their U.S. economic growth expectations, Senator Joe Manchin rejected a $2 trillion tax-and-spending package, hawkish central bank pivots, and rising COVID-19 lockdown risks. 

Ahead is data on leading economic indicators (10:00 AM ET).

Graphic updated 6:40 AM ET. Sentiment Risk-Off if expected /ES open is below the prior day’s range. /ES levels are derived from the profile graphic at the bottom of the following section. Levels may have changed since initially quoted; click here for the latest levels. SqueezeMetrics Dark Pool Index (DIX) and Gamma (GEX) calculations are based on where the prior day’s reading falls with respect to the MAX and MIN of all occurrences available. A higher DIX is bullish. At the same time, the lower the GEX, the more (expected) volatility. Learn the implications of volatility, direction, and moneyness. SHIFT data used for S&P 500 (INDEX: SPX) options activity. Note that options flow is sorted by the call premium spent; if more positive then more was spent on call options. Breadth reflects a reading of the prior day’s NYSE Advance/Decline indicator. VIX reflects a current reading of the CBOE Volatility Index (INDEX: VIX) from 0-100.

What To Expect

Divergent breadth in less heavily-weighted constituents, and what remains of “put-heavy” positioning, coupled with recent fundamental developments, is feeding into lower index prices.

Graphic: Sentimentrader writes: “Fewer than 65% of NDX stocks are currently trading above their 200-day moving averages. That is a stark change from a year ago when internal trends improved as the NDX marched steadily higher.”

Though the December 17 options expiration (OPEX) cleared positive delta and quite a bit of negative delta (e.g., the ARK Innovation ETF [NYSE: ARKK] had $1.5 billion in notional put delta expire) which, in theory, should open a window of strength and realized volatility, wherein positive fundamental forces and dealers’ covering of hedges would bolster any recovery, the January 21 expiry still carries $1.7 billion in notional put delta.

Continued weakness and higher volatility, among other things, likely solicits dealer hedging of exposure to increasing positive delta; weakness has dealers selling against short-dated, increasingly sensitive negative gamma positioning.

With breadth still to recover, a clear expansion of range places the S&P 500 below its 20- and 50-day simple moving averages, the levels which solicited responsive buying by short-term, visual traders who often lack the wherewithal (both emotional and financial) to defend retests.

Graphic: Monthly charts of the S&P 500 (top left), Nasdaq 100 (top right), Russell 2000 (bottom left), Dow Jones Industrial Average (bottom right). All indices come into major support areas.

Context: “The Fed is seen responding to the inflation fears stalking businesses by leaning toward an older playbook of prioritizing the fight against price pressures — even if that risks weaker growth over the longer term,” per Bloomberg.

Notwithstanding, per Nasdaq, “growth in earnings is so far stronger than the multiple compression caused by rising rates,” and that is what has helped support this year’s rally.

Couple that with the management of massive S&P positions, and relentless, seasonally-aligned “passive buying support,” in the face of expectations there will be “the strongest quarterly nominal [economic] growth in more than three decades,” weakness (especially in growth-heavy and rate-sensitive names) remains.

Graphic: Positively skewed return distribution amidst “natural, passive buying,” and supportive positioning metrics. Data SqueezeMetrics. Graph via Physik Invest.

That’s due in part to some of the dynamics discussed in an earlier section, coupled with some negative fundamental developments like the rejection of an economic stimulus package, cuts to Goldman Sachs Group’s GDP forecasts, among other things.

I end with a note from JPMorgan Chase & Co’s (NYSE: JPM) Marko Kolanovic who expects a year-end rally to be driven by stocks targeted by short-sellers. 

“For short-selling campaigns to succeed, there have to be positioning, liquidity and often systematic amplifiers of the selloff,” Kolanovic wrote. 

“We believe these conditions are not met, and hence this market episode may end up in a short squeeze and cyclical rally into year-end and January.” 

That aligns with light positioning, improving seasonality metrics, and data that suggests equity markets tend to rally into the first hike.

Graphic: S&P 500 performance before and after rate hikes.

Expectations: As of 6:40 AM ET, Monday’s regular session (9:30 AM – 4:00 PM ET), in the S&P 500, will likely open in the middle part of a negatively skewed overnight inventory, outside of prior-range and -value, suggesting a potential for immediate directional opportunity.

Gap Scenarios: Gaps ought to fill quickly. Should they not, that’s a signal of strength; do not fade. Leaving value behind on a gap-fill or failing to fill a gap (i.e., remaining outside of the prior session’s range) is a go-with indicator.

Auctioning and spending at least 1-hour of trade back in the prior range suggests a lack of conviction; in such a case, do not follow the direction of the most recent initiative activity.

In the best case, the S&P 500 trades sideways or higher; activity above the $4,548.75 low volume area (LVNode) puts in play the $4,574.25 high volume area (HVNode). Initiative trade beyond the HVNode could reach as high as the $4,590.00 regular trade low (RTH Low) and $4,623.00 untested point of control (VPOC), or higher.

In the worst case, the S&P 500 trades lower; activity below the $4,548.75 LVNode puts in play the $4,523.00 VPOC. Initiative trade beyond the VPOC could reach as low as the $4,492.25 RTH Low and $4,471.00 VPOC, or lower.

Click here to load today’s key levels into the web-based TradingView charting platform. Note that all levels are derived using the 65-minute timeframe. New links are produced, daily.
Graphic: 65-minute profile chart of the Micro E-mini S&P 500 Futures. Learn about the profile.

Definitions

Volume Areas: A structurally sound market will build on areas of high volume (HVNodes). Should the market trend for long periods of time, it will lack sound structure, identified as low volume areas (LVNodes). LVNodes denote directional conviction and ought to offer support on any test. 

If participants were to auction and find acceptance into areas of prior low volume (LVNodes), then future discovery ought to be volatile and quick as participants look to HVNodes for favorable entry or exit.

POCs: POCs are valuable as they denote areas where two-sided trade was most prevalent in a prior day session. Participants will respond to future tests of value as they offer favorable entry and exit.

MCPOCs: POCs are valuable as they denote areas where two-sided trade was most prevalent over numerous day sessions. Participants will respond to future tests of value as they offer favorable entry and exit.

Volume-Weighted Average Prices (VWAPs): A metric highly regarded by chief investment officers, among other participants, for quality of trade. Additionally, liquidity algorithms are benchmarked and programmed to buy and sell around VWAPs.

About

After years of self-education, strategy development, and trial-and-error, Renato Leonard Capelj began trading full-time and founded Physik Invest to detail his methods, research, and performance in the markets.

Additionally, Capelj is a Benzinga finance and technology reporter interviewing the likes of Shark Tank’s Kevin O’Leary, JC2 Ventures’ John Chambers, and ARK Invest’s Catherine Wood, as well as a SpotGamma contributor, helping develop insights around impactful options market dynamics.

Disclaimer

At this time, Physik Invest does not carry the right to provide advice. In no way should the materials herein be construed as advice. Derivatives carry a substantial risk of loss. All content is for informational purposes only.

Categories
Commentary

Daily Brief For November 5, 2021

Abstract

Equity index futures higher. Commodities were higher. Bonds mixed. Volatility compressed.

Ahead is a heavier day of economic releases, in the face of fundamental narratives and positioning metrics that may support intraday price stability.

What Happened

Overnight, equity index futures were marked up ahead of the House’s plan to vote on President Joe Biden’s economic package and infrastructure, as well as October jobs data.

Also, in the news, there were narratives surrounding China’s dollar surplus, a pandemic resurgence in Europe, Pfizer Inc’s (NYSE: PFE) development of a pill for COVID-19.

Ahead is data on payrolls, unemployment, and average hourly earnings (8:30 AM ET), as well as consumer credit (3:00 PM ET). I apologize as this is what I listed yesterday, mistakenly.

Graphic updated 6:30 AM ET. Sentiment Risk-On if expected /ES open is above the prior day’s range. /ES levels are derived from the profile graphic at the bottom of the following section. Levels may have changed since initially quoted; click here for the latest levels. SqueezeMetrics Dark Pool Index (DIX) and Gamma (GEX) calculations are based on where the prior day’s reading falls with respect to the MAX and MIN of all occurrences available. A higher DIX is bullish. At the same time, the lower the GEX, the more (expected) volatility. Learn the implications of volatility, direction, and moneyness. SHIFT data used for S&P 500 (INDEX: SPX) options activity. Note that options flow is sorted by the call premium spent; if more positive then more was spent on call options. Breadth reflects a reading of the prior day’s NYSE Advance/Decline indicator. VIX reflects a current reading of the CBOE Volatility Index (INDEX: VIX) from 0-100.

What To Expect

On weak intraday breadth and lackluster market liquidity metrics, the best case outcome occurred, evidenced by balanced trade at newly discovered S&P 500 prices.

As also evidenced by the separation of value, overnight, the gap out of yesterday’s range marks a potential willingness to continue the uptrend.

To note, poor structure left behind prior initiative trade adds to technical instability, a dynamic mentioned in prior commentaries. Participants will likely look to check old value (i.e., revisit, repair, and strengthen) pockets of low-volume, feverishly, on any breakdown of trend.

Graphic: Flat delta (i.e., non-committed buying/selling as measured by volume delta or buying and selling power as calculated by the difference in volume traded at the bid and offer) in SPDR S&P 500 ETF Trust (NYSE: SPY), via Bookmap. The readings are supportive of responsive trade (i.e., rotational trade that suggests current prices offered favorable entry and exit).

Context: The aforementioned trade is happening in the context of a slowdown in economic growth, increased clarity on the Federal Reserve’s (Fed) intent to moderate stimulus, as well as the prospects of renewed fiscal support.

The implications of these narratives on price are contradictory.

To elaborate, supply chain disruptions slowed the pace of economic growth, while participants saw both the Fed’s decision to taper and keep rates unchanged, as well as the potential passage of President Biden’s economic plan, today, as near-term positives.

In terms of positioning, the CBOE Volatility Index (INDEX: VIX) was lower, while supply came in across the VIX futures term structure. That, alongside the long-gamma environment and increased demand for options above current prices (i.e., bets on the upside), points to increased odds of near-term equity market stability.

To quote options analysis and data provider SpotGamma, “​​the term structure of IV (this is how high the IV is for longer-dated options) remains elevated. That suggests near term options could have more ‘bleed’ which could keep the SPX market price tailwind intact.”

Expectations: As of 6:30 AM ET, Friday’s regular session (9:30 AM – 4:00 PM ET), in the S&P 500, will likely open in the upper part of a positively skewed overnight inventory, outside of prior-range and -value, suggesting a potential for immediate directional opportunity.

Gap Scenarios: Gaps ought to fill quickly. Should they not, that’s a signal of strength; do not fade. Leaving value behind on a gap-fill or failing to fill a gap (i.e., remaining outside of the prior session’s range) is a go-with indicator.

Auctioning and spending at least 1-hour of trade back in the prior range suggests a lack of conviction; in such a case, do not follow the direction of the most recent initiative activity.

In the best case, the S&P 500 trades sideways or higher; activity above the $4,663.00 untested point of control (VPOC) puts in play the $4,684.25 overnight high (ONH). Initiative trade beyond the ONH could reach as high as the $4,705.25 and $4,725.50 Fibonacci, or higher.

In the worst case, the S&P 500 trades lower; activity below the $4,663.00 VPOC puts in play the $4,619.00 VPOC. Initiative trade beyond the VPOC could reach as low as the $4,590.00 balance boundary and $4,574.25 high volume area (HVNode), or lower.

Click here to load today’s updated key levels into the web-based TradingView charting platform. Note that all levels are derived using the 65-minute timeframe. New links are produced, daily.
Graphic: 65-minute profile chart of the Micro E-mini S&P 500 Futures. Learn about the profile.

Charts To Watch

Graphic: (NASDAQ: AMZN). (S~3403, R~3580). S is for support. R is for resistance. I am seeking to initiate short-duration call structures against the 3580 gap fill and prior all-time high. Will initiate for credit or finance with put structures.
Graphic: (NASDAQ: FB). (S~326.45, R~336.90). S is for support. R is for resistance. If the stock was to maintain prices above 336.90, there is a potential change in tone. In such a case, I’m targeting Fibonacci retracements with call structures financed with credits on the put side.
Graphic: (NASDAQ: GOOGL). (S~2900, R~3113). S is for support. R is for resistance. I’m targeting prices between 3000 and 3100 with call structures for low cost or credit.
Graphic: (NYSE: SHOP). (S~1482, R~1650). S is for support. R is for resistance. Potential break of trend, move to an all-time high.
Graphic: (NYSE: IWM). (S~234.53, R~241.96, 251.41). S is for support. R is for resistance. Russell 2000 breaks out of balance. In my opinion, upon acceptance, there are potential opportunities for long trades.

Other charts I’m watching include BABA (S~155.29), ZM (S~245.92), ARKK (S~120.15), PINS (S~42.06), Z (S~58.15), BBY (S~123.65), GOOS (S~40.91), CTSH (R~82.00), LYFT (S~44.41), TMUS (S~118.00), WDC (51.47). S is for support. R is for resistance. 

What People Are Saying

Definitions

Cave-Fill Process: Widened the area deemed favorable to transact at by an increased share of participants. This is a good development.

Overnight Rally Highs (Lows): Typically, there is a low historical probability associated with overnight rally-highs (lows) ending the upside (downside) discovery process.

Volume Areas: A structurally sound market will build on areas of high volume (HVNodes). Should the market trend for long periods of time, it will lack sound structure, identified as low volume areas (LVNodes). LVNodes denote directional conviction and ought to offer support on any test. 

If participants were to auction and find acceptance into areas of prior low volume (LVNodes), then future discovery ought to be volatile and quick as participants look to HVNodes for favorable entry or exit.

Gamma: Gamma is the sensitivity of an option to changes in the underlying price. Dealers that take the other side of options trades hedge their exposure to risk by buying and selling the underlying. When dealers are short-gamma, they hedge by buying into strength and selling into weakness. When dealers are long-gamma, they hedge by selling into strength and buying into weakness. The former exacerbates volatility. The latter calms volatility.

POCs: POCs are valuable as they denote areas where two-sided trade was most prevalent in a prior day session. Participants will respond to future tests of value as they offer favorable entry and exit.

Balance (Two-Timeframe Or Bracket): Rotational trade that denotes current prices offer favorable entry and exit. Balance-areas make it easy to spot a change in the market (i.e., the transition from two-time frame trade, or balance, to one-time frame trade, or trend). 

Modus operandi is responsive trade (i.e., fade the edges), rather than initiative trade (i.e., play the break).

Value-Area Placement: Perception of value unchanged if value overlapping (i.e., inside day). Perception of value has changed if value not overlapping (i.e., outside day). Delay trade in the former case.

About

After years of self-education, strategy development, and trial-and-error, Renato Leonard Capelj began trading full-time and founded Physik Invest to detail his methods, research, and performance in the markets.

Additionally, Capelj is a Benzinga finance and technology reporter interviewing the likes of Shark Tank’s Kevin O’Leary, JC2 Ventures’ John Chambers, and ARK Invest’s Catherine Wood, as well as a SpotGamma contributor, developing insights around impactful options market dynamics.

Disclaimer

At this time, Physik Invest does not manage outside capital and is not licensed. In no way should the materials herein be construed as advice. Derivatives carry a substantial risk of loss. All content is for informational purposes only.