Editor’s Note: In pursuing quality, we want to emphasize that we presented an inadequate definition in the haste to publish this letter. The Volume-Weighted Average Price (VWAP) reflects the average price at which an asset has traded over a specific period, weighted by volume. It is calculated by multiplying the price of each trade by the number of shares traded at that price, summing these products, and dividing by the total shares traded during that timeframe. We sincerely apologize for that!
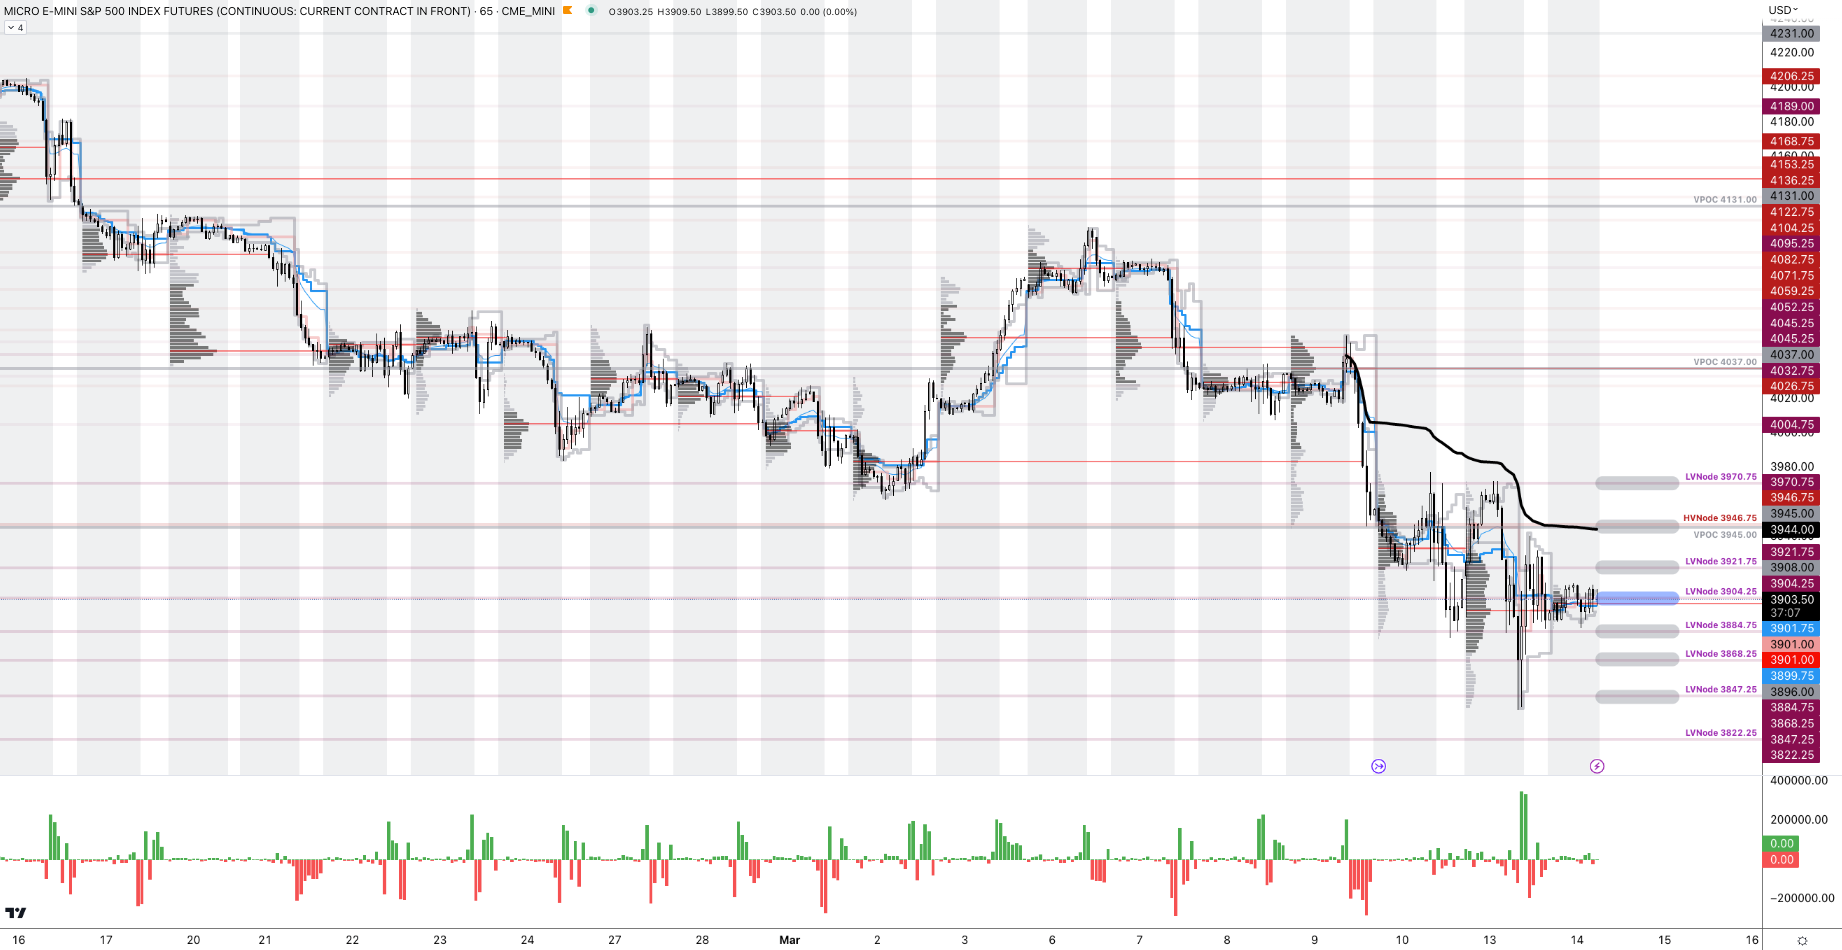
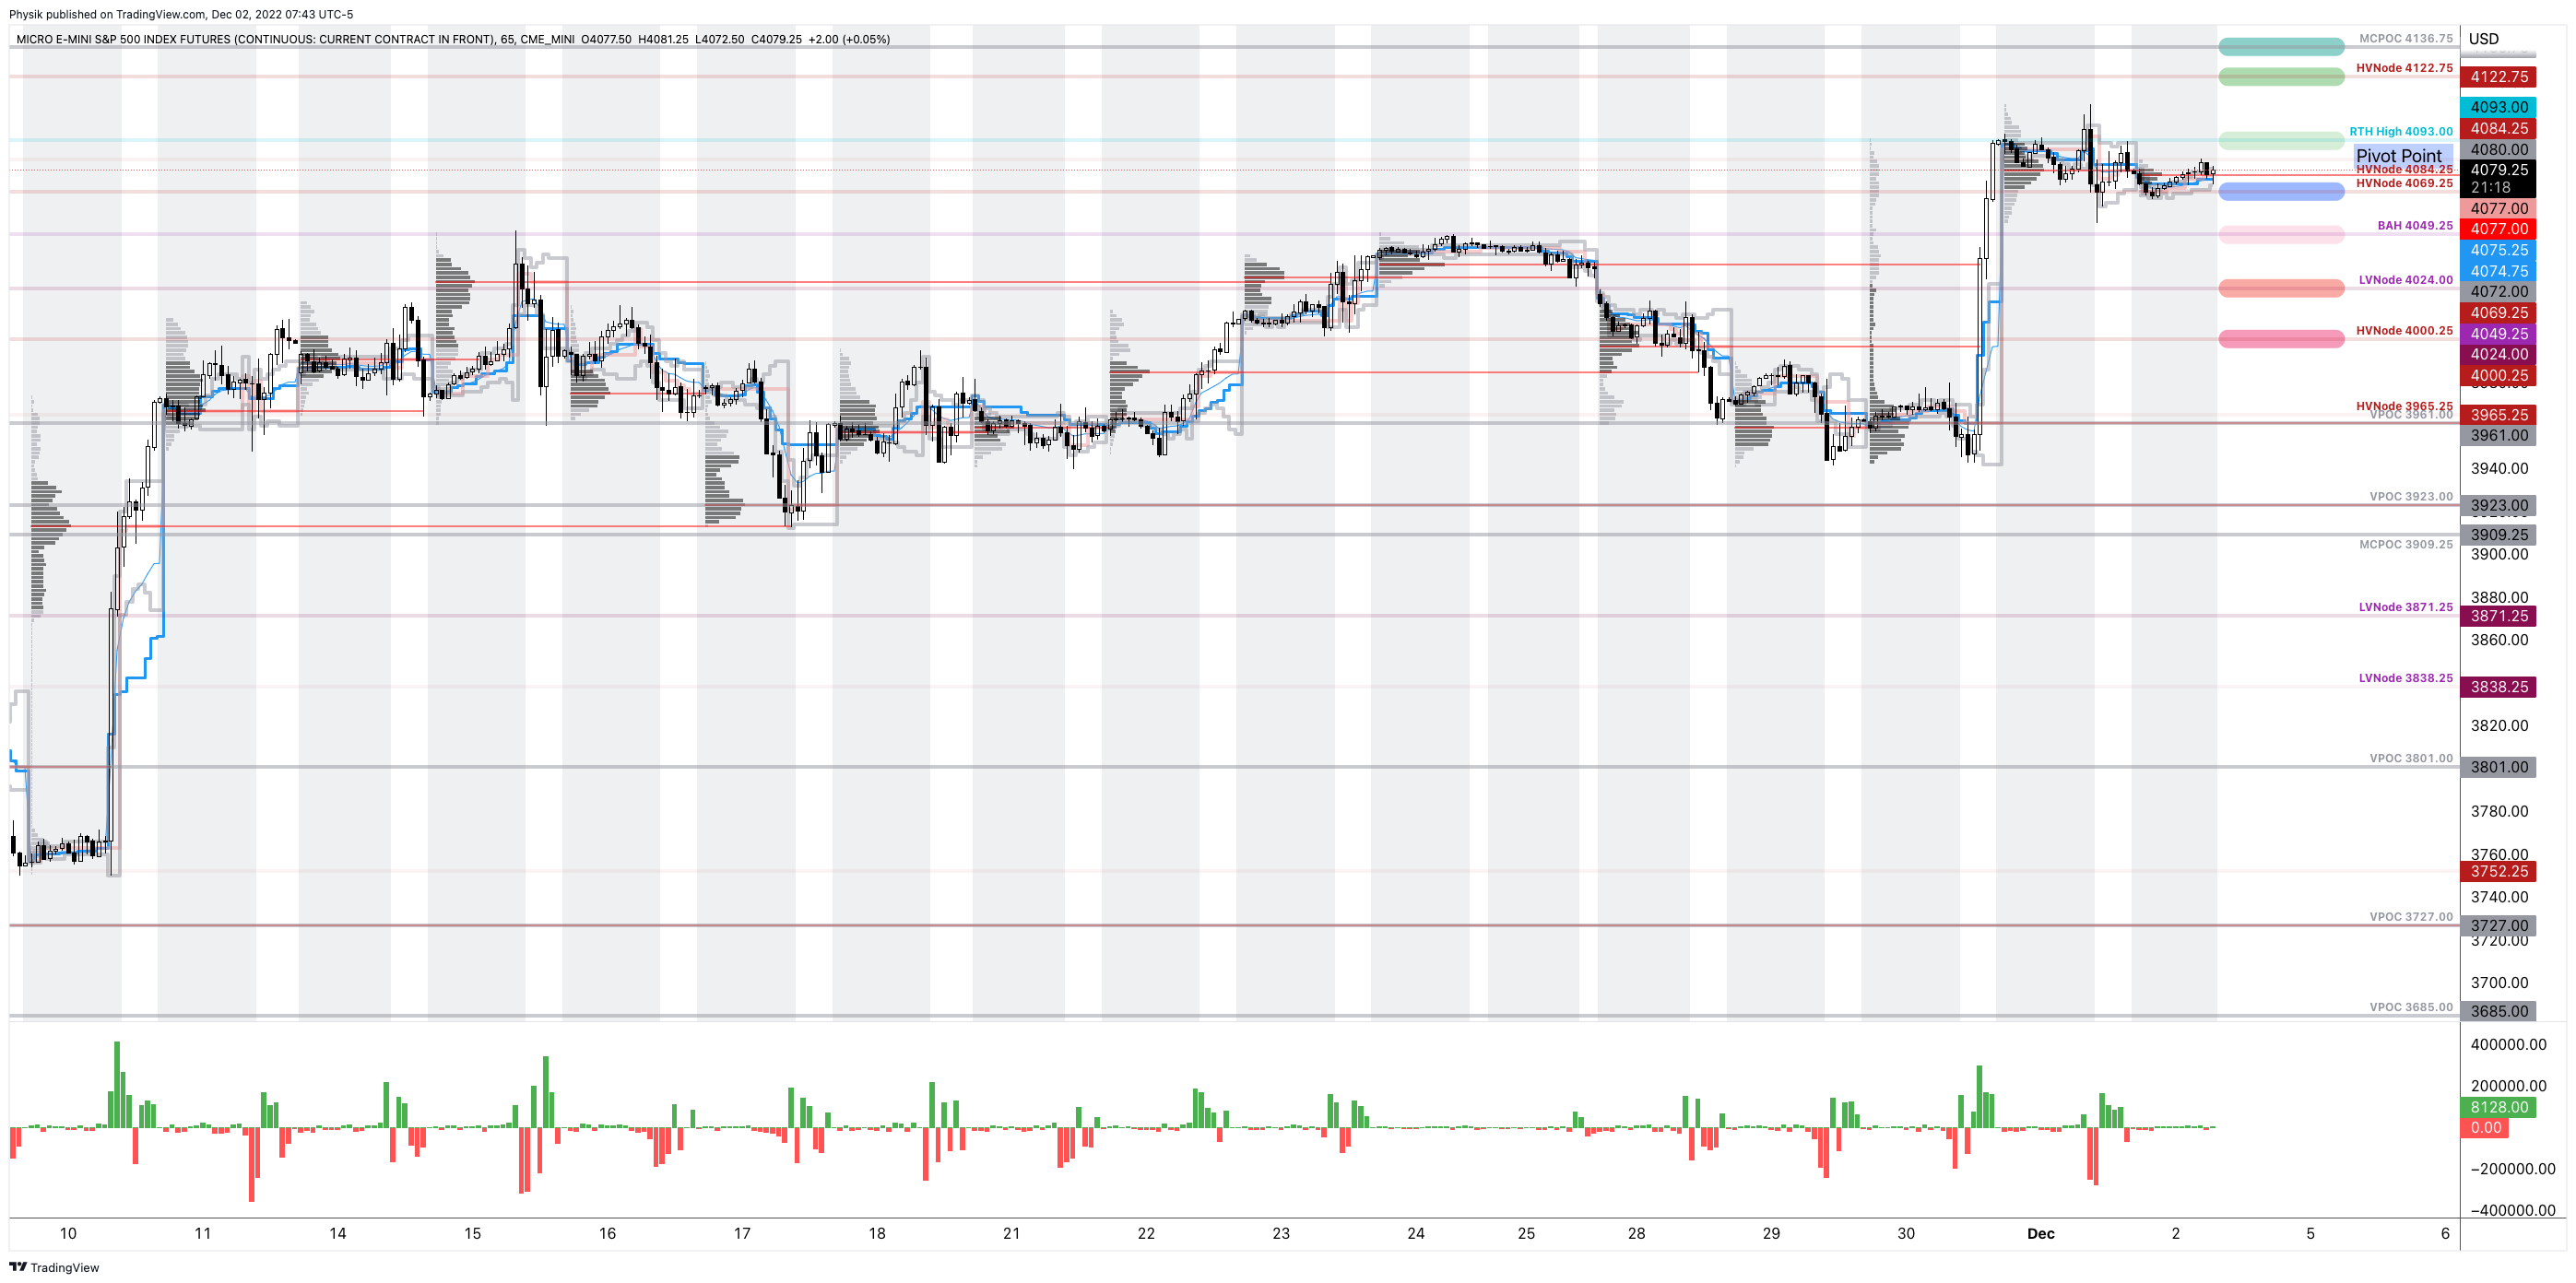
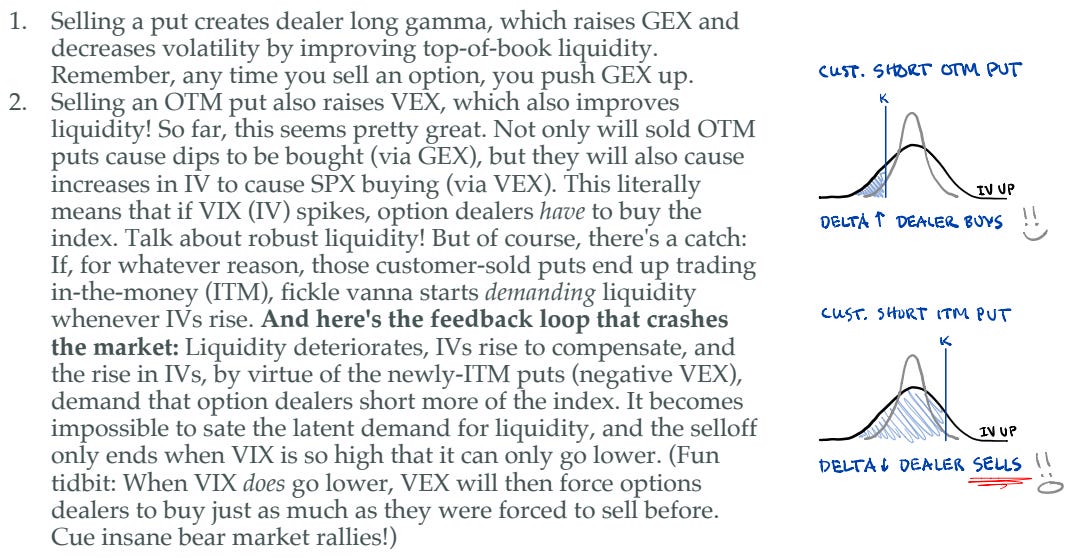
Our technical analysis toolkit is streamlined to prevent analysis paralysis. The primary indicator we rely on is the Volume-Weighted Average Price (VWAP), which combines price and volume to provide a clearer view of an asset’s traded price over time.
Firms like Citadel use VWAP to execute trades, minimizing market impact and achieving better prices. VWAP can be applied to various strategies, including trend identification, mean reversion, and support/resistance trading.
Below, we explain VWAP and recommend following experts on the topic, like Brian Shannon of AlphaTrends. Additionally, platforms like TradingView offer this tool free.
What is Anchoring?
Anchoring is a psychological bias where people rely heavily on the first piece of information they encounter when making decisions. In financial markets, price levels often act as anchors that influence trading behavior. For example:
- “If the price hits this level, I’ll take profit.”
- “If it drops below this level, I’ll cut my losses.”
These anchor points serve as the basis for support and resistance levels in technical analysis. At support, there is buying interest (demand); at resistance, there is selling interest (supply). When these levels are breached, their roles can reverse: previous resistance can turn into new support, and vice versa.
Why Anchoring Matters?
Think of the average price people pay to enter a trade. Future decisions, like selling or holding, are often based on this price. If the price breaks a significant support level, traders who bought at higher prices may rush to sell to avoid further losses, creating resistance at those levels.
What are VWAPs?
Volume-Weighted Average Price (VWAP) is calculated by multiplying the price of each trade by the number of shares traded at that price, summing these values, and then dividing by the total shares traded during the period.
The Anchored VWAP (AVWAP) extends this concept by incorporating time, price, and volume to determine the average price participants have paid since a specific starting point. This starting point could be a pivotal event, such as:
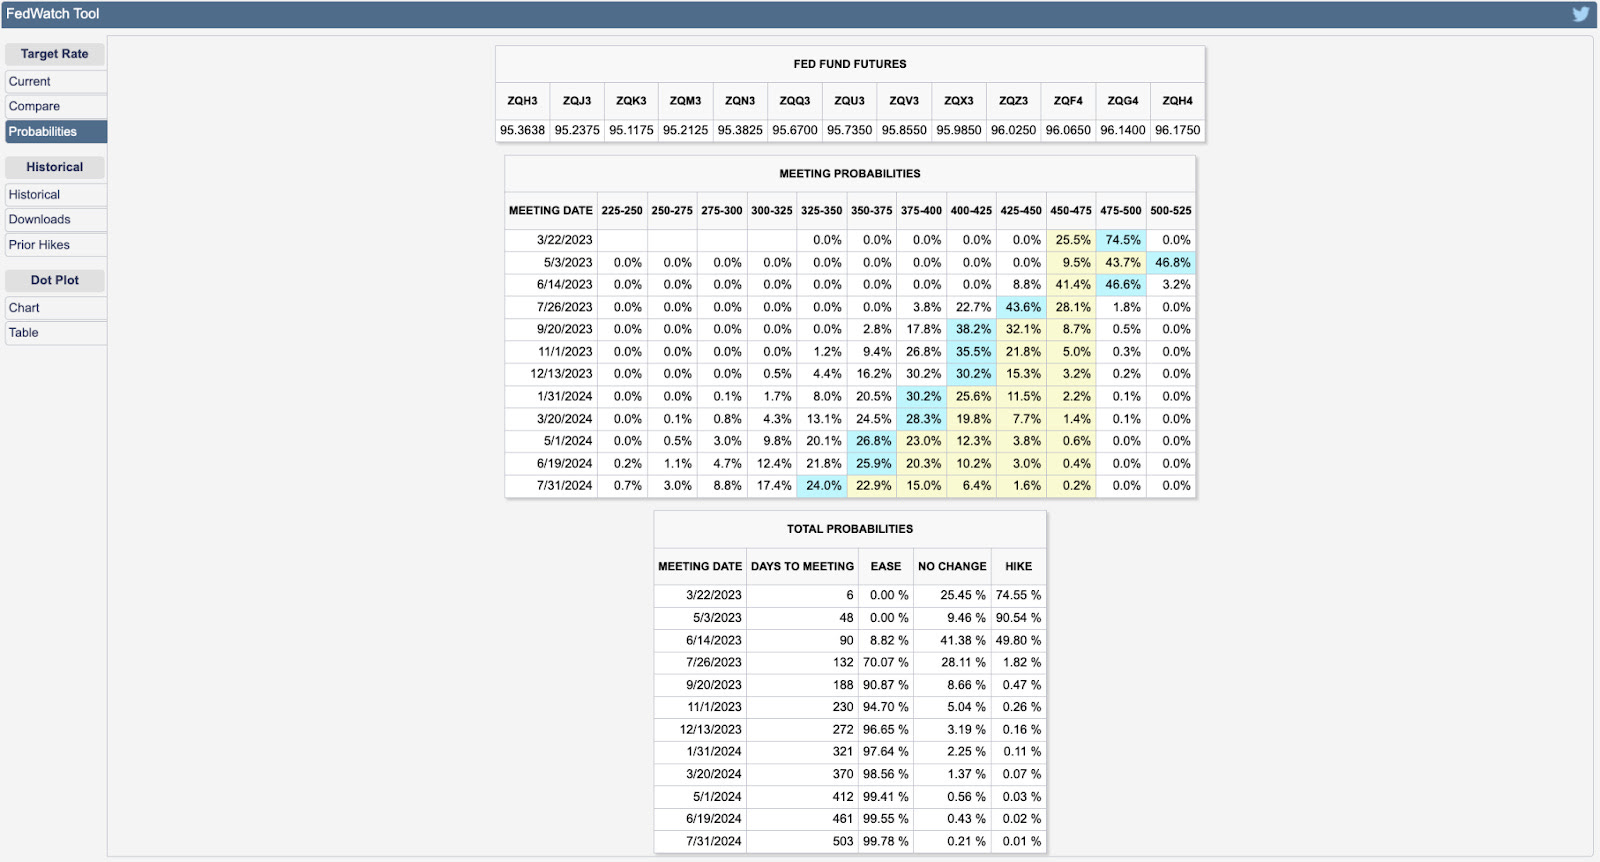
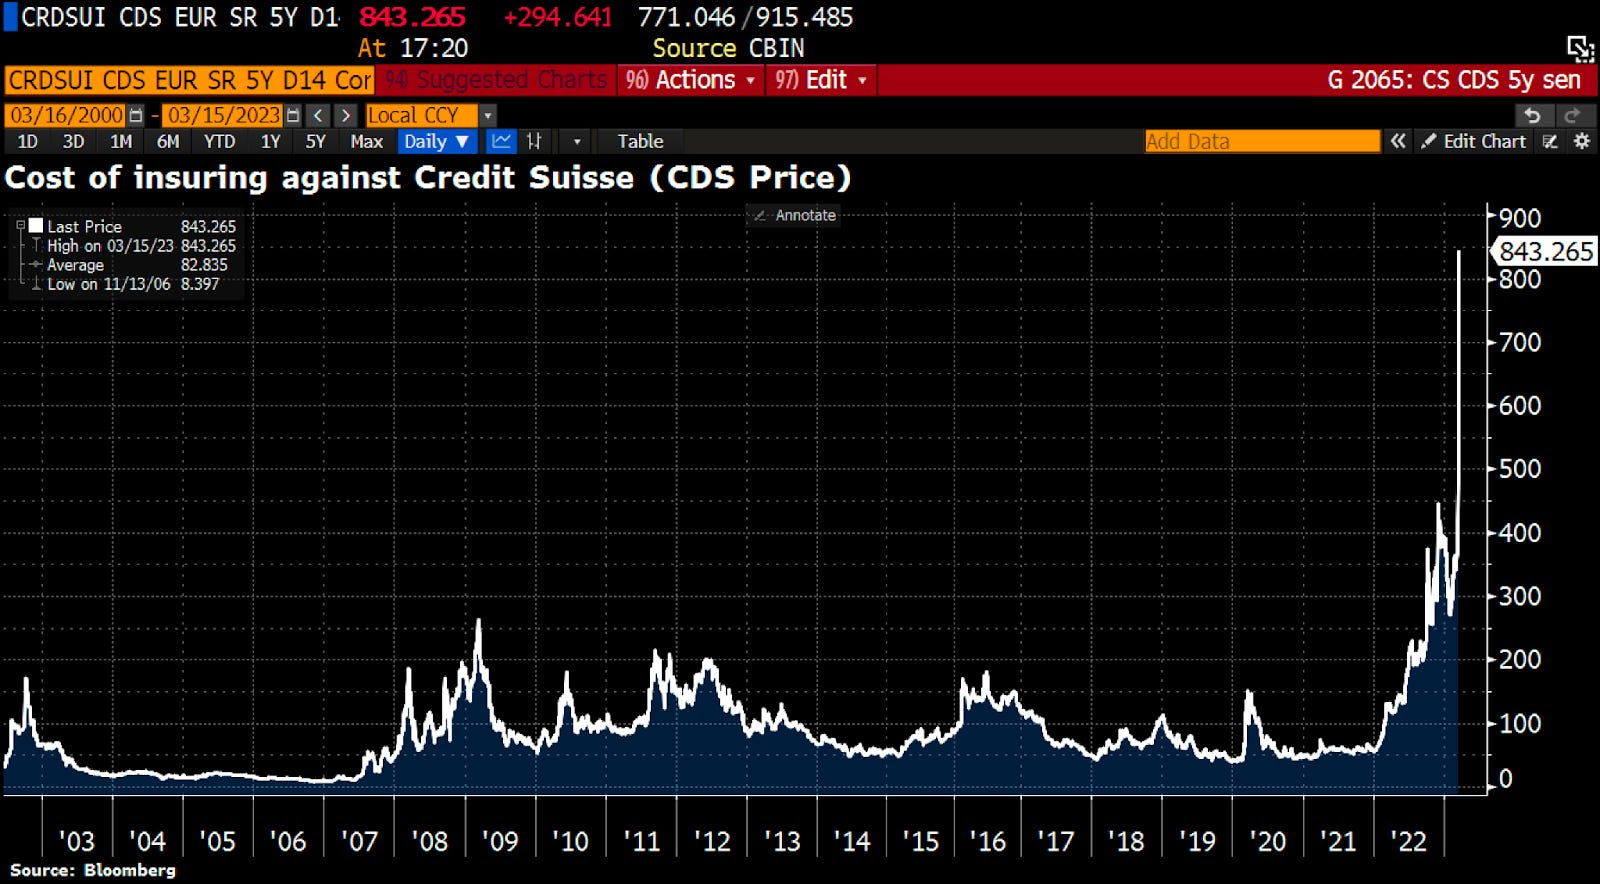
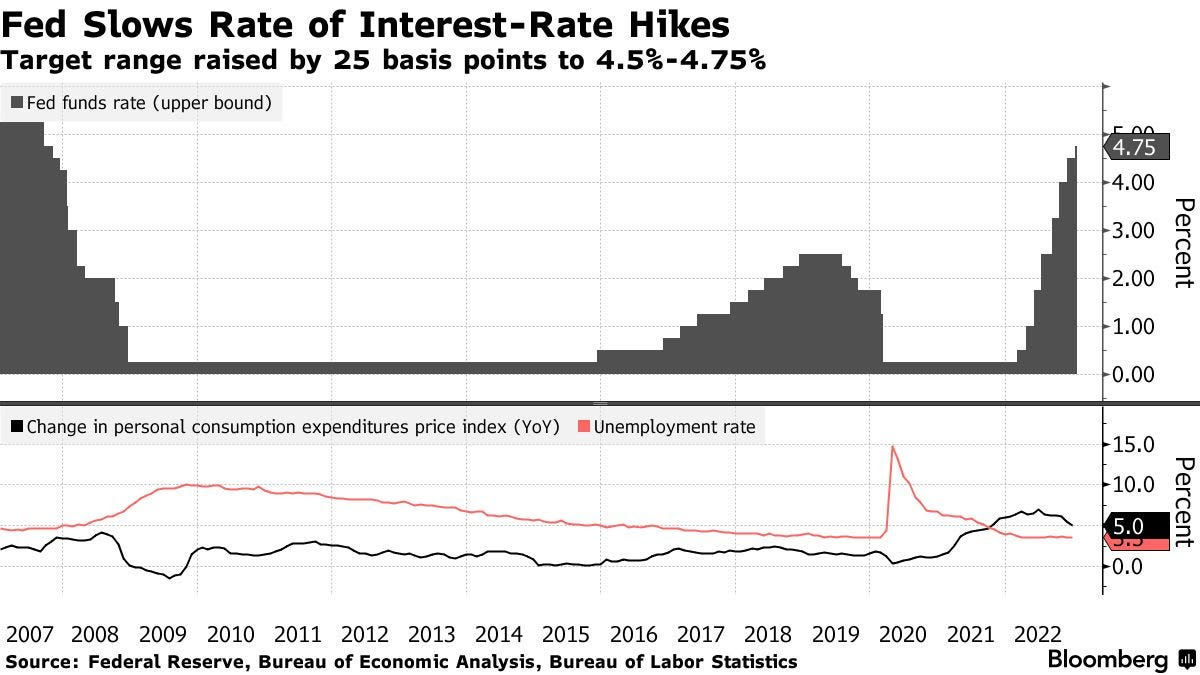
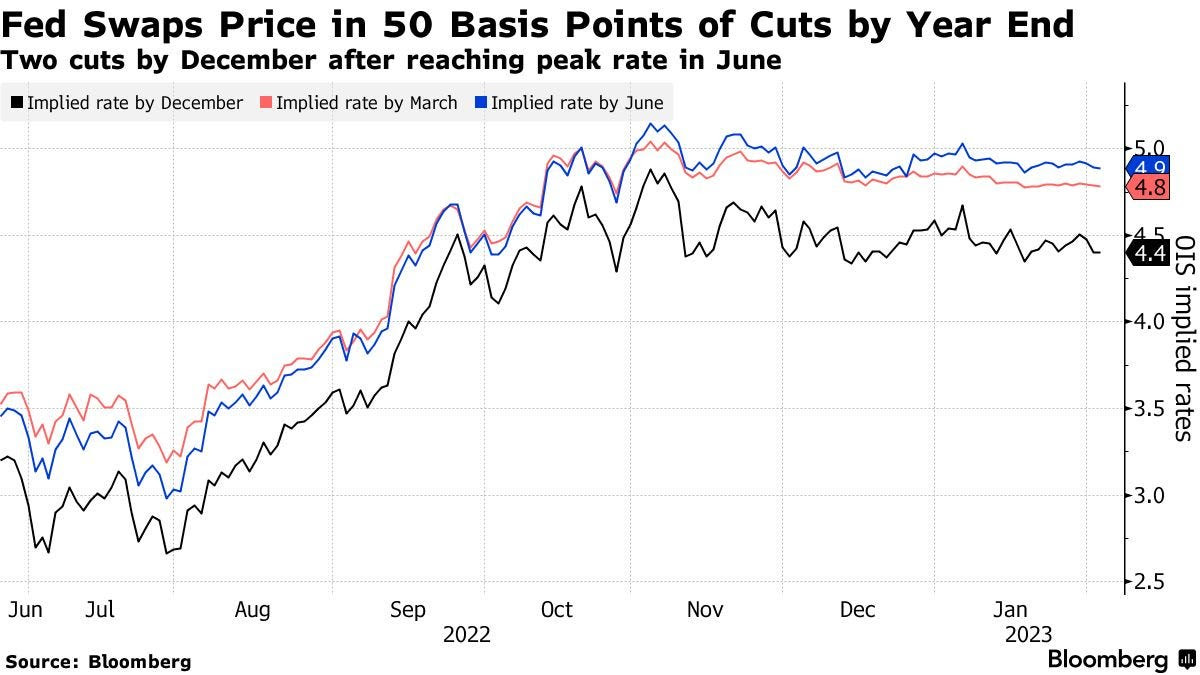
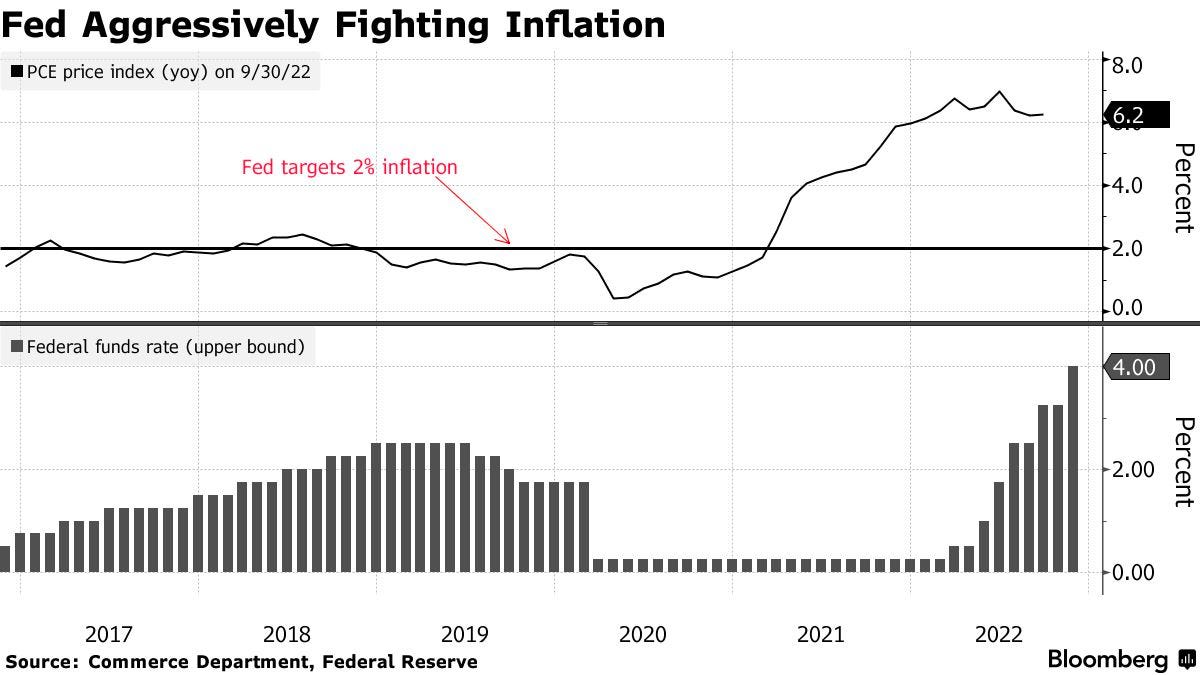
- A significant announcement (e.g., earnings, Federal Reserve decisions).
- The start of a new trading period (e.g., month-to-date, year-to-date).
- A considerable price movement (e.g., swing highs or lows).
AVWAP helps answer:
- Have most traders been in a winning or losing position since the anchor date?
- Where might support or resistance form based on trading activity?
AVWAP in Action
- Above AVWAP: Most participants are profitable if the price exceeds the AVWAP line.
- Below AVWAP: Most participants are likely at a loss if the price is below the AVWAP line.
- Clusters of AVWAPs: Multiple AVWAP lines close together often create strong support or resistance zones.

Sample Uses
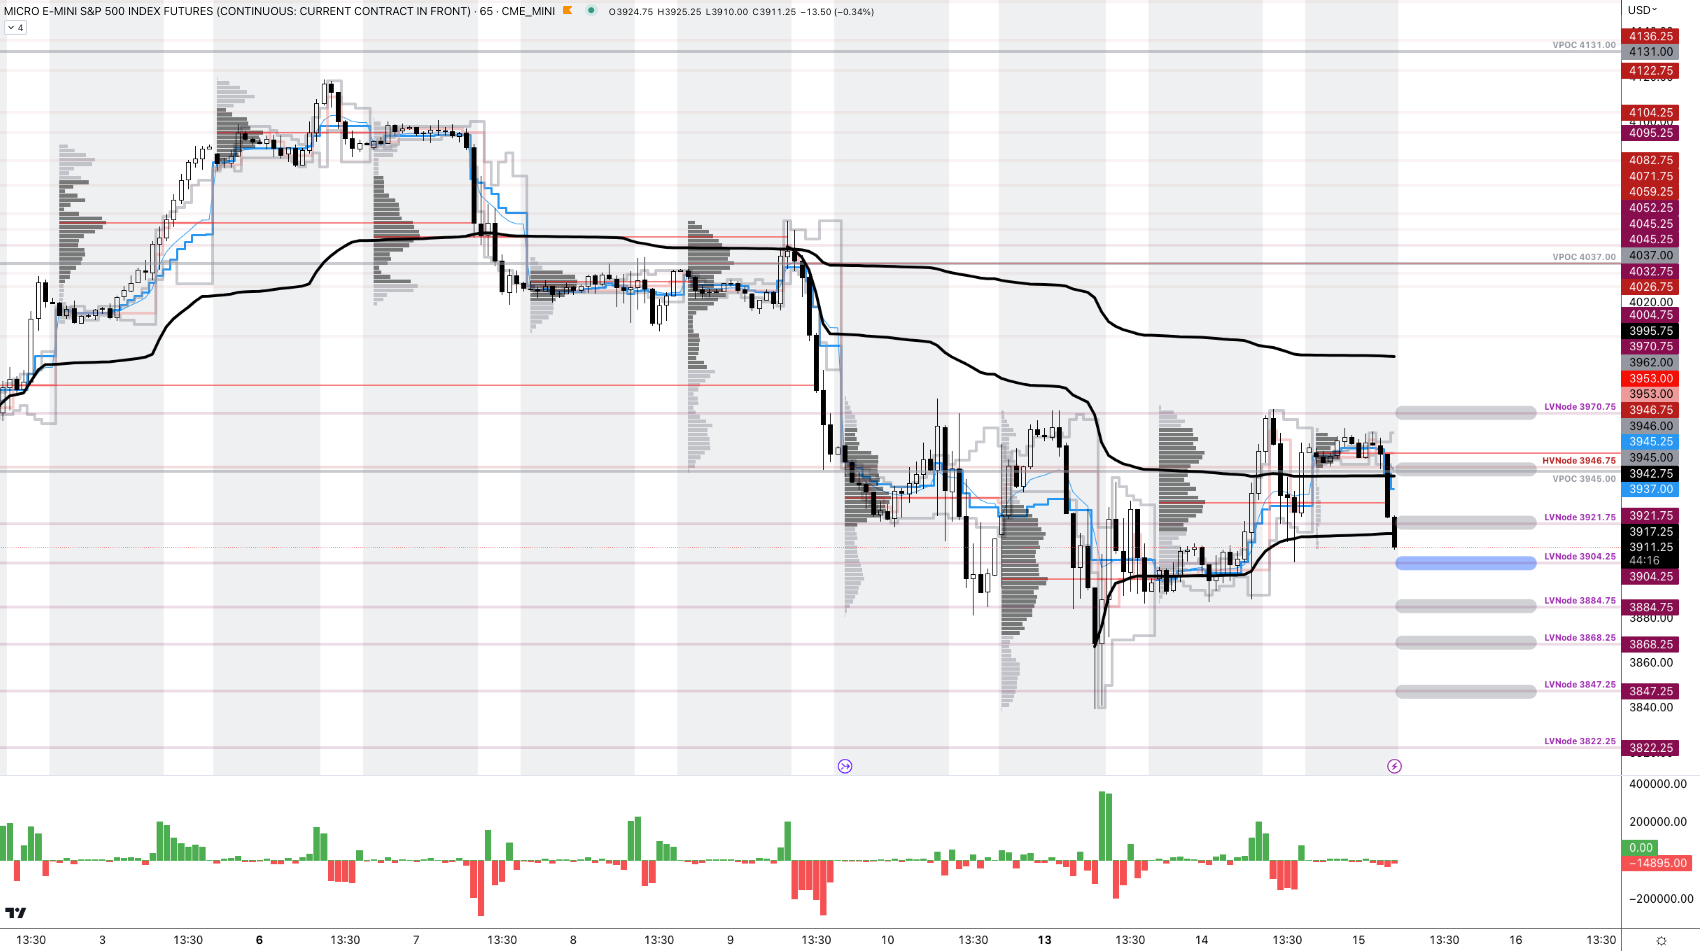
- Intraday Support: In short-term trading (e.g., 2-minute charts), a rising AVWAP often acts as support. Prices may repeatedly bounce off the AVWAP line during the trading session.

- Breaking Trends: In this example with Shopify Inc (NYSE: SHOP), the stock broke an uptrend, and the AVWAP line from earlier highs acted as resistance. Traders could use this to decide where to sell or avoid buying.

- Momentum Trading: Expanding on breaking trends, when trading stocks with strong prior momentum, the AVWAP from the latest spike high can serve as a dependable level to take profits. Here’s an example from Brian Shannon himself.

Why AVWAP Works
AVWAP is popular because Chief Investment Officers use it to evaluate trade quality, and liquidity algorithms are frequently designed to buy or sell near the VWAP, establishing it as a benchmark for institutional trading.
A Practical Application
When AVWAP lines from previous peaks and troughs come together, the stock often breaks out decisively above or below this “pinch” zone. For a depressed stock, pairing an AVWAP pinch with a rising short interest can prepare us for a squeeze! Below is an excellent example from Brian Shannon.

Combining AVWAP with Other Indicators
To enhance decision-making, we can pair AVWAP with:
- Simple Moving Averages: A rising moving average signals buying interest.
- Volume Data: To confirm whether trading activity supports the price levels.
Key Takeaways
The AVWAP provides a more customized view by anchoring the VWAP calculation to a specific point in time (e.g., a significant price level or event), which helps view price, volume, and time factors more dynamically. It is most effective alongside other tools like market profiles, volume profiles, and moving averages.
Disclaimer
By viewing our content, you agree to be bound by the terms and conditions outlined in this disclaimer. Consume our content only if you agree to the terms and conditions below.
Physik Invest is not registered with the US Securities and Exchange Commission or any other securities regulatory authority. Our content is for informational purposes only and should not be considered investment advice or a recommendation to buy or sell any security or other investment. The information provided is not tailored to your financial situation or investment objectives.
We do not guarantee the accuracy, completeness, or timeliness of any information. Please do not rely solely on our content to make investment decisions or undertake any investment strategy. Trading is risky, and investors can lose all or more than their initial investment. Hypothetical performance results have limitations and may not reflect actual trading results. Other factors related to the markets and specific trading programs can adversely affect actual trading results. We recommend seeking independent financial advice from a licensed professional before making investment decisions.
We don’t make any claims, representations, or warranties about the accuracy, completeness, timeliness, or reliability of any information we provide. We are not liable for any loss or damage caused by reliance on any information we provide. We are not liable for direct, indirect, incidental, consequential, or damages from the information provided. We do not have a professional relationship with you and are not your financial advisor. We do not provide personalized investment advice.
Our content is provided without warranties, is the property of our company, and is protected by copyright and other intellectual property laws. You may not be able to reproduce, distribute, or use any content provided through our services without our prior written consent. Please email renato@physikinvest for consent.
We reserve the right to modify these terms and conditions at any time. Following any such modification, your continued consumption of our content means you accept the modified terms. This disclaimer is governed by the laws of the jurisdiction in which our company is located.