
Physik Invest’s Daily Brief is read by thousands of subscribers. You, too, can join this community to learn about the fundamental and technical drivers of markets.

Fundamental
Consumer price updates (CPI) have traders pricing (even) higher rates for longer.
Yesterday’s data showed goods deflation is underway while services inflation persists. Per Unlimited’s Bob Elliott, “the picture of inflation for the Fed today is considerably less sanguine than at the last meeting.”

This new data confirms the hawkishness expressed by the Federal Reserve’s (Fed) Jerome Powell last week. US Treasury interest rates shifted higher, accordingly.

CME Group Inc’s (NASDAQ: CME) FedWatch Tool places the terminal rate at 5.25-5.50%, up from 5.00-5.25% on Tuesday before the CPI release. Easing is set to happen this year still in the November-December timeframe.
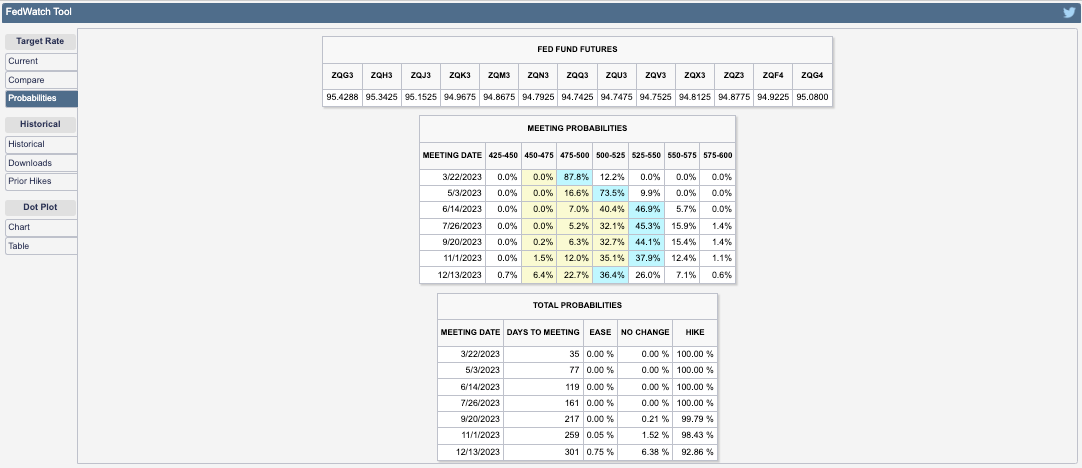
Recall “a higher interest rate environment implies a more potent” monetary tightening and heavier flow of capital out of capital markets (i.e., quantitative tightening or QT), to quote former Fed trader Joseph Wang.
The pressure from the sale of assets (e.g., USTs, MBSs) will increase interest rates and move yield-seeking market participants out of risk, hence the expectation that pressure persists on equities in 2023.
In other words, processes like QT manifest themselves as less demand for assets. Per Fabian Wintersberger, central bankers must “recycle bonds into the markets on an unprecedented scale, which could easily lead to lower bond prices/higher yields” causing a “reflux of capital to safe-haven assets, like treasuries.”
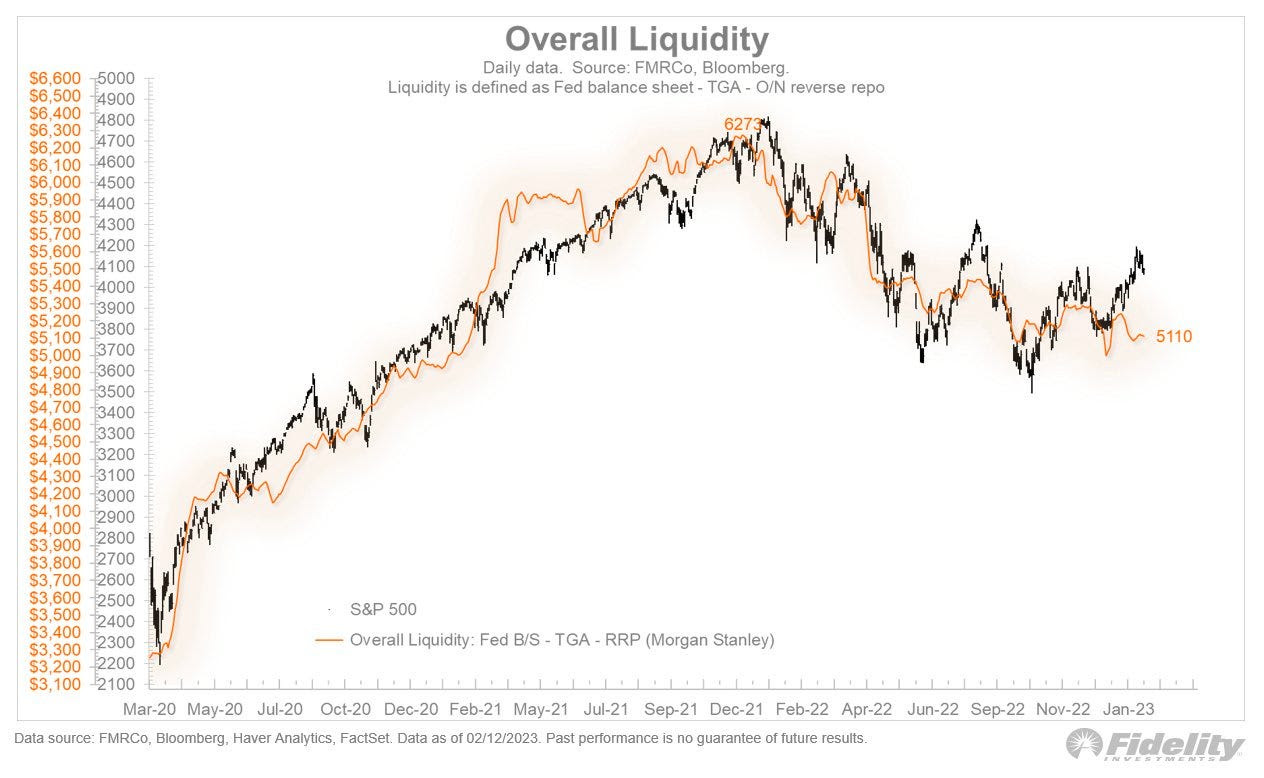
You can produce the above chart yourself. Fed Balance Sheet data, here. Treasury General Account Data, here. Reverse Repo data, here. NL = BS – TGA – RRP.
Moreover, the above chart which this letter has produced for you in the past and some would say is naive, shows so-called net liquidity.
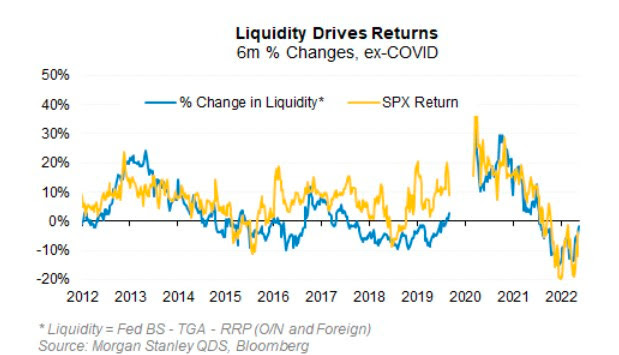
But, according to Morgan Stanley (NYSE: MS), the correlation between net liquidity and the S&P 500 (INDEX: SPX), over the past ten years is about ~0.70 and explains more than half of the movement in price-earings multiples over the past decade.
Positioning
After CPI, there was short-lived relief, as this letter expected. Following CPI, weakness surfaced and measures of traders’ activity in options markets showed a bearish tilt.
Big trades that fired off include the purchase of put options expiring in March on the S&P 500 and call options expiring in May on the Cboe Volatility Index (INDEX: VIX).
The net effect is pressure on the indexes that remain well-supported and compressed heading into big options expirations (OpEx) this week, after which the door may open to enable them to move freely and in sync with their constituents, some of which, like Alphabet Inc (NASDAQ: GOOGL) (NASDAQ: GOOG), are trading rather weak.

To explain, after OpEx, counterparty exposure to positive gamma (i.e., positive exposure to movement hedged in a way that reduces movement) will decline and “leave markets more at the whim of macro-type repositioning”; counterparties will do less to disrupt and more to bolster (i.e., add to movement). For how to trade (or how these events impact trades), see this case study by Physik Invest.
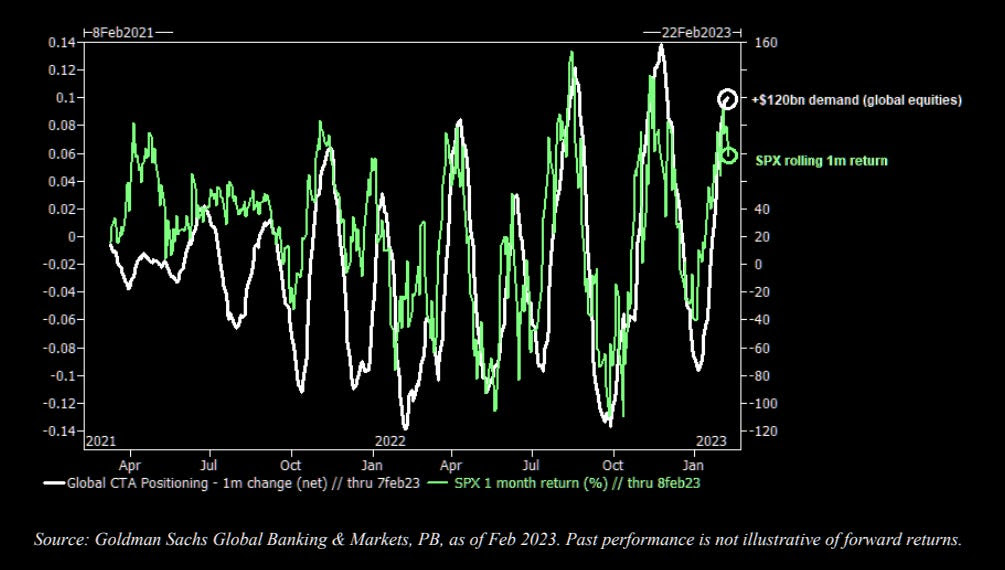
Should there be a large break lower, then “convexity could become an issue,” The Market Ear explained in a statement quoting Goldman Sachs Group Inc (NYSE: GS). “Inflecting CTA flow could translate to an approximately 20% sell-off in US equities over a month in a down-tape scenario.”
Technical
As of 7:30 AM ET, Wednesday’s regular session (9:30 AM – 4:00 PM ET), in the S&P 500, is likely to open in the lower part of a negatively skewed overnight inventory, inside of the prior day’s range, suggesting a limited potential for immediate directional opportunity.
The S&P 500 pivot for today is $4,136.25.
Key levels to the upside include $4,147.00, $4,159.00, and $4,168.75.
Key levels to the downside include $4,122.75, $4,104.25, and $4,083.75.
Disclaimer: Click here to load the updated key levels via the web-based TradingView platform. New links are produced daily. Quoted levels likely hold barring an exogenous development.

Definitions
Volume Areas: Markets will build on areas of high-volume (HVNodes). Should the market trend for a period of time, this will be identified by a low-volume area (LVNodes). The LVNodes denote directional conviction and ought to offer support on any test.
If participants auction and find acceptance in an area of a prior LVNode, then future discovery ought to be volatile and quick as participants look to the nearest HVNodes for more favorable entry or exit.
POCs: Areas where two-sided trade was most prevalent in a prior day session. Participants will respond to future tests of value as they offer favorable entry and exit.
About
The author, Renato Leonard Capelj, works in finance and journalism.
Capelj spends the bulk of his time at Physik Invest, an entity through which he invests and publishes free daily analyses to thousands of subscribers. The analyses offer him and his subscribers a way to stay on the right side of the market. Separately, Capelj is an options analyst at SpotGamma and an accredited journalist.
Capelj’s past works include conversations with investor Kevin O’Leary, ARK Invest’s Catherine Wood, FTX’s Sam Bankman-Fried, Lithuania’s Minister of Economy and Innovation Aušrinė Armonaitė, former Cisco chairman and CEO John Chambers, and persons at the Clinton Global Initiative.
Connect
Direct queries to renato@physikinvest.com or find Physik Invest on Twitter, LinkedIn, Facebook, and Instagram.
Calendar
You may view this letter’s content calendar at this link.
Disclaimer
Do not construe this newsletter as advice. All content is for informational purposes.


