Physik Invest’s Daily Brief is read free by thousands of subscribers. Join this community to learn about the fundamental and technical drivers of markets.
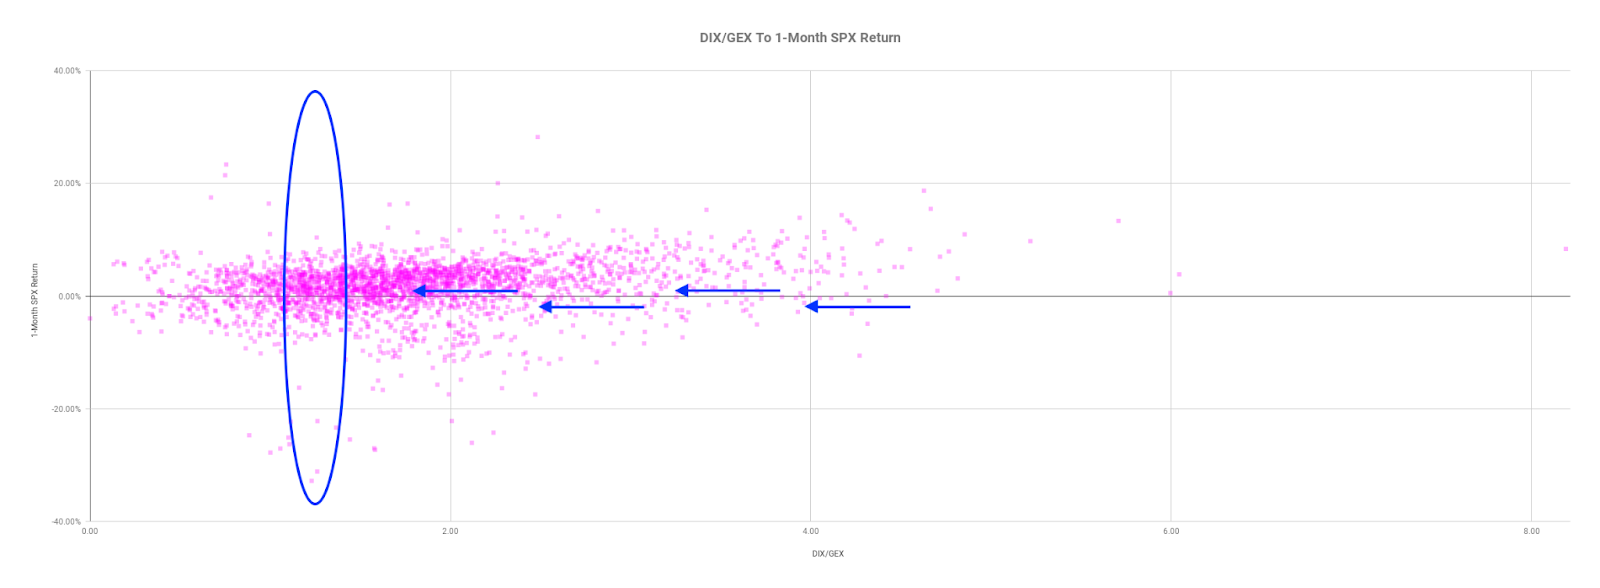
Graphic updated 5:40 AM ET. Sentiment Neutral if expected /MES open is inside of the prior day’s range. /MES levels are derived from the profile graphic at the bottom of this letter. Click here for the latest levels. SqueezeMetrics Dark Pool Index (DIX) and Gamma (GEX) with the latter calculated based on where the prior day’s reading falls with respect to the MAX and MIN of all occurrences available. A higher DIX is bullish. The lower the GEX, the more (expected) volatility. Click to learn the implications of volatility, direction, and moneyness. Breadth reflects a reading of the prior day’s NYSE Advance/Decline indicator. The CBOE VIX Volatility Index (INDEX: VVIX) reflects the attractiveness of owning volatility. UMBS prices via MND. Click here for the economic calendar.
Administrative
Morning, team. Still working on a bigger write-up for later this week. Here are some key things to know. Have a good day!
Positioning
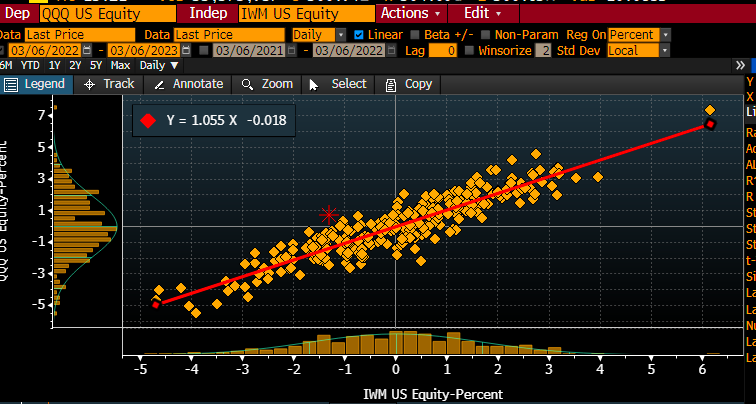
After a boost bolstered by systematic-type investors acting on changes in trend and volatility, the market is at a pivot of sorts.
Graphic: Retrieved from Danny Kirsch of Piper Sandler Companies (NYSE: PIPR). The move in [Nasdaq 100] relative to [the Russell 2000], [S&P 500 versus Russell 2000] looks similar. Ties into re-grossing theme, adding longs (QQQ+SPY) and shorts (IWM). Also fits with recent bid for credit.”
After a test of key areas of confluence, measures of the market’s strength weakened heading into the late-day equity weakness, Monday.
Graphic: Key market internals retrieved from TradingView.
Further, lots of the bullishness of the trend change and falling volatility was spent. The market is in a precarious state heading into Jerome Powell’s testimony, today.
Following Powell’s testimony, ranges likely expand.
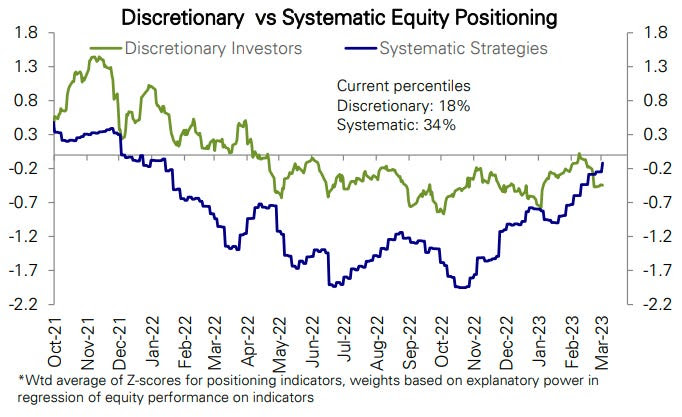
On one hand, FOMO-type demand for call options exposures, coupled with CTAs further “raising their equity exposure” on trend signals and lower volatility, may boost markets into a “more combustible” state the Daily Brief for February 17 explained.
Graphic: Retrieved from Deutsche Bank AG (NYSE: DB) via Bloomberg.
On the other hand, in the context of liquidity coming off of the table and the increased competition between equities and fixed income, should Powell disappoint, expansion of implied volatility (IVOL) on demands for protection, alone, could “draw markets lower” into the March 17 options expiration (OpEx), options data and insight provider SpotGamma says. For more on how to trade this precariousness and reduce portfolio downside, see the Daily Brief for March 3.
Technical
As of 5:30 AM ET, Tuesday’s regular session (9:30 AM – 4:00 PM ET), in the S&P 500, is likely to open in the upper part of a positively skewed overnight inventory, inside of the prior day’s range, suggesting a limited potential for immediate directional opportunity.
The S&P 500 pivot for today is $4,059.25.
Key levels to the upside include $4,071.25, $4,082.75, and $4,095.25.
Key levels to the downside include $4,045.25, $4,032.75, and $4,019.00.
Disclaimer: Click here to load the updated key levels via the web-based TradingView platform. New links are produced daily. Quoted levels likely hold barring an exogenous development.
Graphic: 65-minute profile chart of the Micro E-mini S&P 500 Futures.
Definitions
Volume Areas: Markets will build on areas of high-volume (HVNodes). Should the market trend for a period of time, this will be identified by a low-volume area (LVNodes). The LVNodes denote directional conviction and ought to offer support on any test.
If participants auction and find acceptance in an area of a prior LVNode, then future discovery ought to be volatile and quick as participants look to the nearest HVNodes for more favorable entry or exit.
POCs: Areas where two-sided trade was most prevalent in a prior day session. Participants will respond to future tests of value as they offer favorable entry and exit.
Volume-Weighted Average Prices (VWAPs): A metric highly regarded by chief investment officers, among other participants, for quality of trade. Additionally, liquidity algorithms are benchmarked and programmed to buy and sell around VWAPs.
About
The author, Renato Leonard Capelj, spends the bulk of his time at Physik Invest, an entity through which he invests and publishes free daily analyses to thousands of subscribers. The analyses offer him and his subscribers a way to stay on the right side of the market.
You may view this letter’s content calendar at this link.
Disclaimer
Do not construe this newsletter as advice. All content is for informational purposes. Capelj and Physik Invest manage their own capital and will not solicit others for it.
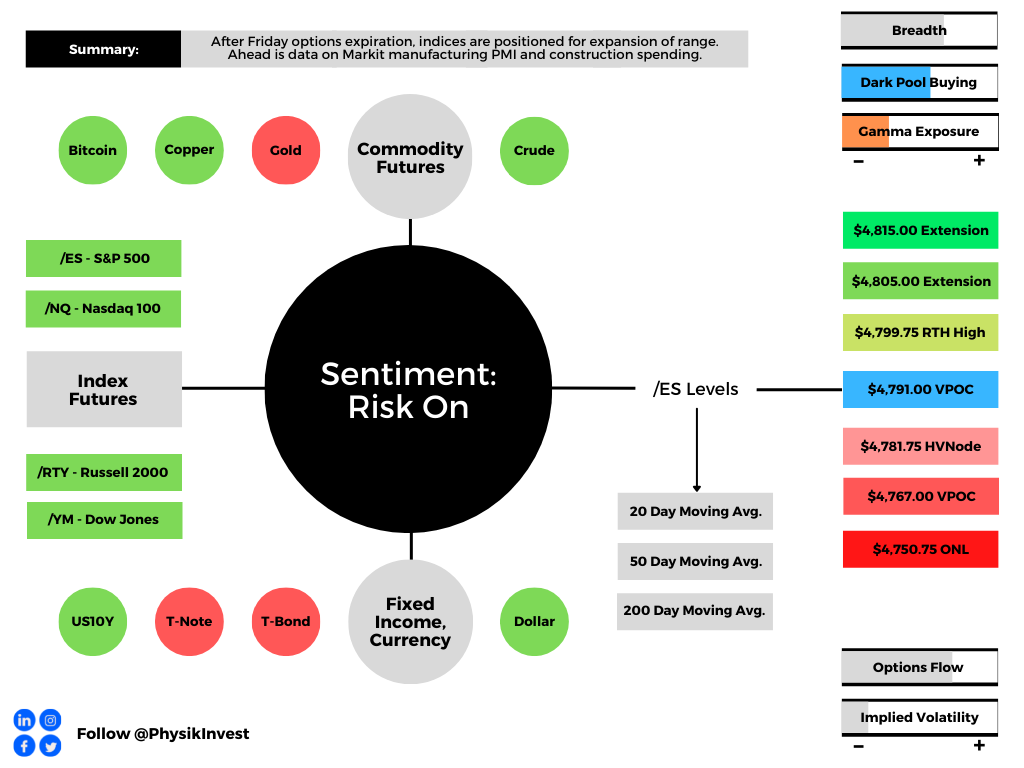
Overnight, equity index futures auctioned higher. Ahead is data on Markit Manufacturing PMI (9:45 AM ET) and Construction Spending (10:00 AM ET).
Graphic updated 6:20 AM ET. Sentiment Risk-On if expected /ES open is above the prior day’s range. /ES levels are derived from the profile graphic at the bottom of the following section. Levels may have changed since initially quoted; click here for the latest levels. SqueezeMetrics Dark Pool Index (DIX) and Gamma (GEX) calculations are based on where the prior day’s reading falls with respect to the MAX and MIN of all occurrences available. A higher DIX is bullish. At the same time, the lower the GEX, the more (expected) volatility. Learn the implications of volatility, direction, and moneyness. SHIFT data used for S&P 500 (INDEX: SPX) options activity. Note that options flow is sorted by the call premium spent; if more positive then more was spent on call options. Breadth reflects a reading of the prior day’s NYSE Advance/Decline indicator. VIX reflects a current reading of the CBOE Volatility Index (INDEX: VIX) from 0-100.
What To Expect
Technicals: Given the Monday gap, the S&P 500, based on its relation to Thursday’s failed balance breakout and end-of-week liquidation, is positioned for sideways-to-higher.
To note, however, the persistence of responses to technical levels, weaker-handed participants (which seldom bear the wherewithal to defend retests) carry a heavier hand in recent discovery.
Via volume profile analysis, we see a plethora of low-volume pockets – voids – that likely hold virgin tests. Successful penetration often portends follow-through as the participants that were most active at those levels (quickly run for the exits when wrong).
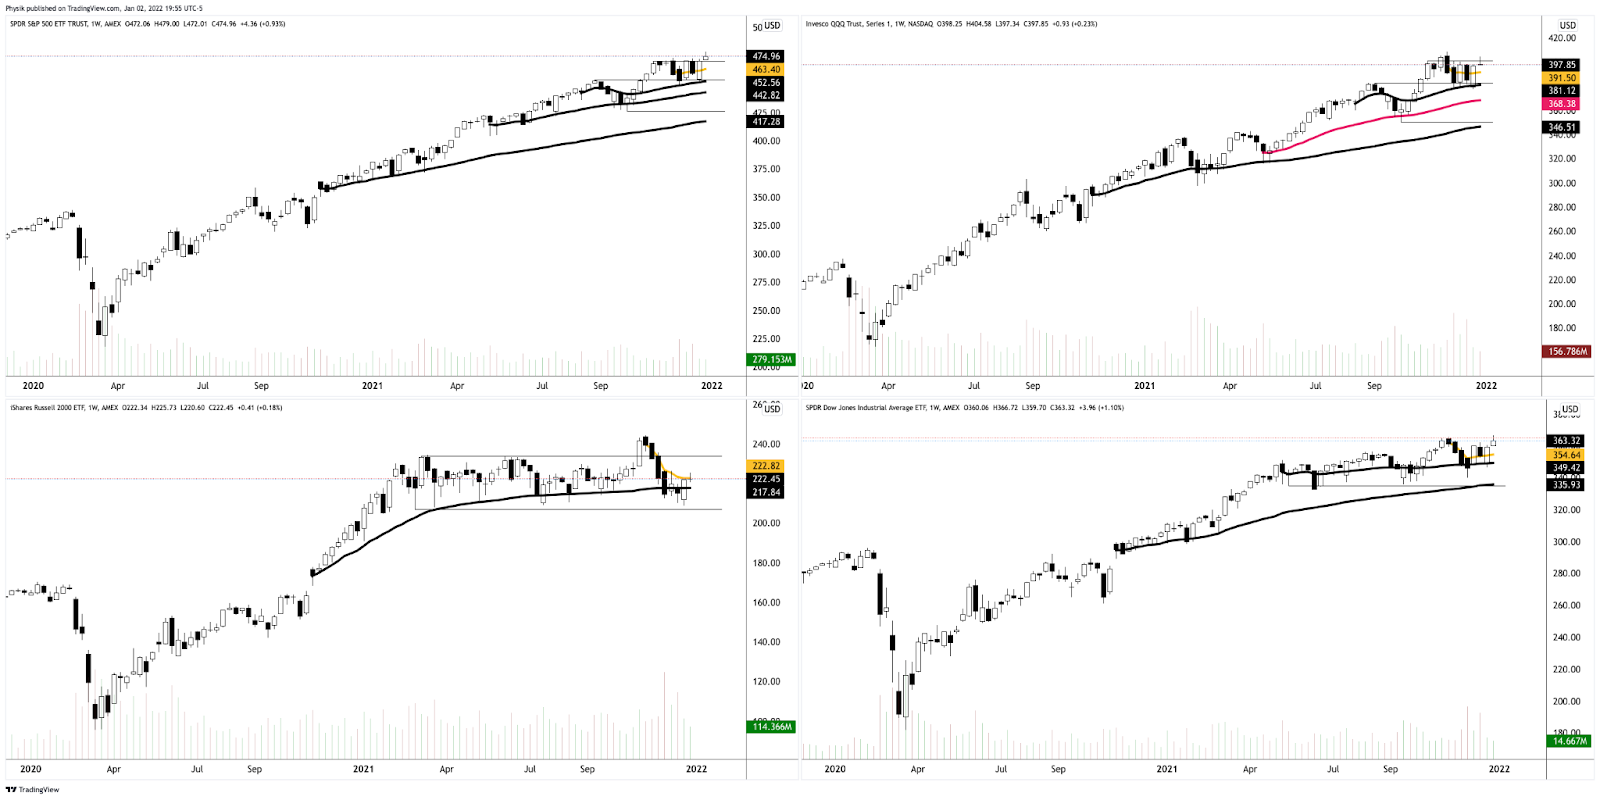
Graphic: Weekly chart for the S&P 500 (top left), Nasdaq 100 (top right), Russell 2000 (bottom left), and Dow Jones Industrial Average (bottom right). Technically, indices are still positioned for sideways or higher.
Fundamental: The aforementioned trade is happening in the context of higher valuations, interest rates, and tax rates, according to Morgan Stanley (NYSE: MS).
These themes serve as a headwind.
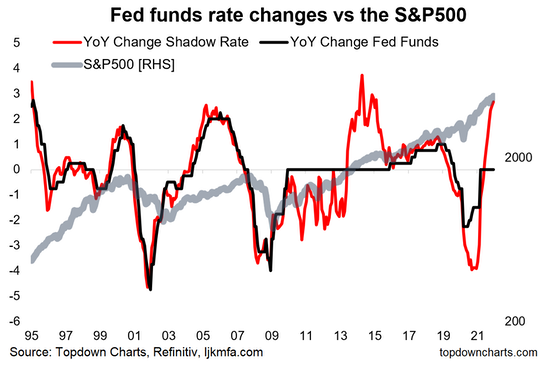
To elaborate, as Nordea recently explained, the Fed will “accelerate its tapering process, and is now set to conclude net purchases already by mid-March vs mid-June with the earlier pace.”
“The dot plot was revised significantly higher, and the plot now shows three hikes for next year, a further three for 2023 and another two for 2024.”
Graphic: The “annual rate of change in the Fed Funds rate” via topdowncharts.com.
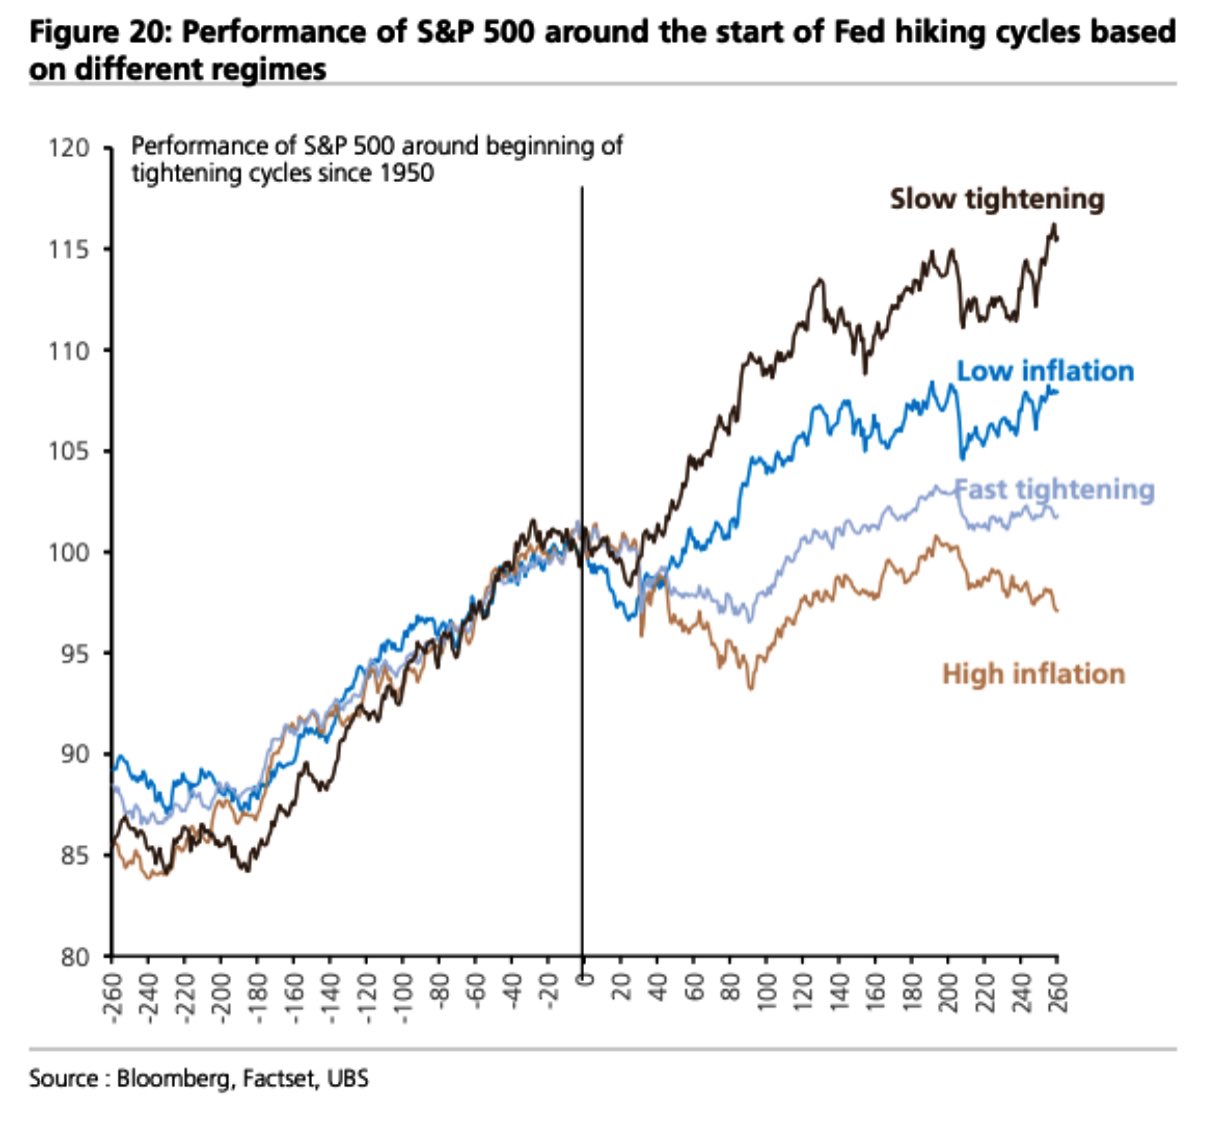
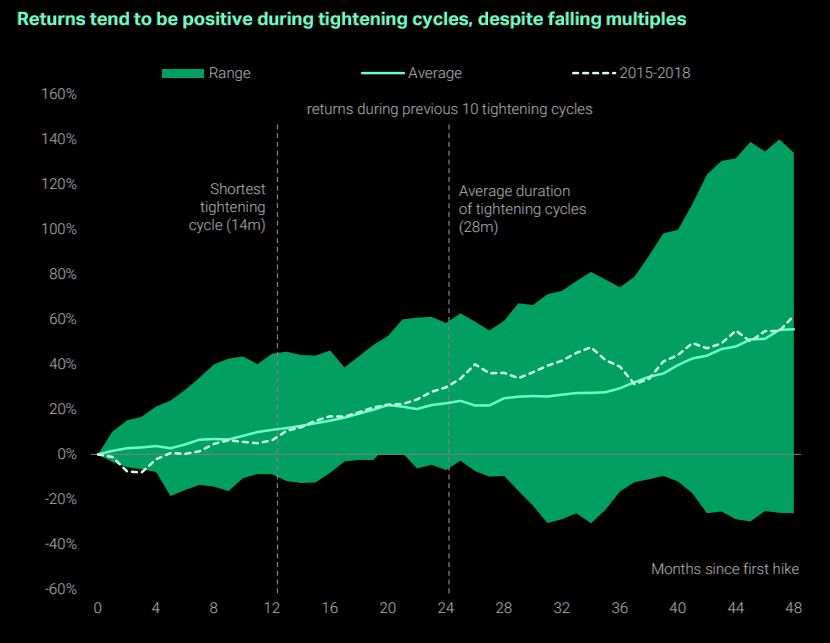
At the same time, equity markets tend to rally into the first hike; Moody’s Corporation’s (NYSE: MCO) forecast aligns with that – “the Dow Jones Industrial Average increases this quarter and peaks in early 2022, … [followed by] steady decline through 2022.”
Graphic: S&P 500 performance before and after rate hikes.
Why? Rising rates, among other factors, have the potential to decrease the present value of future earnings, thereby making stocks, especially those that are high growth, less attractive.
“Our view is that 2022 will be the year of a full global recovery, an end of the global pandemic, and a return to normal conditions we had prior to the Covid-19 outbreak,” JPMorgan Chase & Co (NYSE: JPM) noted.
“We believe this will produce a strong cyclical recovery, a return of global mobility, and strong growth in consumer and corporate spending, within the backdrop of still-easy monetary policy.”
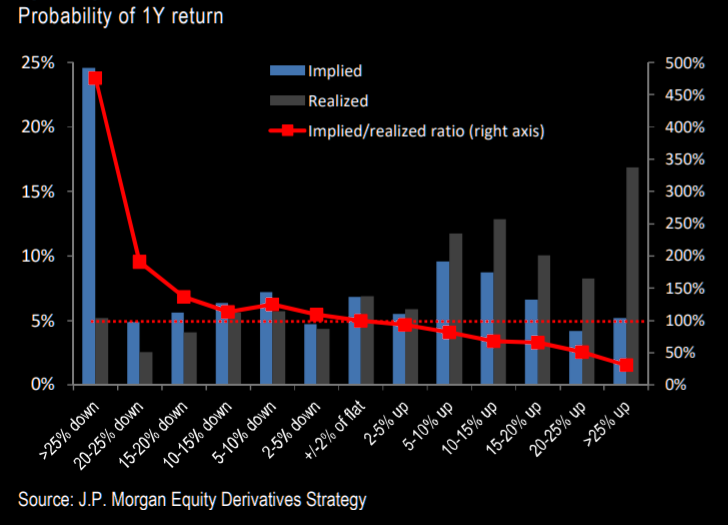
Positioning: According to JPMorgan Chase & Co, “S&P 500 skew overprices downside and underprices upside probabilities relative to historical returns.”
Graphic: Via The Market Ear, JPMorgan’s analysis suggests downside protection is overpriced.
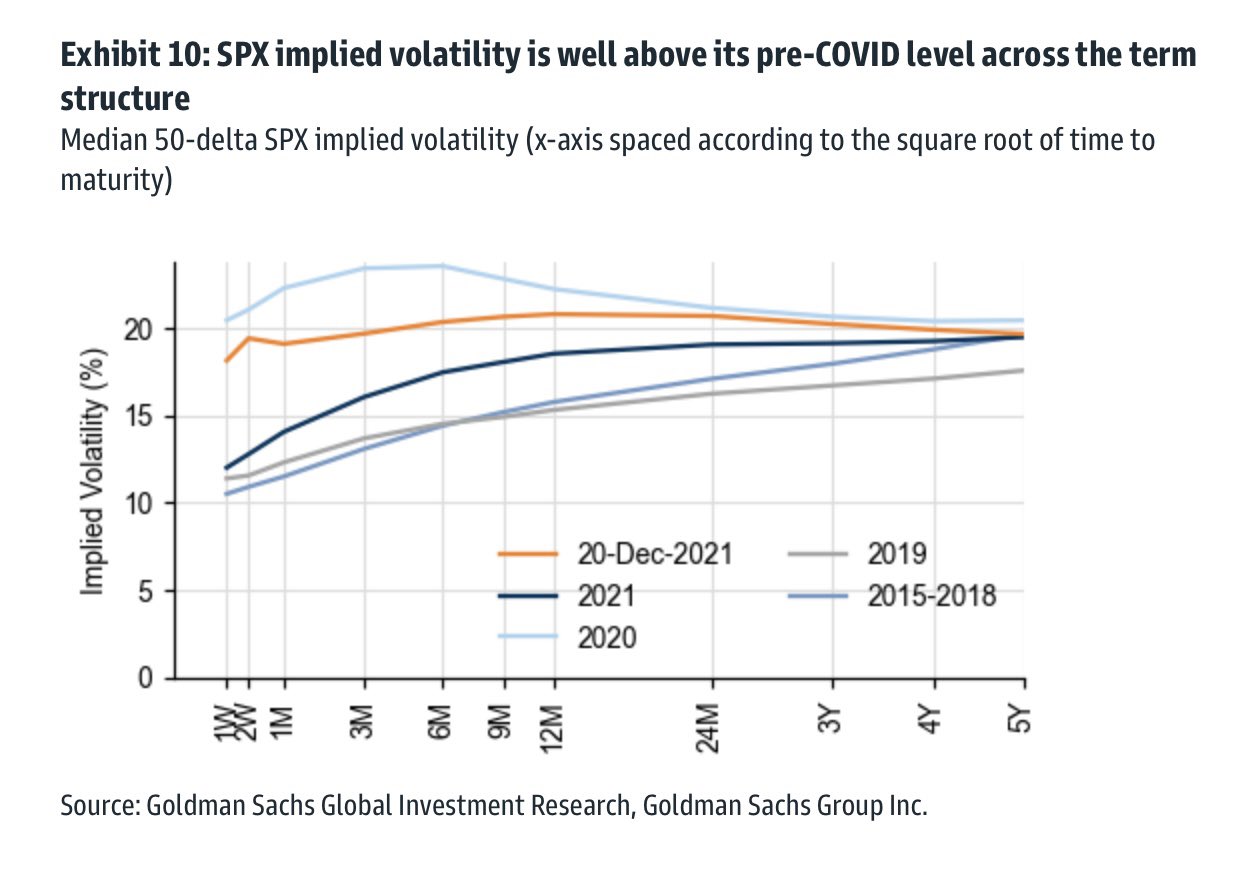
This is all the while the S&P 500’s implied volatility remains above pre-COVID levels.
“SPX implied volatility is well above its pre-Covid level across the term structure.” The compression of volatility lowers the counterparties’ exposure to the positive delta. This “vanna” flow may support higher prices.
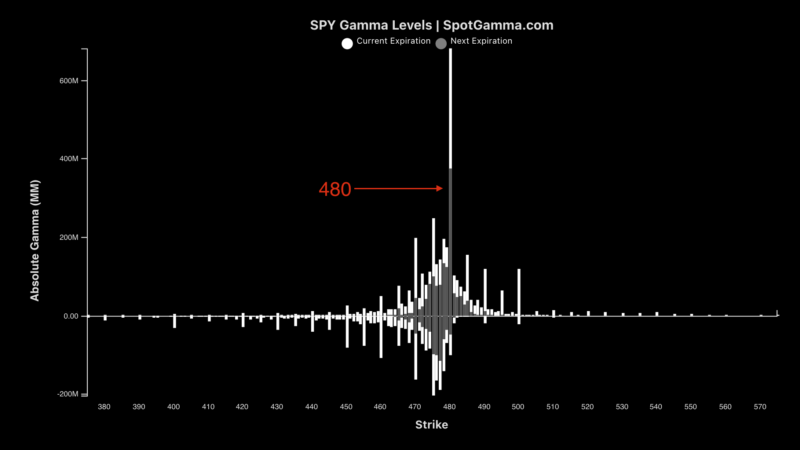
Taken together (in the face of last week’s options expiration which reduced the level of positive sticky options gamma concentrated mostly at the $4,800.00 level in the S&P 500), current options positioning and buying pressure supports a seasonally-aligned price rise in January.
Explanation: As a position’s delta rises with underlying price rises, gamma (or how an option’s delta is expected to change given a change in the underlying) is added to the delta. Counterparties are to offset gamma by adding liquidity to the market (i.e., buy dips, sell rips).
Graphic: SpotGamma data suggests the pin heading into Friday’s options expiration is no more.
The continued compression of volatility will only serve to bolster any price rise as “hedging vanna and charm flows, and whatnot will push the markets higher.”
Should that thesis not pan out – meaning the removal of hedging pressures associated with “put-heavy” single stock options positions and an end to tax-loss harvesting, among other factors – indices likely succumb to the “stealth correction” of its lesser weighted constituents.
Were participants to reach for downside protection, the implications of this would be staggering. In such a case, markets will tend toward instability. At present, the metrics don’t point to this.
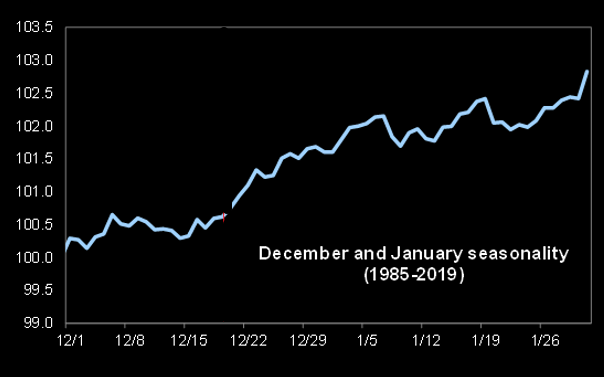
Graphic: Via The Market Ear, amidst heightened cash allocations that are likely to be redeployed, “January is the big inflow month but the seasonality from here is looking less exciting.”
Expectations: As of 6:20 AM ET, Monday’s regular session (9:30 AM – 4:00 PM ET), in the S&P 500, will likely open in the upper part of a positively skewed overnight inventory, outside of prior-range and -value, suggesting a potential for immediate directional opportunity.
Gap Scenarios: Gaps ought to fill quickly. Should they not, that’s a signal of strength; do not fade. Leaving value behind on a gap-fill or failing to fill a gap (i.e., remaining outside of the prior session’s range) is a go-with indicator.

Auctioning and spending at least 1-hour of trade back in the prior range suggests a lack of conviction; in such a case, do not follow the direction of the most recent initiative activity.
In the best case, the S&P 500 trades higher; activity above the $4,791.00 untested point of control (VPOC) puts in play the $4,799.75 regular trade high (RTH High). Initiative trade beyond the RTH High could reach as high as the $4,805.00 and $4,815.00 extensions, or higher.
In the worst case, the S&P 500 trades lower; activity below the $4,791.00 VPOC puts in play the $4,781.75 high volume area (HVNode). Initiative trade beyond the HVNode could reach as low as the $4,767.00 VPOC and $4,750.75 overnight low (ONL), or lower.
Click here to load today’s key levels into the web-based TradingView charting platform. Note that all levels are derived using the 65-minute timeframe. New links are produced, daily.
Graphic: 65-minute profile chart of the Micro E-mini S&P 500 Futures.
What People Are Saying
The S&P 500 is a trend following trading system.
It holds on to winners (and adds to them), while losers are reduced in size and eventually removed.
The average retail trader will do the opposite, add to losers and cut winners.
Overnight Rally Highs (Lows): Typically, there is a low historical probability associated with overnight rally-highs (lows) ending the upside (downside) discovery process.
Volume Areas: A structurally sound market will build on areas of high volume (HVNodes). Should the market trend for long periods of time, it will lack sound structure, identified as low volume areas (LVNodes). LVNodes denote directional conviction and ought to offer support on any test.
If participants were to auction and find acceptance into areas of prior low volume (LVNodes), then future discovery ought to be volatile and quick as participants look to HVNodes for favorable entry or exit.
Gamma: Gamma is the sensitivity of an option to changes in the underlying price. Dealers that take the other side of options trades hedge their exposure to risk by buying and selling the underlying. When dealers are short-gamma, they hedge by buying into strength and selling into weakness. When dealers are long-gamma, they hedge by selling into strength and buying into weakness. The former exacerbates volatility. The latter calms volatility.
Vanna: The rate at which the delta of an option changes with respect to volatility.
Charm: The rate at which the delta of an option changes with respect to time.
POCs: POCs are valuable as they denote areas where two-sided trade was most prevalent in a prior day session. Participants will respond to future tests of value as they offer favorable entry and exit.
MCPOCs: POCs are valuable as they denote areas where two-sided trade was most prevalent over numerous day sessions. Participants will respond to future tests of value as they offer favorable entry and exit.
Options Expiration (OPEX): Traditionally, option expiries mark an end to pinning (i.e, the theory that market makers and institutions short options move stocks to the point where the greatest dollar value of contracts will expire) and the reduction dealer gamma exposure.
Excess: A proper end to price discovery; the market travels too far while advertising prices. Responsive, other-timeframe (OTF) participants aggressively enter the market, leaving tails or gaps which denote unfair prices.
About
After years of self-education, strategy development, mentorship, and trial-and-error, Renato Leonard Capelj began trading full-time and founded Physik Invest to detail his methods, research, and performance in the markets.
Capelj is also a Benzinga finance and technology reporter interviewing the likes of Shark Tank’s Kevin O’Leary, JC2 Ventures’ John Chambers, FTX’s Sam Bankman-Fried, and ARK Invest’s Catherine Wood, as well as a SpotGamma contributor developing insights around impactful options market dynamics.
Disclaimer
At this time, Physik Invest does not carry the right to provide advice.
In no way should the materials herein be construed as advice. Derivatives carry a substantial risk of loss. All content is for informational purposes only.
Notice: Up to January 3, 2022, any commentaries published will be lighthearted and, generally, shorter in length.
What Happened
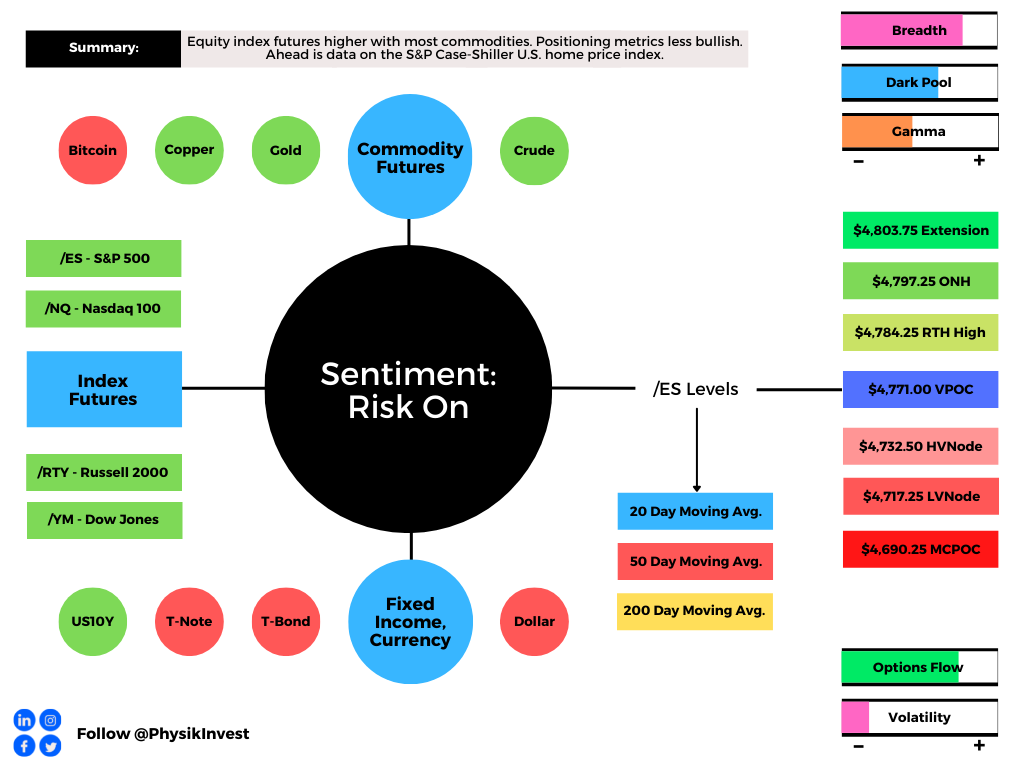
Overnight, equity index futures were sideways to higher with most commodities, yields.
This is as volatility implodes; the CBOE Volatility Index, from December 20, went as low as 17.55 this week [down 9.84 (35.93%)]. This coincides with a compression in the VIX’s term structure, and that has so-called bullish/supportive implications.
Ahead is data on the S&P Case-Shiller U.S. home price index (9:00 AM ET).
Graphic updated 7:00 AM ET. Sentiment Risk-On if expected /ES open is above the prior day’s range. /ES levels are derived from the profile graphic at the bottom of the following section. Levels may have changed since initially quoted; click here for the latest levels. SqueezeMetrics Dark Pool Index (DIX) and Gamma (GEX) calculations are based on where the prior day’s reading falls with respect to the MAX and MIN of all occurrences available. A higher DIX is bullish. At the same time, the lower the GEX, the more (expected) volatility. Learn the implications of volatility, direction, and moneyness. SHIFT data used for S&P 500 (INDEX: SPX) options activity. Note that options flow is sorted by the call premium spent; if more positive then more was spent on call options. Breadth reflects a reading of the prior day’s NYSE Advance/Decline indicator. VIX reflects a current reading of the CBOE Volatility Index (INDEX: VIX) from 0-100.
What To Expect
On lackluster breadth and divergent market liquidity metrics, the S&P 500 continues to auction away from intraday value, the levels at which participants found it most favorable to transact.
Moreover, given the persistence of mechanical responses to technical levels, visually-driven, weaker-handed participants (which seldom bear the wherewithal to defend retests) likely carry a heavier hand in recent price discovery.
Via volume profile analysis, we see a plethora of low-volume pockets – voids, if you will – that likely hold virgin tests.
As stated over the past few days, successful penetration often portends follow-through as the participants that were most active at those levels (quickly run for the exits when wrong).
Context: Recall that a collapse in implied volatility, coupled with relentless, seasonally-aligned passive buying would bring in positive flows that would bolster any attempt higher.
Unpacked with @spotgamma recent trade through an options market lens.
Key Points: – What is delta, long/short gamma, vanna, charm – Implications of NOV, DEC expiry. Post-OPEX vol – Where to next given current options positioning – Expert comments + morehttps://t.co/ZUf97pYhtb
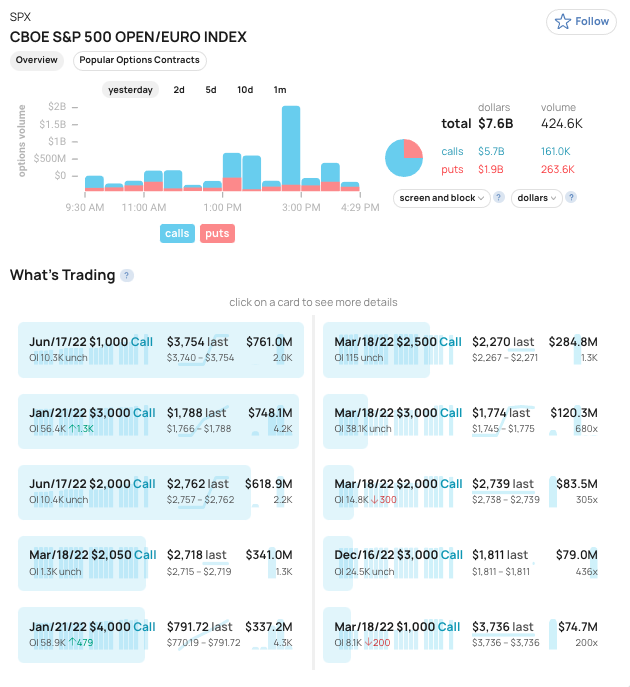
At the same time “options selling strategies [became] attractive,” according to Goldman Sachs Group Inc (NYSE: GS); the commitment of capital to options strikes at higher prices implies participants are pushing up their bets on S&P 500 movement. That’s bullish.
Graphic: Shift Search S&P 500 data (excluding weeklies) suggests participants are likely initiating box spreads and rolling their call exposure out in time (as much as 6 months).
According to SpotGamma, “[s]ince, customers are thought to be net short calls (short-delta), as the index moves toward the high activity $4,800.00 strike, they become longer delta.”
Why? When a position’s delta rises with stock or index price rises, gamma – the expected change in delta given movement in the underlying – is added to delta.
“As participants keep adding to their bets at $4,800.00, the dealer only takes on more exposure to positive gamma, which they hedge by selling futures and adding liquidity to the market.”
$SPY shifted to +gamma last week & brought a shift to lower volatility. With todays move $QQQ & $IWM are now slightly +gamma too. That may reduce their volatility into a large 12/31 OPEX. pic.twitter.com/tRcoH98nhD
The commitment of capital on lower volatility ups the dealers’ exposure to positive gamma; this will be offset through a supply of liquidity (via short futures), which weighs on price discovery.
Taking into account this positioning, versus buying pressure (measured via short sales or liquidity provision on the market-making side), positioning metrics remain positively skewed, albeit less so than before.
Graphic: Data SqueezeMetrics. Graph via Physik Invest.
Going forward, coming into Friday’s weighty options expirations, at the index level, hedging pressures ought to be sticky and weigh on the upside.
Thereafter, positive fundamental forces and dealers’ covering of hedges to remaining “put-heavy” positioning could bolster any seasonally-aligned price rise into the very first interest rate hikes.
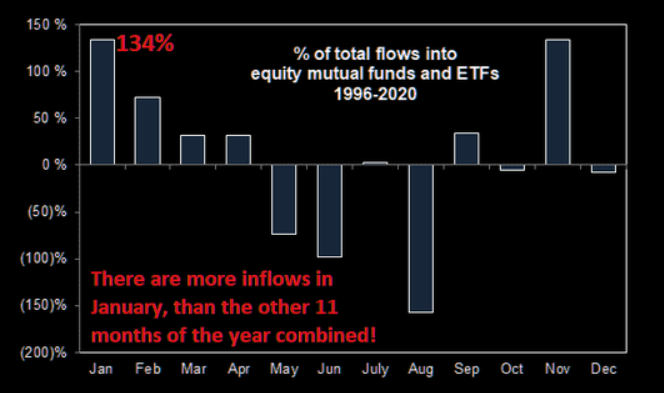
Graphic: Per The Market Ear, “January typically sees 134% of inflows (the rest of the 11 months -34%). And with every private wealth manager in the world right now pitching increased allocations into equities (out of cash and out of bonds), Goldman calculates that keeping 2021 pace, This would be $125BN worth of inflows quickly in January.”
Moody’s Corporation’s (NYSE: MCO) forecast is in agreement: “the Dow Jones Industrial Average increases this quarter and peaks in early 2022, … [followed by] steady decline through 2022.”
Graphic: S&P 500 performance before and after rate hikes.
Expectations: As of 7:00 AM ET, Tuesday’s regular session (9:30 AM – 4:00 PM ET), in the S&P 500, will likely open in the upper part of a positively skewed overnight inventory, just outside of prior-range and -value, suggesting a potential for immediate directional opportunity.
Gap Scenarios: Gaps ought to fill quickly. Should they not, that’s a signal of strength; do not fade. Leaving value behind on a gap-fill or failing to fill a gap (i.e., remaining outside of the prior session’s range) is a go-with indicator.

Auctioning and spending at least 1-hour of trade back in the prior range suggests a lack of conviction; in such a case, do not follow the direction of the most recent initiative activity.
In the best case, the S&P 500 trades sideways or higher; activity above the $4,771.00 untested point of control (VPOC) puts in play the $4,784.25 regular trade high (RTH High). Initiative trade beyond the RTH High could reach as high as the $4,797.25 overnight high (ONH) and $4,803.75 extension, or higher.
In the worst case, the S&P 500 trades lower; activity below the $4,771.00 VPOC puts in play the $4,732.50 high volume area (HVNode). Initiative trade beyond the HVNode could reach as low as the $4,717.25 low volume area (LVNode) and $4,690.25 micro composite point of control (MCPOC), or lower.
Click here to load today’s key levels into the web-based TradingView charting platform. Note that all levels are derived using the 65-minute timeframe. New links are produced, daily.
Graphic: 65-minute profile chart of the Micro E-mini S&P 500 Futures. Learn about the profile.
Definitions
Overnight Rally Highs (Lows): Typically, there is a low historical probability associated with overnight rally-highs (lows) ending the upside (downside) discovery process.
Volume Areas: A structurally sound market will build on areas of high volume (HVNodes). Should the market trend for long periods of time, it will lack sound structure, identified as low volume areas (LVNodes). LVNodes denote directional conviction and ought to offer support on any test.
If participants were to auction and find acceptance into areas of prior low volume (LVNodes), then future discovery ought to be volatile and quick as participants look to HVNodes for favorable entry or exit.
POCs: POCs are valuable as they denote areas where two-sided trade was most prevalent in a prior day session. Participants will respond to future tests of value as they offer favorable entry and exit.
MCPOCs: POCs are valuable as they denote areas where two-sided trade was most prevalent over numerous day sessions. Participants will respond to future tests of value as they offer favorable entry and exit.
Options Expiration (OPEX): Traditionally, option expiries mark an end to pinning (i.e, the theory that market makers and institutions short options move stocks to the point where the greatest dollar value of contracts will expire) and the reduction dealer gamma exposure.
Volume-Weighted Average Prices (VWAPs): A metric highly regarded by chief investment officers, among other participants, for quality of trade. Additionally, liquidity algorithms are benchmarked and programmed to buy and sell around VWAPs.
About
After years of self-education, strategy development, and trial-and-error, Renato Leonard Capelj began trading full-time and founded Physik Invest to detail his methods, research, and performance in the markets.
Additionally, Capelj is a Benzinga finance and technology reporter interviewing the likes of Shark Tank’s Kevin O’Leary, JC2 Ventures’ John Chambers, and ARK Invest’s Catherine Wood, as well as a SpotGamma contributor, helping develop insights around impactful options market dynamics.
Disclaimer
At this time, Physik Invest does not carry the right to provide advice. In no way should the materials herein be construed as advice. Derivatives carry a substantial risk of loss. All content is for informational purposes only.
Overnight, equity index futures auctioned sideways to higher as participants looked to take back nearly all of Friday’s shortened holiday trading range.
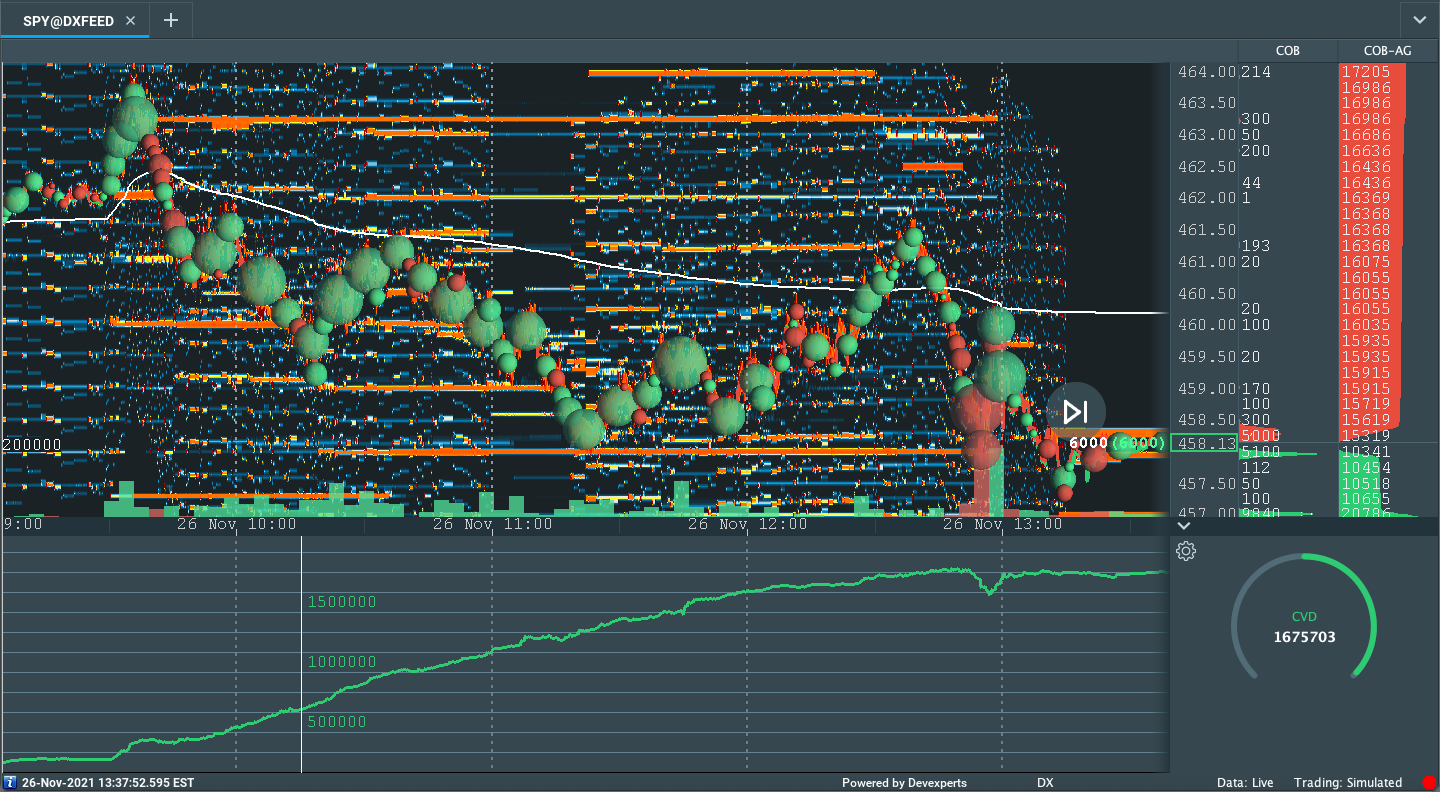
According to some metrics, the SPDR S&P 500 ETF Trust (NYSE: SPY), one of the largest ETFs that track the S&P 500 index, experienced one of its most illiquid days, Friday.
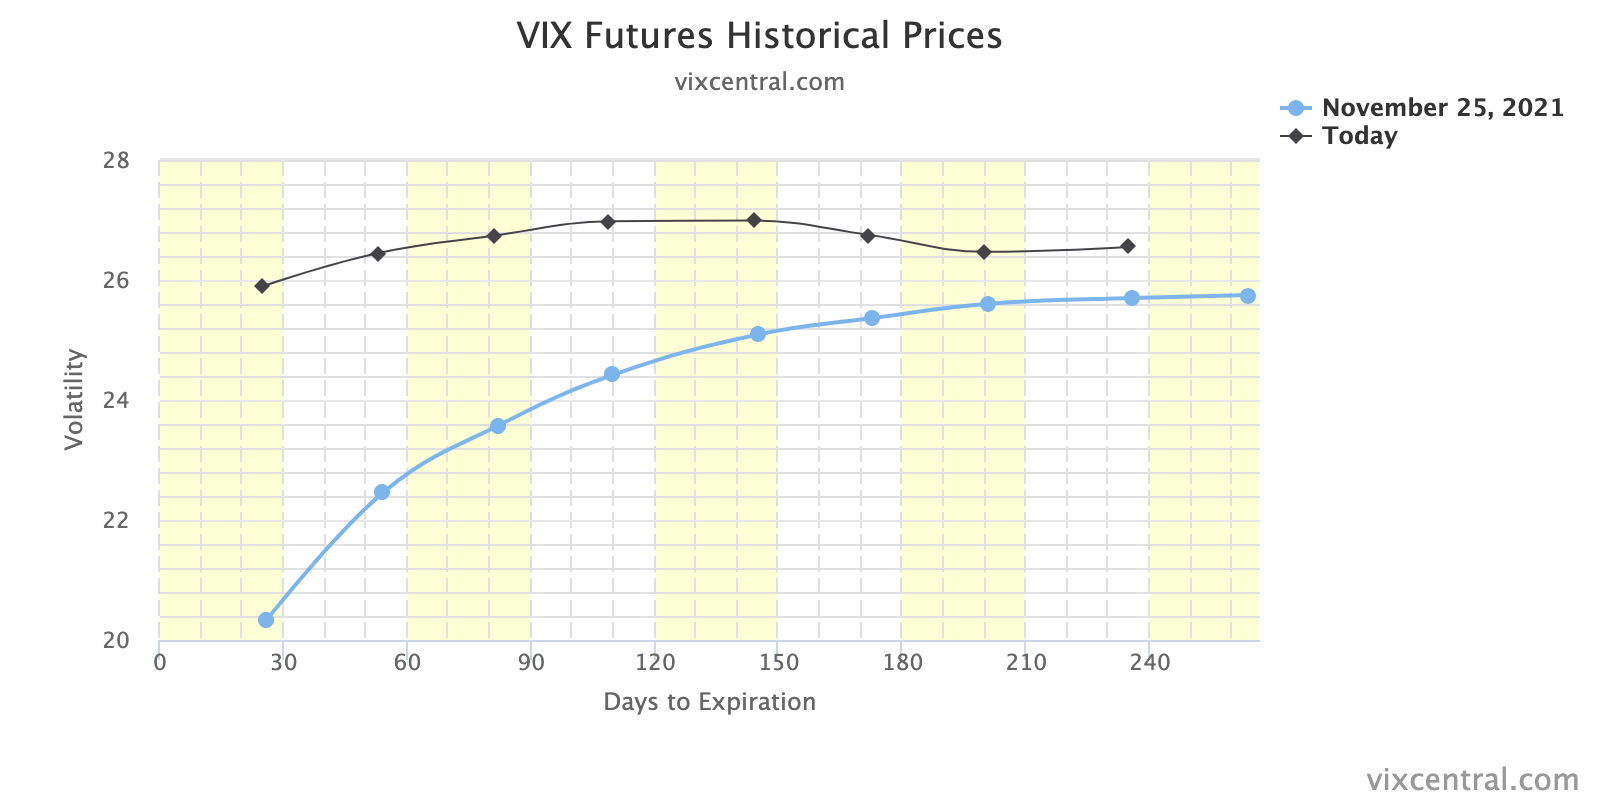
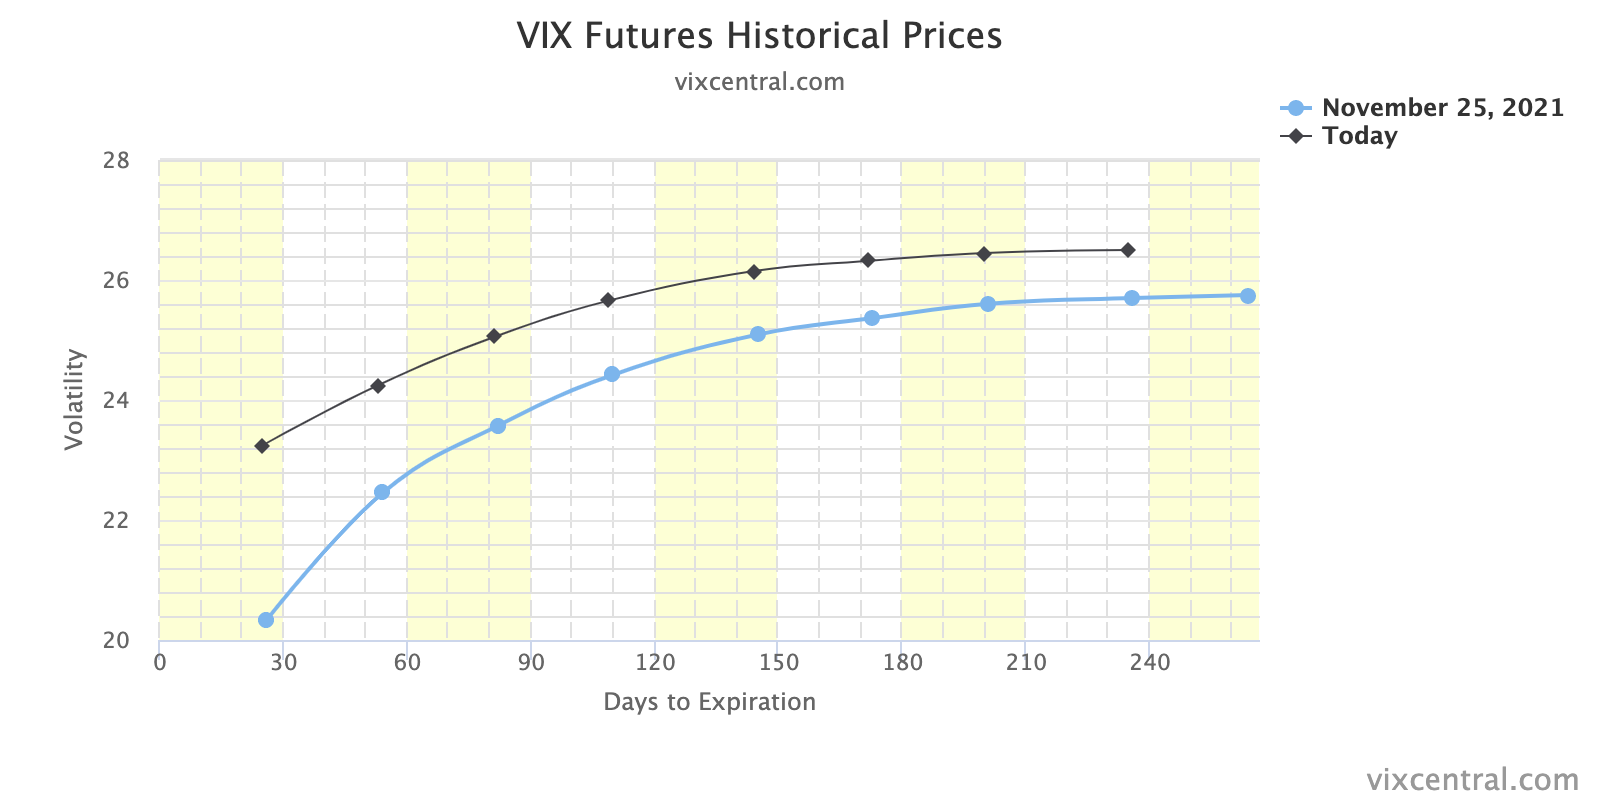
At the same time, the CBOE Volatility Index (INDEX: VIX) closed up nearly 50% while the VIX futures term structure settled in backwardation amidst a re-pricing of tail-risk, so to speak.
Moreover, ahead is data on Pending Home Sales (10:00 AM ET).
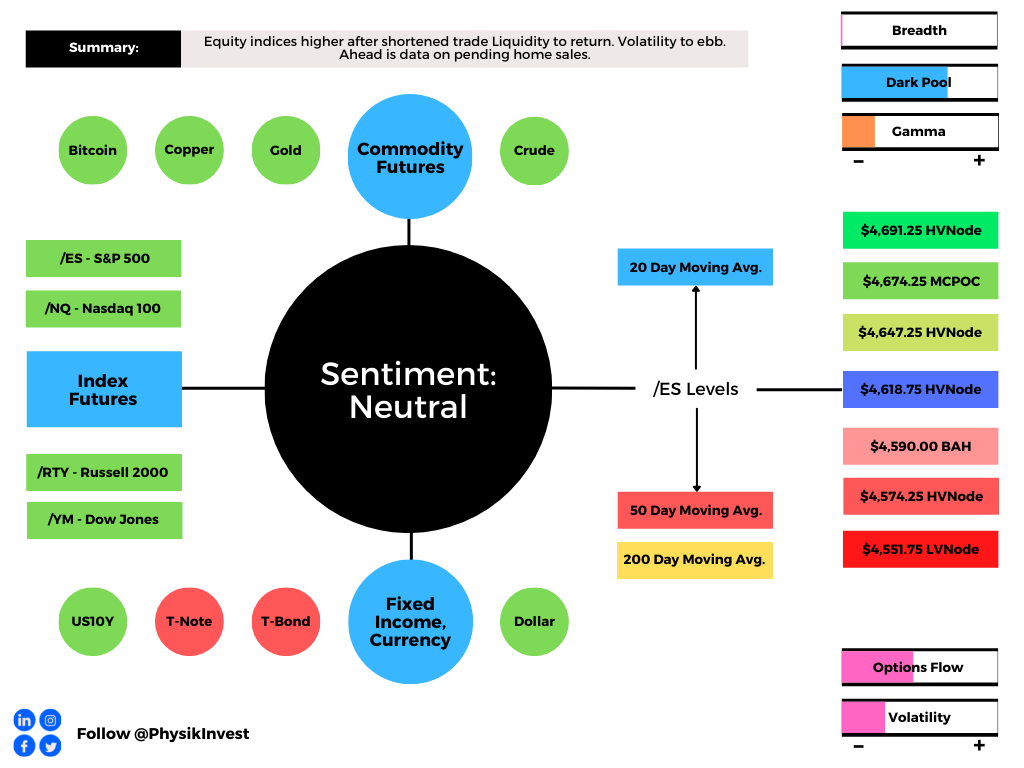
Graphic updated 5:50 AM ET. Sentiment Neutral if expected /ES open is inside of the prior day’s range. /ES levels are derived from the profile graphic at the bottom of the following section. Levels may have changed since initially quoted; click here for the latest levels. SqueezeMetrics Dark Pool Index (DIX) and Gamma (GEX) calculations are based on where the prior day’s reading falls with respect to the MAX and MIN of all occurrences available. A higher DIX is bullish. At the same time, the lower the GEX, the more (expected) volatility. Learn the implications of volatility, direction, and moneyness. SHIFT data used for S&P 500 (INDEX: SPX) options activity. Note that options flow is sorted by the call premium spent; if more positive then more was spent on call options. Breadth reflects a reading of the prior day’s NYSE Advance/Decline indicator. VIX reflects a current reading of the CBOE Volatility Index (INDEX: VIX) from 0-100.
What To Expect
Despite the lackluster intraday breadth and divergent market liquidity metrics, the worst-case outcome occurred, Friday, evidenced by downside expansion of range and separation of value.
Coming into the session, the experiences associated with ‘Volmageddon’ came to mind; the VIX was up nearly 40.00%, a concern given the exuberance of past weeks and options positioning, as well as a decline in correlations, and unsupportive breadth.
Tempering the fall were divergences; the Russell 2000 was down nearly 4.00% before Friday’s U.S. open while the S&P 500 was off about 2.00% or so, buoyed by the Nasdaq 100 which was only down about 1.00% amidst an 8% dip in the ten-year yield.
The divergence persisted with the S&P 500 closing firmly below its 20-day simple moving average, a visual level often acted on by short-term, technically-driven participants who generally are unable to defend retests.
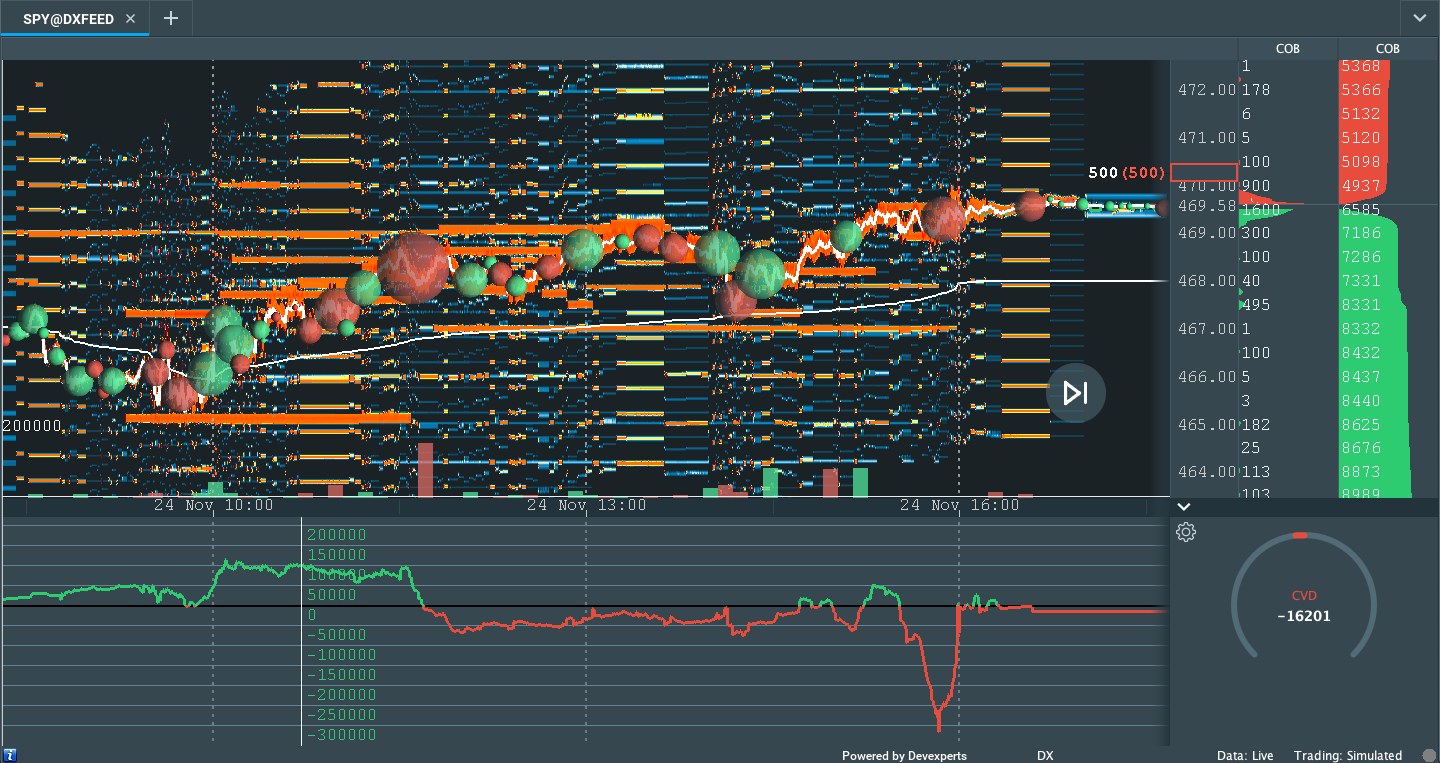
Graphic: Divergent delta (i.e., non-committed selling as measured by volume delta or buying and selling power as calculated by the difference in volume traded at the bid and offer) in SPDR S&P 500 ETF Trust (NYSE: SPY), one of the largest ETFs that track the S&P 500 index.
Context: A resurgence in the COVID-19 coronavirus as an improvement in macroeconomic conditions prompts a hawkish shift from the Federal Reserve (Fed).
“Many risky asset tailwinds in 2021 are turning into at least mild headwinds in 2022,” Nordea says. “Economic growth should decelerate, liquidity conditions are deteriorating, profit margins should be under pressure from rising costs and question marks regarding the Fed/ECB put will arise due to elevated inflation indicators. To us, this spells higher volatility.”
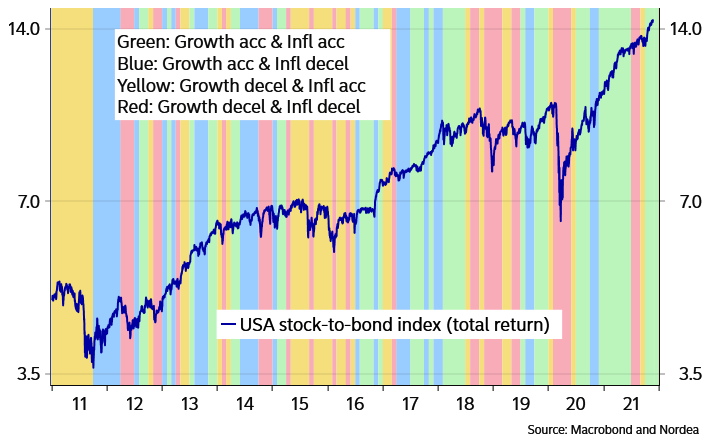
Moreover, for the past two years, almost, equities rallied amidst an acceleration in growth, which is typically correlated with equity outperformance over bonds.
Graphic: Accelerating growth correlates with equity outperformance over bonds.
At the same time, there’s been an insatiable appetite for stocks, according to Bloomberg, with investors pouring “almost $900 billion into equity exchange-traded and long-only funds in 2021 — exceeding the combined total from the past 19 years.”
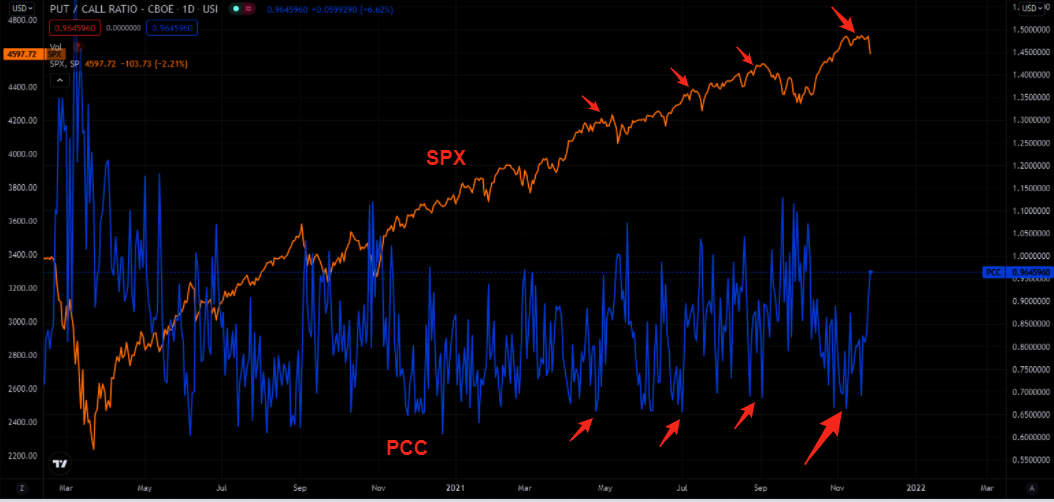
This appetite for risk fed into the activity of some high-flyers like Tesla Inc (NASDAQ: TSLA) with customers, at least in the past weeks, opting to aggressively sell puts and buy calls heading into the November monthly options expiration (OPEX).
Graphic: Per The Market Ear, participants were hating on downside protection for weeks.
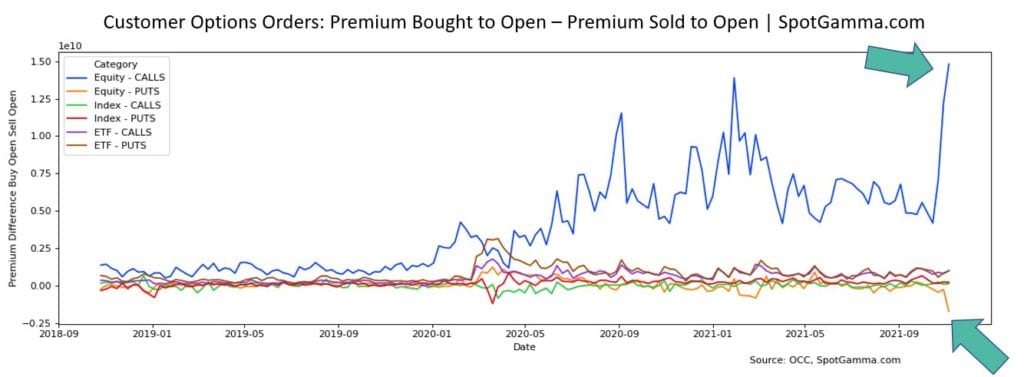
Unfortunately, (1) after OPEX, the absence of sticky and supportive hedging flows freed the broader market for directional resolve, and (2) according to SpotGamma, in light of recent exuberance, “participants [were] underexposed to downside put protection.”
Graphic: Customers took on significant leverage in their purchase and sale of options, via SpotGamma.
What this meant was that after OPEX’s unpinning and increase in correlation, fundamental contexts were to matter more.
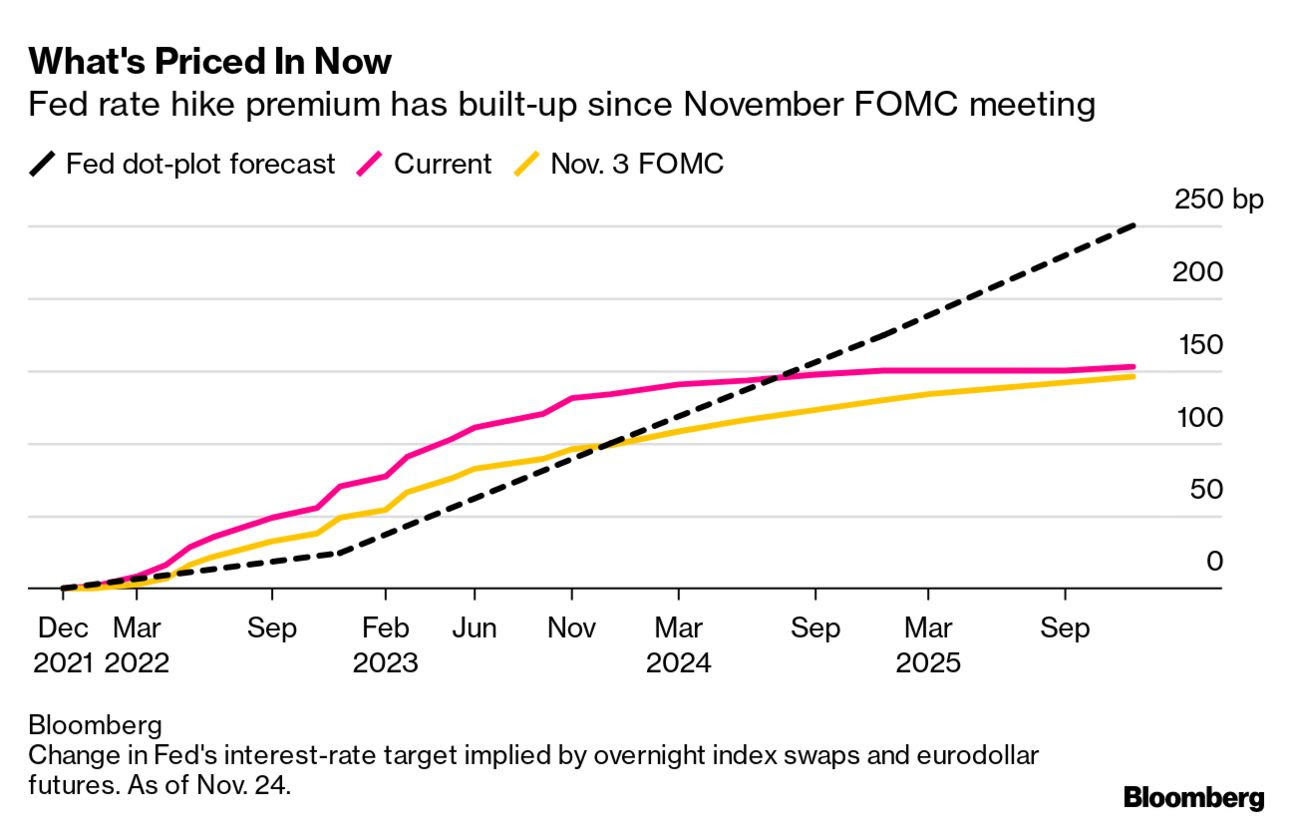
Therefore, the Fed’s “increased openness to accelerat[e] the taper pace” and hike rates, alongside fresh travel restrictions on a new COVID-19 variant, as well as holiday illiquidity, resulted in a rough re-pricing of tail risk as participants sought after those highly “convex” options which had counterparties exacerbating underlying price movement.
Graphic: According to Bloomberg, markets price “a full quarter-point rate hike into the June Fed meeting with a second by September and a third by December.”
To elaborate, in short, was volatility to pick up, those participants (who were once exuberant) were likely to reach for protection forcing dealers to reflexively hedge in a destabilizing manner.
Dealers is the term used to describe those participants that take the other side and warehouse customer options risk, at least in the case where orders can’t be matched between customers.
With that, as volatility rose and customers demanded protection, counterparties hedged by selling into weakness. The conditions worsened when much of the activity was concentrated in shorter-dated tenors where the sensitivity of options to direction is higher if we will.
Graphic: VIX term structure. Backwardation signals an entry into an unstable environment.
Once that short-dated protection rolls off the table (and/or is monetized), dealers will reverse and support the market, buying to close their existing stock/futures hedges.
This flow is stabilizing and may play into a seasonally-aligned rally into Christmas as participants see defenses rolled out against the new COVID-19 variant, and the positive effects of pro-cyclical inflation and economic growth, improvements in global trade, and continuity at the Fed, among other dynamics, play out.
We see participants opportunistically buying the dip, already, via metrics like DIX that’s derived from liquidity provision on the market-making side.
Expectations: As of 6:00 AM ET, Monday’s regular session (9:30 AM – 4:00 PM ET), in the S&P 500, will likely open in the middle part of a positively skewed overnight inventory, inside of prior-range and -value, suggesting a limited potential for immediate directional opportunity.
In the best case, the S&P 500 trades sideways or higher; activity above the $4,618.75 high volume area (HVNode) puts in play the $4,647.25 HVNode. Initiative trade beyond the latter HVNode could reach as high as the $4,674.25 micro composite point of control (MCPOC) and $4,691.25 HVNode, or higher.
In the worst case, the S&P 500 trades lower; activity below the $4,618.75 HVNode puts in play the $4,590.00 balance boundary (BAH). Initiative trade beyond the BAH could reach as low as the $4,574.25 HVNode and $4,551.75 LVNode, or lower.
Click here to load today’s updated key levels into the web-based TradingView charting platform. Note that all levels are derived using the 65-minute timeframe. New links are produced, daily.
Graphic: 65-minute profile chart of the Micro E-mini S&P 500 Futures. Learn about the profile.
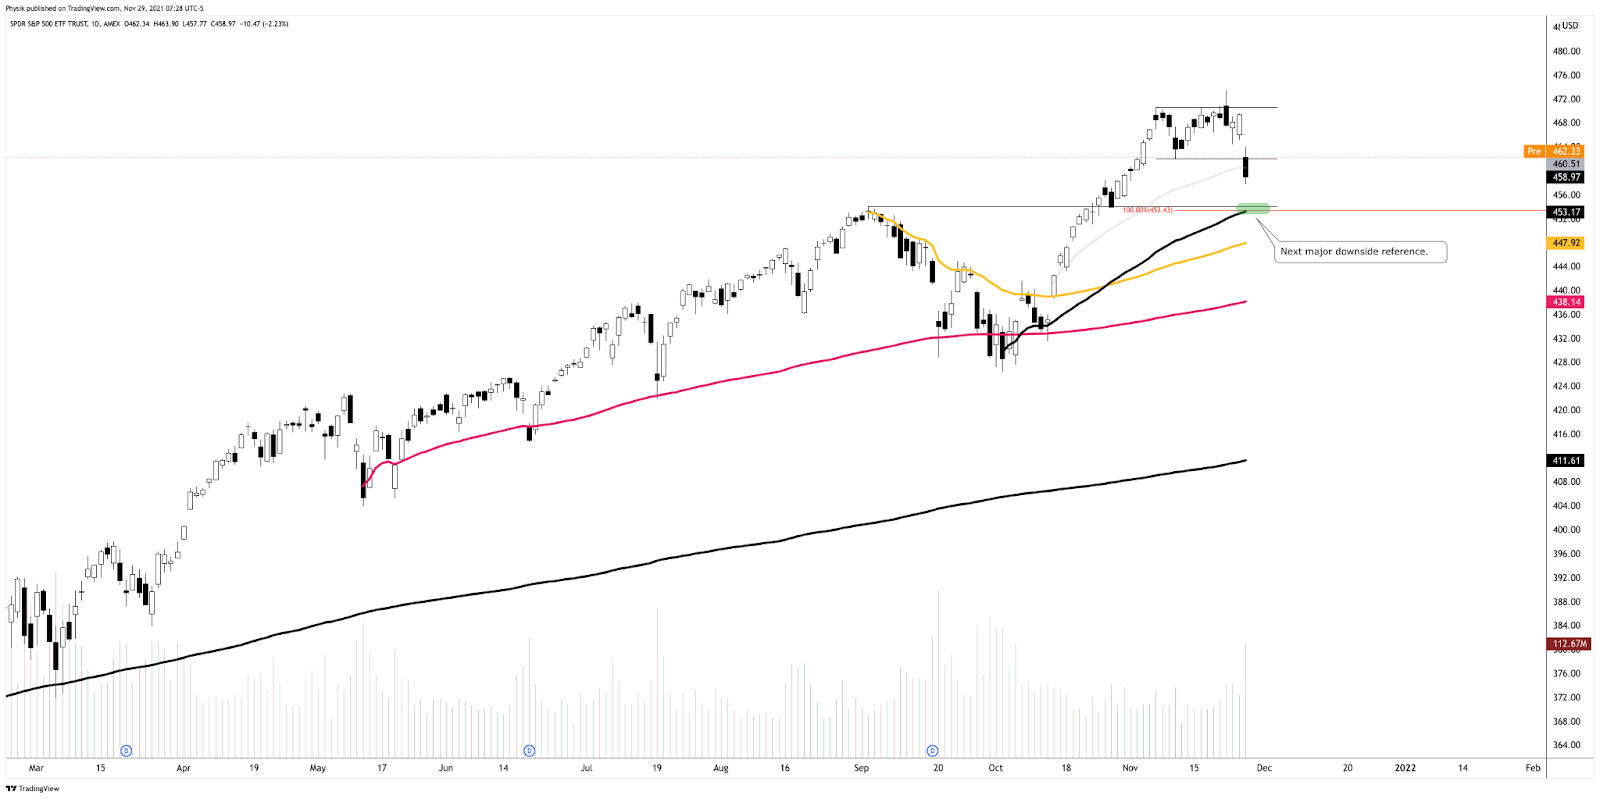
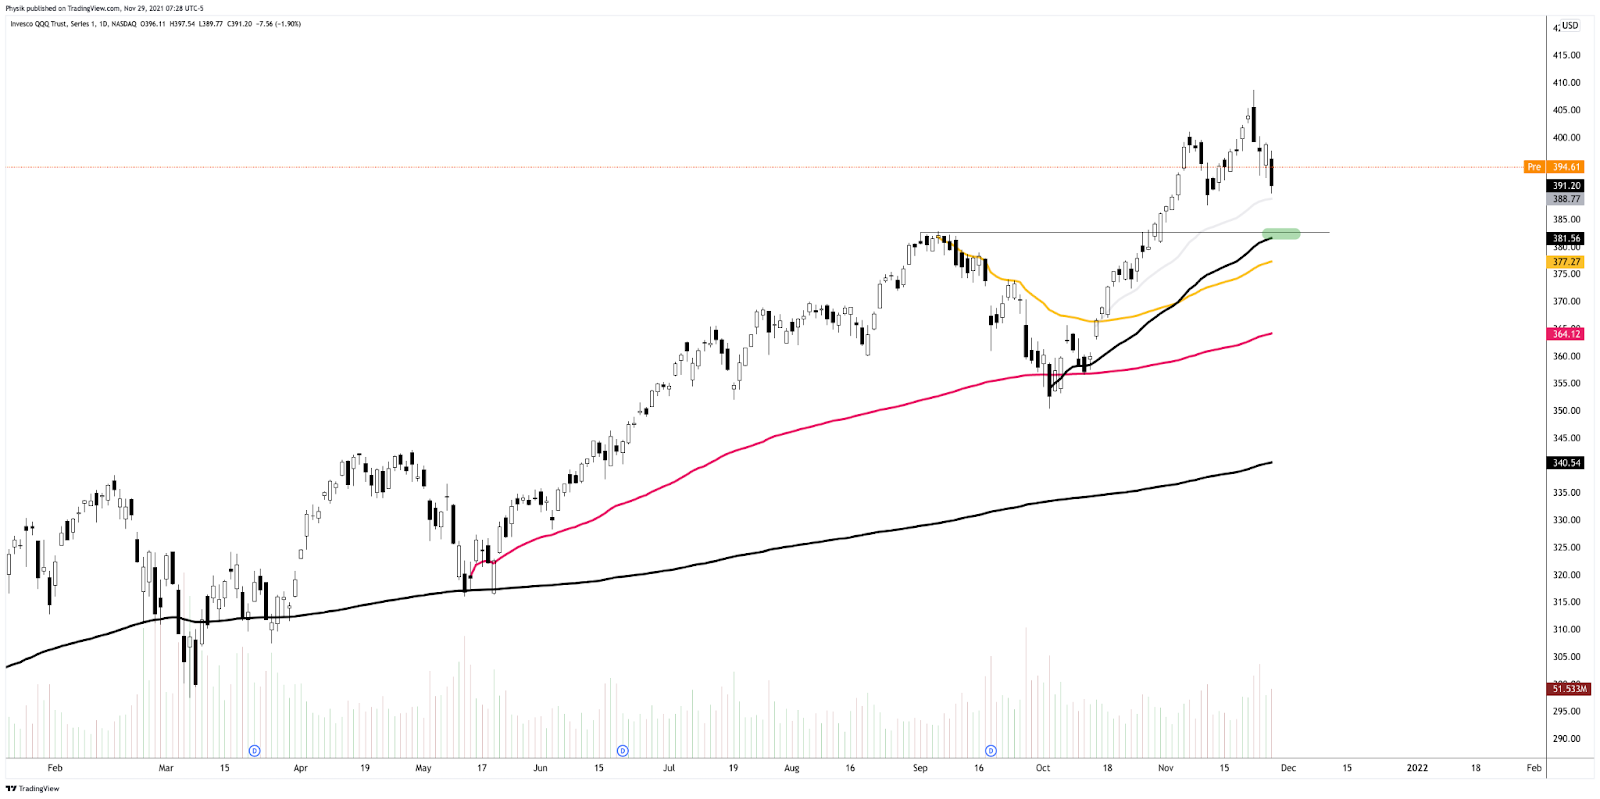
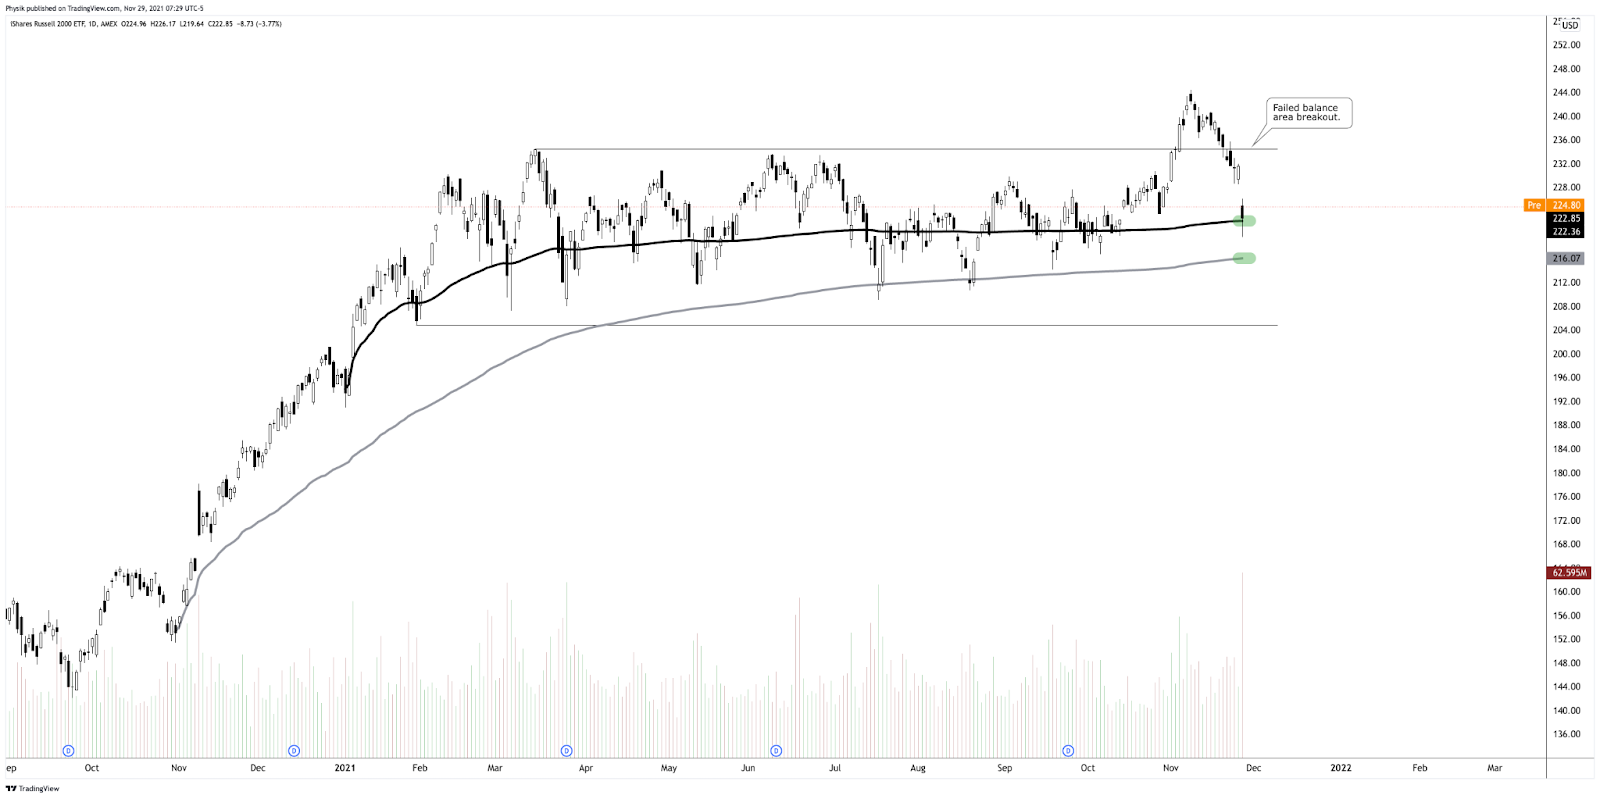
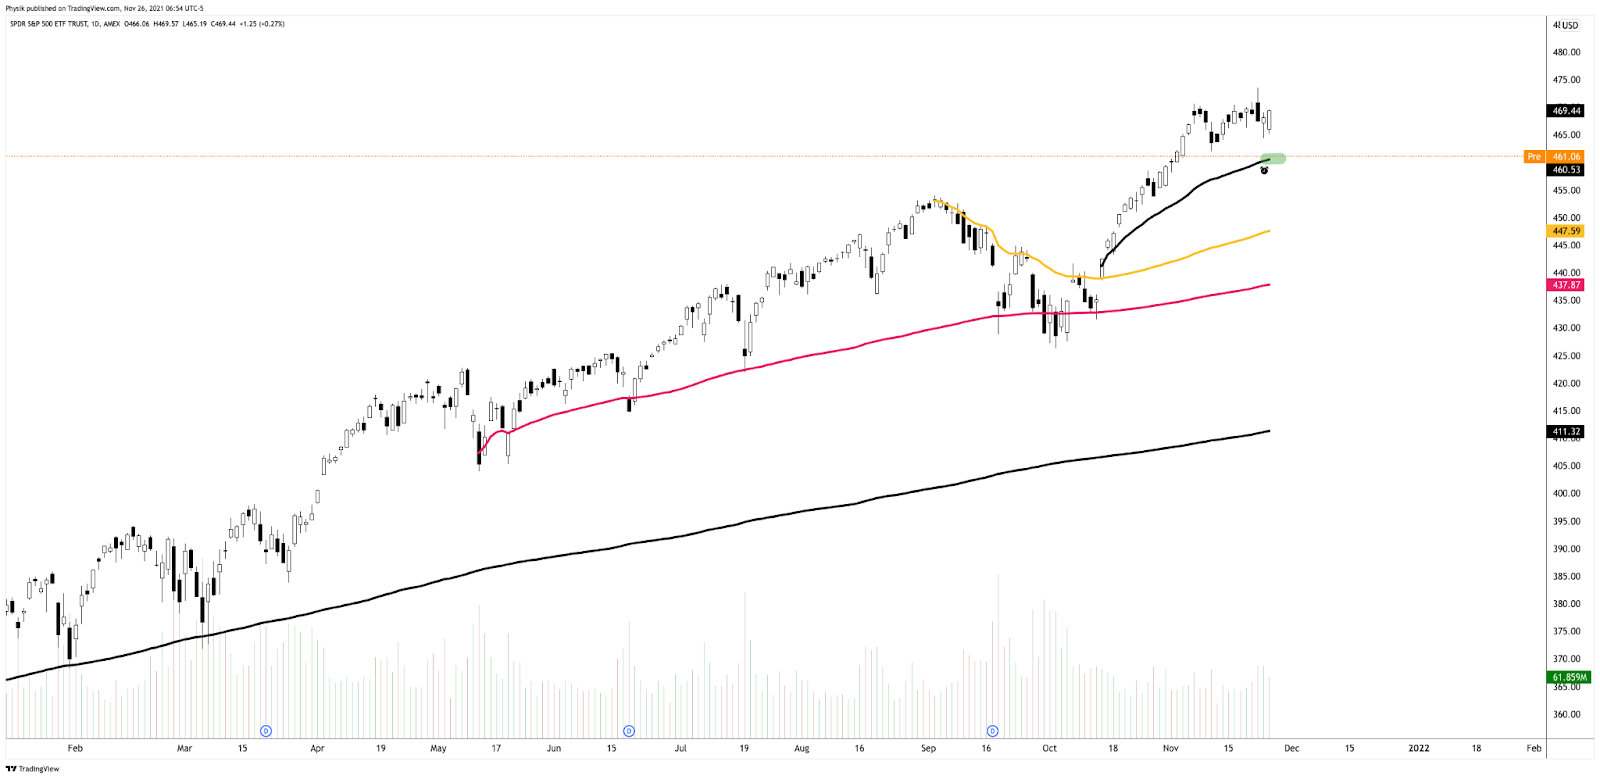
Charts To Watch
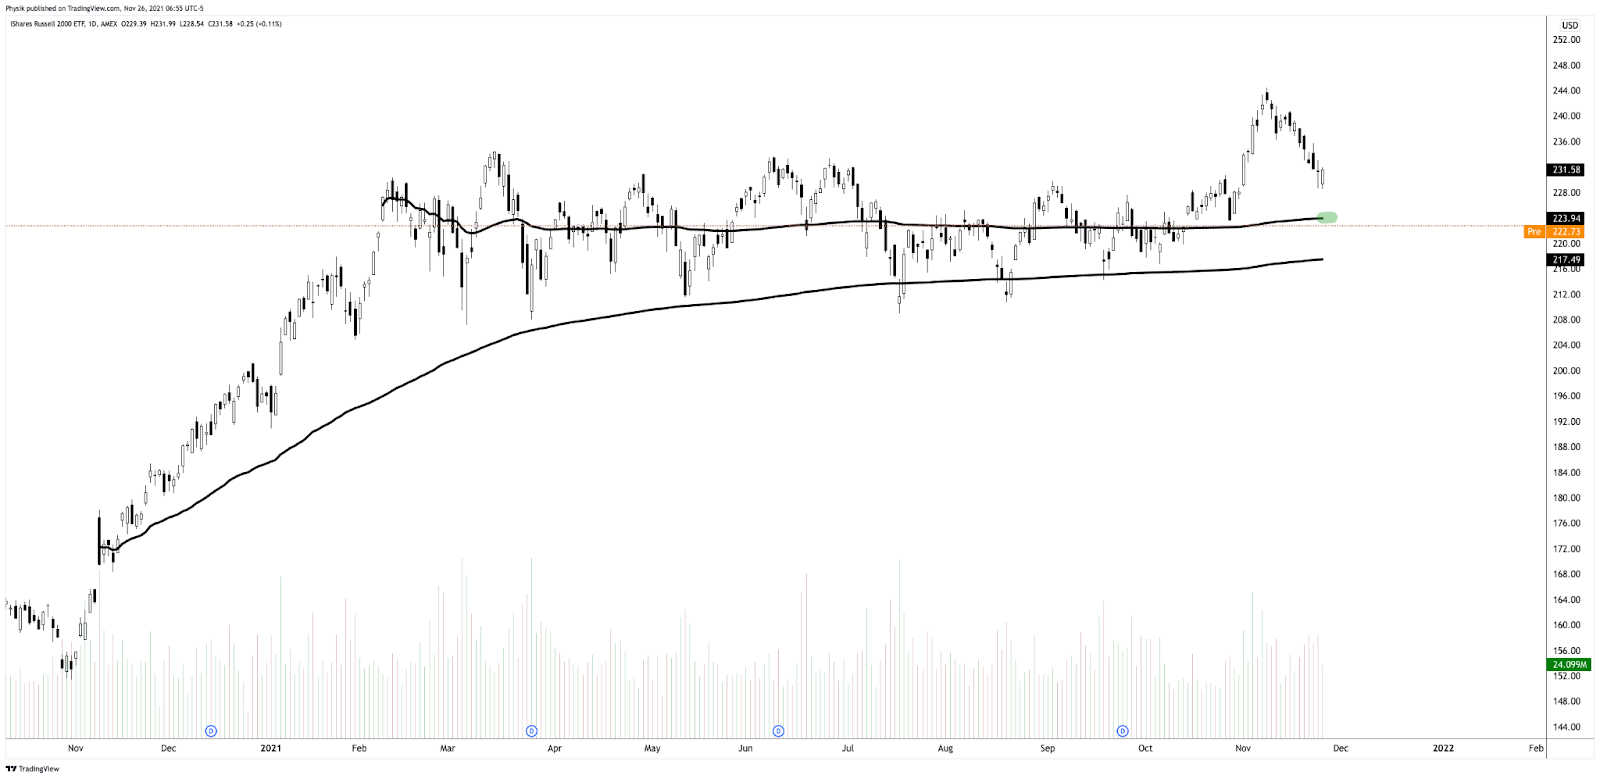
Graphic: (NYSE: SPY). (S~$460 and $453). S is for support.Graphic: (NASDAQ: QQQ). (S~$389 and $381). S is for support.Graphic: (NYSE: IWM). (S~$222 and $216). S is for support.
What People Are Saying
On Friday the SPY had a fire lit underneath it, it was the most illiquid day in a very long time. 332 of the 504 the S&P500 components printed 200 day Illiquidity Ranks above 90%. So what does it mean. pic.twitter.com/KB94QiIPGB
Overnight Rally Highs (Lows): Typically, there is a low historical probability associated with overnight rally-highs (lows) ending the upside (downside) discovery process.
Volume Areas: A structurally sound market will build on areas of high volume (HVNodes). Should the market trend for long periods of time, it will lack sound structure, identified as low volume areas (LVNodes). LVNodes denote directional conviction and ought to offer support on any test.
If participants were to auction and find acceptance into areas of prior low volume (LVNodes), then future discovery ought to be volatile and quick as participants look to HVNodes for favorable entry or exit.
Gamma: Gamma is the sensitivity of an option to changes in the underlying price. Dealers that take the other side of options trades hedge their exposure to risk by buying and selling the underlying. When dealers are short-gamma, they hedge by buying into strength and selling into weakness. When dealers are long-gamma, they hedge by selling into strength and buying into weakness. The former exacerbates volatility. The latter calms volatility.
POCs: POCs are valuable as they denote areas where two-sided trade was most prevalent in a prior day session. Participants will respond to future tests of value as they offer favorable entry and exit.
MCPOCs: POCs are valuable as they denote areas where two-sided trade was most prevalent over numerous day sessions. Participants will respond to future tests of value as they offer favorable entry and exit.
Options Expiration (OPEX): Traditionally, option expiries mark an end to pinning (i.e, the theory that market makers and institutions short options move stocks to the point where the greatest dollar value of contracts will expire) and the reduction dealer gamma exposure.
Rates: Low rates have to potential to increase the present value of future earnings making stocks, especially those that are high growth, more attractive. To note, inflation and rates move inversely to each other. Low rates stimulate demand for loans (i.e., borrowing money is more attractive).
About
After years of self-education, strategy development, and trial-and-error, Renato Leonard Capelj began trading full-time and founded Physik Invest to detail his methods, research, and performance in the markets.
Additionally, Capelj is a Benzinga finance and technology reporter interviewing the likes of Shark Tank’s Kevin O’Leary, JC2 Ventures’ John Chambers, and ARK Invest’s Catherine Wood, as well as a SpotGamma contributor, developing insights around impactful options market dynamics.
Disclaimer
At this time, Physik Invest does not manage outside capital and is not licensed. In no way should the materials herein be construed as advice. Derivatives carry a substantial risk of loss. All content is for informational purposes only.
Ahead of a shortened holiday session, equity index futures auctioned lower alongside the narrative of a resurgence in the COVID-19 coronavirus.
Most affected appears the Russell 2000 which was down nearly 4.00%, at the time of this writing. The S&P 500 was off about 2.00% or so, buoyed by the innovation- and tech-heavy Nasdaq 100 which was only down about 1.00%.
This shift in relative strength comes as the ten-year yield sits lower about 8.00%. The CBOE Volatility Index (INDEX: VIX) was up over 40.00% and the implications of this are staggering, given the underhedged market I talked about over the past sessions.
Moreover, there are no scheduled economic releases, today.
Graphic updated 6:00 AM ET. Sentiment Risk-Off if expected /ES open is below the prior day’s range. /ES levels are derived from the profile graphic at the bottom of the following section. Levels may have changed since initially quoted; click here for the latest levels. SqueezeMetrics Dark Pool Index (DIX) and Gamma (GEX) calculations are based on where the prior day’s reading falls with respect to the MAX and MIN of all occurrences available. A higher DIX is bullish. At the same time, the lower the GEX, the more (expected) volatility. Learn the implications of volatility, direction, and moneyness. SHIFT data used for S&P 500 (INDEX: SPX) options activity. Note that options flow is sorted by the call premium spent; if more positive then more was spent on call options. Breadth reflects a reading of the prior day’s NYSE Advance/Decline indicator. VIX reflects a current reading of the CBOE Volatility Index (INDEX: VIX) from 0-100.
What To Expect
On Wednesday’s lackluster breadth and market liquidity metrics, the best case occurred.
The S&P 500 recovered its $4,697.50 spike base, below which selling activity appeared to be the result of weaker-handed participants liquidating as a result of poor location and news.
Overnight, however, the tone shifted. The S&P 500 initiated back through its $4,647.25 high volume area (HVNode) which had corresponded with the 20-day simple moving average.
The 20-day presented participants with a clear way to measure risk, given the mechanical responses in prior trade. As explained, Wednesday, should participants manage to break past the 20-day, then conditions have changed and follow-through was likely.
Reason being? Those visual levels are acted on by short-term, technically-driven participants who generally are unable to defend retests.
Graphic: Divergent delta (i.e., non-committed buying as measured by volume delta or buying and selling power as calculated by the difference in volume traded at the bid and offer) in SPDR S&P 500 ETF Trust (NYSE: SPY), one of the largest ETFs that track the S&P 500 index, via Bookmap. The readings were supportive of responsive trade (i.e., rotational trade that suggests current prices did not offer favorable entry and exit; the market was in balance).
Context: The aforementioned trade is happening in the context of an “insatiable appetite for stocks this year,” as Bloomberg explains.
“Investors have poured almost $900 billion into equity exchange-traded and long-only funds in 2021 — exceeding the combined total from the past 19 years.”
This appetite fed into the activity of some high-flyers like Tesla Inc (NASDAQ: TSLA) with customers opting to aggressively sell puts and buy calls heading into the November monthly options expiration (OPEX).
Graphic: Customers took on significant leverage in their purchase and sale of options, via SpotGamma.
Unfortunately, (1) after OPEX, the absence of sticky and supportive hedging flows freed the broader market for directional resolve, and (2) according to SpotGamma, in light of recent exuberance, “participants [were] underexposed to downside put protection.”
The implications of the latter are staggering.
In short, should volatility continue to pick up, those participants (who were once exuberant) are likely to reach for protection forcing dealers to reflexively hedge in a destabilizing manner.
As volatility rises and customers demand protection, counterparties are to hedge by selling into weakness. The conditions worsen when much of the activity is in shorter-dated tenors where options gamma is more sensitive if we will. This is what we’re seeing.
Graphic: The CBOE Volatility Index (INDEX: VIX) was higher, while demand came in most predominantly across the entire area of the VIX futures term structure. That, alongside the market’s entry into short-gamma, suggests participants’ hedging has destabilizing implications.
Note that I said short-dated.
Once that exposure rolls off the table (and/or is monetized), dealers/counterparties will reverse and support the market, buying-to-close their existing stock/futures hedges to negative gamma positions.
This flow is stabilizing and may play into a seasonally-aligned rally into Christmas.
As stated on November 23, 2021: “This last part is educated conjecture. It’s what I also feel as though would frustrate the most amount of participants. Basically, a quick wash (or sideways to lower), followed by a move higher into year-end. Be nimble and responsive!”
Expectations: As of 6:00 AM ET, Friday’s regular session (9:30 AM – 1:00 PM ET), in the S&P 500, will likely open in the lower part of a negatively skewed overnight inventory, outside of prior-range and -value, suggesting a potential for immediate directional opportunity.
Gap Scenarios Are In Play: Gaps ought to fill quickly. Should they not, that’s a signal of strength; do not fade. Leaving value behind on a gap-fill or failing to fill a gap (i.e., remaining outside of the prior session’s range) is a go-with indicator.

Auctioning and spending at least 1-hour of trade back in the prior range suggests a lack of conviction; in such a case, do not follow the direction of the most recent initiative activity.
In the best case, the S&P 500 trades sideways or higher; activity above the $4,618.75 high volume area (HVNode) puts in play the $4,647.25 HVNode. Initiative trade beyond the latter HVNode could reach as high as the $4,674.25 micro composite point of control (MCPOC) and $4,691.25 HVNode, or higher.
In the worst case, the S&P 500 trades lower; activity below the $4,618.75 HVNode puts in play the $4,596.75 overnight low (ONL) and $4,590.00 balance boundary (BAH). Initiative trade beyond the BAH could reach as low as the $4,574.25 HVNode and $4,551.75 LVNode, or lower.
Click here to load today’s updated key levels into the web-based TradingView charting platform. Note that all levels are derived using the 65-minute timeframe. New links are produced, daily.
Graphic: 65-minute profile chart of the Micro E-mini S&P 500 Futures. Learn about the profile.
Charts To Watch
Graphic: (ETF: IWM). (Key VWAP support at ~$223)Graphic: (ETF: SPY). (Key VWAP support at ~$460)Graphic: (ETF: QQQ). (Key VWAP support at ~$388)
What People Are Saying
The media seems to attribute the current sell-off to new Covid variant.
However, I'm curious how much of the sell-off is actually due to Covid and how much is due to a less dovish Fed, as there were news that Fed might double its tapering and raise rates quicker than expected.
S&P500, $SPY short-term (10-day) Sector Correlations are ultra low closing at .06. In 2021 this condition has preceded sell-offs. pic.twitter.com/KB1H7vITqR
Spikes: Spike’s mark the beginning of a break from value. Spikes higher (lower) are validated by trade at or above (below) the spike base (i.e., the origin of the spike).
Overnight Rally Highs (Lows): Typically, there is a low historical probability associated with overnight rally-highs (lows) ending the upside (downside) discovery process.
Volume Areas: A structurally sound market will build on areas of high volume (HVNodes). Should the market trend for long periods of time, it will lack sound structure, identified as low volume areas (LVNodes). LVNodes denote directional conviction and ought to offer support on any test.
If participants were to auction and find acceptance into areas of prior low volume (LVNodes), then future discovery ought to be volatile and quick as participants look to HVNodes for favorable entry or exit.
Gamma: Gamma is the sensitivity of an option to changes in the underlying price. Dealers that take the other side of options trades hedge their exposure to risk by buying and selling the underlying. When dealers are short-gamma, they hedge by buying into strength and selling into weakness. When dealers are long-gamma, they hedge by selling into strength and buying into weakness. The former exacerbates volatility. The latter calms volatility.
MCPOCs: POCs are valuable as they denote areas where two-sided trade was most prevalent over numerous day sessions. Participants will respond to future tests of value as they offer favorable entry and exit.
Options Expiration (OPEX): Traditionally, option expiries mark an end to pinning (i.e, the theory that market makers and institutions short options move stocks to the point where the greatest dollar value of contracts will expire) and the reduction dealer gamma exposure.
Volume-Weighted Average Prices (VWAPs): A metric highly regarded by chief investment officers, among other participants, for quality of trade. Additionally, liquidity algorithms are benchmarked and programmed to buy and sell around VWAPs.
About
After years of self-education, strategy development, and trial-and-error, Renato Leonard Capelj began trading full-time and founded Physik Invest to detail his methods, research, and performance in the markets.
Additionally, Capelj is a Benzinga finance and technology reporter interviewing the likes of Shark Tank’s Kevin O’Leary, JC2 Ventures’ John Chambers, and ARK Invest’s Catherine Wood, as well as a SpotGamma contributor, developing insights around impactful options market dynamics.
Disclaimer
At this time, Physik Invest does not manage outside capital and is not licensed. In no way should the materials herein be construed as advice. Derivatives carry a substantial risk of loss. All content is for informational purposes only.
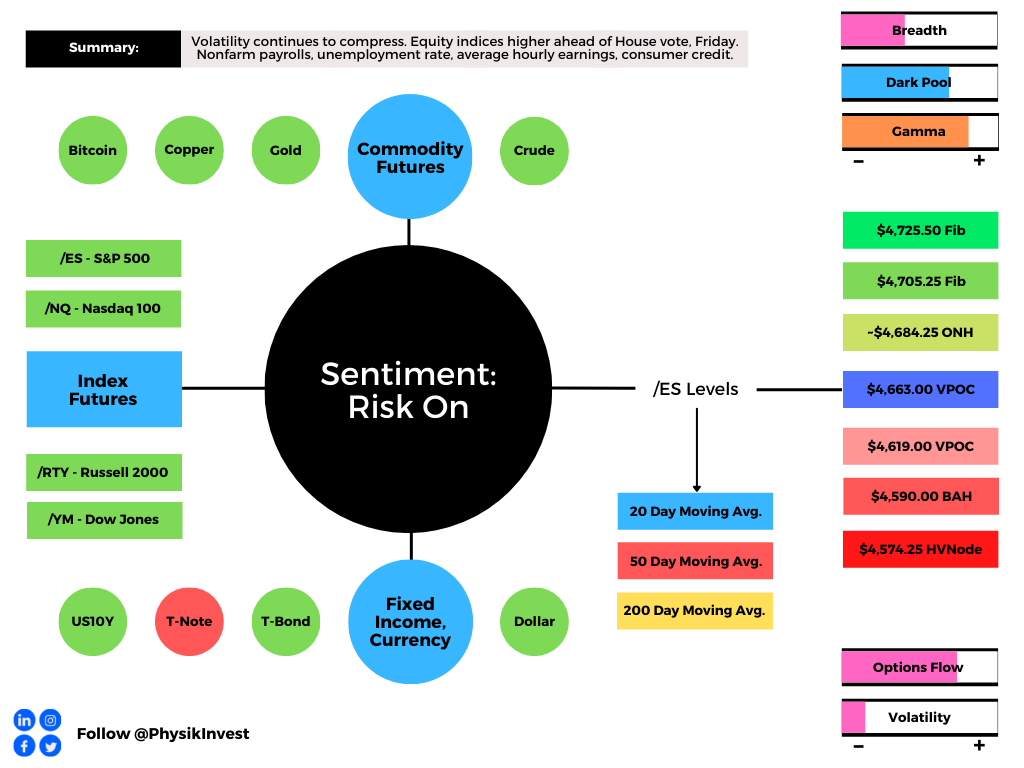
Equity index futures higher. Commodities were higher. Bonds mixed. Volatility compressed.
Ahead is a heavier day of economic releases, in the face of fundamental narratives and positioning metrics that may support intraday price stability.
What Happened
Overnight, equity index futures were marked up ahead of the House’s plan to vote on President Joe Biden’s economic package and infrastructure, as well as October jobs data.
Also, in the news, there were narratives surrounding China’s dollar surplus, a pandemic resurgence in Europe, Pfizer Inc’s (NYSE: PFE) development of a pill for COVID-19.
Ahead is data on payrolls, unemployment, and average hourly earnings (8:30 AM ET), as well as consumer credit (3:00 PM ET). I apologize as this is what I listed yesterday, mistakenly.
Graphic updated 6:30 AM ET. Sentiment Risk-On if expected /ES open is above the prior day’s range. /ES levels are derived from the profile graphic at the bottom of the following section. Levels may have changed since initially quoted; click here for the latest levels. SqueezeMetrics Dark Pool Index (DIX) and Gamma (GEX) calculations are based on where the prior day’s reading falls with respect to the MAX and MIN of all occurrences available. A higher DIX is bullish. At the same time, the lower the GEX, the more (expected) volatility. Learn the implications of volatility, direction, and moneyness. SHIFT data used for S&P 500 (INDEX: SPX) options activity. Note that options flow is sorted by the call premium spent; if more positive then more was spent on call options. Breadth reflects a reading of the prior day’s NYSE Advance/Decline indicator. VIX reflects a current reading of the CBOE Volatility Index (INDEX: VIX) from 0-100.
What To Expect
On weak intraday breadth and lacklustermarket liquidity metrics, the best case outcome occurred, evidenced by balanced trade at newly discovered S&P 500 prices.
As also evidenced by the separation of value, overnight, the gap out of yesterday’s range marks a potential willingness to continue the uptrend.
To note, poor structure left behind prior initiative trade adds to technical instability, a dynamic mentioned in prior commentaries. Participants will likely look to check old value (i.e., revisit, repair, and strengthen) pockets of low-volume, feverishly, on any breakdown of trend.
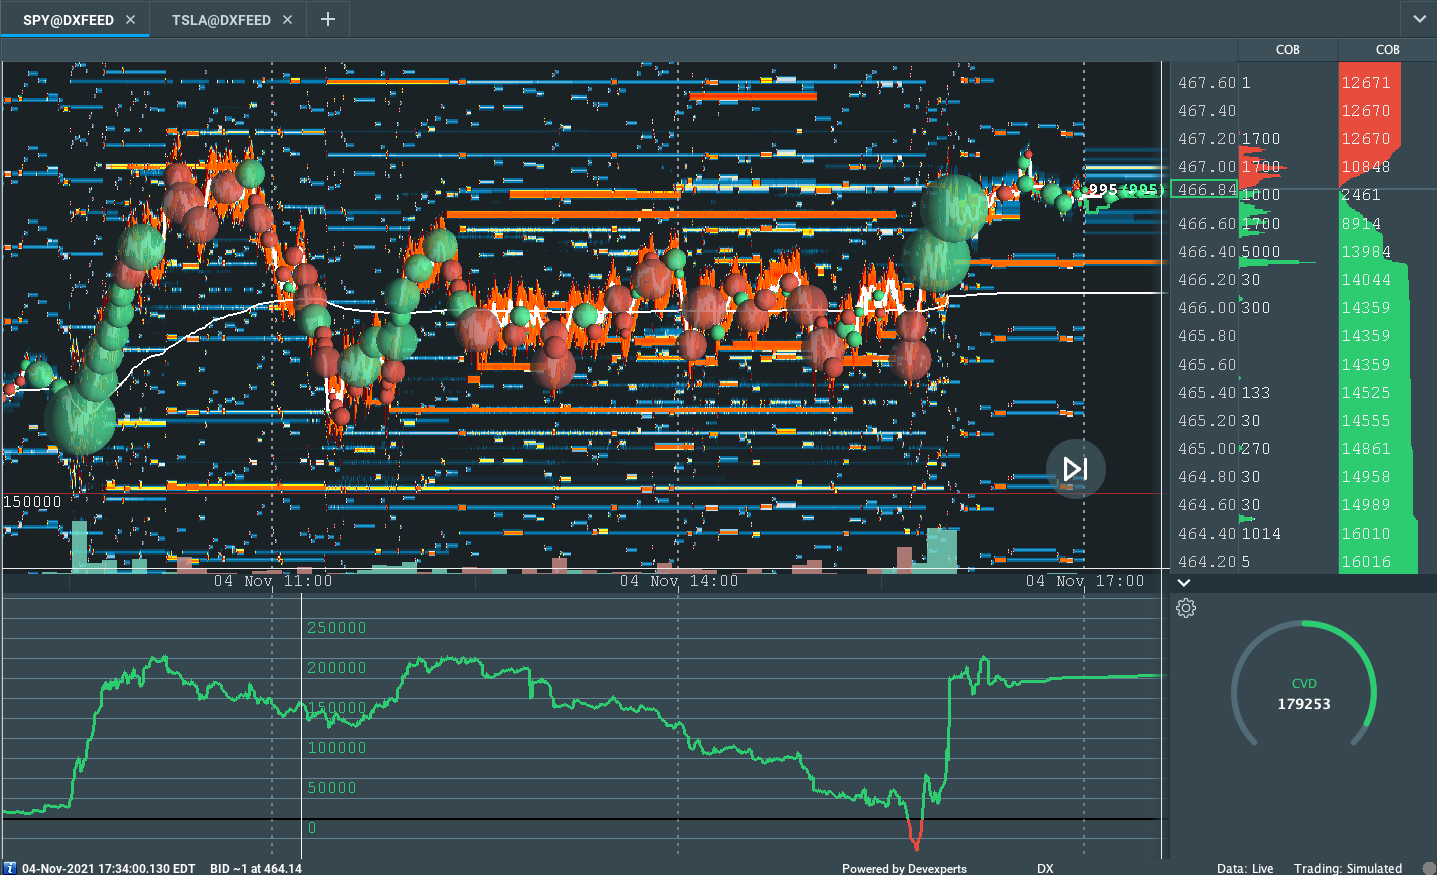
Graphic: Flat delta (i.e., non-committed buying/selling as measured by volume delta or buying and selling power as calculated by the difference in volume traded at the bid and offer) in SPDR S&P 500 ETF Trust (NYSE: SPY), via Bookmap. The readings are supportive of responsive trade (i.e., rotational trade that suggests current prices offered favorable entry and exit).
Context: The aforementioned trade is happening in the context of a slowdown in economic growth, increased clarity on the Federal Reserve’s (Fed) intent to moderate stimulus, as well as the prospects of renewed fiscal support.
The implications of these narratives on price are contradictory.
To elaborate, supply chain disruptions slowed the pace of economic growth, while participants saw both the Fed’s decision to taper and keep rates unchanged, as well as the potential passage of President Biden’s economic plan, today, as near-term positives.
In terms of positioning, the CBOE Volatility Index (INDEX: VIX) was lower, while supply came in across the VIX futures term structure. That, alongside the long-gamma environment and increased demand for options above current prices (i.e., bets on the upside), points to increased odds of near-term equity market stability.
To quote options analysis and data provider SpotGamma, “the term structure of IV (this is how high the IV is for longer-dated options) remains elevated. That suggests near term options could have more ‘bleed’ which could keep the SPX market price tailwind intact.”
Expectations: As of 6:30 AM ET, Friday’s regular session (9:30 AM – 4:00 PM ET), in the S&P 500, will likely open in the upper part of a positively skewed overnight inventory, outside of prior-range and -value, suggesting a potential for immediate directional opportunity.
Gap Scenarios: Gaps ought to fill quickly. Should they not, that’s a signal of strength; do not fade. Leaving value behind on a gap-fill or failing to fill a gap (i.e., remaining outside of the prior session’s range) is a go-with indicator.

Auctioning and spending at least 1-hour of trade back in the prior range suggests a lack of conviction; in such a case, do not follow the direction of the most recent initiative activity.
In the best case, the S&P 500 trades sideways or higher; activity above the $4,663.00 untested point of control (VPOC) puts in play the $4,684.25 overnight high (ONH). Initiative trade beyond the ONH could reach as high as the $4,705.25 and $4,725.50 Fibonacci, or higher.
In the worst case, the S&P 500 trades lower; activity below the $4,663.00 VPOC puts in play the $4,619.00 VPOC. Initiative trade beyond the VPOC could reach as low as the $4,590.00 balance boundary and $4,574.25 high volume area (HVNode), or lower.
Click here to load today’s updated key levels into the web-based TradingView charting platform. Note that all levels are derived using the 65-minute timeframe. New links are produced, daily.
Graphic: 65-minute profile chart of the Micro E-mini S&P 500 Futures. Learn about the profile.
Charts To Watch
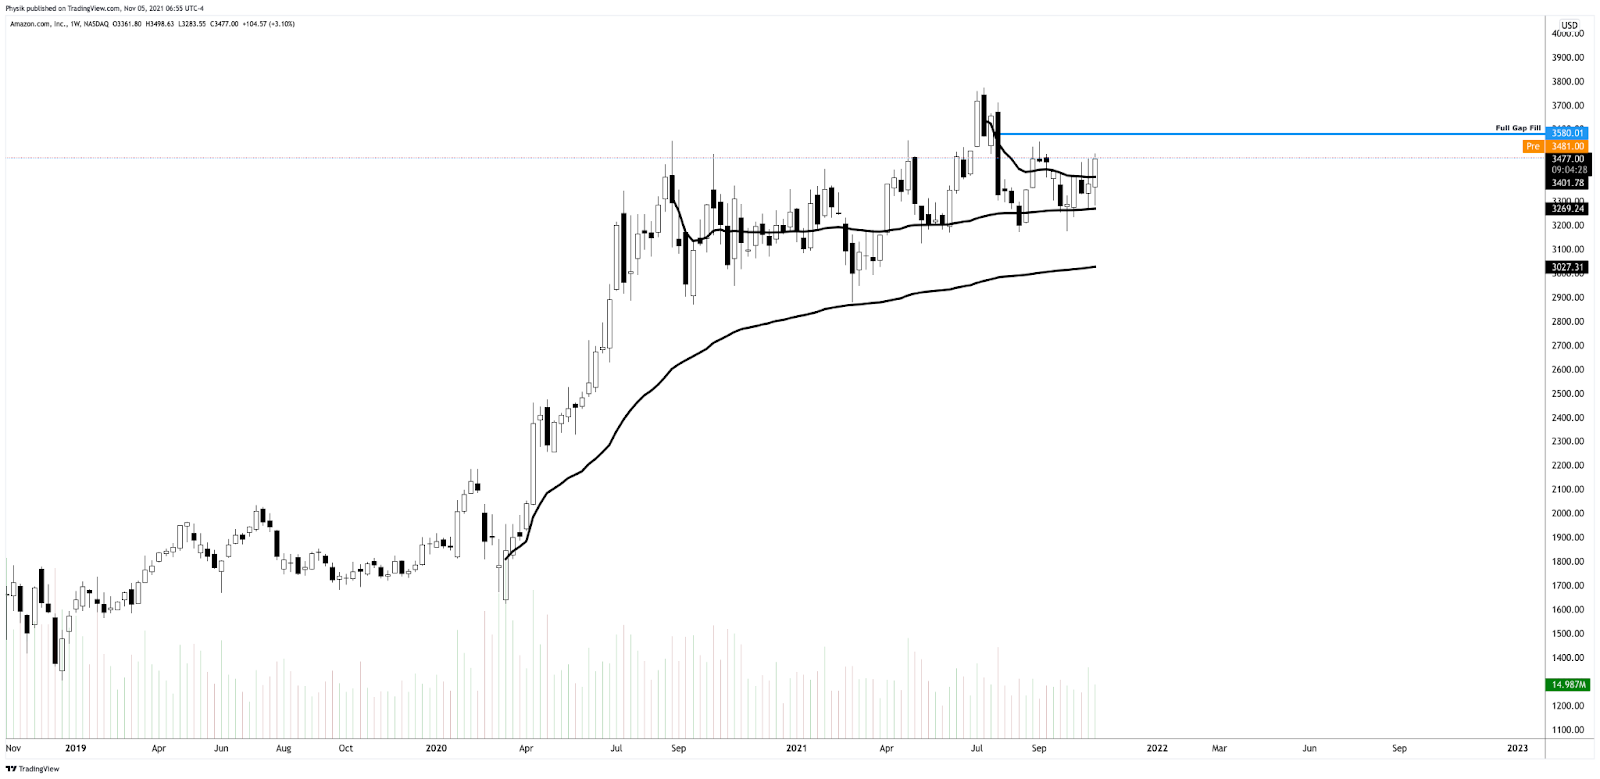
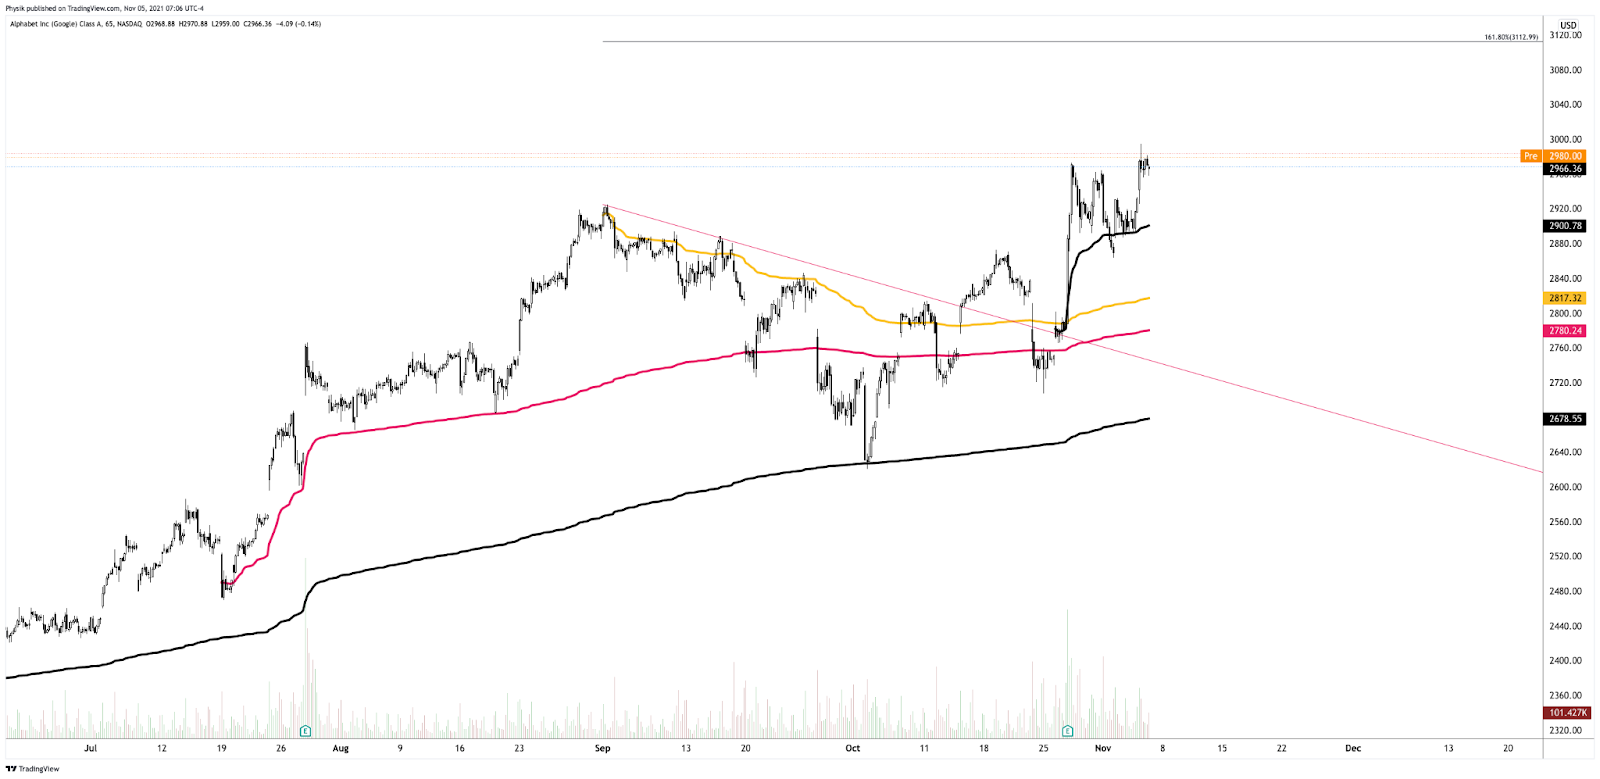
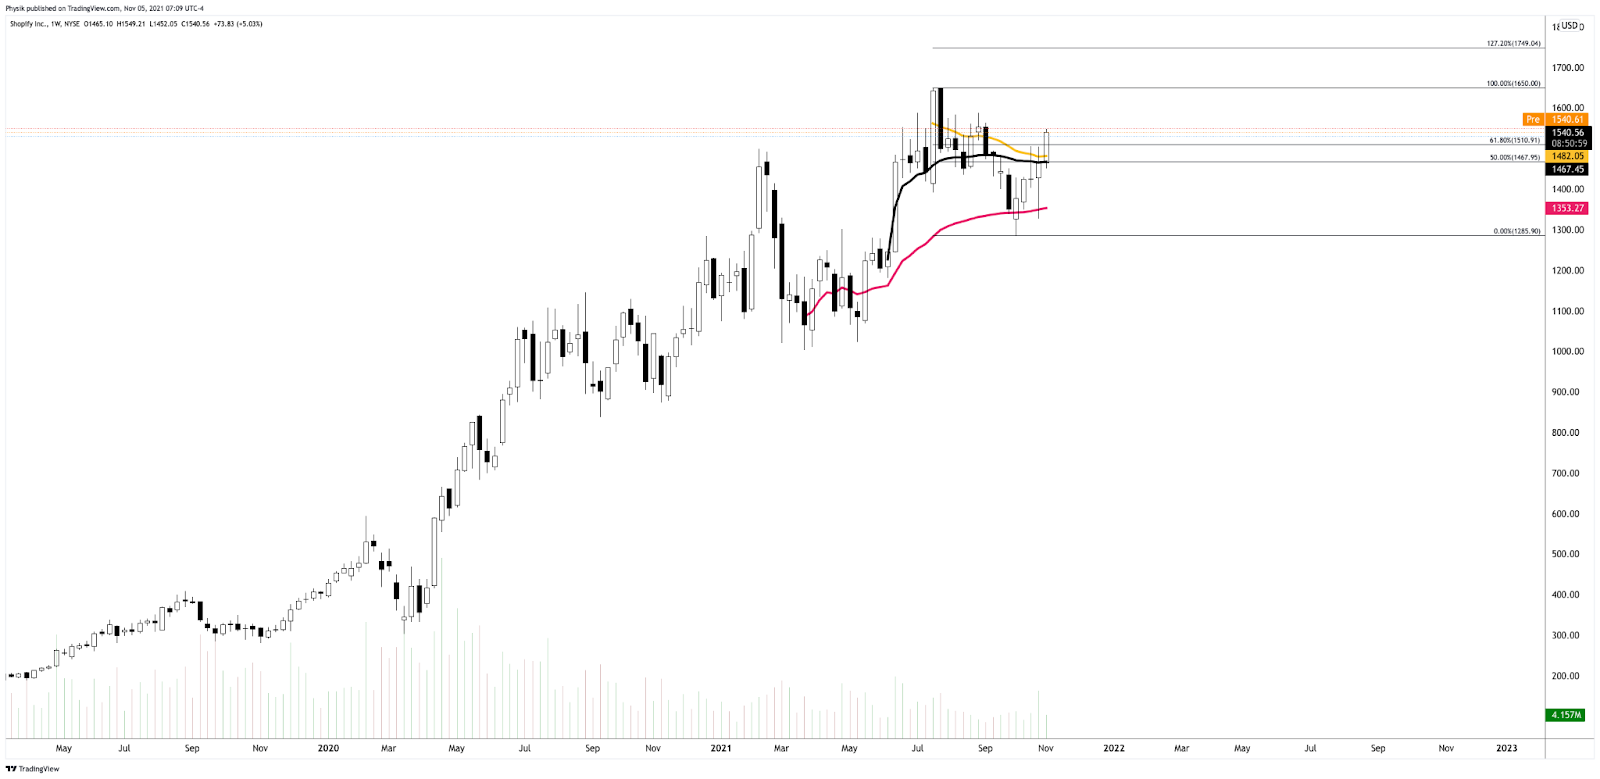
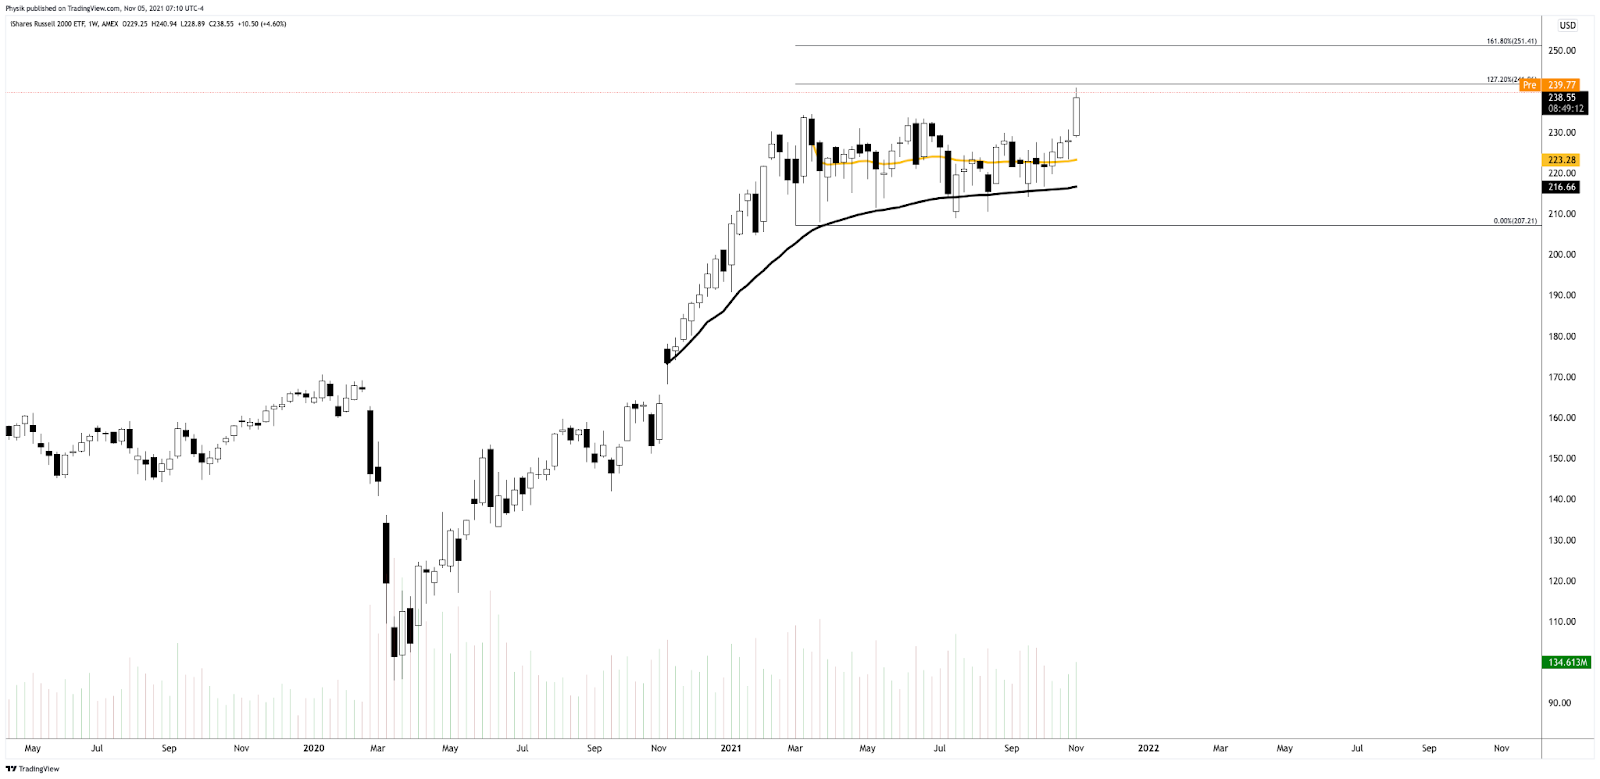
Graphic: (NASDAQ: AMZN). (S~3403, R~3580). S is for support. R is for resistance. I am seeking to initiate short-duration call structures against the 3580 gap fill and prior all-time high. Will initiate for credit or finance with put structures.Graphic: (NASDAQ: FB). (S~326.45, R~336.90). S is for support. R is for resistance. If the stock was to maintain prices above 336.90, there is a potential change in tone. In such a case, I’m targeting Fibonacci retracements with call structures financed with credits on the put side.Graphic: (NASDAQ: GOOGL). (S~2900, R~3113). S is for support. R is for resistance. I’m targeting prices between 3000 and 3100 with call structures for low cost or credit.Graphic: (NYSE: SHOP). (S~1482, R~1650). S is for support. R is for resistance. Potential break of trend, move to an all-time high.Graphic: (NYSE: IWM). (S~234.53, R~241.96, 251.41). S is for support. R is for resistance. Russell 2000 breaks out of balance. In my opinion, upon acceptance, there are potential opportunities for long trades.
Other charts I’m watching include BABA (S~155.29), ZM (S~245.92), ARKK (S~120.15), PINS (S~42.06), Z (S~58.15), BBY (S~123.65), GOOS (S~40.91), CTSH (R~82.00), LYFT (S~44.41), TMUS (S~118.00), WDC (51.47). S is for support. R is for resistance.
What People Are Saying
🔥 Goldman's Prime desk saw clients unwind risk on single names for a 3rd straight day, resulting in the largest $ de-grossing activity in 14 months – since Sept 2020.
Cave-Fill Process: Widened the area deemed favorable to transact at by an increased share of participants. This is a good development.
Overnight Rally Highs (Lows): Typically, there is a low historical probability associated with overnight rally-highs (lows) ending the upside (downside) discovery process.
Volume Areas: A structurally sound market will build on areas of high volume (HVNodes). Should the market trend for long periods of time, it will lack sound structure, identified as low volume areas (LVNodes). LVNodes denote directional conviction and ought to offer support on any test.
If participants were to auction and find acceptance into areas of prior low volume (LVNodes), then future discovery ought to be volatile and quick as participants look to HVNodes for favorable entry or exit.
Gamma: Gamma is the sensitivity of an option to changes in the underlying price. Dealers that take the other side of options trades hedge their exposure to risk by buying and selling the underlying. When dealers are short-gamma, they hedge by buying into strength and selling into weakness. When dealers are long-gamma, they hedge by selling into strength and buying into weakness. The former exacerbates volatility. The latter calms volatility.
POCs: POCs are valuable as they denote areas where two-sided trade was most prevalent in a prior day session. Participants will respond to future tests of value as they offer favorable entry and exit.
Balance (Two-Timeframe Or Bracket): Rotational trade that denotes current prices offer favorable entry and exit. Balance-areas make it easy to spot a change in the market (i.e., the transition from two-time frame trade, or balance, to one-time frame trade, or trend).
Modus operandi is responsive trade (i.e., fade the edges), rather than initiative trade (i.e., play the break).
Value-Area Placement: Perception of value unchanged if value overlapping (i.e., inside day). Perception of value has changed if value not overlapping (i.e., outside day). Delay trade in the former case.
About
After years of self-education, strategy development, and trial-and-error, Renato Leonard Capelj began trading full-time and founded Physik Invest to detail his methods, research, and performance in the markets.
Additionally, Capelj is a Benzinga finance and technology reporter interviewing the likes of Shark Tank’s Kevin O’Leary, JC2 Ventures’ John Chambers, and ARK Invest’s Catherine Wood, as well as a SpotGamma contributor, developing insights around impactful options market dynamics.
Disclaimer
At this time, Physik Invest does not manage outside capital and is not licensed. In no way should the materials herein be construed as advice. Derivatives carry a substantial risk of loss. All content is for informational purposes only.
Mostly in sync with bonds and commodities, equity index futures were mixed. Volatility compressed, further.
Ahead: Fed speak and the Beige Book.
Monetary uncertainty. Earnings pick up.
Options positioning may support prices.
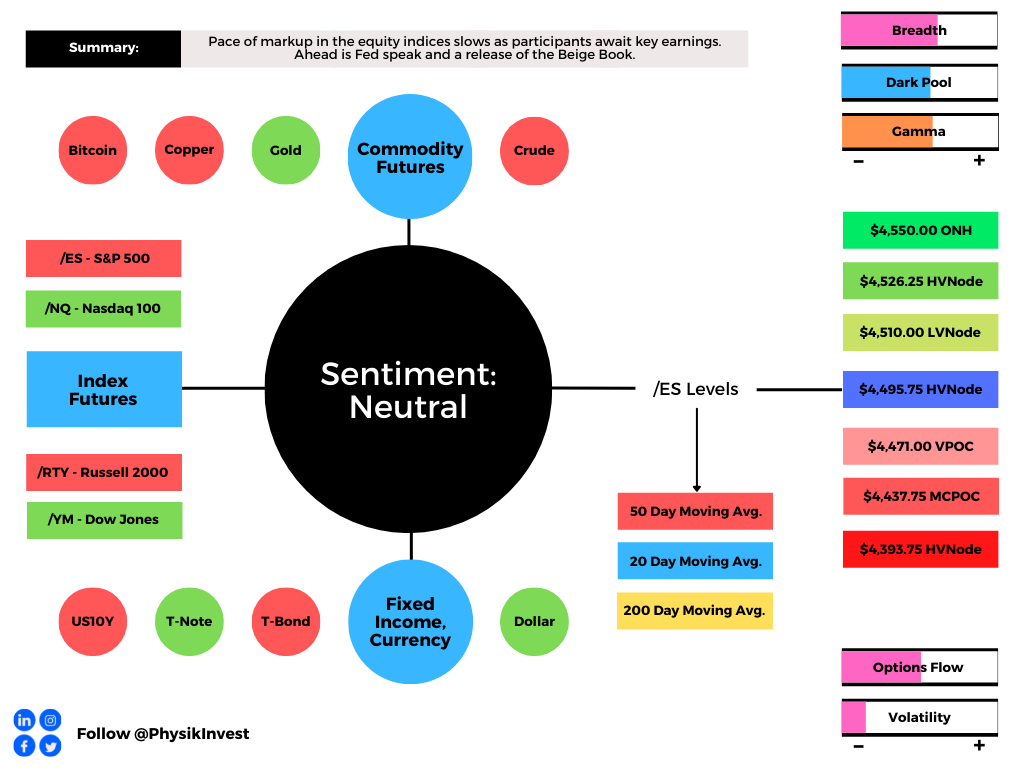
What Happened: The pace of markup in the equity indices slowed as participants await key earnings, as well as updates on monetary and fiscal policy.
Ahead is Fed-speak by Evans, Bullard, Bostic, Kashkari, and Quarles (12:00 and 1:00 PM ET), as well as a release of the Beige Book (2:00 PM ET). Tonight, also, Fed President Daly speaks (8:35 PM ET).
Graphic updated 6:45 AM ET. Sentiment Neutral if expected /ES open is inside of the prior day’s range. /ES levels are derived from the profile graphic at the bottom of the following section. Levels may have changed since initially quoted; click here for the latest levels. SqueezeMetrics Dark Pool Index (DIX) and Gamma (GEX) calculations are based on where the prior day’s reading falls with respect to the MAX and MIN of all occurrences available. A higher DIX is bullish. At the same time, the lower the GEX, the more (expected) volatility. SHIFT data used for S&P 500 (INDEX: SPX) options activity. Note that options flow is sorted by the call premium spent; if more positive then more was spent on call options. Breadth reflects a reading of the prior day’s NYSE Advance/Decline indicator. VIX reflects a current reading of the CBOE Volatility Index (INDEX: VIX) from 0-100.
What To Expect: As of 6:40 AM ET, Wednesday’s regular session (9:30 AM – 4:00 PM EST) in the S&P 500 will likely open inside of prior-range and -value, suggesting a limited potential for immediate directional opportunity.
Status Quo Is Balance: Rotational trade that denotes current prices offering favorable entry and exit. Modus operandi is responsive trade (i.e., fade the edges), rather than initiative trade (i.e., play the break), coming into today’s session.
Adding, during the prior day’s regular trade, on supportive intraday breadth and market liquidity metrics, the best case outcome occurred, evidenced by initiative buying and separation of value.
Coupled with that dynamic, in carrying forward the narrative from days prior, is the sustained presence of numerous gaps and p-shaped emotional, multiple-distribution profile structures (i.e., old-money shorts covering).
Participants will likely look to revisit, repair, and strengthen – build out areas of high volume (HVNodes) via the cave-fill process – these areas of low volume (LVNodes), later.
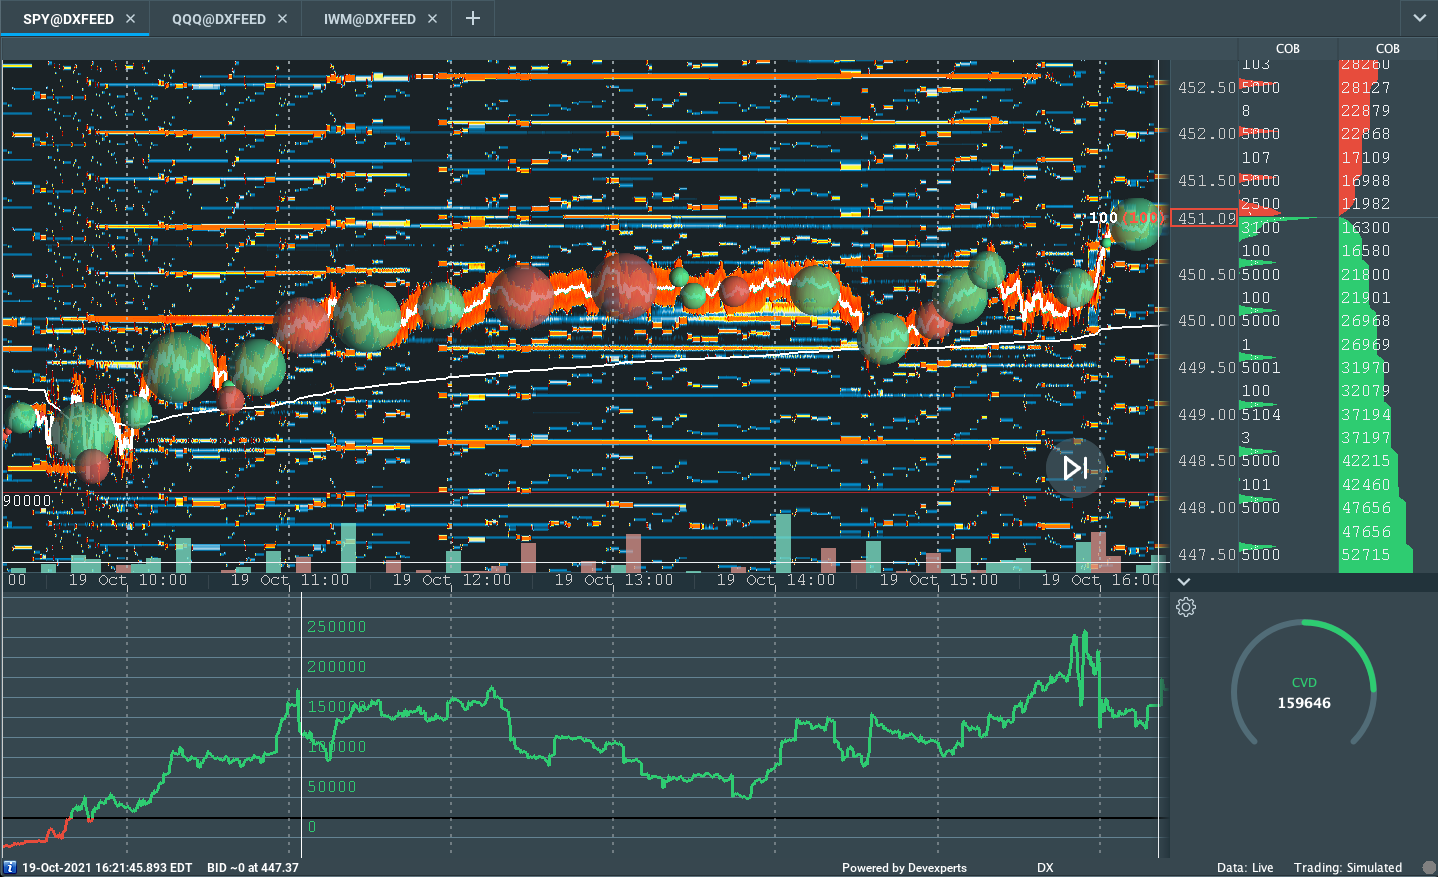
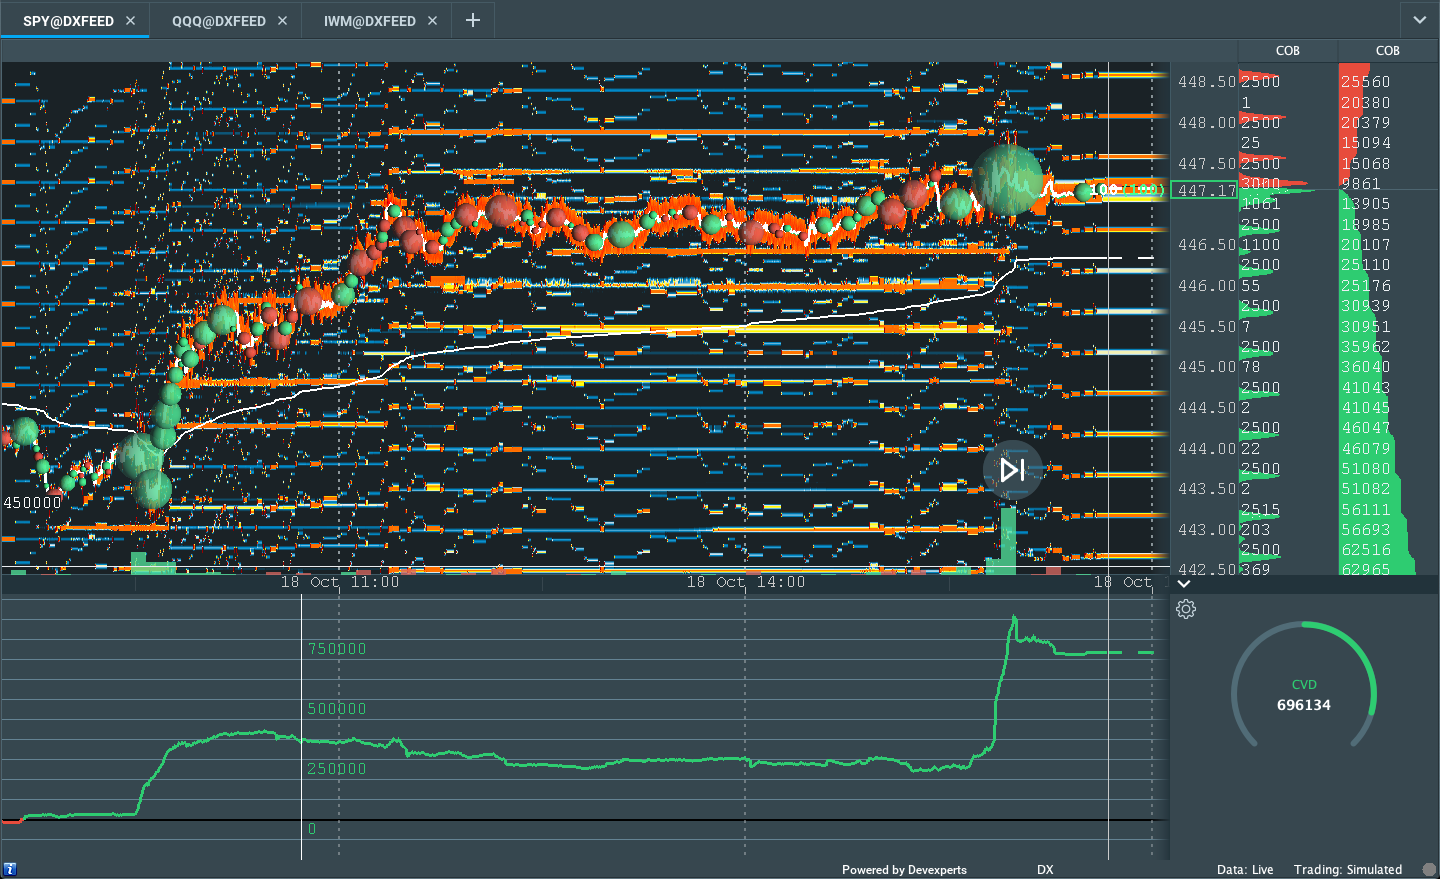
Graphic: Supportive delta (i.e., committed buying as measured by volume delta or buying and selling power as calculated by the difference in volume traded at the bid and offer) in SPDR S&P 500 ETF Trust (NYSE: SPY), one of the largest ETFs that track the S&P 500 index, via Bookmap. The readings are supportive of the initiative trade or markup in price.
Zooming out, we see the Nasdaq 100 trading strong, relative to its peers.
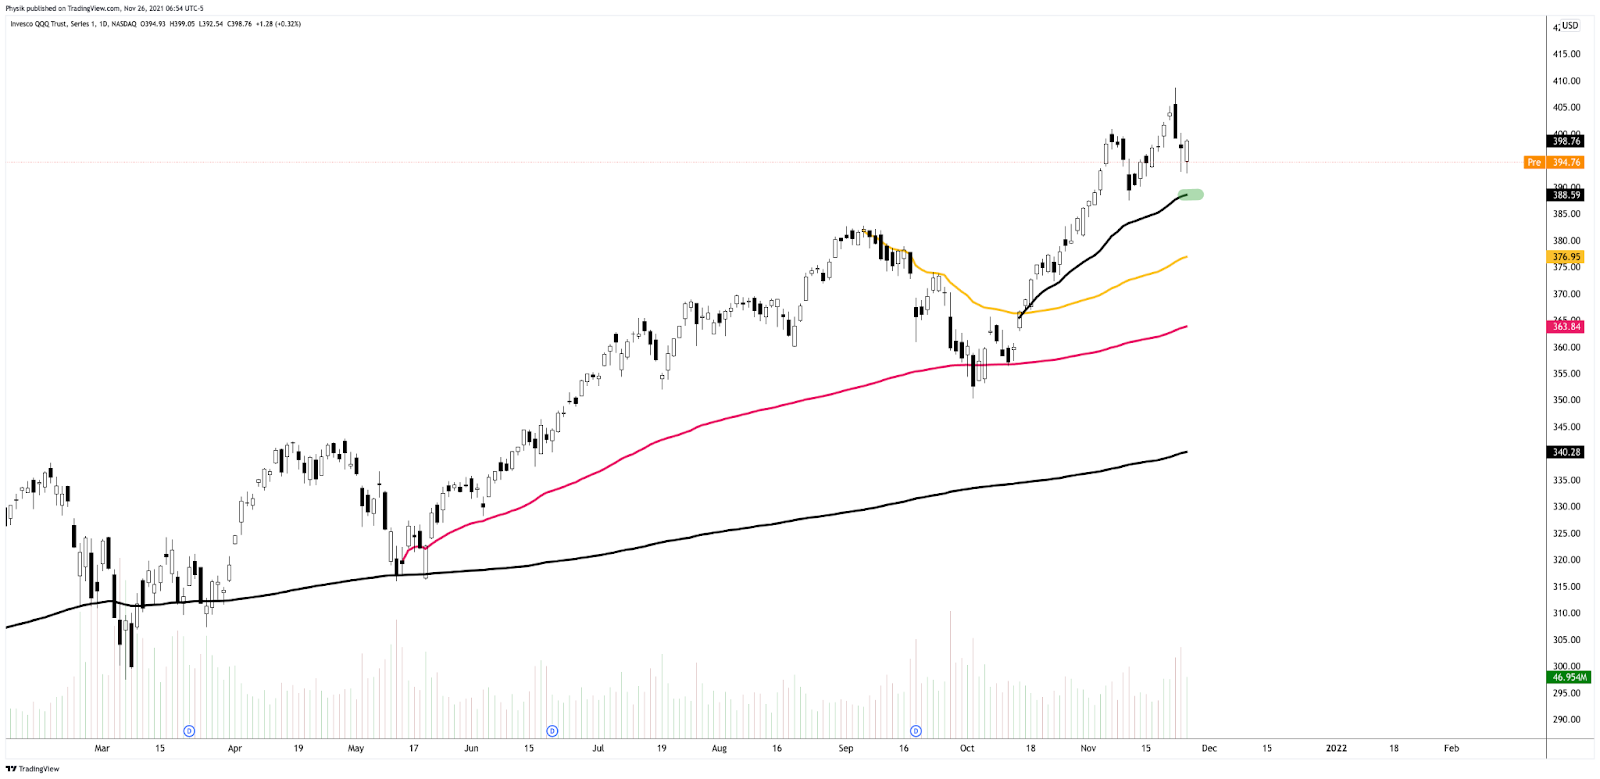
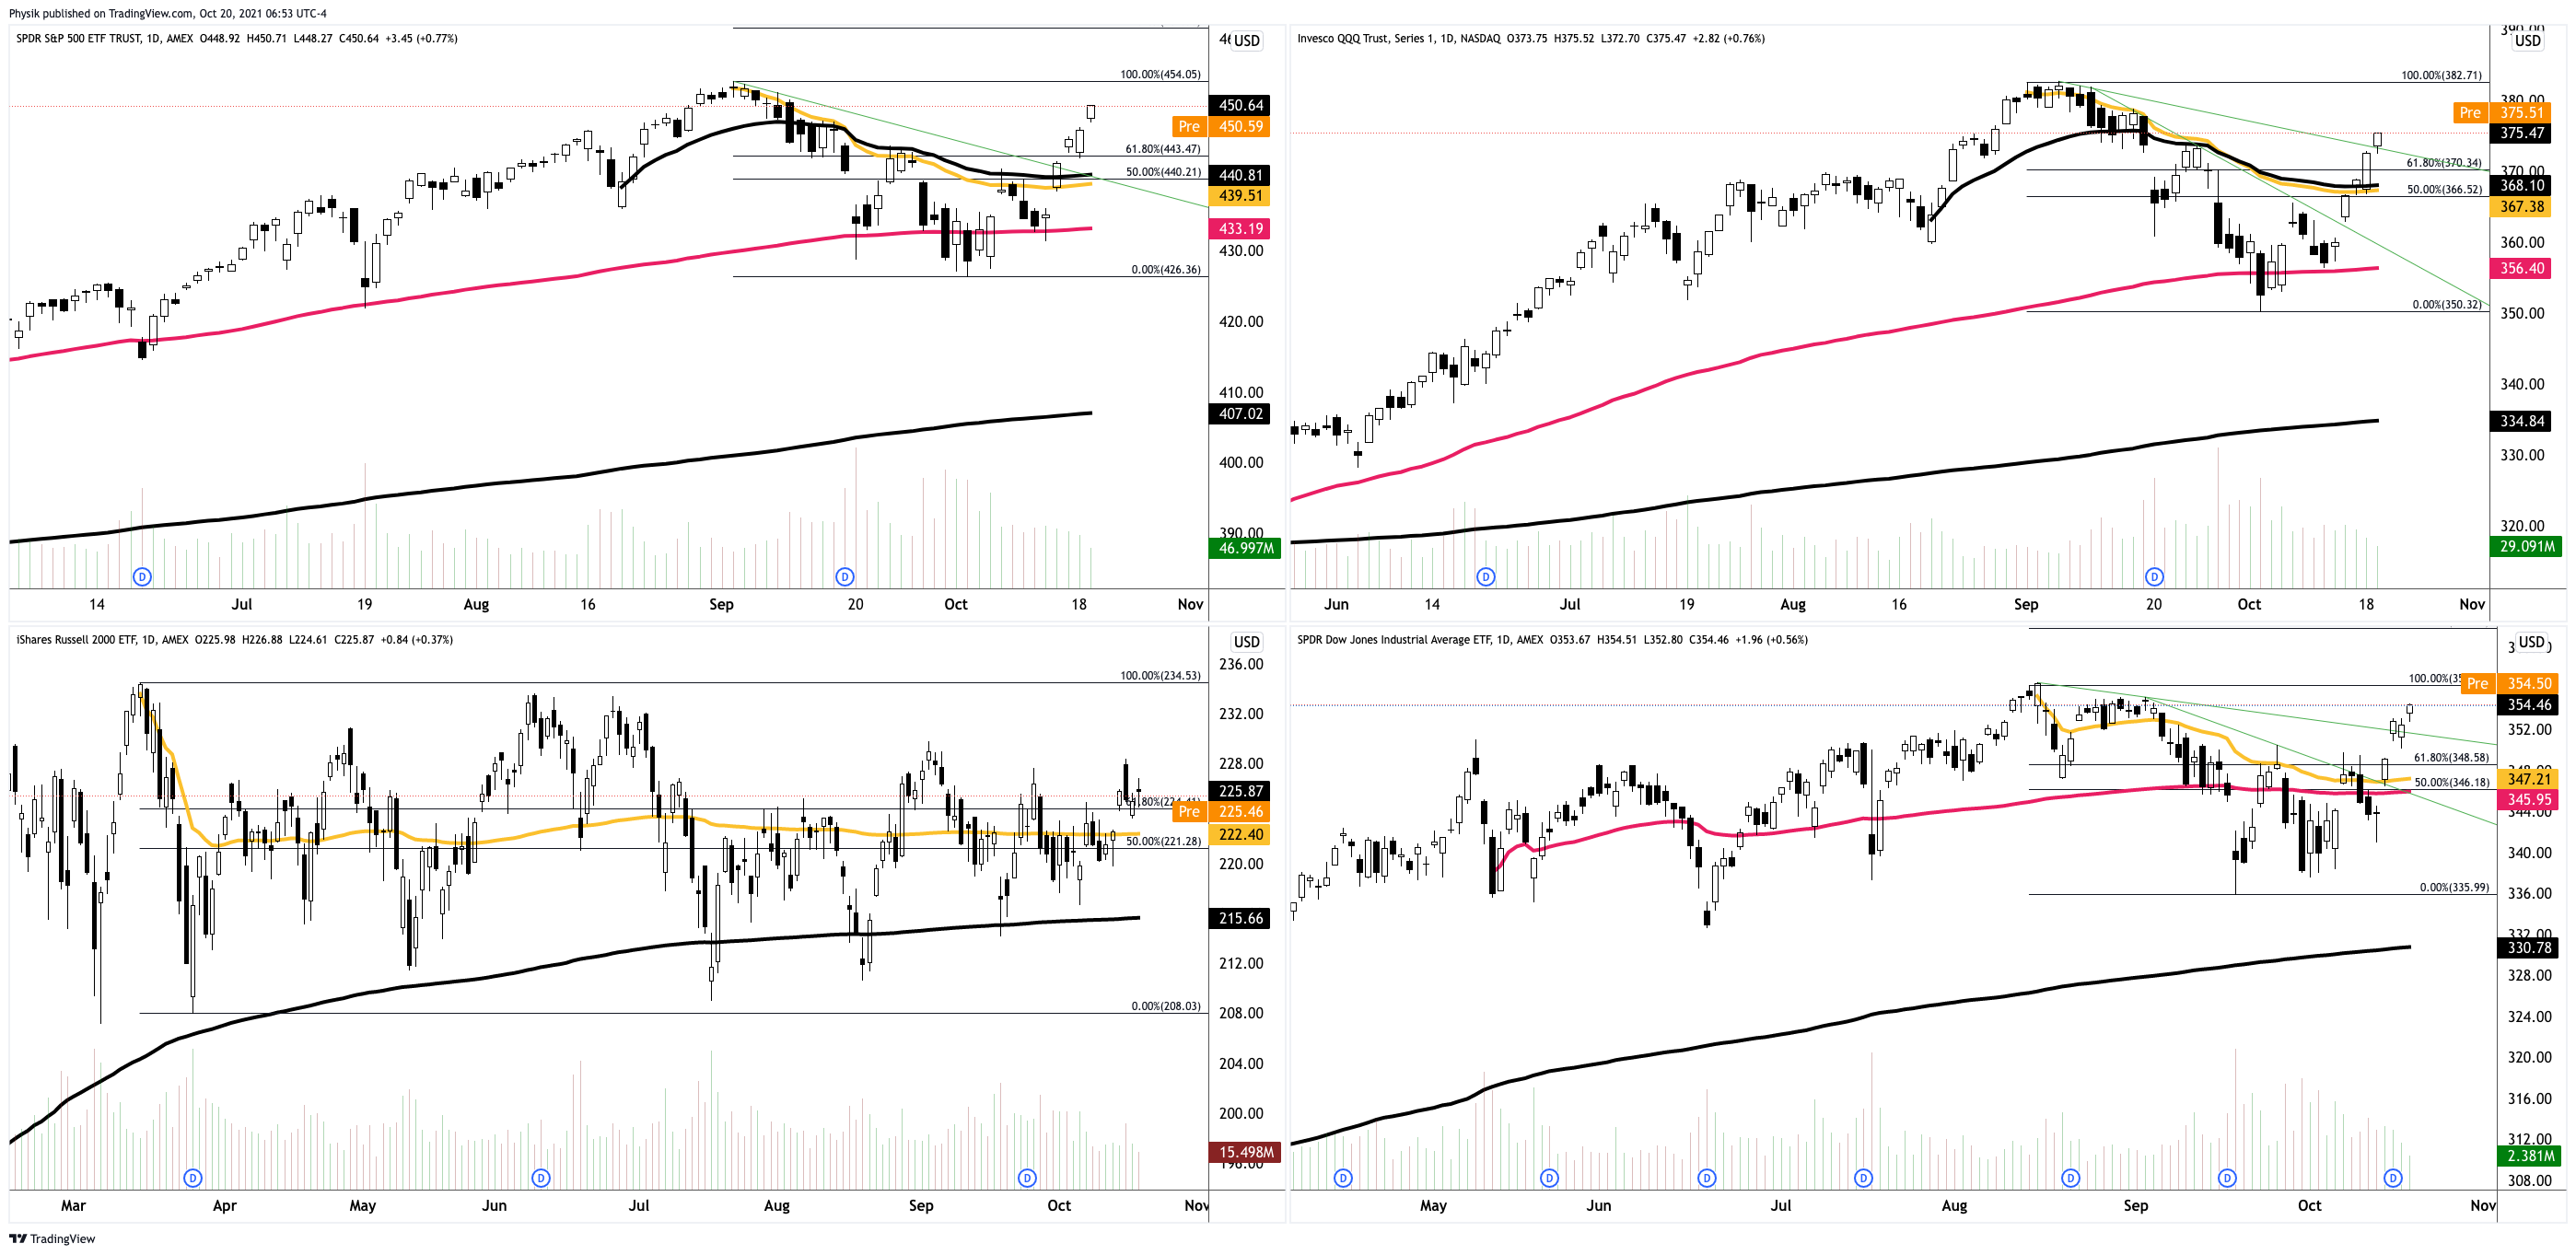
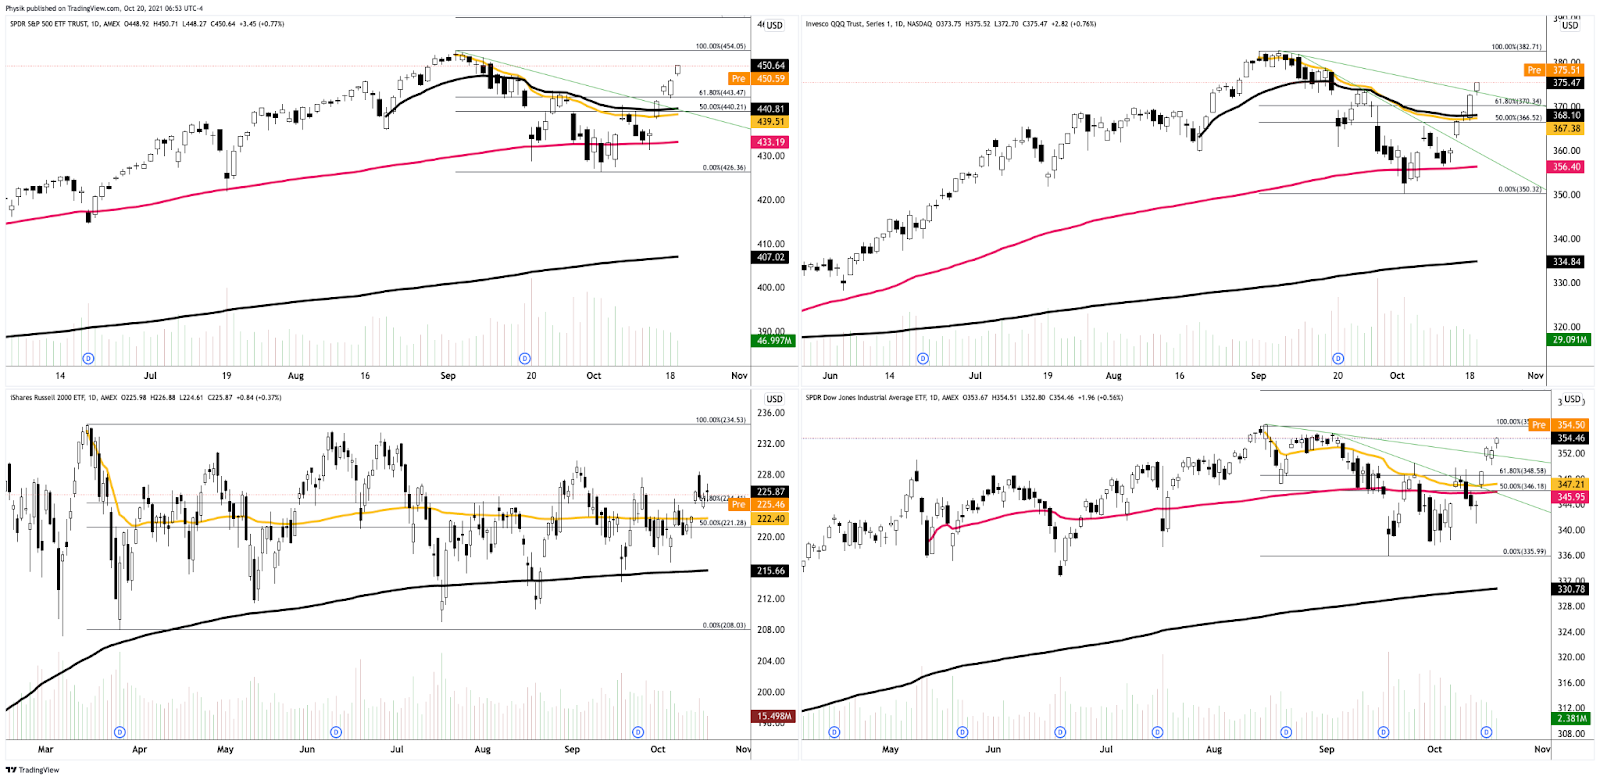
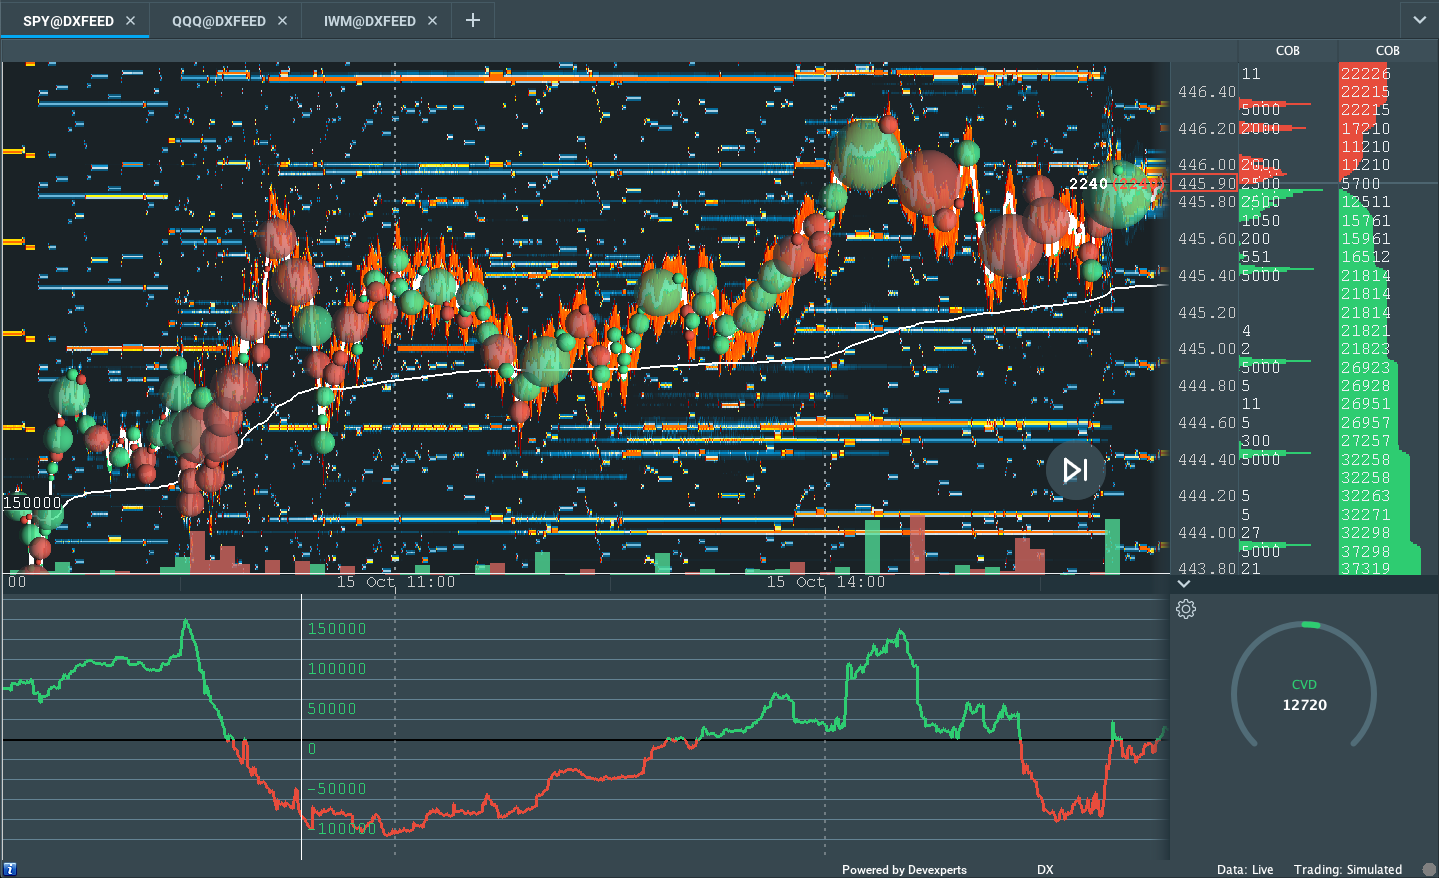
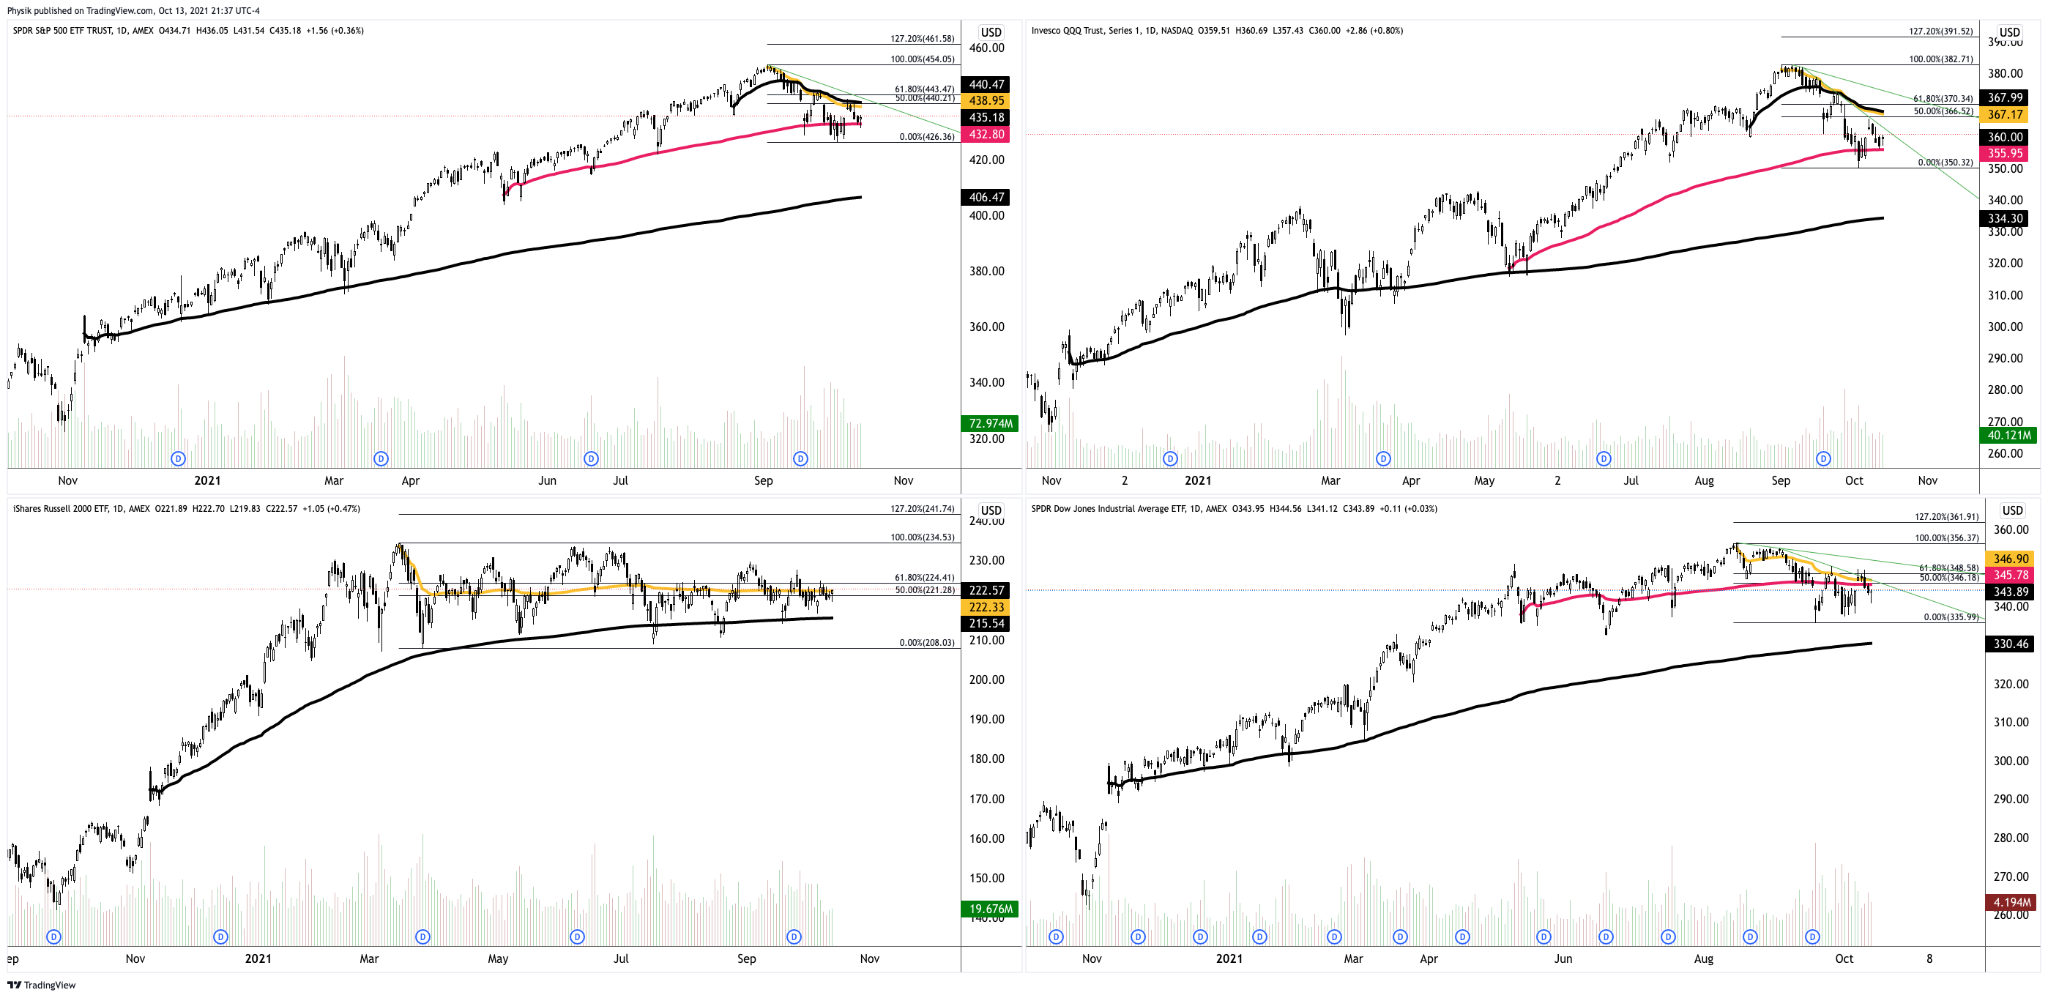
Given where the S&P 500’s price is in relation to the yellow anchored volume-weighted average price (VWAP), below, the average buyer, since the all-time high, holds a winning position; sideways-to-higher trade, above the upward sloping trendline, as well as the 50.00% and 61.8% retracements, likely puts in play a recovery of the all-time high.
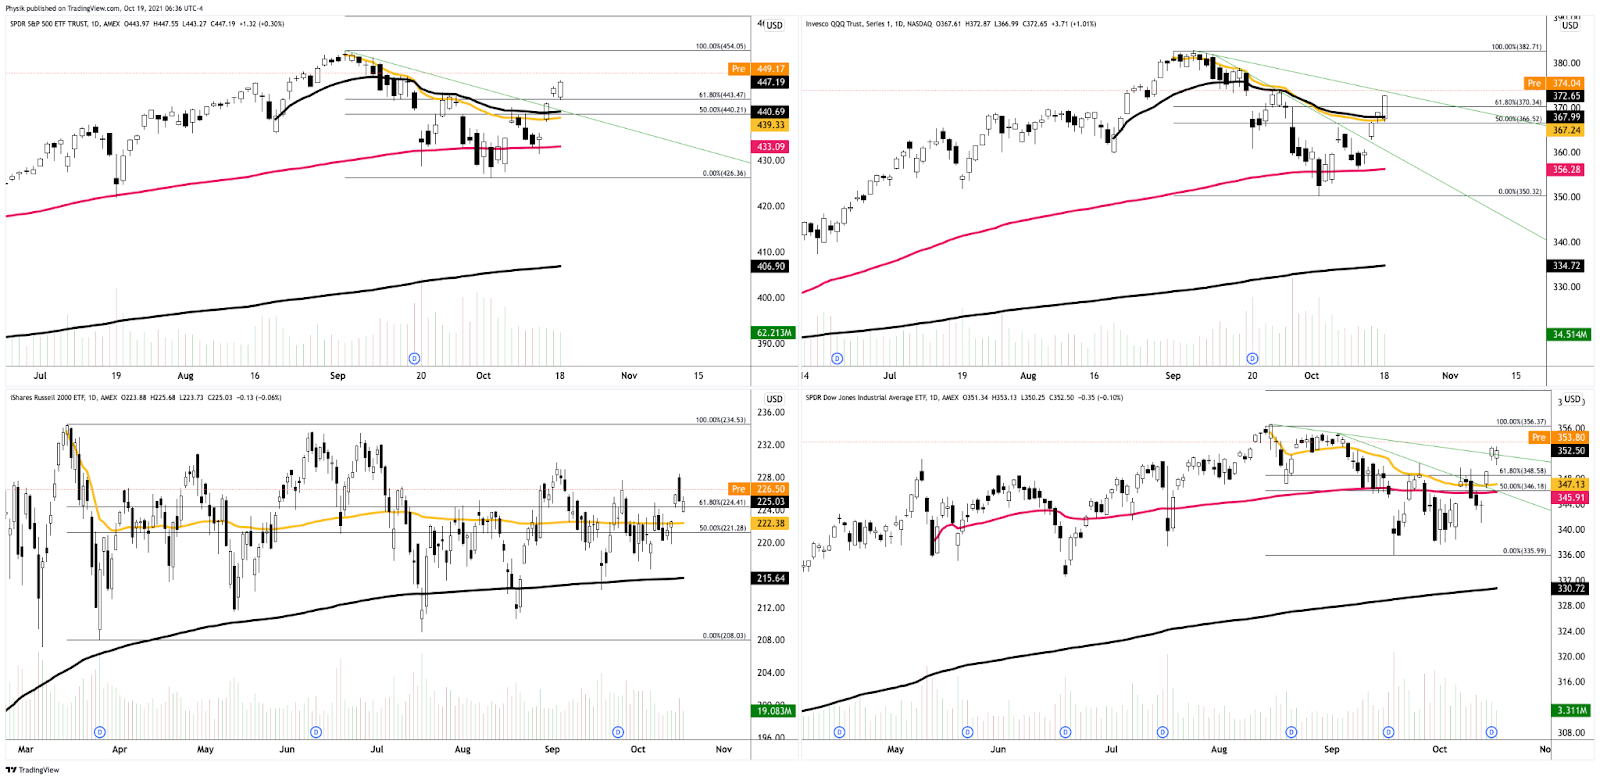
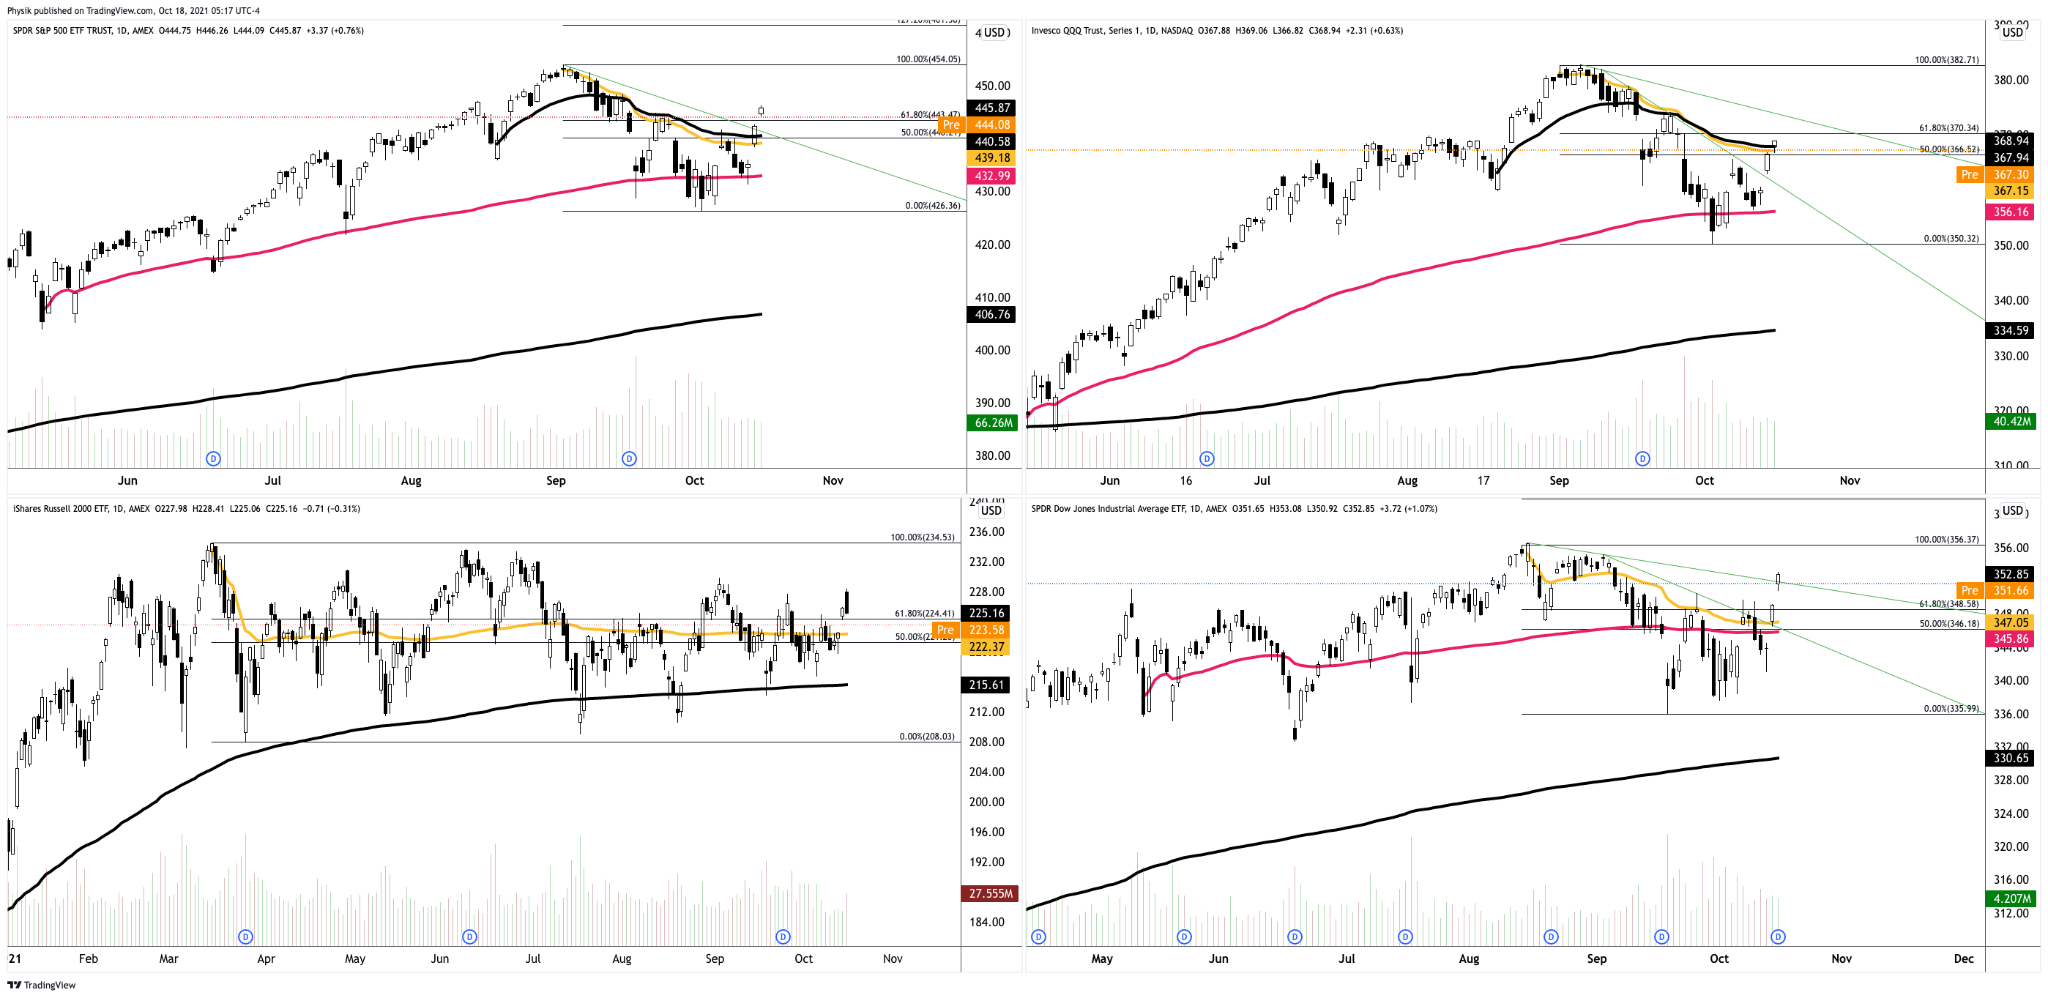
Graphic: SPDR S&P 500 ETF (NYSE: SPY) top left, Invesco QQQ Trust Series 1 (NASDAQ: QQQ) top right, iShares Russell 2000 ETF (NYSE: IWM) bottom left, SPDR Dow Jones Industrial Average ETF Trust (NYSE: DIA) bottom right.
Further, the aforementioned trade is happening in the context of improving breadth amidst a seasonally bullish cycle of contributions, rebalancing, and earnings, as well as the risks associated with a taper in asset purchases and a hike in rates.
In terms of positioning, the CBOE Volatility Index (INDEX: VIX) was lower, while the VIX futures term structure was unchanged; supply at the front end of the curve, alongside the long-gamma environment, signals a potential for near-term equity market stability.
With this decline in implied volatility (a dynamic that, at least in recent history, leads into increased call selling, more dealer hedging and liquidity, as well as further realized volatility suppression), the S&P 500 found itself marked up to the key $4,510.00 low volume area (LVNode).
The $4,510.00 figure is in the vicinity of what options modeling platform SpotGamma calls a Call Wall (i.e., the level at which positive options gamma, essentially delta sensitivity to the underlying price, is highest), which is a near term magnet (and resistance) given associated hedging and a failure to see increased interest and activity in higher options strikes.
As realized volatility falls from its peak around a year ago, more sold SPX options cluster at strikes nearer to spot. And as implied volatility falls with it, the gamma of those options increases.
More dealer long gamma means more liquidity. More liquidity means less movement. pic.twitter.com/712OAMq7iP
Moreover, we’re carrying forward yesterday’s price levels; for today, participants may make use of the following frameworks.
In the best case, the S&P 500 trades sideways or higher; activity above the $4,495.75 high volume area (HVNode) puts in play the $4,510.00 low volume area (LVNode). Initiative trade beyond the LVNode could reach as high as the $4,526.25 HVNode and $4,550.00 overnight high (ONH), or higher.
In the worst case, the S&P 500 trades lower; activity below the $4,495.75 HVNode puts in play the $4,471.00 untested point of control (VPOC). Initiative trade beyond the VPOC could reach as low as the $4,437.75 micro composite point of control (MCPOC) and $4,393.75 HVNode, or lower.
Click here to load today’s updated real-time key levels into the web-based TradingView charting platform. Please note that all levels are derived using the 65-minute timeframe.
Graphic: 65-minute profile chart of the Micro E-mini S&P 500 Futures updated 6:40 AM ET.
Definitions
Cave-Fill Process: Widened the area deemed favorable to transact at by an increased share of participants. This is a good development.
Volume Areas: A structurally sound market will build on areas of high volume (HVNodes). Should the market trend for long periods of time, it will lack sound structure, identified as low volume areas (LVNodes). LVNodes denote directional conviction and ought to offer support on any test.
If participants were to auction and find acceptance into areas of prior low volume (LVNodes), then future discovery ought to be volatile and quick as participants look to HVNodes for favorable entry or exit.
Gamma: Gamma is the sensitivity of an option to changes in the underlying price. Dealers that take the other side of options trades hedge their exposure to risk by buying and selling the underlying. When dealers are short-gamma, they hedge by buying into strength and selling into weakness. When dealers are long-gamma, they hedge by selling into strength and buying into weakness. The former exacerbates volatility. The latter calms volatility.
POCs: POCs are valuable as they denote areas where two-sided trade was most prevalent in a prior day session. Participants will respond to future tests of value as they offer favorable entry and exit.
MCPOCs: POCs are valuable as they denote areas where two-sided trade was most prevalent over numerous day sessions. Participants will respond to future tests of value as they offer favorable entry and exit.
More On Volume-Weighted Average Prices (VWAPs): A metric highly regarded by chief investment officers, among other participants, for quality of trade. Additionally, liquidity algorithms are benchmarked and programmed to buy and sell around VWAPs.
News And Analysis
A combination of lower growth, higher inflation isn’t good.
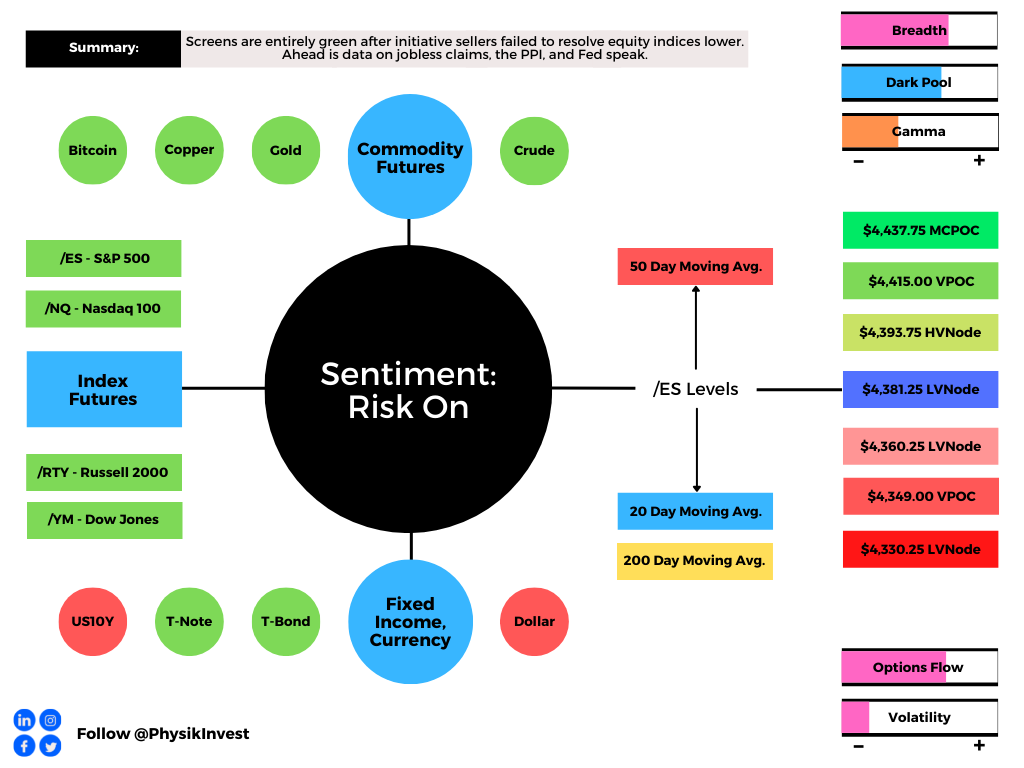
Sentiment in neutral territory, supporting high index price.
Cryptocurrency versus gold – debating on store of value.
Who could be the winners and losers of the energy crisis?
Feeling the strain of supply chain issues and high prices.
Global oil refiners cranking up output as margins recover.
Democrats are looking to break stalemate on Biden plan.
Bitcoin futures ETF starts as second-highest traded fund.
What People Are Saying
HEDGING VS. DIVERSIFICATION Comparing the cost of hedging to the “cost” of diversification
Last year, @FuturesTrader71 tweeted a thread for what he believes to be the real Holy Grail process for #trading#Futures successfully. We'll give you a hint – it's not a "setup".
Check it out on our blog and see what else the CT community has to offer: https://t.co/PAJBDePKhW
After years of self-education, strategy development, and trial-and-error, Renato Leonard Capelj began trading full-time and founded Physik Invest to detail his methods, research, and performance in the markets.
Additionally, Capelj is a finance and technology reporter. Some of his biggest works include interviews with leaders such as John Chambers, founder and CEO, JC2 Ventures, Kevin O’Leary, businessman and Shark Tank host, Catherine Wood, CEO and CIO, ARK Invest, among others.
Disclaimer
At this time, Physik Invest does not manage outside capital and is not licensed. In no way should the materials herein be construed as advice. Derivatives carry a substantial risk of loss. All content is for informational purposes only.
Out sync with bonds, equity index futures and commodities traded higher. Volatility compressed.
Monetary uncertainty. Earnings pick up.
Options positioning may support prices.
Ahead: Building permits, housing starts.
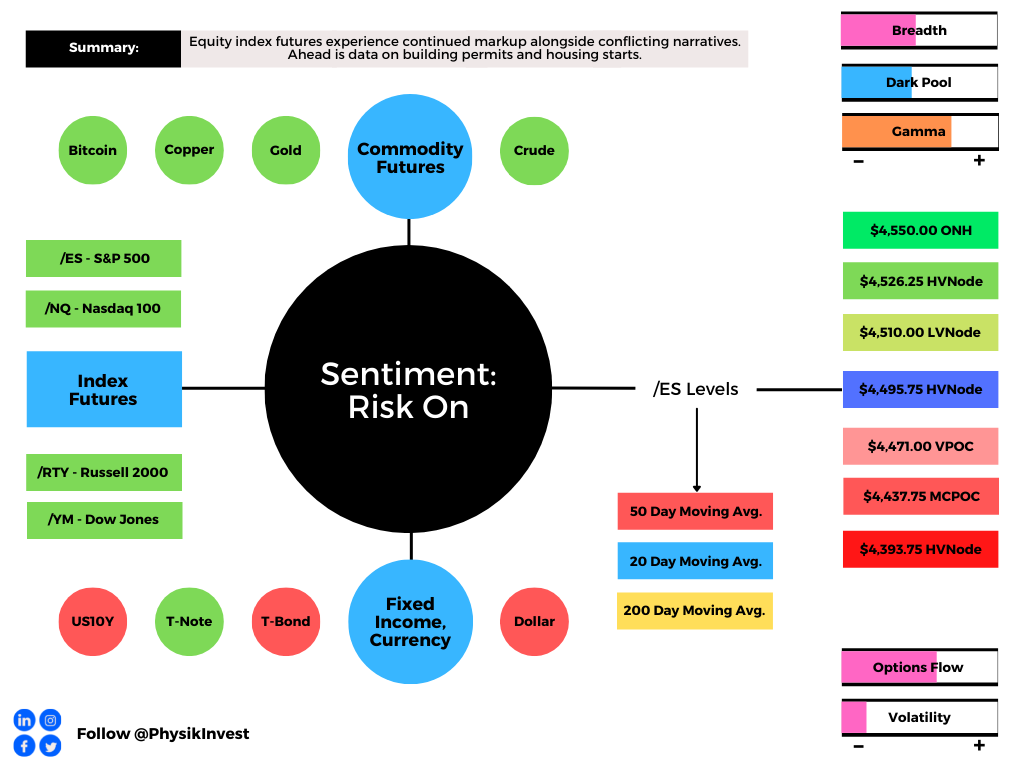
What Happened: U.S. stock index futures auctioned sideways to higher overnight as participants sought to price in robust earnings against the backdrop of monetary uncertainty and increased pricing pressures.
“The world is watching interest rates more closely than it has for some time — and rightly so, the moves have been emphatic, especially in the short-term maturities,” Chris Weston, head of research at Pepperstone Financial Pty, said. He added it’s “impressive how resilient and calm markets are in the face of the rates repricing.”
Ahead is data on building permits and housing starts (8:30 AM ET).
Graphic updated 6:30 AM ET. Sentiment Risk-On if expected /ES open is above the prior day’s range. /ES levels are derived from the profile graphic at the bottom of the following section. Levels may have changed since initially quoted; click here for the latest levels. SqueezeMetrics Dark Pool Index (DIX) and Gamma (GEX) calculations are based on where the prior day’s reading falls with respect to the MAX and MIN of all occurrences available. A higher DIX is bullish. At the same time, the lower the GEX, the more (expected) volatility. SHIFT data used for S&P 500 (INDEX: SPX) options activity. Note that options flow is sorted by the call premium spent; if more positive then more was spent on call options. Breadth reflects a reading of the prior day’s NYSE Advance/Decline indicator. VIX reflects a current reading of the CBOE Volatility Index (INDEX: VIX) from 0-100.
What To Expect: As of 6:30 AM ET, Tuesday’s regular session (9:30 AM – 4:00 PM EST) in the S&P 500 will likely open outside of prior-range and -value, suggesting a potential for immediate directional opportunity.
Gap Scenarios: Gaps ought to fill quickly. Should they not, that’s a signal of strength; do not fade. Leaving value behind on a gap-fill or failing to fill a gap (i.e., remaining outside of the prior session’s range) is a go-with indicator.

Auctioning and spending at least 1-hour of trade back in the prior range suggests a lack of conviction; in such a case, do not follow the direction of the most recent initiative activity.
Adding, during the prior day’s regular trade, on non participatory intraday breadth and supportive market liquidity metrics, the best case outcome occurred, evidenced by a response at the $4,437.75 micro composite point of control (MCPOC), which carried into initiative buying, past the $4,469.75 overnight high (ONH).
Coupled with that dynamic is the sustained presence of numerous gaps and p-shaped emotional, multiple-distribution profile structures (i.e., old-money shorts covering); as a result, participants will likely look to revisit, repair, and strengthen – build out areas of high volume (HVNodes) via the cave-fill process – these areas of low volume (LVNodes).
Graphic: Mostly supportive delta (i.e., committed buying as measured by volume delta or buying and selling power as calculated by the difference in volume traded at the bid and offer) in SPDR S&P 500 ETF Trust (NYSE: SPY), one of the largest ETFs that track the S&P 500 index, via Bookmap. The readings support this recent leg of initiative trade.
Zooming out, we see the Nasdaq 100 trading relatively strong.
Given where the S&P 500’s price is in relation to the yellow anchored volume-weighted average price (VWAP), below, the average buyer, since the all-time high, holds a winning position; sideways-to-higher trade, above the upward sloping trendline, as well as the 50.00% and 61.8% retracements, likely puts in play a recovery of the all-time high.
Graphic: SPDR S&P 500 ETF (NYSE: SPY) top left, Invesco QQQ Trust Series 1 (NASDAQ: QQQ) top right, iShares Russell 2000 ETF (NYSE: IWM) bottom left, SPDR Dow Jones Industrial Average ETF Trust (NYSE: DIA) bottom right.
Further, the aforementioned trade is happening in the context of improving breadth amidst a seasonally bullish cycle of contributions, rebalancing, and earnings, as well as the risks associated with a taper in asset purchases and a hike in rates.
In terms of positioning, the CBOE Volatility Index (INDEX: VIX) was lower, while the VIX futures term structure remained in contango; supply at the front end of the curve, alongside the long-gamma environment, signals a potential for near-term equity market stability.
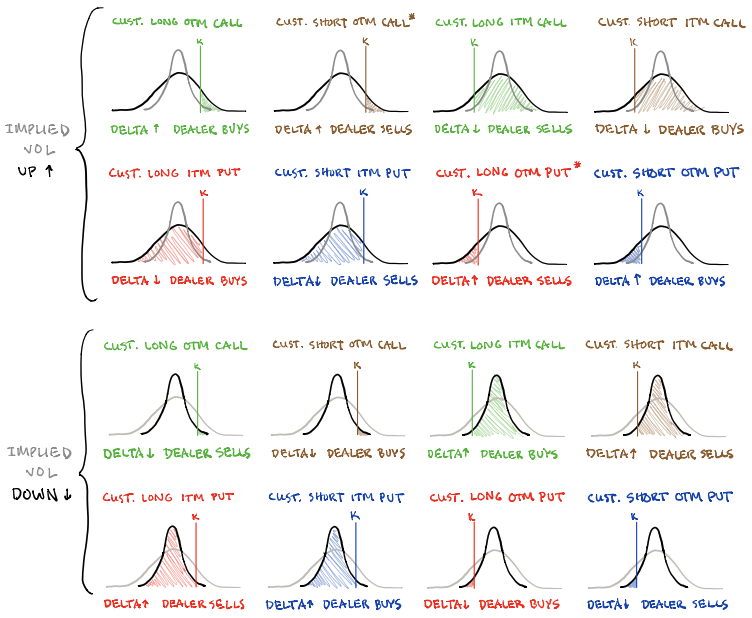
According to SpotGamma analyses, participants were likely selling puts into yesterday’s price rise; this dynamic may support sideways to higher trade.
In a barebones overview of some of the dynamics at play, here, if implied volatility were to rise, the counterparty to the aforementioned trade would purchase stock (long delta) to hedge their rising long put (short delta) exposure. If implied volatility were to decline, the counterparty would likely sell stock (short delta) as their long put (short delta) exposure declines.
Pictured: SqueezeMetrics highlights implications of volatility, direction, and moneyness.
Moreover, for today, participants may make use of the following frameworks.
In the best case, the S&P 500 trades sideways or higher; activity above the $4,495.75 high volume area (HVNode) puts in play the $4,510.00 low volume area (LVNode). Initiative trade beyond the LVNode could reach as high as the $4,526.25 HVNode and $4,550.00 overnight high (ONH), or higher.
In the worst case, the S&P 500 trades lower; activity below the $4,495.75 HVNode puts in play the $4,471.00 untested point of control (VPOC). Initiative trade beyond the VPOC could reach as low as the $4,437.75 micro composite point of control (MCPOC) and $4,393.75 HVNode, or lower.
Click here to load today’s updated real-time key levels into the web-based TradingView charting platform. Please note that all levels are derived using the 65-minute timeframe.
Graphic: 65-minute profile chart of the Micro E-mini S&P 500 Futures updated 6:20 AM ET.
Definitions
Cave-Fill Process: Widened the area deemed favorable to transact at by an increased share of participants. This is a good development.
Overnight Rally Highs (Lows): Typically, there is a low historical probability associated with overnight rally-highs (lows) ending the upside (downside) discovery process.
Volume Areas: A structurally sound market will build on areas of high volume (HVNodes). Should the market trend for long periods of time, it will lack sound structure, identified as low volume areas (LVNodes). LVNodes denote directional conviction and ought to offer support on any test.
If participants were to auction and find acceptance into areas of prior low volume (LVNodes), then future discovery ought to be volatile and quick as participants look to HVNodes for favorable entry or exit.
Short Covering: The profile shape suggests participants were “too” short and had poor location.
Gamma: Gamma is the sensitivity of an option to changes in the underlying price. Dealers that take the other side of options trades hedge their exposure to risk by buying and selling the underlying. When dealers are short-gamma, they hedge by buying into strength and selling into weakness. When dealers are long-gamma, they hedge by selling into strength and buying into weakness. The former exacerbates volatility. The latter calms volatility.
POCs: POCs are valuable as they denote areas where two-sided trade was most prevalent in a prior day session. Participants will respond to future tests of value as they offer favorable entry and exit.
MCPOCs: POCs are valuable as they denote areas where two-sided trade was most prevalent over numerous day sessions. Participants will respond to future tests of value as they offer favorable entry and exit.
Initiative Buying (Selling): Buying (selling) within or above (below) the previous day’s value area.
Responsive Buying (Selling): Buying (selling) in response to prices below (above) an area of recent price acceptance.
Volume-Weighted Average Prices (VWAPs): A metric highly regarded by chief investment officers, among other participants, for quality of trade. Additionally, liquidity algorithms are benchmarked and programmed to buy and sell around VWAPs.
News And Analysis
Nordea: Is permanent inflation now an alarming consensus?
Evergrande unit has remit funds to pay yuan bond coupon.
China’s central bank should cut RRR, one adviser suggests.
World facing fiscal problems much worse than from COVID.
Investing prosperously in light of China’s common prosperity.
Bitcoin pushes toward record before debut of ETF products.
What People Are Saying
Tomorrow, at 10:30 AM ET, @spotgamma and I unpack the SEC's conclusion that #options were not a major catalyst to the early 2021 meme stock price rise.
After years of self-education, strategy development, and trial-and-error, Renato Leonard Capelj began trading full-time and founded Physik Invest to detail his methods, research, and performance in the markets.
Additionally, Capelj is a finance and technology reporter. Some of his biggest works include interviews with leaders such as John Chambers, founder and CEO, JC2 Ventures, Kevin O’Leary, businessman and Shark Tank host, Catherine Wood, CEO and CIO, ARK Invest, among others.
Disclaimer
At this time, Physik Invest does not manage outside capital and is not licensed. In no way should the materials herein be construed as advice. Derivatives carry a substantial risk of loss. All content is for informational purposes only.
In sync with bonds, equity index futures were sideways to lower, overnight. Commodities were mixed. Volatility expanded.
More support for an EOY run-up.
Ahead is a light day for releases.
Positioned for sideways balance.
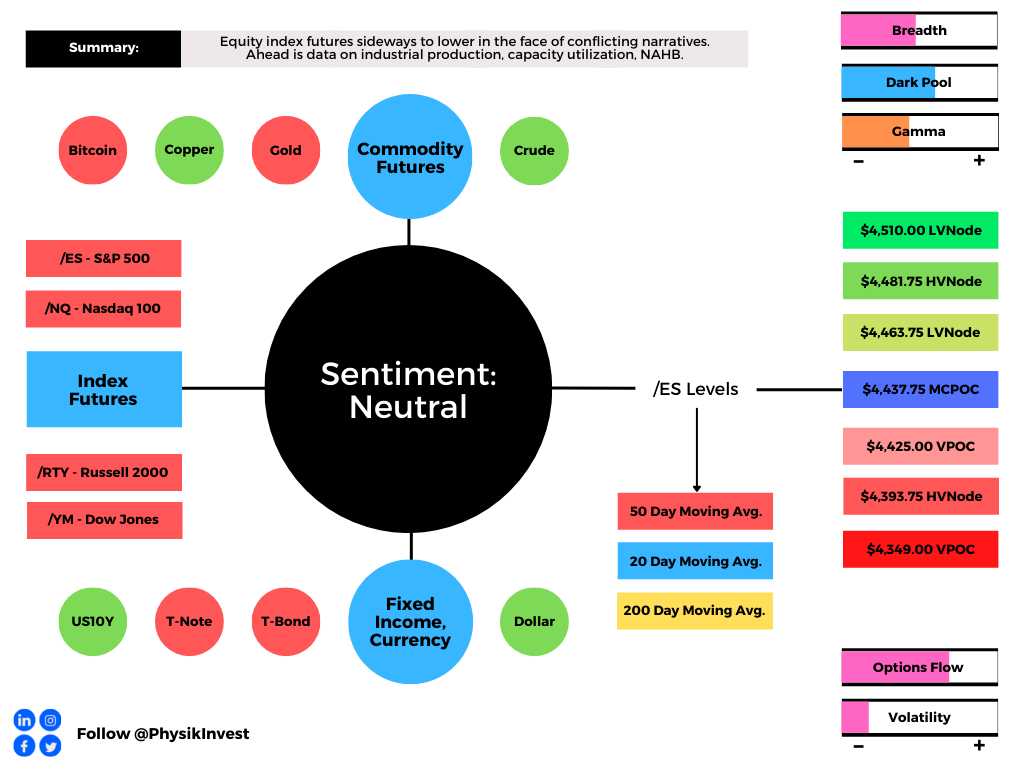
What Happened: U.S. stock index futures auctioned sideways to lower overnight alongside conflicting narratives.
Ahead is data on industrial production and capacity utilization (9:15 AM ET), as well as the National Association of Home Builders Index (10:00 AM ET).
Graphic updated 6:00 AM ET. Sentiment Neutral if expected /ES open is inside of the prior day’s range. Sentiment Risk-On if expected /ES open is above the prior day’s range. Sentiment Risk-Off if expected /ES open is below the prior day’s range. /ES levels are derived from the profile graphic at the bottom of the following section. Levels may have changed since initially quoted; click here for the latest levels. SqueezeMetrics Dark Pool Index (DIX) and Gamma (GEX) calculations are based on where the prior day’s reading falls with respect to the MAX and MIN of all occurrences available. A higher DIX is bullish. At the same time, the lower the GEX, the more (expected) volatility. SHIFT data used for S&P 500 (INDEX: SPX) options activity. Note that options flow is sorted by the call premium spent; if more positive then more was spent on call options. Breadth reflects a reading of the prior day’s NYSE Advance/Decline indicator. VIX reflects a current reading of the CBOE Volatility Index (INDEX: VIX) from 0-100.
What To Expect: As of 6:00 AM ET, Monday’s regular session (9:30 AM – 4:00 PM EST) in the S&P 500 may open inside of prior-range and -value, suggesting a limited potential for immediate directional opportunity.
Adding, during the prior day’s regular trade, on lackluster intraday breadth and market liquidity metrics, the best case outcome occurred, evidenced by an expansion of range above the $4,437.75 micro composite point of control (MCPOC), to a new overnight high (ONH) at $4,469.75.
Coupled with that dynamic is the presence of numerous gaps and p-shaped emotional, multiple-distribution profile structures (i.e., old-money shorts covering); participants will likely look to revisit, repair, and strengthen – build out areas of high volume (HVNodes) via the cave-fill process – these areas of low volume (LVNodes).
Graphic: Unsupportive delta (i.e., non-committed buying and selling as measured by volume delta or buying and selling power as calculated by the difference in volume traded at the bid and offer) in SPDR S&P 500 ETF Trust (NYSE: SPY), one of the largest ETFs that track the S&P 500 index, via Bookmap. The readings are supportive of responsive trade or balance (i.e., rotational trade that suggests current prices offer favorable entry and exit).
Zooming out, we saw the Nasdaq 100 firming, relative to its peers, last week, a significant change in tone.
Given where the S&P 500’s price is in relation to the yellow anchored volume-weighted average price (VWAP), the average buyer, since the all-time high, holds a winning position; sideways-to-higher trade, above the upward sloping trendline, as well as the 50.00% and 61.8% retracements, likely puts in play a recovery of the all-time high.
Graphic: SPDR S&P 500 ETF (NYSE: SPY) top left, Invesco QQQ Trust Series 1 (NASDAQ: QQQ) top right, iShares Russell 2000 ETF (NYSE: IWM) bottom left, SPDR Dow Jones Industrial Average ETF Trust (NYSE: DIA) bottom right.
Further, the aforementioned trade is happening in the context of improving breadth amidst a seasonally bullish cycle of contributions, rebalancing, and earnings, as well as the risks associated with a taper in asset purchases and a hike in rates.
According to a TS Lombard note featured by The Market Ear, the odds are that a tightening in monetary policy should not douse the bullish narrative:
“Tightening monetary policy cycles have historically been positive for stocks. The exceptions were in the 1970s, when inflation was counter-cyclical and the Fed tightened despite slowing growth. In ‘regular’ cycles the Fed raises rates only when the economy (and corporate earnings) warrants a tighter policy stance. What is interesting is that positive returns happen despite falling P/E multiples. Higher rates tend to lead to falling valuations, but earnings growth is typically strong enough to compensate for the derating. Since multiples are still much higher than normal, favouring Growth (faster EPS growth) over Value (slower EPS growth) is a good strategy at this stage.”
Graphic: TS Lombard’s analysis of tightening cycles, via The Market Ear.
In terms of positioning, the CBOE Volatility Index (INDEX: VIX) was higher, overnight, while the VIX futures term structure was in contango; supply at the front end of the curve, alongside the long-gamma environment, signals a potential for near-term equity market stability.
To note, according to SpotGamma models, last week’s near-vertical price rise was responsively sold as dealers looked to hedge their increasing positive directional market exposure; going forward, hedging pressures may dampen volatility, potentially setting the market up for balance (i.e., sideways trade) as participants muster the conviction to initiate the next leg.
Moreover, for today, participants may make use of the following frameworks.
In the best case, the S&P 500 trades sideways or higher; activity above the $4,437.75 MCPOC puts in play the $4,463.75 low volume area (LVNode). Initiative trade beyond the LVNode could reach as high as the $4,481.75 high volume area (HVNode) and $4,510.00 LVNode, or higher.
In the worst case, the S&P 500 trades lower; activity below the $4,437.75 MCPOC puts in play the $4,425.00 untested point of control (VPOC). Initiative trade beyond the VPOC could reach as low as the $4,393.75 HVNode and $4,349.00 VPOC, or lower.
Click here to load today’s updated real-time key levels into the web-based TradingView charting platform. Please note that all levels are derived using the 65-minute timeframe.
Graphic: 65-minute profile chart of the Micro E-mini S&P 500 Futures updated 5:15 AM ET.
Definitions
Overnight Rally Highs (Lows): Typically, there is a low historical probability associated with overnight rally-highs (lows) ending the upside (downside) discovery process.
Cave-Fill Process: Widened the area deemed favorable to transact at by an increased share of participants. This is a good development.
Volume Areas: A structurally sound market will build on areas of high volume (HVNodes). Should the market trend for long periods of time, it will lack sound structure, identified as low volume areas (LVNodes). LVNodes denote directional conviction and ought to offer support on any test.
If participants were to auction and find acceptance into areas of prior low volume (LVNodes), then future discovery ought to be volatile and quick as participants look to HVNodes for favorable entry or exit.
Gamma: Gamma is the sensitivity of an option to changes in the underlying price. Dealers that take the other side of options trades hedge their exposure to risk by buying and selling the underlying. When dealers are short-gamma, they hedge by buying into strength and selling into weakness. When dealers are long-gamma, they hedge by selling into strength and buying into weakness. The former exacerbates volatility. The latter calms volatility.
POCs: POCs are valuable as they denote areas where two-sided trade was most prevalent in a prior day session. Participants will respond to future tests of value as they offer favorable entry and exit.
MCPOCs: POCs are valuable as they denote areas where two-sided trade was most prevalent over numerous day sessions. Participants will respond to future tests of value as they offer favorable entry and exit.
Inversion Of VIX Futures Term Structure: Longer-dated VIX expiries are less expensive; is a warning of elevated near-term risks for equity market stability.
Balance (Two-Timeframe Or Bracket): Rotational trade that denotes current prices offer favorable entry and exit. Balance-areas make it easy to spot a change in the market (i.e., the transition from two-time frame trade, or balance, to one-time frame trade, or trend).
Modus operandi is responsive trade (i.e., fade the edges), rather than initiative trade (i.e., play the break).
More On Volume-Weighted Average Prices (VWAPs): A metric highly regarded by chief investment officers, among other participants, for quality of trade. Additionally, liquidity algorithms are benchmarked and programmed to buy and sell around VWAPs.
Rates: Low rates have to potential to increase the present value of future earnings making stocks, especially those that are high growth, more attractive. To note, inflation and rates move inversely to each other. Low rates stimulate demand for loans (i.e., borrowing money is more attractive). In conjunction with the rapid recovery, lower rates may solicit hawkish commentary as policymakers look to inhibit inflation.
If you're still waiting for a correction, it must be because you're looking at charts with your eyes closed. Half the nasdaq stocks fell over 20% this year. And over 20% of nasdaq stocks got cut in half. Is that what happens in a bubble? lol What bubble? https://t.co/uD8rywpDnApic.twitter.com/LDQ2fwPWNC
After years of self-education, strategy development, and trial-and-error, Renato Leonard Capelj began trading full-time and founded Physik Invest to detail his methods, research, and performance in the markets.
Additionally, Capelj is a finance and technology reporter. Some of his biggest works include interviews with leaders such as John Chambers, founder and CEO, JC2 Ventures, Kevin O’Leary, businessman and Shark Tank host, Catherine Wood, CEO and CIO, ARK Invest, among others.
Disclaimer
At this time, Physik Invest does not manage outside capital and is not licensed. In no way should the materials herein be construed as advice. Derivatives carry a substantial risk of loss. All content is for informational purposes only.
Update: This morning’s 7:55 AM ET release of the newsletter failed to include updated S&P 500 levels in the very first graphic, below. That graphic has been updated, now. Sorry!
Market Commentary
Equity index, commodity, bond futures trade sideways to higher. Volatility ebbs.
Consumer prices rose. Taper in play.
Ahead: Claims, PPI data, Fed speak.
What Happened: After news that consumer prices rose more than expected, alongside the release of Federal Open Market Committee (FOMC) minutes which revealed an intent to taper asset purchases, U.S. stock index futures auctioned higher.
Ahead is data on jobless claims and the producer price index (8:30 AM ET). After is Fed-speak by Lorie Logan (12:00 PM ET), Tom Barkin (1:00 PM ET), and Patrick Harker (6:00 PM ET).
Graphic updated 6:30 AM ET. Sentiment Risk-On if expected /ES open is above the prior day’s range. /ES levels are derived from the profile graphic at the bottom of the following section. SqueezeMetrics Dark Pool Index (DIX) and Gamma (GEX) calculations are based on where the prior day’s reading falls with respect to the MAX and MIN of all occurrences available. A higher DIX is bullish. At the same time, the lower the GEX, the more (expected) volatility. SHIFT data used for S&P 500 (INDEX: SPX) options activity. Note that options flow is sorted by the call premium spent; if more positive then more was spent on call options. Breadth reflects a reading of the prior day’s NYSE Advance/Decline indicator. VIX reflects a current reading of the CBOE Volatility Index (INDEX: VIX) from 0-100.
What To Expect: As of 6:30 AM ET, Thursday’s regular session (9:30 AM – 4:00 PM EST) in the S&P 500 will likely open outside of prior-range and -value, suggesting a potential for immediate directional opportunity.
Gap Scenarios: Gaps ought to fill quickly. Should they not, that’s a signal of strength; do not fade. Leaving value behind on a gap-fill or failing to fill a gap (i.e., remaining outside of the prior session’s range) is a go-with indicator.

Auctioning and spending at least 1-hour of trade back in the prior range suggests a lack of conviction; in such a case, do not follow the direction of the most recent initiative activity.
Adding, during the prior day’s regular trade, on positive intraday breadth and divergent market liquidity metrics, the best case outcome occurred; after numerous sessions of a minimum separation in value (i.e., the area where 70% of the day’s volume occurred) failed to support downside price discovery, participants took back Monday’s spike and weak close.
The activity now puts in play the minimal excess high just short of the $4,408.75 low volume area (LVNode), as well as the $4,415.00 untested point of control (VPOC), two areas where initiative buyers were unable to counter the fading momentum from short covering.
Looking across the spectrum, the Nasdaq 100 and Russell 2000 are firming, relative to the S&P 500 and Dow Jones Industrial Average, two indices that held the relative strength mantle, prior.
This rotation, if we will, may support sideways-to-higher trade in the coming sessions as participants clash head-on with the 50.00% and 61.80% Fibonacci retracements, levels that overlap key anchored volume-weighted average price (AVWAP)levels.
Note: VWAP is a metric highly regarded by chief investment officers, among other participants, for quality of trade. Additionally, liquidity algorithms are benchmarked and programmed to buy and sell around VWAPs. We look to buy above a flat/rising VWAP pinch. Sell below a flat/declining VWAP pinch.
Graphic: SPDR S&P 500 ETF (NYSE: SPY) top left, Invesco QQQ Trust Series 1 (NASDAQ: QQQ) top right, iShares Russell 2000 ETF (NYSE: IWM) bottom left, SPDR Dow Jones Industrial Average ETF Trust (NYSE: DIA) bottom right. Spending more than a few hours of trade above trend, VWAP (yellow), and the 61.80% Fibonacci retracement suggest good odds of upside continuation.
Further, the aforementioned trade is happening in the context of weakness into a seasonally bullish cycle of rebalancing and earnings.
Some risks include the prospects of tapering off asset purchases, next month, alongside dangerous inflation pressures, as indicated by minutes from the FOMC meeting last month.
“Markets took the hint. Two-year yields are their highest since March last year, when the pandemic first hit,” said Bloomberg’s John Authers. “Meanwhile, the 10-year yield retreated from an approach toward its post-pandemic high. The two-year reflects the now-strong likelihood that the Fed will raise rates within the next two years; the 10-year reflects concerns about growth.”
In terms of positioning, conditions may be supportive.
The current combination of DIX and GEX historically yields average 1-month returns of +2.00%.
Moreover, for today, participants may make use of the following frameworks.
In the best case, the S&P 500 trades sideways or higher; activity above the $4,381.25 LVNode puts in play the $4,393.75 high volume area (HVNode). Initiative trade beyond the HVNode could reach as high as the $4,415.00 VPOC and $4,437.75 micro composite point of control (MCPOC), or higher.
In the worst case, the S&P 500 trades lower; activity below the $4,381.25 LVNode puts in play the $4,360.25 LVNode. Initiative trade beyond the $4,360.25 LVNode could reach as low as the $4,349.00 VPOC and $4,330.25 LVNode, or lower.
Click here to load today’s updated real-time key levels into the web-based TradingView charting platform. Please note that all levels are derived using the 65-minute timeframe.
Graphic: 65-minute profile chart of the Micro E-mini S&P 500 Futures updated 6:30 AM ET.
Definitions
Spikes: Spike’s mark the beginning of a break from value. Spikes higher (lower) are validated by trade at or above (below) the spike base (i.e., the origin of the spike).
Volume Areas: A structurally sound market will build on areas of high volume (HVNodes). Should the market trend for long periods of time, it will lack sound structure, identified as low volume areas (LVNodes). LVNodes denote directional conviction and ought to offer support on any test.
If participants were to auction and find acceptance into areas of prior low volume (LVNodes), then future discovery ought to be volatile and quick as participants look to HVNodes for favorable entry or exit.
POCs: POCs are valuable as they denote areas where two-sided trade was most prevalent in a prior day session. Participants will respond to future tests of value as they offer favorable entry and exit.
MCPOCs: POCs are valuable as they denote areas where two-sided trade was most prevalent over numerous day sessions. Participants will respond to future tests of value as they offer favorable entry and exit.
Excess: A proper end to price discovery; the market travels too far while advertising prices. Responsive, other-timeframe (OTF) participants aggressively enter the market, leaving tails or gaps which denote unfair prices.
Value-Area Placement: Perception of value unchanged if value overlapping (i.e., inside day). Perception of value has changed if value not overlapping (i.e., outside day). Delay trade in the former case.
News And Analysis
Consumer prices rise more than expected as energy costs surge.
Global minimum tax pact ups the chance of multinational tax hike.
Global gas crisis is spilling over into the oil markets, IEA explains.
China’s power cuts stressing economic growth and supply chains.
Federal Reserve officials seeing mid-November, December taper.
What People Are Saying
This is really such a big factor that nobody else talks about. When I explain to investors there are only 4 real liquidity providers in the space, they think I’m a madman.
Having spent two decades in the coatings industry, I can tell you that zinc price inflation is a serious issue. Many coatings used for the protection of steel contain up to 90% zinc (!). The price volatility is enormous but end consumers will feel the pain in 2022-2023 onward. pic.twitter.com/XS5g3LpTaP
After years of self-education, strategy development, and trial-and-error, Renato Leonard Capelj began trading full-time and founded Physik Invest to detail his methods, research, and performance in the markets.
Additionally, Capelj is a finance and technology reporter. Some of his biggest works include interviews with leaders such as John Chambers, founder and CEO, JC2 Ventures, Kevin O’Leary, businessman and Shark Tank host, Catherine Wood, CEO and CIO, ARK Invest, among others.
Disclaimer
At this time, Physik Invest does not manage outside capital and is not licensed. In no way should the materials herein be construed as advice. Derivatives carry a substantial risk of loss. All content is for informational purposes only.