Bloomberg reports that if the US defaults on its debt, which could happen as soon as June 1 if President Biden and House Speaker McCarthy fail to reach a deal on raising the ceiling, homebuyer borrowing costs may surge to 8.40%. As a consequence, the typical home’s monthly payment would increase by 22.00% and cool property sales; the monthly payment on a $500,000.00 mortgage may rise to $3,800.00, compared to about $3,095.00 at the current rate of 6.30%.
In prior letters, we concluded that past monetary action made stocks less sensitive to interest rates, quoting JPMorgan Chase & Co (NYSE: JPM) strategists that the market would likely continue to “artificially suppress perceptions of fundamental macro risks,” barring surprises like a debt limit breach.
With a debt limit breach a potential reality, Moody’s Corporation (NYSE: MCO) says a breach may compound recessionary pressures; expect a drop in equities, a volatility spike, and a disruption of funding markets.
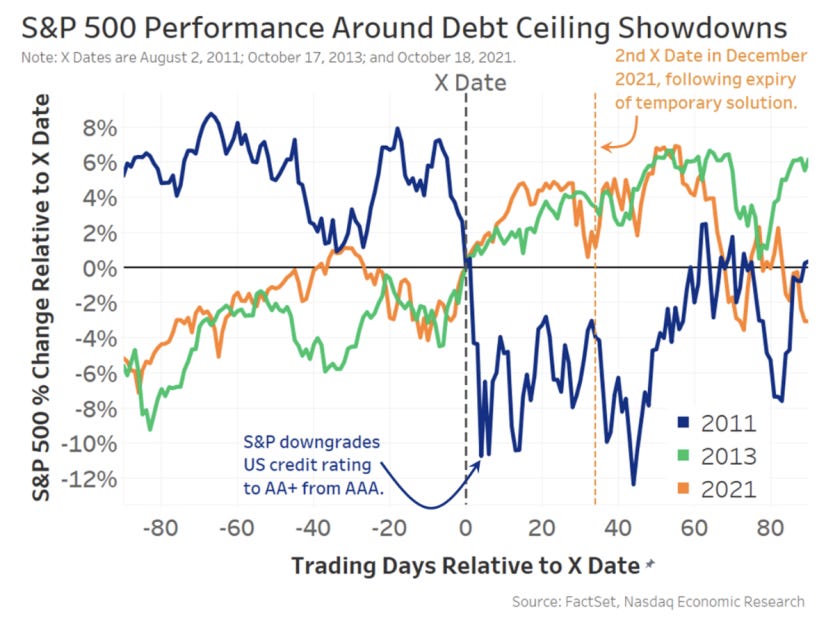
Graphic: Retrieved from Nasdaq Inc (NASDAQ: NDAQ).
“Data show that short-term bonds have the most predictable reaction – with interest rates and default insurance costs rising significantly – before quickly returning to normal after the uncertainty has passed,” Nasdaq’s Phil Mackintosh writes. “In reality, a crisis was averted in all [prior] cases, with the government able to increase or suspend the debt limit before the X Date.”
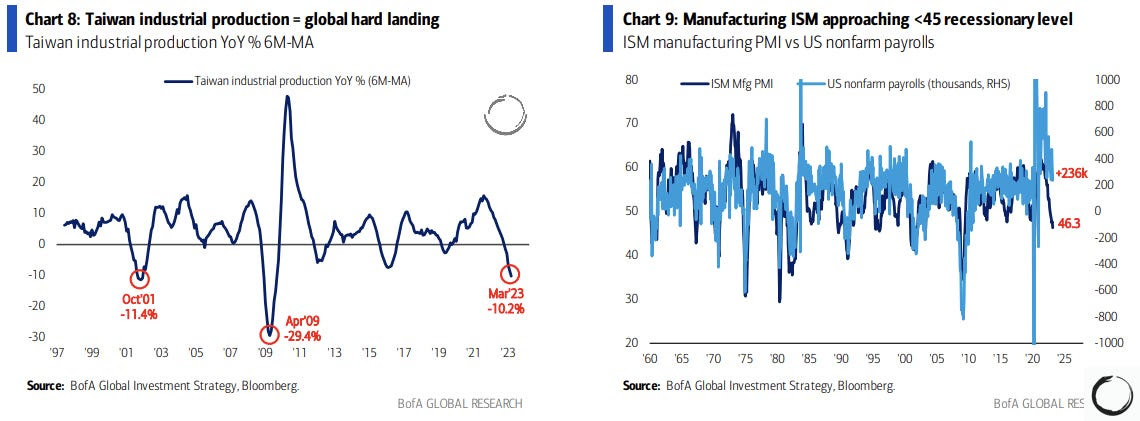
Notwithstanding the short-term uncertainty regarding the debt limit, Bank of America Corporation (NYSE: BAC) is adamant there will be a recession that manifests cracks in “credit and tech,” similar to the situation in 2008. BAC sees the bubble in technology, media, and telecommunication stocks soon deflating as they face higher-for-longer interest rates and a tempered earnings outlook.
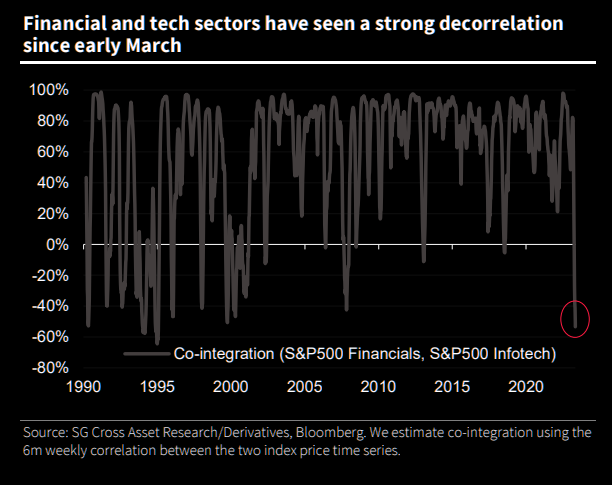
Graphic: Retrieved from Societe Generale SA (OTC: SCGLY) via The Market Ear.While investors poured $3.8 billion into technology stocks in the week through May 10, $2.1 billion was pulled from financial equities, the most significant redemption since May 2022.
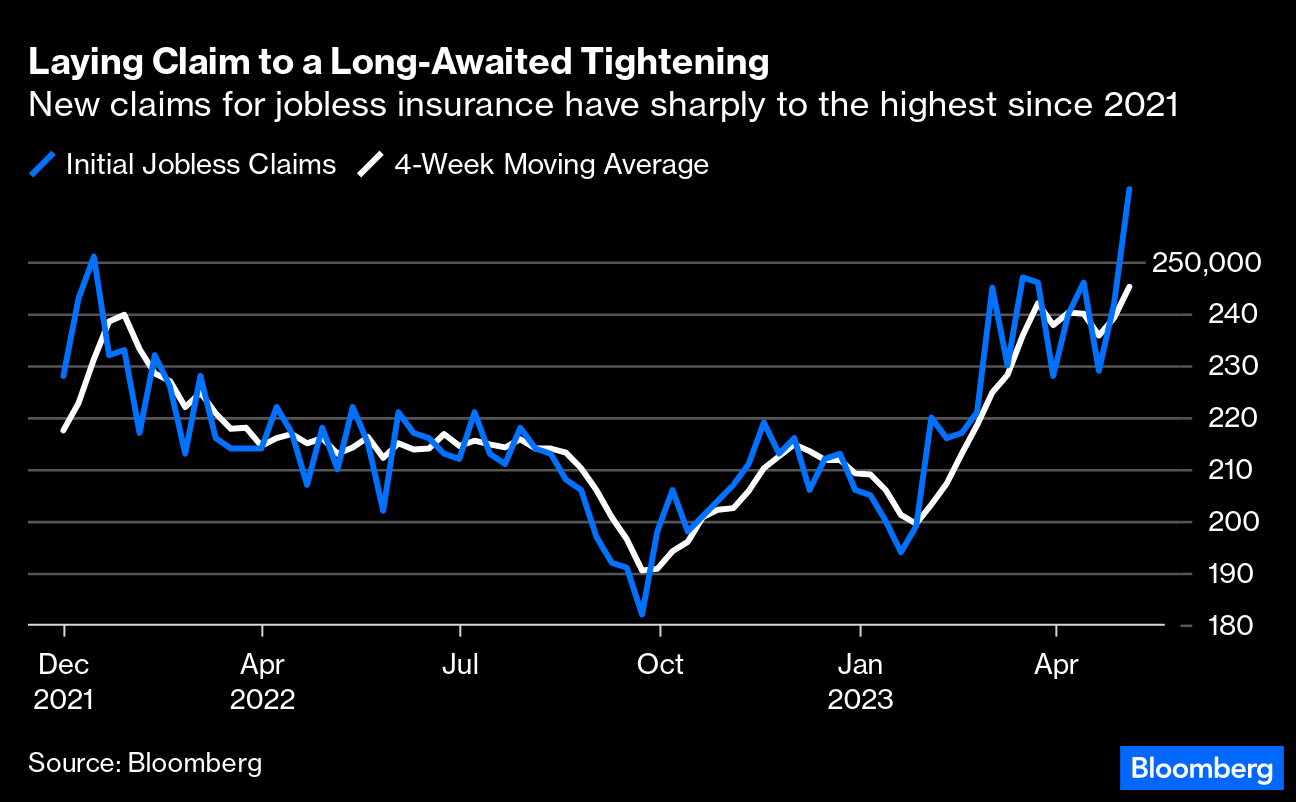
Compounding the recessionary pressures BAC sees, EPB Research adds, are banks’ funding costs, which have increased too much relative to prevailing asset yields. If the spread drops too low, bank lending tightens, and a recession occurs. Also, other data suggests tightening is finally starting to have an impact. Bloomberg reports that initial claims for unemployment insurance are on the rise. There has been a drop in overall wage growth to 5.1% last month, too, the biggest fall in the rate of increase since the series began.
Separately, breadth divergences are becoming more frequent, with the Daily Advance-Decline (A-D) Line for the NYSE showing lower highs while DJIA and S&P 500 show slightly higher highs, McClellan Financial Publications writes. The bond CEF A-D Line is also showing a bearish divergence, indicating a shift in liquidity that could weigh on other stocks, including the big-cap stocks holding up the SP500 and the Nasdaq 100.
Graphic: Retrieved from McClellan Financial Publications.
McClellan adds that the A-D Line originated from data collected by Leonard Ayres and James Hughes in the 1920s. It was made famous in 1962.
Graphic: Retrieved from McClellan Financial Publications.
That’s when Joe Granville and Richard Russell commented on it in their newsletters, noting how it had shown a big bearish divergence ahead of the 1962 bear market.
Graphic: Retrieved from McClellan Financial Publications.
To end, the economic calendar next week is focused on manufacturing and housing. The housing market is showing some downside risk for existing-home sales for April due to a weak reading on pending sales, MCO says, adding that housing permits and starts are expected to move sideways as builders remain cautious amid high-interest rates and economic uncertainty. Regional Fed surveys in New York and Philadelphia will provide the first read on factory activity for May, with little hope for a significant rebound in manufacturing. Jobless claims will be critical, as continuing the recent trend would likely signal a rapid deceleration in monthly job gains. Other critical data to be released include retail sales, industrial production, and business inventories.
Should readers wish to hedge the debt ceiling debacle, June call options on the Cboe Volatility Index appear attractive, some suggest. But, with RVOL as low as it is, owning optionality is not generally warranted. The risk is lower lows in volatility.
Welcome to the Daily Brief by Physik Invest, a soon-to-launch research, consulting, trading, and asset management solutions provider. Learn about our origin story here, and consider subscribing for daily updates on the critical contexts that could lend to future market movement.
Separately, please don’t use this free letter as advice; all content is for informational purposes, and derivatives carry a substantial risk of loss. At this time, Capelj and Physik Invest, non-professional advisors, will never solicit others for capital or collect fees and disbursements. Separately, you may view this letter’s content calendar at this link.
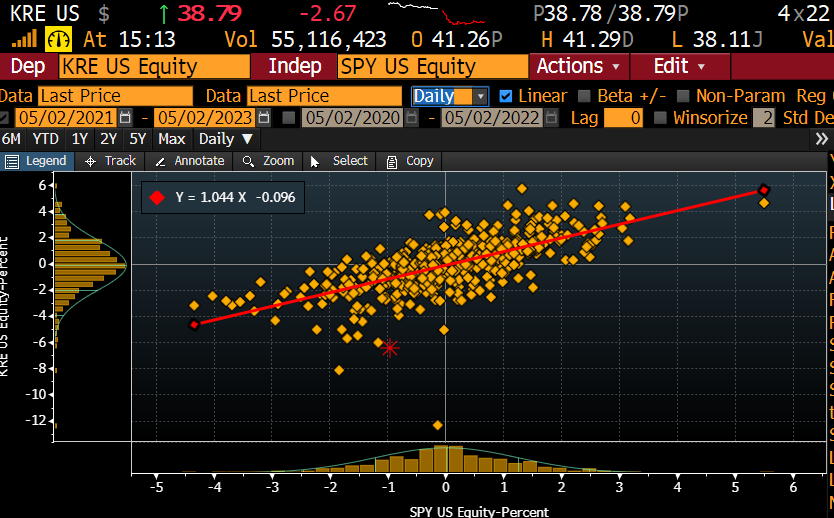
The S&P 500 (INDEX: SPX) recovered after a violent sell-off led by products like the SPDR S&P Regional Banking ETF (NYSE: KRE). This is before updates on the Federal Reserve’s (Fed) monetary policy today.
Graphic: Retrieved from Danny Kirsch of Piper Sandler Companies (NYSE: PIPR).
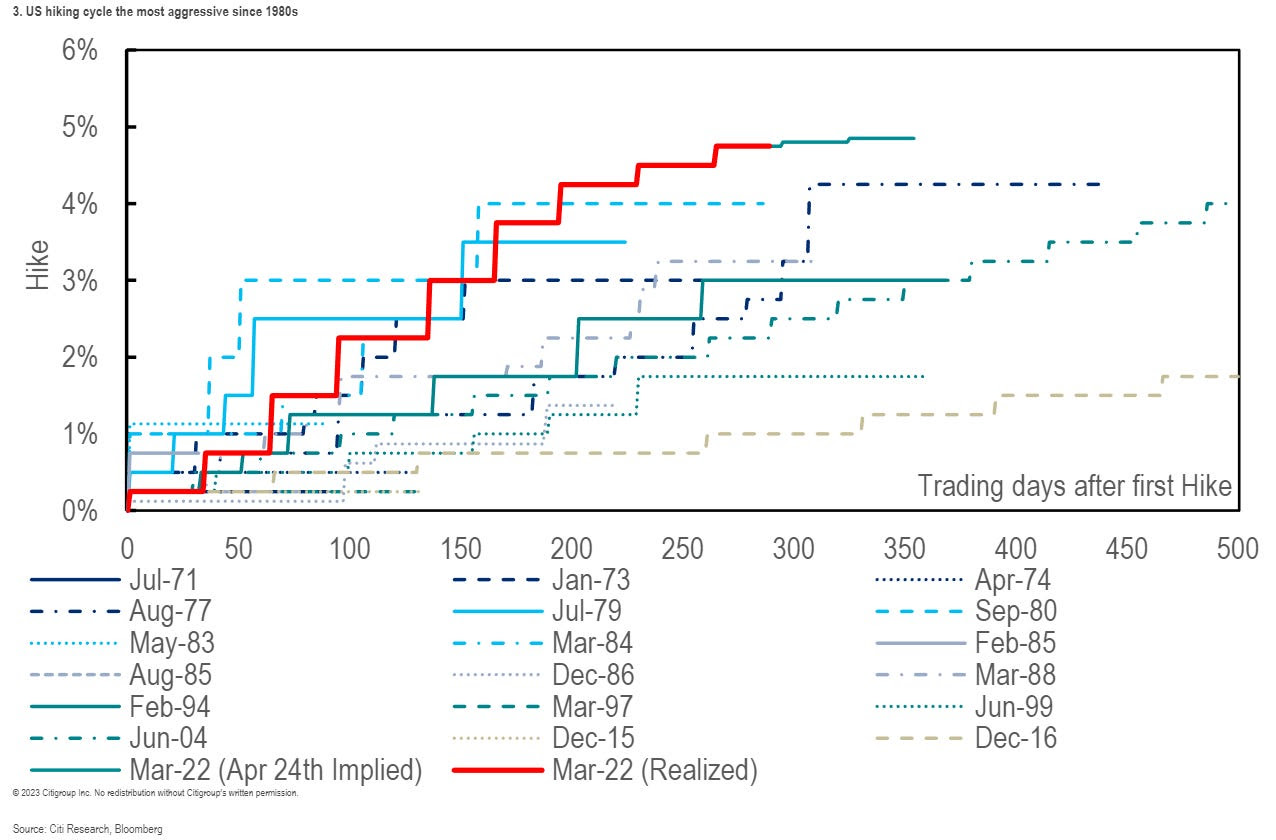
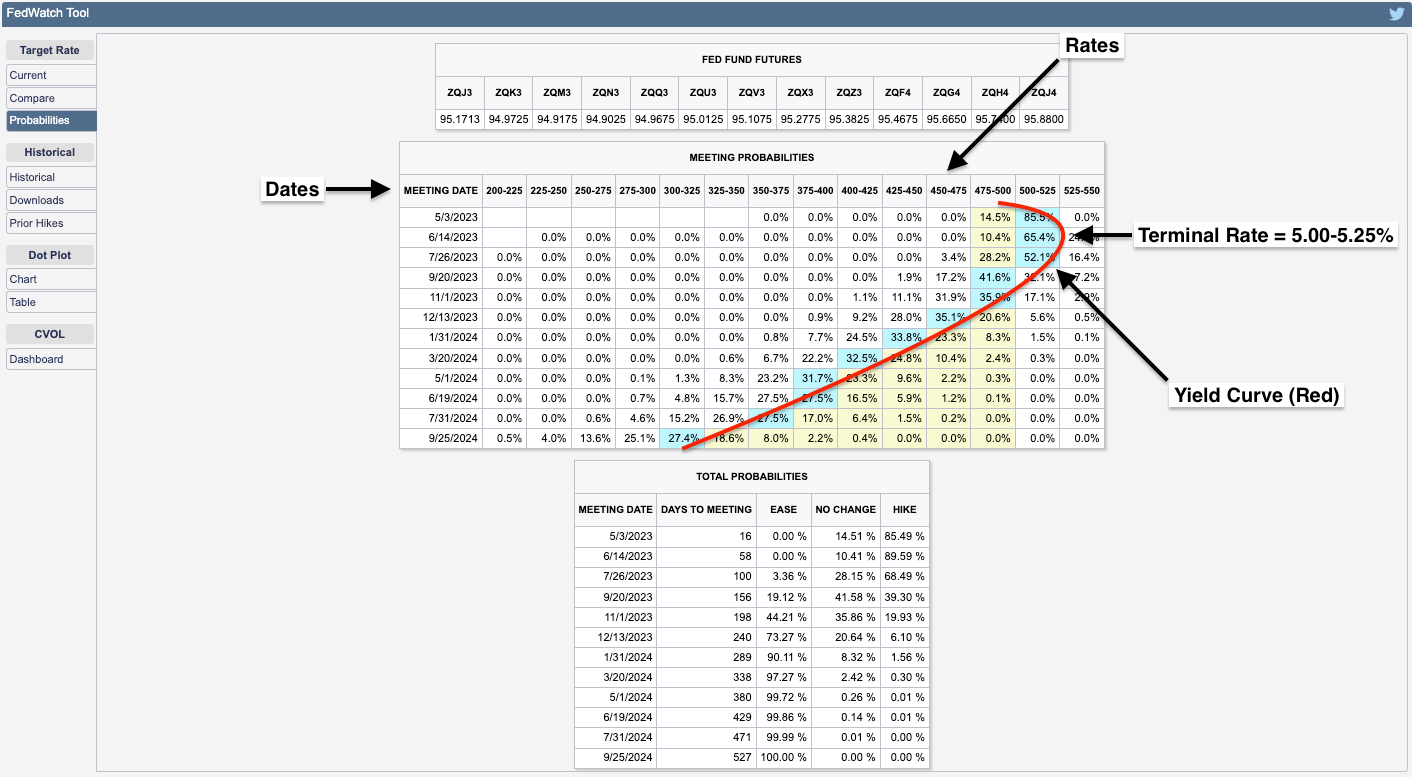
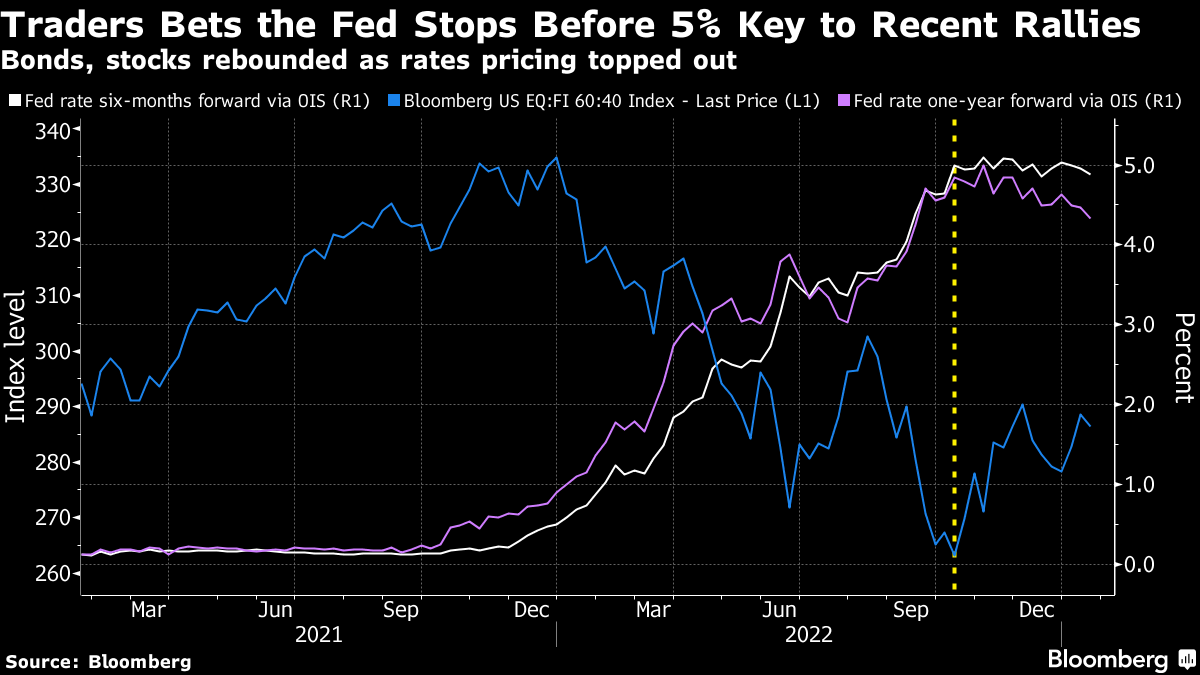
The consensus is the Fed ratchets up the target rate to 5.00-5.25%. Following this, it is likely to keep rates at this higher level for longer than markets expect, letting the effects of the tightening work through the economy and tame the still-sticky inflation (e.g., lenders eating the cost of interest to sell more goods, job vacancies dropping, and payrolls surprising higher).
Graphic: Retrieved from Citigroup Inc (NYSE: C) via Bloomberg. “The Fed’s own projections from March suggest rates will be only just above 5% by year’s end — implying a protracted pause with no cuts, after the most aggressive hiking campaign in decades. It’s marked in red in the chart [above].”
Strategists at JPMorgan Chase & Co (NYSE: JPM) think a “hike and pause” scenario prompts a push higher in stocks.
“Here, the Fed would be relying on a tightening of lending standards stemming from the banking crisis to act as de facto rate hikes. Any language that the market interprets as the Fed being on pause should benefit stocks,” JPM wrote. “This outcome is not fully priced into equities.”
This idea was alluded to in yesterday’s letter; stocks likely do “ok” in a higher rates for longer environment. Beyond economic surprises and the debt ceiling issue, the Fed’s balance sheet (not likely to be addressed in this next announcement) strategists like Andy Constan of Damped Spring Advisors are most concerned about, since the size of quantitative easing or QE made stocks less sensitive to interest rates. Ratcheting quantitative tightening or QT, the flow of capital out of markets, would prompt some increased bearishness among those strategists.
Graphic: Retrieved from Bank of America Corporation (NYSE: BAC) via Macro Ops.
JPM strategists add the market may continue “artificially suppress[ing] perceptions of fundamental macro risks,” prompting upside momentum.
“We expect these inflows to persist over the next two weeks, with several more large returns expected to drop from the trailing sample window,” Tier1Alpha explains. “Even if market volatility increases during this time, it would take exceptionally significant moves to trigger substantial selling. While these inflows are advantageous during market upswings, it’s essential to remember that they can be particularly brutal on the way back down once volatility inevitably returns.”
Eventually, “as recessionary conditions proliferate,” EPB’s Eric Basmajian says, asset prices will turn. Downside accelerants include the debt limit breach, which Nasdaq Inc (NASDAQ: NDAQ) and Moody’s Corporation (NYCE: MCO) think portends recession and volatility spike.
Trade ideas and more in our recently published report.
Welcome to the Daily Brief by Physik Invest, a soon-to-launch research, consulting, trading, and asset management solutions provider. Learn about our origin story here, and consider subscribing for daily updates on the critical contexts that could lend to future market movement.
Separately, please don’t use this free letter as advice; all content is for informational purposes, and derivatives carry a substantial risk of loss. At this time, Capelj and Physik Invest, non-professional advisors, will never solicit others for capital or collect fees and disbursements. Separately, you may view this letter’s content calendar at this link.
Inflation and employment rates remain high. Additionally, consumers show resilience, and earnings are strong. As a consequence, markets are back to pricing higher rates for longer. This is a pressure on bonds and stocks which appear “overvalued relative to coming bad news on both economic growth and corporate earnings.”
Graphic: Retrieved from Bloomberg via @Marcomadness2. Hedge funds are net short 2Y and SOFR futures.
Morgan Stanley (NYSE: MS) says stocks are at risk of a pullback, accordingly.
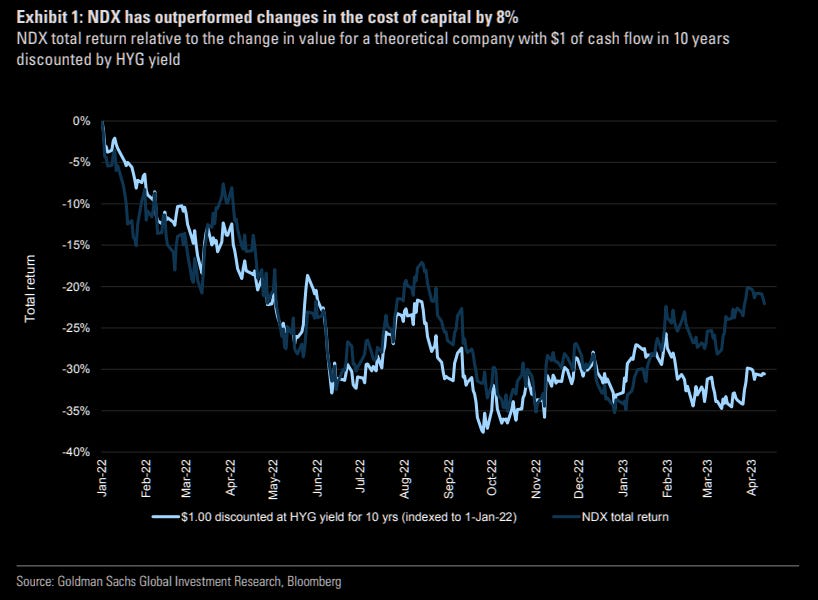
Graphic: Retrieved from Goldman Sachs Group Inc (NYSE: GS) via The Market Ear. The indexes have front-run the pause and pivot; Goldman Sachs Group Inc (NYSE: GS) data suggests a statistically significant disconnect between the Nasdaq 100 (INDEX: NDX) and yield.
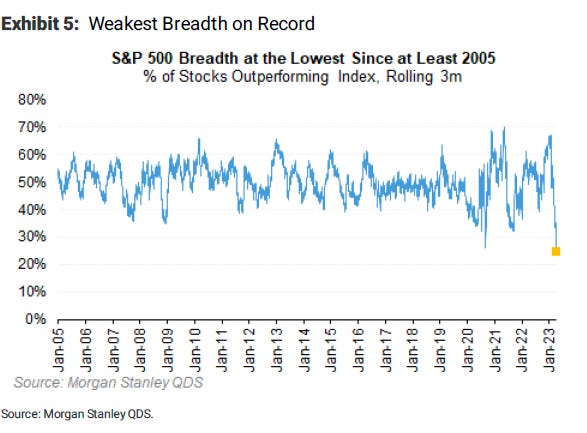
With the percentage of stocks outperforming the S&P 500 the lowest on record, MS added, a slump in technology is the big risk if yields continue to rise; the bear market is not yet over. “If there is one thing that can throw cold water on the large mega-cap rally, it’s higher yields due to a Fed that can’t stop hiking.”
Graphic: Retrieved from Morgan Stanley (NYSE: MS) via Bloomberg.
Moody’s Corporation (NYSE: MCO) expects a “0.25-percentage point increase to the fed funds rate when the FOMC reconvenes in early May.” Following this hike, there is likely to be a pause at a 5.00-5.25% terminal rate for a few months.
Graphic: Retrieved from CME Group Inc’s (NASDAQ: CME) FedWatch Tool.
From a positioning perspective, Kai Volatility’s Cem Karsan stated that in the past 6-9 months, there has been a significant increase in the volume of options with zero days to expiration (0 DTE), which now accounts for 44% of the total volume. This increase in short-dated options volume has been accompanied by a similarly sized decrease in longer-dated options volume.
Further, the majority of trading activity in these short-dated options is split between hedging and directional trading, as well as yield harvesting via out-of-the-money (OTM) options sales. Though the short-dated activity may prompt cascading events in market downturns, the main issue is the reduced use of longer-dated options; a supply and demand imbalance likely resolves itself with an implied volatility repricing of great size where longer-dated options outperform those that are shorter-dated.
Traders can look to position for a potential IVOL repricing, particularly in the back half of the year when dealer positioning is less clear, buybacks are to fall off of a cliff, and the boost from short-covering has played its course.
Traders can continue to play near-term strength via call spread structures and use those profits to reduce the costs of owning longer-dated bets on markets or rates falling and IVOL increasing. If not interested in directional exposure, traders may allocate funds to T-bills and SPX box spreads which allow traders to create a loan structure similar to a T-bill. If savvy, one could find some structures yielding ~5.5%. Traders can also consider blending T-bills and boxes with directional exposure. This way, they can cut portfolio volatility but still have a bit of leverage potential. Please check out our past letters for trade structure specifics. Have a great day!
About
Welcome to the Daily Brief by Physik Invest, a soon-to-launch research, consulting, trading, and asset management solutions provider. Learn about our origin story here, and consider subscribing for daily updates on the critical contexts that could lend to future market movement.
Separately, please don’t use this free letter as advice; all content is for informational purposes, and derivatives carry a substantial risk of loss. At this time, Capelj and Physik Invest, non-professional advisors, will never solicit others for capital or collect fees and disbursements. Separately, you may view this letter’s content calendar at this link.
Physik Invest’s Daily Brief is read free by thousands of subscribers. Join this community to learn about the fundamental and technical drivers of markets.
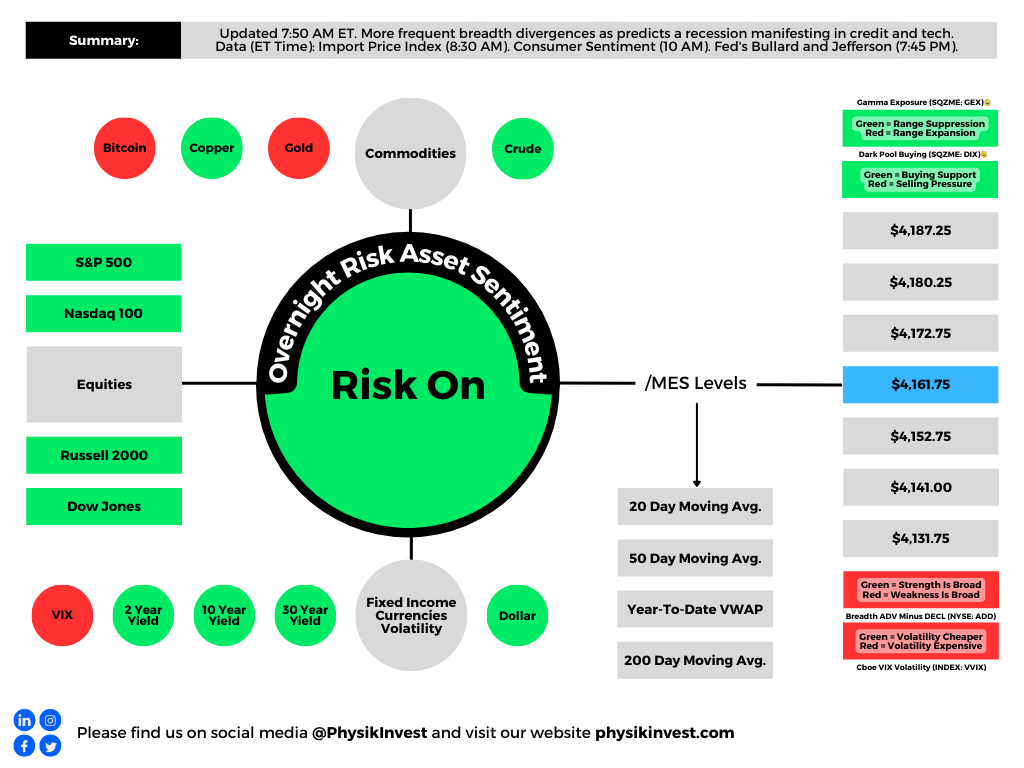
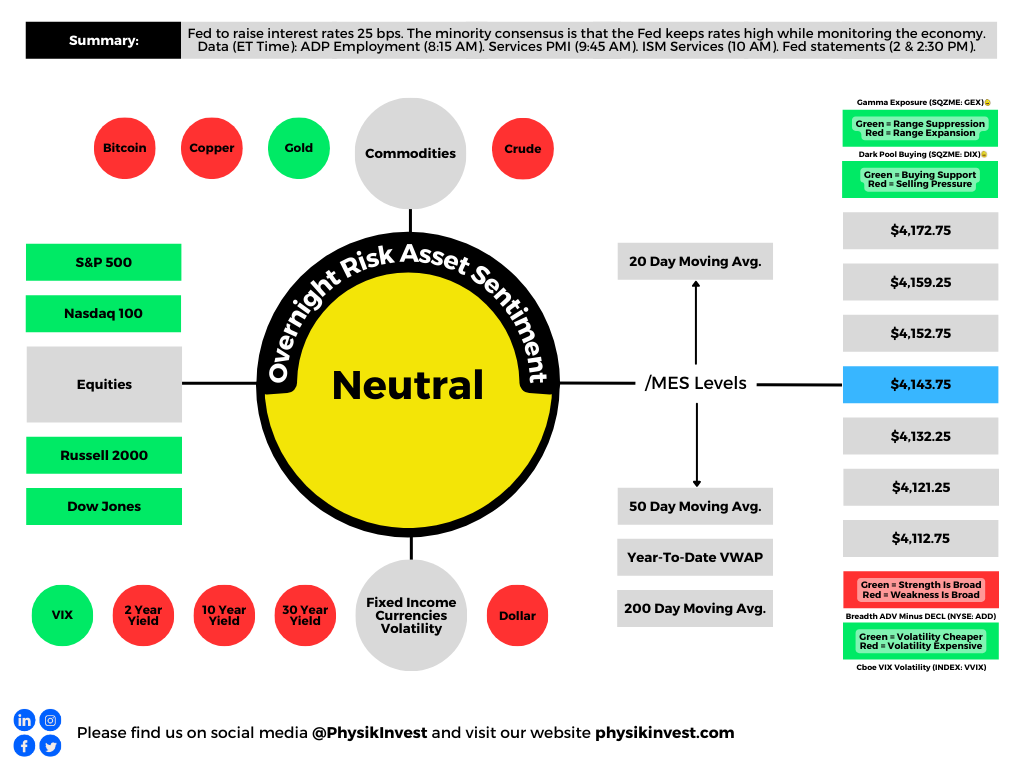
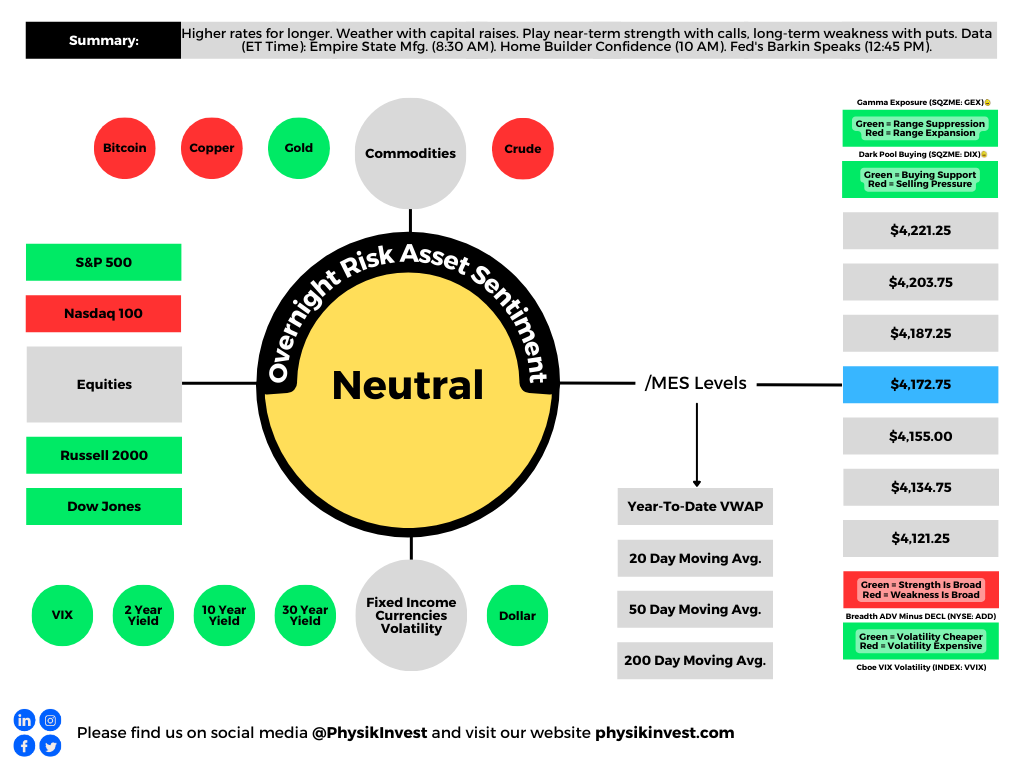
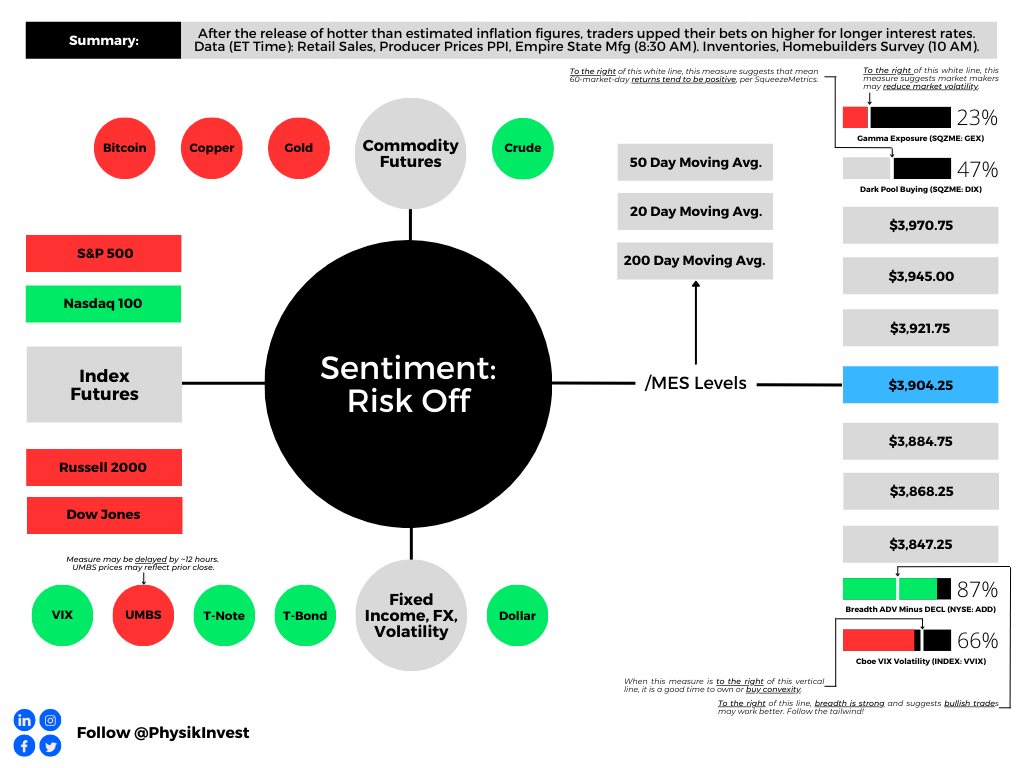
Graphic updated 6:15 AM ET. Sentiment Risk-Off if expected /MES open is below the prior day’s range. /MES levels are derived from the profile graphic at the bottom of this letter. Click here for the latest levels. SqueezeMetrics Dark Pool Index (DIX) and Gamma (GEX) with the latter calculated based on where the prior day’s reading falls with respect to the MAX and MIN of all occurrences available. A higher DIX is bullish. The lower the GEX, the more (expected) volatility. Click to learn the implications of volatility, direction, and moneyness. Breadth reflects a reading of the prior day’s NYSE Advance/Decline indicator. The CBOE VIX Volatility Index (INDEX: VVIX) reflects the attractiveness of owning volatility. UMBS prices via MND. Click here for the economic calendar.
Administrative
As indicated yesterday, through the end-of-this week, newsletters may be shorter due to the letter writer’s commitments. Therefore, please read the Daily Brief for March 14, if you haven’t already, for a big discussion on bond and equity market volatility, as well as the odds of the market falling apart or rising, and positioning contexts that support that movement. If there are any incomplete statements below, we shall complete them in the coming letters. We’re laying it all out for awareness. Take care!
Fundamental
Headline inflation via CPI (Consumer Price Index) fell most on energy and core goods while shelter, food, and services inflation continues to be sticky. Core prices continue to be high, risking “inflationary psychology [] becoming ingrained,” Bloomberg’s John Authers explains.
“There’s nothing in this report to suggest that inflation is defeated already,” explained Authers. “Not to raise the fed funds rate next week, with median inflation above 7%, would be a sign of panic,” and an acknowledgment of uncertainties with regard to the banking system, as talked about in the Daily Brief on March 14.
To note, however, contagion appears contained, despite Moody’s Corporation (NYSE: MCO) cutting its outlook for the banking system to negative from stable, and placing lenders including First Republic Bank (NYSE: FRC) on a downgrade review.
JPMorgan Chase & Co’s (NYSE: JPM) Marko Kolanovic did cut his equity allocation warning that not all carry trades, something this letter has talked about numerous times before (i.e., borrow at a low rate and invest in something that provides higher return), can be bailed out. Kolanovic appears worried about commercial real estate, which Simplify Asset Management’s Michael Green just told your letter writer is in a bubble that “we’re seeing crack,” finally.
Graphic: Retrieved from Bloomberg. The Federal Reserve’s new Bank Term Funding Program or BTFP is “QE in another name – assets will grow on the Fed balance sheet which will increase reserves.” Recall that QE is the flow of capital into capital markets while QT is the opposite. Q is for quantitative while E is for easing and T is for tightening.
Anyways, following yesterday’s CPI, traders price higher odds of a 25 basis point hike which puts the terminal or peak fed funds rate at 4.75-5.00%. Following this spring, factoring potential inflation plateau and financial system uncertainties, traders foresee the Fed easing. By year-end, traders expect rates to fall down to 3.75-4.00%. Recall that at the beginning of last week, there were no expectations of easing in 2023. Also, traders thought the Fed would raise as high as 5.50-5.75%.
Mortgage rates, determined by changes in the price of mortgage-backed securities or MBSs, fell too.
ARK Invest’s Cathie Wood, who your letter writer had the honor of interviewing in person for Benzinga articles, thinks we’re on the cusp of the “roaring twenties” as inflation “is likely to surprise on the low side of expectations” with the banking crisis also leading to “bad deflation.”
“Today, five major innovation platforms are evolving at the same time – multiomics sequencing, robotics, energy storage, artificial intelligence, and blockchain technology, all of which are converging,” she elaborates.
“Once the Fed stops looking backward at CPI inflation and starts addressing the deflationary banking crisis that a 19-fold increase in short rates and an inverted yield have caused, we would not be surprised to see a return to the Roaring Twenties.”
Graphic: Retrieved from Bloomberg.
On the backward-looking measures quote in the above paragraph, former Fed trader Joseph Wang notes that the Fed and central banks, in general, are aware segments of the market may break, but that won’t discourage them from tightening further.
“As the BOE saved the gilt market through purchases and kept tightening, so the Fed can save banks and keep tightening.”
Positioning
Tuesday’s letter said that following important events like CPI, the compression of wound implied volatility or IVOL, coupled with the nearing large options expirations (OpEx), sets the market up for potential short bursts of strength into the end of the month and next month.
That’s along the lines of what is happening. The S&P 500 rose mechanically after the release of CPI yesterday. Later, though the index succumbed, internally speaking the market remained strong through end-of-day, hence some short bursts boosted by some short-dated options activities, also.
As explained, yesterday, the recent re-grossing theme appears intact. Any further compression of wound IVOL and the passage of options expirations (OpEx) could support equities as month-end approaches. Though it may be too early to position for strength, one may consider it the way it was explained in the Daily Brief on March 14.
Technical
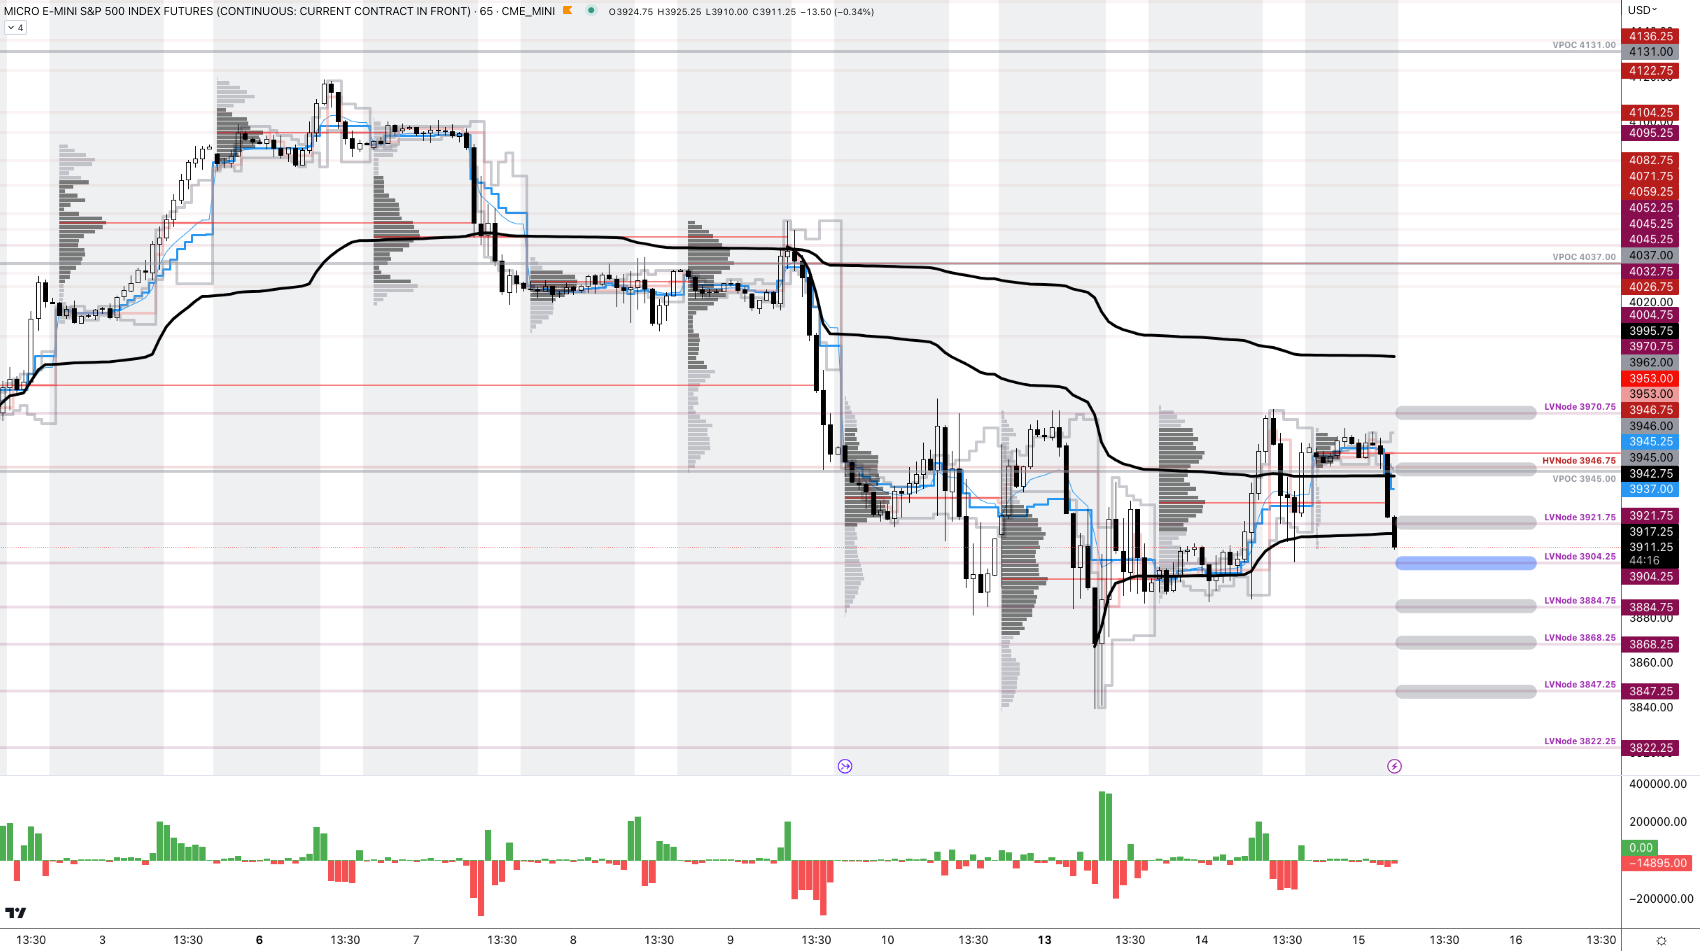
As of 6:15 AM ET, Wednesday’s regular session (9:30 AM – 4:00 PM ET), in the S&P 500, is likely to open in the middle part of a negatively skewed overnight inventory, inside of the prior day’s range, suggesting a limited potential for immediate directional opportunity.
The S&P 500 pivot for today is $3,904.25.
Key levels to the upside include $3,921.75, $3,945.00, and $3,970.75.
Key levels to the downside include $3,884.75, $3,868.25, and $3,847.25.
Disclaimer: Click here to load the updated key levels via the web-based TradingView platform. New links are produced daily. Quoted levels likely hold barring an exogenous development.
Graphic: 65-minute profile chart of the Micro E-mini S&P 500 Futures.
Definitions
Volume Areas: Markets will build on areas of high-volume (HVNodes). Should the market trend for a period of time, this will be identified by a low-volume area (LVNodes). The LVNodes denote directional conviction and ought to offer support on any test.
If participants auction and find acceptance in an area of a prior LVNode, then future discovery ought to be volatile and quick as participants look to the nearest HVNodes for more favorable entry or exit.
POCs: Areas where two-sided trade was most prevalent in a prior day session. Participants will respond to future tests of value as they offer favorable entry and exit.
Volume-Weighted Average Prices (VWAPs): A metric highly regarded by chief investment officers, among other participants, for quality of trade. Additionally, liquidity algorithms are benchmarked and programmed to buy and sell around VWAPs.
About
The author, Renato Leonard Capelj, spends the bulk of his time at Physik Invest, an entity through which he invests and publishes free daily analyses to thousands of subscribers. The analyses offer him and his subscribers a way to stay on the right side of the market.
You may view this letter’s content calendar at this link.
Disclaimer
Do not construe this newsletter as advice. All content is for informational purposes. Capelj and Physik Invest manage their own capital and will not solicit others for it.
Physik Invest’s Daily Brief is read by thousands of subscribers. You, too, can join this community to learn about the fundamental and technical drivers of markets.
Graphic updated 7:15 AM ET. Sentiment Neutral if expected /ES open is inside of the prior day’s range. /ES levels are derived from the profile graphic at the bottom of this letter. Levels may have changed since initially quoted; click here for the latest levels. SqueezeMetrics Dark Pool Index (DIX) and Gamma (GEX) with the latter calculated based on where the prior day’s reading falls with respect to the MAX and MIN of all occurrences available. A higher DIX is bullish. At the same time, the lower the GEX, the more (expected) volatility. Click to learn the implications of volatility, direction, and moneyness. Breadth reflects a reading of the prior day’s NYSE Advance/Decline indicator. The CBOE VIX Volatility Index (INDEX: VVIX) measure reflects the total attractiveness of owning volatility.
Administrative
Your letter writer has returned after a period of travel. Now, there is a lot of content to cover, so we’ll give it a good shot today and fill in some of the missing points over the coming days. Thanks!
Fundamental
At its core, the expectation is that the US economy will fall into recession in the first half of 2023, and traders are betting policymakers will reverse in the second half of the year. This, in part, has boosted the S&P 500 (INDEX: SPX) over the past weeks.
However, many strategists think there is little reason for the policymakers to reverse course, and that will not be good for the markets.
Graphic: Retrieved from Bloomberg. Traders bet big on a peak in interest rates; some have amassed positions “in June 2023 SOFR options targeting a policy peak between 4.75% to 4.875%, and paying a premium of approximately $5.25 million for the hedge.”
As a recap, recall our past letters featuring the likes of Kai Volatility’s Cem Karsan and Credit Suisse Group AG’s (NYSE: CS) Zoltan Pozsar. The inflation conversation began when authorities cut rates and bought bonds, while money was sent to people.
Risk assets were the first to respond; it was easier to borrow and make bets on ideas with a lot of promise in the future. As the economy reopened and demand picked up, supply chains tightened, and prices in the real economy inflated.
Graphic: Retrieved from Moody’s Corporation (NYSE: MCO).
As argued by Pozsar, Andy Constan, and Joseph Wang, inflation likely trends higher for longer. Trends in de-globalization, supply chain chokepoints and restructuring, and a large credit boom in the banking sector are among the factors to blame.
Policymakers will continue generating negative wealth effects. Collateral damages to the economy (e.g., Alphabet Inc [NASDAQ: GOOGL] [NASDAQ: GOOG] and Spotify Technology SA [NYSE: SPOT] layoffs) are expected, consequently.
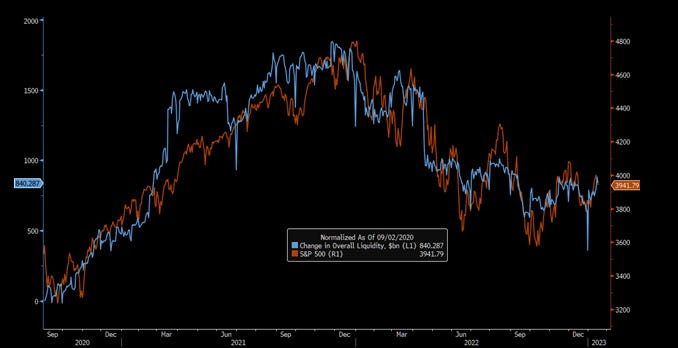
Graphic: Retrieved from The Market Ear. Per Morgan Stanley (NYSE: MS), “the single most important driver of equities over the last year has been excess liquidity, and it’s about to turn more restrictive. The amount of liquidity in the system is about to change again – the Treasury is increasing bill issuance sizes, which will drain liquidity from the system. The Treasury could build cash by more than $200 billion over the span of a month – which on top of QT will effectively drain nearly $300 billion from bank reserves – which implies the S&P 500 should be 6% lower over the net month.”
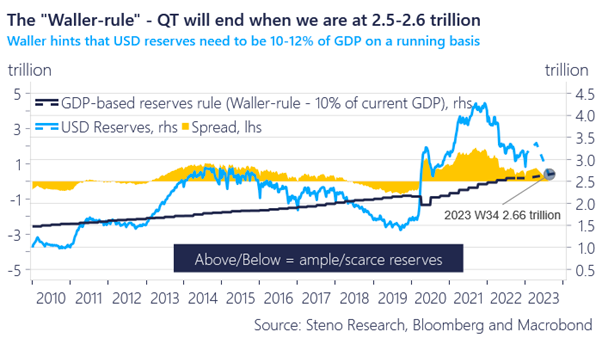
Moreover, per Andreas Steno Larsen, markets likely bottoms in the middle of 2023.
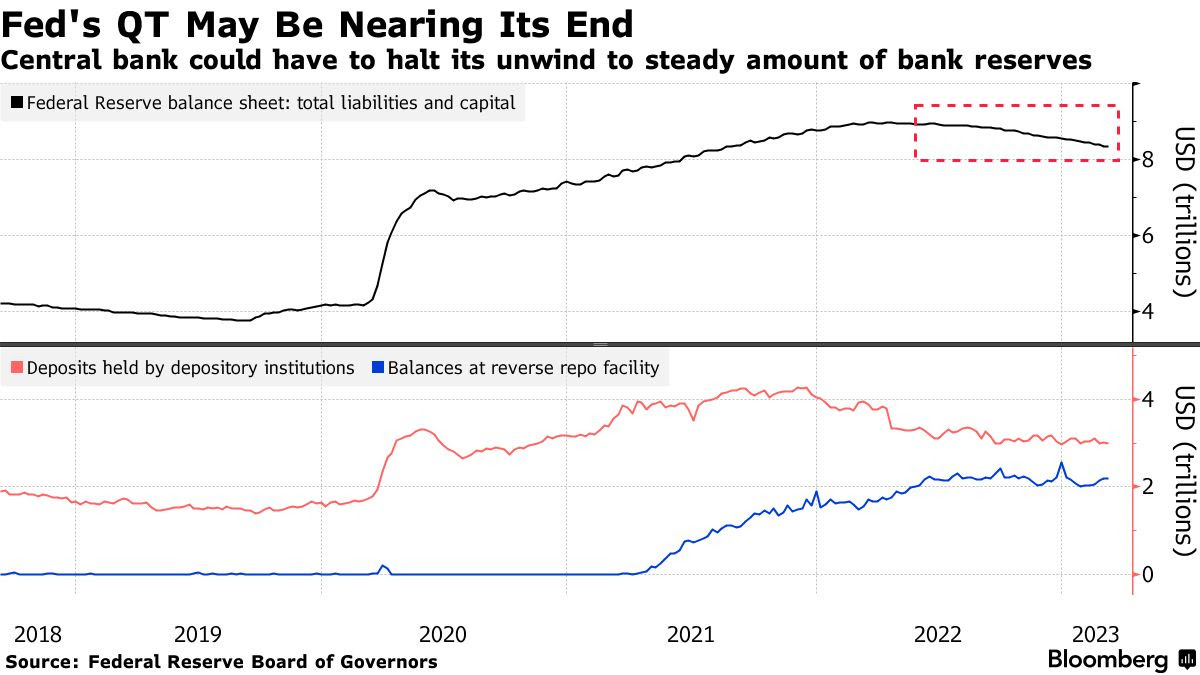
“[Christopher] Waller said that the QT process will either have to slow or come to a complete halt if the amount of USD reserves is equal to 10-11% of USD GDP, which is around 2.5 trillion USDs relative to current GDP (but rising over time obviously).”
Because we have more than $3 trillion USD in the system, and “more to be added due to the debt ceiling, we need a withdrawal of another $5-600 billion before QT will end [or] slow in between weeks 34-40 on our calculations,” Steno Larsen added, noting that if GDP flatlines, that would help keep QT running for longer.
“If the Fed is willing to bring reserves down to 10% of GDP, we should expect S&P 500 to bottom around $3,250.00 in the second half of the year,” Steno Larsen said. “The Waller Rule is not good news ultimately, but for now let’s enjoy the liquidity added in February and March due to the debt ceiling. When a debt ceiling deal is signed, run for the hills.”
As of 7:15 AM ET, Monday’s regular session (9:30 AM – 4:00 PM ET), in the S&P 500, is likely to open in the middle part of a balanced overnight inventory, inside of prior-range and -value, suggesting a limited potential for immediate directional opportunity.
Our S&P 500 pivot for today is $3,988.25.
Key levels to the upside include $3,998.25, $4,011.75, and $4,019.00.
Key levels to the downside include $3,979.75, $3,965.25, and $3,949.00.
Click here to load today’s key levels into the web-based TradingView platform. All levels are derived using the 65-minute timeframe. New links are produced, daily.
As a disclaimer, the S&P 500 could trade beyond the levels quoted in the letter. Therefore, you should load the above link on your browser for more relevant levels.
Graphic: 65-minute profile chart of the Micro E-mini S&P 500 Futures.
Definitions
Volume Areas: Markets will build on areas of high-volume (HVNodes). Should the market trend for long periods of time, it will be identified by low-volume areas (LVNodes). LVNodes denote directional conviction and ought to offer support on any test.
If participants auction and find acceptance in an area of a prior LVNode, then future discovery ought to be volatile and quick as participants look to HVNodes for favorable entry or exit.
POCs: Denote areas where two-sided trade was most prevalent in a prior day session. Participants will respond to future tests of value as they offer favorable entry and exit.
MCPOCs: Denote areas where two-sided trade was most prevalent over numerous sessions. Participants will respond to future tests of value as they offer favorable entry and exit.
About
In short, an economics graduate working in finance and journalism.
Capelj spends most of his time as the founder of Physik Invest through which he invests and publishes daily analyses to subscribers, some of whom represent well-known institutions.
Separately, Capelj is an equity options analyst at SpotGamma and an accredited journalist interviewing global leaders in business, government, and finance.
The daily brief is a free glimpse into the prevailing fundamental and technical drivers of U.S. equity market products. Join the 300+ that read this report daily, below!
Graphic updated 6:30 AM ET. Sentiment Neutral if expected /ES open is inside of the prior day’s range. /ES levels are derived from the profile graphic at the bottom of the following section. Levels may have changed since initially quoted; click here for the latest levels. SqueezeMetrics Dark Pool Index (DIX) and Gamma (GEX) calculations are based on where the prior day’s reading falls with respect to the MAX and MIN of all occurrences available. A higher DIX is bullish. At the same time, the lower the GEX, the more (expected) volatility. Learn the implications of volatility, direction, and moneyness. Breadth reflects a reading of the prior day’s NYSE Advance/Decline indicator. VIX reflects a current reading of the CBOE Volatility Index (INDEX: VIX) from 0-100.
Fundamental
A light few letters after what it seems were like weeks of heavy content to discuss.
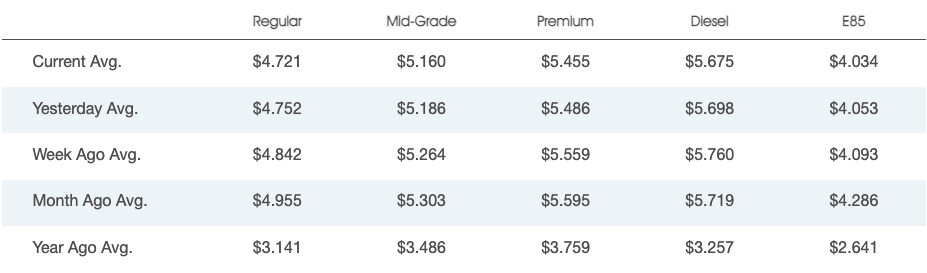
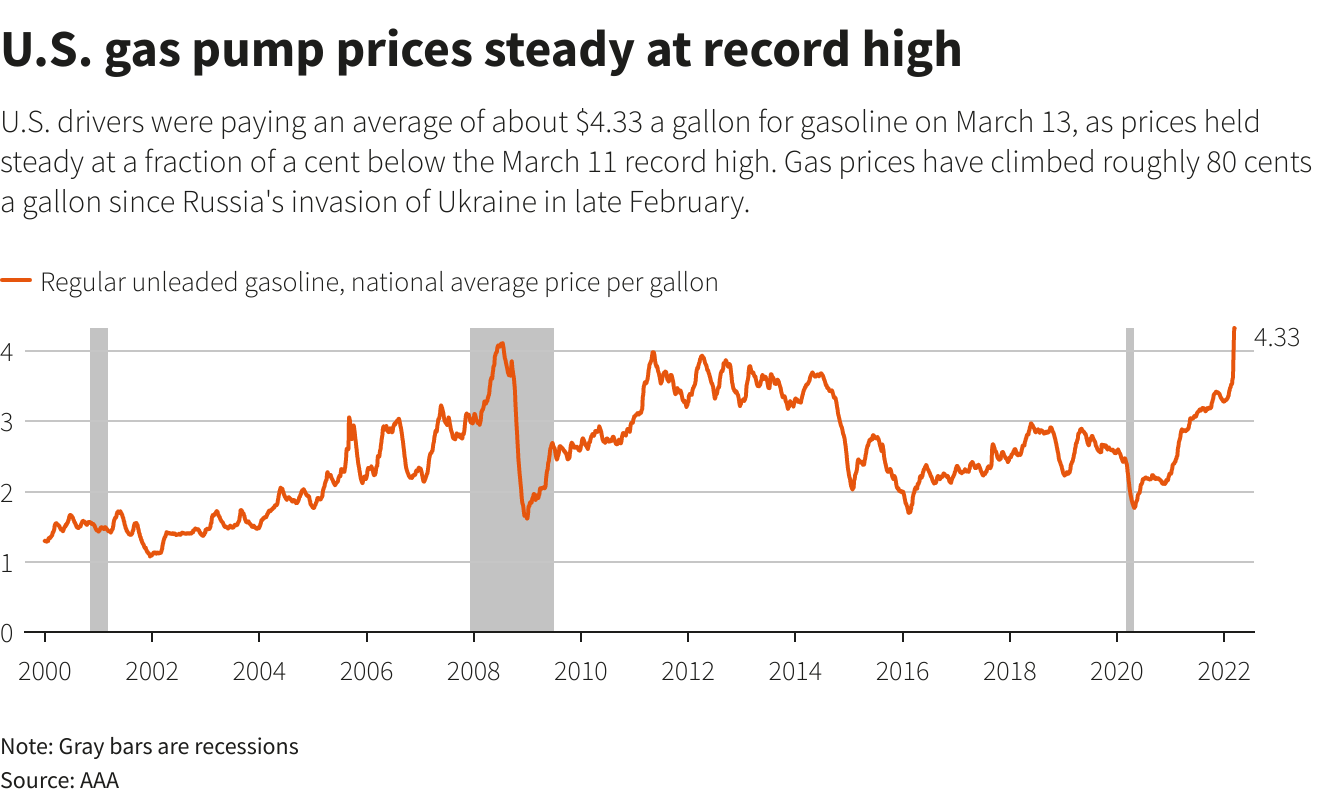
Further, prices at the pump are falling on an “unseasonal” drop in consumption, all the while the biggest bulls have tempered their outlooks on the market citing inflation and the implications of geopolitical tensions.
Graphic: National average gas prices posted by AAA.
An overseas slowdown affecting China likely solicits stimulus. Reported was China’s Ministry of Finance considering the sale of special bonds with proceeds used to pay for infrastructure and boost a slowed economy increasingly in the clear from Covid.
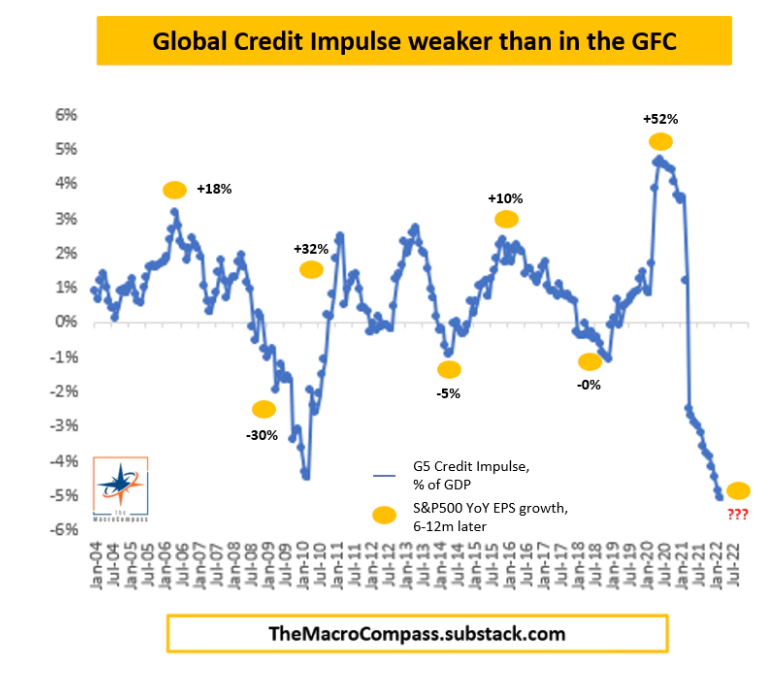
Graphic: Shared by Alfonso Peccatiello. “the pace of real-economy money printing (not bank reserves…) going on in the 5 largest economies in the world. It’s a good leading indicator for economic growth & the performance of several asset classes. It just printed below the GFC lows.”
Moreover, as talked about yesterday, inflation may have peaked. Inventories are pointing to a looming supply gut.
Accordingly, the Federal Reserve (Fed), just as it was slow to end stimulus late last year and early this year, maybe slow in moderating its efforts to de-stimulate.
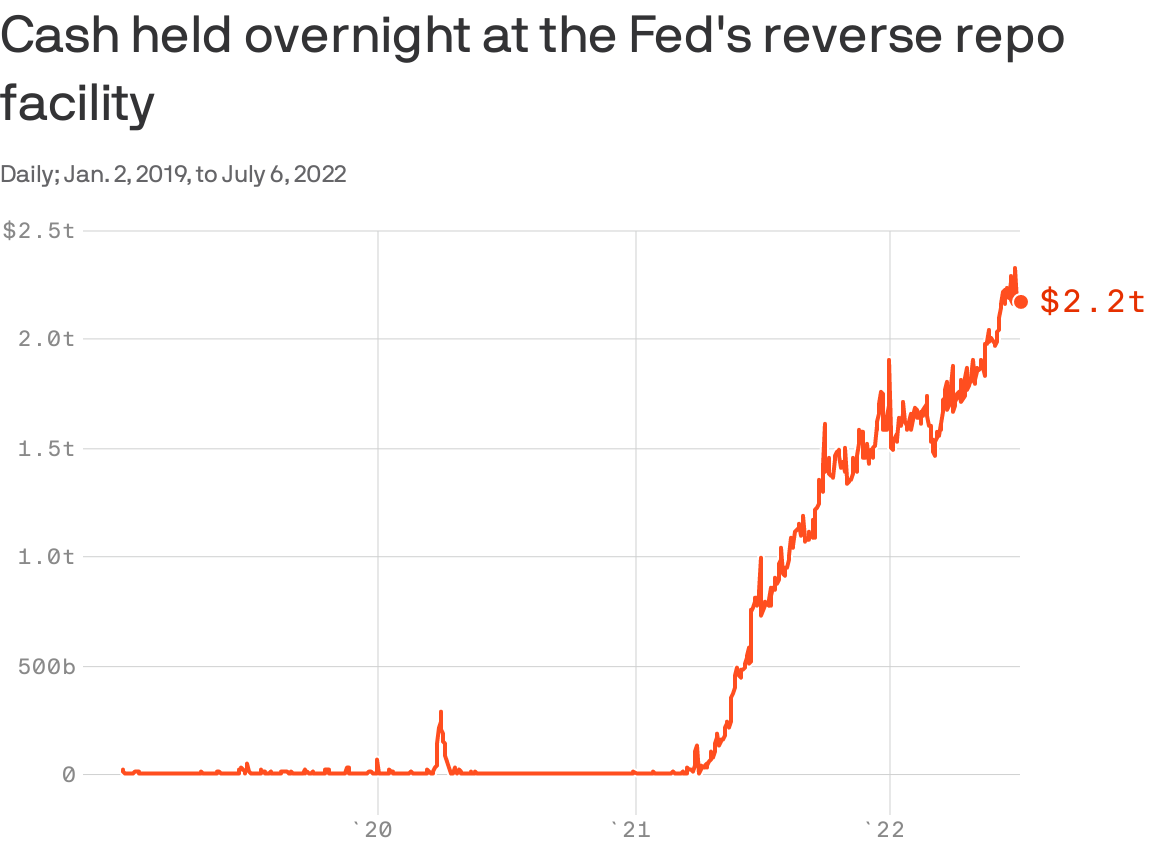
Graphic: Retrieved from Axios. “The glut of cash being parked at the Fed is reflective of policies that have already run their course, especially with quantitative tightening underway.” But, “it’s a representation of how much too far the Fed went in easing,” says Thomas Simon, an economist at Jefferies Financial Group (NYSE: JEF).
Minutes from the last Federal Open Market Committee (FOMC) meeting revealed a rate hike up to 75 basis points in July would be appropriate, per Moody’s Corporation (NYSE: MCO).
A strong jobs report would likely prompt the Fed “to raise rates even more aggressively as they pursue their goal to raise the unemployment rate,” explains Bryce Doty of Sit Fixed Income.
“As [the Fed] seek[s] to destroy demand, they are also destroying supply. As a result, inflation will persist longer and the economy will be even worse.”
This is pursuant to calls by the Credit Suisse Group AG’s (NYSE: CS) Zoltan Pozsar who put forth, earlier this year, that the “Fed is pursuing demand destruction through negative wealth effects,” as the “central banks can only deal with nominal [and] not real chokepoints.”
Graphic: Via JPMorgan Chase & Co (NYSE: JPM). Taken from The Market Ear. “A stronger dollar, lower equity prices, and higher mortgage rates will weigh on demand growth [and] Over time weaker output demand should lead to weaker labor demand Don’t fight the Fed as this is what Fed wants (slower growth).”
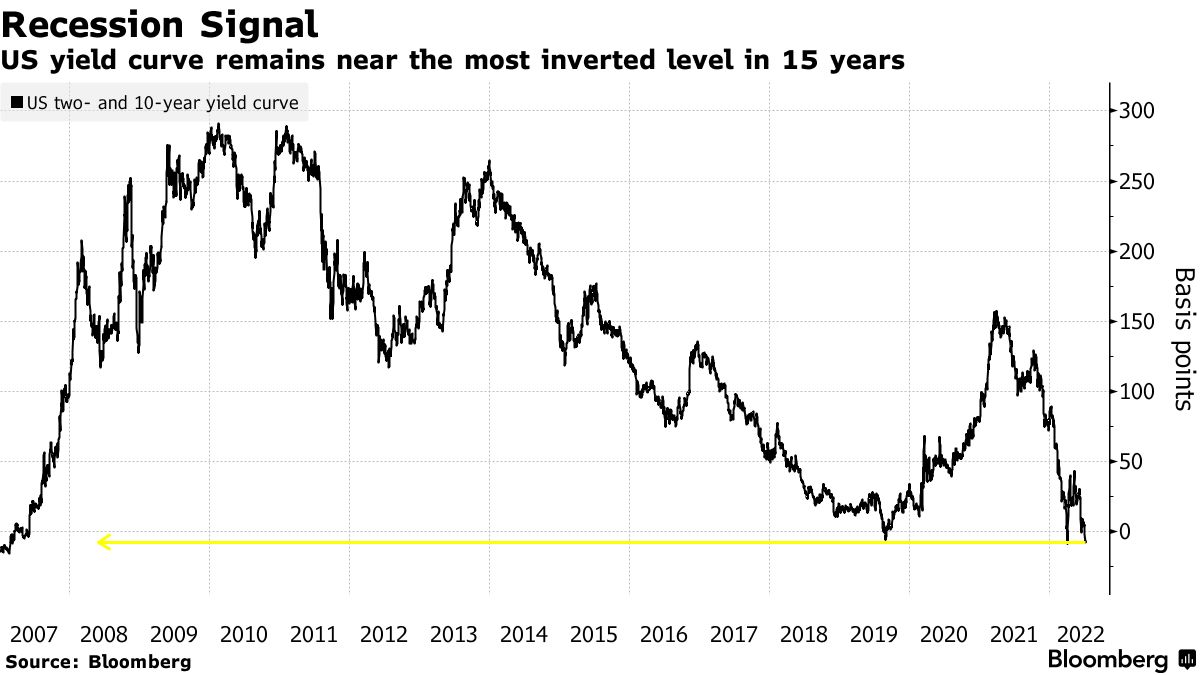
Ultimately, the “risk of recession, whether it is real or merely implied by an inversion of the yield curve, won’t deter the Fed from hiking rates higher faster or from injecting more volatility to build up negative wealth effects.”
“Rallies could beget more forceful pushback from the Fed – the new game.”
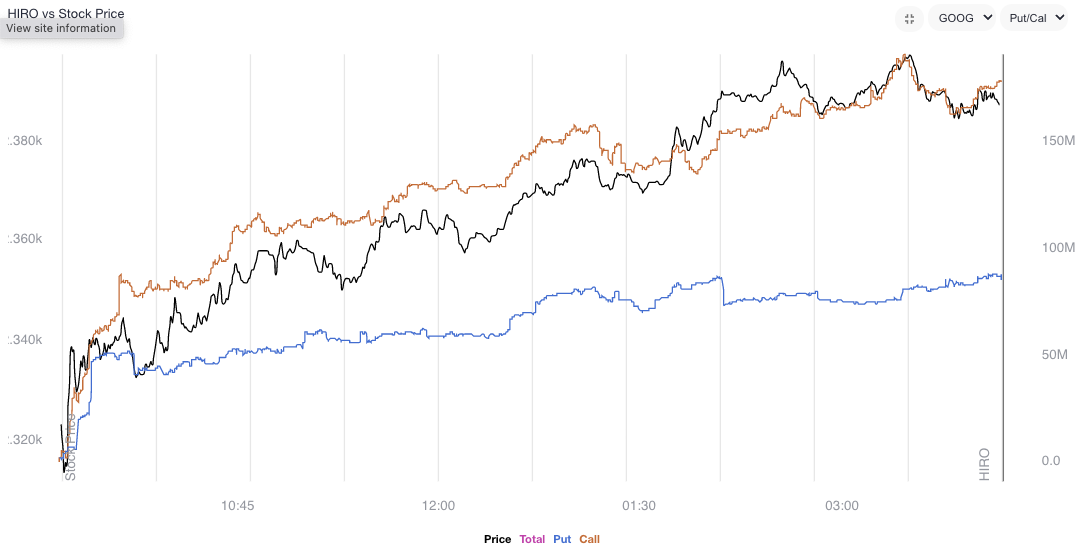
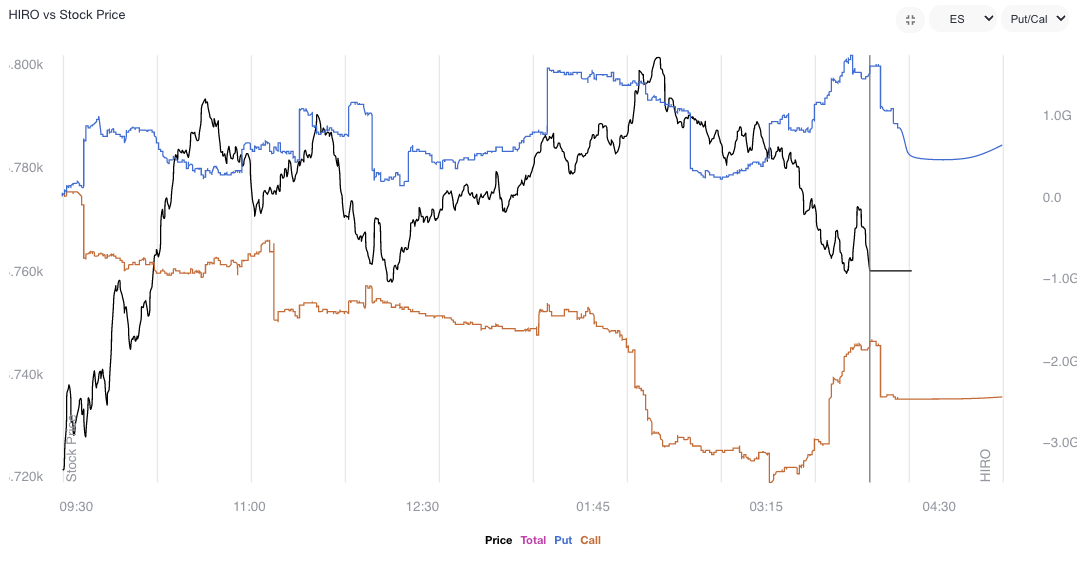
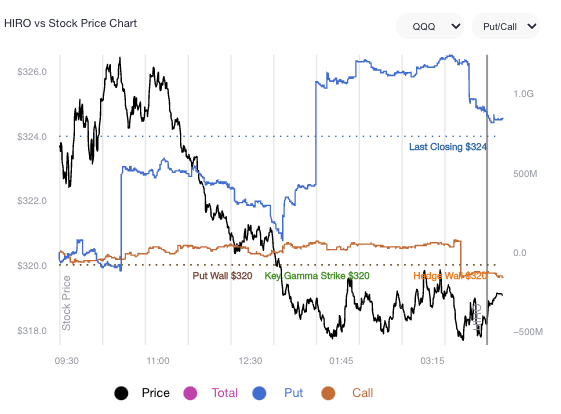
Data shows net gamma exposure increasing which may increasingly feed into smaller ranges and a positive drift amid shorter-dated volatility sales and a pick up in call demand, particularly in some of the larger index weights.
Graphic: Via SpotGamma’s Hedging Impact of Real-Time Options (HIRO) indicator for Alphabet Inc (NASDAQ: GOOG) (NASDAQ: GOOGL). Rising orange and blue lines point to call buying and put selling, both of which have bullish implications.
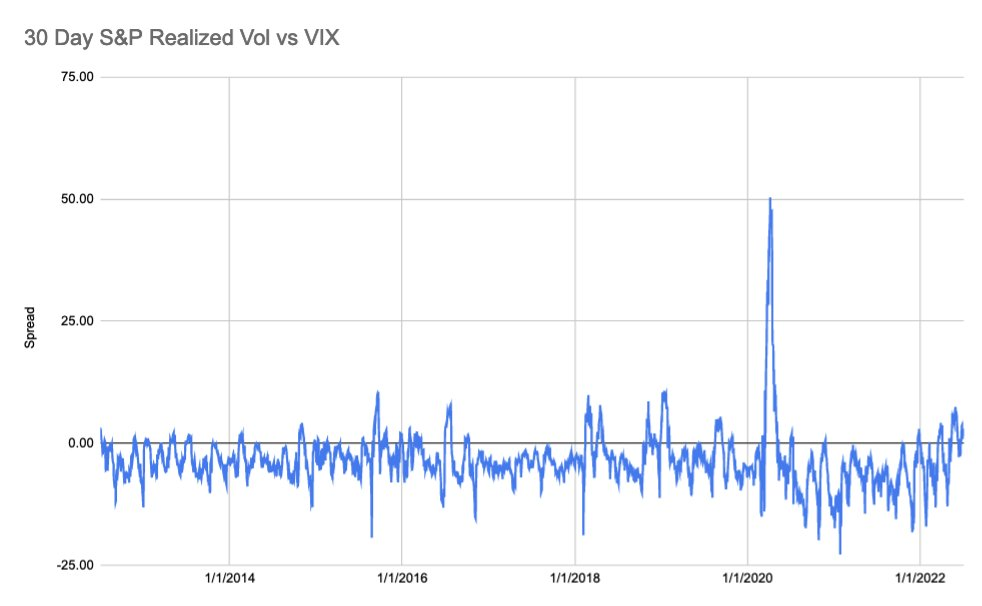
The creep in volatility realized (RVOL), versus that which is implied (IVOL), coupled with “a flattening in the downside fixed strike skew, while the upside wings [are] more smiley,” per JPMorgan Chase & Co (NYSE: JPM), makes it so we can put on more complex structures.
Graphic: Via S&P Global Inc (NYSE: SPGI). As explained by SpotGamma, “30-day realized SPX volatility is now trading above the VIX, something that generally shows after major selloffs wherein IV “premium” needs to reset to calmer/higher equity markets.”
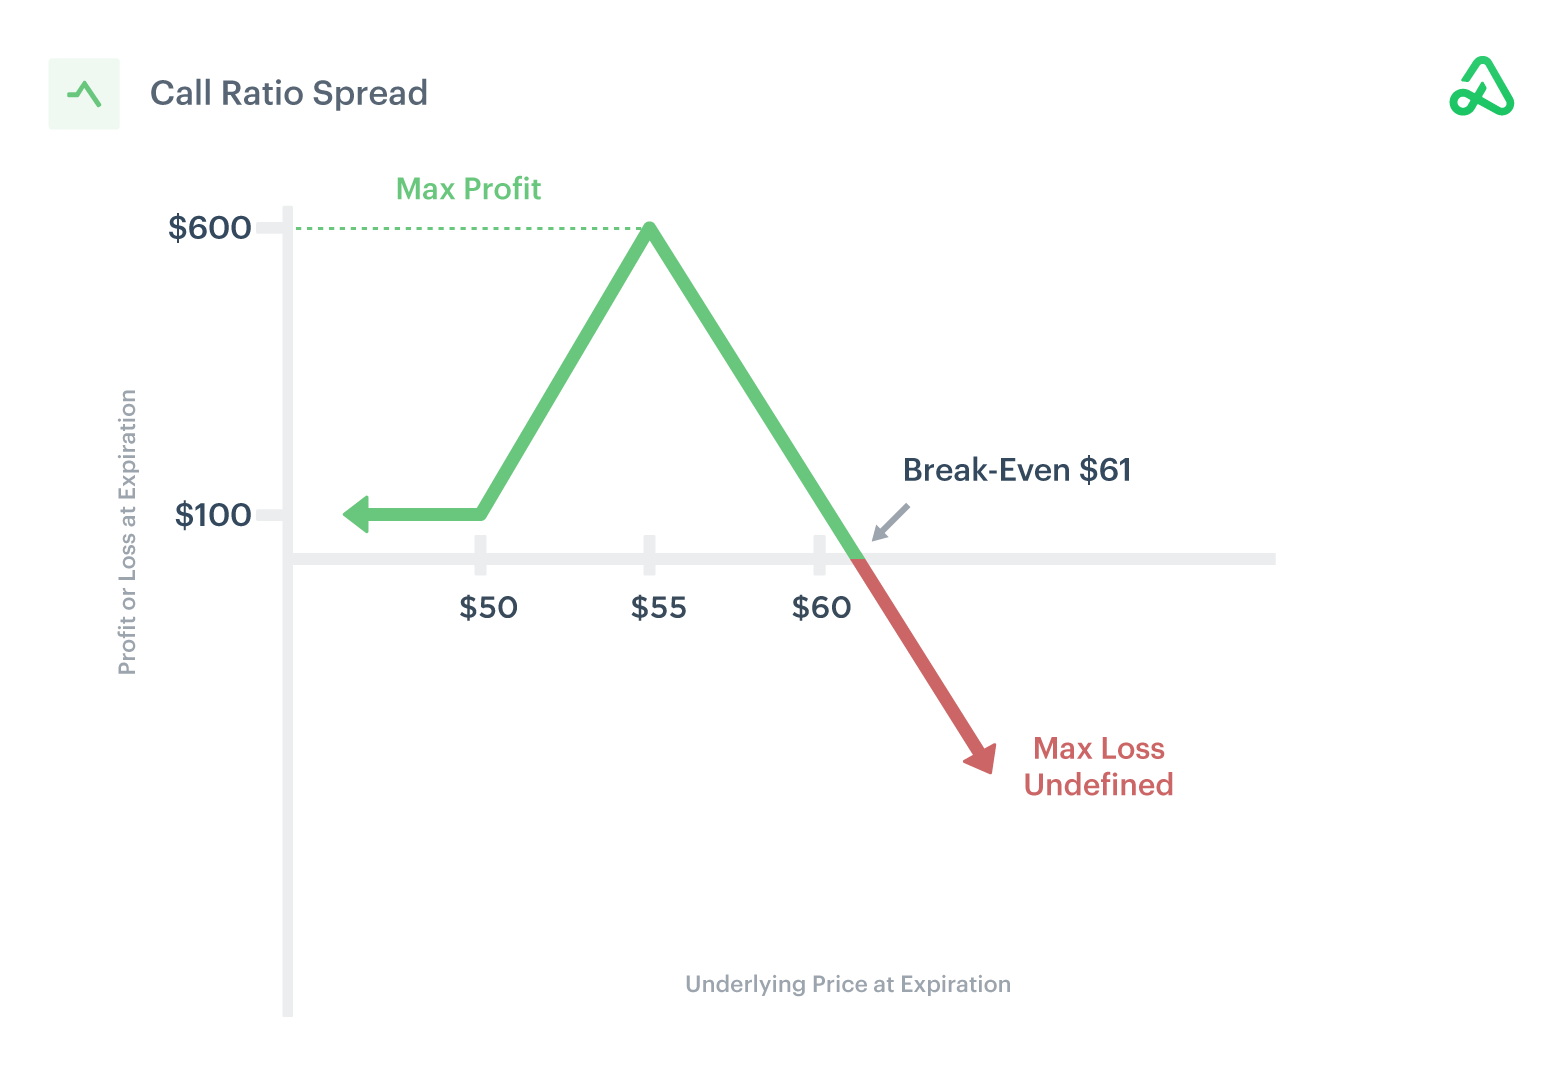
For instance, ratio spreads continue to work well for low- or no-cost exposure to the upside.
Likewise, if one thought volatility, though at a high starting point particularly at the money (ATM), was due for a repricing, they would look for exposure to the downside via something such as an inverse ratio (or backspread).
This is as the ATMs, unlike those further out of the money (OTM), are less convex in vega.
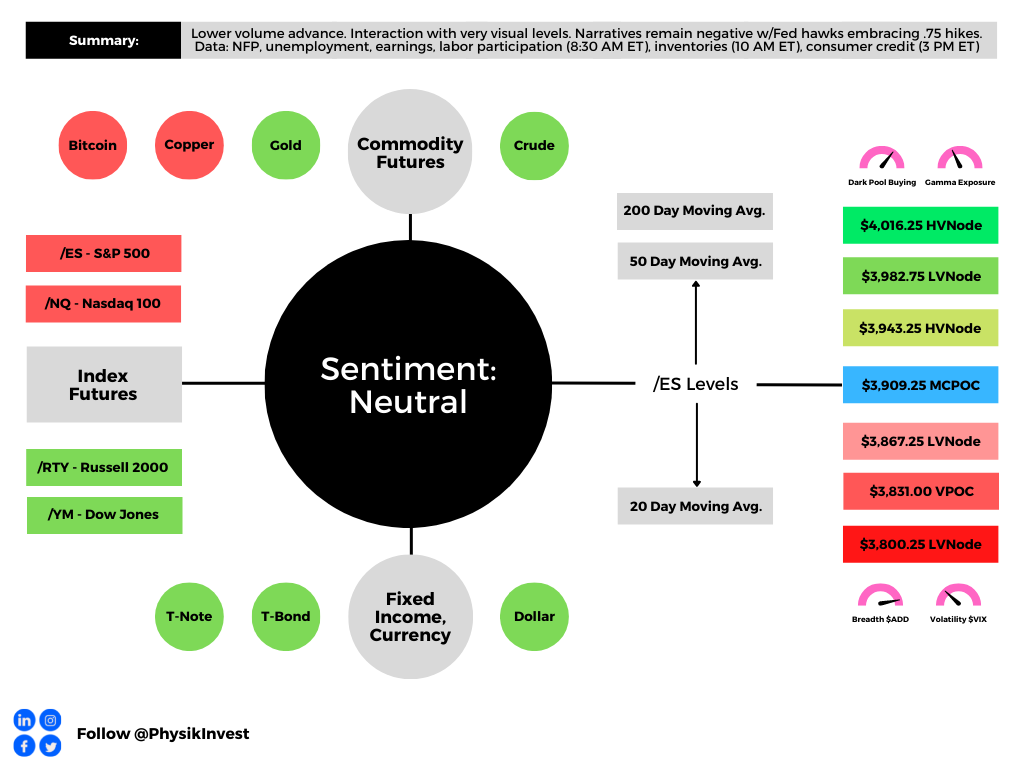
As of 6:30 AM ET, Friday’s regular session (9:30 AM – 4:00 PM ET), in the S&P 500, is likely to open in the upper part of a negatively skewed overnight inventory, inside of prior-range and -value, suggesting a limited potential for immediate directional opportunity.
In the best case, the S&P 500 trades higher.
Any activity above the $3,909.25 MCPOC puts into play the $3,943.25 HVNode. Initiative trade beyond the HVNode could reach as high as the $3,982.75 LVNode and $4,016.25 HVNode, or higher.
In the worst case, the S&P 500 trades lower.
Any activity below the $3,909.25 MCPOC puts into play the $3,867.25 LVNode. Initiative trade beyond the LVNode could reach as low as the $3,831.00 VPOC and $3,800.25 LVNode, or lower.
Click here to load today’s key levels into the web-based TradingView charting platform. Note that all levels are derived using the 65-minute timeframe. New links are produced, daily.
Graphic: 65-minute profile chart of the Micro E-mini S&P 500 Futures.
Considerations: Responsiveness near key-technical areas (that are discernable visually on a chart), suggests technically-driven traders with short time horizons are very active.
Such traders often lack the wherewithal to defend retests and, additionally, the type of trade may be indicative of the other time frame participants waiting for more information to initiate trades.
Definitions
Volume Areas: A structurally sound market will build on areas of high volume (HVNodes). Should the market trend for long periods of time, it will lack sound structure, identified as low volume areas (LVNodes). LVNodes denote directional conviction and ought to offer support on any test.
If participants were to auction and find acceptance into areas of prior low volume (LVNodes), then future discovery ought to be volatile and quick as participants look to HVNodes for favorable entry or exit.
POCs: POCs are valuable as they denote areas where two-sided trade was most prevalent in a prior day session. Participants will respond to future tests of value as they offer favorable entry and exit.
MCPOCs: POCs are valuable as they denote areas where two-sided trade was most prevalent over numerous day sessions. Participants will respond to future tests of value as they offer favorable entry and exit.
Volume-Weighted Average Prices (VWAPs): A metric highly regarded by chief investment officers, among other participants, for quality of trade. Additionally, liquidity algorithms are benchmarked and programmed to buy and sell around VWAPs.
About
After years of self-education, strategy development, mentorship, and trial-and-error, Renato Leonard Capelj began trading full-time and founded Physik Invest to detail his methods, research, and performance in the markets.
Capelj also develops insights around impactful options market dynamics at SpotGamma and is a Benzinga reporter.
In no way should the materials herein be construed as advice. Derivatives carry a substantial risk of loss. All content is for informational purposes only.
The daily brief is a free glimpse into the prevailing fundamental and technical drivers of U.S. equity market products. Join the 300+ that read this report daily, below!
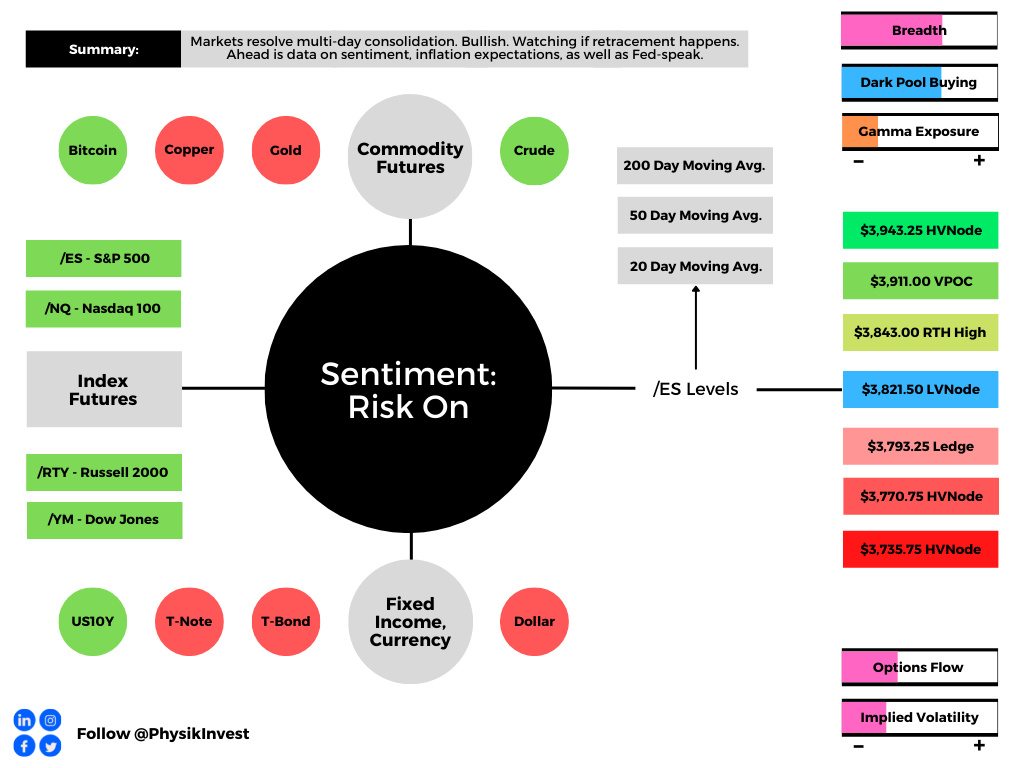
Overnight, equity index futures resolved a multi-day consolidation and auctioned higher, far beyond the prior day’s range. Commodities were mixed while bonds were lower.
The break from consolidation is one of the most bullish happenings in weeks. We’re monitoring whether participants add to their recent short volatility bets against direction, or whether there is repositioning and this bolsters the initiative probe.
Ahead is data on University of Michigan consumer sentiment, inflation expectations, and new home sales (10:00 AM ET), as well as some Fed speak (7:30 AM and 4:00 PM ET).
Graphic updated 6:40 AM ET. Sentiment Risk-On if expected /ES open is above the prior day’s range. /ES levels are derived from the profile graphic at the bottom of the following section. Levels may have changed since initially quoted; click here for the latest levels. SqueezeMetrics Dark Pool Index (DIX) and Gamma (GEX) calculations are based on where the prior day’s reading falls with respect to the MAX and MIN of all occurrences available. A higher DIX is bullish. At the same time, the lower the GEX, the more (expected) volatility. Learn the implications of volatility, direction, and moneyness. SHIFT data used for S&P 500 (INDEX: SPX) options activity. Note that options flow is sorted by the call premium spent; if more positive, then more was spent on call options. Breadth reflects a reading of the prior day’s NYSE Advance/Decline indicator. VIX reflects a current reading of the CBOE Volatility Index (INDEX: VIX) from 0-100.
What To Expect
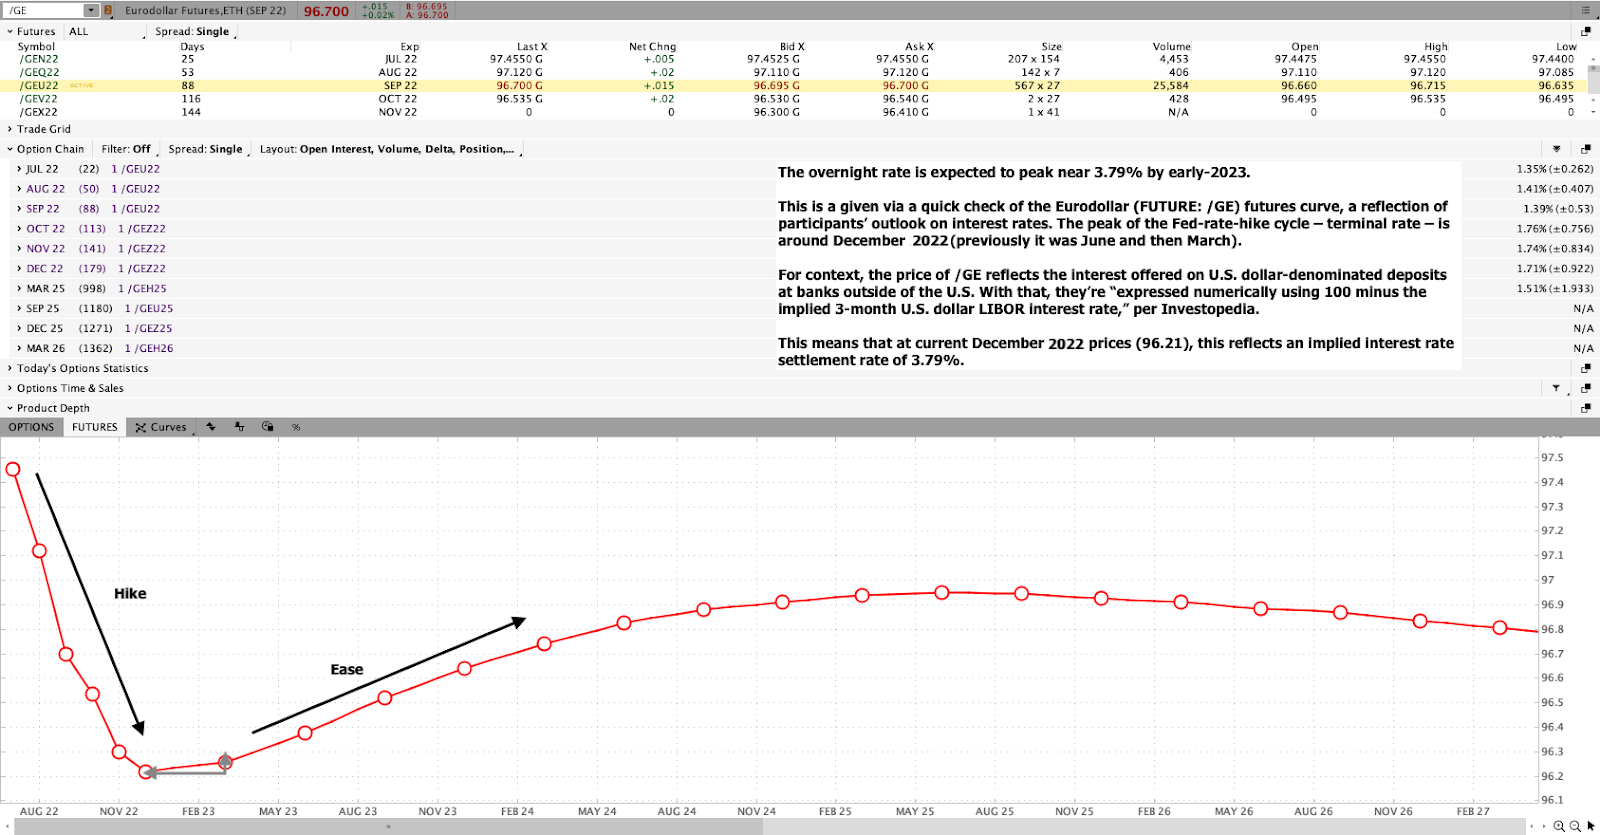
Fundamental: To start, I want to apologize for any confusion, yesterday, with respect to the /GE Eurodollar quote. This newsletter said the peak of the Fed-rate-hike cycle – terminal rate – sat near December 2023.
That’s wrong. It’s December 2022.
Graphic: Via Charles Schwab Corporation-owned (NYSE: SCHW) TD Ameritrade’s Thinkorswim. The Eurodollar (FUTURE: /GE) futures curve is a reflection of participants’ outlook on interest rates. The peak of the Fed-rate-hike cycle – terminal rate – is around DEC 20[22].
Okay, moving on, now!
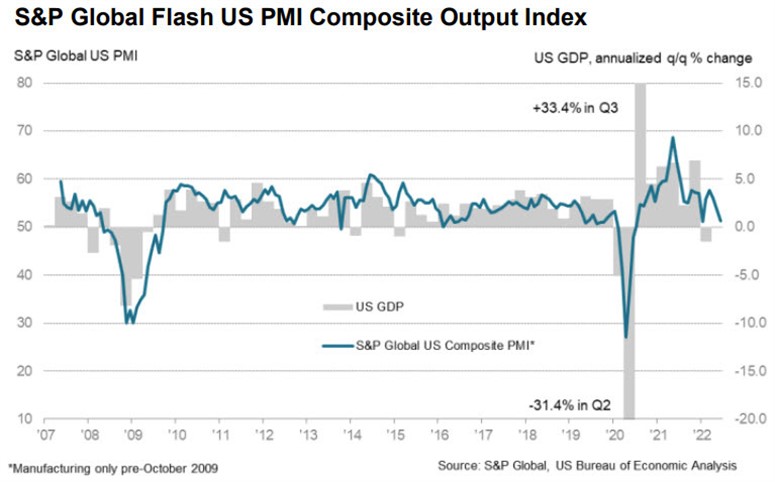
New data is pointing to a “remarkable” drop in demand for goods and services during June, compared to months prior.
“US economic growth has slowed sharply in June, with deteriorating forward-looking indicators setting the scene for an economic contraction in the third quarter,” S&P Global (NYSE: SPGI) Market Intelligence’s Chris Williamson explained.
“The survey data are consistent with the economy expanding at an annualized rate of less than 1% in June, with the goods-producing sector already in decline and the vast service sector slowing sharply.”
Graphic: Via S&P Global Inc. “This is a sizeable miss and evidence of a quick slowdown in demand, though it’s still in positive territory (above 50). This report is consistent with a shifting narrative away from inflation worries and towards growth worries.”
Businesses (particularly in retail) are way “more concerned about the outlook” of costs and demand, as well as the path in monetary policies and deterioration in financial conditions.
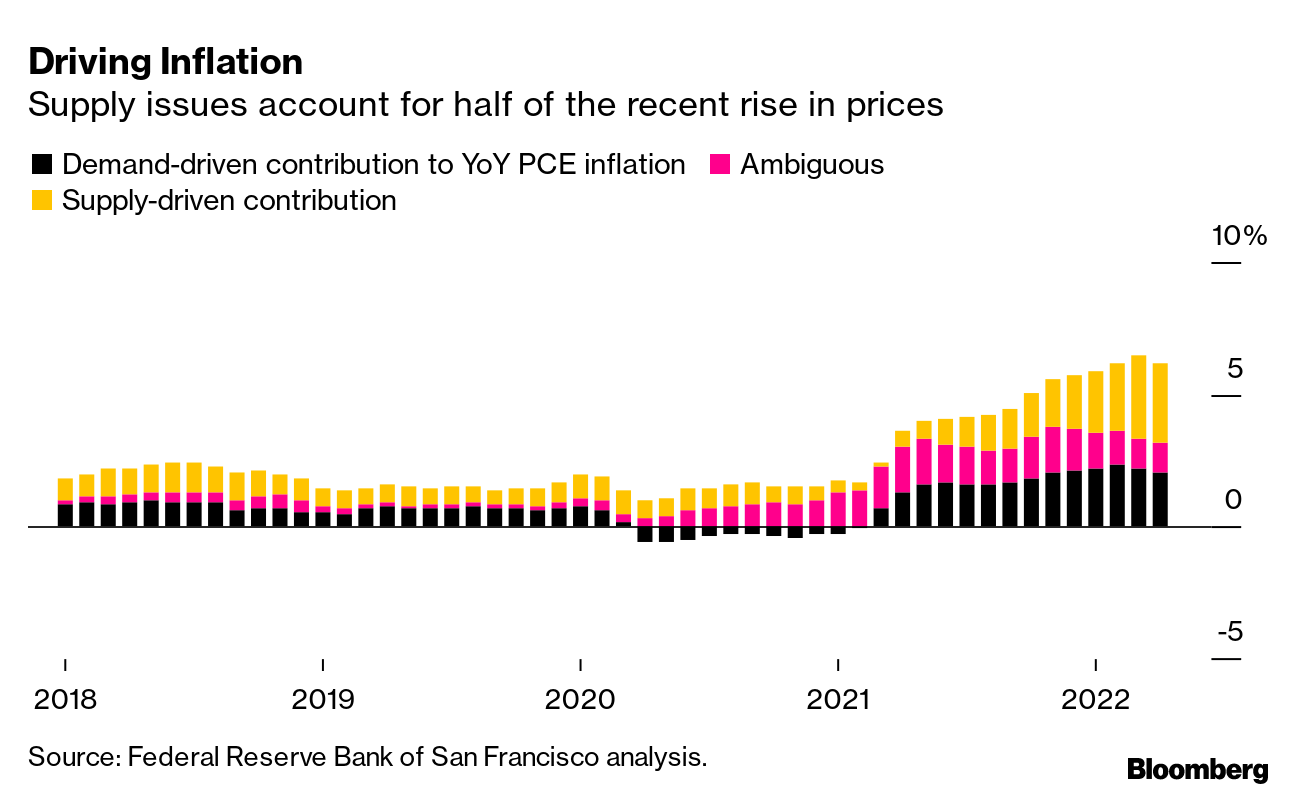
Graphic: Via Bloomberg. “Supply constraints, exacerbated by Russia’s war in Ukraine this year, account for about half of the surge in US inflation, with demand currently making up a third of the increase, according to new research from the Federal Reserve Bank of San Francisco.”
That’s validated by Tesla Inc’s (NASDAQ: TSLA) CEO Elon Musk speaking about the carmaker’s losses from new plants, supply chain problems, and the like.
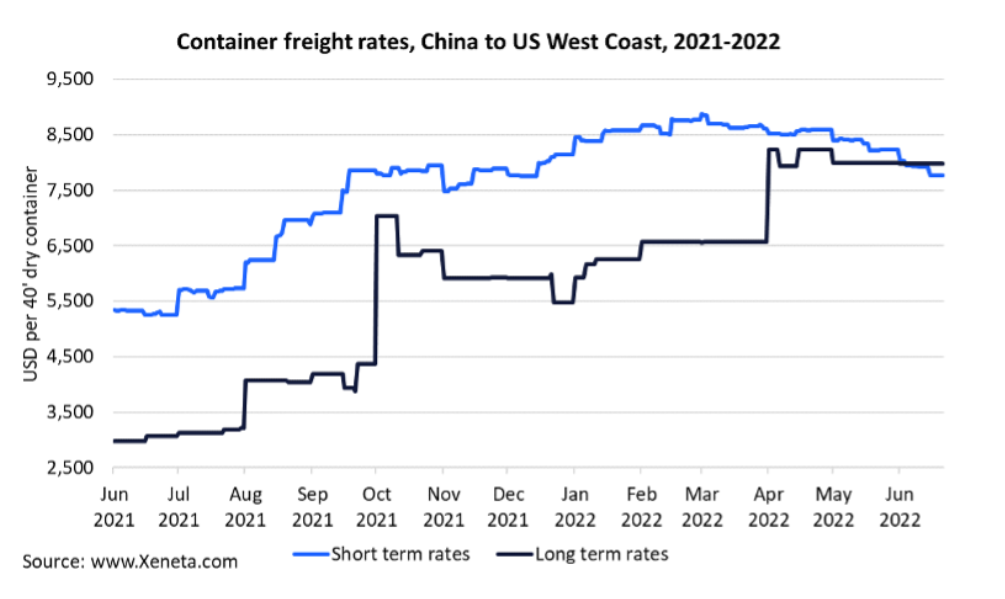
Graphic: Via Bloomberg. “Long-term ocean freight rates between China and the US West Coast are higher than spot prices for the first time since April 2020.”
“The past two years have been an absolute nightmare of supply chain interruptions, one thing after another,” Musk said.
“We’re not out of it yet. That’s overwhelmingly our concern is how do we keep the factories operating so we can pay people and not go bankrupt.”
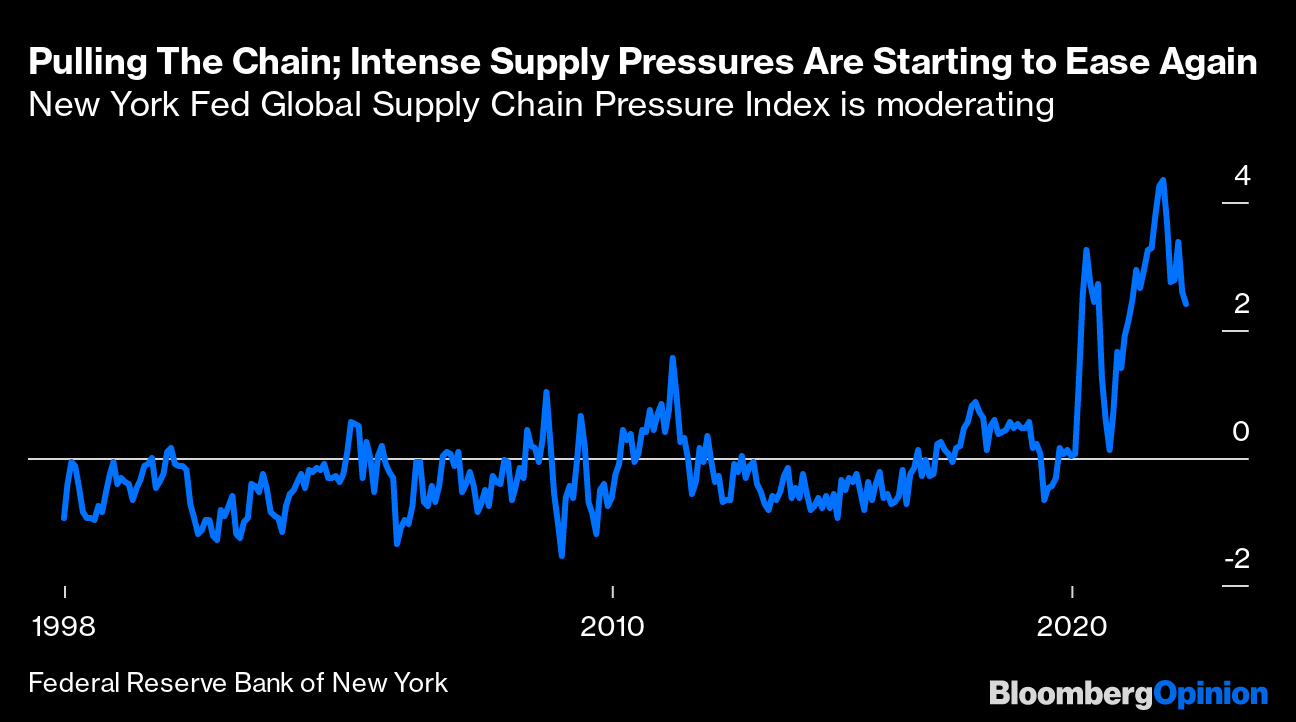
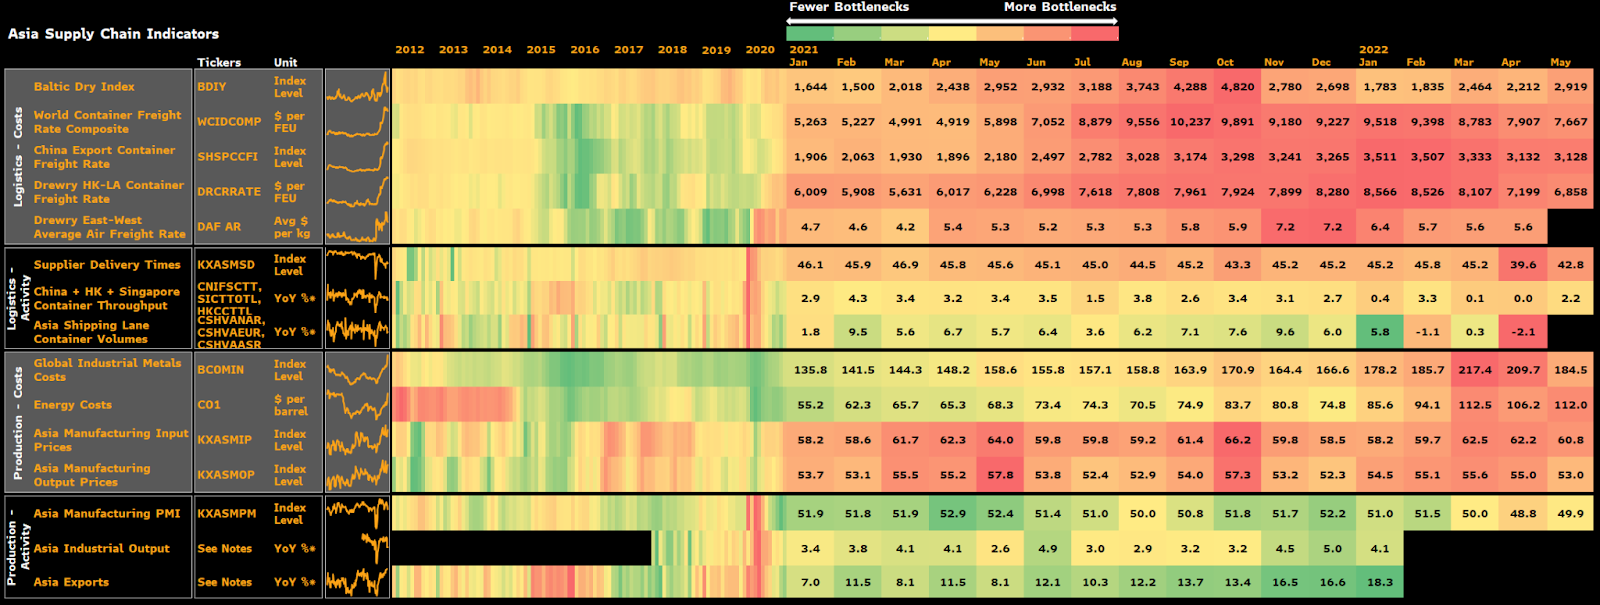
Graphic: Via Bloomberg. “Supply chains in Asia look to be on the mend,” though it will “ take a while for supply and demand to rebalance.”
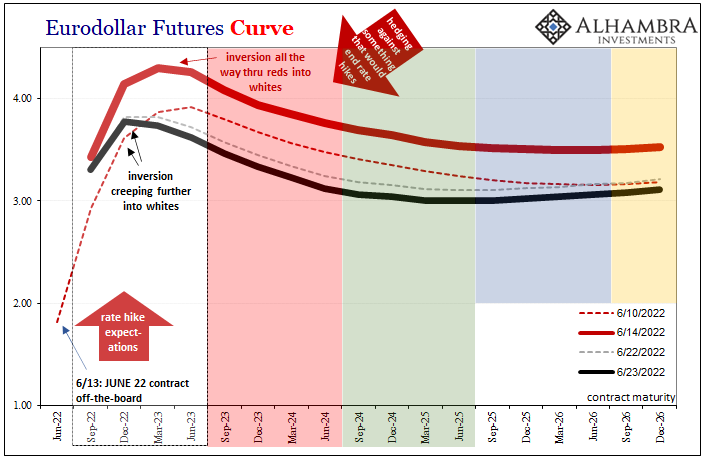
It’s a global move into recession all at once, as Jeffrey Snider of Alhambra Investments says.
“Combine the potential for break in repo collateral with economy heading toward recession, no wonder the Euro[dollar] curve inversion is spreading as rapidly as it has. Possibility of something big going wrong, therefore ending rate hikes, is huge now.”
“Euro[dollar] squeeze, collateral shortage, deflationary potential in money, and now demand destruction in global real economy.”
Graphic: Via Alhambra Investments.
Over the last four decades, monetary policy was a go-to for supporting the economy. Money was sent to capital and that promoted innovation and, by that token, deflation, ultimately creating “unimportance to cash flows,” as well put by Kai Volatility’s Cem Karsan.
Now, there’s a strong commitment to reducing liquidity and credit, all the while there are chokepoints monetary policymakers have little control over.
This has consequences on the real economy and asset prices, accordingly, which rose and kept deflationary pressures at bay. A stock market drop is both a recession and a direct reflection of the unwind of carry. It is the manifestation of a deflationary shock, and today’s poor sentiments and economic data reflects this.
At the same time, “bonds are not acting as a hedge and appear to be becoming less ‘money’ like due persistent declines in price and elevated rate vol,” as Joseph Wang puts it.
Bank deposits are to drain about $1 trillion or so by year-end, prompting investors to “continue to lower their selling prices to compete for the cash they want.”
Retail buyers, who, according to Michael Wang of Prometheus Alternative Investments, “were a significant driver of the inflated valuations we saw in tech and crypto,” are capitulating in stocks, all the while froth in housing markets is soon to abate, likewise.
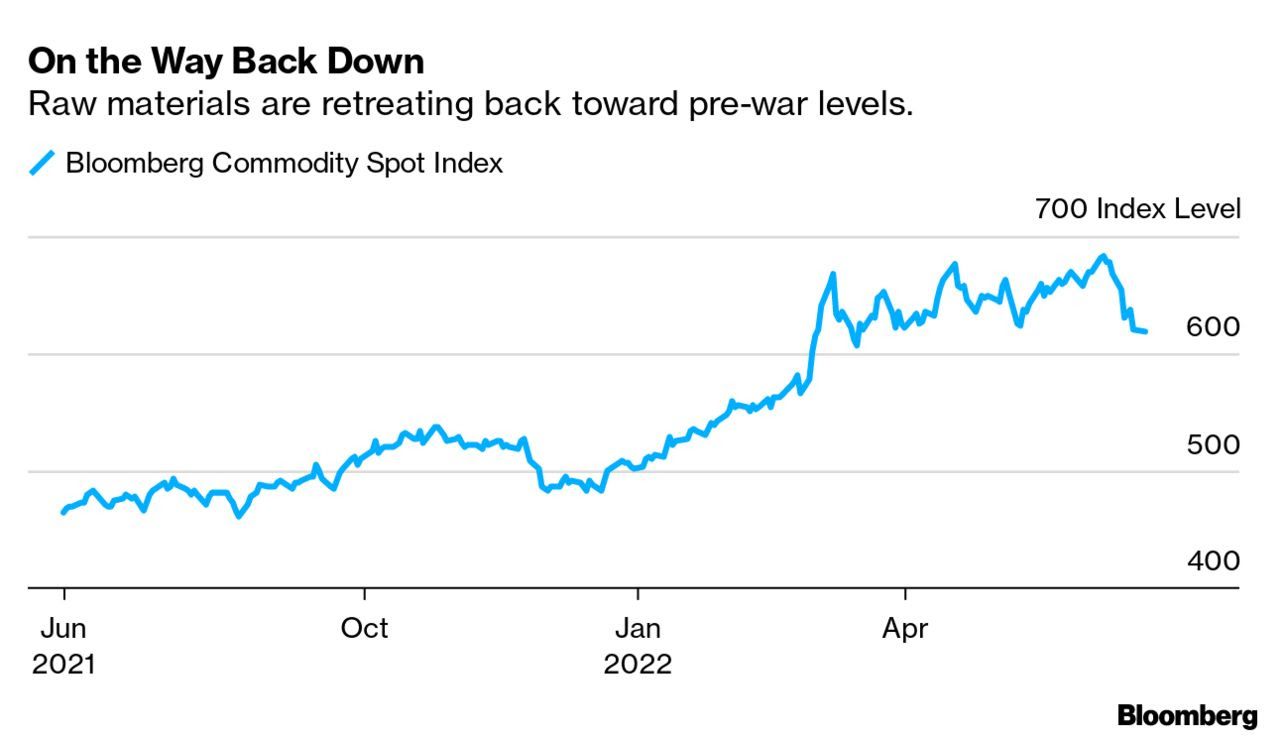
Notwithstanding, Mark Zandi of Moody’s Corporation (NYSE: MCO) does not see “the kind of mortgage defaults and distressed sales that would be necessary for big declines in housing values,” just as prices of raw materials are retreating as inventories are bloating.
As put forth, partially, earlier this week, one has to wonder about the likelihood that inflation is near its high and whether the de-rates have played their course.
Let’s keep an open mind and follow up on this, in detail, next week.
Graphic: Via Bloomberg. “The hot commodities rally is cooling off fast as recession fears again ground and cloud the outlook for demand.”
Positioning: Keeping this section short.
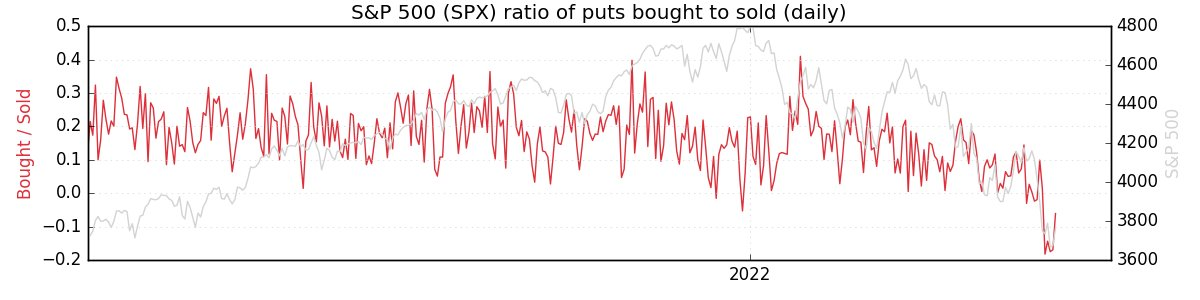
As stated yesterday, a feature of the equity sell-off is the suppression of implied volatility (IVOL) versus that which the market realizes (RVOL) given that participants are hedged and volatility remains in strong supply.
Options data and insights platform SqueezeMetrics explained that this is due in part to lower leverage, too.
“Leveraged long S&P lost favor (understandable), and marginal demand for puts went with it. Creeping into net selling territory is ‘smart’ bear market positioning. Short delta, short skew.”
As I said in SpotGamma’s note, last night, given “the high starting point in IVOL, as well as its place in relation to [RVOL], it makes sense to own structures that benefit either from sharp changes in underlying price or an abrupt repricing in volatility.”
Cutting into the realization of a sharp change in underlying price or a far-reaching rally, however, are short-volatility bets across shorter maturity periods (and the associated hedging), as well as big (and popularized) positions set to roll off at the quarter-end.
Liquidity providers, per SpotGamma, all else equal, will have to sell to re-hedge, and we will talk about this further, next week.
Graphic: Taken 6/22/2022. SpotGamma’s Hedging Impact of Real-Time Options (HIRO) indicator points to selling of put and call options in the S&P 500 (INDEX: SPX) and S&P 500 ETF (SPY). Those liquidity providers, who are on the other side, are more exposed to long volatility, which they hedge by buying (selling) into weakness (strength) underlying.
Technical: As of 6:40 AM ET, Friday’s regular session (9:30 AM – 4:00 PM ET), in the S&P 500, will likely open in the upper part of a positively skewed overnight inventory, outside of prior-range and -value, suggesting a potential for immediate directional opportunity.
In the best case, the S&P 500 trades higher; activity above the $3,821.50 LVNode puts in play the $3,843.00 RTH High. Initiative trade beyond the RTH High could reach as high as the $3,911.00 VPOC and $3,943.25 HVNode, or higher.
In the worst case, the S&P 500 trades lower; activity below the $3,821.50 LVNode puts in play the $3,793.25 ledge. Initiative trade beyond the ledge could reach as low as the $3,770.75 HVNode and $3,735.75 HVNode, or lower.
Click here to load today’s key levels into the web-based TradingView charting platform. Note that all levels are derived using the 65-minute timeframe. New links are produced, daily.
Graphic: 65-minute profile chart of the Micro E-mini S&P 500 Futures.
Considerations: Recent trade has been lackluster and the overnight break is the most bullish happening in weeks. The go-to trade this week was short volatility. Participants responded to tests of key visual areas, and sold options, particularly in shorter maturities.
In the coming session(s), some of those participants will respond to the break in a manner that bolsters the initiative drive. Notwithstanding, the key to watch for is whether participants will use the bump as an opportunity to add to their most recent short volatility bets against the direction.
Ultimately, the more time that is spent outside of the prior consolidation area, the likelihood that the breakout is a signal to look for dips to buy and play rotations to key areas up above.
Definitions
Volume Areas: A structurally sound market will build on areas of high volume (HVNodes). Should the market trend for long periods of time, it will lack sound structure, identified as low volume areas (LVNodes). LVNodes denote directional conviction and ought to offer support on any test.
If participants were to auction and find acceptance into areas of prior low volume (LVNodes), then future discovery ought to be volatile and quick as participants look to HVNodes for favorable entry or exit.
POCs: POCs are valuable as they denote areas where two-sided trade was most prevalent in a prior day session. Participants will respond to future tests of value as they offer favorable entry and exit.
Balance-Break + Gap Scenarios: A change in the market (i.e., the transition from two-time frame trade, or balance, to one-time frame trade, or trend) is occurring.
Monitor for acceptance (i.e., more than 1-hour of trade) outside of the balance area.
Leaving value behind on a gap-fill or failing to fill a gap (i.e., remaining outside of the prior session’s range) is a go-with indicator.
Rejection (i.e., return inside of balance) portends a move to the opposite end of the balance.
About
After years of self-education, strategy development, mentorship, and trial-and-error, Renato Leonard Capelj began trading full-time and founded Physik Invest to detail his methods, research, and performance in the markets.
Capelj also develops insights around impactful options market dynamics at SpotGamma and is a Benzinga reporter.
In no way should the materials herein be construed as advice. Derivatives carry a substantial risk of loss. All content is for informational purposes only.
The daily brief is a free glimpse into the prevailing fundamental and technical drivers of U.S. equity market products. Join the 300+ that read this report daily, below!
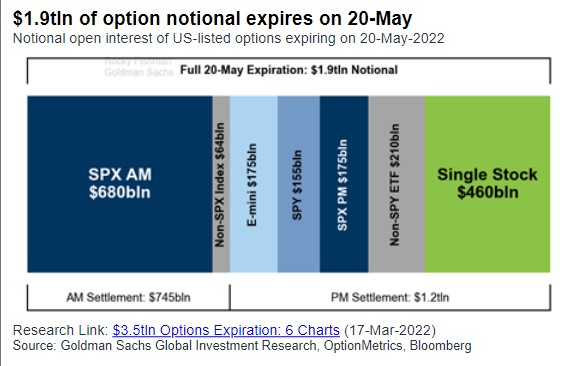
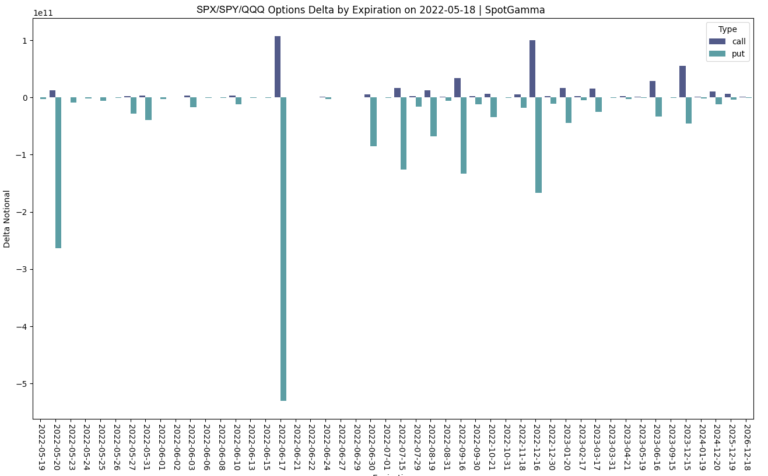
Ahead of a $1.9 trillion options expiration, which we unpack later in the letter, the equity index and commodity futures, as well as yields, were bid.
This activity was on the heels of good news coming from overseas. China lowered prime rates on the five-year by a record to boost mortgages and loans amid an ongoing pandemic slump.
In other news, China warned the U.S. over a ‘dangerous situation’ forming over Taiwan, and the U.S. is set to block Russian debt payments, raising concerns of default.
This is as Russian forces, per Michael Horowitz of Le Beck Int’l, broke “Ukrainian defenses west of Popasna in the Donbass, … a tactical success for Russia, the first in a very long time.”
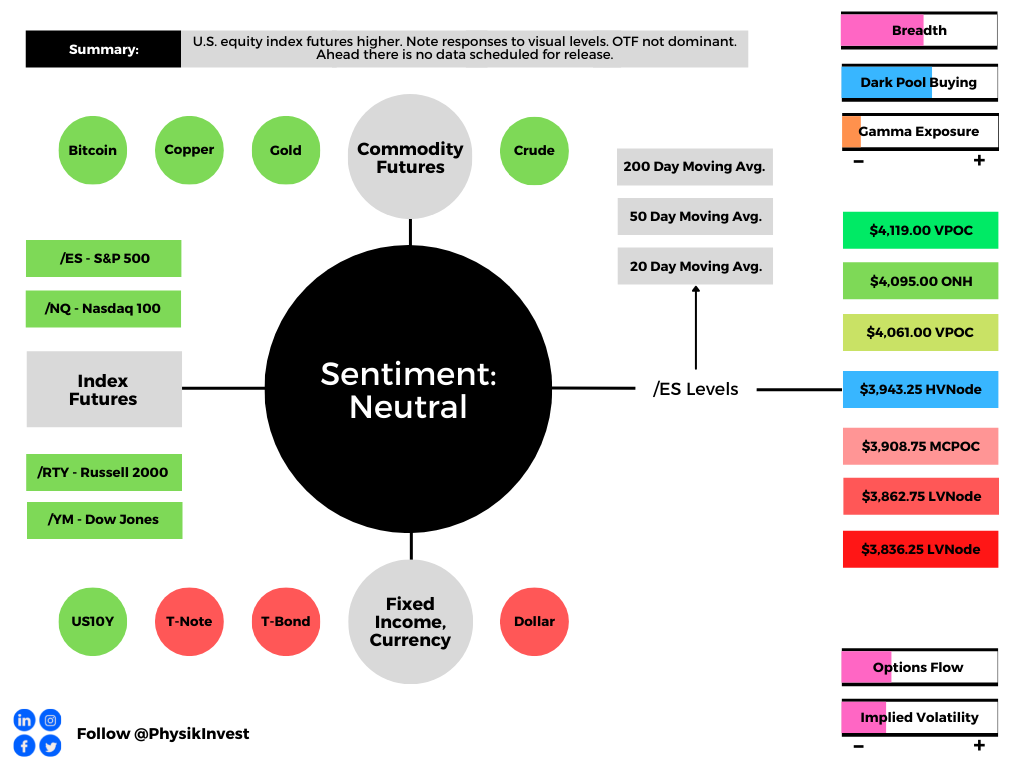
Ahead, there is no data scheduled for release. Enjoy your Friday!
Graphic updated 6:30 AM ET. Sentiment Neutral if expected /ES open is inside of the prior day’s range. /ES levels are derived from the profile graphic at the bottom of the following section. Levels may have changed since initially quoted; click here for the latest levels. SqueezeMetrics Dark Pool Index (DIX) and Gamma (GEX) calculations are based on where the prior day’s reading falls with respect to the MAX and MIN of all occurrences available. A higher DIX is bullish. At the same time, the lower the GEX, the more (expected) volatility. Learn the implications of volatility, direction, and moneyness. SHIFT data used for S&P 500 (INDEX: SPX) options activity. Note that options flow is sorted by the call premium spent; if more positive, then more was spent on call options. Breadth reflects a reading of the prior day’s NYSE Advance/Decline indicator. VIX reflects a current reading of the CBOE Volatility Index (INDEX: VIX) from 0-100.
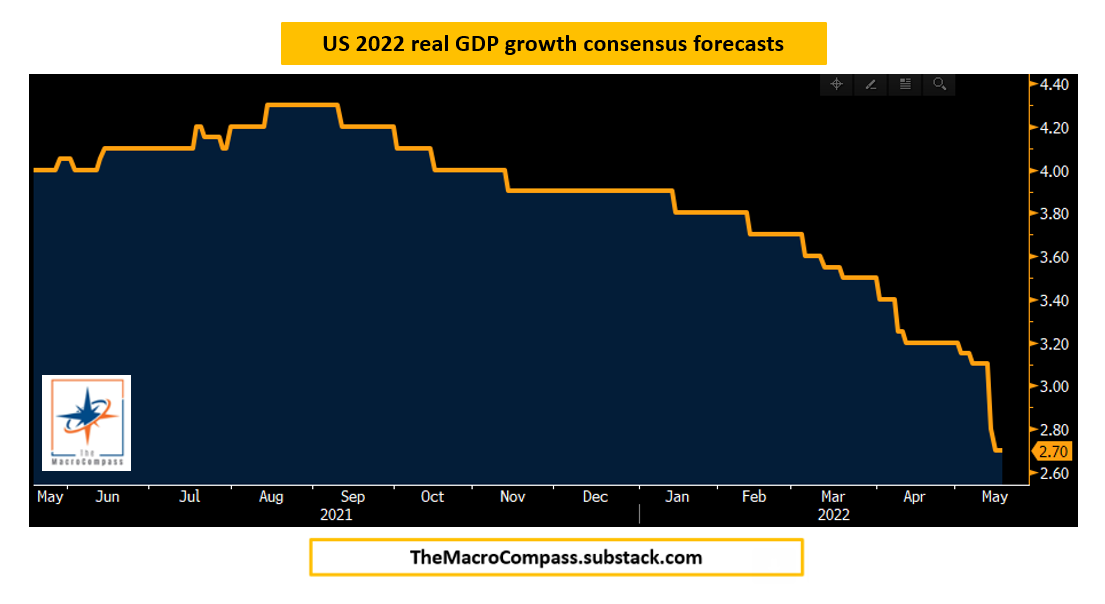
Moody’s Corporation’s (NYSE: MCO) Mark Zandi explains “the odds that the economy will suffer a downturn beginning in the next 12 months at one in three with uncomfortable near-even odds of a recession in the next 24 months.”
Graphic: Via The Macro Compass. “Analyst consensus for the 2022 US real GDP growth has been consistently revised down this year.”
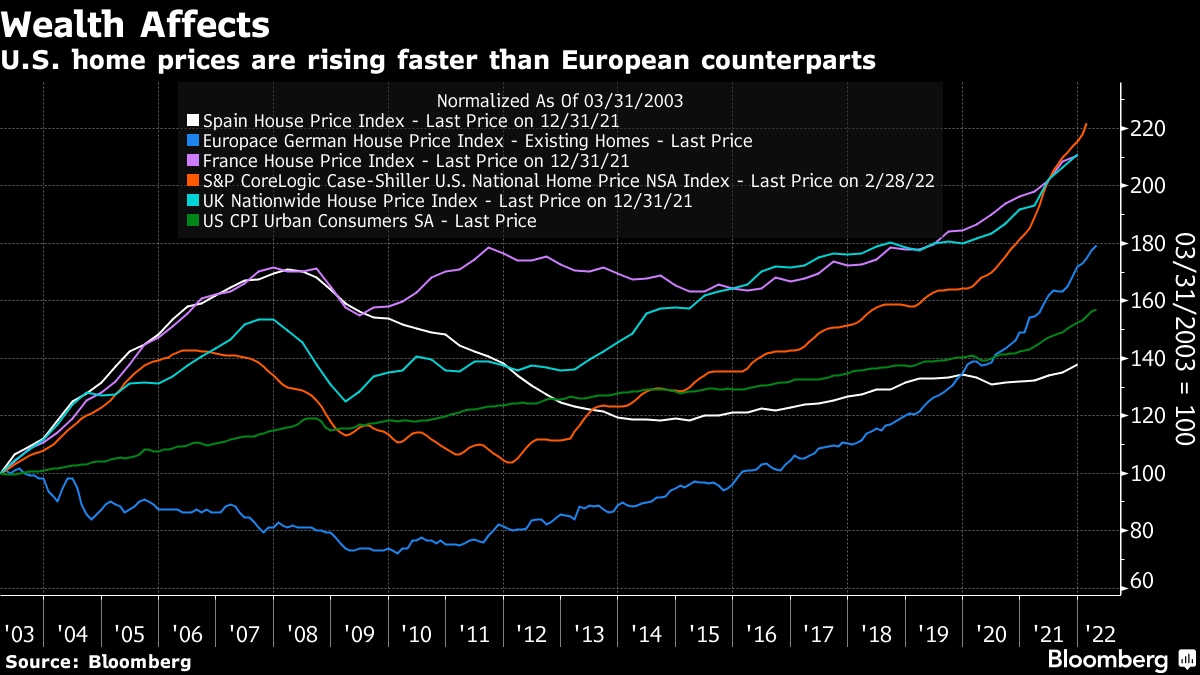
Per Bloomberg’s John Authers, U.S. housing is slowing down in the context of still-heightened sales. Data on home building suggests builders “aren’t running scared” while chokepoints still are feeding into support for house prices.
“Now, with inflation rising, the Fed is more concerned about wealth effects,” Authers explained.
“The rise in asset prices has made a lot of people wealthier and encouraged them to spend accordingly. It’s also stoked inequality. A fall in home values would be helpful at this point,” and it’s something the Fed is keen on “pursuing,” as talked about in letters earlier this week.
Positioning: Friday marks the roll off of $460 billion of derivatives across single stocks and $855 billion of S&P 500-linked contracts, according to a Bloomberg report quoting Goldman Sachs Group Inc (NYSE: GS) research.
Graphic: Via Goldman Sachs Group Inc. Taken from Bloomberg.
Into this event, participants are hedged and volatility remains well-supplied, due in part to suppressive volatility selling, as well as passive flows supporting the largest index constituents.
Consequently, the market’s descent has been orderly and not exacerbated by the demand for hedges and associated repricings of volatility.
This was expected, per Kai Volatility Cem Karsan’s commentary published in December 2021.
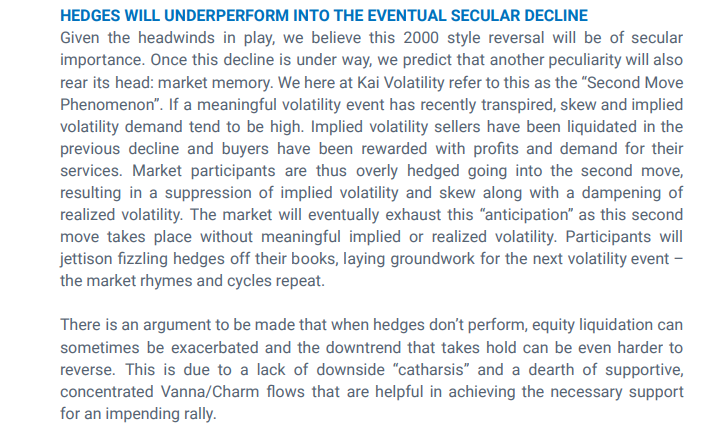
“If a meaningful volatility event has recently transpired [e.g., COVID-19], implied volatility demand tends to be high,” as sellers of it were liquidated in previous declines and “buyers have been rewarded with profits and demand for their services.”
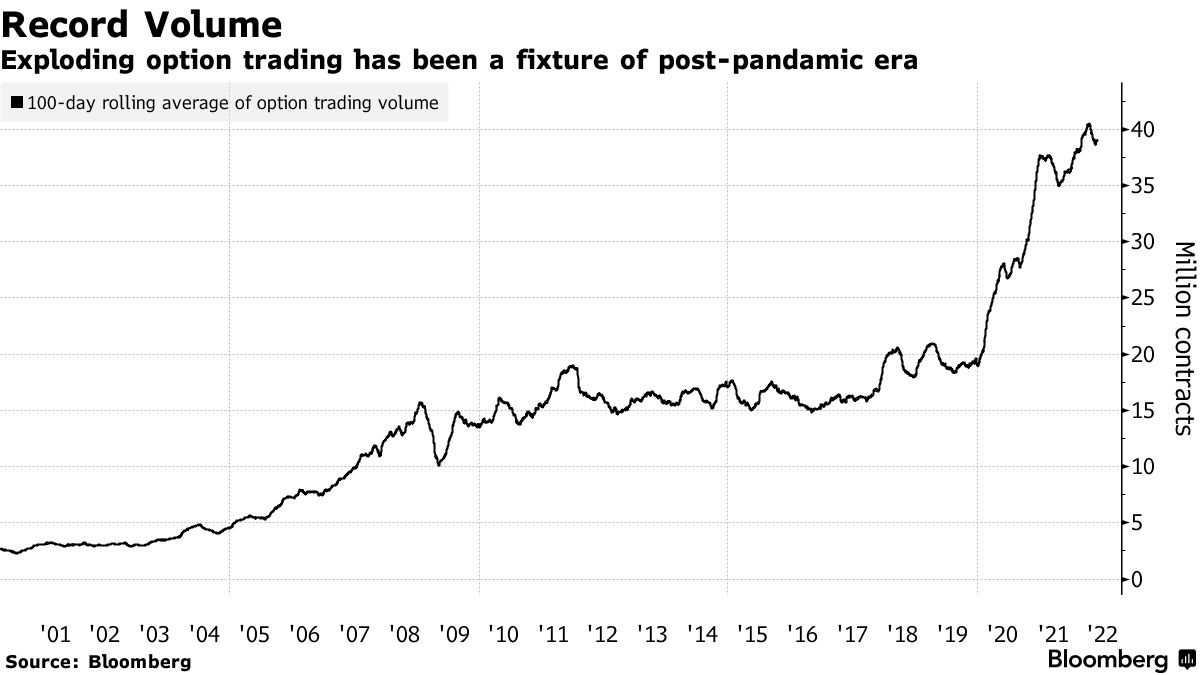
Graphic: Via Bloomberg. “2022 is shaping up to be the busiest year for option trading. Almost 40 million contracts have changed hands daily on average, 6% above last year’s record, data compiled by Bloomberg show.”
“Market participants are thus overly hedged going into the second move, resulting in the suppression of implied volatility and skew along with a dampening of realized volatility.”
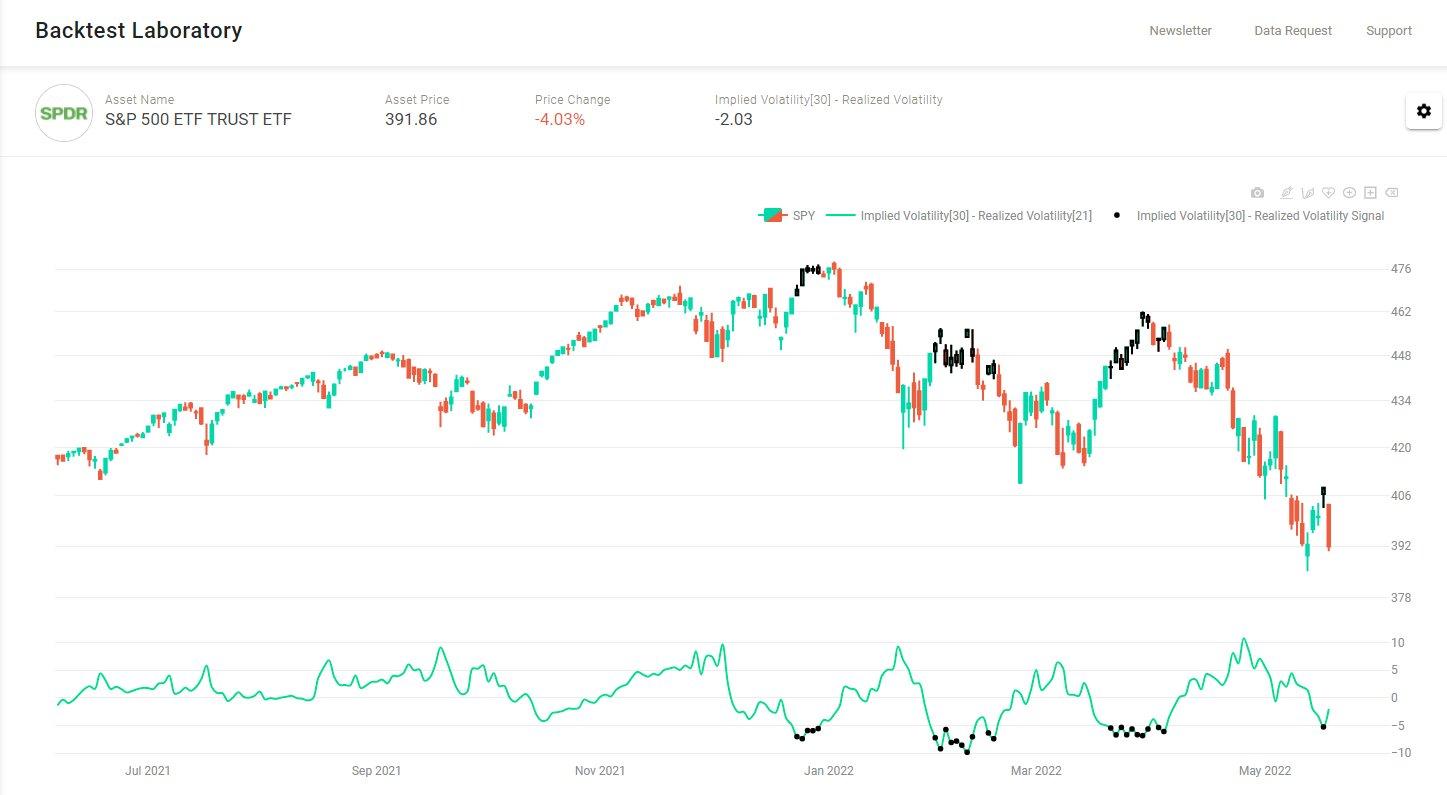
Given the aforementioned supply and demand dynamic, as well as illiquidity, we continue to observe a “divergence in the volatility (movement of underlying equity market up and down) realized, versus that which is implied by options activity,” SpotGamma says.
Graphic: Via @ftx_chris. “The relationship between illiquidity & volatility is a critical market driver for traditional markets now. In simple terms: lower liquidity creates increased volatility.”
“For some of these reasons – tempered measures of implied volatility – the market’s missing a lot of the ‘stored energy’ or ‘vanna fuel’ that’s helped support it in past periods of turmoil.”
Graphic: Via @HalfersPower. “1 day return distribution when QQQ ROC[1] > 3.7%. Historically you can expect the weakest relative mean forward returns, and second-highest mean realized volatility amongst deciles.”
So, barring changes in fundamentals, the catalysts to a potential rally are few and far between, and we elaborated on this in an earlier commentary.
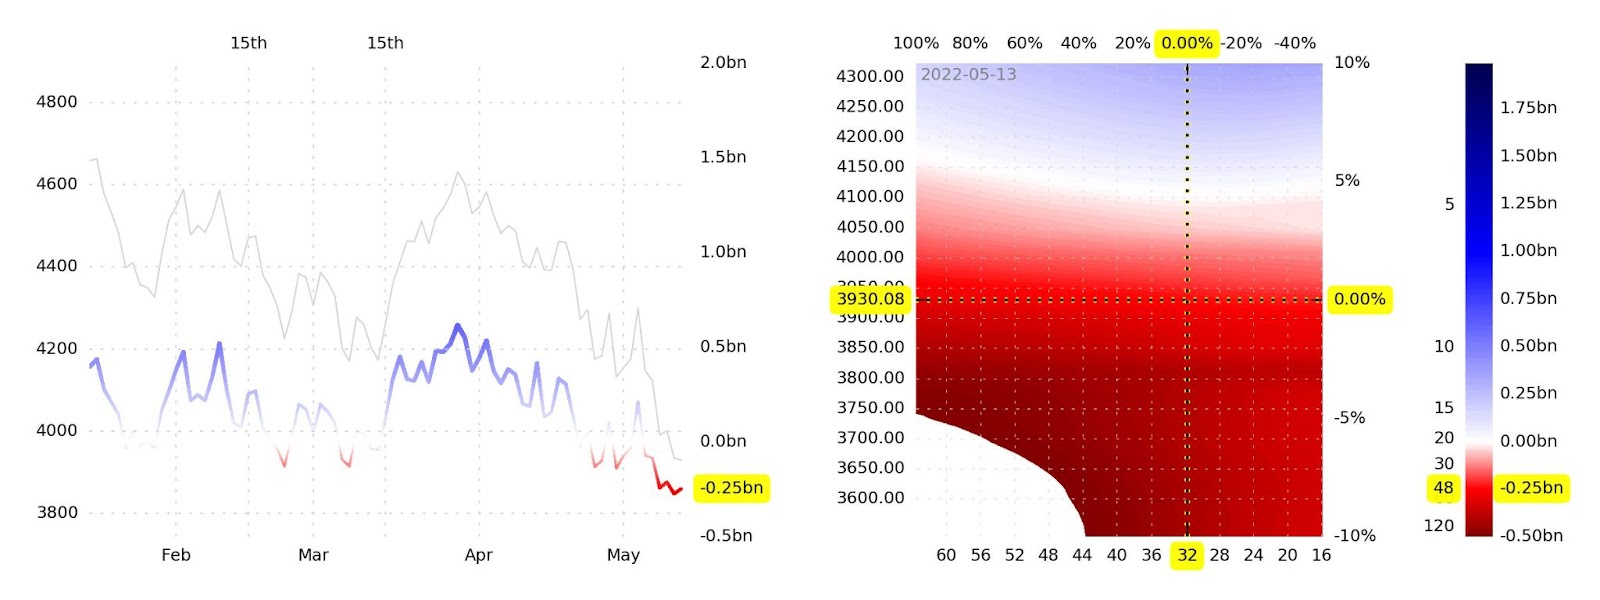
Graphic: Via SqueezeMetrics. Updated May 13, 2022. “VIX compressing to 30 on a modest pre-market rally with dealer gamma exposure more negative than it’s been in years is not how you get sustained rallies—it’s how you get energy for bigger downside moves.”
Heading into Friday, Bloomberg quotes the $4,000.00 S&P 500 (INDEX: SPX) strike having “93,000 open positions set to run out, … includ[ing] 41,024 calls and 52,269 puts.”
Graphic: Via SpotGamma.
An open well below $4,000.00 means that this expiration will coincide with the removal of a lot of in-the-money put-delta. That means, post-expiration, per SpotGamma, “market makers will be free to buy back stocks to cover the short exposures that are no longer needed.”
“Any ultimate rally off of Opex, we’d consider to be short covering, and subject to swift reversals into the end of next week.”
Technical: As of 6:30 AM ET, Friday’s regular session (9:30 AM – 4:00 PM ET), in the S&P 500, will likely open in the upper part of a positively skewed overnight inventory, just inside of prior-range and -value, suggesting a limited potential for immediate directional opportunity.
In the best case, the S&P 500 trades higher; activity above the $3,943.25 high volume area (HVNode) puts in play the $4,061.00 untested point of control (VPOC). Initiative trade beyond the VPOC could reach as high as the $4,095.00 overnight high (ONH) and $4,119.00 VPOC, or higher.
In the worst case, the S&P 500 trades lower; activity below the $3,943.25 HVNode puts in play the $3,908.75 micro composite point of control (MCPOC). Initiative trade beyond the MCPOC could reach as low as the $3,862.75 and $3,836.25 low volume areas (LVNodes), or lower.
Click here to load today’s key levels into the web-based TradingView charting platform. Note that all levels are derived using the 65-minute timeframe. New links are produced, daily.
Graphic: 65-minute profile chart of the Micro E-mini S&P 500 Futures.
Considerations: Push-and-pull, as well as responsiveness near key-technical areas (discernable visually on a chart), suggests technically-driven traders with shorter time horizons are (becoming) active.
Such traders often lack the wherewithal to defend retests.
Large participants (who often move by committee) seldom respond to key technical inflections. It is their activity that often results in poor reliability of our technical levels.
Sometimes, the better trade is to wait for the larger participants’ entry and use the expansion of the range as a confirmation of a new trend.
Definitions
Overnight Rally Highs (Lows): Typically, there is a low historical probability associated with overnight rally-highs (lows) ending the upside (downside) discovery process.
Volume Areas: A structurally sound market will build on areas of high volume (HVNodes). Should the market trend for long periods of time, it will lack sound structure, identified as low volume areas (LVNodes). LVNodes denote directional conviction and ought to offer support on any test.
If participants were to auction and find acceptance into areas of prior low volume (LVNodes), then future discovery ought to be volatile and quick as participants look to HVNodes for favorable entry or exit.
POCs: POCs are valuable as they denote areas where two-sided trade was most prevalent in a prior day session. Participants will respond to future tests of value as they offer favorable entry and exit.
MCPOCs: POCs are valuable as they denote areas where two-sided trade was most prevalent over numerous day sessions. Participants will respond to future tests of value as they offer favorable entry and exit.
About
After years of self-education, strategy development, mentorship, and trial-and-error, Renato Leonard Capelj began trading full-time and founded Physik Invest to detail his methods, research, and performance in the markets.
Capelj also develops insights around impactful options market dynamics at SpotGamma and is a Benzinga reporter.
In no way should the materials herein be construed as advice. Derivatives carry a substantial risk of loss. All content is for informational purposes only.
The Daily Brief is a free glimpse into the prevailing fundamental and technical drivers of U.S. equity market products. Join the 200+ that read this report daily, below!
Tuesday’s selling came alongside Russia cutting gas to Poland and Bulgaria, Vice President Kamala Harris testing positive for COVID-19, and heavy selling in growth and tech stocks, amid doubts corporate profits can withstand the Federal Reserve’s bid to tame inflation.
As Jerome Schneider of Pacific Investment Management Co says, QT will “have a profound effect on the cost of liquidity and more importantly the cost of transacting business and reallocating assets from one avenue to another avenue.”
“There might not necessarily be a rapid deceleration or decline in the stock market or other risk assets, but there’s going to be a changing cost of capital that this balance sheet is going to be part of.”
After the close, weakness continued. Alphabet Inc (NASDAQ: GOOGL) (NASDAQ: GOOG) missed on slowing sales growth and digital-ad spending. One of the biggest losers was Tesla Inc (NASDAQ: TSLA) which shed 12% or so on news that Elon Musk would use his fortune, much of which is tied up in Tesla, to buy Twitter Inc (NYSE: TWTR).
Germany’s passage of a bigger borrowing budget, coupled with China’s pledge to boost infrastructure bolstered an overnight advance that fed into price action at home. The S&P 500, in particular, for a brief moment, took back a key level, negating much of yesterday’s liquidation.
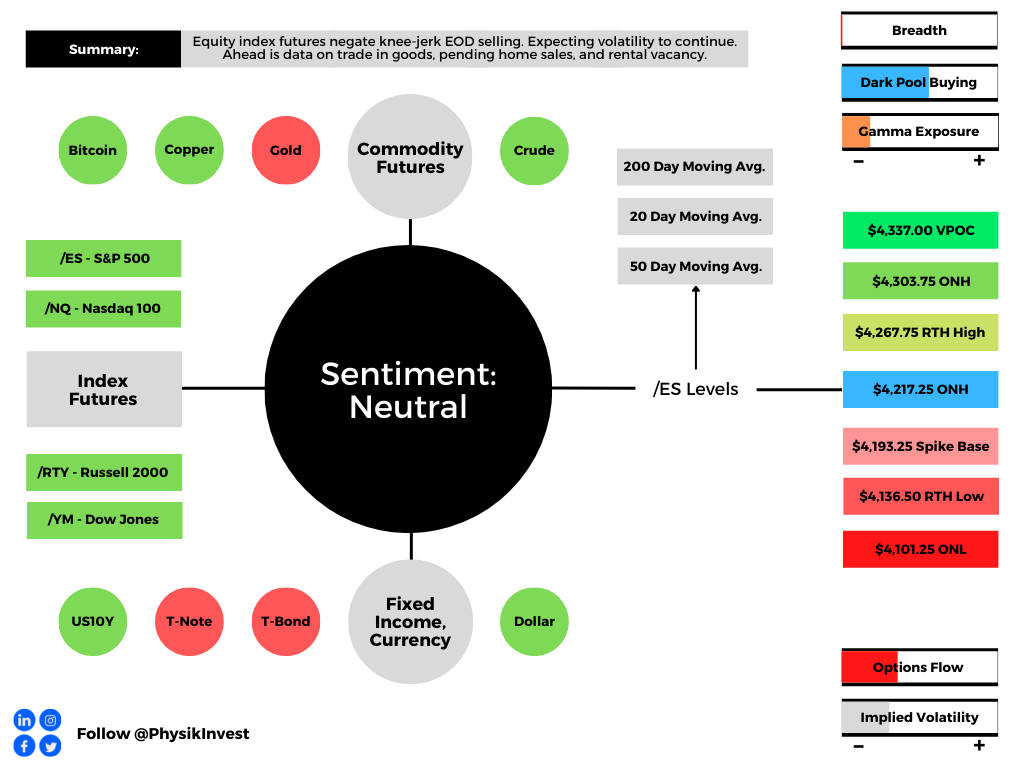
Ahead is data on international trade in goods (8:30 AM ET), as well as pending home sales and the rental vacancy rate (10:00 AM ET).
Graphic updated 7:00 AM ET. Sentiment Neutral if expected /ES open is inside of the prior day’s range. /ES levels are derived from the profile graphic at the bottom of the following section. Levels may have changed since initially quoted; click here for the latest levels. SqueezeMetrics Dark Pool Index (DIX) and Gamma (GEX) calculations are based on where the prior day’s reading falls with respect to the MAX and MIN of all occurrences available. A higher DIX is bullish. At the same time, the lower the GEX, the more (expected) volatility. Learn the implications of volatility, direction, and moneyness. SHIFT data used for S&P 500 (INDEX: SPX) options activity. Note that options flow is sorted by the call premium spent; if more positive, then more was spent on call options. Breadth reflects a reading of the prior day’s NYSE Advance/Decline indicator. VIX reflects a current reading of the CBOE Volatility Index (INDEX: VIX) from 0-100.
What To Expect
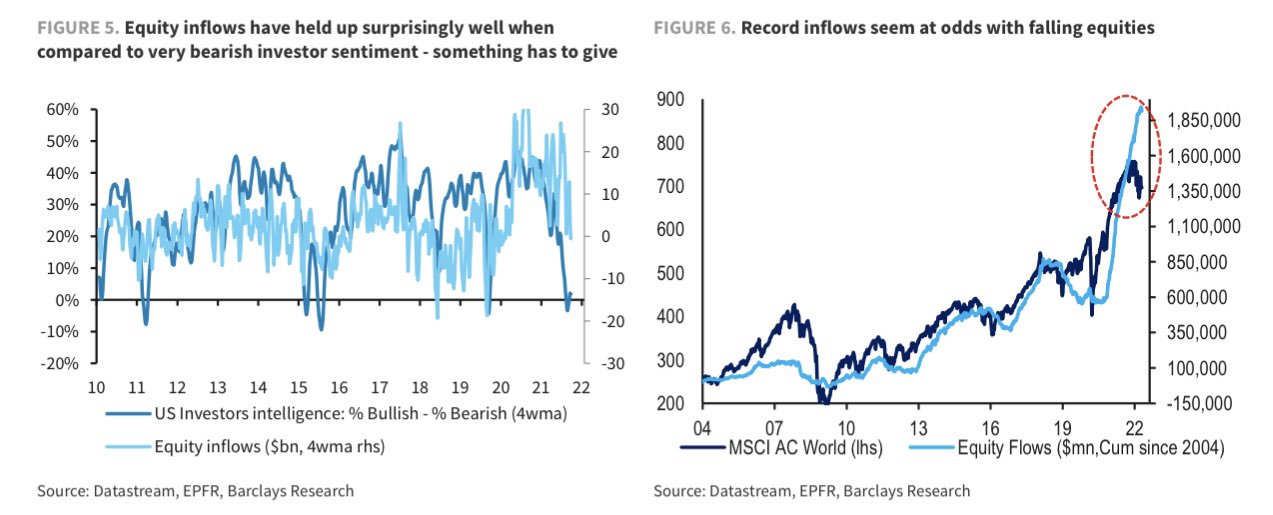
Positioning: Markets are positioned for continued volatility.
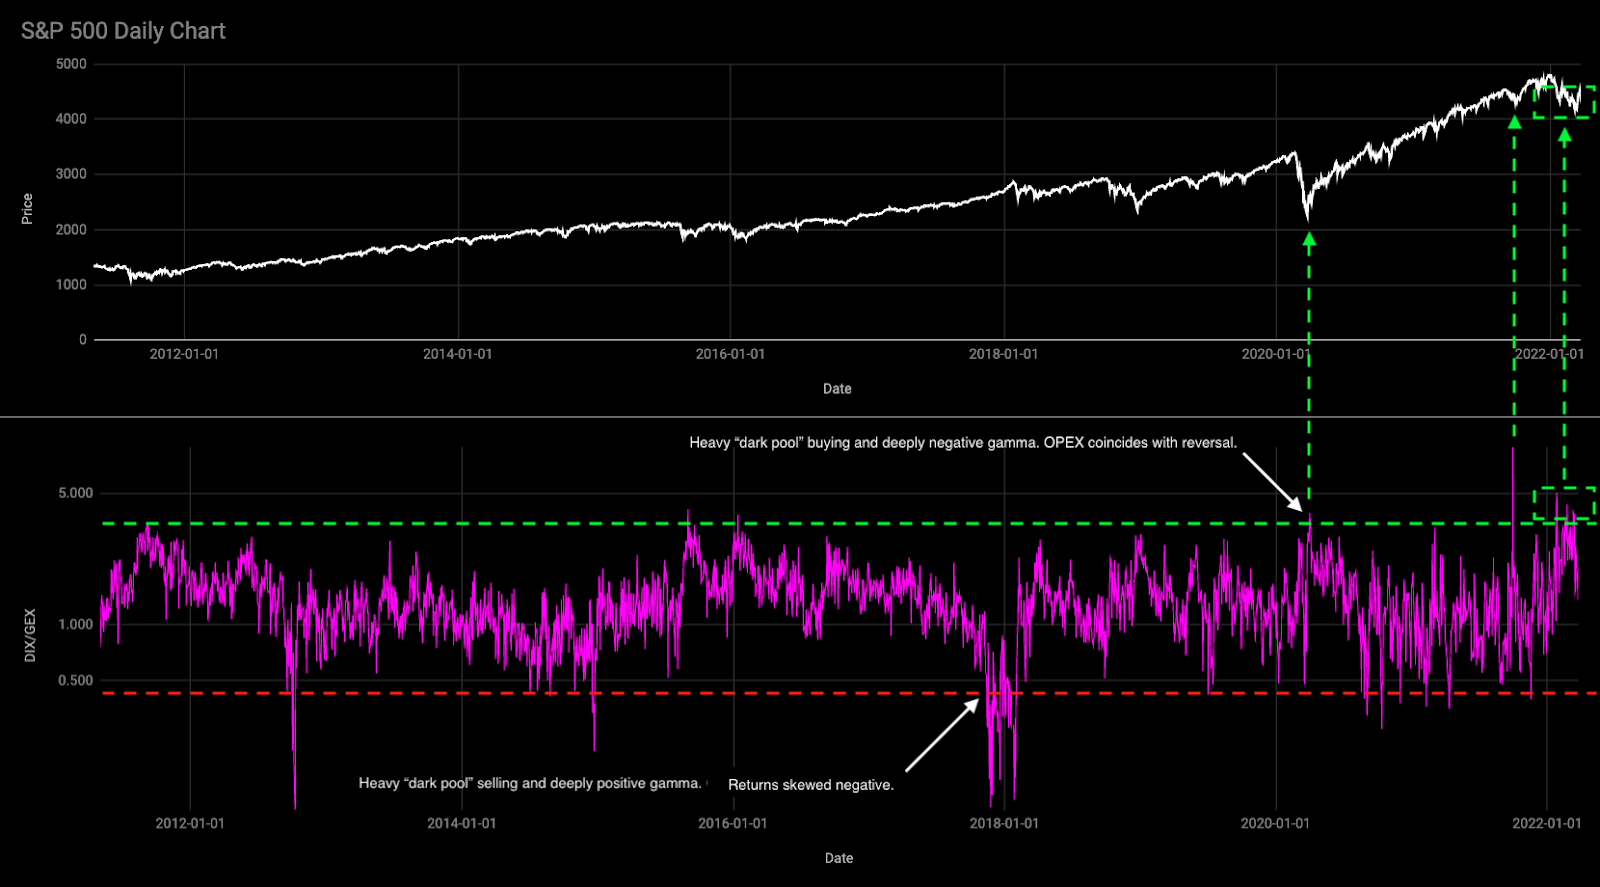
Based on a reading of market gamma exposure (GEX) and buying support (DIX), the returns distribution is skewed positive. There’s buying in the context of an environment in which the hedging of options positioning implies selling into weakness and buying of strength.
Graphic: Via Barclays PLC (NYSE: BCS) research.
In the most simple way that I can explain: when positioning is stretched one way, that often tends to mark a turning point – the returns distribution is either skewed positive or negative.
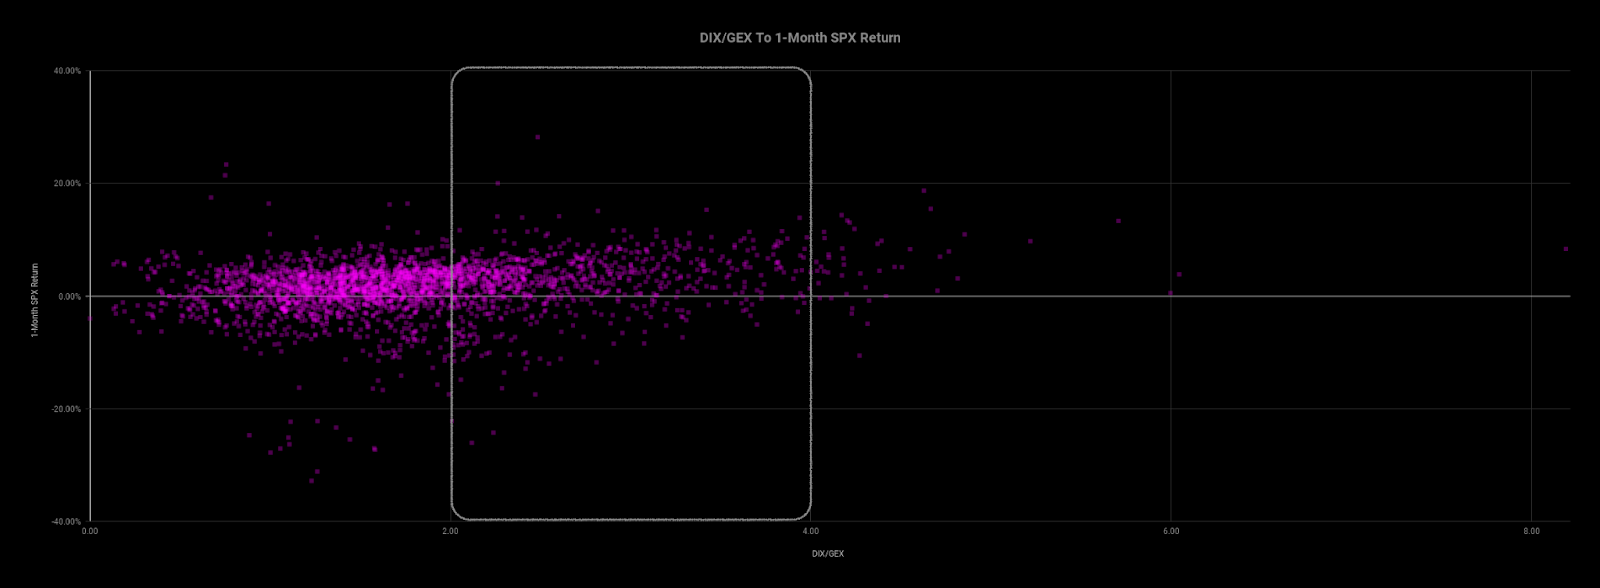
Graphic: Via Physik Invest. Data via SqueezeMetrics. Updated March of 2022. A high DIX/GEX ratio often portends positive 1-month returns.
An updated read, after Tuesday’s weak close, tells us that we can (1) definitely expect larger ranges to continue and (2) potential for short-term bounces.
Based on overnight activity, one of those is happening, now.
Graphic: Via Physik Invest. Data via SqueezeMetrics.
This is as participants are both well-hedged and using weakness as an opportunity to buy into a less highly valued market.
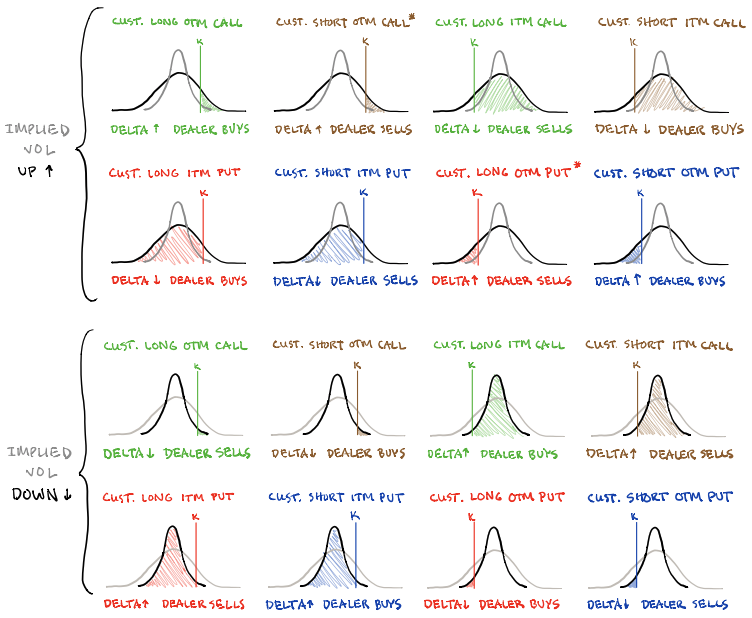
Well-hedged means that customers (i.e., you and I) own protection against long equity exposure. So, that could mean customers own puts and/or are short calls. One of the most dominant flows is the long put, short call.
Such trade offers customers positive, yet asymmetric (gamma), exposure to direction (delta). In other words, negative delta and positive gamma.
The counterparty has exposure to positive delta and negative gamma. If the underlyings trade lower and volatility rises, all else equal, the position will lose. To hedge against these losses, the counterparties will sell underlying into weakness.
If prices reverse and move higher, these counterparties will re-hedge and buy underlying.
Normally, as seen over the bull run of 2020 and 2021, markets are in an uptrend and there’s a strong supply of volatility. Often, customers sell more calls than puts and, in an uptrend, those calls solicit more active hedging than the put options.
Recall that the customer is short the call. That means the counterparty is long the call (a positive delta and gamma trade) and will make money if prices rise, all else equal.
The hedging of this particular exposure (i.e., sell strength, buy weakness), in an uptrend, occurs slower (i.e., counterparts will allow their profits to run), and that’s what can help the market sustain lower volatility trends for longer periods.
When prices reverse and underlyings trade lower, put options solicit increased hedging activity. Given the nature of counterparty exposure to those puts, that hedging happens quickly and can take from market liquidity as to volatility (i.e., buy strength, sell weakness).
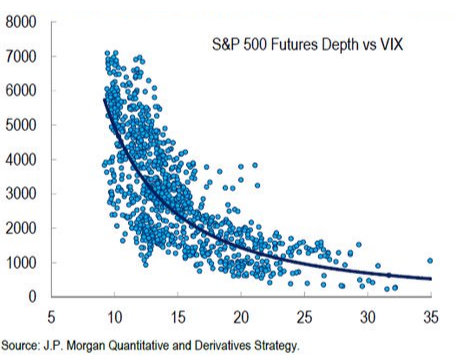
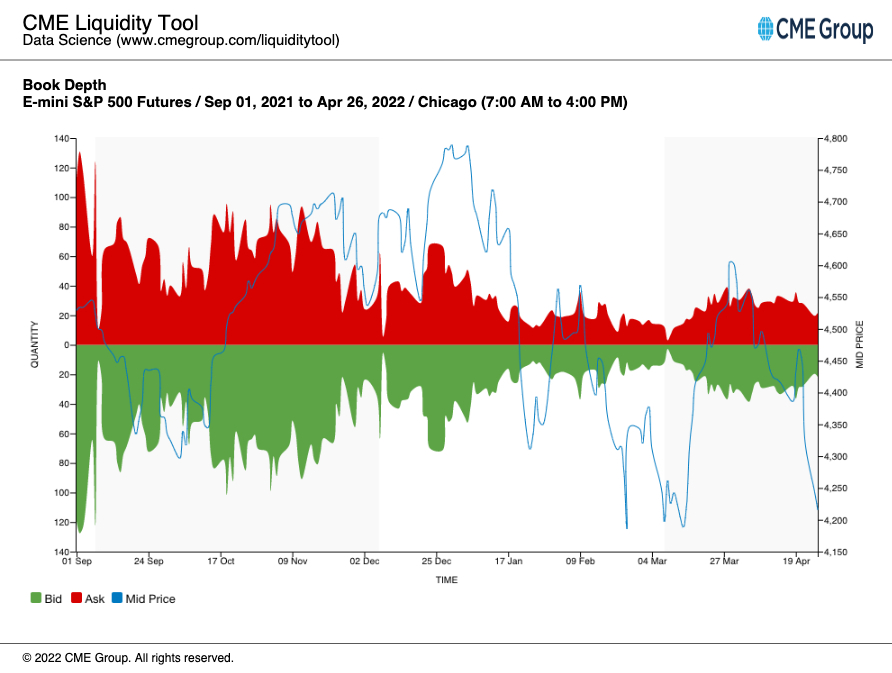
See, below, E-mini S&P 500 book depth, a proxy for market liquidity, and how much it has declined since the end of last year when markets became more volatile and noise around the Federal Reserve’s intent to taper bond-buying and raise rates grew louder.
Graphic: Via CME Group Inc (NASDAQ: CME) Liquidity Tool. Note how in late March, book depth rose as markets rose and customer call activity solicited increased hedging of counterparty long-gamma exposure (i.e., buy weakness, sell strength), adding to market liquidity.
In the above environment, counterparty hedging matters; the market is more sensitive to the flow, so to speak. That sensitivity is expected to continue.
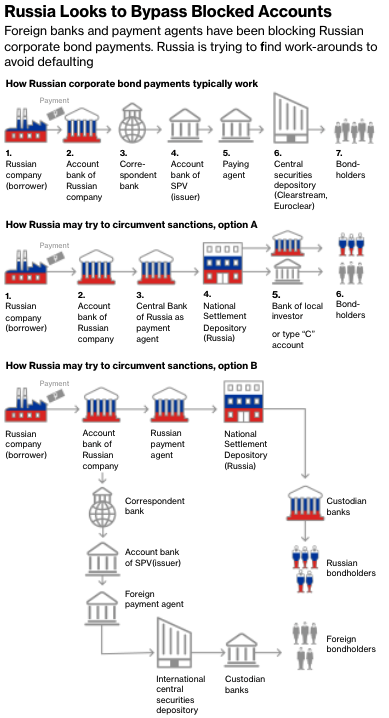
SpotGamma, an options data and analysis service, sees the early May period as pivotal. Then is the Federal Open Market Committee (FOMC) meeting and the potential Russian default, per Moody’s Corporation (NYSE: MCO).
As quoted: “Russia ‘may be considered in default’ if it does not pay two bonds in US dollars by end of a grace period on May 4.”
Until those events are resolved, participants will likely continue to (remain) hedge(d). Upon resolve, customers likely monetize their protection to offset losses on underlying equity exposure.
That means selling volatility which reduces counterparty exposure to short puts (negative gamma and positive delta). To re-hedge, underlying is bought back and that may support a price rise.
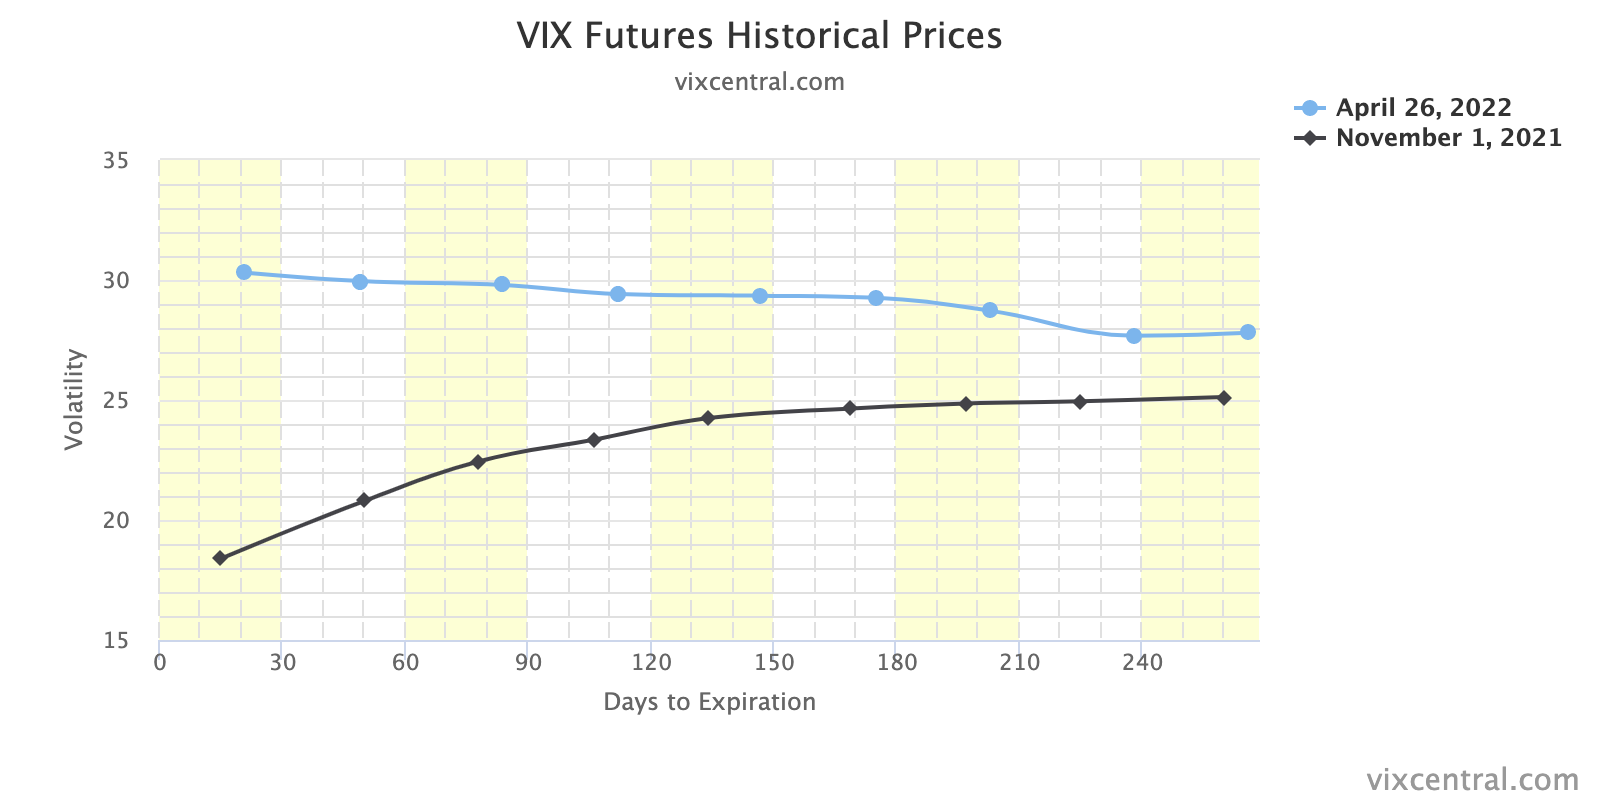
Graphic: VIX term structure via VIX Central. Expansion (higher) solicits counterparty selling which pressures the market lower. Compression (lower) solicits counterparty buying which bolsters attempts higher.
Whether that price rise has legs depends on what the fundamental situation is, then. See the below section titled Considerations for a full technical picture and the most likely turning points.
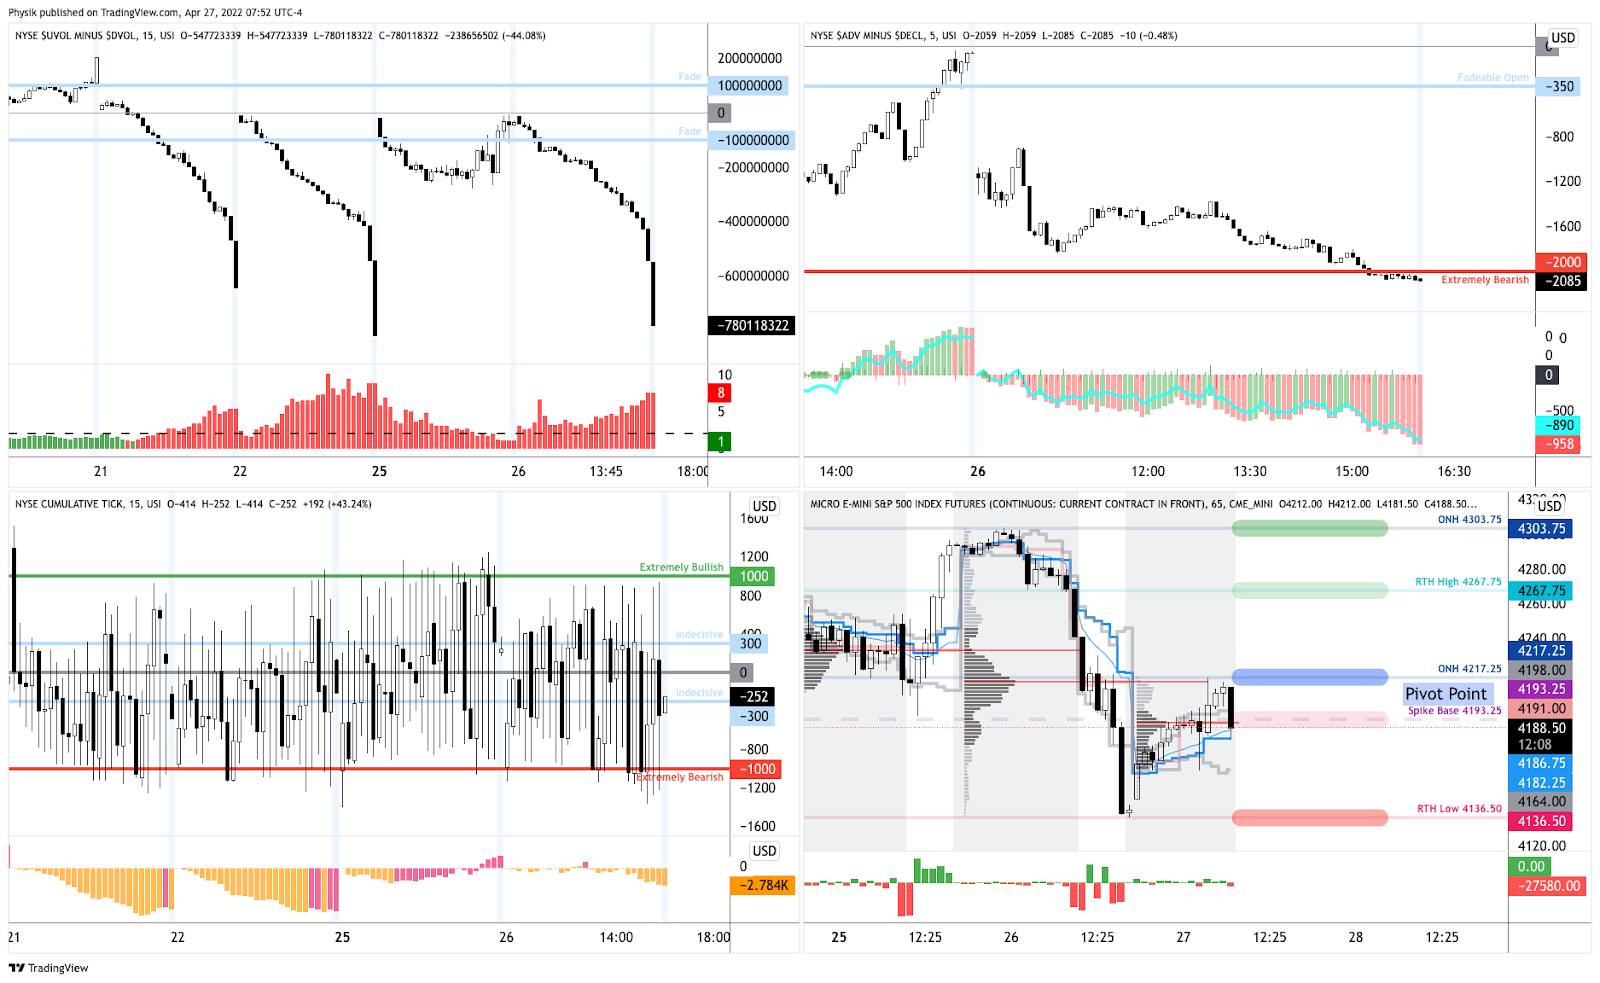
Technical: As of 7:00 AM ET, Wednesday’s regular session (9:30 AM – 4:00 PM ET), in the S&P 500, will likely open in the middle part of a balanced overnight inventory, inside of prior-range and -value, suggesting a limited potential for immediate directional opportunity.
In the best case, the S&P 500 trades higher; activity above the $4,217.25 overnight high (ONH) puts in play the $4,267.75 regular trade high (RTH High). Initiative trade beyond the RTH High could reach as high as the $4,303.75 ONH and $4,337.00 VPOC, or higher.
In the worst case, the S&P 500 trades lower; activity below the $4,217.25 ONH puts in play the $4,193.25 spike base. Initiative trade beyond the spike base could reach as low as the $4,136.50 regular trade low (RTH Low) and $4,101.25 overnight low (ONL), or lower.
Considerations: Spikes mark the beginning of a break from value. Spikes higher (lower) are validated by trade at or above (below) the spike base (i.e., the origin of the spike).
Additionally, the indexes continue to trade below their 20-, 50-, and 200-day simple moving averages, confirming the trend change and bearish tone (further validated by poor breadth).
Graphic: Market Internals as pioneered by (a mentor of mine) Peter Reznicek. Notice the indicator in the top right, weighted S&P sectors (histogram) versus unweighted (blue line). During late last week, participants sold the entire market, heavily (as supported by the difference between the volume flowing into stocks that are up versus those that are down).
All indexes remain, as stated, yesterday, below their volume-weighted average prices (VWAPs) anchored from the start of this year (or their respective peaks).
VWAPs are a metric highly regarded by chief investment officers (CIOs), among other participants, for quality of trade. Liquidity algorithms, too, are benchmarked and programmed to buy and sell around VWAPs.
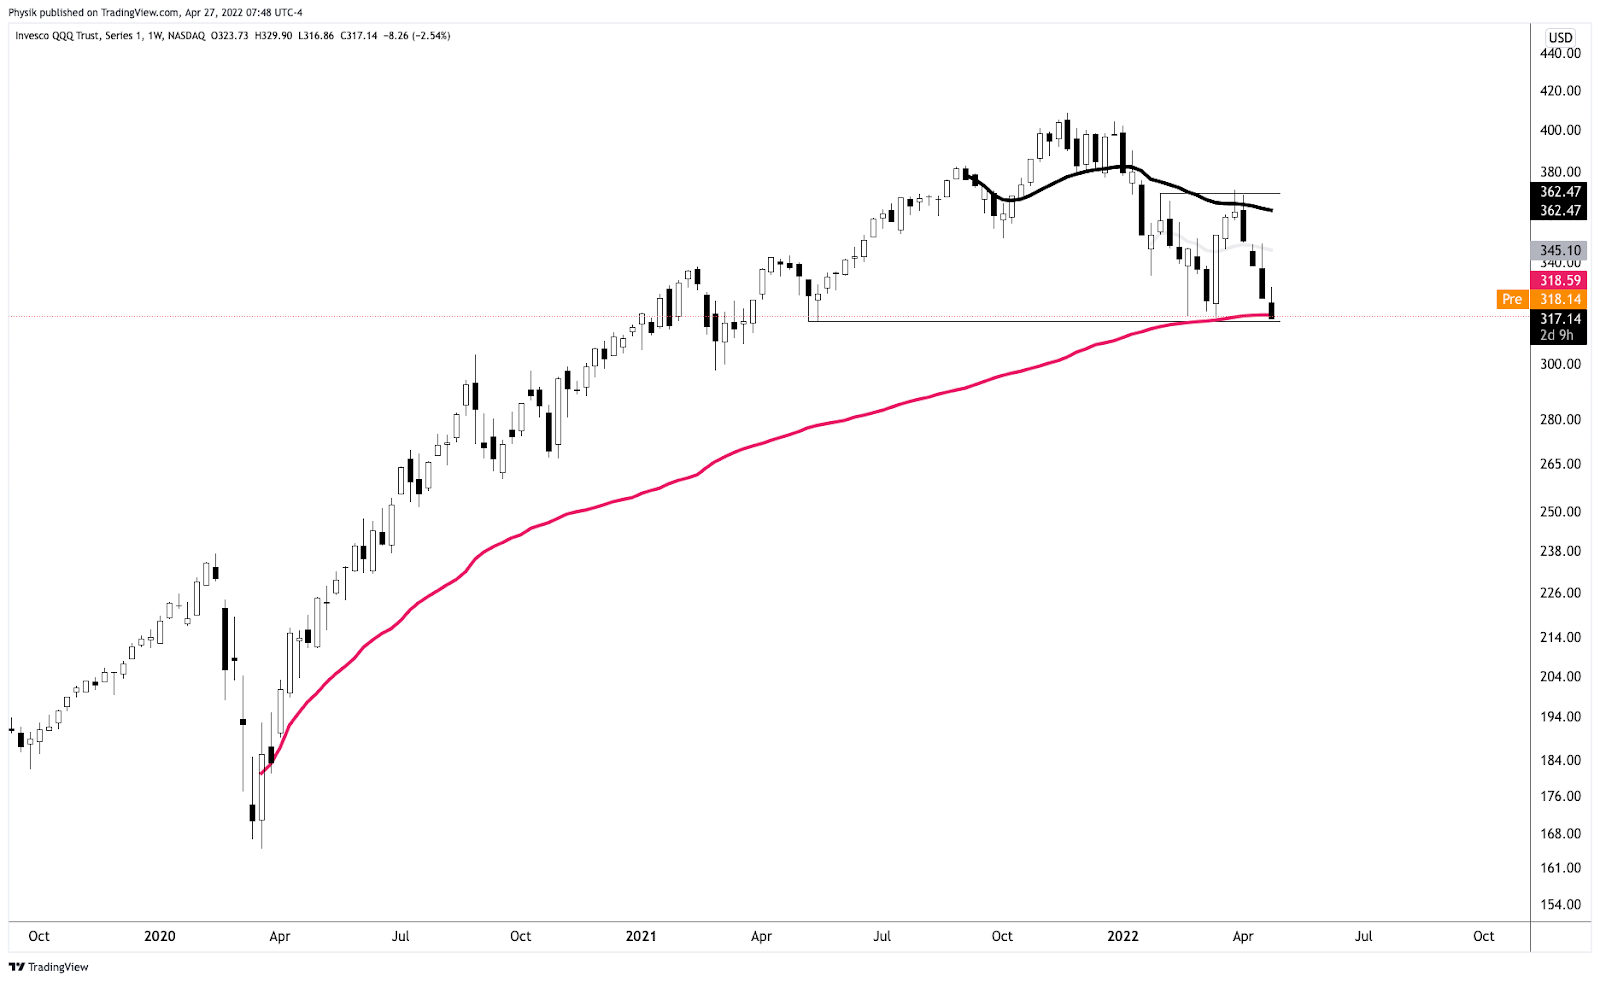
The Invesco QQQ Trust Series 1 (NASDAQ: QQQ) just tested a major VWAP, yesterday, anchored from the lows of March 2020. That’s a fair price to pay for Nasdaq 100 exposure.
Graphic: Invesco QQQ Trust Series 1 (NASDAQ: QQQ) with anchored VWAPs.
Notwithstanding, notice the flat-to-declining AVWAP that’s black in color. So long as prices remain below this level, the index is likely a sell.
Should that level flatten (and begin to rise), and if the QQQ was able to trade above it for a sustained period, there is potential for sustained upside.
Click here to load today’s key levels into the web-based TradingView charting platform. Note that all levels are derived using the 65-minute timeframe. New links are produced, daily.
Graphic: 65-minute profile chart of the Micro E-mini S&P 500 Futures.
Definitions
Overnight Rally Highs (Lows): Typically, there is a low historical probability associated with overnight rally-highs (lows) ending the upside (downside) discovery process.
Volume Areas: A structurally sound market will build on areas of high volume (HVNodes). Should the market trend for long periods of time, it will lack sound structure, identified as low volume areas (LVNodes). LVNodes denote directional conviction and ought to offer support on any test.
If participants were to auction and find acceptance into areas of prior low volume (LVNodes), then future discovery ought to be volatile and quick as participants look to HVNodes for favorable entry or exit.
POCs: POCs are valuable as they denote areas where two-sided trade was most prevalent in a prior day session. Participants will respond to future tests of value as they offer favorable entry and exit.
About
After years of self-education, strategy development, mentorship, and trial-and-error, Renato Leonard Capelj began trading full-time and founded Physik Invest to detail his methods, research, and performance in the markets.
Capelj also develops insights around impactful options market dynamics at SpotGamma and is a Benzinga reporter.
In no way should the materials herein be construed as advice. Derivatives carry a substantial risk of loss. All content is for informational purposes only.
Editor’s Note: The Daily Brief is a free glimpse into the prevailing fundamental and technical drivers of U.S. equity market products. Join the 200+ that read this report daily, below!
Overnight, equity index futures explored lower prices alongside most commodities. Bonds and implied volatility metrics were bid, also.
The narrative is that this is follow-on selling as participants look to price in the implications of COVID-19 lockdowns in China, as well as the Russia-Ukraine conflict. Arguably, there is some pre-Federal Open Market Committee (FOMC) positioning going on, too.
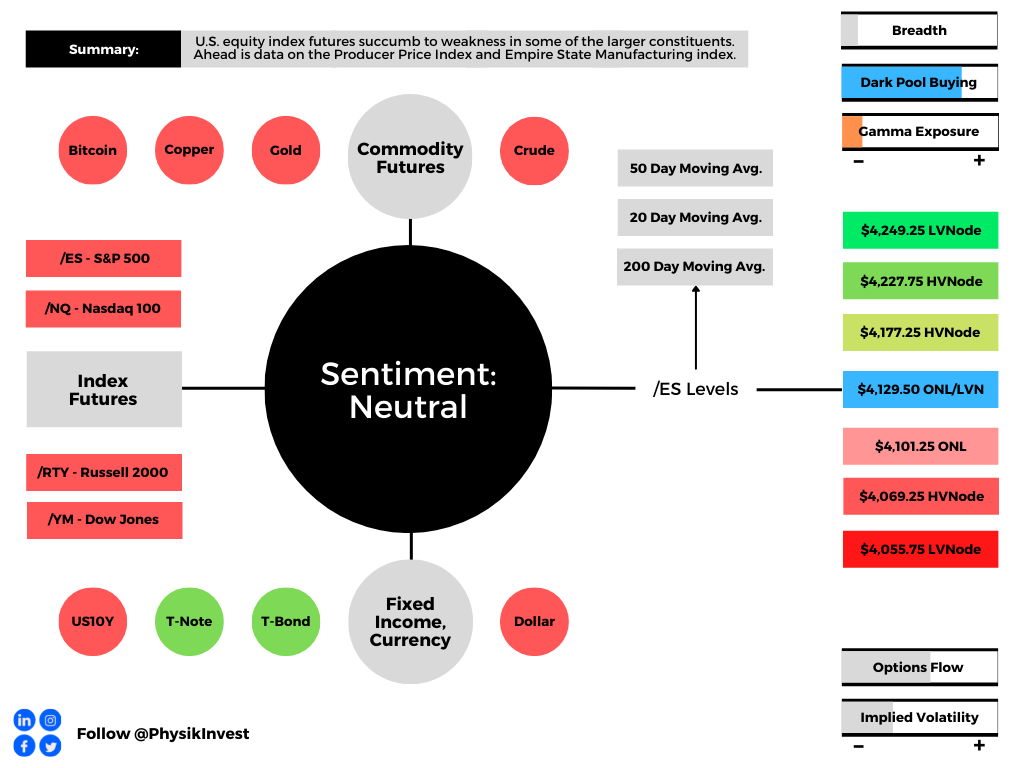
Ahead is data on the Producer Price Index and Empire State Manufacturing (8:30 AM ET).
Graphic updated 6:15 AM ET. Sentiment Neutral if expected /ES open is inside of the prior day’s range. /ES levels are derived from the profile graphic at the bottom of the following section. Levels may have changed since initially quoted; click here for the latest levels. SqueezeMetrics Dark Pool Index (DIX) and Gamma (GEX) calculations are based on where the prior day’s reading falls with respect to the MAX and MIN of all occurrences available. A higher DIX is bullish. At the same time, the lower the GEX, the more (expected) volatility. Learn the implications of volatility, direction, and moneyness. SHIFT data used for S&P 500 (INDEX: SPX) options activity. Note that options flow is sorted by the call premium spent; if more positive, then more was spent on call options. Breadth reflects a reading of the prior day’s NYSE Advance/Decline indicator. VIX reflects a current reading of the CBOE Volatility Index (INDEX: VIX) from 0-100.
What To Expect
Fundamental: Keeping it short, today. Please check out Monday’s commentary, if you haven’t!
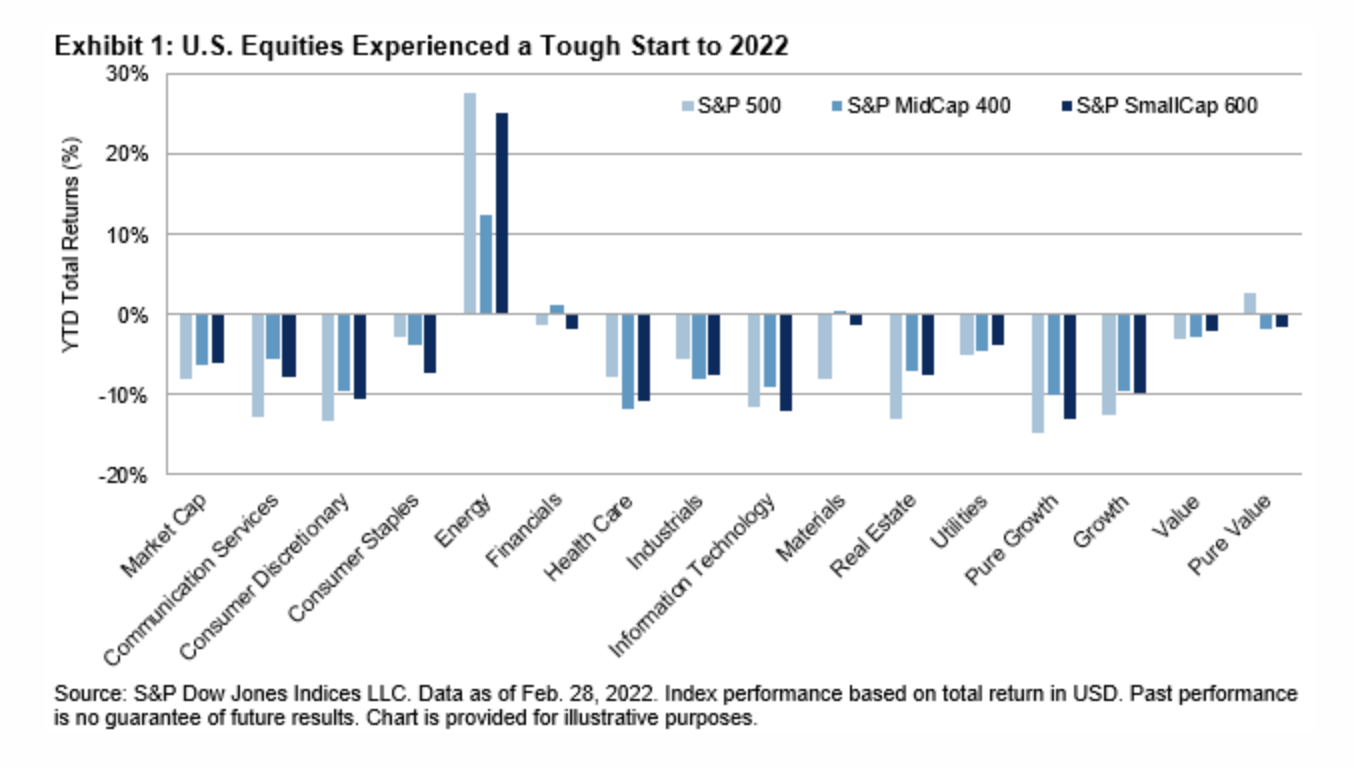
Weak start to 2022 as participants look to price slower growth and inflation, tighter monetary policy, geopolitical tensions, a resurgence in COVID-19, potential Russian defaults, and beyond.
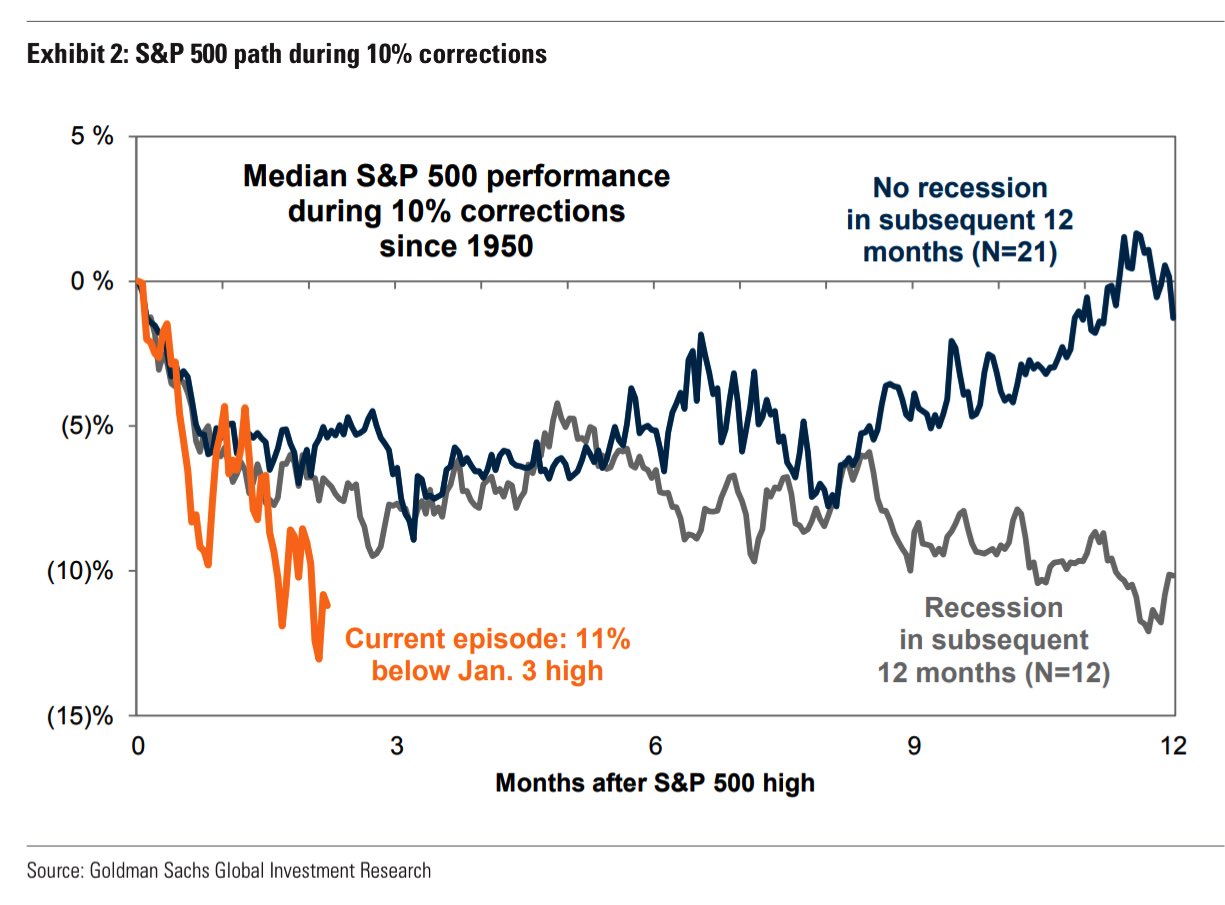
Pursuant to these remarks, Goldman Sachs Group Inc (NYSE: GS) economists suggest the probability of recession in the next year is between 20-35% while Morgan Stanley (NYSE: MS) strategists see equity valuations overshooting to the downside with out of control inflation.
Graphic: Via Goldman Sachs Group Inc.
In opposition, JPMorgan Chase & Co’s (NYSE: JPM) Marko Kolanovic suggests there is too much negativity priced in and that investors should add equity risk.
“We believe that the past month’s correction has induced too much negativity in markets, e.g., reflected by our market-implied recession probabilities, on the fear that growth will be severely affected by the war. We stay with a pro-risk stance as we do not believe that we will see a recession or that we have entered a sustained bear market.”
Graphic: Via Bloomberg. “A Moody’s Analytics computer model suggests that the U.S. as a whole would be able to avoid a recession, even if military hostilities are prolonged.”
Positioning: Per Goldman Sachs Group Inc’s derivatives team, “puts are more overvalued than any time over the past five years.”
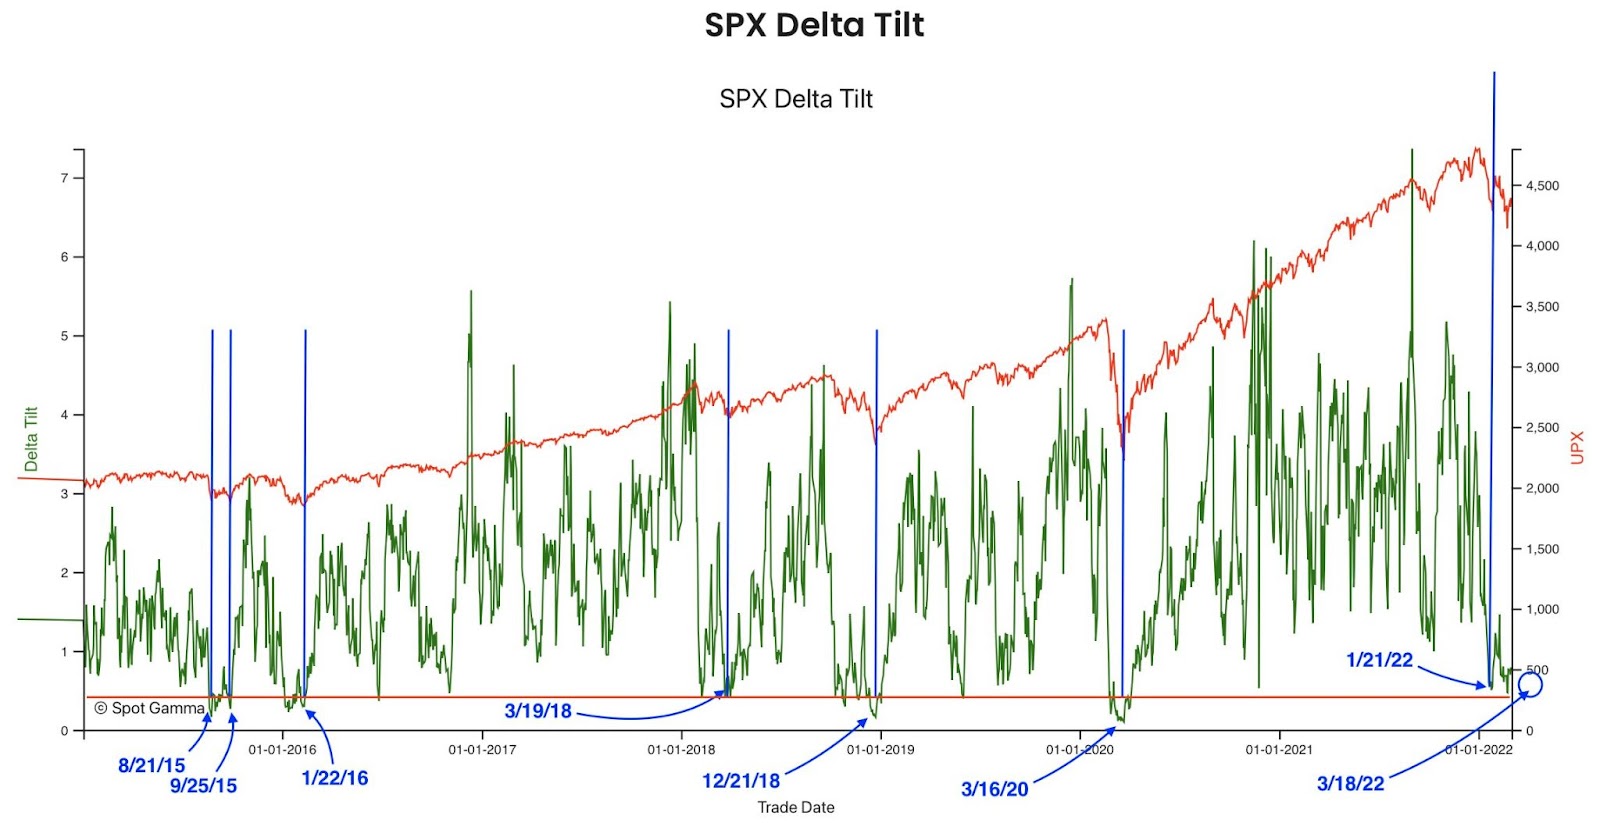
Graphic: Via SpotGamma. “Netting call & put delta, you can see we’re near extremes in terms of put:call positions. Often large put positions are removed by expirations, which seems to coincide with market lows. Many of these are quarterly expirations which coincide w/FOMC meetings – such as next week.”
Further, it is expected that the compression of volatility (via passage of FOMC), as well as the removal of customer puts and (accordingly) counterparty negative gamma exposure (OPEX) may serve to alleviate some of this pressure.
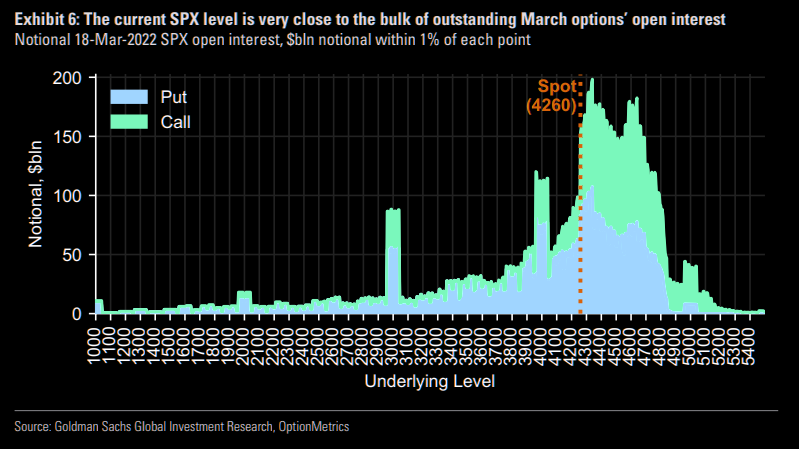
Graphic: Via Goldman Sachs Group Inc (NYSE: GS). Taken from The Market Ear. “18-Mar has more expiring near-the-money SPX open interest than any expiration since 2019.”
In taking the other side of this demand for protection, counterparties carry exposure to positive delta and negative gamma (losses amplified to the downside). In hedging their own exposure, counterparties will sell underlying(s), and this is where the aforementioned pressure arises.
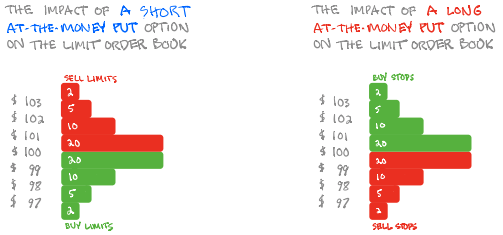
Graphic: SqueezeMetrics details the implications of customer activity in the options market, on the underlying’s order book. For instance, in selling a put, customers add liquidity and stabilize the market. How? The market maker long the put will buy (sell) the underlying to neutralize directional risk as price falls (rises).
Given present supply and demand conditions (customer hedging in months prior), the incremental pressure counterparties add with each leg lower is less, if you will.
Here’s a good explanation:
“When implied volatility is high, that same 1% move lower is much more ‘expected’ so there generally won’t be the same upward pressure on volatility and in fact it might decline,” said Christopher Jacobson, a strategist at Susquehanna Financial Group LLP.
“Along the same lines, investors at that point have had more opportunity and time to hedge, so those same market moves may not lead to as much hedging activity.”
Pictured: SqueezeMetrics highlights implications of volatility, direction, and moneyness.
Adding to that last remark, as Amy Wu Silverman of Royal Bank of Canada’s (NYSE: RY) capital markets group puts it well: “You’re also seeing people selling that volatility and doing some overwriting. That can probably dampen volatility.”
Graphic: SpotGamma’s Hedging Impact of Real-Time Options (HIRO) indicator for QQQ shows strong put selling 3/14/2022. Divergences often precede reversals in the underlying.
There is the potential, according to SpotGamma, for some “path dependency,” however, as “the expiration and/or covering of a large swath of these put hedges may place the market back into an ‘underhedged’ position.” In such a case, new demand would add fuel to weakness.
Technical: As of 6:15 AM ET, Tuesday’s regular session (9:30 AM – 4:00 PM ET), in the S&P 500, will likely open in the middle part of a negatively skewed overnight inventory, inside of prior-range and -value, suggesting a limited potential for immediate directional opportunity.
Gap Scenarios: Gaps ought to fill quickly. Should they not, that’s a signal of strength; do not fade. Leaving value behind on a gap-fill or failing to fill a gap (i.e., remaining outside of the prior session’s range) is a go-with indicator.

Auctioning and spending at least 1-hour of trade back in the prior range suggests a lack of conviction; in such a case, do not follow the direction of the most recent initiative activity.
In the best case, the S&P 500 trades higher; activity above the $4,129.50 overnight low (ONL) puts in play the $4,177.25 high volume area (HVNode). Initiative trade beyond the $4,177.25 HVNode could reach as high as the $4,227.75 HVNode and $4,249.25 LVNode, or higher.
In the worst case, the S&P 500 trades lower; activity below the $4,129.50 ONL puts in play the $4,101.25 ONL. Initiative trade beyond the ONL could reach as low as the $4,069.25 HVNode and $4,055.75 LVNode, or lower.
Considerations: Push-and-pull, as well as responsiveness near key-technical areas (that are discernable visually on a chart), suggests technically-driven traders with short time horizons are very active.
Such traders often lack the wherewithal to defend retests and, additionally, the type of trade may be indicative of the other time frame participants waiting for more information to initiate trades.
Click here to load today’s key levels into the web-based TradingView charting platform. Note that all levels are derived using the 65-minute timeframe. New links are produced, daily.
Graphic: 65-minute profile chart of the Micro E-mini S&P 500 Futures.
Definitions
Overnight Rally Highs (Lows): Typically, there is a low historical probability associated with overnight rally-highs (lows) ending the upside (downside) discovery process.
Volume Areas: A structurally sound market will build on areas of high volume (HVNodes). Should the market trend for long periods of time, it will lack sound structure, identified as low volume areas (LVNodes). LVNodes denote directional conviction and ought to offer support on any test.
If participants were to auction and find acceptance into areas of prior low volume (LVNodes), then future discovery ought to be volatile and quick as participants look to HVNodes for favorable entry or exit.
About
After years of self-education, strategy development, mentorship, and trial-and-error, Renato Leonard Capelj began trading full-time and founded Physik Invest to detail his methods, research, and performance in the markets.
Capelj is also a Benzinga finance and technology reporter interviewing the likes of Shark Tank’s Kevin O’Leary, JC2 Ventures’ John Chambers, FTX’s Sam Bankman-Fried, and ARK Invest’s Catherine Wood, as well as a SpotGamma contributor developing insights around impactful options market dynamics.
Disclaimer
Physik Invest does not carry the right to provide advice.
In no way should the materials herein be construed as advice. Derivatives carry a substantial risk of loss. All content is for informational purposes only.