Physik Invest’s Daily Brief is read by thousands of subscribers. You, too, can join this community to learn about the fundamental and technical drivers of markets.
Graphic updated 8:00 AM ET. Sentiment Risk-On if expected /ES open is above the prior day’s range. /ES levels are derived from the profile graphic at the bottom of this letter. Click here for the latest levels. SqueezeMetrics Dark Pool Index (DIX) and Gamma (GEX) with the latter calculated based on where the prior day’s reading falls with respect to the MAX and MIN of all occurrences available. A higher DIX is bullish. At the same time, the lower the GEX, the more (expected) volatility. Click to learn the implications of volatility, direction, and moneyness. Breadth reflects a reading of the prior day’s NYSE Advance/Decline indicator. The CBOE VIX Volatility Index (INDEX: VVIX) reflects the attractiveness of owning volatility.
Positioning
It’s a dynamic this letter has discussed before. Levels quoted in the bottom section of this letter have proved useful in recent trade, marking the bottom and top of rallies precisely. A factor to blame is short-term participation. Let’s explain this further.
Graphic: 65-minute profile chart of the Micro E-mini S&P 500 Futures.
For instance, as SpotGamma said this morning, volumes at options strikes, very close to levels this letter quotes, are very large relative to the open interest changes. These volumes are large enough to add to the movement and result in responses to certain areas, but their impact is not long-lasting. In fact, some suggest the activity is part of “trading for risk positioning” and the impact “can net out” over a longer time horizon.
It is this letter writer’s opinion that the noise is easy to get swept into. Rather, we are interested in participating in the bigger strides, hence the trades we’ve quoted prior.
As your letter writer elaborated in a recent note for SpotGamma, following weakness heading into the January monthly options expiration (OpEx), the window was open for relief. A cross above big inflections like the 200-day simple moving average, a trigger for some to buy stocks, coupled with measures like the Cboe Volatility Index (INDEX: VIX) trending higher, partly the result of the fear of missing out and hedging in a lower liquidity environment, had us leaning optimistic.
Notwithstanding, with measures like the Cboe VIX Volatility (INDEX: VVIX) “at low levels and rebounding” implying “(1) traders are looking to hedge for cheap and (2) convexity remains a good place to be”, we had the interest to limit downside via call structures with long and short options. The short options help us harvest a bit of call skew and lower the cost of the spread, helping it retain “value better through time.”
In short, though “the marginal positivity of further IV compression likely does little to keep stocks on an upward trajectory”, SpotGamma explained, structures we explained recently may enable you to get on the right side of an SPX and VIX up environment (explained by SpotGamma), all the while limiting downside on the eventual turn.
If you’re averse to directional risk, consider trades like the Box Spreads we talked about many letters back, which are now gaining popularity.
Technical
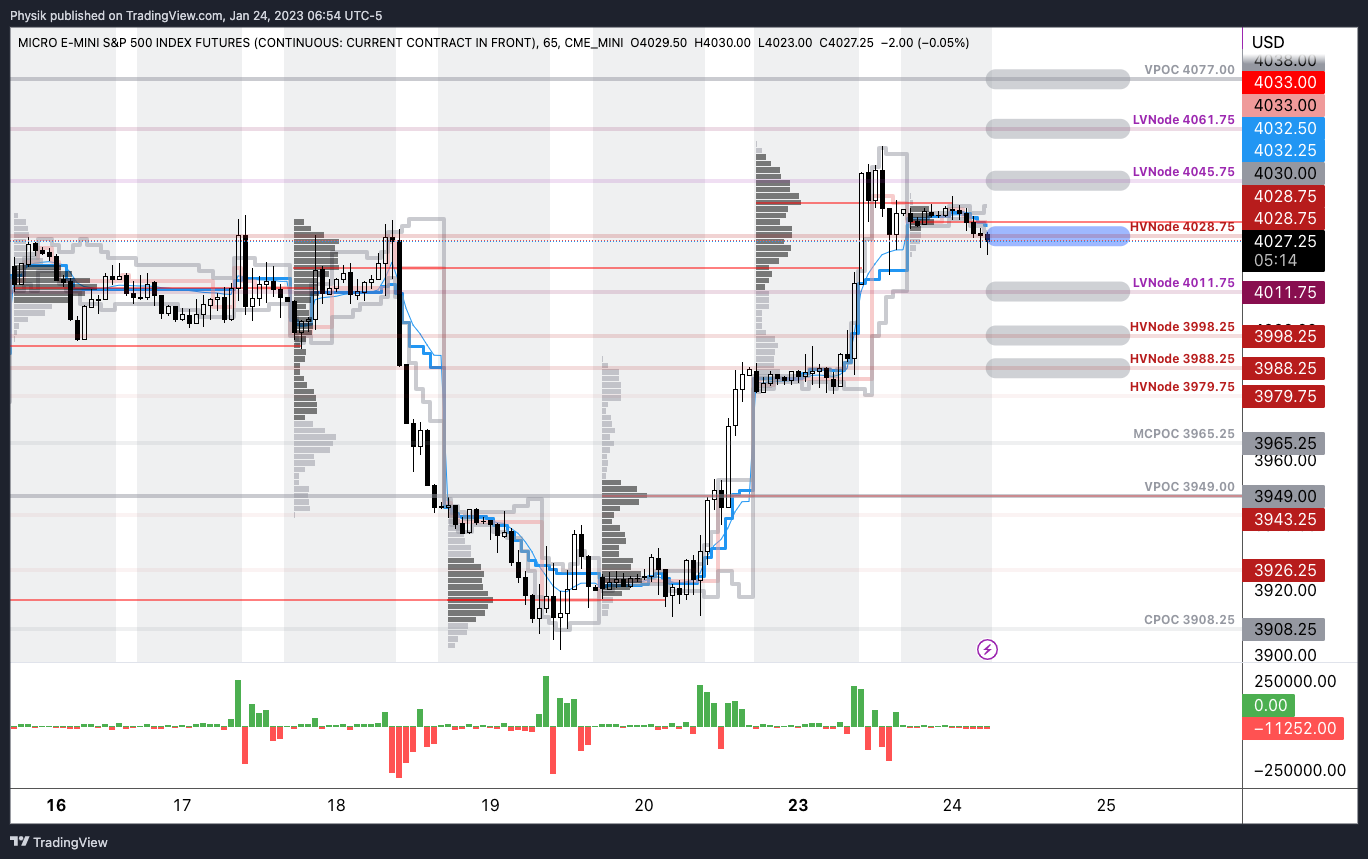
As of 8:00 AM ET, Thursday’s regular session (9:30 AM – 4:00 PM ET), in the S&P 500, is likely to open in the upper part of a positively skewed overnight inventory, outside of prior-range and -value, suggesting a potential for immediate directional opportunity.
Our S&P 500 pivot for today is $4,050.25.
Key levels to the upside include $4,061.75, $4,071.50, and $4,083.75.
Key levels to the downside include $4,028.75, $4,011.75, and $3,998.25.
Click here to load updated key levels into the web-based TradingView platform. All levels are derived using the 65-minute timeframe. New links are produced, daily.
Graphic: 65-minute profile chart of the Micro E-mini S&P 500 Futures.
Definitions
Volume Areas: Markets will build on areas of high-volume (HVNodes). Should the market trend for long periods of time, it will be identified by low-volume areas (LVNodes). LVNodes denote directional conviction and ought to offer support on any test.
If participants auction and find acceptance in an area of a prior LVNode, then future discovery ought to be volatile and quick as participants look to HVNodes for favorable entry or exit.
POCs: Denote areas where two-sided trade was most prevalent in a prior day session. Participants will respond to future tests of value as they offer favorable entry and exit.
About
In short, Renato Leonard Capelj is an economics graduate working in finance and journalism.
Capelj spends most of his time as the founder of Physik Invest through which he invests and publishes daily analyses to subscribers, some of whom represent well-known institutions.
Separately, Capelj is an equity options analyst at SpotGamma and an accredited journalist interviewing global leaders in business, government, and finance.
Physik Invest’s Daily Brief is read by thousands of subscribers. You, too, can join this community to learn about the fundamental and technical drivers of markets.
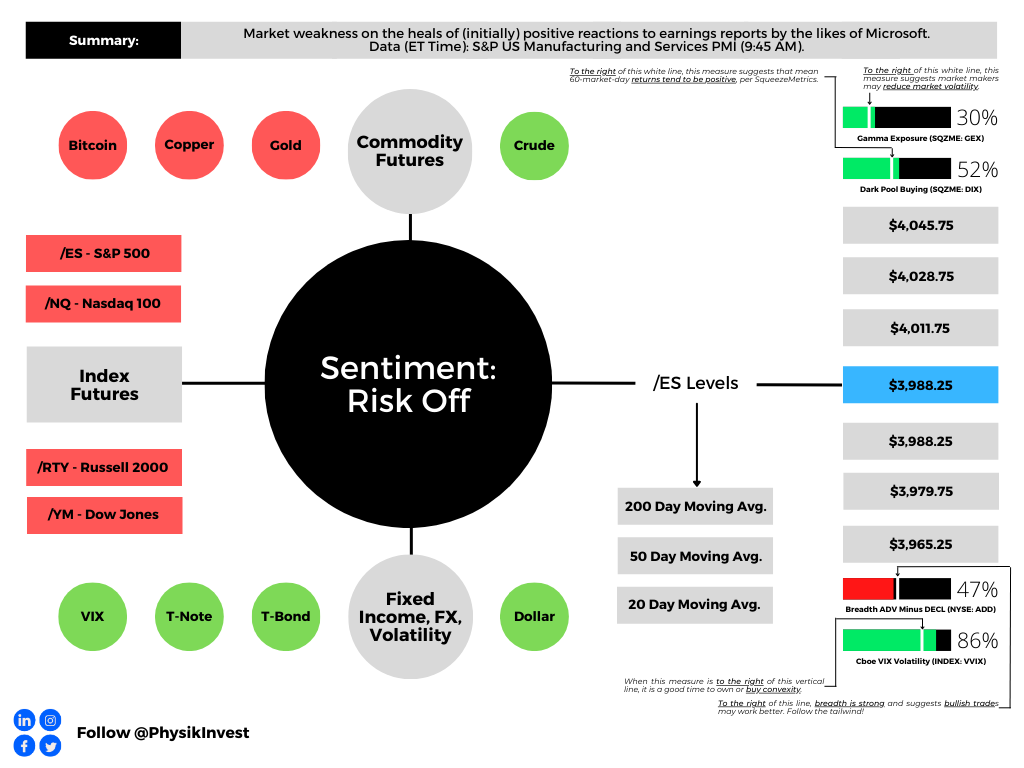
Graphic updated 8:00 AM ET. Sentiment Risk-Off if expected /ES open is below the prior day’s range. /ES levels are derived from the profile graphic at the bottom of this letter. Click here for the latest levels. SqueezeMetrics Dark Pool Index (DIX) and Gamma (GEX) with the latter calculated based on where the prior day’s reading falls with respect to the MAX and MIN of all occurrences available. A higher DIX is bullish. At the same time, the lower the GEX, the more (expected) volatility. Click to learn the implications of volatility, direction, and moneyness. Breadth reflects a reading of the prior day’s NYSE Advance/Decline indicator. The CBOE VIX Volatility Index (INDEX: VVIX) reflects the attractiveness of owning volatility.
Positioning
After a rocky end to 2022, the result of rebalances and repositioning, stocks rallied in the face of incredibly bearish sentiment and off-sides positioning. The detailed Daily Brief for January 24 discussed this context.
Presently, the S&P 500 (INDEX: SPX) is riding above an important inflection (i.e., the 200-day simple moving average) which is a trigger for many traders to flip to owning stocks. At the same time, implied volatility (IVOL), as measured by measures such as the Cboe Volatility Index (INDEX: VIX), is trending higher, and that’s, in part, a result of options hedging in a lower liquidity environment.
Anyways, little is expected to change until the middle of February, this letter quoted Kai Volatility’s Cem Karsan stating, yesterday. Following mid-February, a window for weakness opens. This could be a problem for some traders who are short volatility.
The reason being is as follows. Traders’ disinterest in hedging downside leaves them offside should the market drop quickly. Consequently, the demand for hedges (puts) will coincide with a re-pricing in IVOL dangerous to anyone who is short volatility.
Given the unstable SPX and VIX up environment, attractive trades provide exposure to the upside while limiting the downside. Structures such as call butterflies or ratio spreads, as included in yesterday’s letter, may work well.
In yesterday’s example, owning the 20-point FEB 1×2 Tesla Call Ratio Spread resulted in about 400% profit in the span of 14 days or so (i.e., $0.20 db → $1.00 cr). The loss was limited* to about $20.00 at entry while the exit was marked in excess of $100.00.
*Note that losses can exceed the entry debit should the underlying stock trade very far beyond the ratio spread’s short strikes.
Similar trades can be structured in the indexes such as the Nasdaq 100 (INDEX: NDX) where there is a steeper skew that may enable us to collect more credit in the options we are short, helping us lower the cost of the entire spread we own.
If you’re leaning toward the indexes, then you may avoid some of the volatility we saw yesterday when large swaths of stocks on the Intercontinental Exchange Inc-owned (NYSE: ICE) New York Stock Exchange commenced trading with an open book some reports have suggested.
As SpotGamma explained yesterday, “movement-reducing hedging activities” in the indexes “can mask realized volatility (RV) under the hood in single stocks.” Therefore, your index positions may be better isolated from what’s going on under the hood.
As of 8:00 AM ET, Wednesday’s regular session (9:30 AM – 4:00 PM ET), in the S&P 500, is likely to open in the lower part of a negatively skewed overnight inventory, outside of prior-range and -value, suggesting a potential for immediate directional opportunity.
Our S&P 500 pivot for today is $3,998.25.
Key levels to the upside include $4,011.75, $4,028.75, and $4,045.75.
Key levels to the downside include $3,988.25, $3,979.75, and $3,965.25.
Click here to load updated key levels into the web-based TradingView platform. All levels are derived using the 65-minute timeframe. New links are produced, daily.
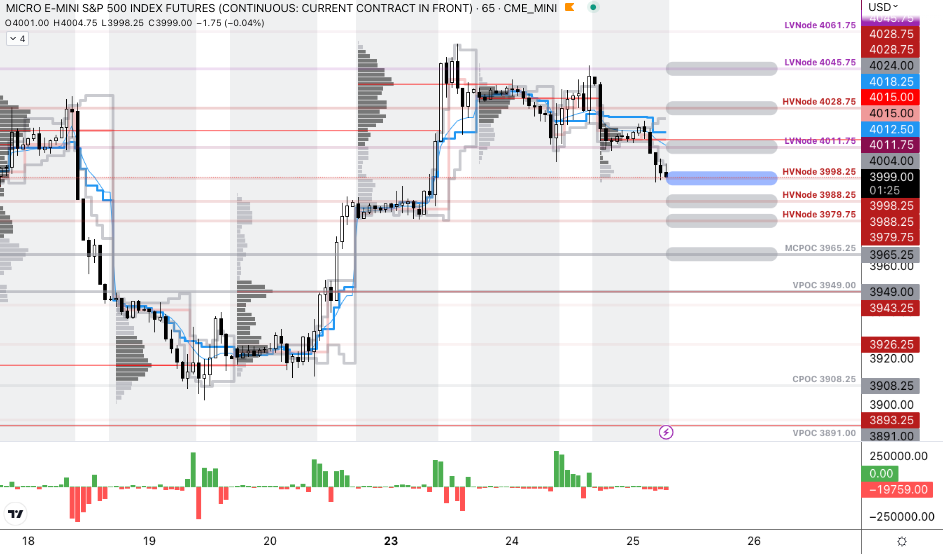
Graphic: 65-minute profile chart of the Micro E-mini S&P 500 Futures.
Definitions
Volume Areas: Markets will build on areas of high-volume (HVNodes). Should the market trend for long periods of time, it will be identified by low-volume areas (LVNodes). LVNodes denote directional conviction and ought to offer support on any test.
If participants auction and find acceptance in an area of a prior LVNode, then future discovery ought to be volatile and quick as participants look to HVNodes for favorable entry or exit.
MCPOCs: Denote areas where two-sided trade was most prevalent over numerous sessions. Participants will respond to future tests of value as they offer favorable entry and exit.
About
In short, Renato Leonard Capelj is an economics graduate working in finance and journalism.
Capelj spends most of his time as the founder of Physik Invest through which he invests and publishes daily analyses to subscribers, some of whom represent well-known institutions.
Separately, Capelj is an equity options analyst at SpotGamma and an accredited journalist interviewing global leaders in business, government, and finance.
Physik Invest’s Daily Brief is read by thousands of subscribers. You, too, can join this community to learn about the fundamental and technical drivers of markets.
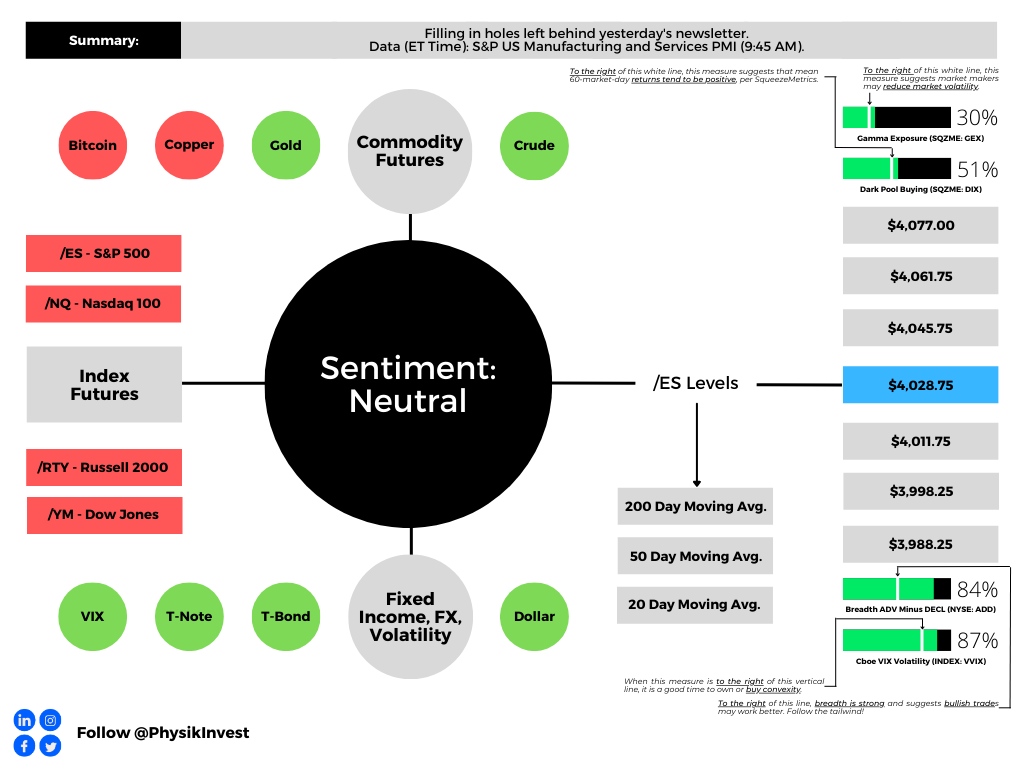
Graphic updated 7:00 AM ET. Sentiment Neutral if expected /ES open is inside of the prior day’s range. /ES levels are derived from the profile graphic at the bottom of this letter. Click here for the latest levels. SqueezeMetrics Dark Pool Index (DIX) and Gamma (GEX) with the latter calculated based on where the prior day’s reading falls with respect to the MAX and MIN of all occurrences available. A higher DIX is bullish. At the same time, the lower the GEX, the more (expected) volatility. Click to learn the implications of volatility, direction, and moneyness. Breadth reflects a reading of the prior day’s NYSE Advance/Decline indicator. The CBOE VIX Volatility Index (INDEX: VVIX) reflects the attractiveness of owning volatility.
Administrative
Monday’s letter had some holes. Let’s try to fill them in, today, and get a fuller picture.
Summary of today’s letter: though the real economy may be strong, sticky inflation likely results in higher rates for longer, as well as quantitative tightening. This is not good for the financial economy. Some suggest the equity market rally persists into mid-February before further weaknesses appear. Read on for more.
Fundamental
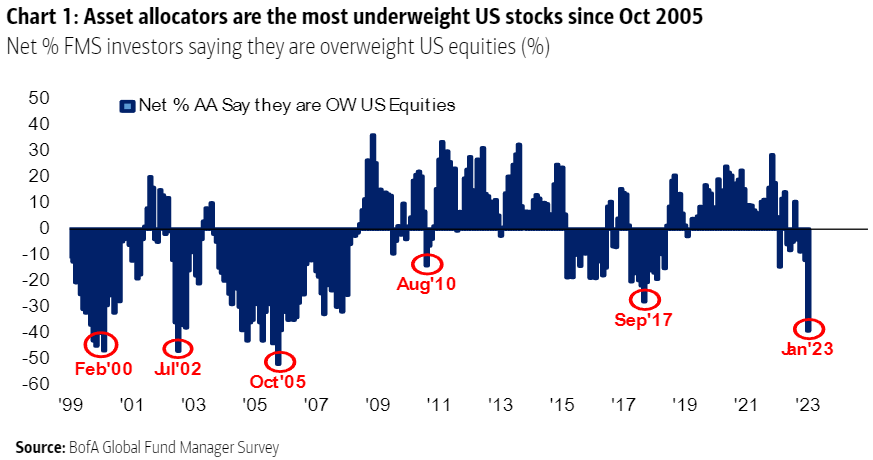
Many sentiment and positioning indicators are bearish.
For instance, surveys by Bank of America Corporation (NYSE: BAC) point to allocators being very underweight US stocks. Also, investors are reporting some of their biggest one-month exits from stocks since BAC started surveying.
Graphic: Retrieved from BAC via Bloomberg’s John Authers.
The consensus is turning more bearish, we see, and some of this letter’s most quoted voices maintain that markets (not necessarily the economy) are in for more weakness.
That is in the face of a severely depressed S&P 500 (INDEX: SPX) crossing above key areas denoting technical resistance, a signal for trend-followers to get involved on the long side (i.e., buy stocks) Kai Volatility’s Cem Karsan explained in a video last week.
Equity market strength drivers, Karsan said, include China reopening and increasing stimulus, Europe’s not-so-bad winter, and little worsening of conflicts (e.g., Ukraine and Russia situation).
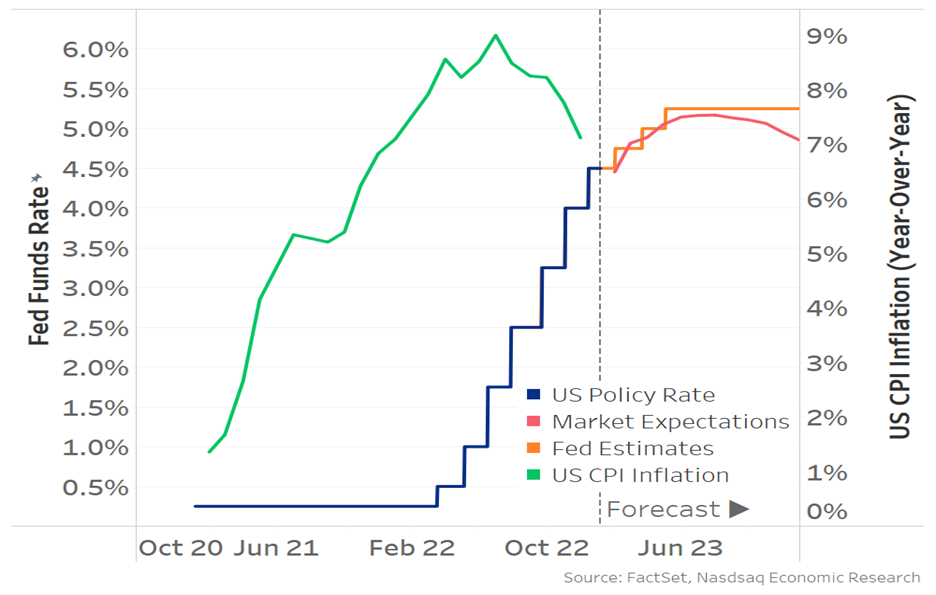
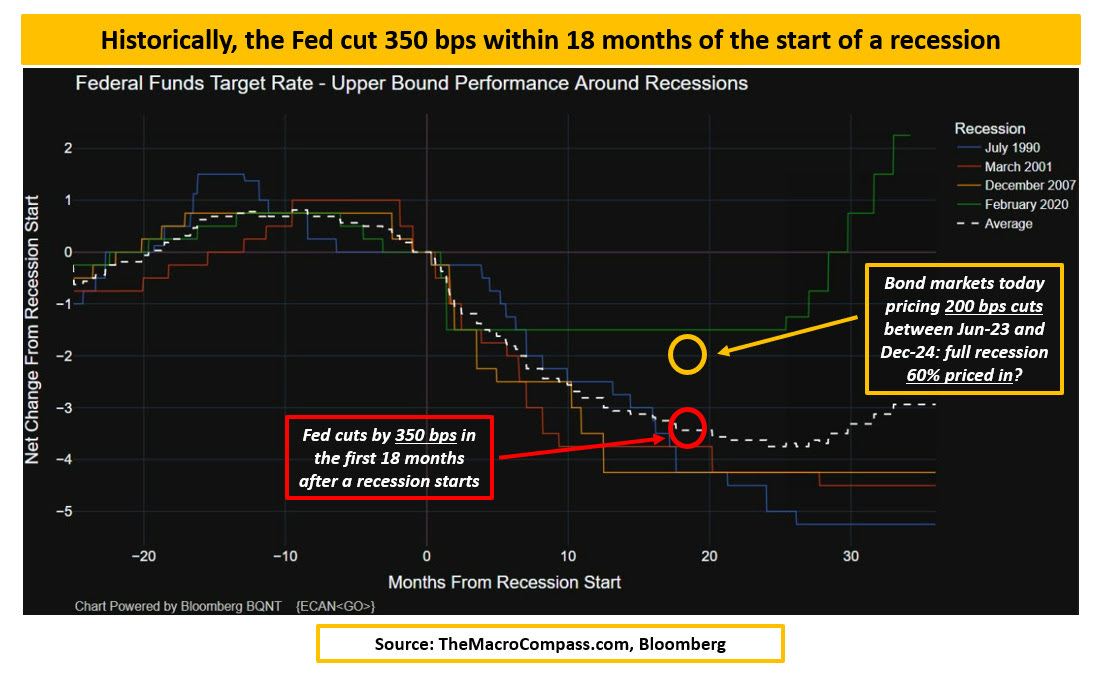
Adding, as The Macro Compass’ Alfonso Peccatiello said, the bond market thinks the Fed will not hike into a recession. Inflation likely “slows down to 2.5% quickly, [with] the Fed cutting rates to neutral (and never below). [That’s] not recessionary pricing. It’s immaculate disinflation pricing.”
The base case is a landing that’s soft.
To elaborate, the data shows the Fed cut by about 350 basis points or so within 18 months of the start of a recession, Peccatiello said. Now, the markets are pricing a mid-2023 pivot with about 200 basis points of cuts between 2023 and 2024.
Graphic: Retrieved from Nasdaq Inc (NASDAQ: NDAQ).
“That must mean the bond market’s base case (60%) is a recession,” Peccatiello said, noting that the Fed Funds is not pricing “below reasonable estimates of neutral rate (2.25-2.75% in nominal terms)” in the next 2-5 years. That means this would be the first time ever the US is in a recession and the Fed doesn’t cut rates below neutral.”
And, though downside earnings revisions are happening, the “2023 EPS consensus at $225 implies a +4% earnings growth this year [while] in [past] recessionary episodes the average EPS decline is instead -30%.”
“[C]yclical sectors and countries are outperforming defensive,” and there is little fear and desire to protect against far-reaching weakness. “Protection in the S&P 500 is at the cheapest levels in 2 years” as evidenced by “the implied volatility in 20% out-of-the-money SPX puts … trading in the lowest” percentiles.
But, as Karsan implied in his recent appearance, there’s a disconnect. The economy is not the stock market, and the liquidity context is poor, which many may not recognize.
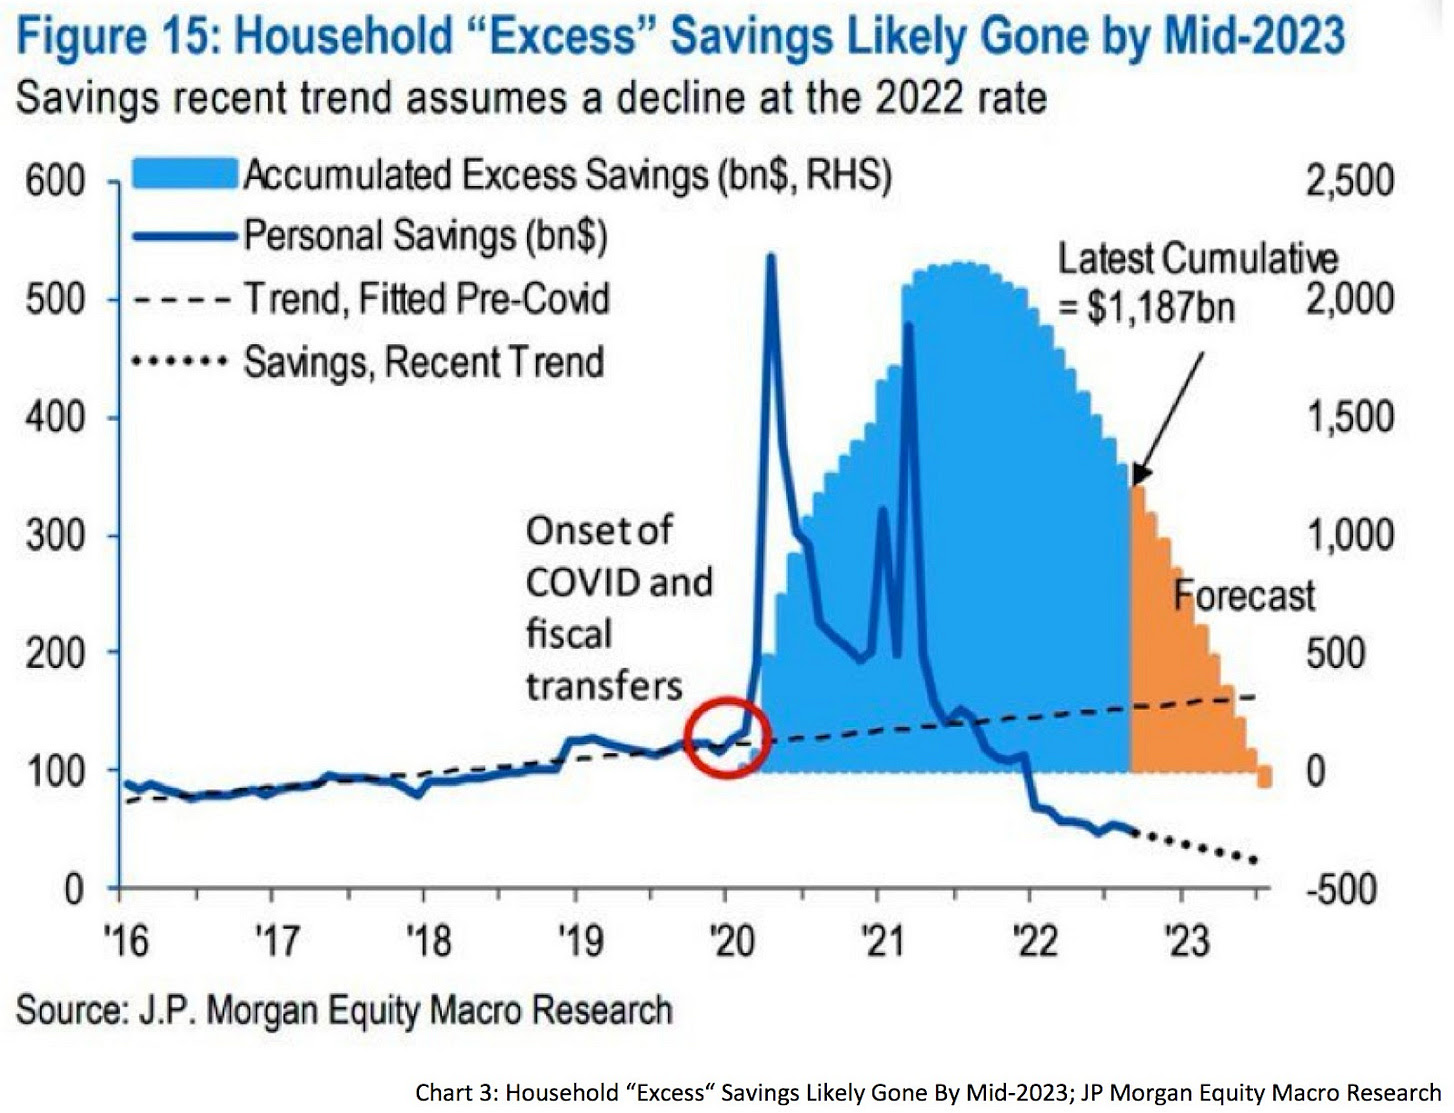
The economy performing well due to China reopening and strong demand among businesses surveyed, consumers’ savings excesses, persistent credit boom, and a strong labor market suggest inflation lasts longer.
Consequently, interest rates remain higher for longer and quantitative tightening is likely to persist. This is not so good for the financial economy.
Graphic: Retrieved from JPMorgan Chase & Co (NYSE: JPM) via Fabian Wintersberger.
“[B]lindly trusting the bond market could end badly,” Fabian Wintersberger added, noting that “recent bear market rallies in stocks and bonds will reverse” eventually.
Karsan appears to agree: though green shoots are likely to push better than expected economic performance, the Fed “is in a box” and this rally likely ends in early spring.
Graphic: Retrieved from Nasdaq Inc (NASDAQ: NDAQ). Note that “[h]igher rates act as a headwind for valuations – prices should fall if earnings don’t change [and] increased earnings make PEs (valuations) fall and make stocks look more attractive.” Currently, “the market is currently pricing in a year where rates and earnings don’t change much … inflation could stay elevated [with China reopening and supply chain re-shoring] which means rates should too.”
For now, the break of the 200-day moving average is a significant impetus since it’s a level many watch (i.e., technicals matter if enough people look at them). The chase is manifesting an SPX up, Cboe Volatility Index (INDEX: VIX) up dynamic (i.e., those who fear they may miss a rally bid volatility while the underlying market trades higher).
The Daily Brief for January 13 said “the more depressed technology names to the upside for debits [looked] attractive.”
Accordingly, Tesla Call Ratio Spreads have performed really well.
The 1/2 BACKRATIO TSLA 100 17 FEB 23 160/180 CALL is pricing in excess of a $1.00 credit to close, up about 400% in the span of 14 days or so.
A push likely lasts until mid-February, after which a window for weakness may open, particularly with the liquidity context (see the below video) no longer as supportive. However, if the market consolidates for a period after, this would be bullish.
To end, the median projection puts the S&P 500 at a level above $4,000.00 by year-end with the worst estimate putting the index at $3,000.00.
Joseph Wang explained, also, that there is an “increasing probability of a second bout of inflation, an issue in the 1970s that the Fed is keen to avoid … [by] retighten[ing] financial conditions … through its balance sheet” with an extended quantitative tightening or QT maintained “even if policy rates are cut.”
Given that QT is the flow of capital out of capital markets, this context presents more pressure on the financial economy (not necessarily the real economy).
Technical
As of 6:55 AM ET, Tuesday’s regular session (9:30 AM – 4:00 PM ET), in the S&P 500, is likely to open in the bottom part of a negatively skewed overnight inventory, inside of prior-range and -value, suggesting a limited potential for immediate directional opportunity.
Our S&P 500 pivot for today is $4,028.75.
Key levels to the upside include $4,045.75, $4,061.75, and $4,077.00.
Key levels to the downside include $4,011.75, $3,998.25, and $3,988.25.
Click here to load updated key levels into the web-based TradingView platform. All levels are derived using the 65-minute timeframe. New links are produced, daily.
Graphic: 65-minute profile chart of the Micro E-mini S&P 500 Futures.
Definitions
Volume Areas: Markets will build on areas of high-volume (HVNodes). Should the market trend for long periods of time, it will be identified by low-volume areas (LVNodes). LVNodes denote directional conviction and ought to offer support on any test.
If participants auction and find acceptance in an area of a prior LVNode, then future discovery ought to be volatile and quick as participants look to HVNodes for favorable entry or exit.
Vanna: The rate at which the delta of an option changes with respect to implied volatility.
Charm: The rate at which the delta of an option changes with respect to time.
POCs: Denote areas where two-sided trade was most prevalent in a prior day session. Participants will respond to future tests of value as they offer favorable entry and exit.
Options: Options offer an efficient way to gain directional exposure.
If an option buyer was short (long) stock, he or she could buy a call (put) to hedge upside (downside) exposure. Additionally, one can spread, or buy (+) and sell (-) options together, strategically.
Commonly discussed spreads include credit, debit, ratio, back, and calendar.
Credit: Sell -1 option closer to the money. Buy +1 option farther out of the money.
Debit: Buy +1 option closer to the money. Sell -1 option farther out of the money.
Ratio: Buy +1 option closer to the money. Sell -2 options farther out of the money.
Back: Sell -1 option closer to the money. Buy +2 options farther out of the money.
Calendar: Sell -1 option. Buy +1 option farther out in time, at the same strike.
In the most basic way, if bullish (bearish), sell at-the-money put (call) credit spread and/or buy a call (put) debit/ratio spread structured around target price. Alternatively, if the expected directional move is great (small), opt for a back spread (calendar spread). Also, if credit spread, seek to capture 50-75% of the premium collected. If debit spread, seek to capture 2-300% of the premium paid.
Be cognizant of risk exposure.
Negative (positive) Delta = synthetic short (long).
Negative (positive) Gamma = movement hurts (helps)
Negative (positive) Theta = time decay hurts (helps).
In short, Renato Leonard Capelj is an economics graduate working in finance and journalism.
Capelj spends most of his time as the founder of Physik Invest through which he invests and publishes daily analyses to subscribers, some of whom represent well-known institutions.
Separately, Capelj is an equity options analyst at SpotGamma and an accredited journalist interviewing global leaders in business, government, and finance.
The daily brief is a free glimpse into the prevailing fundamental and technical drivers of U.S. equity market products. Join the 750+ that read this report daily, below!
Graphic updated 7:00 AM ET. Sentiment Neutral if expected /ES open is inside of the prior day’s range. /ES levels are derived from the profile graphic at the bottom of the following section. Levels may have changed since initially quoted; click here for the latest levels. SqueezeMetrics Dark Pool Index (DIX) and Gamma (GEX) calculations are based on where the prior day’s reading falls with respect to the MAX and MIN of all occurrences available. A higher DIX is bullish. At the same time, the lower the GEX, the more (expected) volatility. Learn the implications of volatility, direction, and moneyness. Breadth reflects a reading of the prior day’s NYSE Advance/Decline indicator. VIX reflects a current reading of the CBOE Volatility Index (INDEX: VIX) from 0-100.
Fundamental
We’ll skip the fundamentals section, today, and do an in-depth review, sometime next week.
Positioning
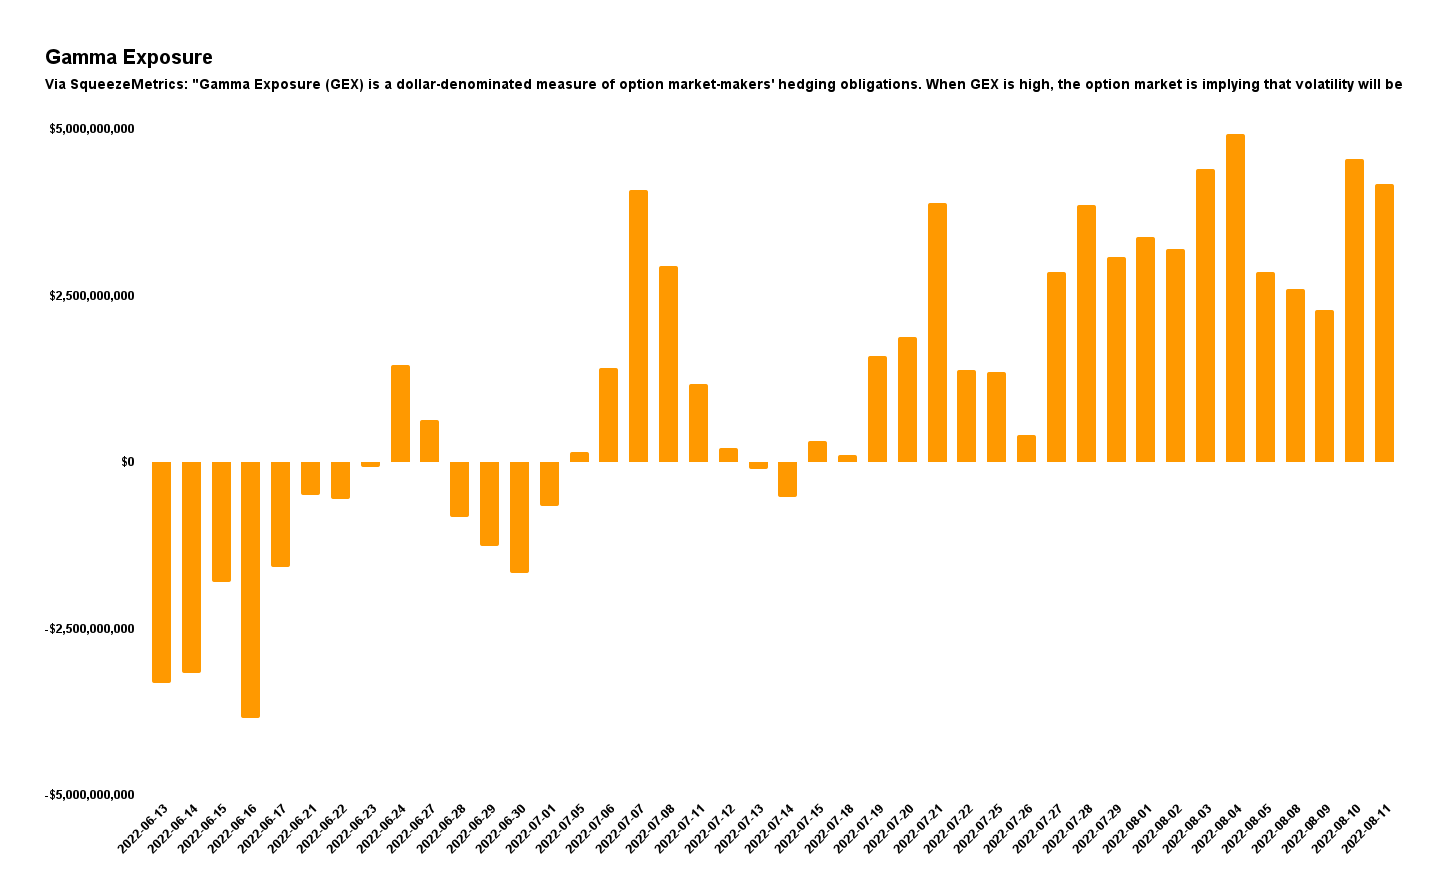
As of 7:00 AM ET, Friday’s expected volatility, via the Cboe Volatility Index (INDEX: VIX), sits at ~1.06%. Net gamma exposures generally rising may promote tighter trading ranges.
Graphic: Via Physik Invest. Data retrieved from SqueezeMetrics.
As stated yesterday, it may be beneficial for traders to shift their focus to dynamic structures. In other words, be a buyer of options structures (i.e., replace static directional exposures or Delta with those that are dynamic).
This is (1) due to where realized (RVOL) and implied (IVOL) volatility measures, and skew.
Graphic: Retrieved from Interactive Brokers Group Inc’s (NASDAQ: IBKR) Trader Workstation.
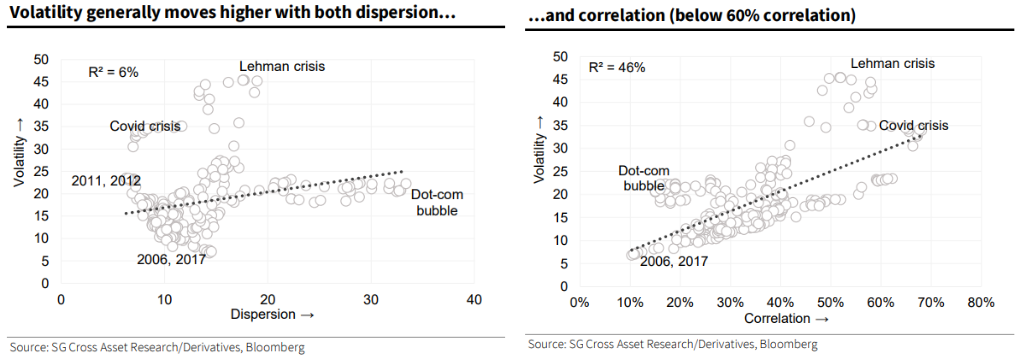
As well as (2) increased average stock correlation and lower return dispersion which, per Societe Generale SA (OTC: SCGLY) research, make stock picking hard(er).
It can be the case that Delta hedging becomes easier, too, as one asset, in a more correlated environment, can better offset the first-order sensitivities elsewhere.
Graphic: Retrieved from Bloomberg. Via Societe Generale.
The reason why?
In regards to the correlation and dispersion remark, that’s more to do with the risk-off sentiment and the impact of tightening liquidity affecting all risk assets, basically.
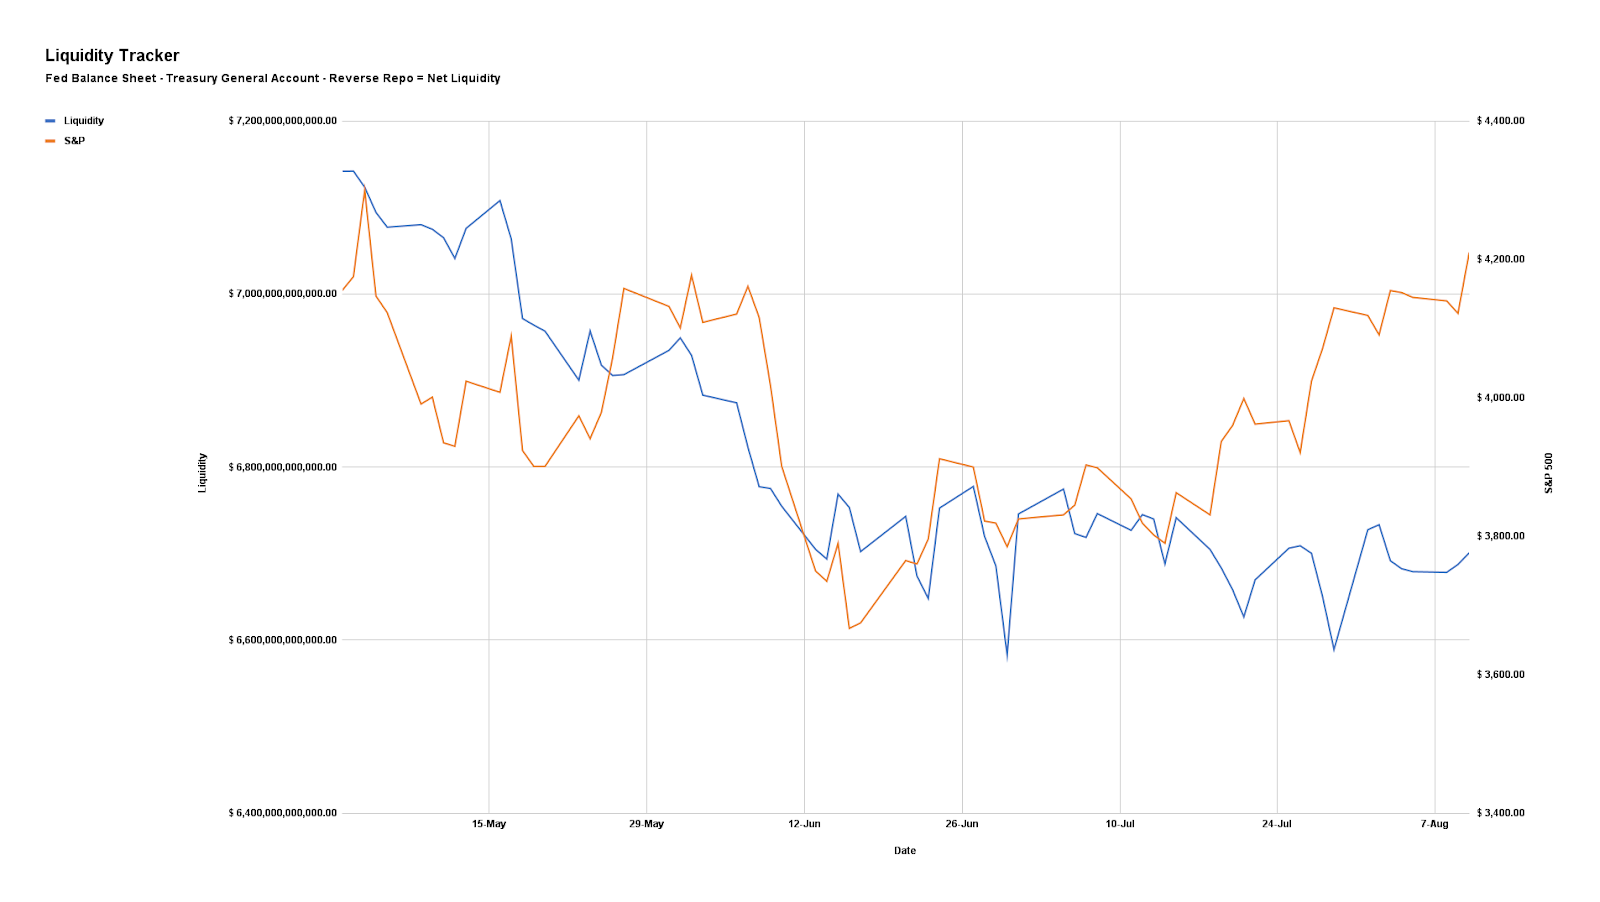
Graphic: Via PhysikInvest. Data compiled by @jkonopas623. Fed Balance Sheet data, here. Treasury General Account Data, here. Reverse Repo data, here. NL = BS – TGA – RRP.
Regarding the volatility issue (RVOL, IVOL, and skew), that’s more to do with hedging trends.
Essentially, the monetization and counterparty hedging of existing customer hedges, as well as the sale of short-dated volatility, particularly in some of the single names where there was “rich” volatility, into the fall, lent to lackluster performance in IVOL and index mean reversion.
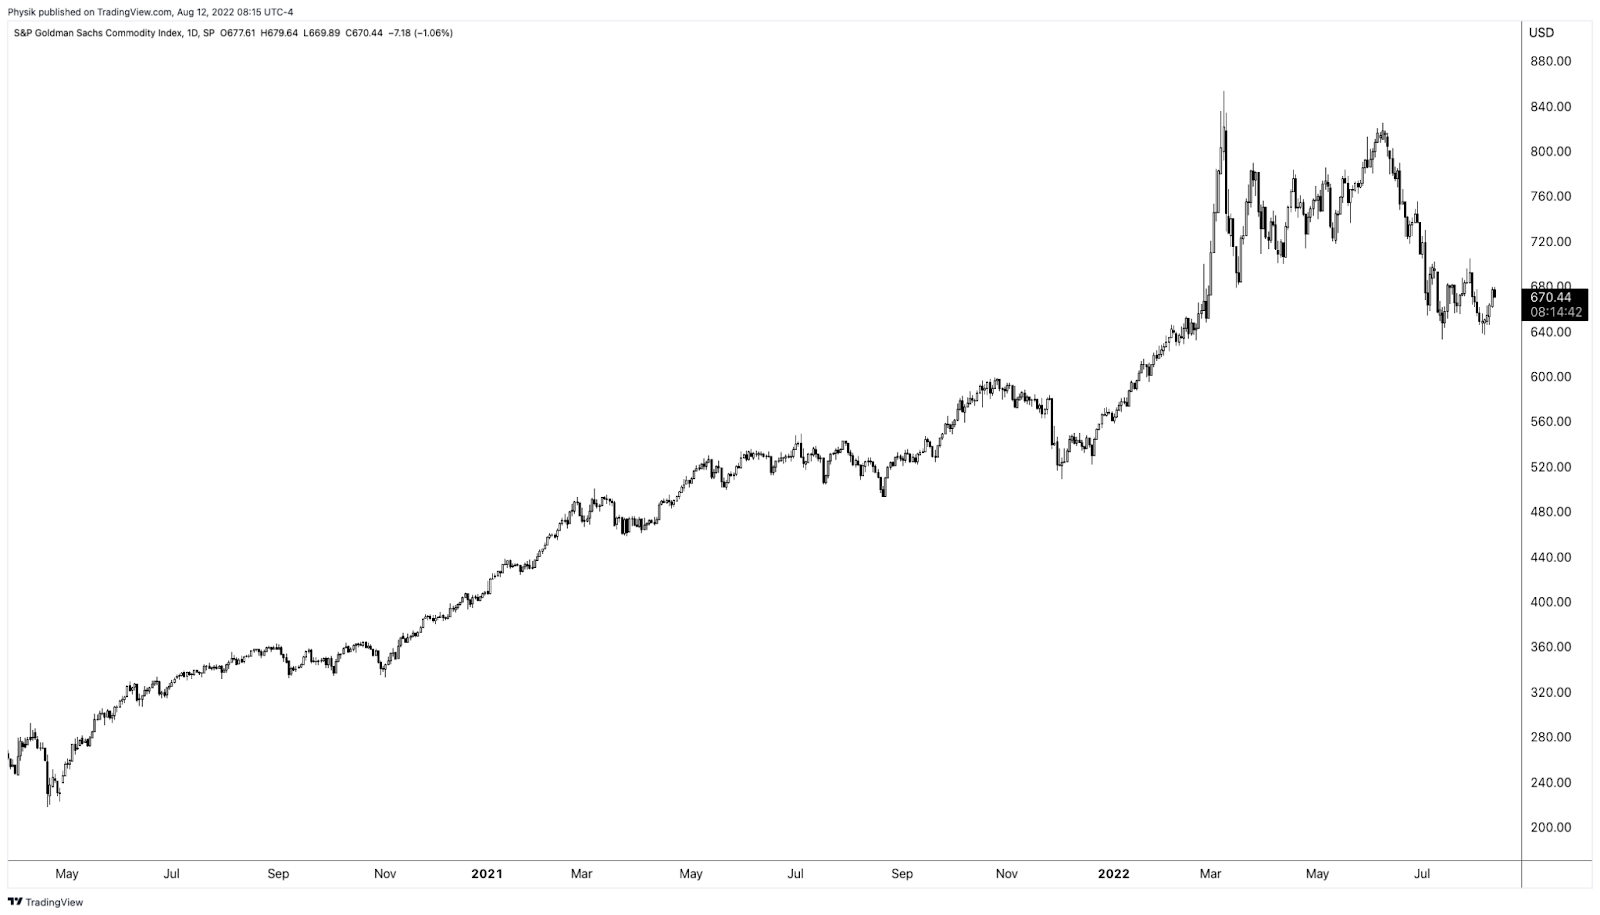
Accordingly, “if commodities are not performing … as a hedge, that opens the door,” to markets falling and traders demand equity volatility hedges, per The Ambrus Group’s Kris Sidial.
Learn about options dealer flows, inflation, and investing in a changing world with Cem Karsan.
Graphic: Retrieved by Physik Invest from TradingView. S&P Goldman Sachs Commodity Index.
Adding, per to SpotGamma, “a lot of the boost from volatility compression has played out. With IVOL at a lower bound, it may be opportune to replace static Delta bets for those that are dynamic (i.e., long option exposures) and have less to lose in this lower volatility environment.”
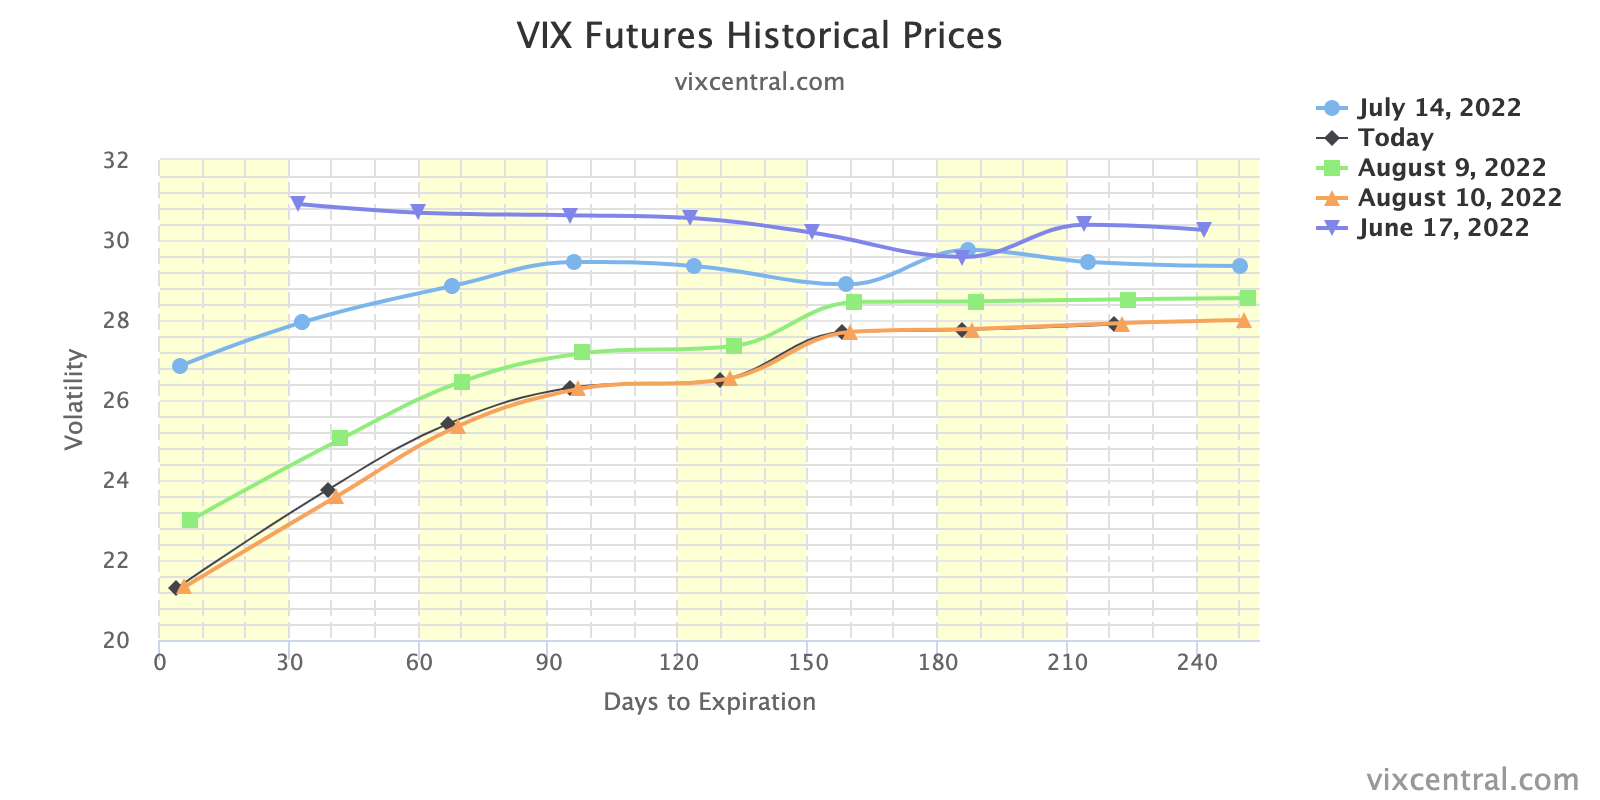
Graphic: Retrieved from Vix Central. The term structure of IVOL.
“In a case where market participants see the Fed keeping its commitment to aggressive monetary policy action, negative Delta options exposures may outperform static short equity (bets on the downside).”
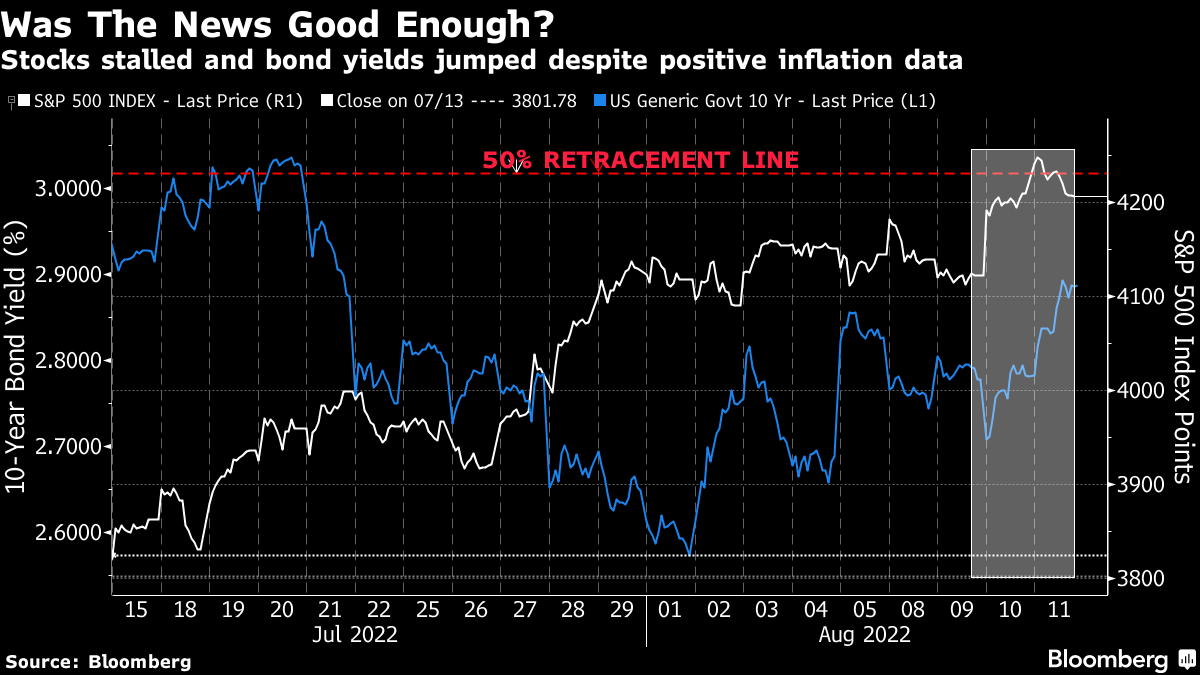
Graphic: Retrieved from Bloomberg. “Thursday’s message was that on mature reflection, the progress on the economy didn’t justify taking the stock market any higher than it was at the start of the day.”
If bullish, sample structures to consider, given a smiley skew, include low- or zero-cost bullish call ratio spreads, against the trend resistances in products like the S&P 500 (INDEX: SPX).
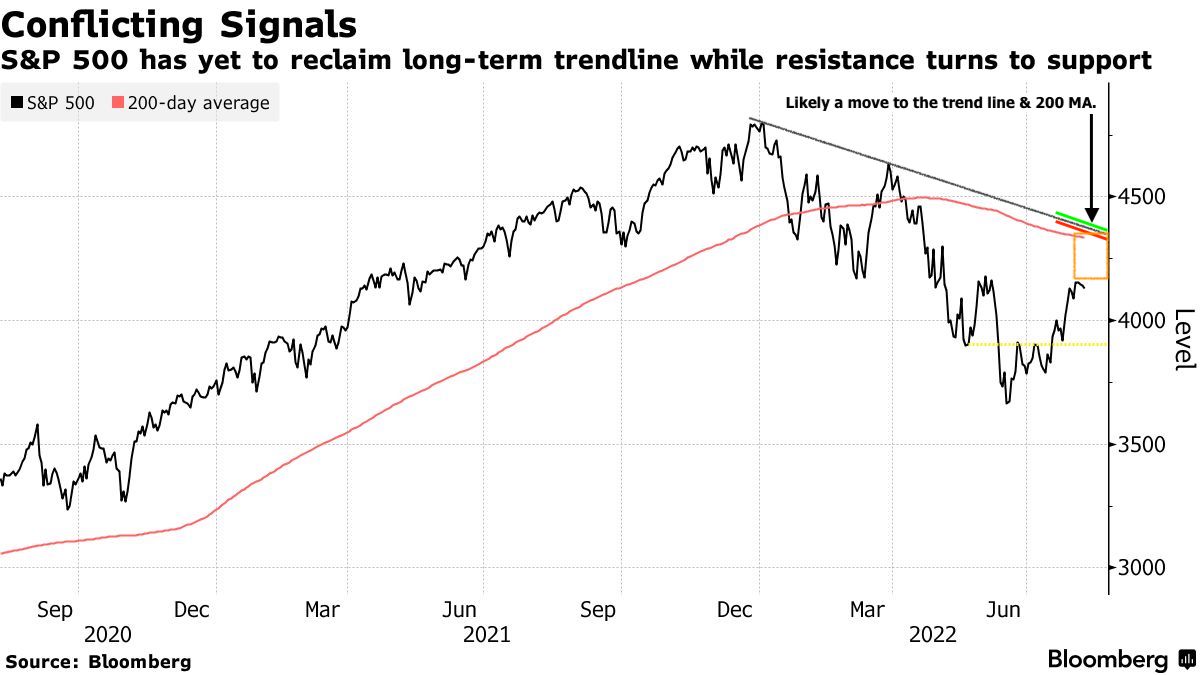
Graphic: Retrieved from Bloomberg. Drawn on by Physik Invest.
Technical
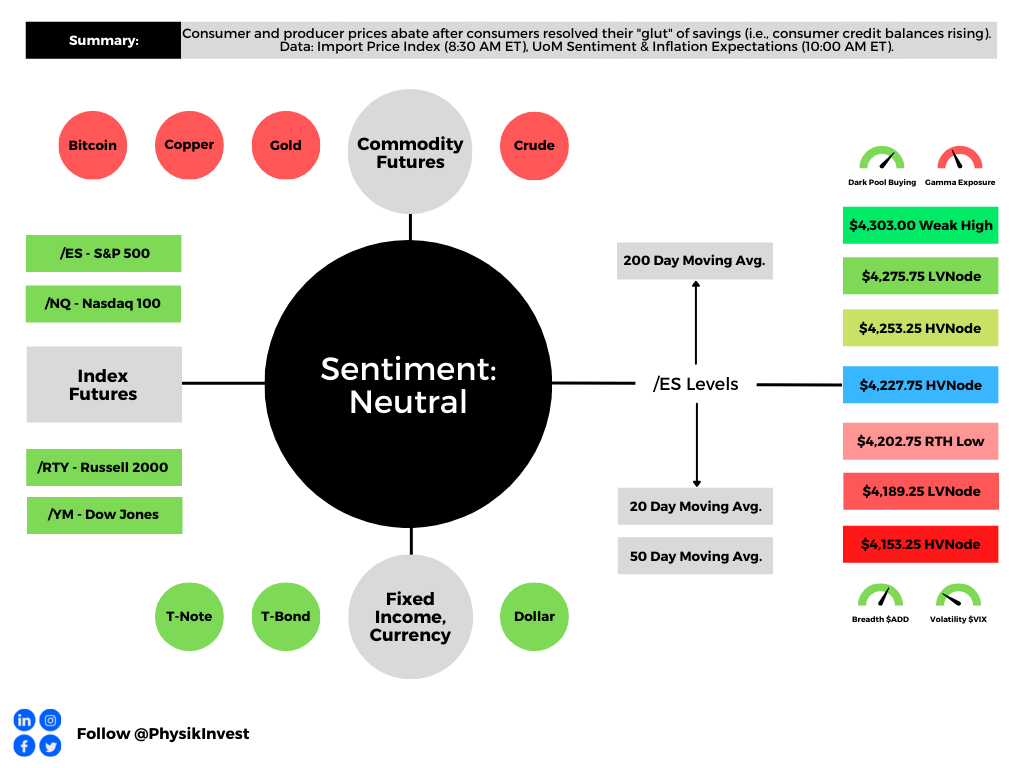
As of 7:00 AM ET, Friday’s regular session (9:30 AM – 4:00 PM ET), in the S&P 500, is likely to open in the middle part of a nearly balanced overnight inventory, inside of prior-range and -value, suggesting a limited potential for immediate directional opportunity.
In the best case, the S&P 500 trades higher.
Any activity above the $4,227.75 HVNode puts into play the $4,253.25 HVNode. Initiative trade beyond the latter could reach as high as the $4,275.75 LVNode and $4,303.00 Weak High, or higher.
In the worst case, the S&P 500 trades lower.
Any activity below the $4,227.75 HVNode puts into play the $4,202.75 RTH Low. Initiative trade beyond the RTH Low could reach as low as the $4,189.25 LVNode and $4,153.25 HVNode, or lower.
Click here to load today’s key levels into the web-based TradingView charting platform. Note that all levels are derived using the 65-minute timeframe. New links are produced, daily.
Graphic: 65-minute profile chart of the Micro E-mini S&P 500 Futures.
Definitions
Volume Areas: A structurally sound market will build on areas of high volume (HVNodes). Should the market trend for long periods of time, it will lack sound structure, identified as low volume areas (LVNodes). LVNodes denote directional conviction and ought to offer support on any test.
If participants were to auction and find acceptance into areas of prior low volume (LVNodes), then future discovery ought to be volatile and quick as participants look to HVNodes for favorable entry or exit.
POCs: POCs are valuable as they denote areas where two-sided trade was most prevalent in a prior day session. Participants will respond to future tests of value as they offer favorable entry and exit.
MCPOCs: POCs are valuable as they denote areas where two-sided trade was most prevalent over numerous day sessions. Participants will respond to future tests of value as they offer favorable entry and exit.
Volume-Weighted Average Prices (VWAPs): A metric highly regarded by chief investment officers, among other participants, for quality of trade. Additionally, liquidity algorithms are benchmarked and programmed to buy and sell around VWAPs.
About
After years of self-education, strategy development, mentorship, and trial-and-error, Renato Leonard Capelj began trading full-time and founded Physik Invest to detail his methods, research, and performance in the markets.
Capelj also develops insights around impactful options market dynamics at SpotGamma and is a Benzinga reporter.
In no way should the materials herein be construed as advice. Derivatives carry a substantial risk of loss. All content is for informational purposes only.
The Daily Brief is a free glimpse into the prevailing fundamental and technical drivers of U.S. equity market products. Join the 200+ that read this report daily, below!
Tuesday’s selling came alongside Russia cutting gas to Poland and Bulgaria, Vice President Kamala Harris testing positive for COVID-19, and heavy selling in growth and tech stocks, amid doubts corporate profits can withstand the Federal Reserve’s bid to tame inflation.
As Jerome Schneider of Pacific Investment Management Co says, QT will “have a profound effect on the cost of liquidity and more importantly the cost of transacting business and reallocating assets from one avenue to another avenue.”
“There might not necessarily be a rapid deceleration or decline in the stock market or other risk assets, but there’s going to be a changing cost of capital that this balance sheet is going to be part of.”
After the close, weakness continued. Alphabet Inc (NASDAQ: GOOGL) (NASDAQ: GOOG) missed on slowing sales growth and digital-ad spending. One of the biggest losers was Tesla Inc (NASDAQ: TSLA) which shed 12% or so on news that Elon Musk would use his fortune, much of which is tied up in Tesla, to buy Twitter Inc (NYSE: TWTR).
Germany’s passage of a bigger borrowing budget, coupled with China’s pledge to boost infrastructure bolstered an overnight advance that fed into price action at home. The S&P 500, in particular, for a brief moment, took back a key level, negating much of yesterday’s liquidation.
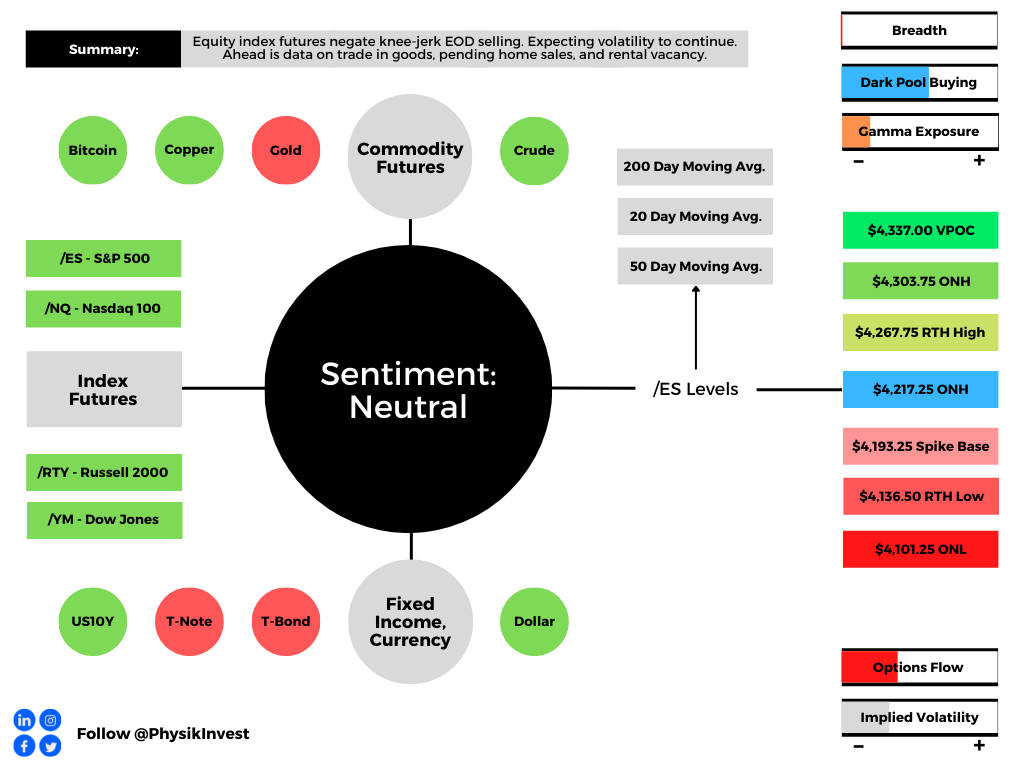
Ahead is data on international trade in goods (8:30 AM ET), as well as pending home sales and the rental vacancy rate (10:00 AM ET).
Graphic updated 7:00 AM ET. Sentiment Neutral if expected /ES open is inside of the prior day’s range. /ES levels are derived from the profile graphic at the bottom of the following section. Levels may have changed since initially quoted; click here for the latest levels. SqueezeMetrics Dark Pool Index (DIX) and Gamma (GEX) calculations are based on where the prior day’s reading falls with respect to the MAX and MIN of all occurrences available. A higher DIX is bullish. At the same time, the lower the GEX, the more (expected) volatility. Learn the implications of volatility, direction, and moneyness. SHIFT data used for S&P 500 (INDEX: SPX) options activity. Note that options flow is sorted by the call premium spent; if more positive, then more was spent on call options. Breadth reflects a reading of the prior day’s NYSE Advance/Decline indicator. VIX reflects a current reading of the CBOE Volatility Index (INDEX: VIX) from 0-100.
What To Expect
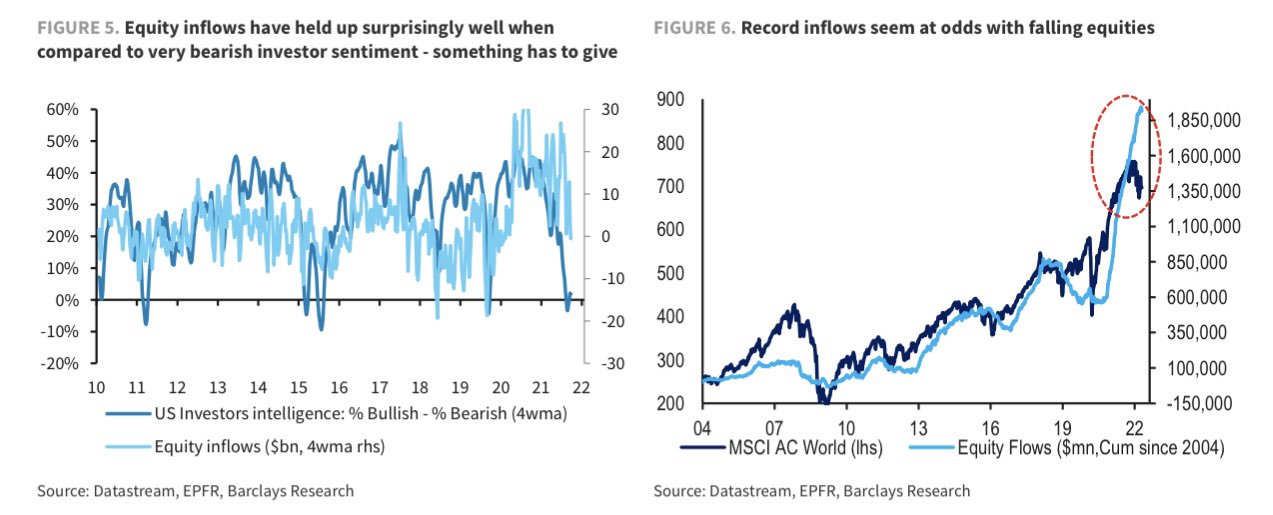
Positioning: Markets are positioned for continued volatility.
Based on a reading of market gamma exposure (GEX) and buying support (DIX), the returns distribution is skewed positive. There’s buying in the context of an environment in which the hedging of options positioning implies selling into weakness and buying of strength.
Graphic: Via Barclays PLC (NYSE: BCS) research.
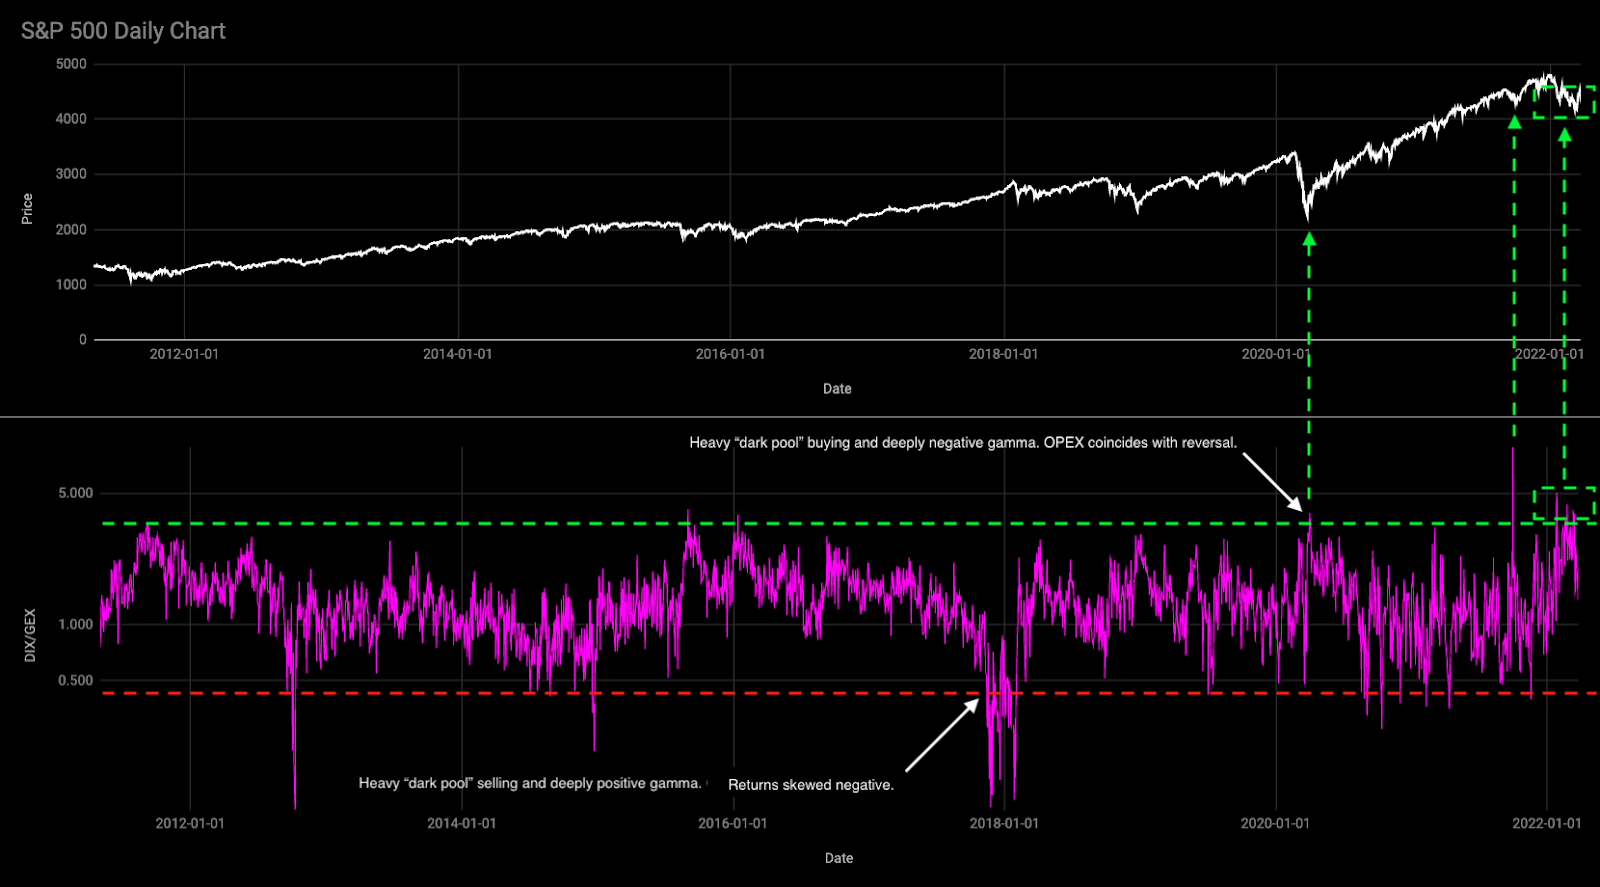
In the most simple way that I can explain: when positioning is stretched one way, that often tends to mark a turning point – the returns distribution is either skewed positive or negative.
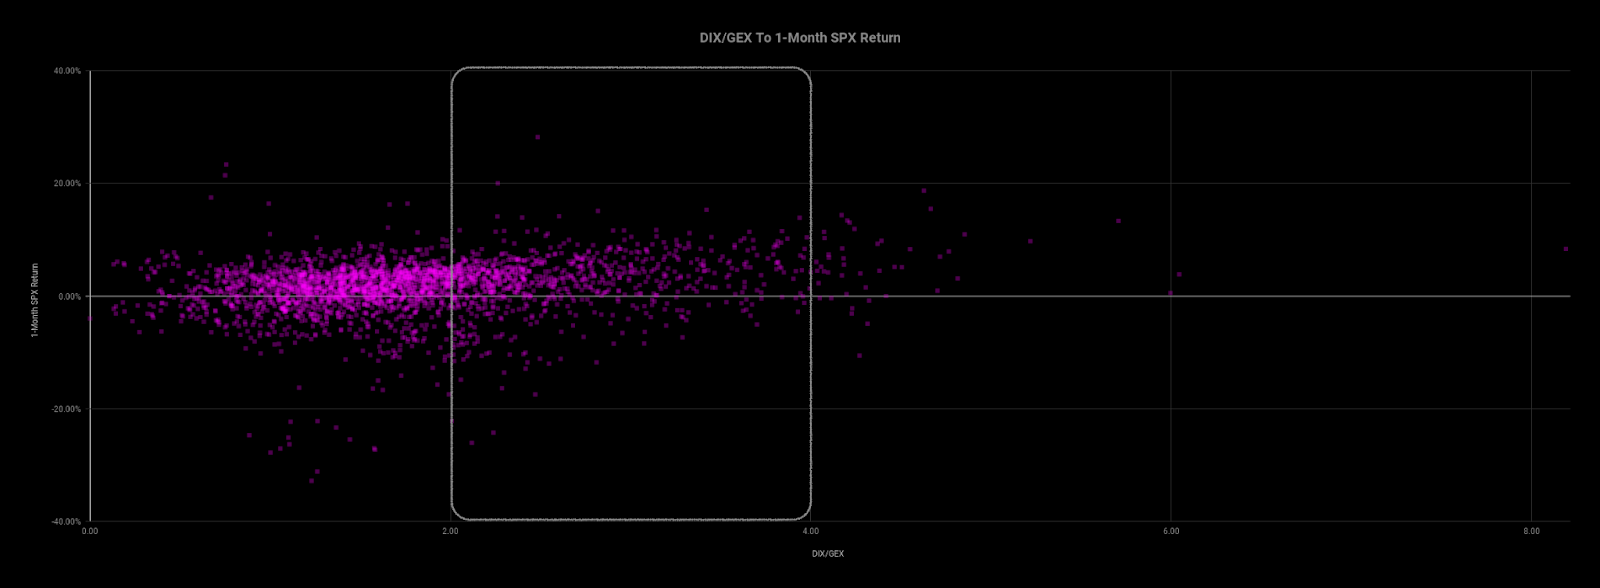
Graphic: Via Physik Invest. Data via SqueezeMetrics. Updated March of 2022. A high DIX/GEX ratio often portends positive 1-month returns.
An updated read, after Tuesday’s weak close, tells us that we can (1) definitely expect larger ranges to continue and (2) potential for short-term bounces.
Based on overnight activity, one of those is happening, now.
Graphic: Via Physik Invest. Data via SqueezeMetrics.
This is as participants are both well-hedged and using weakness as an opportunity to buy into a less highly valued market.
Well-hedged means that customers (i.e., you and I) own protection against long equity exposure. So, that could mean customers own puts and/or are short calls. One of the most dominant flows is the long put, short call.
Such trade offers customers positive, yet asymmetric (gamma), exposure to direction (delta). In other words, negative delta and positive gamma.
The counterparty has exposure to positive delta and negative gamma. If the underlyings trade lower and volatility rises, all else equal, the position will lose. To hedge against these losses, the counterparties will sell underlying into weakness.
If prices reverse and move higher, these counterparties will re-hedge and buy underlying.
Normally, as seen over the bull run of 2020 and 2021, markets are in an uptrend and there’s a strong supply of volatility. Often, customers sell more calls than puts and, in an uptrend, those calls solicit more active hedging than the put options.
Recall that the customer is short the call. That means the counterparty is long the call (a positive delta and gamma trade) and will make money if prices rise, all else equal.
The hedging of this particular exposure (i.e., sell strength, buy weakness), in an uptrend, occurs slower (i.e., counterparts will allow their profits to run), and that’s what can help the market sustain lower volatility trends for longer periods.
When prices reverse and underlyings trade lower, put options solicit increased hedging activity. Given the nature of counterparty exposure to those puts, that hedging happens quickly and can take from market liquidity as to volatility (i.e., buy strength, sell weakness).
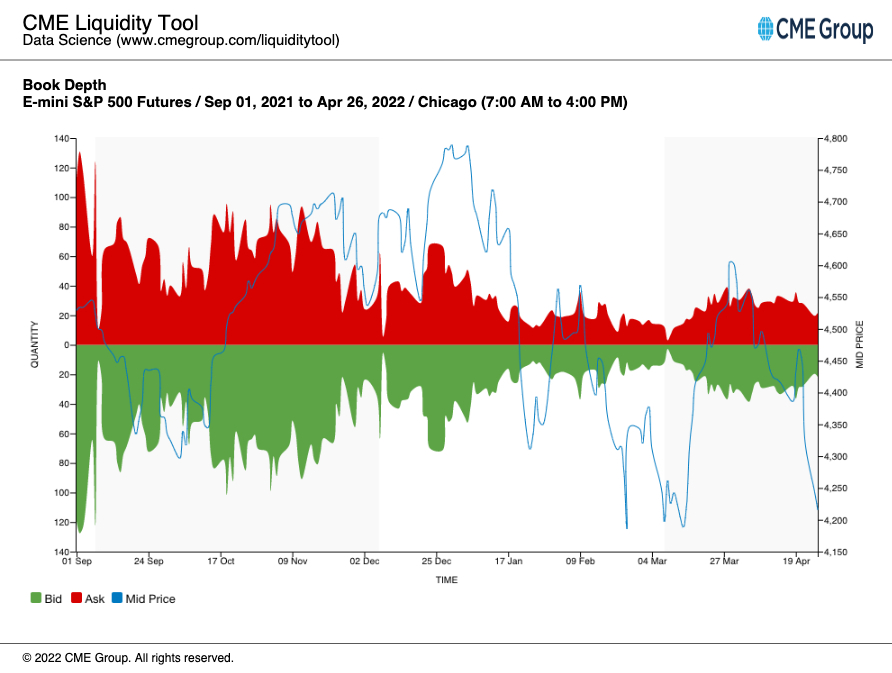
See, below, E-mini S&P 500 book depth, a proxy for market liquidity, and how much it has declined since the end of last year when markets became more volatile and noise around the Federal Reserve’s intent to taper bond-buying and raise rates grew louder.
Graphic: Via CME Group Inc (NASDAQ: CME) Liquidity Tool. Note how in late March, book depth rose as markets rose and customer call activity solicited increased hedging of counterparty long-gamma exposure (i.e., buy weakness, sell strength), adding to market liquidity.
In the above environment, counterparty hedging matters; the market is more sensitive to the flow, so to speak. That sensitivity is expected to continue.
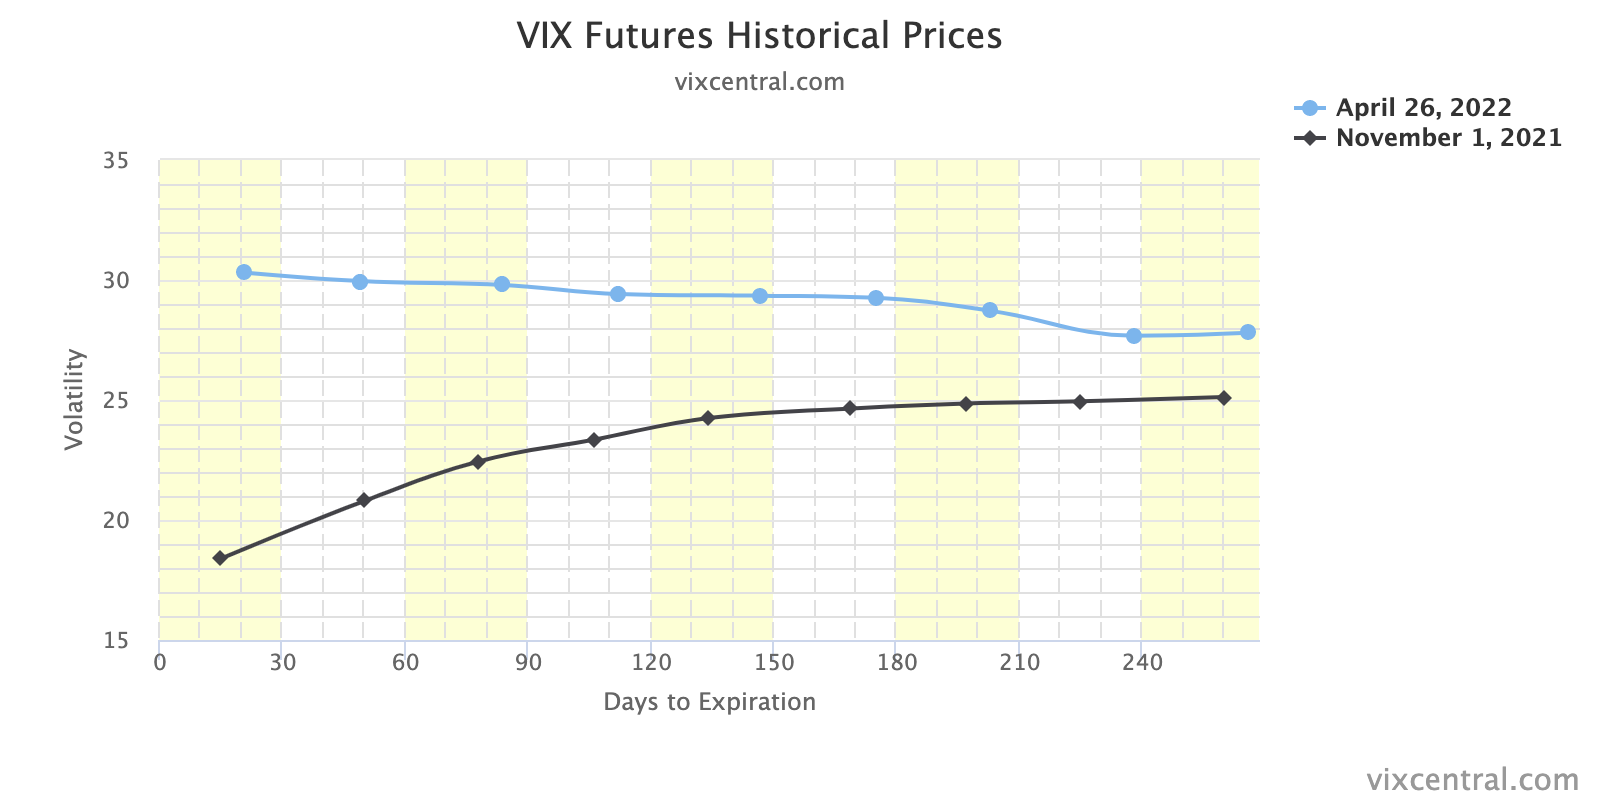
SpotGamma, an options data and analysis service, sees the early May period as pivotal. Then is the Federal Open Market Committee (FOMC) meeting and the potential Russian default, per Moody’s Corporation (NYSE: MCO).
As quoted: “Russia ‘may be considered in default’ if it does not pay two bonds in US dollars by end of a grace period on May 4.”
Until those events are resolved, participants will likely continue to (remain) hedge(d). Upon resolve, customers likely monetize their protection to offset losses on underlying equity exposure.
That means selling volatility which reduces counterparty exposure to short puts (negative gamma and positive delta). To re-hedge, underlying is bought back and that may support a price rise.
Graphic: VIX term structure via VIX Central. Expansion (higher) solicits counterparty selling which pressures the market lower. Compression (lower) solicits counterparty buying which bolsters attempts higher.
Whether that price rise has legs depends on what the fundamental situation is, then. See the below section titled Considerations for a full technical picture and the most likely turning points.
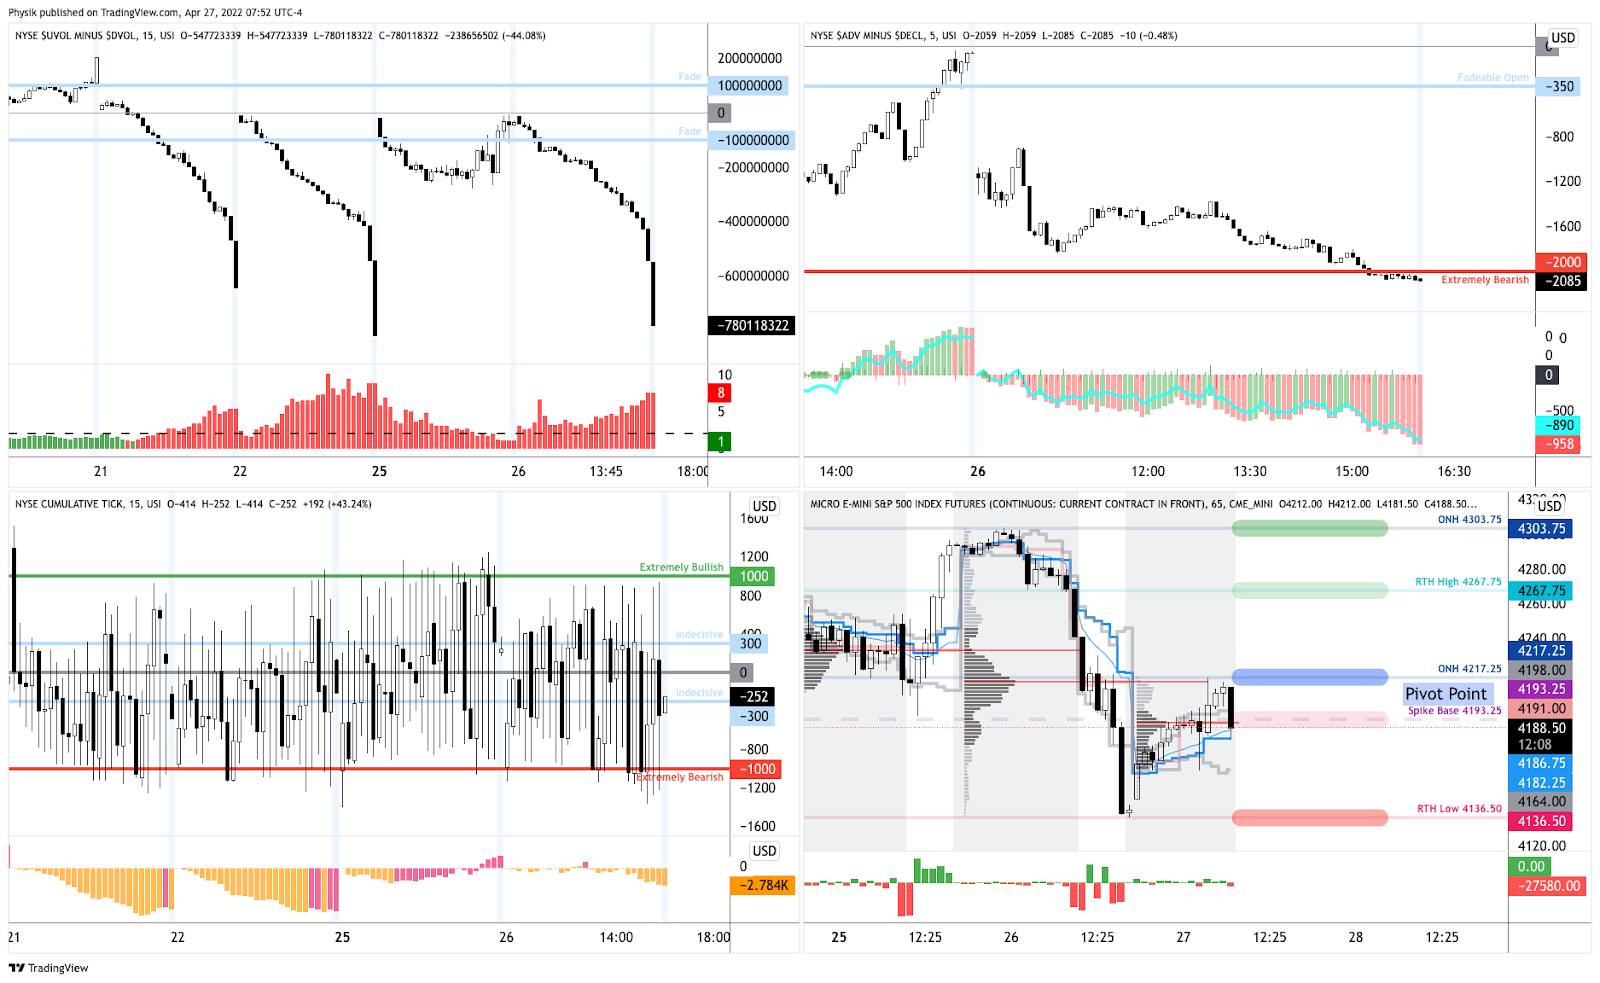
Technical: As of 7:00 AM ET, Wednesday’s regular session (9:30 AM – 4:00 PM ET), in the S&P 500, will likely open in the middle part of a balanced overnight inventory, inside of prior-range and -value, suggesting a limited potential for immediate directional opportunity.
In the best case, the S&P 500 trades higher; activity above the $4,217.25 overnight high (ONH) puts in play the $4,267.75 regular trade high (RTH High). Initiative trade beyond the RTH High could reach as high as the $4,303.75 ONH and $4,337.00 VPOC, or higher.
In the worst case, the S&P 500 trades lower; activity below the $4,217.25 ONH puts in play the $4,193.25 spike base. Initiative trade beyond the spike base could reach as low as the $4,136.50 regular trade low (RTH Low) and $4,101.25 overnight low (ONL), or lower.
Considerations: Spikes mark the beginning of a break from value. Spikes higher (lower) are validated by trade at or above (below) the spike base (i.e., the origin of the spike).
Additionally, the indexes continue to trade below their 20-, 50-, and 200-day simple moving averages, confirming the trend change and bearish tone (further validated by poor breadth).
Graphic: Market Internals as pioneered by (a mentor of mine) Peter Reznicek. Notice the indicator in the top right, weighted S&P sectors (histogram) versus unweighted (blue line). During late last week, participants sold the entire market, heavily (as supported by the difference between the volume flowing into stocks that are up versus those that are down).
All indexes remain, as stated, yesterday, below their volume-weighted average prices (VWAPs) anchored from the start of this year (or their respective peaks).
VWAPs are a metric highly regarded by chief investment officers (CIOs), among other participants, for quality of trade. Liquidity algorithms, too, are benchmarked and programmed to buy and sell around VWAPs.
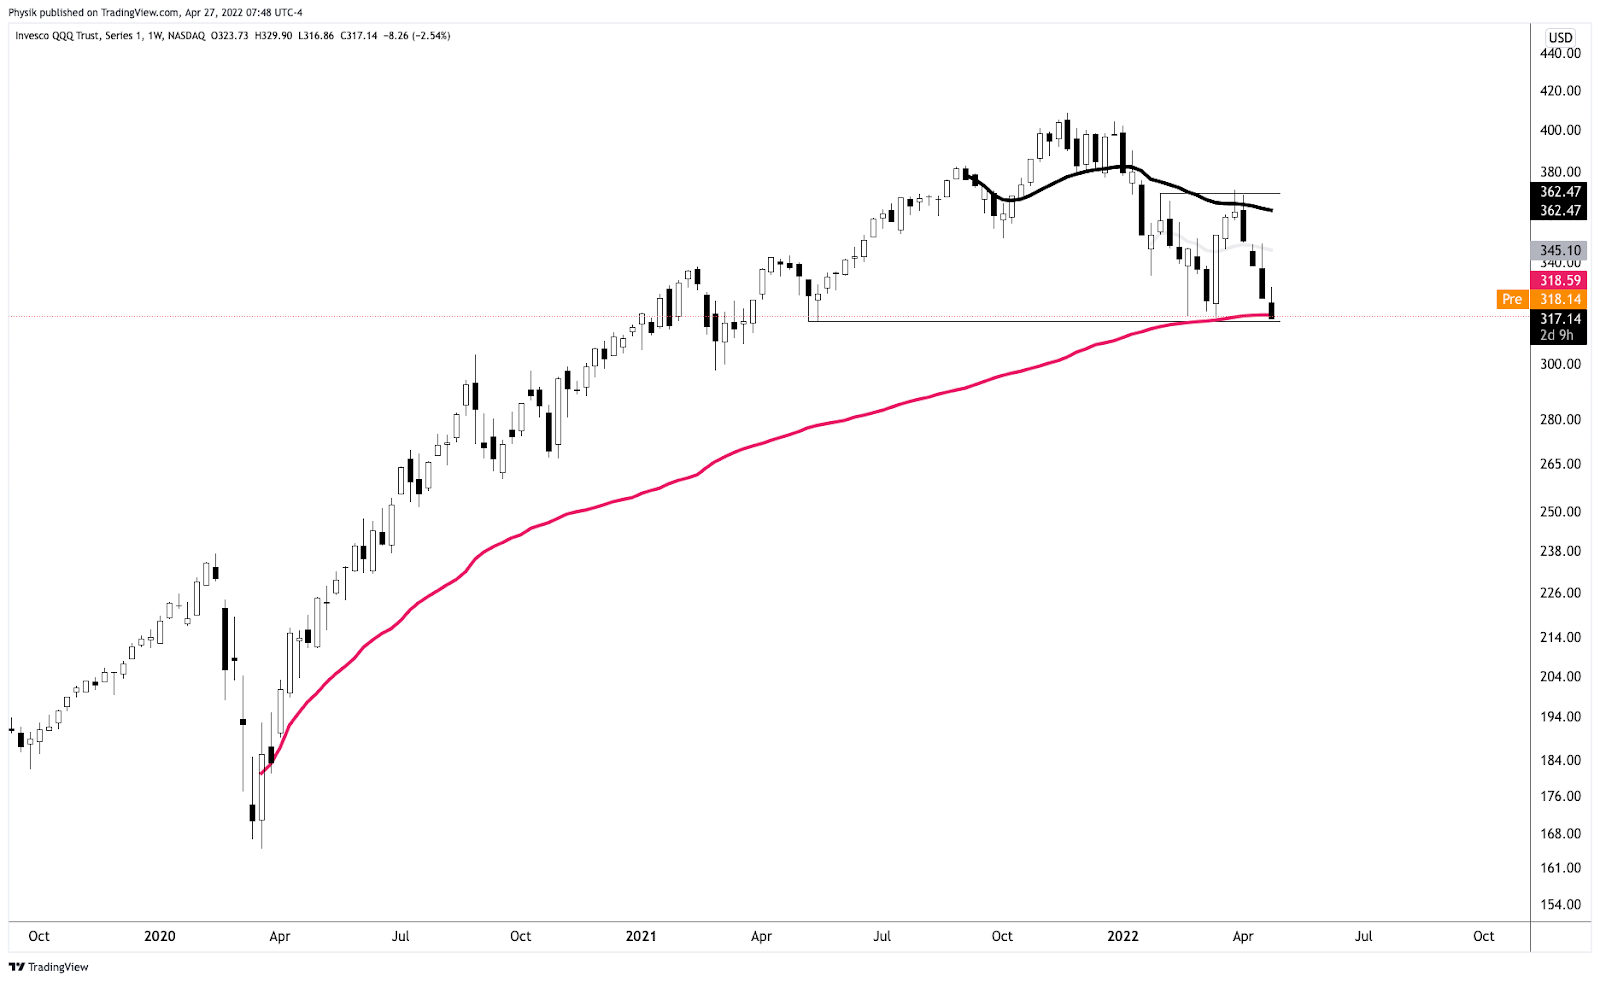
The Invesco QQQ Trust Series 1 (NASDAQ: QQQ) just tested a major VWAP, yesterday, anchored from the lows of March 2020. That’s a fair price to pay for Nasdaq 100 exposure.
Graphic: Invesco QQQ Trust Series 1 (NASDAQ: QQQ) with anchored VWAPs.
Notwithstanding, notice the flat-to-declining AVWAP that’s black in color. So long as prices remain below this level, the index is likely a sell.
Should that level flatten (and begin to rise), and if the QQQ was able to trade above it for a sustained period, there is potential for sustained upside.
Click here to load today’s key levels into the web-based TradingView charting platform. Note that all levels are derived using the 65-minute timeframe. New links are produced, daily.
Graphic: 65-minute profile chart of the Micro E-mini S&P 500 Futures.
Definitions
Overnight Rally Highs (Lows): Typically, there is a low historical probability associated with overnight rally-highs (lows) ending the upside (downside) discovery process.
Volume Areas: A structurally sound market will build on areas of high volume (HVNodes). Should the market trend for long periods of time, it will lack sound structure, identified as low volume areas (LVNodes). LVNodes denote directional conviction and ought to offer support on any test.
If participants were to auction and find acceptance into areas of prior low volume (LVNodes), then future discovery ought to be volatile and quick as participants look to HVNodes for favorable entry or exit.
POCs: POCs are valuable as they denote areas where two-sided trade was most prevalent in a prior day session. Participants will respond to future tests of value as they offer favorable entry and exit.
About
After years of self-education, strategy development, mentorship, and trial-and-error, Renato Leonard Capelj began trading full-time and founded Physik Invest to detail his methods, research, and performance in the markets.
Capelj also develops insights around impactful options market dynamics at SpotGamma and is a Benzinga reporter.
In no way should the materials herein be construed as advice. Derivatives carry a substantial risk of loss. All content is for informational purposes only.
The Daily Brief is a free glimpse into the prevailing fundamental and technical drivers of U.S. equity market products. Join the 200+ that read this report daily, below!
Editor’s Note: Hey team, thanks again for your reading of this daily newsletter. Due to travel commitments, I will not be writing reports consistently for the rest of this month.
Don’t expect any updates until Monday, April 11, 2022. Thereafter, coverage may be sporadic for the rest of the month.
What Happened
Overnight, equity index futures were higher after exploring lower, briefly. Commodities were mixed while bonds were lower and implied volatility measures were bid.
In terms of news, the European Union said it was interested in penalizing Russia, further, for its actions in Ukraine. This is as China battles new COVID-19 sub-strains.
Ahead is data on factory and core capital equipment orders (10:00 AM ET).
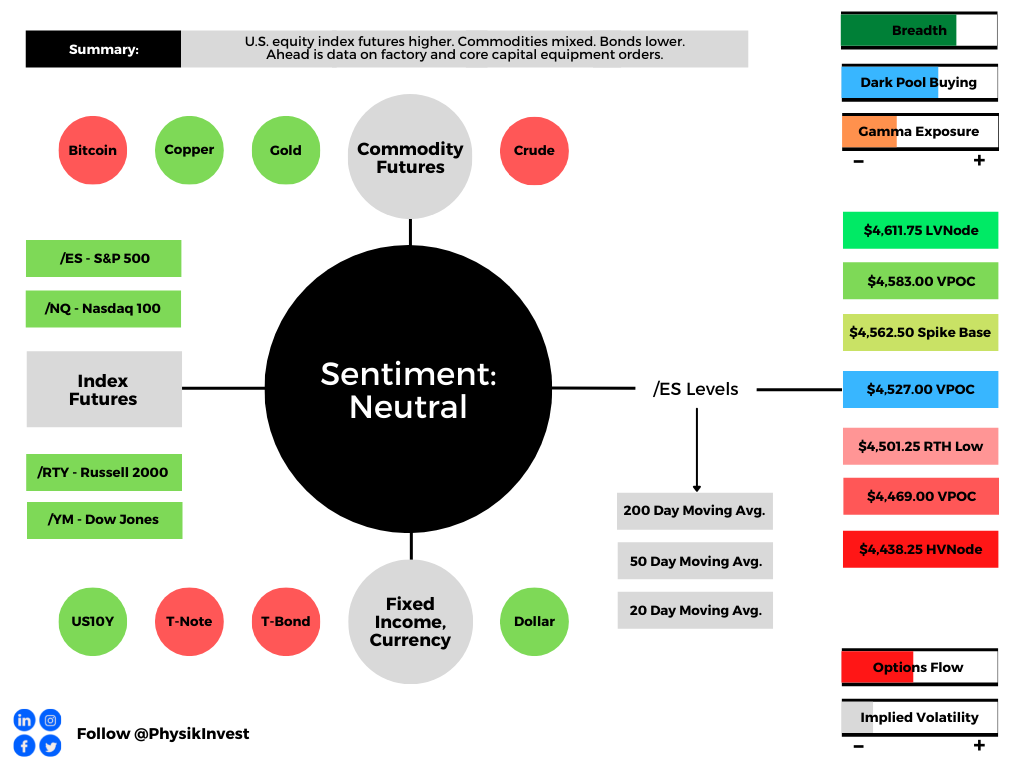
Graphic updated 5:45 AM ET. Sentiment Neutral if expected /ES open is inside of the prior day’s range. /ES levels are derived from the profile graphic at the bottom of the following section. Levels may have changed since initially quoted; click here for the latest levels. SqueezeMetrics Dark Pool Index (DIX) and Gamma (GEX) calculations are based on where the prior day’s reading falls with respect to the MAX and MIN of all occurrences available. A higher DIX is bullish. At the same time, the lower the GEX, the more (expected) volatility. Learn the implications of volatility, direction, and moneyness. SHIFT data used for S&P 500 (INDEX: SPX) options activity. Note that options flow is sorted by the call premium spent; if more positive, then more was spent on call options. Breadth reflects a reading of the prior day’s NYSE Advance/Decline indicator. VIX reflects a current reading of the CBOE Volatility Index (INDEX: VIX) from 0-100.
What To Expect
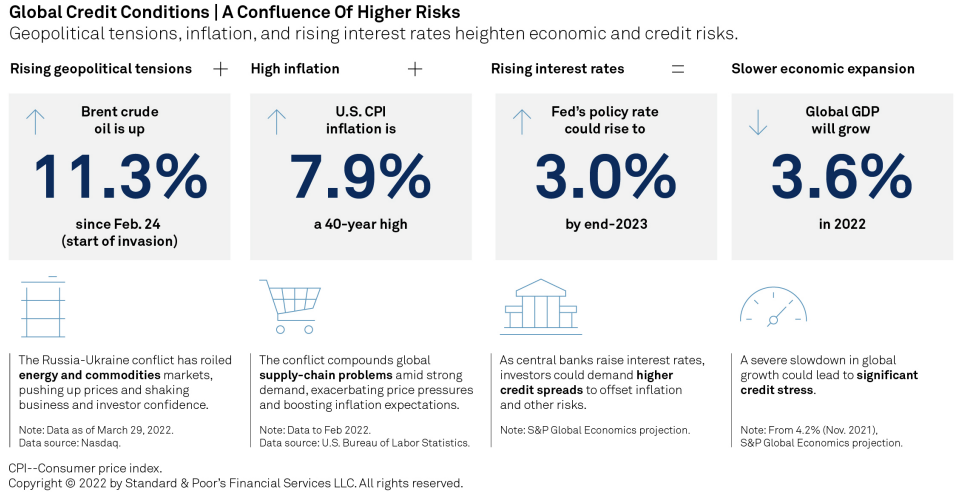
Fundamental: In the face of geopolitical tension, supply pressures, and inflation, consumer sentiment is at or below pandemic levels, prompting the Federal Reserve (Fed) to destimulate.
Graphic: Via S&P Global Inc (NYSE: SPGI) research. “Confluence Of Risks Halts Positive Credit Momentum.
“It has entered 2008-09 territory and is not far from all-time lows in the ‘80s when inflation and interest rates hit double digits,” ARK Invest’s Catherine Wood explained in a Twitter discussion on yield-curve inversions and aggressive action by the Federal Reserve, as well as inflation.
“The economy succumbed to recession in each of those periods. Europe and China are also in difficult straits. The Fed seems to be playing with fire.”
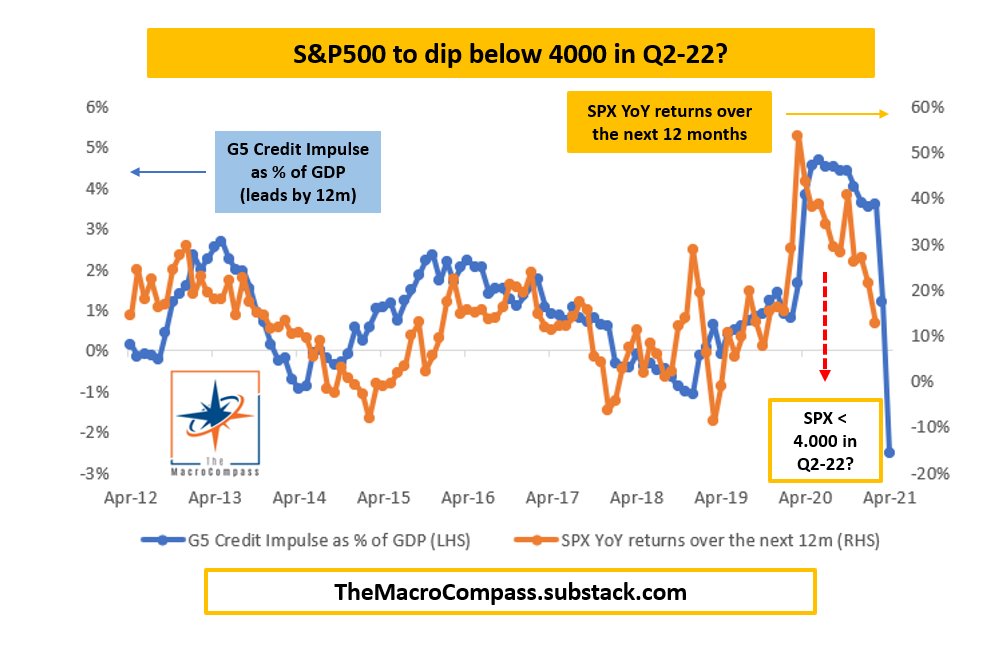
In accordance, the Macro Compass’ Alfonso Peccatiello explains that his credit impulse metrics, which lead economic activity and risk asset performance, imply a slowdown in earnings.
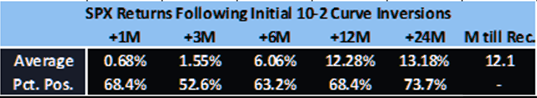
Still, in spite of these metrics, on average, recessions happen 12 to 24 months after the first yield curve inversions, according to Jefferies Financial Group Inc (NYSE: JEF).
Post-inversion S&P 500 performance, actually, is often positive.
Bolstering the call for positive equity market performance are strong seasonality trends during Fed-rate-hike episodes, a contraction in equity risk premia, and “still accommodative” monetary policy, per explanations by rates strategist Rishi Mishra.
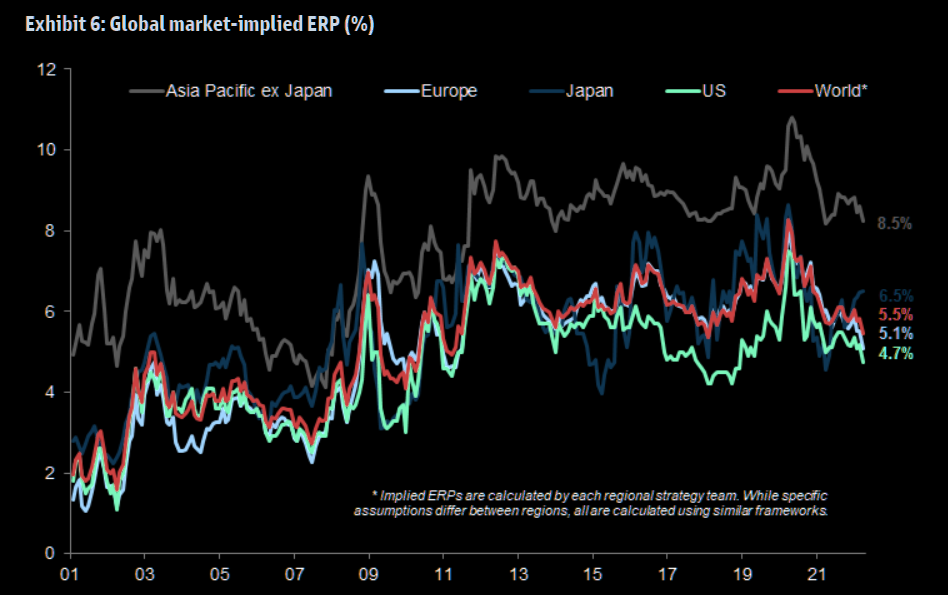
Graphic: Via Goldman Sachs Group Inc (NYSE: GS). Taken from The Market Ear. “Equities are a real asset as they make a claim on nominal GDP. In the post-financial crisis era, weak economic activity and lower inflation pushed down nominal GDP, raising the equity risk premium and reducing the bond term premium. So as long as economies grow, revenues and dividends should also grow. The dividend yield can be thought of as a real yield. Equity risk premia have started to decline in the post COVID cycle but remain higher than in the pre-financial crisis era.”
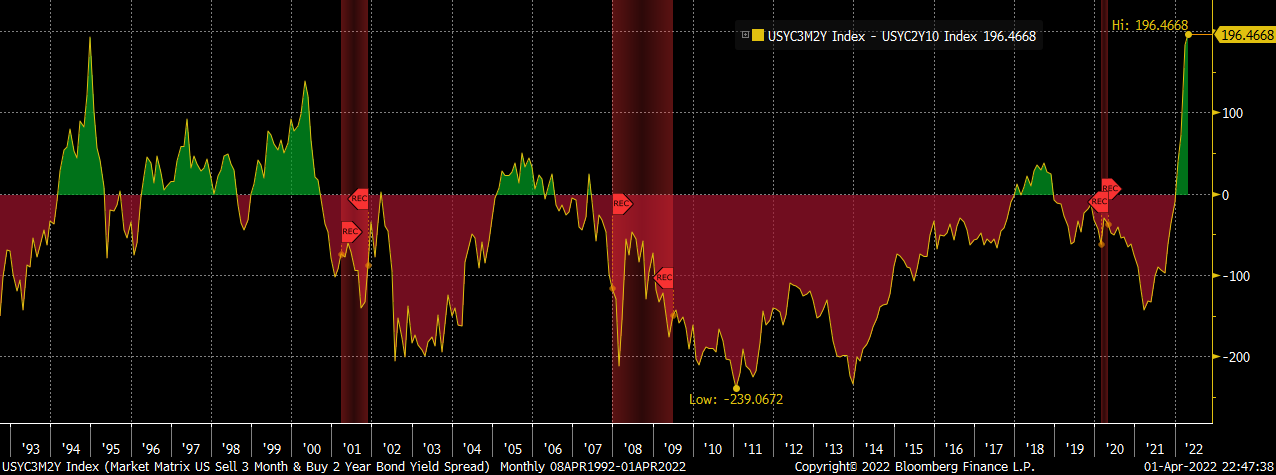
“[T]he 3ms2s vs 2s10s spread (or the 3m2s10s fly) is the widest it has been since the end of 1994. The widening of this fly is indicative of the fact that while the Fed shifted its guidance from dovish to extremely hawkish, the policy is still accommodative.”
Positioning: The equity market’s ferocious end-of-March rally, which placed the S&P 500 back above a key go/no-go level – the 200-period simple moving average – may have been in part the result of institutional investors purchasing equities ahead of quarterly reporting.
“Remember that stocks settle T+2, meaning that shares are actually owned by buyers two business days after they are purchased in the market,” says Interactive Brokers’ Group Inc (NASDAQ: IBKR) Steve Sosnick.
“That means that institutions who wanted to show stock positions on their quarterly reports would have needed to purchase those shares no later than Tuesday the 29th. The sharp end-of-day runups that we saw on Monday and Tuesday had the hallmarks of aggressive institutional buying.”
According to Deutsche Bank AG (NYSE: DB) analyses, “[a]ggregate equity positioning has now risen off the lows but only to the 22nd percentile and is still well below neutral.”
That said, quarter-end rebalances and options expirations (OPEX) likely do little to upset the balance of trade. Based on a lot of the insights shared in this letter, barring some exogenous event, the market is in a position to drift or balance.
This, as a result, may solicit a “stronger impulse to chase the rally,” at which point JPMorgan Chase & Co (NYSE: JPM) strategists say they would “generally be more concerned.”
A collapse (or convergence) in volatility metrics for different asset classes (like the Merrill Lynch Options Volatility Estimate [INDEX: MOVE] and Cboe Volatility Index [INDEX: VIX]) would bolster the “drift or balance” thesis.
Graphic: Via Physik Invest.
Technical: As of 5:45 AM ET, Monday’s regular session (9:30 AM – 4:00 PM ET), in the S&P 500, will likely open in the upper part of a positively skewed overnight inventory, inside of prior-range and -value, suggesting a limited potential for immediate directional opportunity.
In the best case, the S&P 500 trades higher; activity above the $4,527.00 untested point of control (VPOC) puts in play the $4,562.50 spike base. Initiative trade beyond the spike base could reach as high as the $4,583.00 VPOC and $4,611.75 low volume area (LVNode), or higher.
In the worst case, the S&P 500 trades lower; activity below the $4,527.00 VPOC puts in play the $4,501.25 regular trade low (RTH Low). Initiative trade beyond the RTH Low could reach as low as the $4,469.00 VPOC and $4,438.25 HVNode, or lower.
Considerations: Spikes often mark the beginning of a break from value. Spikes higher (lower) are validated by trade at or above (below) the spike base (i.e., the origin of the spike).
In a spike up (down) situation, trade below (above) the spike base, negates the buying (selling).
Click here to load today’s key levels into the web-based TradingView charting platform. Note that all levels are derived using the 65-minute timeframe. New links are produced, daily.
Graphic: 65-minute profile chart of the Micro E-mini S&P 500 Futures.
The price strength in the SP500 lately has been impressive. But it is not even being confirmed (yet) by a higher high in the HY Bond A-D Line. That is less than impressive. pic.twitter.com/6X6DlXksol
Volume Areas: A structurally sound market will build on areas of high volume (HVNodes). Should the market trend for long periods of time, it will lack sound structure, identified as low volume areas (LVNodes). LVNodes denote directional conviction and ought to offer support on any test.
If participants were to auction and find acceptance into areas of prior low volume (LVNodes), then future discovery ought to be volatile and quick as participants look to HVNodes for favorable entry or exit.
POCs: POCs are valuable as they denote areas where two-sided trade was most prevalent in a prior day session. Participants will respond to future tests of value as they offer favorable entry and exit.
About
After years of self-education, strategy development, mentorship, and trial-and-error, Renato Leonard Capelj began trading full-time and founded Physik Invest to detail his methods, research, and performance in the markets.
Capelj also develops insights around impactful options market dynamics at SpotGamma and is a Benzinga reporter.
In no way should the materials herein be construed as advice. Derivatives carry a substantial risk of loss. All content is for informational purposes only.
Equity index futures were sideways to lower with bonds and the dollar.
Nordea: Macro backdrop worsens.
Ahead is a relatively light calendar.
October is volatile while Q4 bullish.
What Happened: U.S. stock index futures auctioned sideways to lower overnight alongside reports that China was showing little interest in a direct bailout of Evergrande and U.S. political leaders remain at odds on the debt limit.
Ahead is data on factory orders and core capital goods orders (10:00 AM ET).
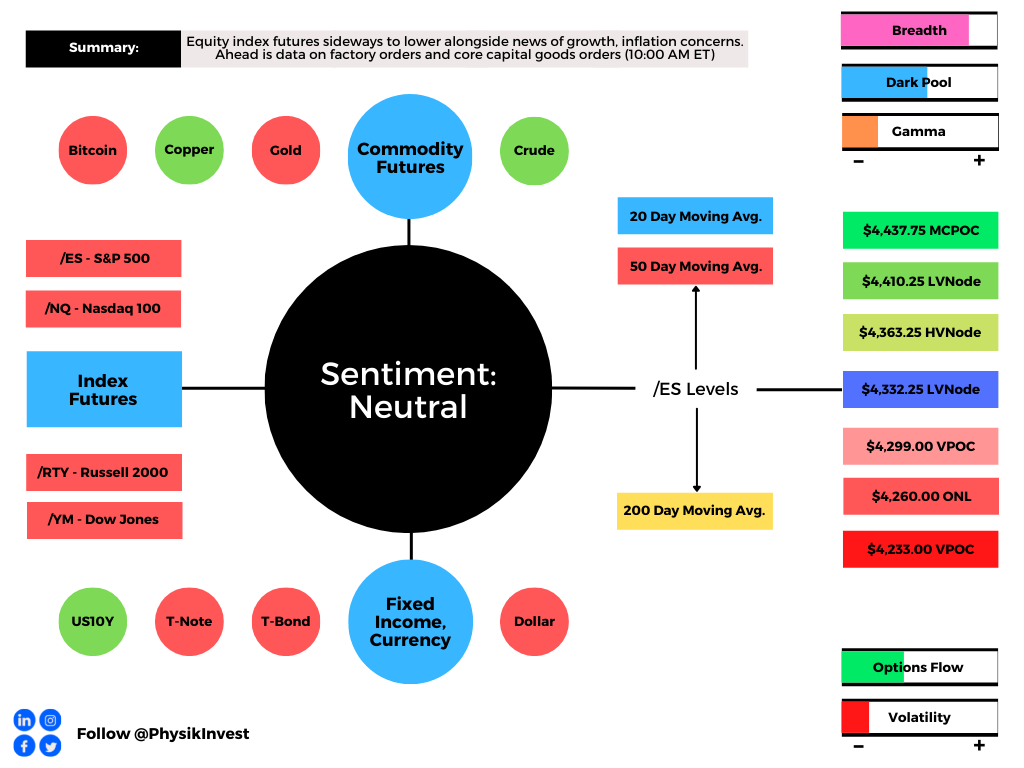
Graphic updated 6:30 AM ET. Sentiment Neutral if expected /ES open is inside of the prior day’s range. /ES levels are derived from the profile graphic at the bottom of the following section. SqueezeMetrics Dark Pool Index (DIX) and Gamma (GEX) calculations are based on where the prior day’s reading falls with respect to the MAX and MIN of all occurrences available. A higher DIX is bullish. At the same time, the lower the GEX, the more (expected) volatility. SHIFT data used for S&P 500 (INDEX: SPX) options activity. Note that options flow is sorted by the call premium spent; if more positive then more was spent on call options. Breadth reflects a reading of the prior day’s NYSE Advance/Decline indicator. VIX reflects a current reading of the CBOE Volatility Index (INDEX: VIX) from 0-100.
What To Expect: As of 6:30 AM ET, Monday’s regular session (9:30 AM – 4:00 PM EST) in the S&P 500 will likely open inside of prior-range and -value, suggesting a limited potential for immediate directional opportunity.
Adding, during the prior day’s regular trade, on a strengthening of intraday breadth, among other metrics including positioning measures, the best case outcome occurred, evidenced by a recovery of Thursday’s $4,365.00 untested point of control (VPOC).
Given the overnight response at the top of Friday’s value area – the bulk of where trade was conducted – it looks as though participants are interested in slowing the pace of downside discovery.
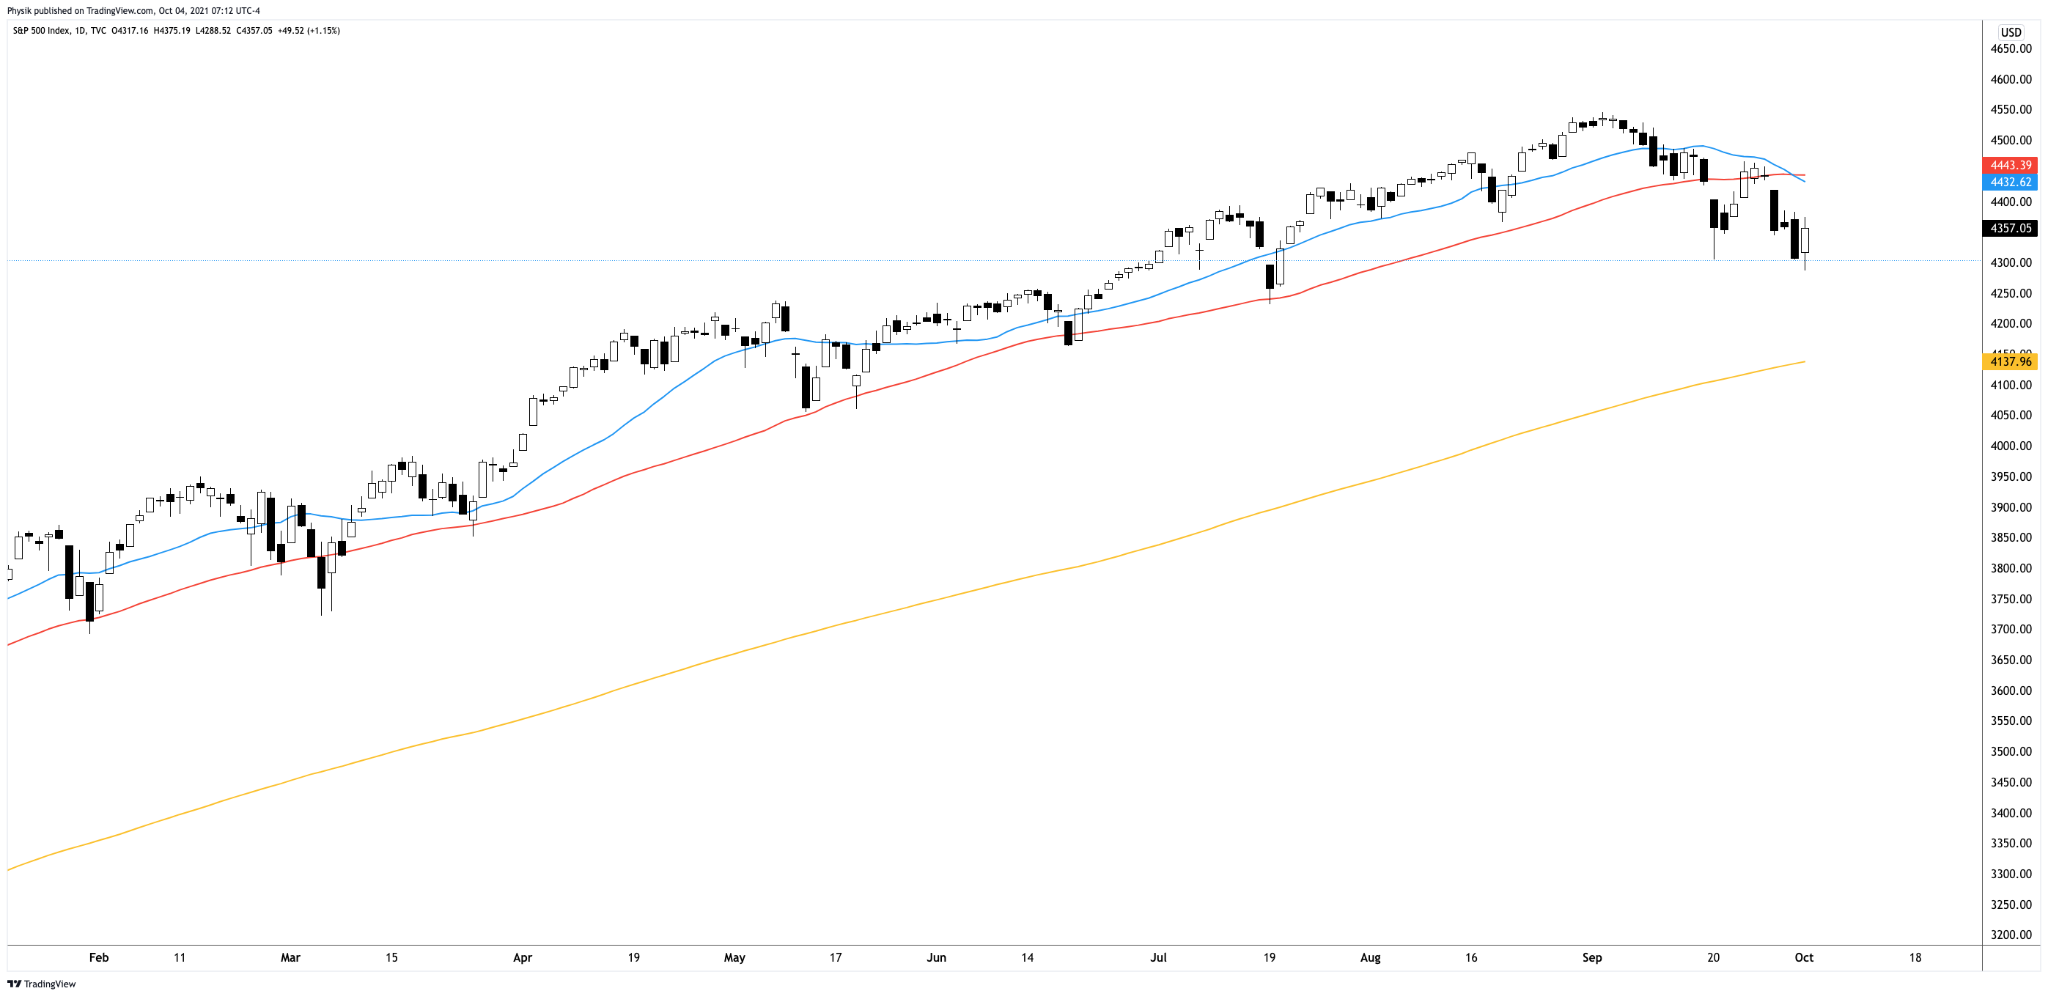
Still, the S&P 500 is well below its 20- and 50-day simple moving averages and multiple distribution profile structures denote emotion, as well as a lack of commitment.
Graphic: S&P 500 daily chart with 20-, 50-, and 200-day simple moving average.
Further, the aforementioned trade is happening in the context of a traditionally volatile October and a fraying in the buy-the-dip psychology.
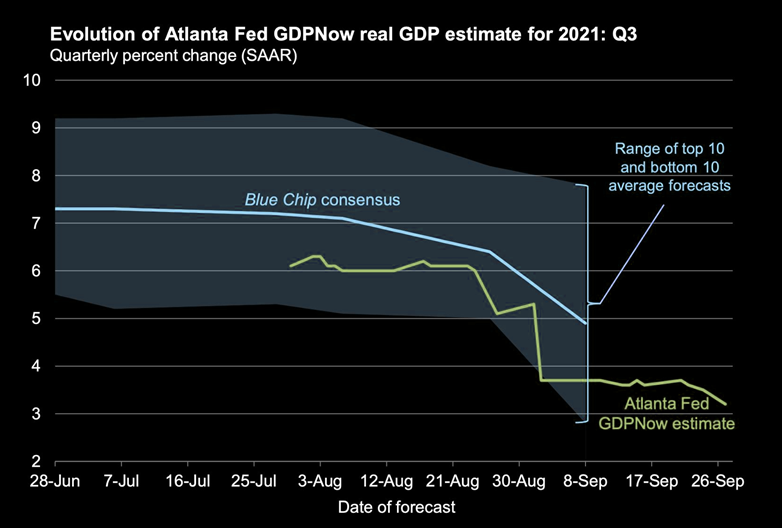
According to Nordea, despite a calm, upward-sloping term structure, there has been “a slightly upward tilting trend” in futures tracking the S&P 500 volatility index, likely warranted by several macro reasons including a worsening in liquidity, a slowdown in growth, cost/margin problems, and risks to the Fed put.
Graphic: Fed’s GDPNow estimate lowers expectations for U.S. economic growth, via The Market Ear.
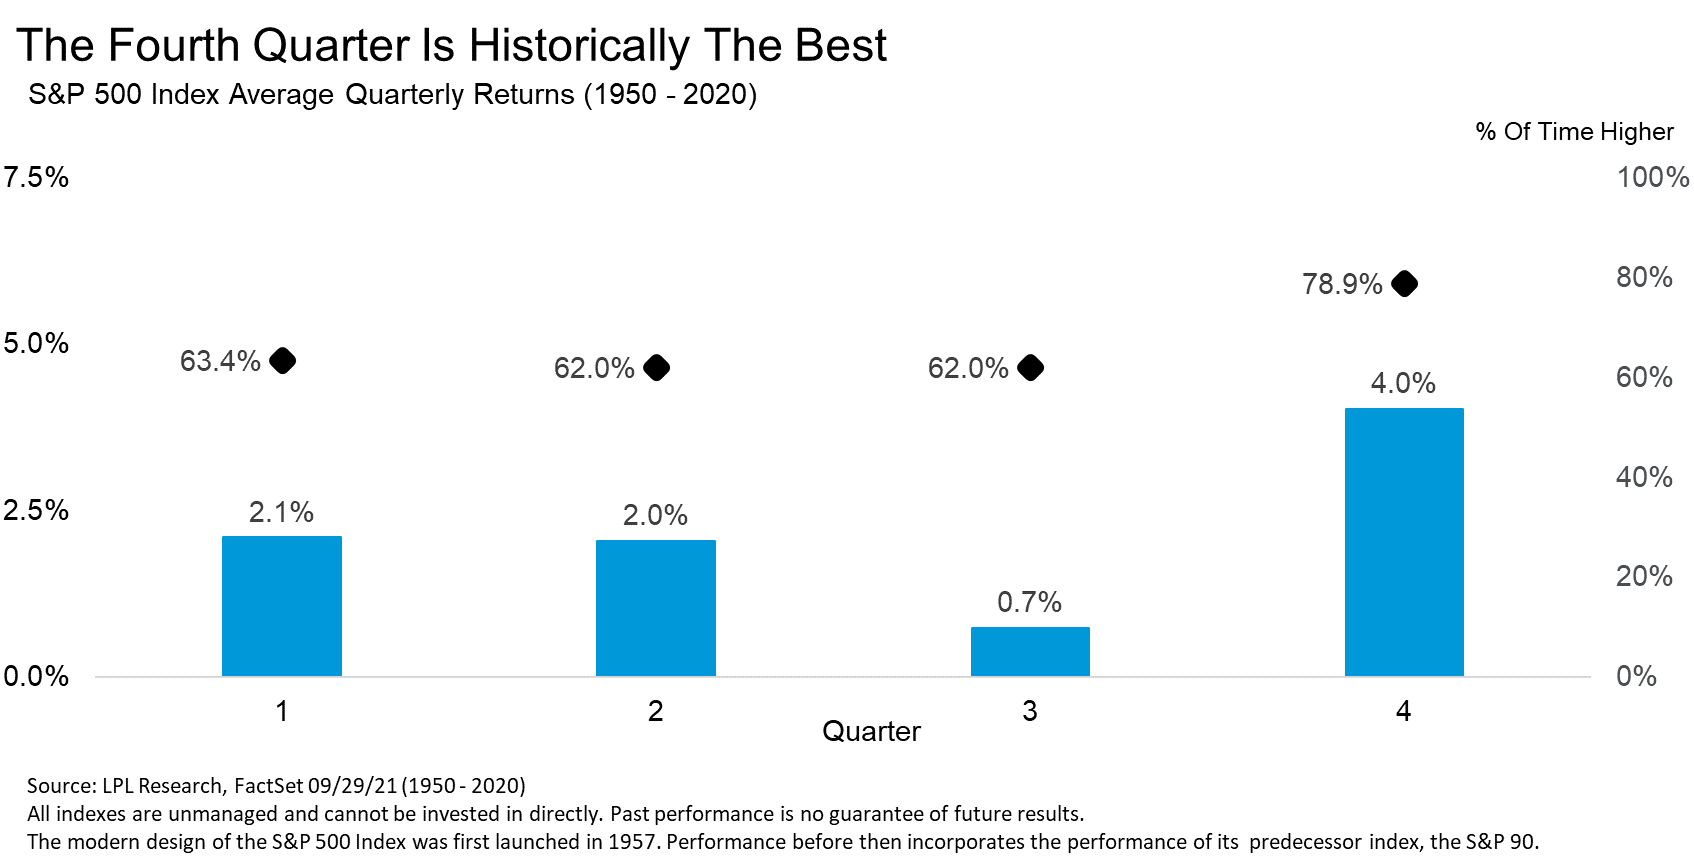
LPL Research adds that aside from October, no other month has seen more 1% moves, and the fourth quarter is “historically the best for stocks, with the third quarter the worst.”
Graphic: LPL Research unpacks S&P 500 seasonality.
Moreover, for today, given expectations of heightened volatility, participants may make use of the following frameworks.
In the best case, the S&P 500 trades sideways or higher; activity above the $4,332.25 low volume area (LVNode) puts in play the $4,363.25 high volume area (HVNode). Initiative trade beyond the HVNode could reach as high as the $4,410.25 LVNode and $4,437.75 micro composite point of control (MCPOC), or higher.
In the worst case, the S&P 500 trades lower; activity below the $4,332.25 LVNode puts in play the $4,299.00 VPOC. Initiative trade beyond the VPOC could reach as low as $4,260.00 overnight low (ONL) and $4,233.00 VPOC, or lower.
Graphic: 65-minute profile chart of the Micro E-mini S&P 500 Futures updated 6:30 AM ET.
Definitions
Overnight Rally Highs (Lows): Typically, there is a low historical probability associated with overnight rally-highs (lows) ending the upside (downside) discovery process.

Volume Areas: A structurally sound market will build on areas of high volume (HVNodes). Should the market trend for long periods of time, it will lack sound structure, identified as low volume areas (LVNodes). LVNodes denote directional conviction and ought to offer support on any test.

If participants were to auction and find acceptance into areas of prior low volume (LVNodes), then future discovery ought to be volatile and quick as participants look to HVNodes for favorable entry or exit.

POCs: POCs are valuable as they denote areas where two-sided trade was most prevalent in a prior day session. Participants will respond to future tests of value as they offer favorable entry and exit.

MCPOCs: POCs are valuable as they denote areas where two-sided trade was most prevalent over numerous day sessions. Participants will respond to future tests of value as they offer favorable entry and exit.

Responsive Buying (Selling): Buying (selling) in response to prices below (above) an area of recent price acceptance.

Price Discovery (One-Timeframe Or Trend): Elongation and range expansion denotes a market seeking new prices to establish value, or acceptance (i.e., more than 30-minutes of trade at a particular price level).
After years of self-education, strategy development, and trial-and-error, Renato Leonard Capelj began trading full-time and founded Physik Invest to detail his methods, research, and performance in the markets.
Additionally, Capelj is a finance and technology reporter. Some of his biggest works include interviews with leaders such as John Chambers, founder and CEO, JC2 Ventures, Kevin O’Leary, businessman and Shark Tank host, Catherine Wood, CEO and CIO, ARK Invest, among others.
Disclaimer
At this time, Physik Invest does not manage outside capital and is not licensed. In no way should the materials herein be construed as advice. Derivatives carry a substantial risk of loss. All content is for informational purposes only.