Categories
Commentary

Daily Brief For March 22, 2023

Physik Invest’s Daily Brief is read free by thousands of subscribers. Join this community to learn about the fundamental and technical drivers of markets.

Graphic updated 8:20 AM ET. Sentiment Neutral if expected /MES open is inside of the prior day’s range./MES levels are derived from the profile graphic at the bottom of this letter. Click here for the latest levels. SqueezeMetrics Dark Pool Index (DIX) and Gamma (GEX) with the latter calculated based on where the prior day’s reading falls with respect to the MAX and MIN of all occurrences available. A higher DIX is bullish. The lower the GEX, the more (expected) volatility. Click to learn the implications of volatility, direction, and moneyness. Breadth reflects a reading of the prior day’s NYSE Advance/Decline indicator. The CBOE VIX Volatility Index (INDEX: VVIX) reflects the attractiveness of owning volatility. UMBS prices via MNDClick here for the economic calendar.

Administrative

Recall our past letters pondering the use of the yuan for settlements in the East. Well, there’s been progress on that end.

Also recall “the recycling of petrodollars by oil-rich nations” fueling “several emerging market debt crises” and prompting “the creation of a more speculative, debt-fueled economy in the US.” Is this a reversing trend? We shall unpack in a future letter, soon.

Fundamental

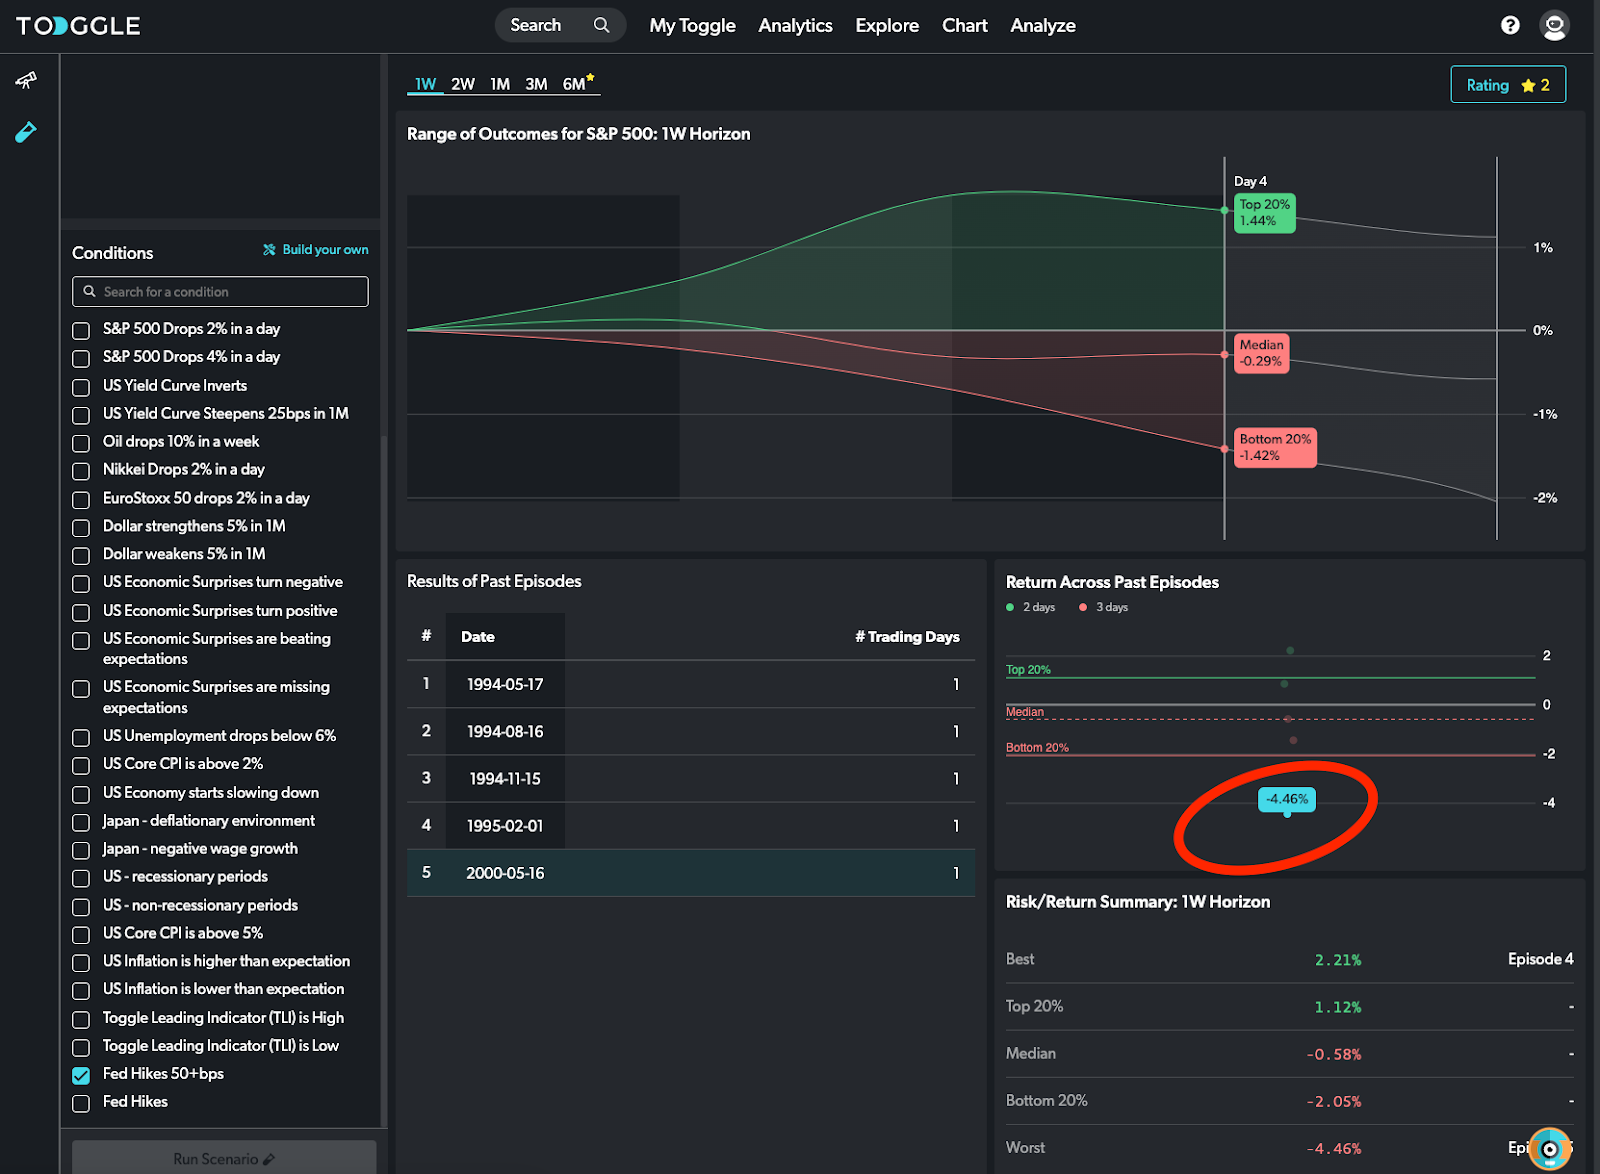
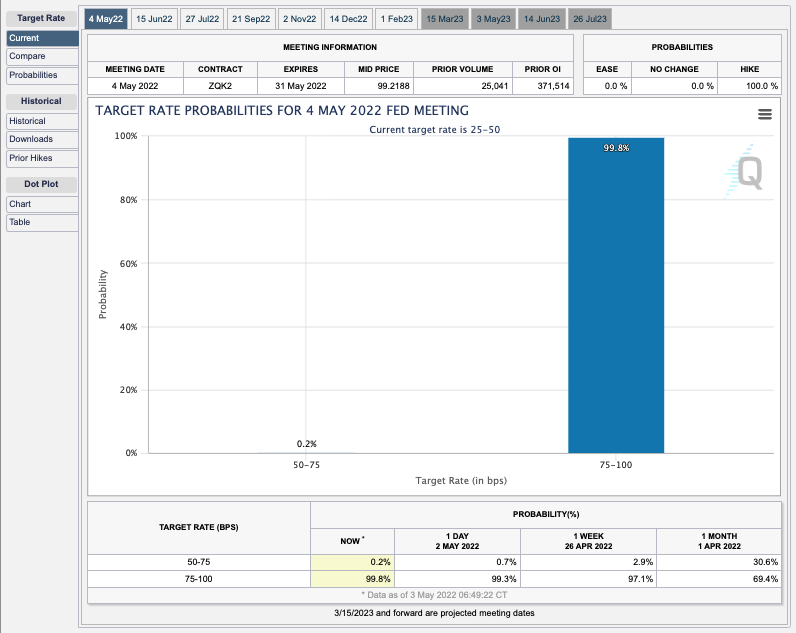
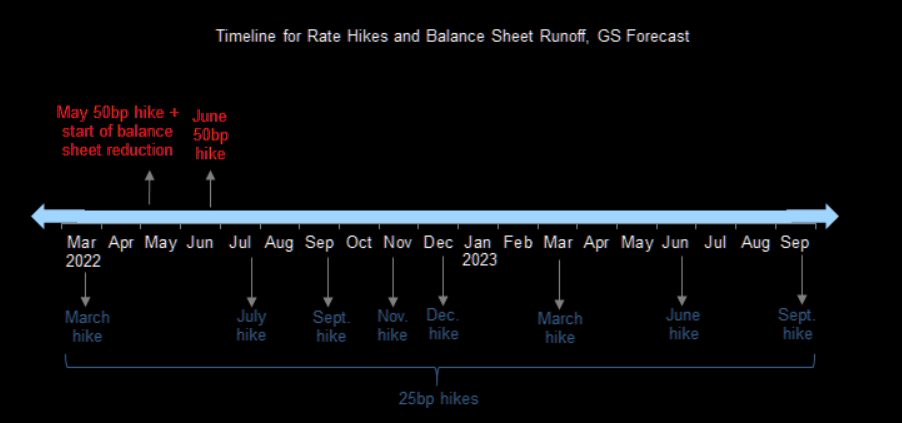
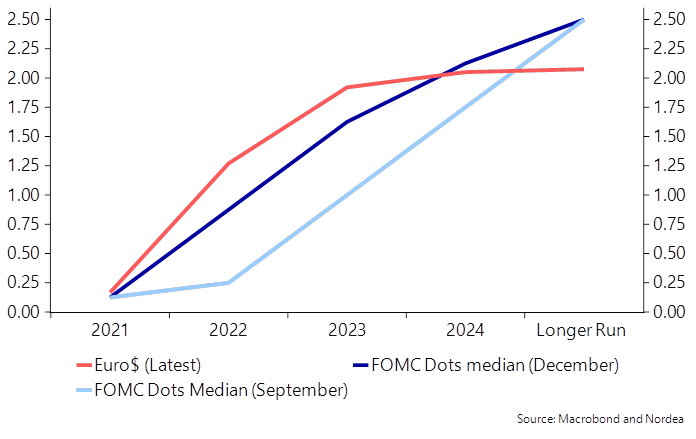
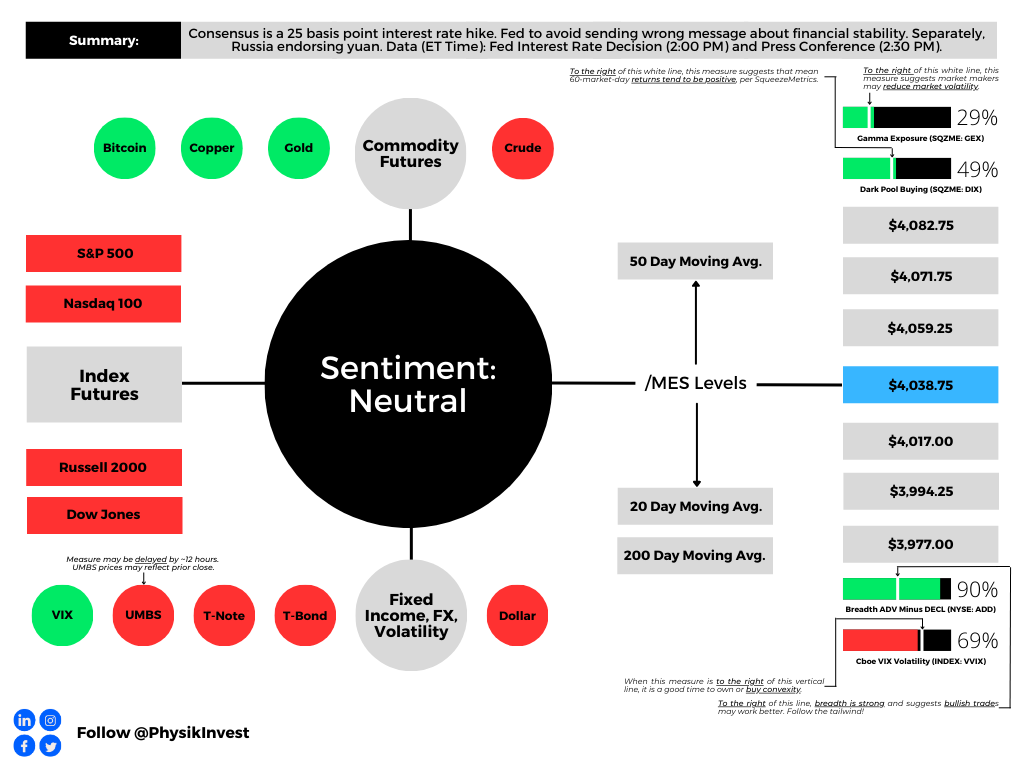
The Federal Reserve (Fed) is likely to bump its current target rate up 25 basis points to 4.75-5.00%. Failing to bump interest rates would likely send the wrong message about financial stability. To give up on the inflation fight (a pause or interest rate cut) would tell investors “look out below,” Bloomberg summarizes.

Graphic: Retrieved from CME Group Inc’s (NASDAQ: CME) FedWatch Tool.

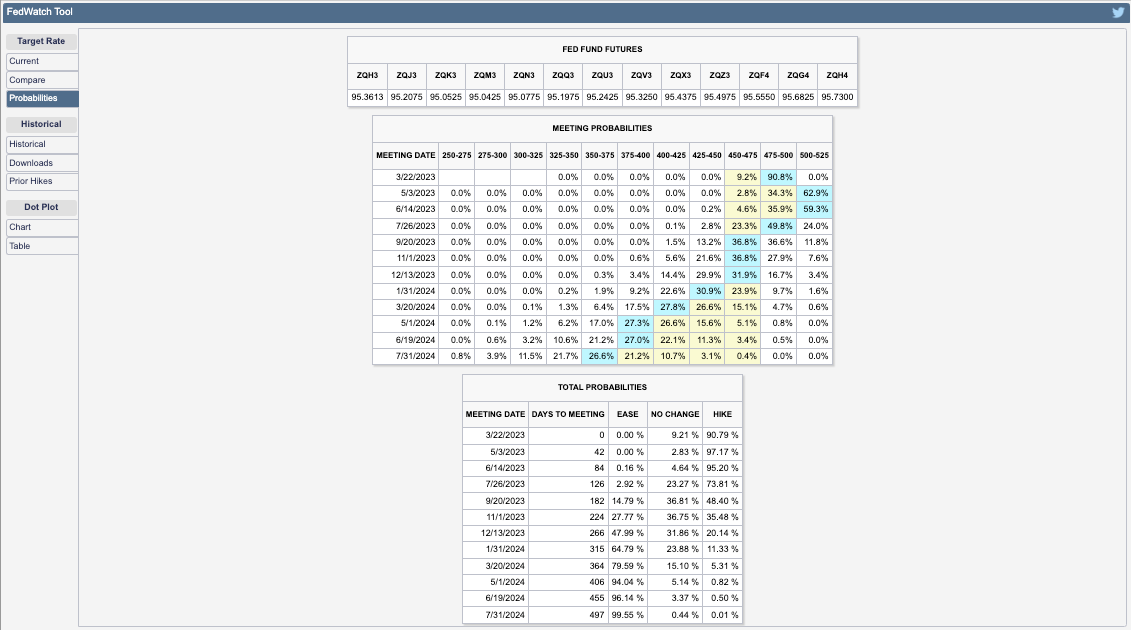
The path after is less certain, though most think there is likely to be at least one additional hike in the coming months. The catch is that if market-induced financial tightening persists through the second quarter, it would substitute for rate hikes. 

Assuming the Fed publishes its summary of economic projections (SEP) or dot plot, they will likely show the governors “getting less aggressive,” adds Bloomberg’s John Authers.

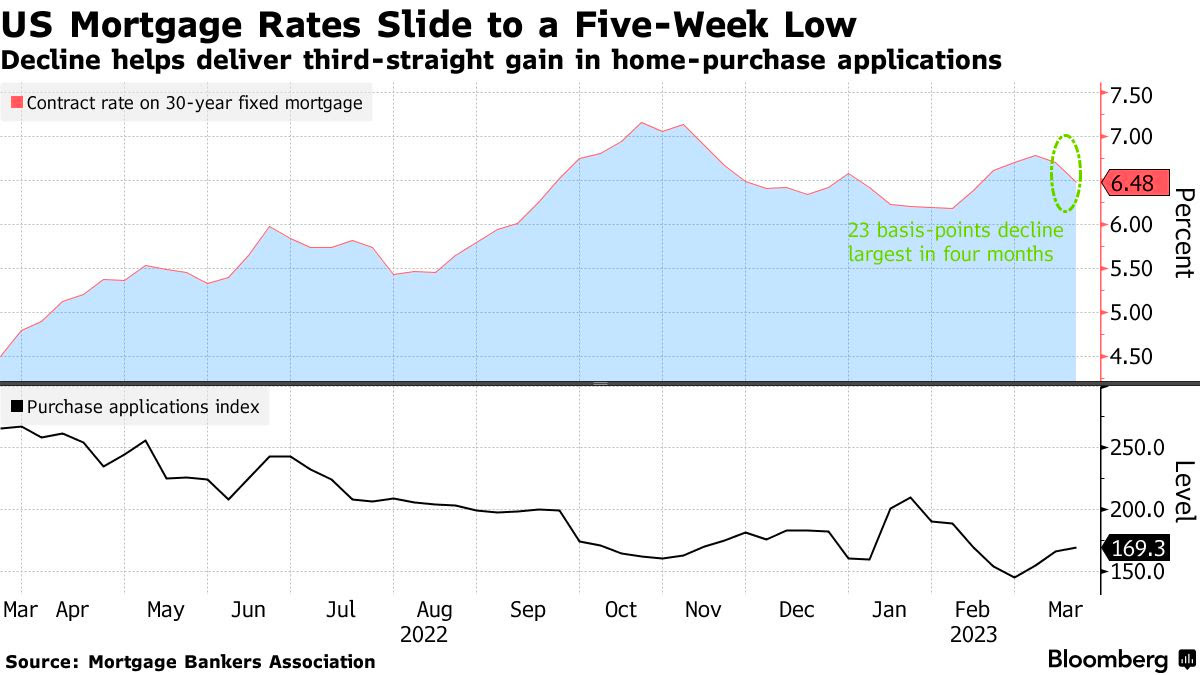
If we recall, Kai Volatility’s Cem Karsan talked about the Fed not wanting liquidations; they want a slow sale, not a fire sale. So, with there being a lag, the Fed may want to slow and assess, carefully telegraphing this being not a pivot. A pivot would probably inspire confidence among investors to own assets “mak[ing] things hotter,” Karsan explains, noting that the Fed really needs to walk up the long end of the yield curve. Recall that the long end fell considerably on the back of the turmoil and intervention, as well as recent data (e.g., housing starts showing more supply, likely a mortgage application booster that would further “make things hotter”).

Read: US 30-Year Mortgage Rate Falls To A Five-Week Low Of 6.48%; Purchase Applications Gauge At Highest Since Early February

Graphic: Retrieved from Bloomberg.Graphic: Retrieved from Bloomberg.

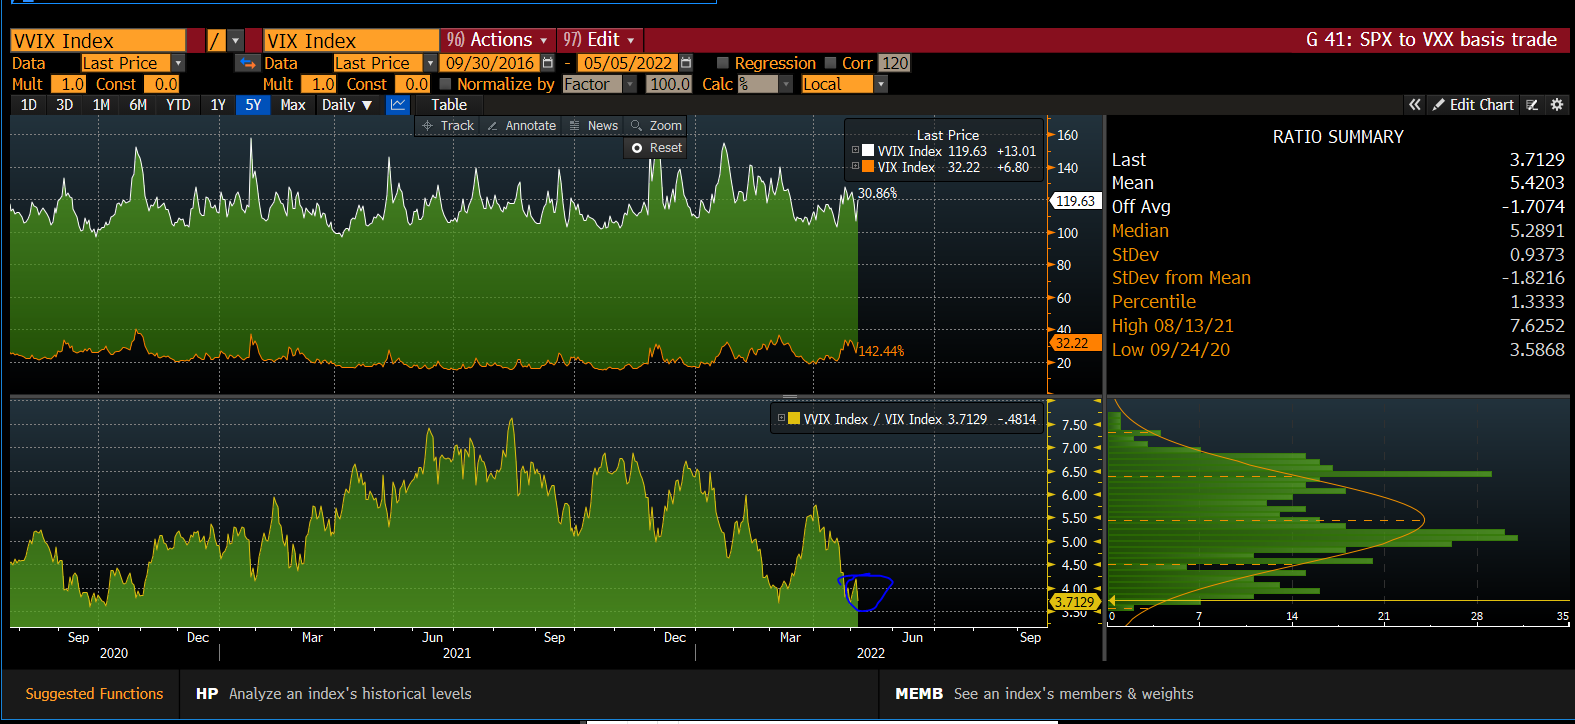
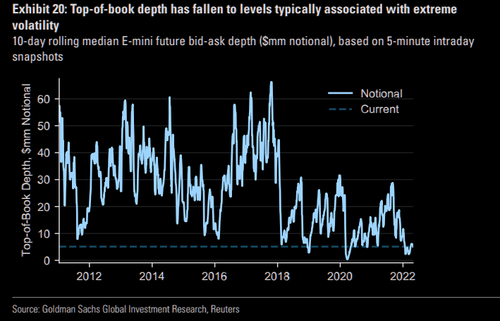
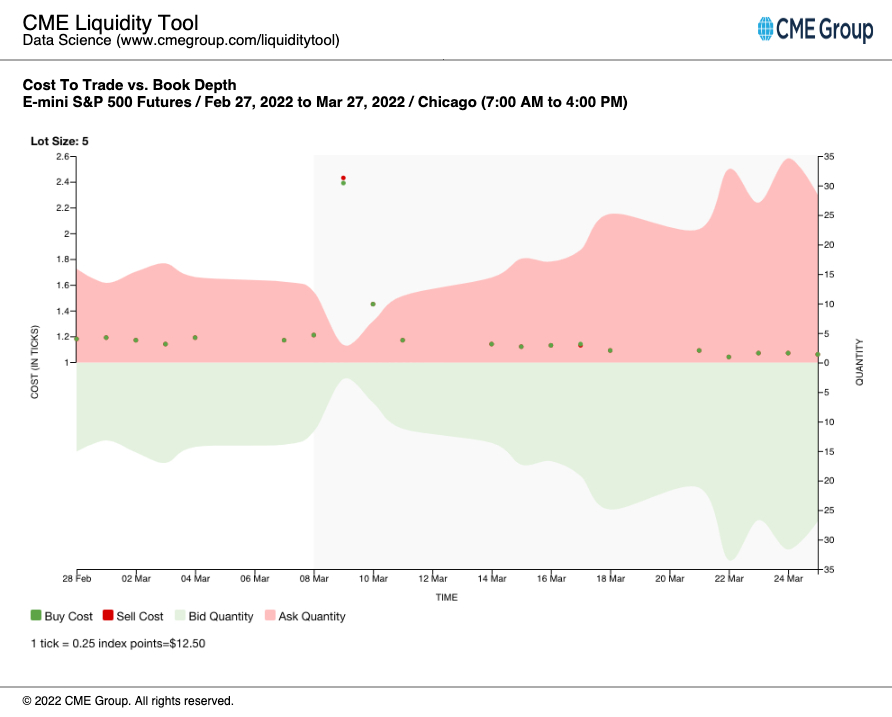
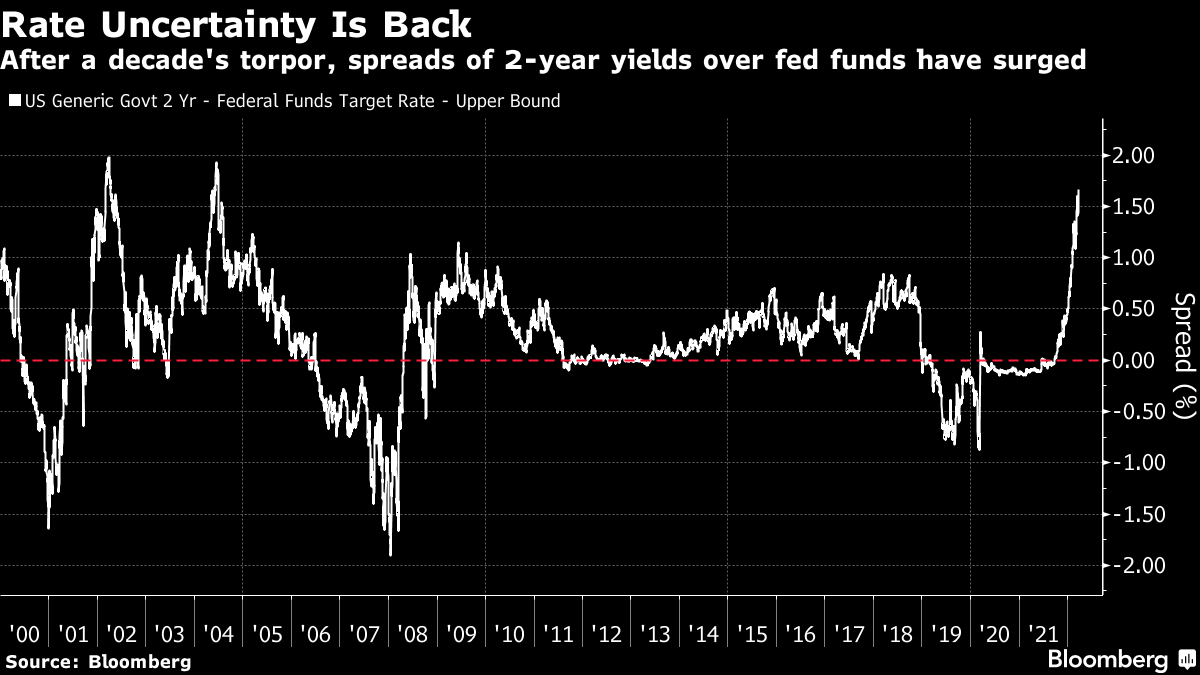
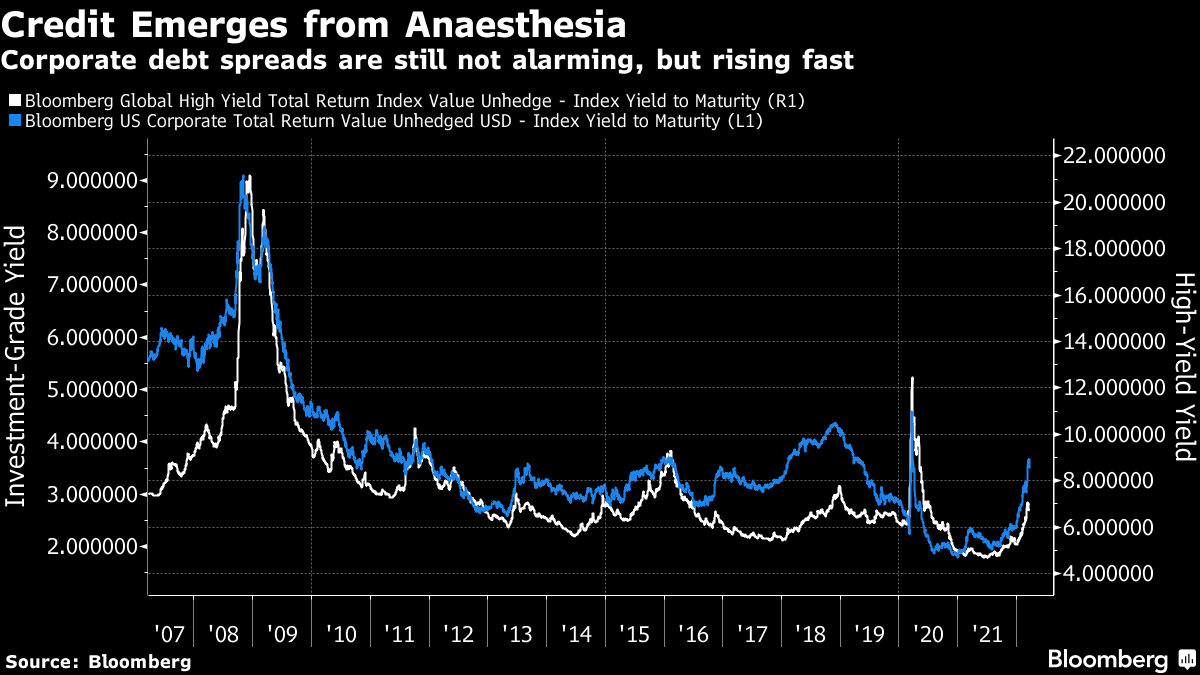
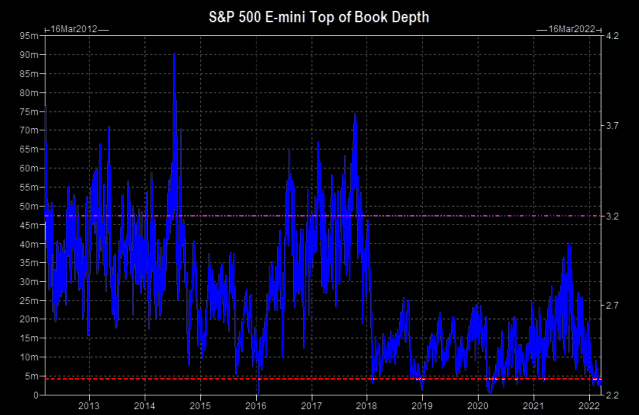
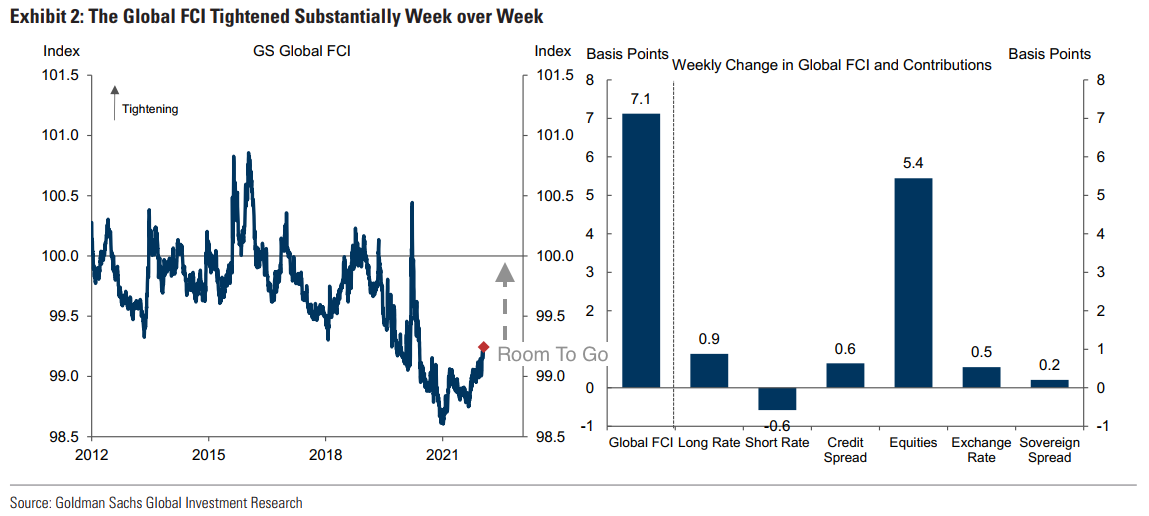
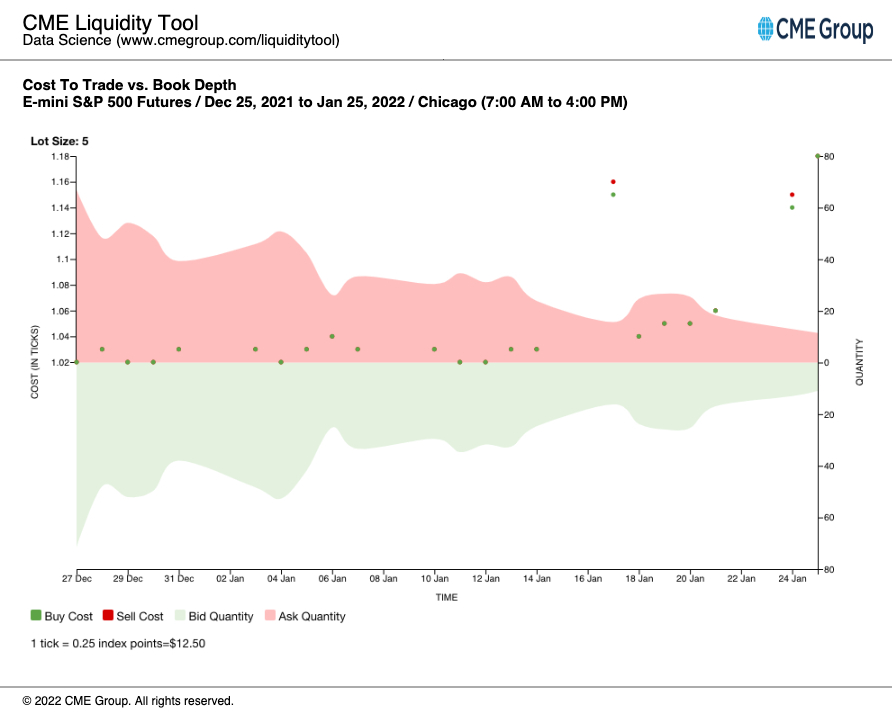
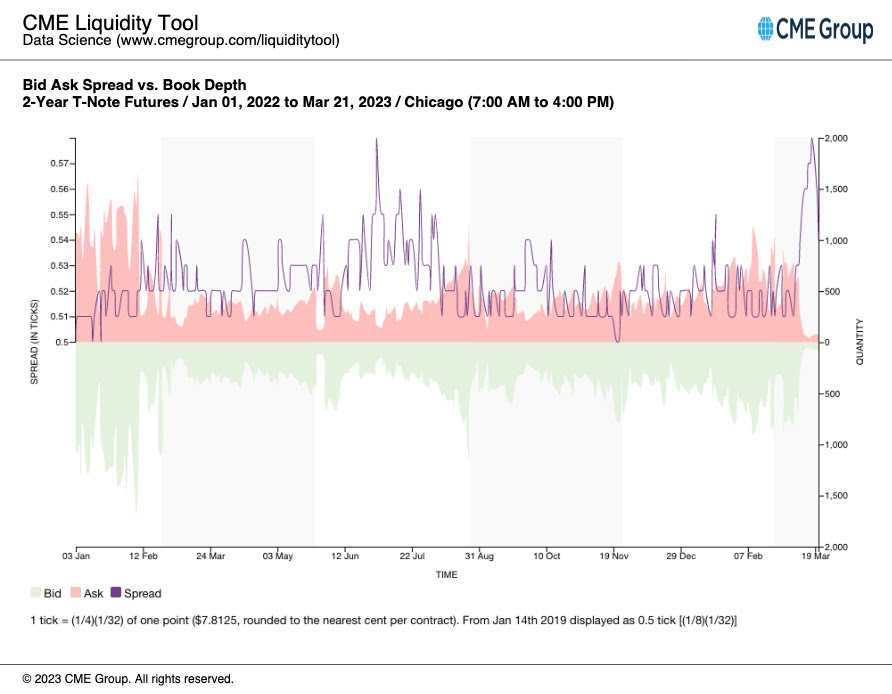
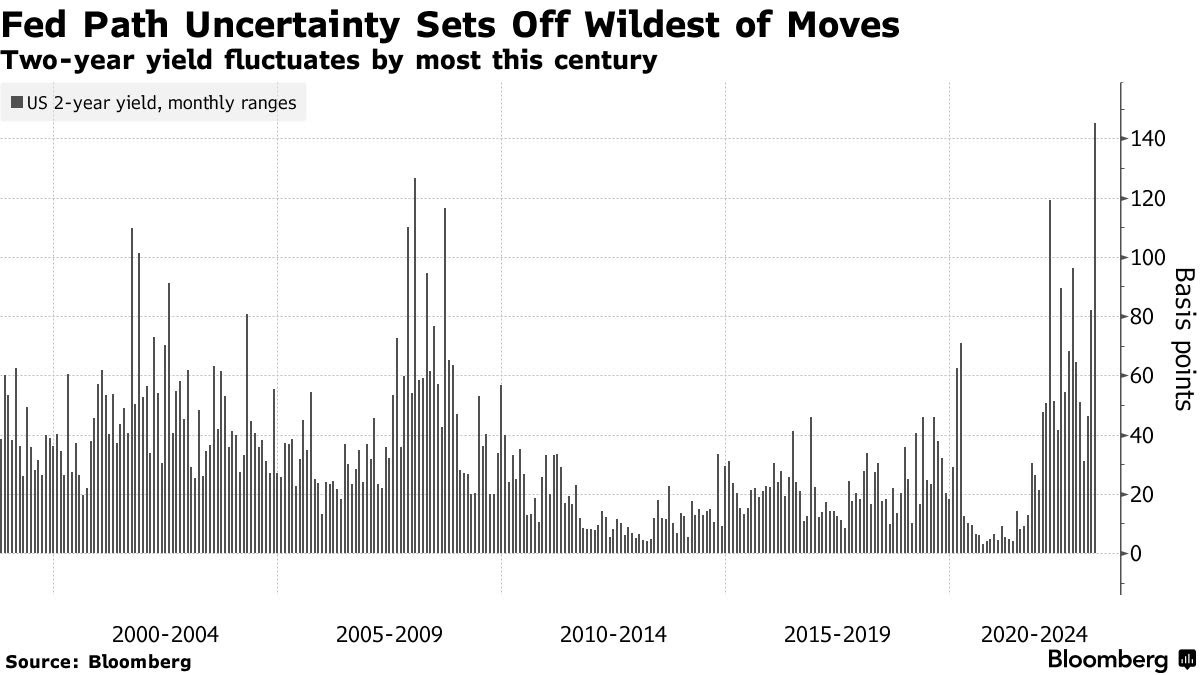
Additionally, there’s been lots of talk about volatility in bond markets.

Graphic: Retrieved from Bloomberg.

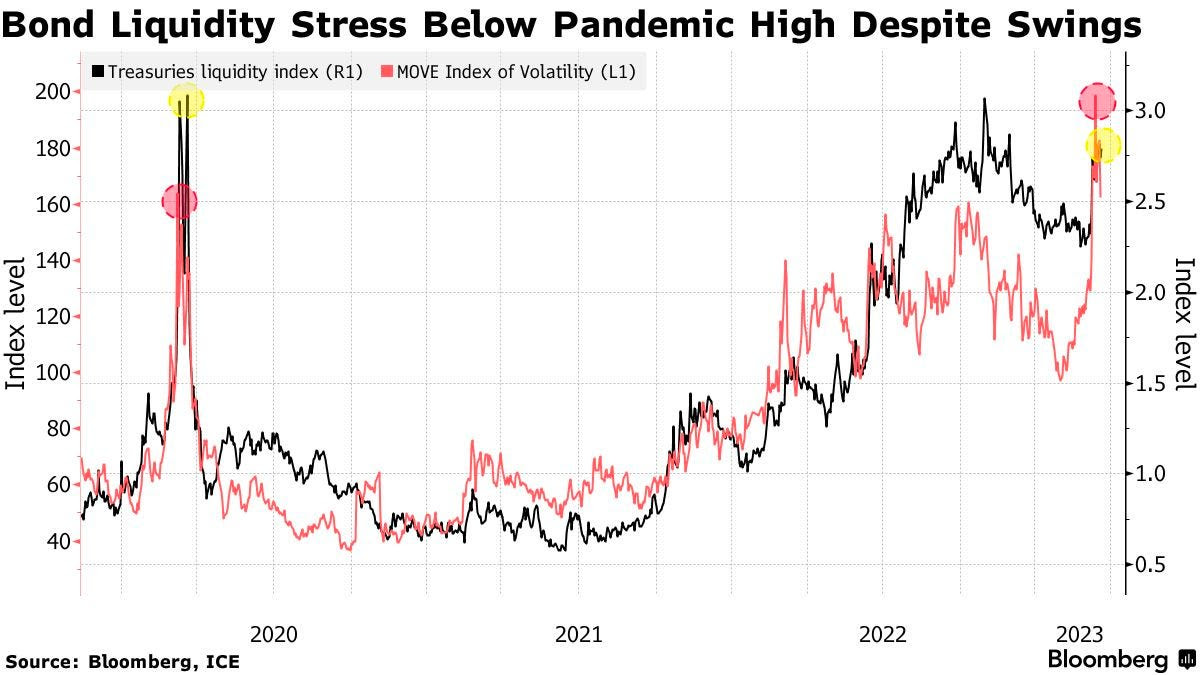
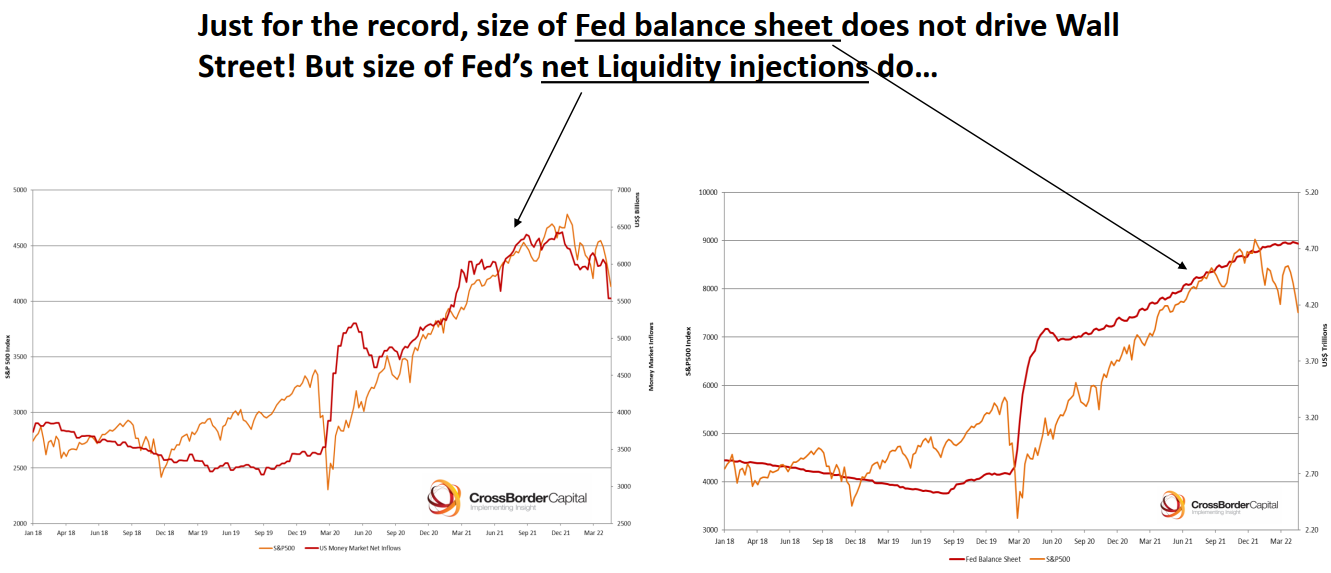
In large part the result of low liquidity, Treasury volatility could prompt the Fed to adjust their quantitative tightening or QT (i.e., the flow of capital out of capital markets) program, instead. Just as quantitative easing or QE (i.e., the flow of capital into capital markets) did little to spark off inflation, it’s unlikely that temping QT would disrupt efforts to rein inflation. 

Graphic: Retrieved from CME Group Inc’s (NASDAQ: CME) Liquidity Tool. Per a Bloomberg article, “the spread between offered prices and what sellers will accept has widened for all maturities, … a sign of thinning market depth” and illiquidity.

Adjusting QT, which is contributing to the excessive volatility, “would be preferable to not raising rates … [since] an abrupt pause in rate hikes would likely resurrect the notion that there’s, indeed, a Fed ‘put’ designed to bail out Wall Street at the first sign of stress,” a potential catalyst for market upside, says Robert Burgess.

Graphic: Retrieved from Bloomberg.

Positioning

In Tuesday’s letter, we talked about the potential for fears of downside easing and fears of missing out (i.e., FOMO) on upside rising. Specifically, the letter said the following: 

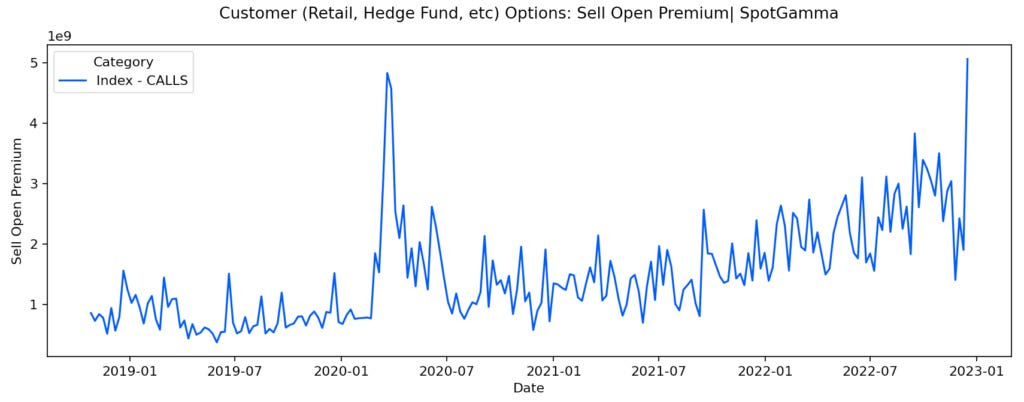
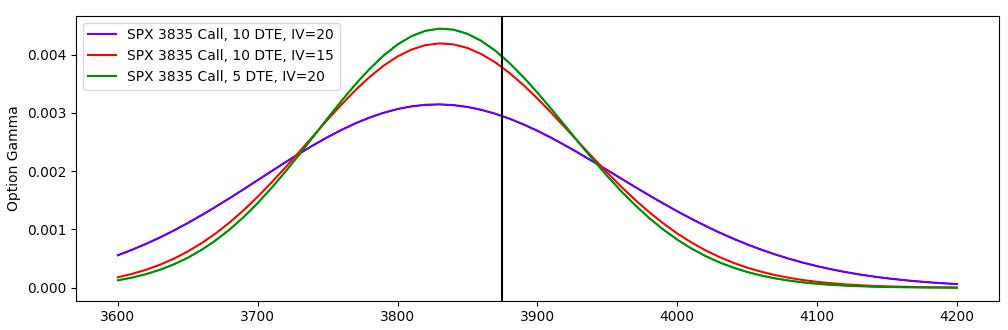
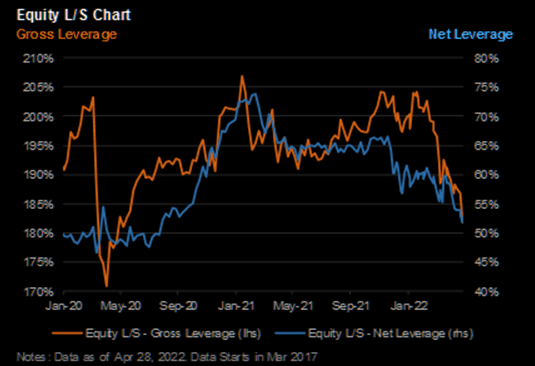
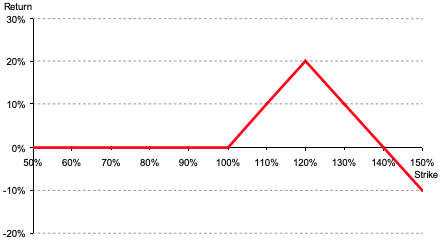
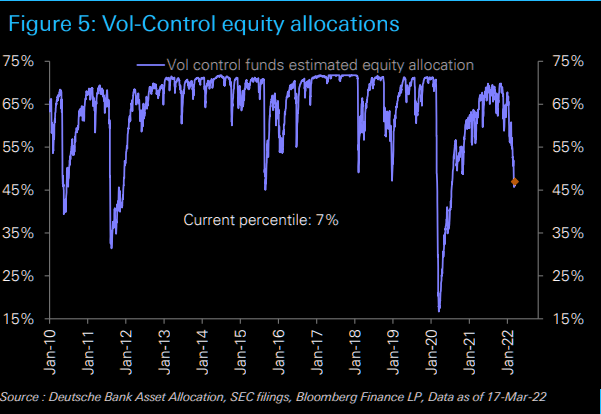
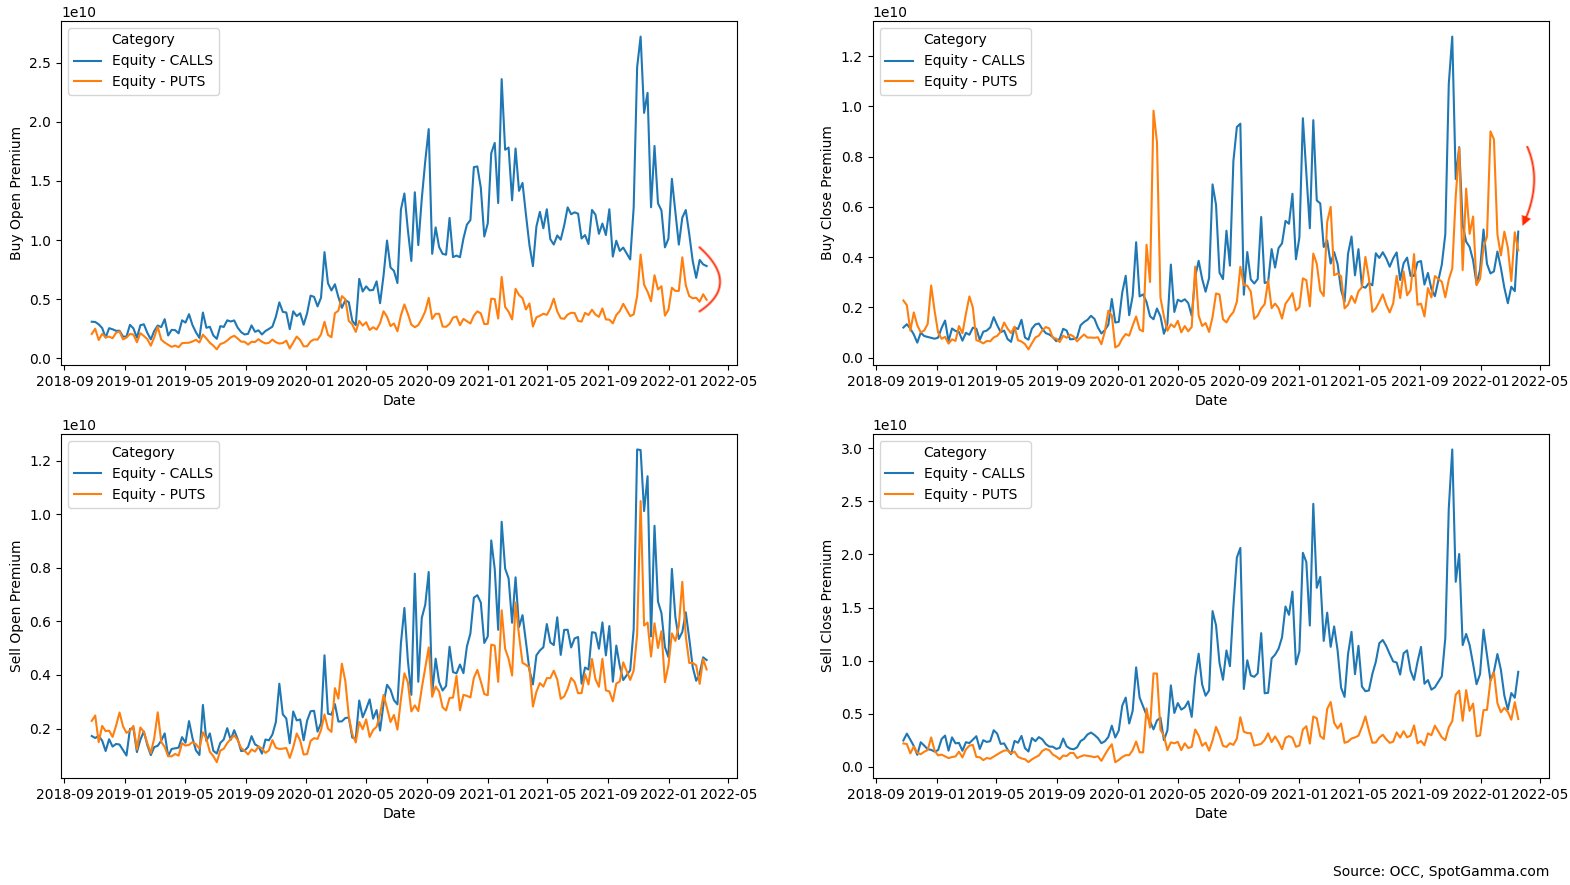
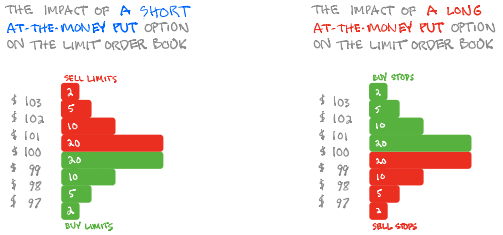
“A response may be FOMO-type demand for call options exposures, coupled with CTAs further ‘raising their equity exposure’ on trend signals and lower volatility, boosting markets into a ‘more combustible’ state as explained on 2/17. This fear of missing out is visible in options volatility skew; traders are hedging those tail outcomes.”

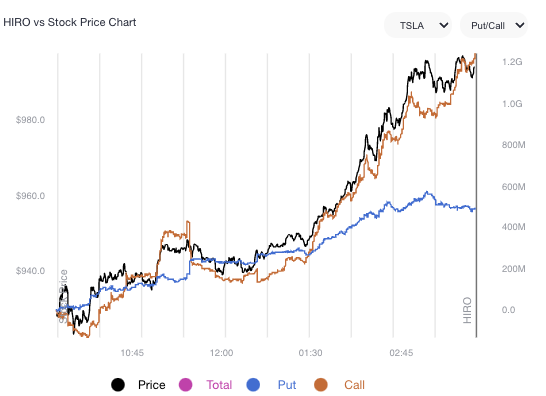
In support of the most recent strength, per JPMorgan Chase & Co’s (NYSE: JPM) trade desk commentary, there is a buy skew. Goldman Sachs Group Inc (NYSE: GS) strategists agree, noting that flows are almost entirely “cover-driven.”

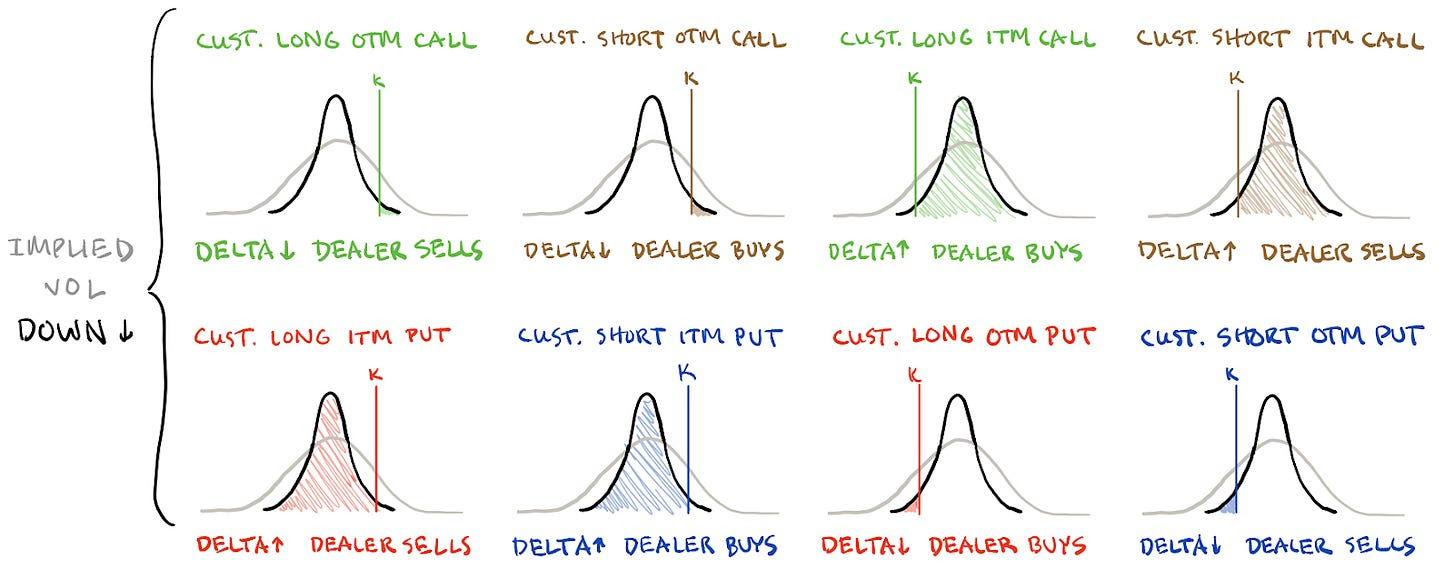
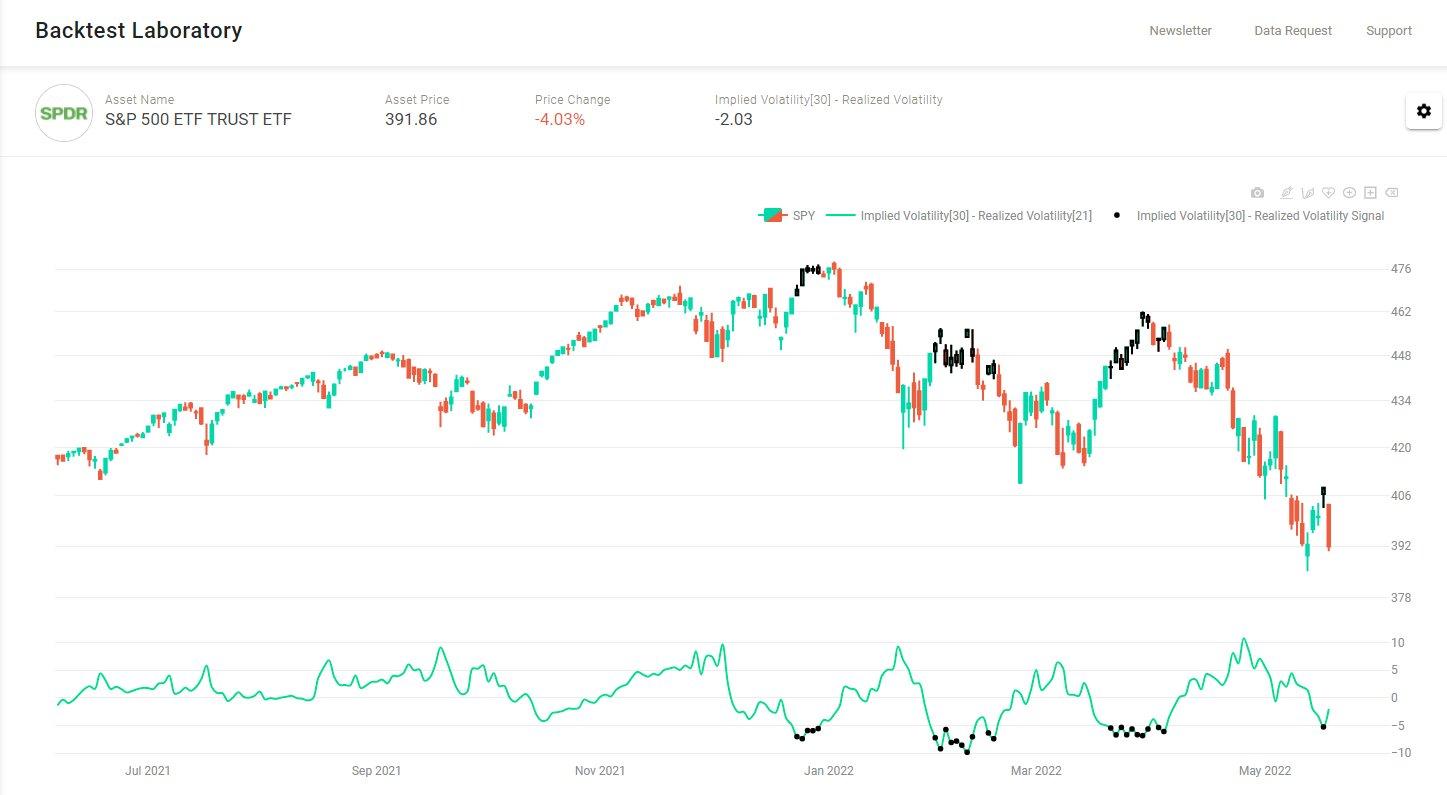
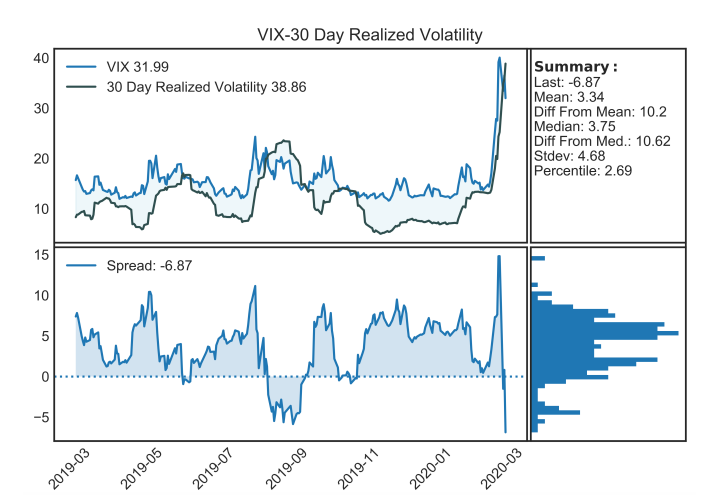
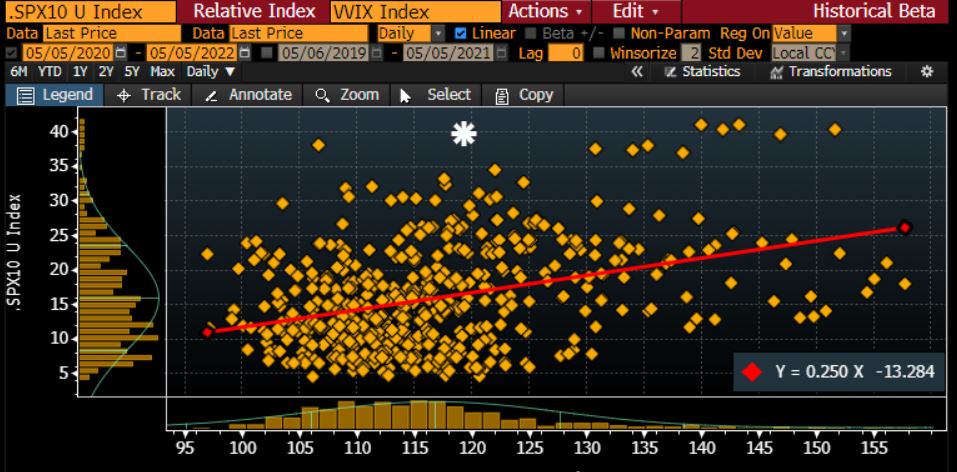
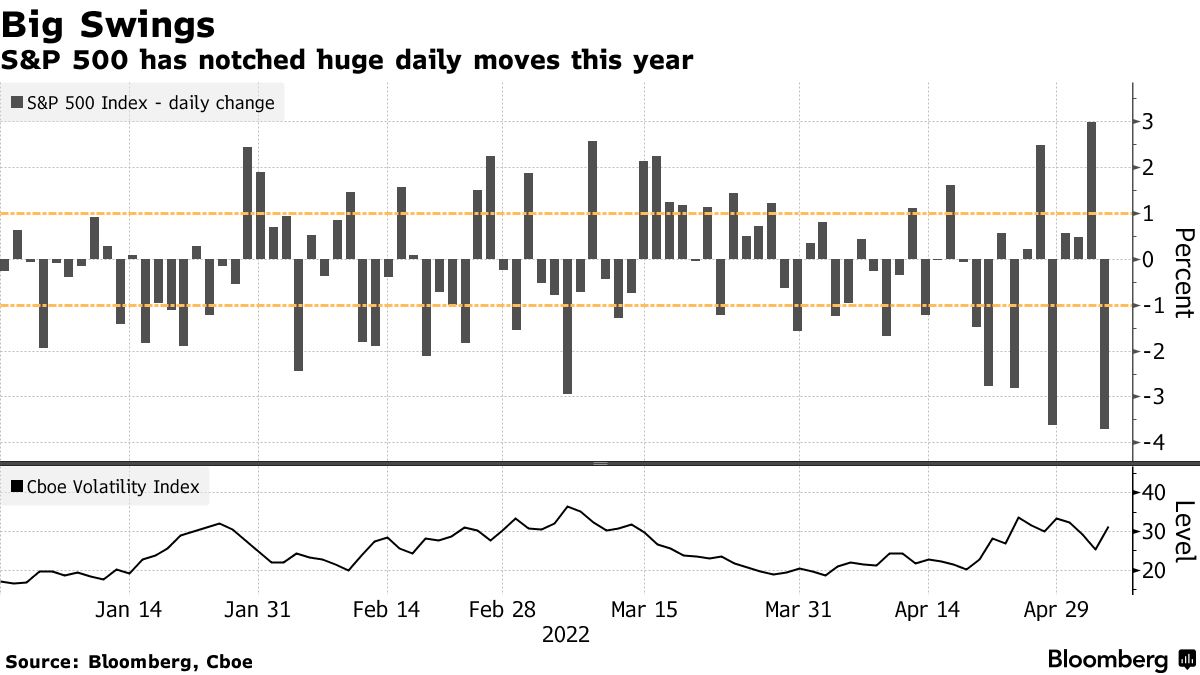
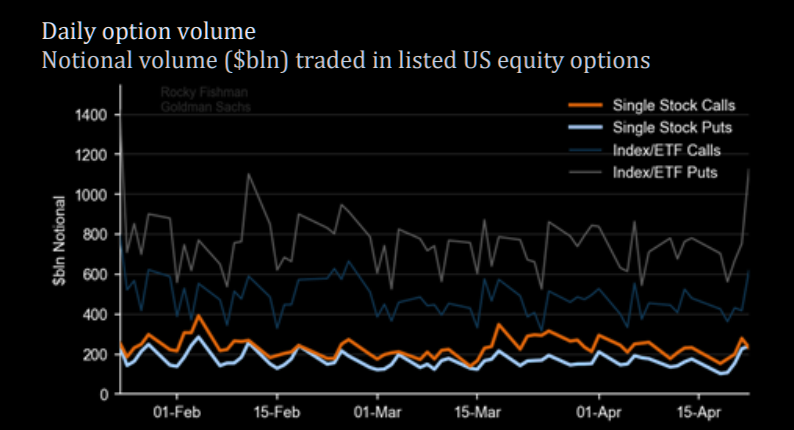
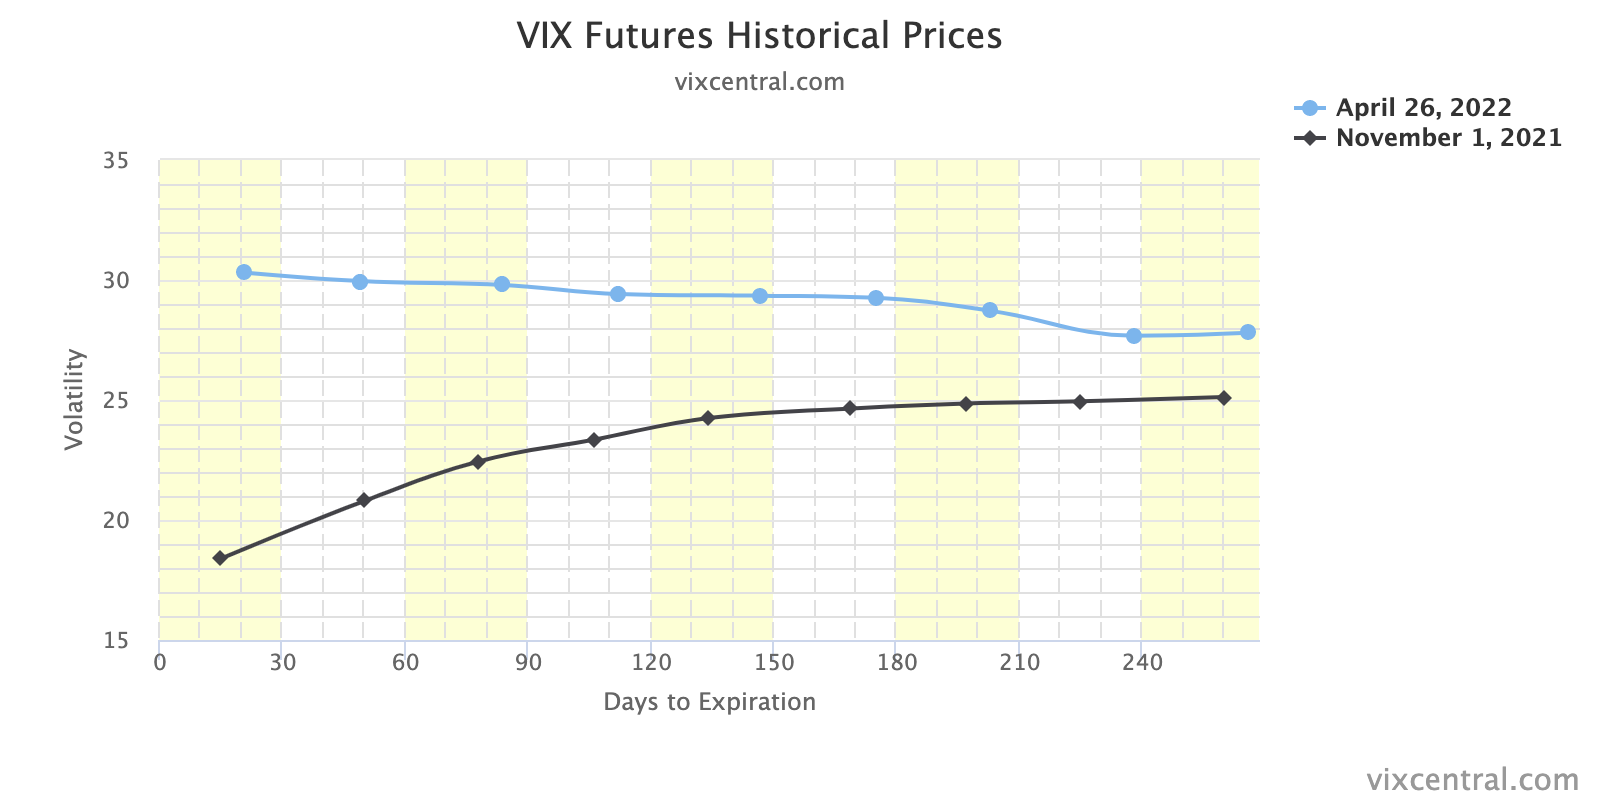
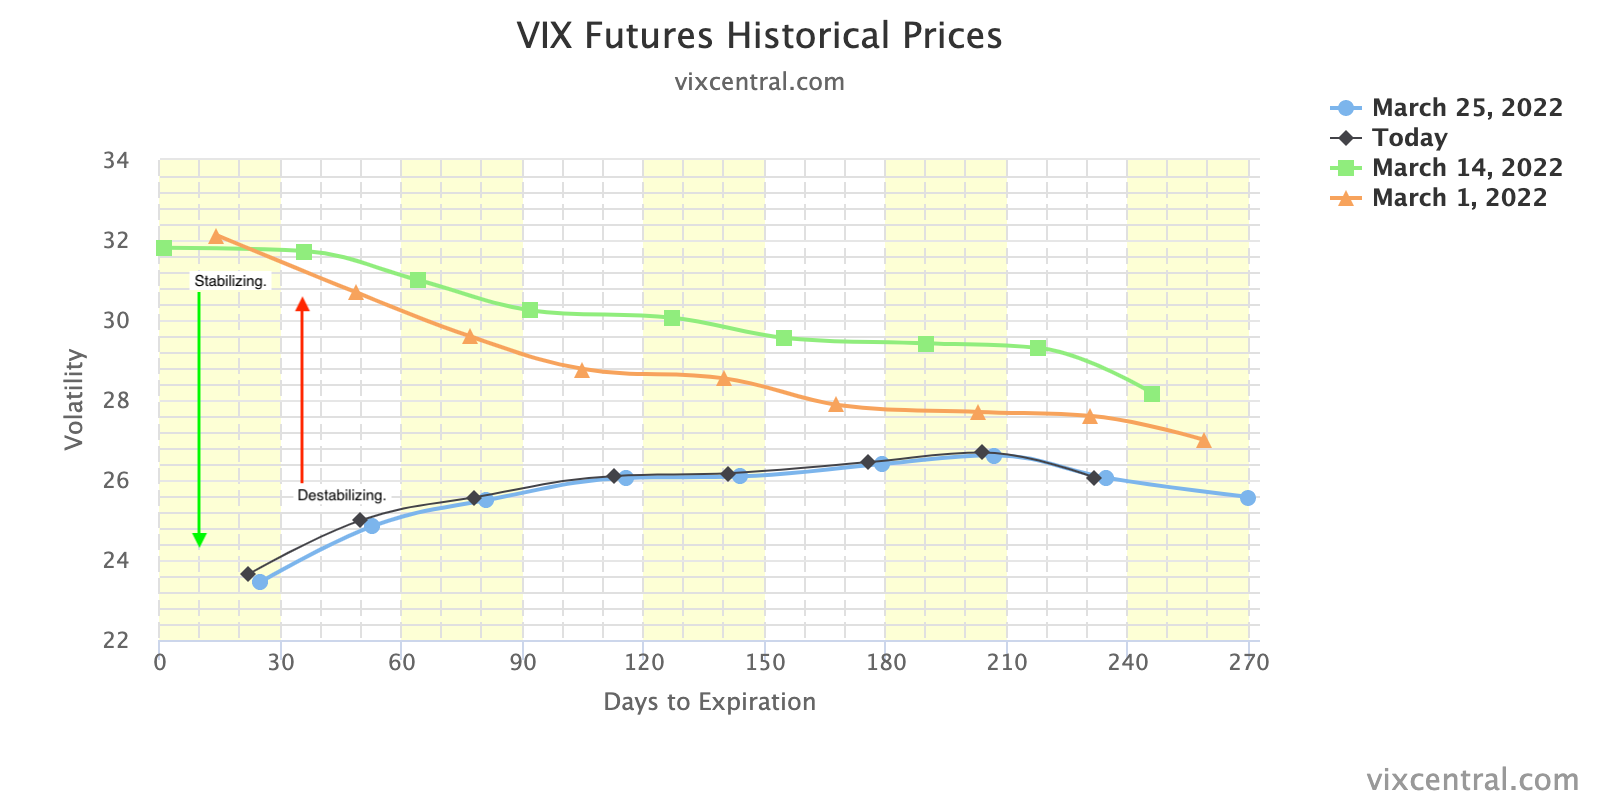
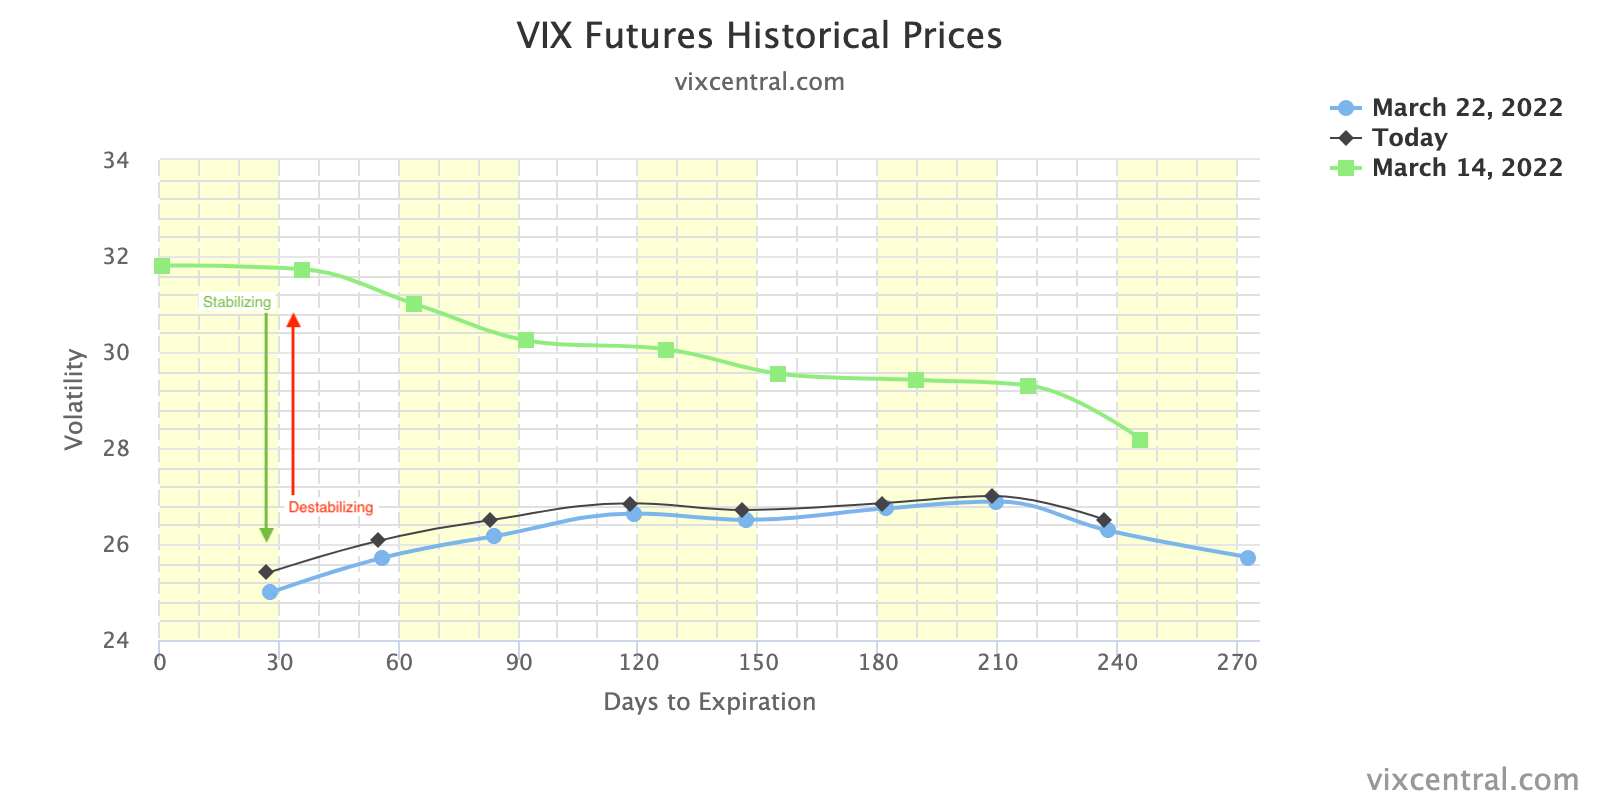
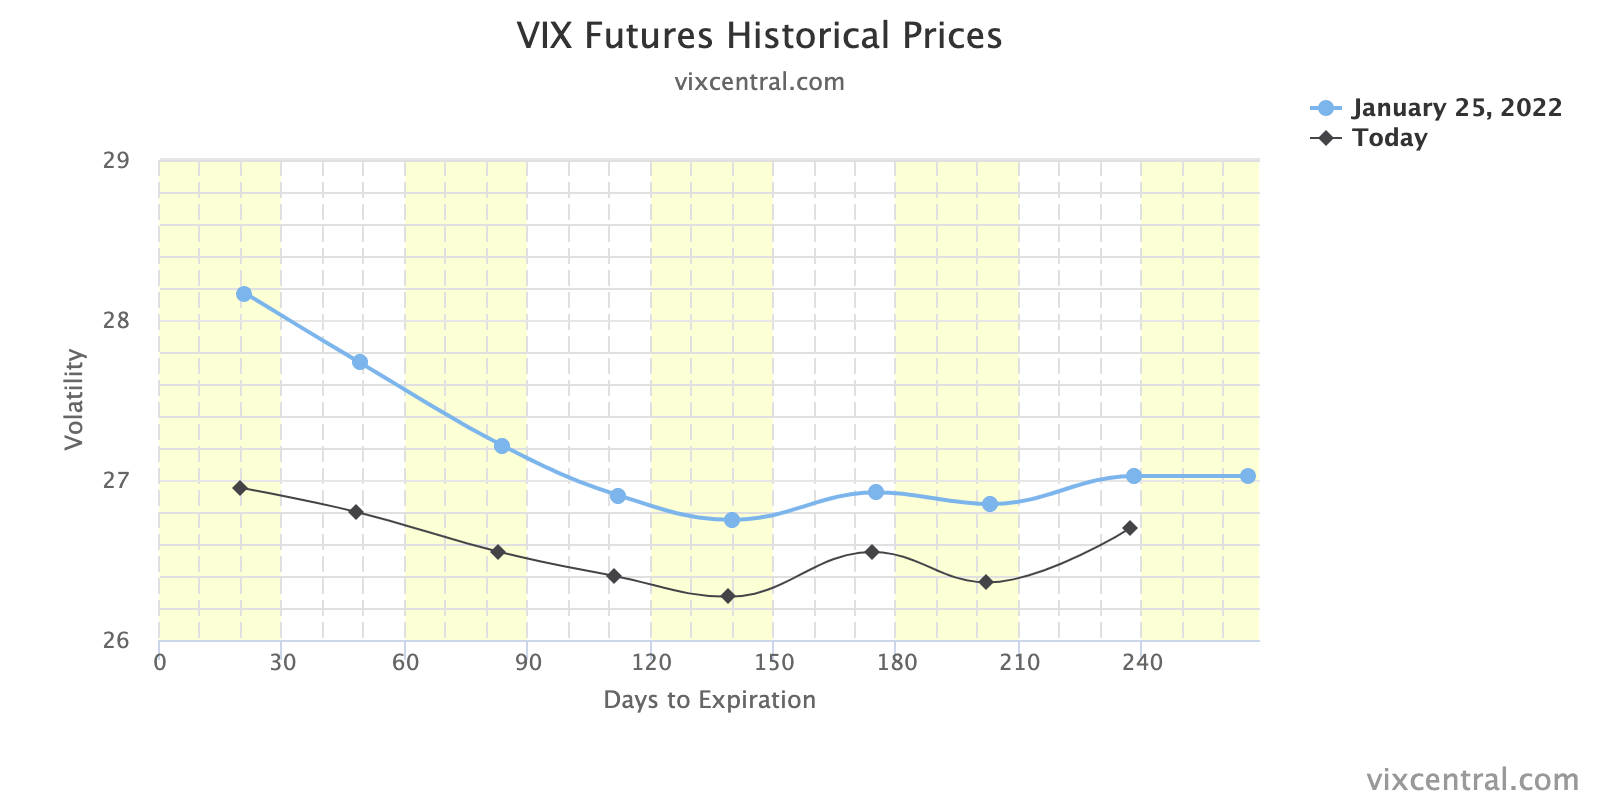
Recall that traders sought protection amidst all the calamities recently. Accordingly, measures of implied volatility or IVOL including the Cboe Volatility Index or VIX rose (e.g. traders demand exposure to downside put protection by way of S&P 500 options which bids options prices and manifests higher IVOL and counterparty pressure from their equity future/stock sales to hedge this demand). These same measures of IVOL are now falling as traders’ closure of protection results in counterparty pressures being lifted (helping explain, in part, the above “cover-driven” remark by GS).

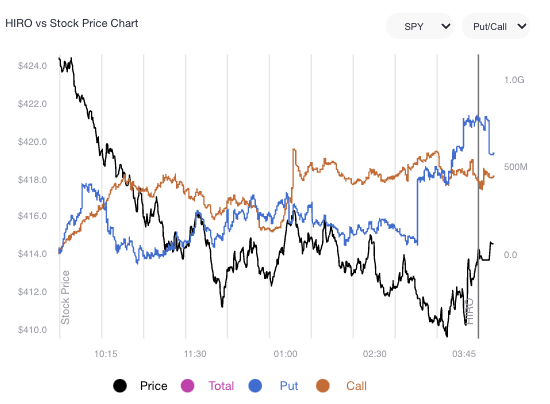
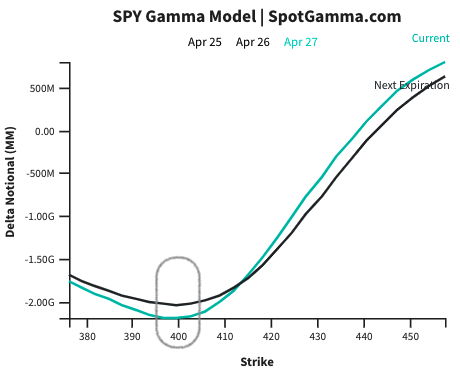
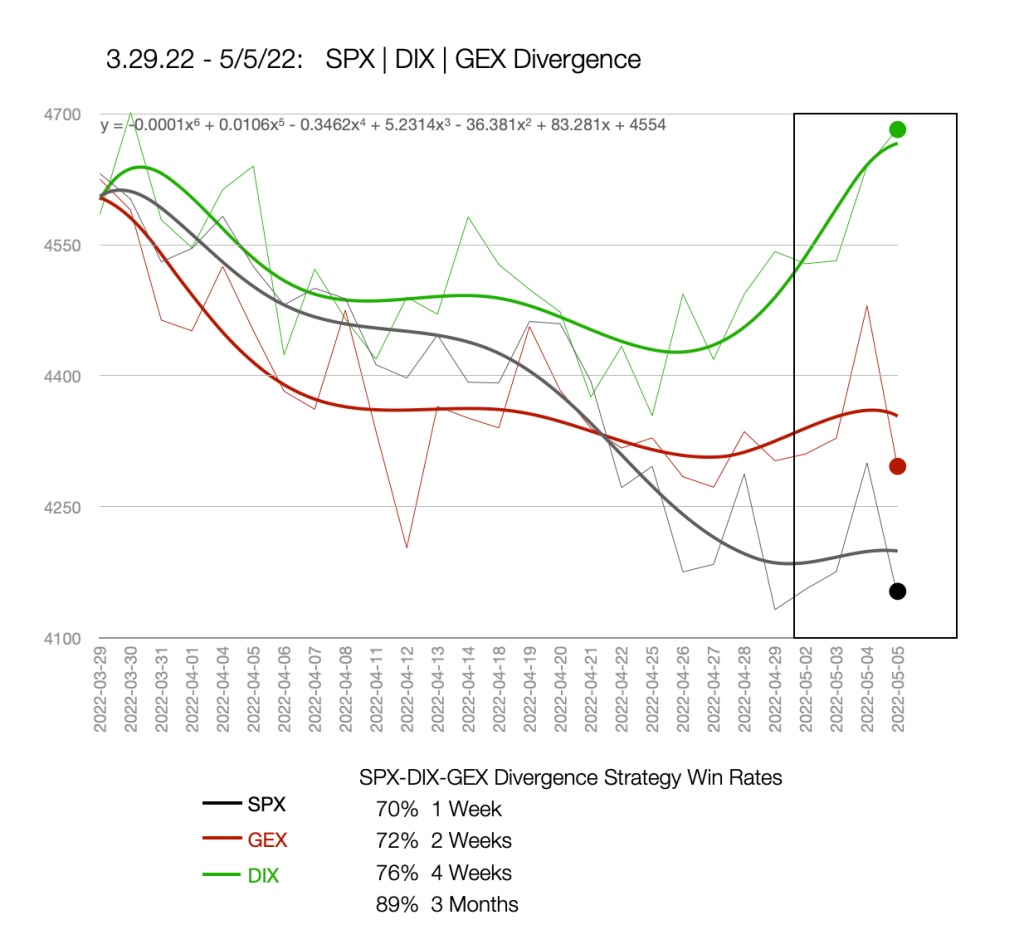
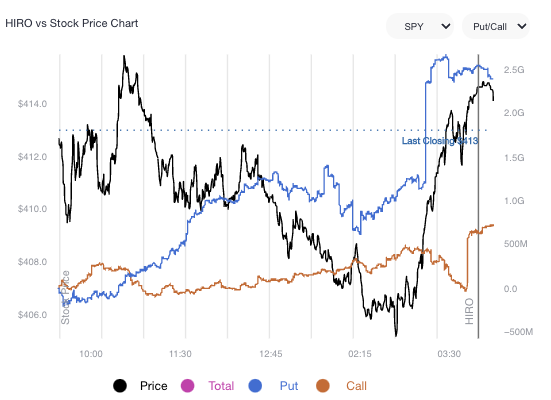
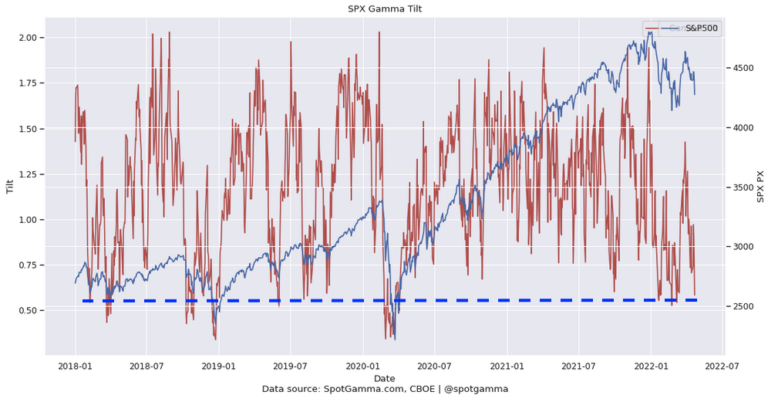
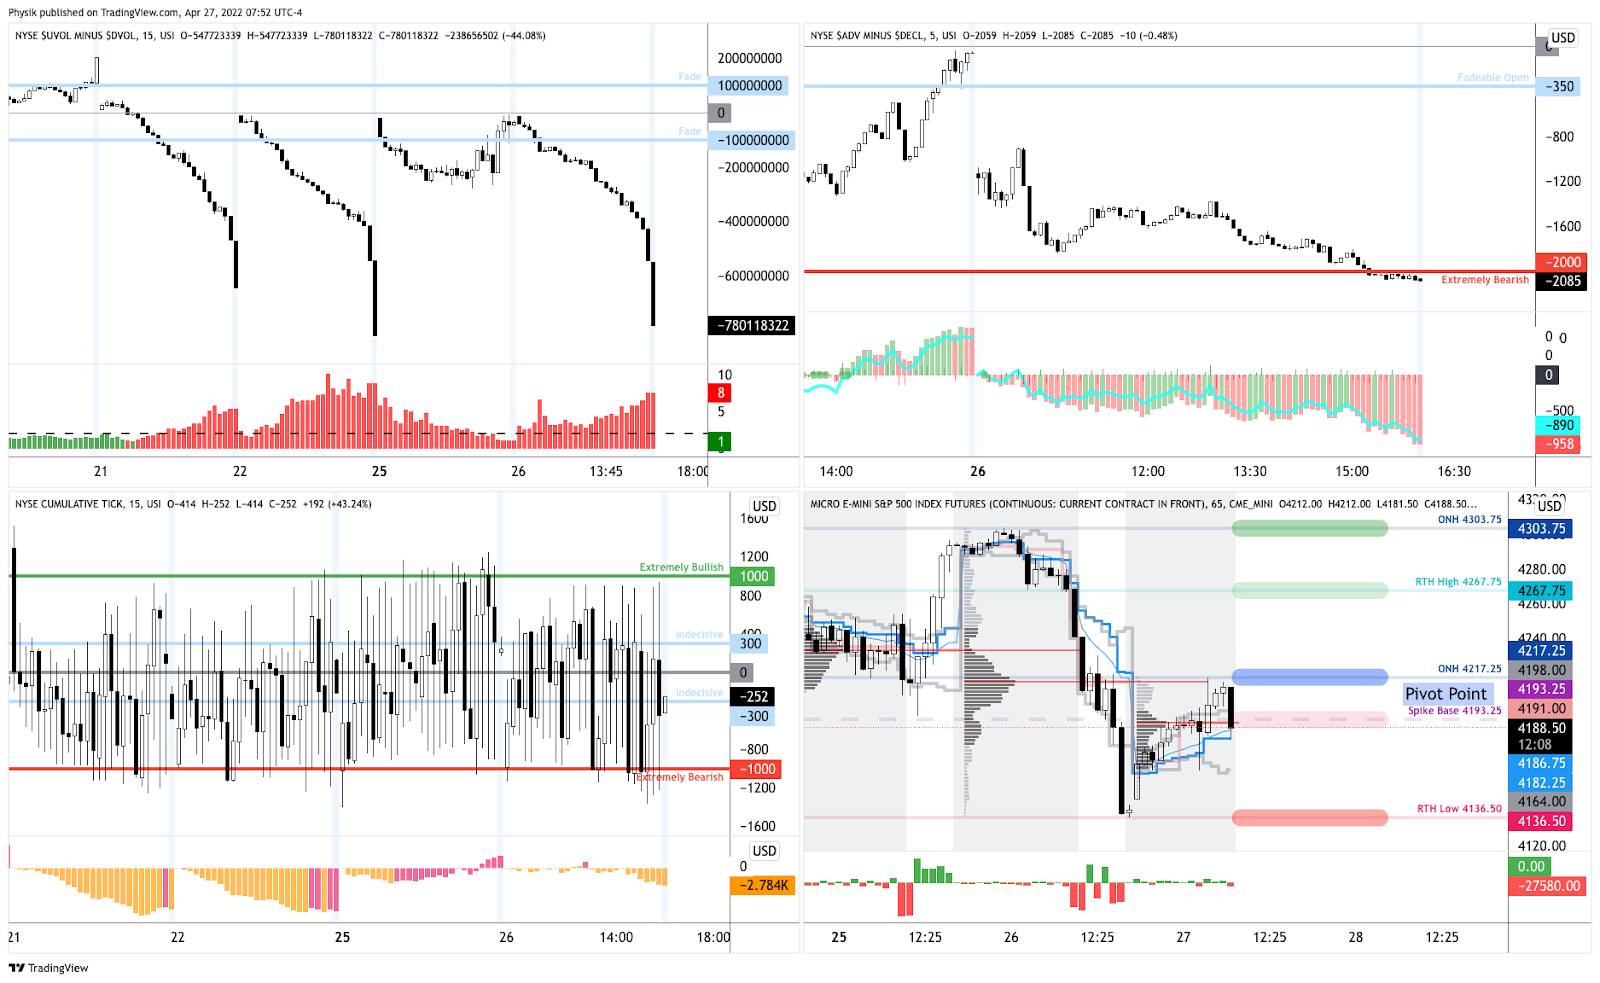
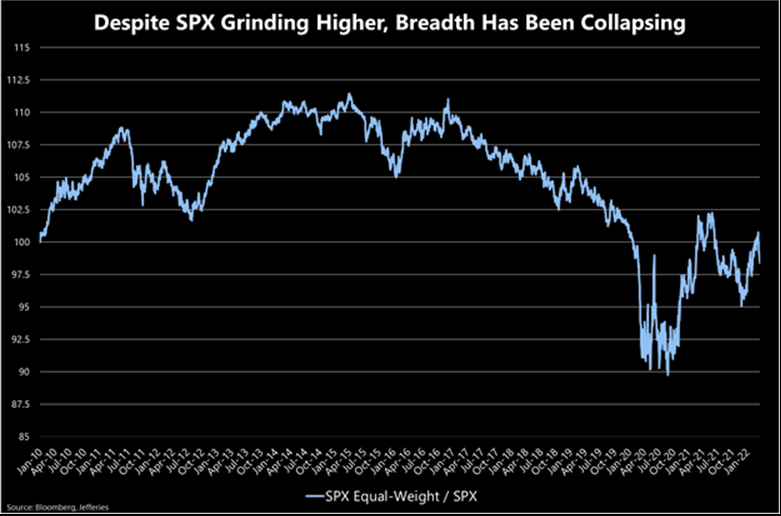
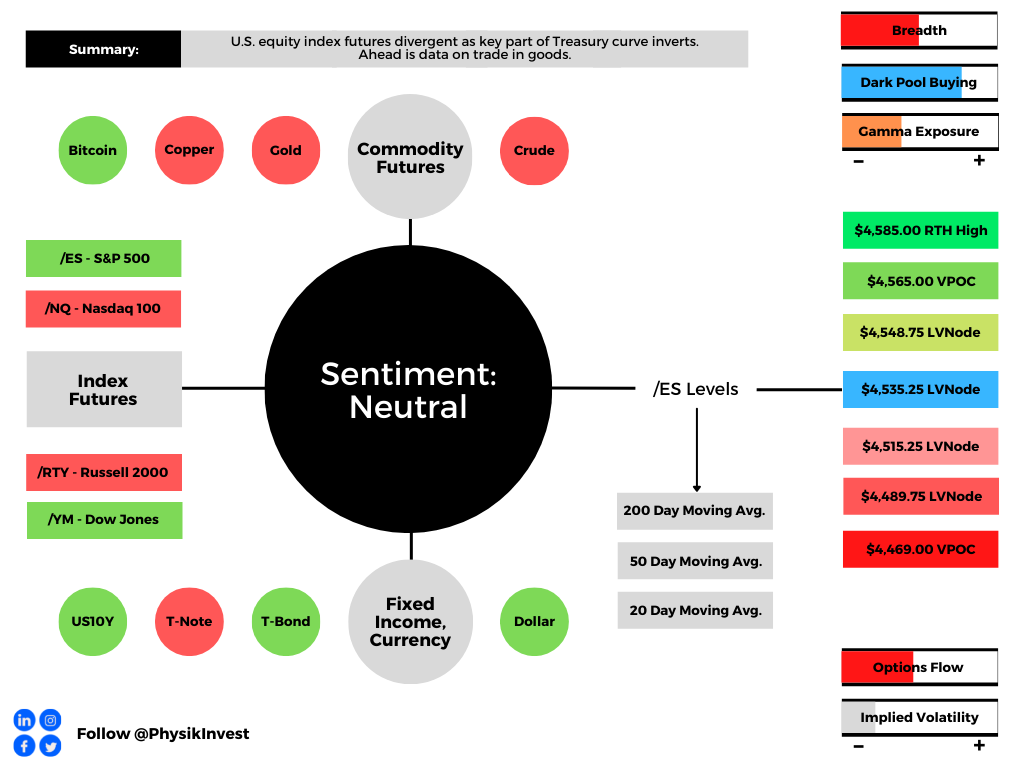
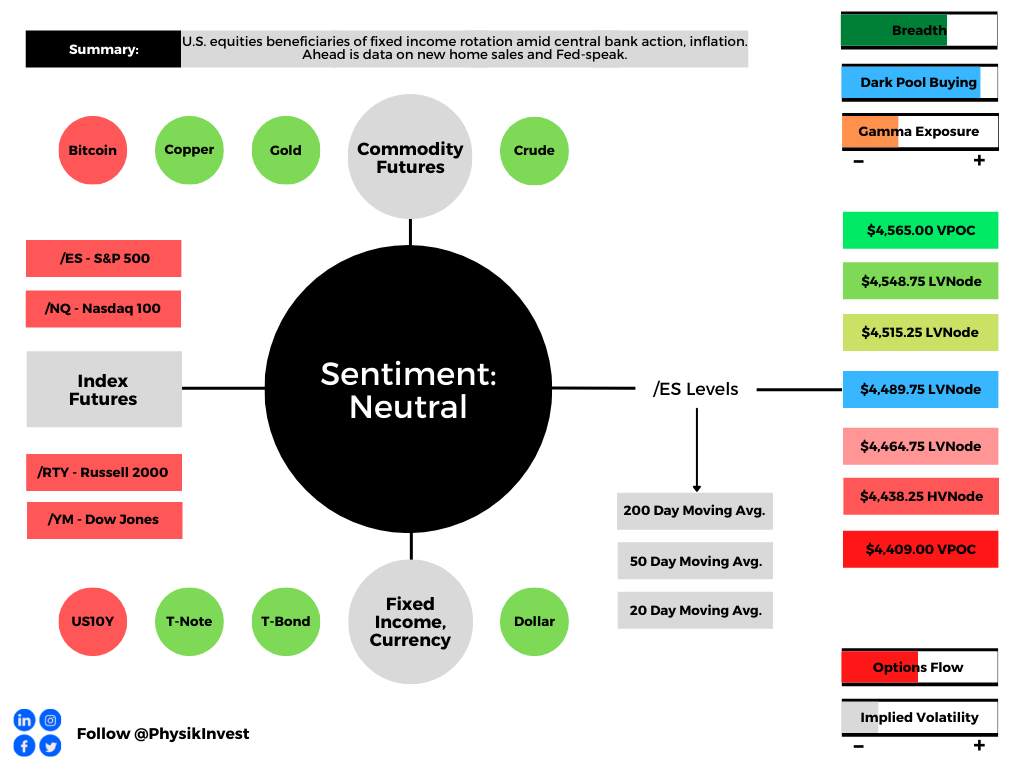
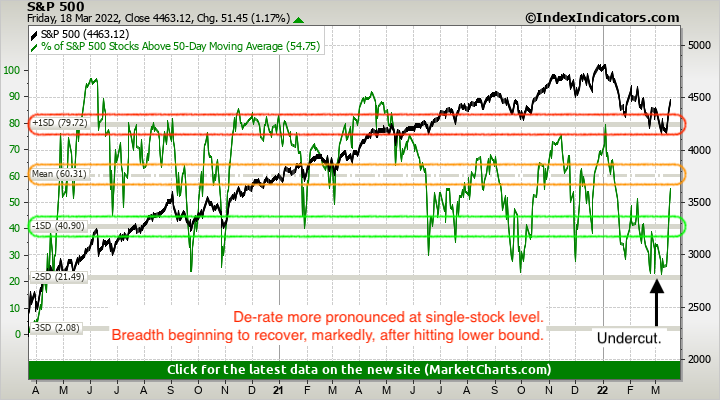
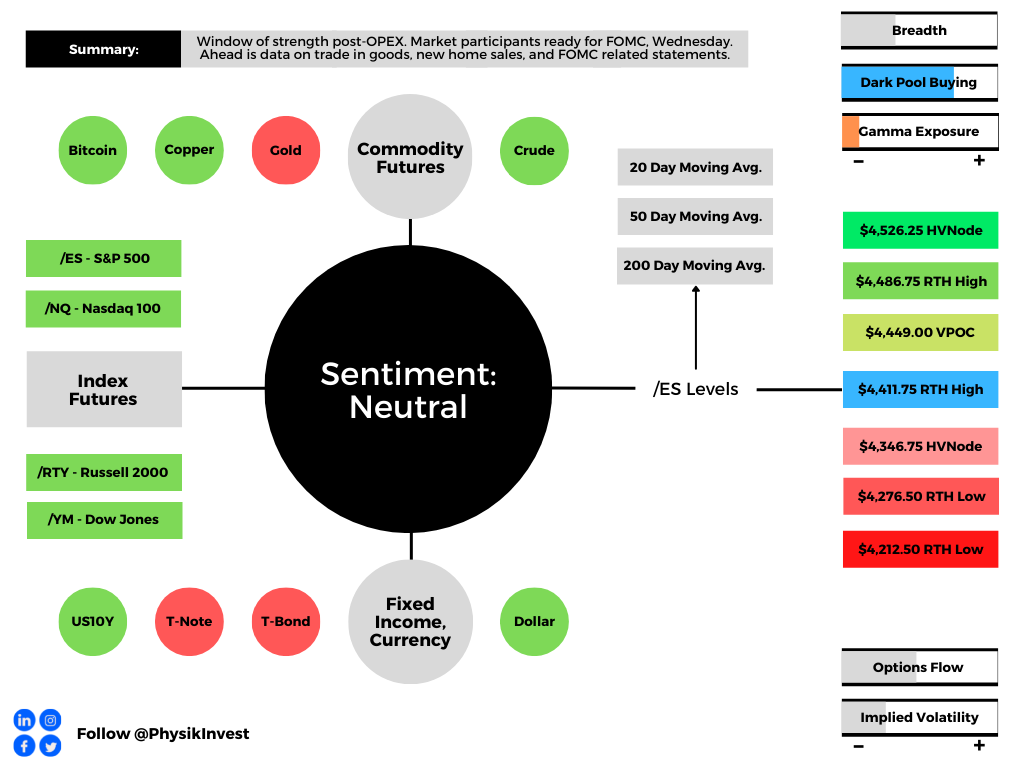
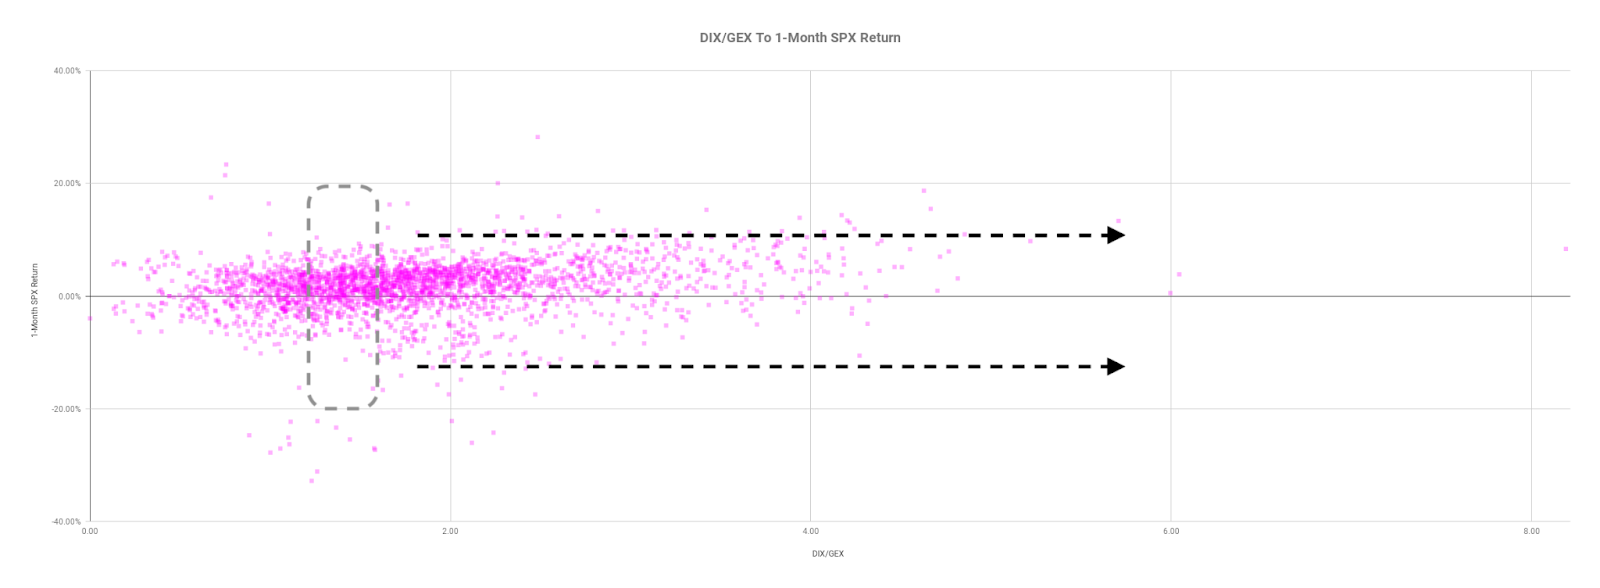
Does this rally have breadth behind it? Look no further than market internals. 

Graphic: Retrieved from Bloomberg via Liz Young. “The Nasdaq’s Cumulative Advance-Decline line has parted ways with index direction in recent days. In other words, the index has rallied despite weak breadth (more stocks falling than rising), the two lines are likely to find their way back together somehow…”

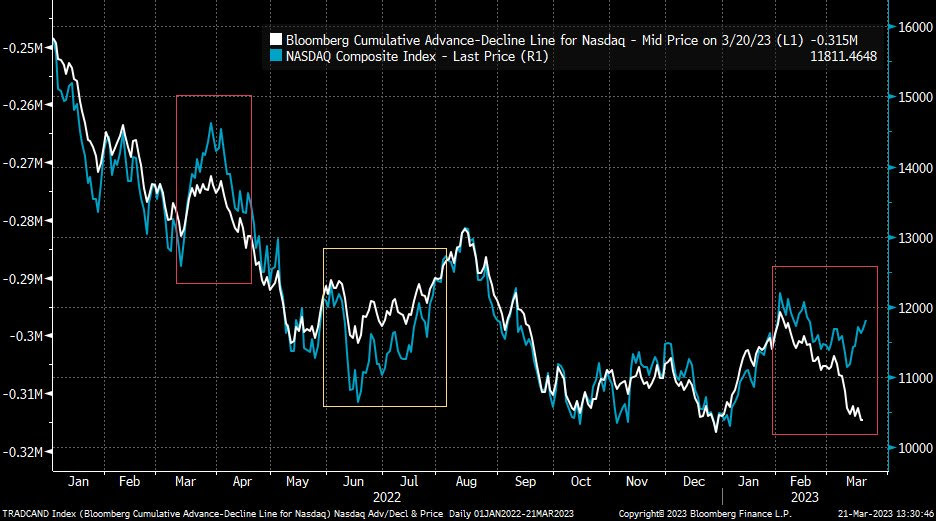
A pause before the Fed announcement, and then breadth catches up to price?

Or, has the typical post-Fed IVOL boost been spent?

Regardless, we maintain that low-cost call options structures as proposed in previous letters worked (and may continue to work). Notwithstanding, look for opportunities to play the downside should markets trade higher into a “more combustible” position. 

More on trade ideas in the next letters. Take care.
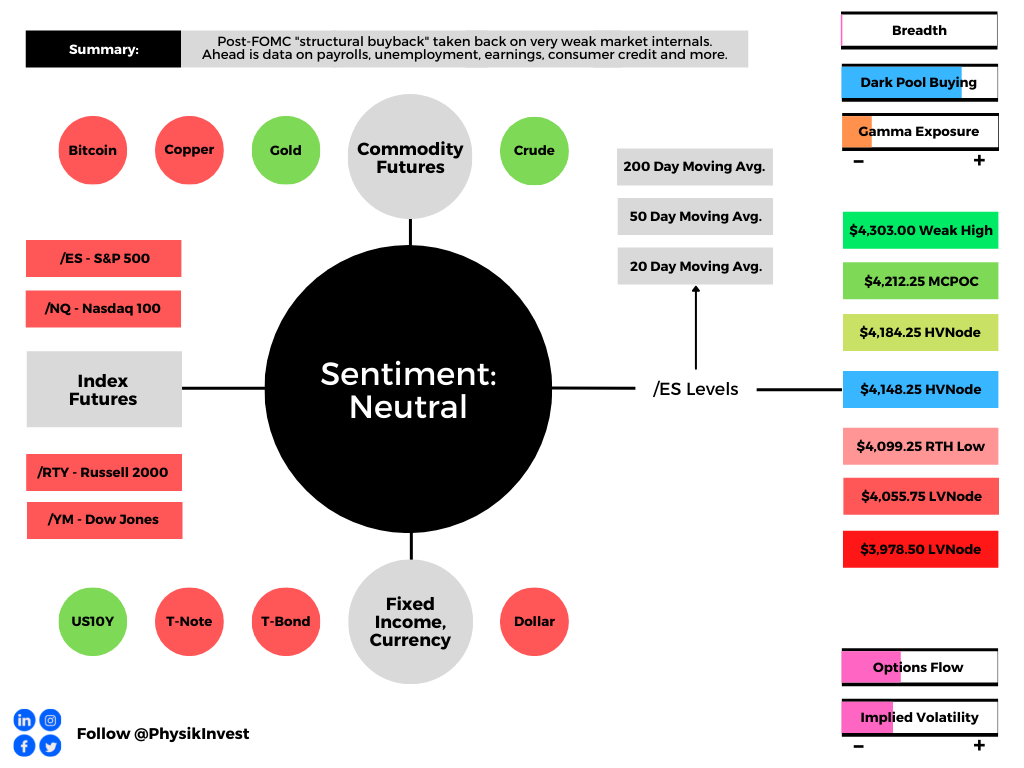
Technical

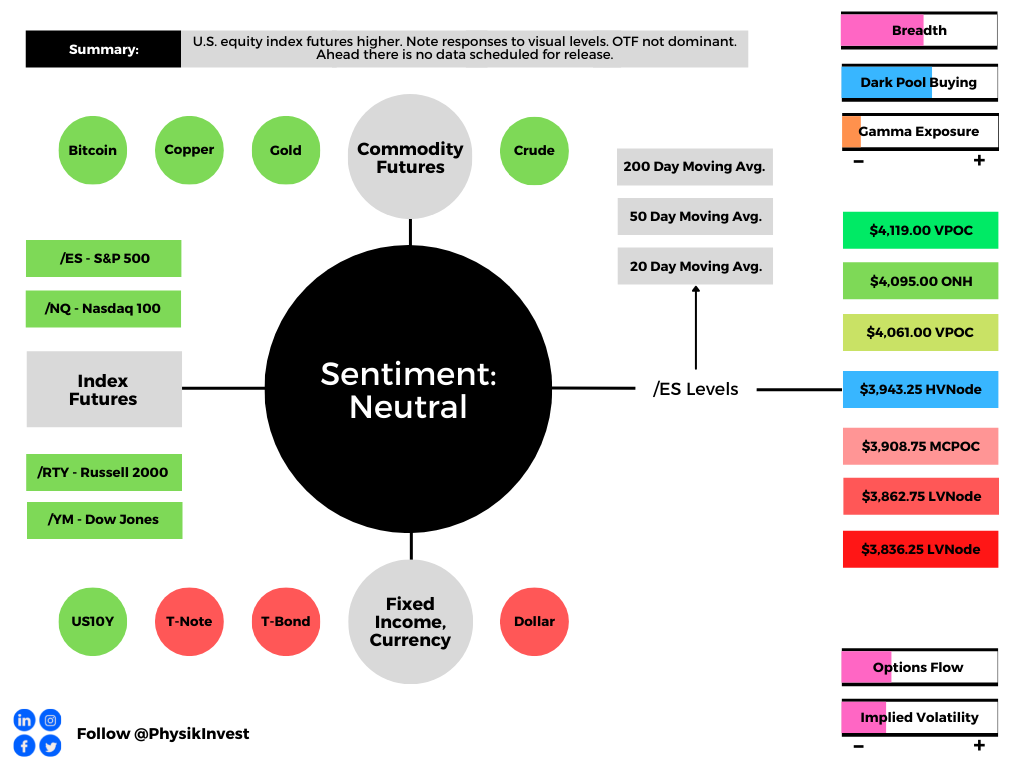
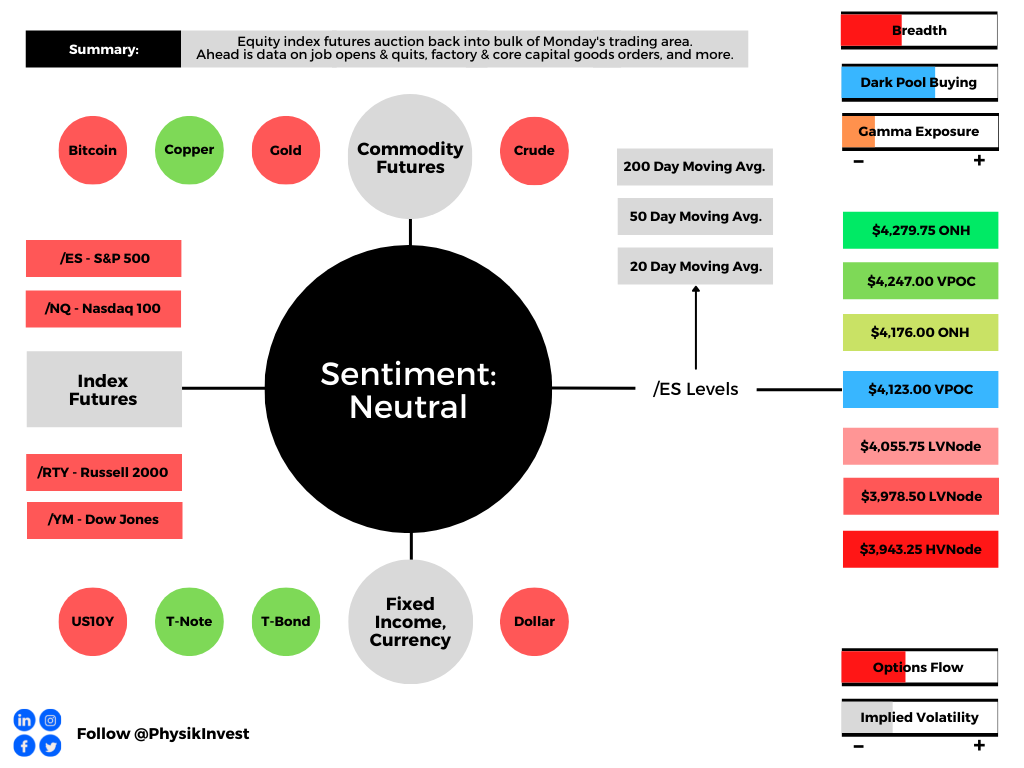
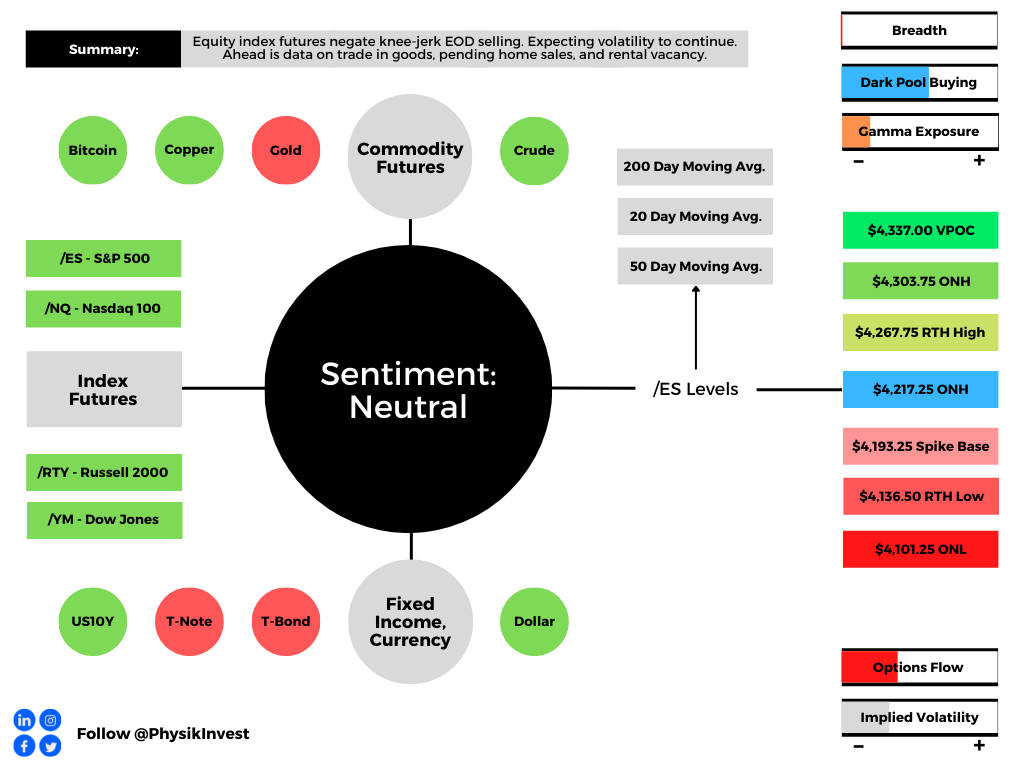
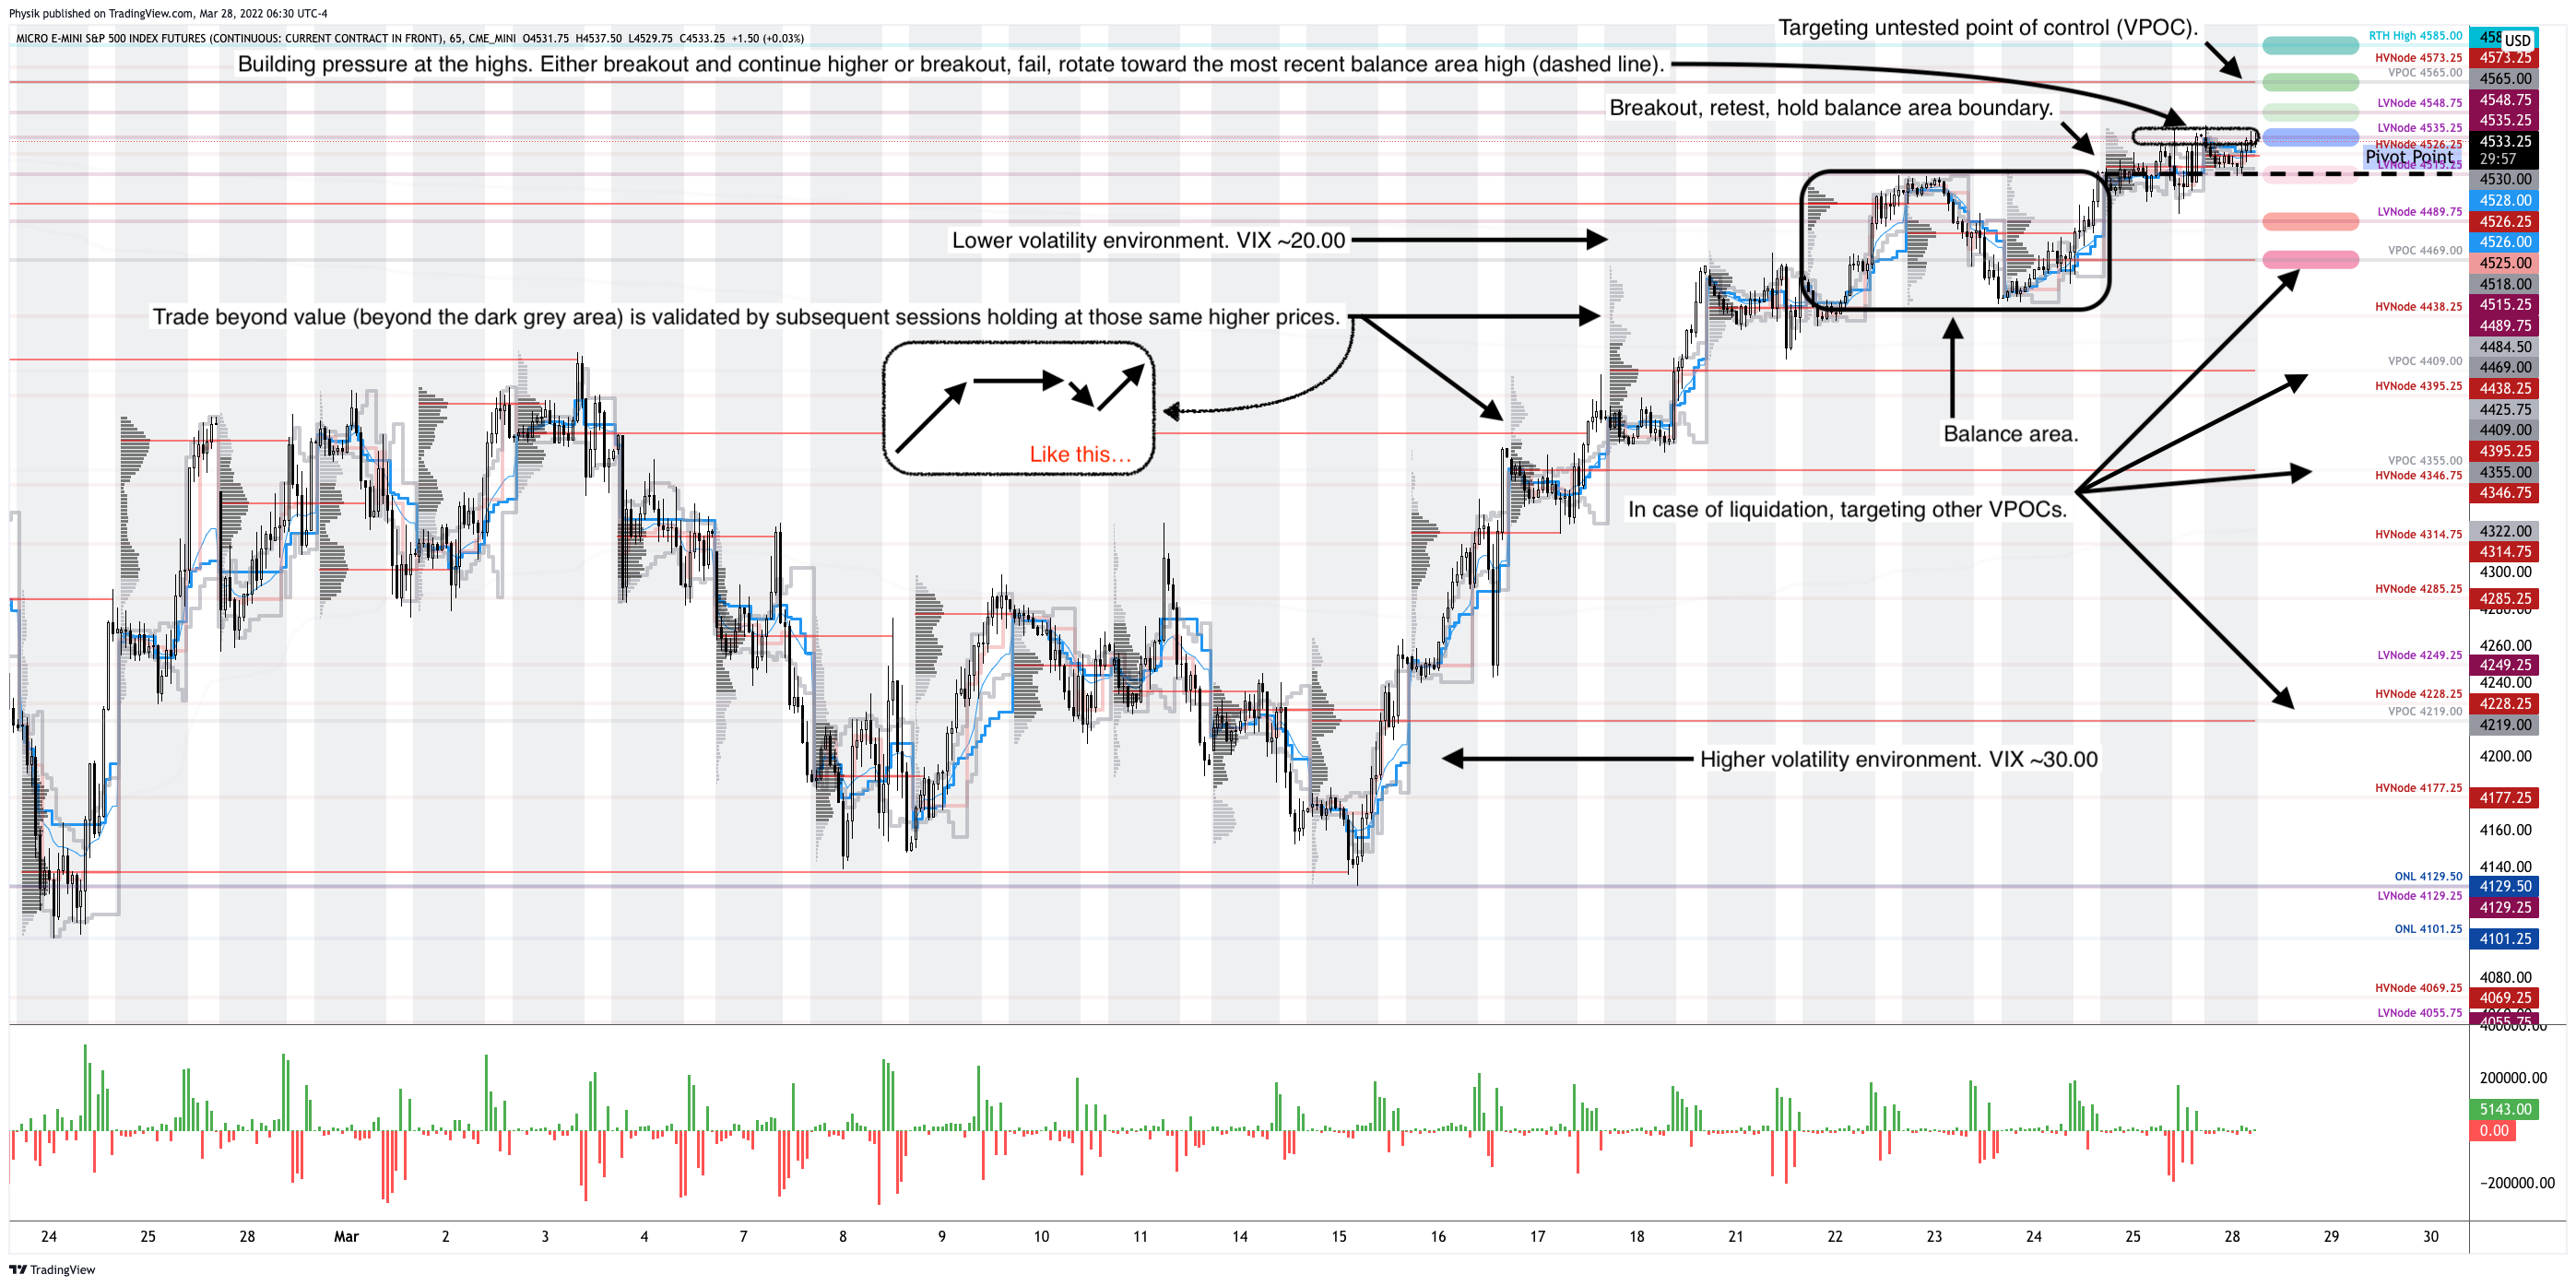
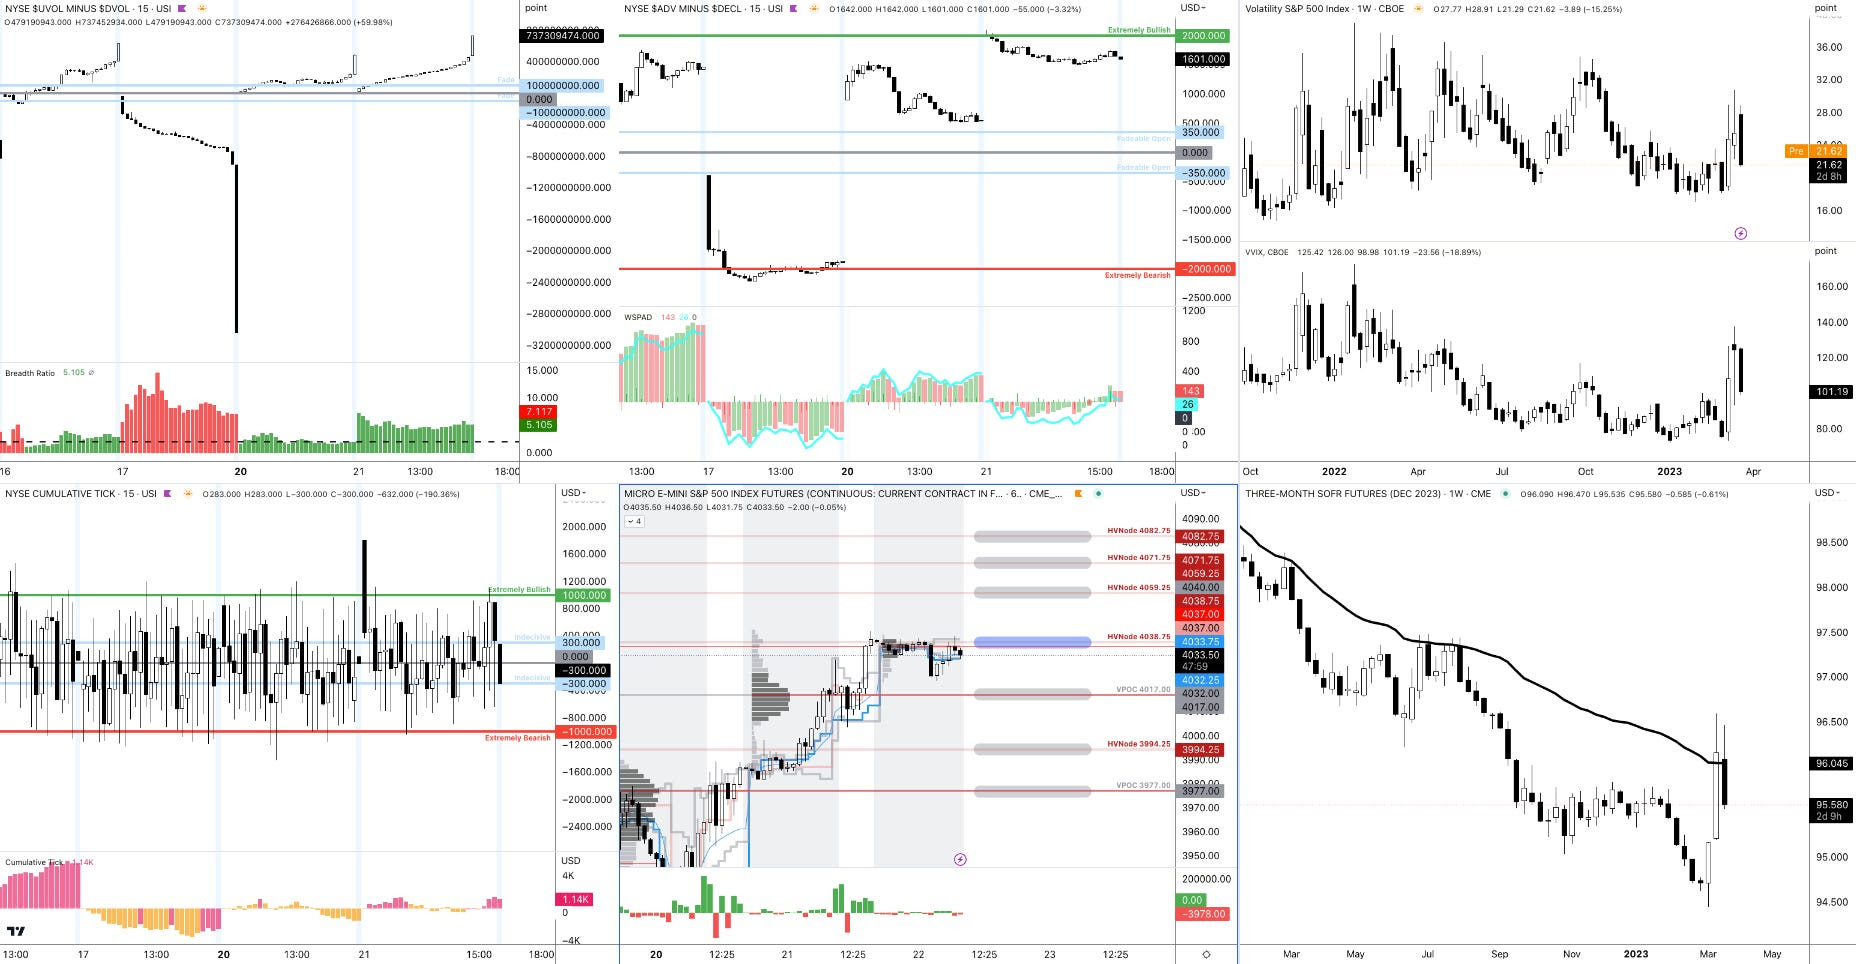
As of 8:15 AM ET, Wednesday’s regular session (9:30 AM – 4:00 PM ET), in the S&P 500, is likely to open in the upper part of a negatively skewed overnight inventory, inside of the prior day’s range, suggesting a limited potential for immediate directional opportunity.

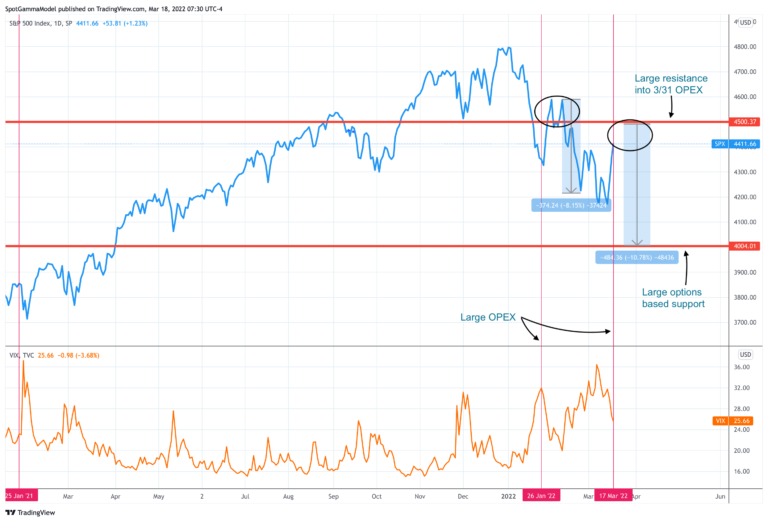
The S&P 500 pivot for today is $4,038.75. 

Key levels to the upside include $4,059.25, $4,071.75, and $4,082.75.

Key levels to the downside include $4,017.00, $3,994.25, and $3,977.00.

Disclaimer: Click here to load the updated key levels via the web-based TradingView platform. New links are produced daily. Quoted levels likely hold barring an exogenous development.

Graphic: 65-minute profile chart of the Micro E-mini S&P 500 Futures (bottom middle).

Definitions

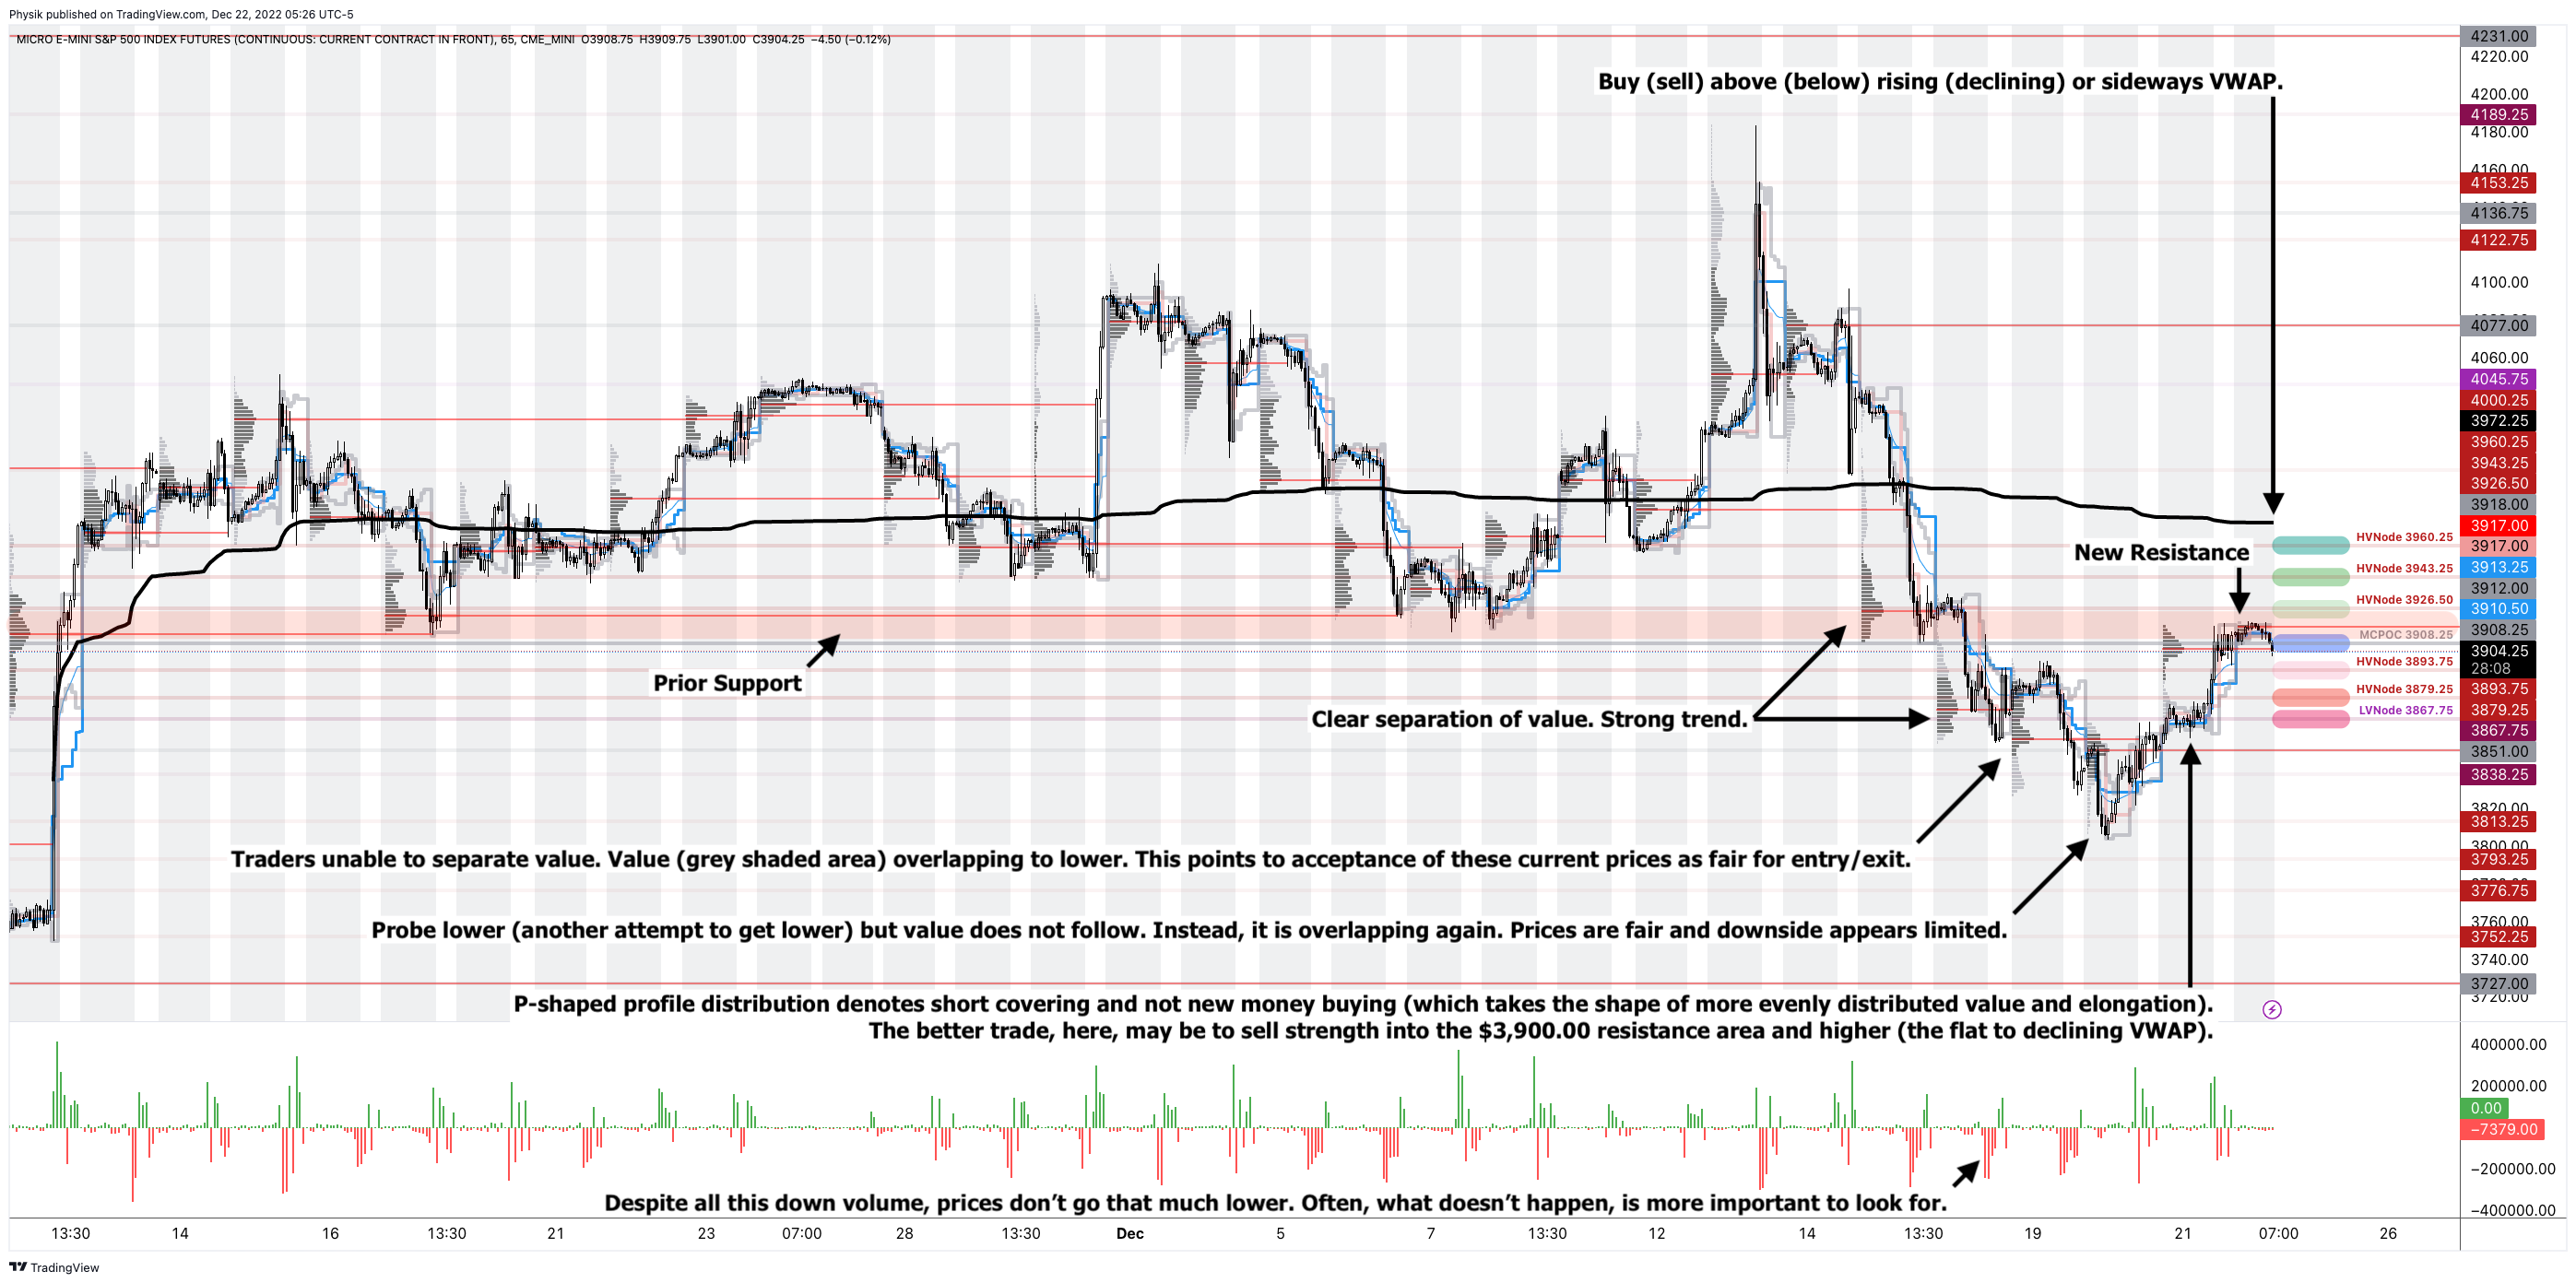
Volume Areas: Markets will build on areas of high-volume (HVNodes). Should the market trend for a period of time, this will be identified by a low-volume area (LVNodes). The LVNodes denote directional conviction and ought to offer support on any test.

If participants auction and find acceptance in an area of a prior LVNode, then future discovery ought to be volatile and quick as participants look to the nearest HVNodes for more favorable entry or exit.

POCs: Areas where two-sided trade was most prevalent in a prior day session. Participants will respond to future tests of value as they offer favorable entry and exit.


About

The author, Renato Leonard Capelj, spends the bulk of his time at Physik Invest, an entity through which he invests and publishes free daily analyses to thousands of subscribers. The analyses offer him and his subscribers a way to stay on the right side of the market. 

Separately, Capelj is an accredited journalist with past works including interviews with investor Kevin O’Leary, ARK Invest’s Catherine Wood, FTX’s Sam Bankman-Fried, North Dakota Governor Doug Burgum, Lithuania’s Minister of Economy and Innovation Aušrinė Armonaitė, former Cisco chairman and CEO John Chambers, and persons at the Clinton Global Initiative.

Connect

Direct queries to renato@physikinvest.com. Find Physik Invest on TwitterLinkedInFacebook, and Instagram. Find Capelj on TwitterLinkedIn, and Instagram. Only follow the verified profiles.

Calendar

You may view this letter’s content calendar at this link.

Disclaimer

Do not construe this newsletter as advice. All content is for informational purposes. Capelj and Physik Invest manage their own capital and will not solicit others for it.

Categories
Commentary

Daily Brief For December 22, 2022

Physik Invest’s Daily Brief is read by thousands of subscribers. You, too, can join this community to learn about the fundamental and technical drivers of markets.

Graphic updated 5:30 AM ET. Sentiment Neutral if expected /ES open is inside of the prior day’s range. /ES levels are derived from the profile graphic at the bottom of this letter. Levels may have changed since initially quoted; click here for the latest levels. SqueezeMetrics Dark Pool Index (DIX) and Gamma (GEX) with the latter calculated based on where the prior day’s reading falls with respect to the MAX and MIN of all occurrences available. A higher DIX is bullish. At the same time, the lower the GEX, the more (expected) volatility. Click to learn the implications of volatility, direction, and moneyness. Breadth reflects a reading of the prior day’s NYSE Advance/Decline indicator. VIX reflects a current reading of the CBOE Volatility Index (INDEX: VIX) from 0-100.

Technical

As of 5:30 AM ET, Thursday’s regular session (9:30 AM – 4:00 PM ET), in the S&P 500, is likely to open in the lower part of a balanced overnight inventory, inside of prior-range and -value, suggesting a limited potential for immediate directional opportunity.

Our S&P 500 pivot for today is $3,908.25. 

Key levels to the upside include $3,926.50, $3,943.25, and $3,960.25. 

Key levels to the downside include $3,893.75, $3,879.25, and $3,867.75.

Click here to load today’s key levels into the web-based TradingView platform. All levels are derived using the 65-minute timeframe. New links are produced, daily.

Graphic: 65-minute profile chart of the Micro E-mini S&P 500 Futures.

Checking Bookmap, a tool that allows us to visualize market liquidity, today, we see orders near the $3,920.00 – $3,925.00 area in the E-mini S&P 500 (FUTURE: /ES). These are orders to enter or exit trades at the resistance area highlighted in the 65-minute profile chart above.

Graphic: Market liquidity in the E-mini S&P 500 Future via thinkorswim’s Bookmap integration.

Considerations: Traders may have noticed responsiveness near key-technical areas visually discernable on a chart. In the Daily Brief for December 21, we discussed the positioning contexts to blame for this. After big events last week, an absence of the unexpected (i.e., what traders sought to hedge and/or bet on) prompted the sale of options protection, a pressure on options prices.

Graphic: Retrieved from SpotGamma.

As a result, the S&P 500 is sliding into lower levels of fixed-strike and top-line implied volatility (IVOL) measures. Given the current positioning, when IVOL is on a downward trajectory, counterparties sell strength and buy weakness. For instance, there is a ton of short-call open interest at the $3,835.00 strike. Customers are (mainly) short these calls. Dealers (on the other side) sell underlying to re-hedge their rising positive Delta exposure from the in-the-money call. This mutes movement.

Graphic: Retrieved from SqueezeMetrics.

This more positive Delta is a consequence of IVOL falling and Gamma (sensitivity to movement) rising. A higher Gamma implies a more variable Delta and, hence, less stable directional risk.

Graphic: Retrieved from SpotGamma.

Basically, as IVOL falls, the extrinsic or time value (theta) of the option falls and, given that in this case, the option is in the money, its intrinsic value (Delta) rises.

Graphic: Retrieved from The Options Industry Council.

While this is happening (i.e., orderly index selling and lower IVOL), big constituents like Tesla Inc (NASDAQ: TSLA) are swinging far more amid traders’ uneasiness and bets, there.

Weakness under the hood, relative to the indexes, and responsiveness to very minute technical levels won’t last; yes, in the interim, you may lean on these levels provided. Again, however, don’t expect that to last.

IVOL is performing poorly and that’s resulted in investors moving to better-performing strategies including short volatility. As a consequence, the broader market is in a less-well-hedged position. Coupled with the removal of the index-level support contexts (i.e., positioning that’s promoting responses to key areas) and some exogenous catalysts, we could see higher realized volatility (RVOL) and less immunity from the weaknesses happening under the hood in single stocks, in the new year.


Definitions

Volume Areas: Markets will build on areas of high-volume (HVNodes). Should the market trend for long periods of time, it will be identified by low-volume areas (LVNodes). LVNodes denote directional conviction and ought to offer support on any test.

If participants auction and find acceptance in an area of a prior LVNode, then future discovery ought to be volatile and quick as participants look to HVNodes for favorable entry or exit.

MCPOCs: Denote areas where two-sided trade was most prevalent over numerous sessions. Participants will respond to future tests of value as they offer favorable entry and exit.


About

In short, an economics graduate working in finance and journalism.

Capelj spends most of his time as the founder of Physik Invest through which he invests and publishes daily analyses to subscribers, some of whom represent well-known institutions.

Separately, Capelj is an equity options analyst at SpotGamma and an accredited journalist interviewing global leaders in business, government, and finance.

Past works include conversations with investor Kevin O’Leary, ARK Invest’s Catherine Wood, FTX’s Sam Bankman-Fried, Lithuania’s Minister of Economy and Innovation Aušrinė Armonaitė, former Cisco chairman and CEO John Chambers, and persons at the Clinton Global Initiative.

Contact

Direct queries to renato@physikinvest.com or Renato Capelj#8625 on Discord.

Calendar

You may view this letter’s content calendar at this link.

Disclaimer

Do not construe this newsletter as advice. All content is for informational purposes.

Categories
Commentary

Daily Brief For May 20, 2022

The daily brief is a free glimpse into the prevailing fundamental and technical drivers of U.S. equity market products. Join the 300+ that read this report daily, below!

What Happened

Ahead of a $1.9 trillion options expiration, which we unpack later in the letter, the equity index and commodity futures, as well as yields, were bid.

This activity was on the heels of good news coming from overseas. China lowered prime rates on the five-year by a record to boost mortgages and loans amid an ongoing pandemic slump.

In other news, China warned the U.S. over a ‘dangerous situation’ forming over Taiwan, and the U.S. is set to block Russian debt payments, raising concerns of default. 

This is as Russian forces, per Michael Horowitz of Le Beck Int’l, broke “Ukrainian defenses west of Popasna in the Donbass, … a tactical success for Russia, the first in a very long time.”

Ahead, there is no data scheduled for release. Enjoy your Friday!

Graphic updated 6:30 AM ET. Sentiment Neutral if expected /ES open is inside of the prior day’s range. /ES levels are derived from the profile graphic at the bottom of the following section. Levels may have changed since initially quoted; click here for the latest levels. SqueezeMetrics Dark Pool Index (DIX) and Gamma (GEX) calculations are based on where the prior day’s reading falls with respect to the MAX and MIN of all occurrences available. A higher DIX is bullish. At the same time, the lower the GEX, the more (expected) volatility. Learn the implications of volatility, direction, and moneyness. SHIFT data used for S&P 500 (INDEX: SPX) options activity. Note that options flow is sorted by the call premium spent; if more positive, then more was spent on call options. Breadth reflects a reading of the prior day’s NYSE Advance/Decline indicator. VIX reflects a current reading of the CBOE Volatility Index (INDEX: VIX) from 0-100.

What To Expect

Fundamental: Fundamentally, the narrative remains the same, albeit there has been a rise in concern over global growth given persistent supply chokepoints and a commitment to reducing liquidity and credit.

Moody’s Corporation’s (NYSE: MCO) Mark Zandi explains “the odds that the economy will suffer a downturn beginning in the next 12 months at one in three with uncomfortable near-even odds of a recession in the next 24 months.”

Graphic: Via The Macro Compass. “Analyst consensus for the 2022 US real GDP growth has been consistently revised down this year.”

Per Bloomberg’s John Authers, U.S. housing is slowing down in the context of still-heightened sales. Data on home building suggests builders “aren’t running scared” while chokepoints still are feeding into support for house prices.

“Now, with inflation rising, the Fed is more concerned about wealth effects,” Authers explained. 

“The rise in asset prices has made a lot of people wealthier and encouraged them to spend accordingly. It’s also stoked inequality. A fall in home values would be helpful at this point,” and it’s something the Fed is keen on “pursuing,” as talked about in letters earlier this week.

Graphic: Via Bloomberg.

Positioning: Friday marks the roll off of $460 billion of derivatives across single stocks and $855 billion of S&P 500-linked contracts, according to a Bloomberg report quoting Goldman Sachs Group Inc (NYSE: GS) research.

Graphic: Via Goldman Sachs Group Inc. Taken from Bloomberg.

Into this event, participants are hedged and volatility remains well-supplied, due in part to suppressive volatility selling, as well as passive flows supporting the largest index constituents.

Consequently, the market’s descent has been orderly and not exacerbated by the demand for hedges and associated repricings of volatility.

This was expected, per Kai Volatility Cem Karsan’s commentary published in December 2021.

“If a meaningful volatility event has recently transpired [e.g., COVID-19], implied volatility demand tends to be high,” as sellers of it were liquidated in previous declines and “buyers have been rewarded with profits and demand for their services.”

Graphic: Via Bloomberg. “2022 is shaping up to be the busiest year for option trading. Almost 40 million contracts have changed hands daily on average, 6% above last year’s record, data compiled by Bloomberg show.”

“Market participants are thus overly hedged going into the second move, resulting in the suppression of implied volatility and skew along with a dampening of realized volatility.”

Graphic: Commentary published by Kai Volatility.

Given the aforementioned supply and demand dynamic, as well as illiquidity, we continue to observe a “divergence in the volatility (movement of underlying equity market up and down) realized, versus that which is implied by options activity,” SpotGamma says.

Graphic: Via @ftx_chris. “The relationship between illiquidity & volatility is a critical market driver for traditional markets now. In simple terms: lower liquidity creates increased volatility.”

“For some of these reasons – tempered measures of implied volatility – the market’s missing a lot of the ‘stored energy’ or ‘vanna fuel’ that’s helped support it in past periods of turmoil.”

Graphic: Via @HalfersPower. “1 day return distribution when QQQ ROC[1] > 3.7%. Historically you can expect the weakest relative mean forward returns, and second-highest mean realized volatility amongst deciles.”

So, barring changes in fundamentals, the catalysts to a potential rally are few and far between, and we elaborated on this in an earlier commentary.

Graphic: Via SqueezeMetrics. Updated May 13, 2022. “VIX compressing to 30 on a modest pre-market rally with dealer gamma exposure more negative than it’s been in years is not how you get sustained rallies—it’s how you get energy for bigger downside moves.”

Heading into Friday, Bloomberg quotes the $4,000.00 S&P 500 (INDEX: SPX) strike having “93,000 open positions set to run out, … includ[ing] 41,024 calls and 52,269 puts.”

Graphic: Via SpotGamma.

An open well below $4,000.00 means that this expiration will coincide with the removal of a lot of in-the-money put-delta. That means, post-expiration, per SpotGamma, “market makers will be free to buy back stocks to cover the short exposures that are no longer needed.” 

“Any ultimate rally off of Opex, we’d consider to be short covering, and subject to swift reversals into the end of next week.”

Technical: As of 6:30 AM ET, Friday’s regular session (9:30 AM – 4:00 PM ET), in the S&P 500, will likely open in the upper part of a positively skewed overnight inventory, just inside of prior-range and -value, suggesting a limited potential for immediate directional opportunity.

In the best case, the S&P 500 trades higher; activity above the $3,943.25 high volume area (HVNode) puts in play the $4,061.00 untested point of control (VPOC). Initiative trade beyond the VPOC could reach as high as the $4,095.00 overnight high (ONH) and $4,119.00 VPOC, or higher.

In the worst case, the S&P 500 trades lower; activity below the $3,943.25 HVNode puts in play the $3,908.75 micro composite point of control (MCPOC). Initiative trade beyond the MCPOC could reach as low as the $3,862.75 and $3,836.25 low volume areas (LVNodes), or lower.

Click here to load today’s key levels into the web-based TradingView charting platform. Note that all levels are derived using the 65-minute timeframe. New links are produced, daily.
Graphic: 65-minute profile chart of the Micro E-mini S&P 500 Futures.

Considerations: Push-and-pull, as well as responsiveness near key-technical areas (discernable visually on a chart), suggests technically-driven traders with shorter time horizons are (becoming) active.

Such traders often lack the wherewithal to defend retests.

Large participants (who often move by committee) seldom respond to key technical inflections. It is their activity that often results in poor reliability of our technical levels.

Sometimes, the better trade is to wait for the larger participants’ entry and use the expansion of the range as a confirmation of a new trend.

Definitions

Overnight Rally Highs (Lows): Typically, there is a low historical probability associated with overnight rally-highs (lows) ending the upside (downside) discovery process.

Volume Areas: A structurally sound market will build on areas of high volume (HVNodes). Should the market trend for long periods of time, it will lack sound structure, identified as low volume areas (LVNodes). LVNodes denote directional conviction and ought to offer support on any test. 

If participants were to auction and find acceptance into areas of prior low volume (LVNodes), then future discovery ought to be volatile and quick as participants look to HVNodes for favorable entry or exit.

POCs: POCs are valuable as they denote areas where two-sided trade was most prevalent in a prior day session. Participants will respond to future tests of value as they offer favorable entry and exit.

MCPOCs: POCs are valuable as they denote areas where two-sided trade was most prevalent over numerous day sessions. Participants will respond to future tests of value as they offer favorable entry and exit.

About

After years of self-education, strategy development, mentorship, and trial-and-error, Renato Leonard Capelj began trading full-time and founded Physik Invest to detail his methods, research, and performance in the markets.

Capelj also develops insights around impactful options market dynamics at SpotGamma and is a Benzinga reporter.

Some of his works include conversations with ARK Invest’s Catherine Wood, investors Kevin O’Leary and John Chambers, FTX’s Sam Bankman-Fried, Kai Volatility’s Cem Karsan, The Ambrus Group’s Kris Sidial, among many others.

Disclaimer

In no way should the materials herein be construed as advice. Derivatives carry a substantial risk of loss. All content is for informational purposes only.

Categories
Commentary

Daily Brief For May 6, 2022

The Daily Brief is a free glimpse into the prevailing fundamental and technical drivers of U.S. equity market products. Join the 200+ that read this report daily, below!

What Happened

Overnight, equity index futures auctioned weak, inside of the prior day’s large trading range.

Yesterday, the equity indexes, bonds, and crypto (which many saw as a hedge against equities) were sold, aggressively. The selling came one day after the Federal Reserve hiked 0.50 basis points and outlined its balance sheet reduction timeline.

Notable was ten-year Treasury yields breaking the 3.00% barrier.

Despite a more dovish tone (i.e., Fed assuaging participants of a 0.75 basis point hike in the coming meetings), the near-vertical price rise (which we discussed was a function of “structural buyback” in yesterday’s morning letter) was taken back in a fire sale across all sectors.

Today is data on nonfarm payrolls, unemployment rates, average hourly earnings, and labor force participation (8:30 AM ET). Later, consumer credit data is released (3:00 PM ET).

Speaking today is the Fed’s John Williams (9:15 AM ET), Raphael Bostic (3:20 PM ET), James Bullard and Chris Waller (7:15 PM ET), as well as Mary Daly (8:00 PM ET).

Graphic updated 6:45 AM ET. Sentiment Neutral if expected /ES open is inside of the prior day’s range. /ES levels are derived from the profile graphic at the bottom of the following section. Levels may have changed since initially quoted; click here for the latest levels. SqueezeMetrics Dark Pool Index (DIX) and Gamma (GEX) calculations are based on where the prior day’s reading falls with respect to the MAX and MIN of all occurrences available. A higher DIX is bullish. At the same time, the lower the GEX, the more (expected) volatility. Learn the implications of volatility, direction, and moneyness. SHIFT data used for S&P 500 (INDEX: SPX) options activity. Note that options flow is sorted by the call premium spent; if more positive, then more was spent on call options. Breadth reflects a reading of the prior day’s NYSE Advance/Decline indicator. VIX reflects a current reading of the CBOE Volatility Index (INDEX: VIX) from 0-100.

What To Expect

Positioning: In yesterday’s detailed letter, we talked about the implications of participants’ hedging heading into and after the Federal Open Market Committee (FOMC) event.

Mainly, markets were stretched and participants were demanding protection in size. As said:

“Barring a worst-case scenario, if markets do not perform to the downside (i.e., do not trade lower), those highly-priced (often very short-dated) bets on direction will quickly decay, and hedging flows with respect to time and volatility may bolster sharp rallies.” 

After that “structural buyback,” as Kai Volatility’s Cem Karsan explained clearly, it was highly likely the bear trend would hold. Participants not shifting their bets on direction (via options) to higher prices, further out in time, further suggested very little change in sentiment.

Toggle, which is an AI and machine learning research firm tracking 35,000 securities globally, sent us, yesterday, their post-Fed analysis. According to them, “during the first week after the Fed’s 50 bps hike markets broadly headed lower.”

“In fact, 1 in 5 times the drop reached more than 5%.”

Graphic: Via Toggle.

The firm’s CEO and founder – Jan Szilagyi – said, in response to the market action that “market bulls should root for stocks to go down first.”

That’s actually a powerful statement. For markets to break (rally), they sometimes need to rally (break). Said another way, at times the market is stretched. Sellers (buyers) are either too short (or too long), if we will.

In order to trade lower, for instance, that short inventory (which in and of itself is a support mechanism as it is a bunch of buy orders sitting at lower prices) must be cleared (i.e., covered).

After that support is removed, the market can succumb to whatever fundamental weaknesses it was trying to price in. 

In this case, “the incremental effects on liquidity (QE/QT),” as Karsan says.

Moreover, what’s interesting, and this is something others have picked up on, is the difference between the level of volatility that is realized and implied by activity in the derivatives market.

Another time we saw such divergences was during the 2020 Coronacrisis sell-off.

Graphic: Via @HalfersPower. On March 2, 2020, “VIX-30 day realized vol go from 99 percentile yesterday to inverted and 9 percentile today lol. (left vs. right).

Let’s unpack. So, the Cboe Volatility Index (INDEX: VIX), as described by Cboe Global Markets Inc (BATS: CBOE), is a “constant, 30-day expected volatility of the U.S. stock market, derived from real-time, mid-quote prices of S&P 500 Index (INDEX: SPX) call and put options.”

Essentially, to make it simple, VIX is the equity market’s pricing of risk or insurance and it has a strong inverse relationship with the SPX. If SPX is lower, the VIX higher, basically.

Then, just as we have metrics to measure the change in an option’s sensitivity to the underlying direction (delta) or gamma, we have the sensitivity of an option to changes in volatility (vega) or volga.

Volga has different names. Vomma. The convexity of vega (i.e., change in vega based on change in volatility implied by market participants’ activity). The volatility of volatility. And so on.

The volatility of volatility can naively be measured through the Cboe VVIX Index (INDEX: VVIX) which, according to Cboe, “represents a volatility of volatility in the sense that it measures the expected volatility of the 30-day forward price of VIX.”

Historically, the gauge has a mean somewhere beneath 100 and a high correlation with the VIX at times of heightened stress (e.g., Coronacrisis).

Graphic: The VVIX via Physik Invest.

What’s going on is there is really negative sentiment and emotion, both of which are playing into market weaknesses and realized volatility. However, that realized volatility is not priced in.

In other words, the volatility of volatility – VVIX – is low relative to the volatility realized (and implied) and that, as I take it, essentially means that the market is not pricing up protection.

Graphic: Via The Ambrus Group’s Kris Sidial. “Trotting out the good old VVIX/VIX (trader heuristic) to compare SPX skew to VIX Vol. Negative sentiment but lack of fear continues.”

Why does this matter? Well, when you think there is to be an outsized move, relative to what is priced, you buy options (positive exposure to gamma) so that you may have gains that are potentially amplified in case of directional movement.

You also buy can buy options for positive exposure to volga. This is so that you may have gains that are potentially amplified in case of movement (repricing) in implied volatility.

Graphic: Via @Alpha_Ex_LLC. “Here’s 10-day realized vs VVIX on a scatter. The ‘white star’ is 40 realized but only 117 VVIX. When realized this high, VVIX typically closer to 150.”

With back-to-back daily price changes sometimes in excess of 2%, this essentially suggests to us the potential for the pricing of equity market risk to “catch up.”

Graphic: Via Bloomberg. The realized volatility for the SPX versus the VIX.

Per SpotGamma, much of this has to do with market participants being “well-hedged.”

“From an options perspective, participants would have to demand en masse protection (buy puts, sell calls) for liquidity providers to further take from market liquidity (sell into weakness) and that volatility skew to, essentially, blowout (e.g., Corona crisis, Meme mania, and the like).”

The Ambrus Group’s Kris Sidial, who felt that the liquidation was likely large desks de-risking their book, explains, well, too: 

“Vol is mainly used as a source of hedging. We are coming off of a big FOMC meeting where vol was slightly elevated. Think about this for a second, although SPX had a nasty day today, we are still right where we were at Tuesday… what does that tell you?”

“That means there wasn’t really a NEED to rehedge that same exposure. Volatility didn’t compress much after FOMC and when the market gave it all back it brought us right back to where we started. Put yourself in the shoes of an institution.”

Graphic: SpotGamma’s Hedging Impact of Real-Time Options Indicator (HIRO) for SPY shows light put selling and call buying. Participants are (likely) hedged and are not demanding protection in size amid lower prices.

Pursuant to those remarks, SpotGamma sees markets reaching a lower limit near the $4,000.00 SPX area. At that juncture, the rate at which liquidity providers add pressure in their hedging activities flattens as they, too, have hedges.

Graphic: Via SpotGamma. Updated April 27, 2022.

“In turn, dealers may be able to advantageously reduce delta hedging (sell less), and supply markets with more liquidity (buy more stock). This could serve to reduce volatility.”

So, what do you do with this information? The idea is that volatility implied may reprice to reflect what is realized. In such a case, you’d want positive exposure to volga (i.e., don’t sell volatility).

This is more of a view on volatility rather than direction, at this juncture.

Directionally speaking, the returns distribution is skewed positive. This is from an overlay of proxies for buying and naive gamma exposure.

Here’s one model using similar data we often look at in this letter.

Graphic: Via nextSignals. “When SPX and [gamma exposure] nosedive after an extended selloff while dark pools’ buying sharply diverges to the upside … buy the S&P 500.”

Technical: As of 6:45 AM ET, Friday’s regular session (9:30 AM – 4:00 PM ET), in the S&P 500, will likely open in the middle part of a negatively skewed overnight inventory, inside of prior-range and -value, suggesting a limited potential for immediate directional opportunity.

In the best case, the S&P 500 trades higher; activity above the $4,148.25 high volume area (HVNode) puts in play the $4,184.25 HVNode. Initiative trade beyond the $4,184.25 HVNode could reach as high as the $4,212.25 micro composite point of control (MCPOC) and $4,303.00 weak high (obvious breakout level), or higher.

In the worst case, the S&P 500 trades lower; activity below the $4,148.25 HVNode puts in play the $4,099.25 regular trade low (RTH Low). Initiative trade beyond the RTH Low could reach as low as the $4,055.75 low volume area (LVNode) and $3,978.50 LVNode, or lower.

Click here to load today’s key levels into the web-based TradingView charting platform. Note that all levels are derived using the 65-minute timeframe. New links are produced, daily.
Graphic: 65-minute profile chart of the Micro E-mini S&P 500 Futures.

Definitions

Overnight Rally Highs (Lows): Typically, there is a low historical probability associated with overnight rally-highs (lows) ending the upside (downside) discovery process.

Volume Areas: A structurally sound market will build on areas of high volume (HVNodes). Should the market trend for long periods of time, it will lack sound structure, identified as low volume areas (LVNodes). LVNodes denote directional conviction and ought to offer support on any test. 

If participants were to auction and find acceptance into areas of prior low volume (LVNodes), then future discovery ought to be volatile and quick as participants look to HVNodes for favorable entry or exit.

POCs: POCs are valuable as they denote areas where two-sided trade was most prevalent in a prior day session. Participants will respond to future tests of value as they offer favorable entry and exit.

Volume-Weighted Average Prices (VWAPs): A metric highly regarded by chief investment officers, among other participants, for quality of trade. Additionally, liquidity algorithms are benchmarked and programmed to buy and sell around VWAPs.

About

After years of self-education, strategy development, mentorship, and trial-and-error, Renato Leonard Capelj began trading full-time and founded Physik Invest to detail his methods, research, and performance in the markets.

Capelj also develops insights around impactful options market dynamics at SpotGamma and is a Benzinga reporter.

Some of his works include conversations with ARK Invest’s Catherine Wood, investors Kevin O’Leary and John Chambers, FTX’s Sam Bankman-Fried, Kai Volatility’s Cem Karsan, The Ambrus Group’s Kris Sidial, among many others.

Disclaimer

In no way should the materials herein be construed as advice. Derivatives carry a substantial risk of loss. All content is for informational purposes only.

Categories
Commentary

Daily Brief For May 3, 2022

The Daily Brief is a free glimpse into the prevailing fundamental and technical drivers of U.S. equity market products. Join the 200+ that read this report daily, below!

What Happened

Overnight, equity index futures were sideways, inside of the prior range, after exploring much lower, Monday. Measures of implied volatility, bonds, and most commodities were bid.

This is alongside news that Russia is dodging default, the necessity for the Fed to drop inflation down to 4% by year-end per Citadel’s Ken Griffin, the U.S. Treasury’s intent to scale back sales of longer-term debt, falling earnings estimates, Taiwan preparing to fend-off a potential invasion as Beijing ordered officials to find ways to fight against western sanctions, similar to those used against Russia, among other things including Fitch trimming China’s 2022 growth forecast.

Also, near risk-free, inflation-protected I bonds will pay 9.62% through October, the Treasury said, and here’s more on the Citigroup Inc (NYSE: C) trader that’s behind a European crash.

Ahead is data on job openings and quits, as well as factory and core capital goods orders (10:00 AM ET).

Read on for coverage on the fundamental and technical position of the market, as well as ways to position for future trade.

Graphic updated 6:45 AM ET. Sentiment Neutral if expected /ES open is inside of the prior day’s range. /ES levels are derived from the profile graphic at the bottom of the following section. Levels may have changed since initially quoted; click here for the latest levels. SqueezeMetrics Dark Pool Index (DIX) and Gamma (GEX) calculations are based on where the prior day’s reading falls with respect to the MAX and MIN of all occurrences available. A higher DIX is bullish. At the same time, the lower the GEX, the more (expected) volatility. Learn the implications of volatility, direction, and moneyness. SHIFT data used for S&P 500 (INDEX: SPX) options activity. Note that options flow is sorted by the call premium spent; if more positive, then more was spent on call options. Breadth reflects a reading of the prior day’s NYSE Advance/Decline indicator. VIX reflects a current reading of the CBOE Volatility Index (INDEX: VIX) from 0-100.

What To Expect

Fundamental: The Federal Reserve (Fed) is expected to raise its target overnight rate by about 50 basis points and provide updates on quantitative tightening (QT).

Graphic: Via CME Group Inc’s (NASDAQ: CME) FedWatch Tool. Market participants expect a near-100% chance the fed moves its target rate to 75 or 100 basis points.

The expectations of the aforementioned have played into a tightening of financial conditions which, as Columbia Threadneedle’s Gene Tannuzzo explains, “reduces demand and ultimately slows inflation.”

Graphic: Via Bloomberg. “Tighter financial conditions are the mechanism that reduces demand and ultimately slows inflation,” said Tannuzzo, the firm’s global head of fixed income. “If financial conditions don’t tighten and inflation remains high, in their eyes, they need to hike more.”

The key is the update on QT. As Bloomberg’s John Authers puts it well, “what the Fed does with its balance sheet at the margin [] matters for asset prices, and there is little or no lag.”

Graphic: Via Crossborder Capital Ltd. Taken from Bloomberg.

The Fed’s liquidity reductions, thus far, have played into the market’s troubles since the start of the year. This is as QT has an impact on the “ability to roll over or refinance investments.”

Graphic: Taken from The Market Ear. “46% of non-earnings driven market cap changes were explained by Fed balance sheet expansion since GFC.”

Perspective: JPMorgan Chase & Co (NYSE: JPM) strategists note that investors’ fears are unwarranted. The U.S.’s economic expansion has not been derailed. 

“Worries about China’s growth outlook, a negative take on the Q1 earnings reporting season, concerns about higher bond yields and further tightening of financial conditions from a strong dollar, all appear to have soured equity and credit investors’ sentiment,” the strategists said. 

“We find these fears overblown.”

Positioning: Comments from yesterday’s morning letter remain valid, today.

Participants’ bets on the direction are concentrated in negative delta (long puts, short calls). The exposure is short-dated and extremely sensitive to changes in implied volatility and direction.

Graphic: Via Goldman Sachs Group Inc (NYSE: GS). Taken from The Market Ear. “Retail Investors buyers of 0-1 DTE (days-to-expiry) puts are largest on record.”

Those options carry a lot of gamma and are exposed to the potential for asymmetric or convex payouts. This is not good for those who are on the other side.

In hedging a short put, for instance, a positive delta and negative gamma trade, counterparties sell underlying if there is weakness or jumps in implied volatility. If the underlying trades higher, or dips in volatility, the counterparty will buy the underlying, all else equal.

Taken together, in such an environment, the counterparty leans toward taking liquidity and this exacerbates underlying movement if there’s a thinning liquidity environment, SpotGamma says.

Graphic: Via Goldman Sachs Group Inc (NYSE: GS). Taken from SpotGamma.

In other words, hedging matters more in such an environment. This was clear during Monday’s trade when a bout of put selling and light call buying appeared in both the SPDR S&P 500 ETF Trust (NYSE: SPY) and Invesco QQQ Trust Series 1 (NASDAQ: QQQ).

This, ultimately, too, fed into the compression of volatility at the short-end of the term structure, yesterday. To re-hedge, counterparts likely bought into the market’s weakness and bolstered the near-vertical reversal, and close higher.

Graphic: SpotGamma’s Hedging Impact of Real-Time Options (HIRO) indicator for SPY. A rising blue and orange denote put selling and call buying, respectively.

The odds of follow-through, to the upside, come back to the fundamental situation and Fed announcements this week. Should fears with respect to monetary policy be assuaged, then volatility can compress and that, alone, will spur a buy-back of those underlying short hedges.

If participants start to concentrate their bets at higher prices, further out in time, that confirms the odds of sustained follow-through. If not, it’s likely that prices, after a short-term relief, will succumb to fundamental weaknesses.

Technical: As of 6:45 AM ET, Tuesday’s regular session (9:30 AM – 4:00 PM ET), in the S&P 500, will likely open in the middle part of a balanced overnight inventory, inside of prior-range and -value, suggesting a limited potential for immediate directional opportunity.

In the best case, the S&P 500 trades higher; activity above the $4,123.00 untested point of control (VPOC) puts in play the $4,176.00 overnight high (ONH). Initiative trade beyond the ONH could reach as high as the $4,247.00 VPOC and $4,279.75 ONH, or higher.

In the worst case, the S&P 500 trades lower; activity below the $4,123.00 VPOC puts in play the $4,055.75 low volume area (LVNode). Initiative trade beyond the LVNode could reach as low as the $3,978.50 LVNode and $3,943.25 high volume area (HVNode), or lower.

Click here to load today’s key levels into the web-based TradingView charting platform. Note that all levels are derived using the 65-minute timeframe. New links are produced, daily.
Graphic: 65-minute profile chart of the Micro E-mini S&P 500 Futures.

Considerations: Most interesting was Monday’s response at a key technical level ($4,055.75) outlined in the morning letter.

Specifically, the E-mini S&P 500 probed $4,056.00 before staging a sharp reversal and closing higher. This is noteworthy as it tells us a lot about who has (or is gaining) the upper hand.

Push-and-pull, as well as responsiveness near key-technical areas (discernable visually on a chart), suggests technically-driven traders with shorter time horizons are (becoming) active.

Such traders often lack the wherewithal to defend retests and, additionally, this type of trade may suggest other time frame participants are waiting for more information to initiate trades.

Adding, the Federal Reserve’s meeting this week concludes with statements to be shared on Wednesday. For weeks heading into this event, (larger) participants (that move by committee) have de-grossed and hedged. For that reason, the reliability of our technical levels took a hit.

Graphic: Via JPMorgan Chase & Co (NYSE: JPM). Taken from The Market Ear. Per Bloomberg, “Hedge funds tracked by Morgan Stanley have also cut their net leverage — a measure of risk appetite that takes into account long versus short positions — to a two-year low.”

In the very near term, until more fundamental information is revealed, these technical-driven traders may play a larger role in the volatility. These traders, given capital constraints and tolerances, often trigger sharp moves in their entry and exit on news. Caution on whipsaw.

How I’m Playing: Presently, the market is stretched to the downside and participants are leaning, heavily, one way.

Graphic: Via SpotGamma, “Put vs Call gamma suggests stretched positioning.”

Pursuant to that remark, as SpotGamma says, “traders are underpricing right-tail risk,” and that opens the window for unique ways to play a returns distribution that is skewed positive (albeit with large negative outliers).

Consider zero- or low-cost bets that deliver asymmetric payouts in case of reversals.

This letter’s writer presently is structured positive delta and gamma in the Nasdaq 100 (INDEX: NDX) via ratios spread (1×2) and butterfly (1x2x1) structures. 

The concern with these strategies is the width and time to expiry. Should either of those be wrong, then spreads initially positive gamma turn negative, meaning losses are amplified.

For instance, in the Nasdaq 100, to put in short, 500-1000 points wide ratio spreads (buy the closer leg, sell two of the farther legs) expiring in ten to fifteen days work well. 

For those spreads that are not zero cost, debits can be offset with credit sales (on the put side) in products that have shown relative strength like the S&P 500 (INDEX: SPX). This, inherently, carries more risk. Read more about these strategies, here.

Please note that the above is NOT a trade recommendation or advice.

Graphic: Via Banco Santander SA (NYSE: SAN) research, the return profile, at expiry, of a classic 1×2 (long 1, short 2 further away) ratio spread.

Definitions

Overnight Rally Highs (Lows): Typically, there is a low historical probability associated with overnight rally-highs (lows) ending the upside (downside) discovery process.

Volume Areas: A structurally sound market will build on areas of high volume (HVNodes). Should the market trend for long periods of time, it will lack sound structure, identified as low volume areas (LVNodes). LVNodes denote directional conviction and ought to offer support on any test. 

If participants were to auction and find acceptance into areas of prior low volume (LVNodes), then future discovery ought to be volatile and quick as participants look to HVNodes for favorable entry or exit.

POCs: POCs are valuable as they denote areas where two-sided trade was most prevalent in a prior day session. Participants will respond to future tests of value as they offer favorable entry and exit.

Volume-Weighted Average Prices (VWAPs): A metric highly regarded by chief investment officers, among other participants, for quality of trade. Additionally, liquidity algorithms are benchmarked and programmed to buy and sell around VWAPs.

About

After years of self-education, strategy development, mentorship, and trial-and-error, Renato Leonard Capelj began trading full-time and founded Physik Invest to detail his methods, research, and performance in the markets.

Capelj also develops insights around impactful options market dynamics at SpotGamma and is a Benzinga reporter.

Some of his works include conversations with ARK Invest’s Catherine Wood, investors Kevin O’Leary and John Chambers, FTX’s Sam Bankman-Fried, Kai Volatility’s Cem Karsan, The Ambrus Group’s Kris Sidial, among many others.

Disclaimer

In no way should the materials herein be construed as advice. Derivatives carry a substantial risk of loss. All content is for informational purposes only.

Categories
Commentary

Daily Brief For April 27, 2022

The Daily Brief is a free glimpse into the prevailing fundamental and technical drivers of U.S. equity market products. Join the 200+ that read this report daily, below!

What Happened

Overnight, equity index futures probed higher, essentially negating Tuesday’s end-of-day, knee-jerk liquidation.

Tuesday’s selling came alongside Russia cutting gas to Poland and Bulgaria, Vice President Kamala Harris testing positive for COVID-19, and heavy selling in growth and tech stocks, amid doubts corporate profits can withstand the Federal Reserve’s bid to tame inflation.

As Jerome Schneider of Pacific Investment Management Co says, QT will “have a profound effect on the cost of liquidity and more importantly the cost of transacting business and reallocating assets from one avenue to another avenue.” 

“There might not necessarily be a rapid deceleration or decline in the stock market or other risk assets, but there’s going to be a changing cost of capital that this balance sheet is going to be part of.”

After the close, weakness continued. Alphabet Inc (NASDAQ: GOOGL) (NASDAQ: GOOG) missed on slowing sales growth and digital-ad spending. One of the biggest losers was Tesla Inc (NASDAQ: TSLA) which shed 12% or so on news that Elon Musk would use his fortune, much of which is tied up in Tesla, to buy Twitter Inc (NYSE: TWTR).

Germany’s passage of a bigger borrowing budget, coupled with China’s pledge to boost infrastructure bolstered an overnight advance that fed into price action at home. The S&P 500, in particular, for a brief moment, took back a key level, negating much of yesterday’s liquidation.

Ahead is data on international trade in goods (8:30 AM ET), as well as pending home sales and the rental vacancy rate (10:00 AM ET).

Graphic updated 7:00 AM ET. Sentiment Neutral if expected /ES open is inside of the prior day’s range. /ES levels are derived from the profile graphic at the bottom of the following section. Levels may have changed since initially quoted; click here for the latest levels. SqueezeMetrics Dark Pool Index (DIX) and Gamma (GEX) calculations are based on where the prior day’s reading falls with respect to the MAX and MIN of all occurrences available. A higher DIX is bullish. At the same time, the lower the GEX, the more (expected) volatility. Learn the implications of volatility, direction, and moneyness. SHIFT data used for S&P 500 (INDEX: SPX) options activity. Note that options flow is sorted by the call premium spent; if more positive, then more was spent on call options. Breadth reflects a reading of the prior day’s NYSE Advance/Decline indicator. VIX reflects a current reading of the CBOE Volatility Index (INDEX: VIX) from 0-100.

What To Expect

Positioning: Markets are positioned for continued volatility. 

Based on a reading of market gamma exposure (GEX) and buying support (DIX), the returns distribution is skewed positive. There’s buying in the context of an environment in which the hedging of options positioning implies selling into weakness and buying of strength.

Graphic: Via Barclays PLC (NYSE: BCS) research.

In the most simple way that I can explain: when positioning is stretched one way, that often tends to mark a turning point – the returns distribution is either skewed positive or negative.

Graphic: Via Physik Invest. Data via SqueezeMetrics. Updated March of 2022. A high DIX/GEX ratio often portends positive 1-month returns.

An updated read, after Tuesday’s weak close, tells us that we can (1) definitely expect larger ranges to continue and (2) potential for short-term bounces

Based on overnight activity, one of those is happening, now.

Graphic: Via Physik Invest. Data via SqueezeMetrics.

This is as participants are both well-hedged and using weakness as an opportunity to buy into a less highly valued market.

Well-hedged means that customers (i.e., you and I) own protection against long equity exposure. So, that could mean customers own puts and/or are short calls. One of the most dominant flows is the long put, short call.

Such trade offers customers positive, yet asymmetric (gamma), exposure to direction (delta). In other words, negative delta and positive gamma. 

The counterparty has exposure to positive delta and negative gamma. If the underlyings trade lower and volatility rises, all else equal, the position will lose. To hedge against these losses, the counterparties will sell underlying into weakness.

If prices reverse and move higher, these counterparties will re-hedge and buy underlying.

Normally, as seen over the bull run of 2020 and 2021, markets are in an uptrend and there’s a strong supply of volatility. Often, customers sell more calls than puts and, in an uptrend, those calls solicit more active hedging than the put options.

Recall that the customer is short the call. That means the counterparty is long the call (a positive delta and gamma trade) and will make money if prices rise, all else equal. 

The hedging of this particular exposure (i.e., sell strength, buy weakness), in an uptrend, occurs slower (i.e., counterparts will allow their profits to run), and that’s what can help the market sustain lower volatility trends for longer periods.

When prices reverse and underlyings trade lower, put options solicit increased hedging activity. Given the nature of counterparty exposure to those puts, that hedging happens quickly and can take from market liquidity as to volatility (i.e., buy strength, sell weakness).

See, below, E-mini S&P 500 book depth, a proxy for market liquidity, and how much it has declined since the end of last year when markets became more volatile and noise around the Federal Reserve’s intent to taper bond-buying and raise rates grew louder.

Graphic: Via CME Group Inc (NASDAQ: CME) Liquidity Tool. Note how in late March, book depth rose as markets rose and customer call activity solicited increased hedging of counterparty long-gamma exposure (i.e., buy weakness, sell strength), adding to market liquidity.

In the above environment, counterparty hedging matters; the market is more sensitive to the flow, so to speak. That sensitivity is expected to continue.

SpotGamma, an options data and analysis service, sees the early May period as pivotal. Then is the Federal Open Market Committee (FOMC) meeting and the potential Russian default, per Moody’s Corporation (NYSE: MCO).

As quoted: “Russia ‘may be considered in default’ if it does not pay two bonds in US dollars by end of a grace period on May 4.”

Graphic: Via Bloomberg.

Until those events are resolved, participants will likely continue to (remain) hedge(d). Upon resolve, customers likely monetize their protection to offset losses on underlying equity exposure. 

That means selling volatility which reduces counterparty exposure to short puts (negative gamma and positive delta). To re-hedge, underlying is bought back and that may support a price rise.

Graphic: VIX term structure via VIX Central. Expansion (higher) solicits counterparty selling which pressures the market lower. Compression (lower) solicits counterparty buying which bolsters attempts higher.

Whether that price rise has legs depends on what the fundamental situation is, then. See the below section titled Considerations for a full technical picture and the most likely turning points.

Technical: As of 7:00 AM ET, Wednesday’s regular session (9:30 AM – 4:00 PM ET), in the S&P 500, will likely open in the middle part of a balanced overnight inventory, inside of prior-range and -value, suggesting a limited potential for immediate directional opportunity.

In the best case, the S&P 500 trades higher; activity above the $4,217.25 overnight high (ONH) puts in play the $4,267.75 regular trade high (RTH High). Initiative trade beyond the RTH High could reach as high as the $4,303.75 ONH and $4,337.00 VPOC, or higher.

In the worst case, the S&P 500 trades lower; activity below the $4,217.25 ONH puts in play the $4,193.25 spike base. Initiative trade beyond the spike base could reach as low as the $4,136.50 regular trade low (RTH Low) and $4,101.25 overnight low (ONL), or lower.

Considerations: Spikes mark the beginning of a break from value. Spikes higher (lower) are validated by trade at or above (below) the spike base (i.e., the origin of the spike).

Additionally, the indexes continue to trade below their 20-, 50-, and 200-day simple moving averages, confirming the trend change and bearish tone (further validated by poor breadth).

Graphic: Market Internals as pioneered by (a mentor of mine) Peter Reznicek. Notice the indicator in the top right, weighted S&P sectors (histogram) versus unweighted (blue line). During late last week, participants sold the entire market, heavily (as supported by the difference between the volume flowing into stocks that are up versus those that are down).

All indexes remain, as stated, yesterday, below their volume-weighted average prices (VWAPs) anchored from the start of this year (or their respective peaks). 

VWAPs are a metric highly regarded by chief investment officers (CIOs), among other participants, for quality of trade. Liquidity algorithms, too, are benchmarked and programmed to buy and sell around VWAPs.

The Invesco QQQ Trust Series 1 (NASDAQ: QQQ) just tested a major VWAP, yesterday, anchored from the lows of March 2020. That’s a fair price to pay for Nasdaq 100 exposure.

Graphic: Invesco QQQ Trust Series 1 (NASDAQ: QQQ) with anchored VWAPs.

Notwithstanding, notice the flat-to-declining AVWAP that’s black in color. So long as prices remain below this level, the index is likely a sell. 

Should that level flatten (and begin to rise), and if the QQQ was able to trade above it for a sustained period, there is potential for sustained upside.

Click here to load today’s key levels into the web-based TradingView charting platform. Note that all levels are derived using the 65-minute timeframe. New links are produced, daily.
Graphic: 65-minute profile chart of the Micro E-mini S&P 500 Futures.

Definitions

Overnight Rally Highs (Lows): Typically, there is a low historical probability associated with overnight rally-highs (lows) ending the upside (downside) discovery process.

Volume Areas: A structurally sound market will build on areas of high volume (HVNodes). Should the market trend for long periods of time, it will lack sound structure, identified as low volume areas (LVNodes). LVNodes denote directional conviction and ought to offer support on any test. 

If participants were to auction and find acceptance into areas of prior low volume (LVNodes), then future discovery ought to be volatile and quick as participants look to HVNodes for favorable entry or exit.

POCs: POCs are valuable as they denote areas where two-sided trade was most prevalent in a prior day session. Participants will respond to future tests of value as they offer favorable entry and exit.

About

After years of self-education, strategy development, mentorship, and trial-and-error, Renato Leonard Capelj began trading full-time and founded Physik Invest to detail his methods, research, and performance in the markets.

Capelj also develops insights around impactful options market dynamics at SpotGamma and is a Benzinga reporter.

Some of his works include conversations with ARK Invest’s Catherine Wood, investors Kevin O’Leary and John Chambers, FTX’s Sam Bankman-Fried, Kai Volatility’s Cem Karsan, The Ambrus Group’s Kris Sidial, among many others.

Disclaimer

In no way should the materials herein be construed as advice. Derivatives carry a substantial risk of loss. All content is for informational purposes only.

Categories
Commentary

Daily Brief For March 28, 2022

The Daily Brief is a free glimpse into the prevailing fundamental and technical drivers of U.S. equity market products. Join the 200+ that read this report daily, below!

What Happened

Overnight, equity index futures diverged during participants’ attempt to discover higher prices.

Commodities were mixed while bonds extended their slump; central bank authorities, in an effort to rein in inflation amid rising prices, are focused on implementing tighter monetary policies.

For a moment, the (5-30) Treasury curve dropped below zero for the first time since 2006. This is after the Federal Reserve’s (Fed) Jerome Powell said last week the central bank was committed to upping borrowing costs and would hike by 50 basis points if needed.

Graphic updated 6:40 AM ET. Sentiment Neutral if expected /ES open is inside of the prior day’s range. /ES levels are derived from the profile graphic at the bottom of the following section. Levels may have changed since initially quoted; click here for the latest levels. SqueezeMetrics Dark Pool Index (DIX) and Gamma (GEX) calculations are based on where the prior day’s reading falls with respect to the MAX and MIN of all occurrences available. A higher DIX is bullish. At the same time, the lower the GEX, the more (expected) volatility. Learn the implications of volatility, direction, and moneyness. SHIFT data used for S&P 500 (INDEX: SPX) options activity. Note that options flow is sorted by the call premium spent; if more positive, then more was spent on call options. Breadth reflects a reading of the prior day’s NYSE Advance/Decline indicator. VIX reflects a current reading of the CBOE Volatility Index (INDEX: VIX) from 0-100.

What To Expect

Fundamental: Keeping it short, today. 

Last week, we discussed monetary policy and the impact of quantitative tightening (QT) in the face of revisions in global growth expectations. You can check that out, here.

Graphic: Via Goldman Sachs Group Inc (NYSE: GS). Taken from The Market Ear. “GS has significantly lowered our 2022 global growth forecast in recent weeks. The chart shows global 2022 real GDP growth, % change.”

On the belief that the “Fed hiking cycle and balance sheet drain are now priced” as the market enters a seasonally favorable period, strategists like JPMorgan Chase & Co’s (NYSE: JPM) Marko Kolanovic favor risk in high-beta.

“While the commodity supercycle will persist,” Kolanovic said, “the correction in bubble sectors is now likely finished, and geopolitical risk will likely start abating in a few weeks’ time (while a comprehensive resolution may take a few months).”

Graphic: Via Callum Thomas. “April is historically the best month (highest average monthly gain and 74% of all Aprils in history were positive).”

Complicating Kolanovic’s outlook is uncertainty with respect to the Fed’s decision to hike and pare asset holdings as financial conditions tighten.

Graphic: Via Stenos Signals. “On top of already tight financial conditions, the spill-overs from a weakening credit cycle remain mostly unseen. If usual correlations hold, then a contracting credit cycle will lead long bond yields LOWER and not higher during H2-2022.”

In the coming weeks, the thesis that a de-rate (or pricing in of uncertainties) has played out will be put to the test as the Fed reveals its template for QT. Final plans are likely to be unveiled in an announcement at the beginning of May.

Damped Spring Advisors’ Andy Constan explains well his perspectives on what comes next in the below video. Check it out.

Positioning: The CBOE Volatility Index (INDEX: VIX), a measure of participants’ demand for protection, so to speak, appears to have hit a lower bound around 20.00. This is as the VIX term structure steepened, dramatically, over the last weeks, particularly at the front end of the curve.

Graphic: Via Vix Central.

After a long period during which options market participants concentrated their activity on bets on lower prices (negative delta trades that payout in case of movement lower), markets jolted higher as that protection was monetized (and decay ensued).

Alongside this collapse in implied volatility was speculative demand in index heavy-weights like Tesla Inc (NASDAQ: TSLA). Participants bought stock while selling puts (bets on the downside) and buying calls (bets on the upside).

Graphic: SpotGamma’s Hedging Impact of Real-Time Options (HIRO) indicator for TSLA as shown in our March 23, 2022 newsletter. The rising orange line denotes call buying. The rising blue line denotes put selling.

As this speculative demand cools, counterparties to these levered bets on the upside unwind their hedges and this has the effect of pressuring attempts higher.

According to SpotGamma, this is as, heading into this week’s expiration of quarterly options, there’s a “potential for more ‘pinning’ action as close-to-the-money bets concentrated in that expiry near the end of their lifecycle.” You can learn more about this, here.

Why? As time and volatility trend toward zero, the rate of change of options delta (gamma) of near-the-money options increases.

“This happens because the range of spot prices across which option deltas shift from near-zero to near-100% becomes very narrow as options approach maturity (and at maturity, options on one side of the settlement value have zero delta and the other side have 100% delta).”

With, at least at the index level, bets on lower volatility dominating (put and call selling), as the gamma of these near-the-money options increases, counterparties add liquidity, buying (selling) into weakness (strength) as positive delta exposure falls (rises).

Graphic: Analysis of book depth for the E-mini S&P 500 futures contract, via CME Group Inc’s (NASDAQ: CME) Liquidity Tool. For more on the implications of participants’ options positioning and dealer hedging, read here.

Moreover, the odds point to sideways trade, rather than a fast move higher or lower. 

However, after this expiry, it’s likely that the market succumbs to underlying forces. At present, despite the S&P 500 and its peers trading higher, underlying breadth is collapsing.

Graphic: Via Jefferies Financial Group Inc (NYSE: JEF). Taken from The Market Ear. “While the SPX is up over 8% since the lows, the equal-weight version of the index is down nearly 3% relative, its steepest relative decline so far this year. Typically, this would make us uneasy too, but the market narrowed considerably from June to Dec last year, so this might be attributable to a tech bounce from lows.”

Technical: As of 6:40 AM ET, Monday’s regular session (9:30 AM – 4:00 PM ET), in the S&P 500, will likely open in the upper part of a balanced overnight inventory, inside of prior-range and -value, suggesting a limited potential for immediate directional opportunity.

In the best case, the S&P 500 trades higher; activity above the $4,535.25 low volume area (LVNode) puts in play the $4,548.75 LVNode. Initiative trade beyond the $4,548.75 LVNode could reach as high as the $4,565.00 untested point of control (VPOC) and $4,585.00 regular trade high (RTH High), or higher.

In the worst case, the S&P 500 trades lower; activity below the $4,535.25 LVNode puts in play the $4,515.25 LVNode. Initiative trade beyond the $4,515.25 LVNode could reach as low as the $4,489.75 LVNode and $4,469.00 VPOC, or lower.

Click here to load today’s key levels into the web-based TradingView charting platform. Note that all levels are derived using the 65-minute timeframe. New links are produced, daily.
Graphic: 65-minute profile chart of the Micro E-mini S&P 500 Futures.

What People Are Saying

Definitions

Volume Areas: A structurally sound market will build on areas of high volume (HVNodes). Should the market trend for long periods of time, it will lack sound structure, identified as low volume areas (LVNodes). LVNodes denote directional conviction and ought to offer support on any test. 

If participants were to auction and find acceptance into areas of prior low volume (LVNodes), then future discovery ought to be volatile and quick as participants look to HVNodes for favorable entry or exit.

POCs: POCs are valuable as they denote areas where two-sided trade was most prevalent in a prior day session. Participants will respond to future tests of value as they offer favorable entry and exit.

Balance (Two-Timeframe Or Bracket): Rotational trade that denotes current prices offer favorable entry and exit. Balance areas make it easy to spot a change in the market (i.e., the transition from two-time frame trade, or balance, to one-time frame trade, or trend). 

About

After years of self-education, strategy development, mentorship, and trial-and-error, Renato Leonard Capelj began trading full-time and founded Physik Invest to detail his methods, research, and performance in the markets.

Capelj also develops insights around impactful options market dynamics at SpotGamma and is a Benzinga reporter.

Some of his works include conversations with ARK Invest’s Catherine Wood, investors Kevin O’Leary and John Chambers, FTX’s Sam Bankman-Fried, Kai Volatility’s Cem Karsan, The Ambrus Group’s Kris Sidial, among many others.

Disclaimer

In no way should the materials herein be construed as advice. Derivatives carry a substantial risk of loss. All content is for informational purposes only.

Categories
Commentary

Daily Brief For March 23, 2022

Editor’s Note: Hey team! Thanks for all the support. I enjoy putting together these notes as it helps keep me aware of narratives that may impact my own trades.

I’ll be taking the rest of the week off (i.e., no notes till Monday most likely), focusing on other areas of the business like prep for the weeks and months to come.

Take care and trade safe,

Renato

What Happened

Overnight, equity index futures auctioned sideways to lower while commodities, bonds, and implied volatility metrics were bid.

This is in the context of a global bond market rout. Central banks intend to tighten policy in light of surging inflation; investors are selling bonds and rotating into areas that have “better upside.”

Ahead is data on new home sales (10:00 AM ET). The Federal Reserve’s (Fed) Loretta Mester speaks at 10:00 AM ET. Mary Daly follows at 11:45 AM ET.

Moreover, yesterday’s commentary carried a pessimistic tone. In hindsight, too pessimistic. The reality is that this is a market environment like no other. Certain metrics that were very reliable carry little-to-no value (predictive ability) right now. This is true for those who base much of their decision-making on “fundamental” and “technical” analyses, too.

To combat this, we zoom out and look for trades that offer asymmetric payouts. We’re careful to provide liquidity when others demand it en masse. Similarly, we are to give ourselves room for error; stops are widened and lot sizes are smaller.

Read on for today’s lighter-hearted take on what’s happening and frameworks to trade on.

Graphic updated 6:30 AM ET. Sentiment Neutral if expected /ES open is inside of the prior day’s range. /ES levels are derived from the profile graphic at the bottom of the following section. Levels may have changed since initially quoted; click here for the latest levels. SqueezeMetrics Dark Pool Index (DIX) and Gamma (GEX) calculations are based on where the prior day’s reading falls with respect to the MAX and MIN of all occurrences available. A higher DIX is bullish. At the same time, the lower the GEX, the more (expected) volatility. Learn the implications of volatility, direction, and moneyness. SHIFT data used for S&P 500 (INDEX: SPX) options activity. Note that options flow is sorted by the call premium spent; if more positive, then more was spent on call options. Breadth reflects a reading of the prior day’s NYSE Advance/Decline indicator. VIX reflects a current reading of the CBOE Volatility Index (INDEX: VIX) from 0-100.

What To Expect

Fundamental: Bloomberg’s John Authers published a discussion on the performance of stocks, relative to bonds. Essentially, there have only been four previous two-week periods when stocks beat bonds by this much.

Graphic: Via Bloomberg. The 10-trading-day return of the SPDR S&P 500 ETF (NYSE: SPY) relative to the iShares 20 Plus Year Treasury Bond ETF (NASDAQ: TLT).

“All of the big positive moves were driven by classic stock market rebounds that proved to be durable. There was no particular move in bond yields. This is the first time a turn this dramatic has been pushed almost as much by falling bond prices as by rising stock prices.”

Graphic: Via Bloomberg. “The upper bound of the fed funds rate is still only 0.5%, but the two-year bond yield implies confidence that there are seven more hikes to come in that time.”

Authers explains that “equities are enjoying a false dawn as they’re recipients of the money coming out of bonds, and that we are about to be reacquainted with the bear markets in both bonds and stocks which come when rates [i.e., cost of money] have to rise to control inflation,” which impacts longer duration stocks (i.e., a stock whose value lies further in the future) most.

Graphic: Via Goldman Sachs Group Inc. Taken from The Market Ear

Adding, the impact of rising Treasury rates is magnified further when credit spreads (i.e., the difference in yield between bonds of similar maturities but different credit quality) also rise.

Graphic: Via Bloomberg. “But the speed with which corporate yields are rising again gives the impression of a market process that is coming around from an anaesthetic injected to help it survive the trauma of the credit crisis back in 2008.”

“The performance of stocks relative to bonds suggests we’re at the beginning of a big upswing; the absolute performance of bond yields in their own right suggests we need to bail out now before another crisis engulfs us,” Authers says.

Graphic: Via Goldman Sachs Group Inc (NYSE: GS). Taken from The Market Ear. “GS has lowered GDP a number of times over the past few weeks. Remember that during the fantastic bull from Q220 and 1 year onwards it was the flipside with GS way above consensus…”

Positioning: Dip buying serves investors well.

Graphic: Via Morgan Stanley (NYSE: MS). Taken from The Market Ear. “Buy the dip has worked well during periods of QE but has not historically worked during QT. Better to ‘buy the rally’ during QT (2018-2019), which was also the case during the 80s/90s.”

The near-vertical price rise in markets, over the last week, comes after a long period of weakness during which participants concentrated their activity in negative delta trades (which make money when markets trade lower, all else equal).

From a static delta perspective, now, there is both the covering of shorts and so-called macro buying (pointed to in the above section). 

From a dynamic delta perspective, there are the implications of volatility compression (e.g., Cboe Volatility Index [INDEX: VIX] and term structure dropping), the removal of put-heavy exposures via last week’s options expiration (OPEX), and the market’s trade higher.

Graphic: Via Deutsche Bank AG (NYSE: DB). Taken from The Market Ear. Volatility control is the concept of managing assets “through continual rebalancing between a risky asset holding – often, but not always, equity – and cash holdings,” via The Actuary.

Taken together (short covering, macro buying, volatility compression, OPEX, and so on), the aforementioned dynamics bolster markets. It is the dynamics of positioning (demand or supply of liquidity) that magnify (add to) the velocity of moves up (or down).

Graphic: Via Refinitiv. Taken from The Market Ear. “Poor liquidity (and short gamma) magnified moves on the way down. It seems poor liquidity works both ways seeing px action during the latest squeeze.”

Earlier this week, this newsletter pointed to the potential non-sustainability of the market’s rise. This was based on metrics that have provided tremendous predictive power, in the past. 

Participants’ commitment to positive delta exposure (i.e., buying calls and selling puts), is a feature of sustained reversals. Data through Tuesday did not show this at the index level. 

As discussed by SpotGamma, yesterday, in the S&P, participants bought puts and sold calls (i.e., a negative delta trade).

This was in the context of aggressive call buying and put selling in heavily weighted index constituents like Tesla Inc (NASDAQ: TSLA).

Graphic: SpotGamma’s Hedging Impact of Real-Time Options (HIRO) indicator for TSLA.

As stated in yesterday’s commentary, markets remain vulnerable to sharp drops. In the case of further volatility suppression (e.g., customer call and put selling), counterparties will tend toward supporting markets and laying the foundation for later-dated rallies.

However, if markets trade down and volatility rises, accordingly, as participants seek protection, the potential exists for magnified moves on the way down.

Straight up could well precede straight down. A bottom (as some strategists are calling for) may take time to hammer out.

Graphic: Via Vix Central.

Technical: As of 6:30 AM ET, Wednesday’s regular session (9:30 AM – 4:00 PM ET), in the S&P 500, will likely open in the lower part of a negatively skewed overnight inventory, inside of prior-range and -value, suggesting a limited potential for immediate directional opportunity.

In the best case, the S&P 500 trades higher; activity above the $4,489.75 low volume area (LVNode) puts in play the $4,515.25 LVNode. Initiative trade beyond the $4,515.25 LVNode could reach as high as the $4,548.75 LVNode and $4,565.00 untested point of control (VPOC), or higher.

In the worst case, the S&P 500 trades lower; activity below the $4,489.75 LVNode puts in play the $4,464.75 LVNode. Initiative trade beyond the $4,464.75 LVNode could reach as low as the $4,438.25 high volume area (HVNode) and $4,409.00 VPOC, or lower.

Considerations: Push-and-pull, as well as responsiveness near key-technical areas (that are discernable visually on a chart), suggests technically-driven traders with short time horizons are very active. 

Such traders often lack the wherewithal to defend retests and, additionally, the type of trade may be indicative of the other time frame participants waiting for more information to initiate trades.

Click here to load today’s key levels into the web-based TradingView charting platform. Note that all levels are derived using the 65-minute timeframe. New links are produced, daily.
Graphic: 65-minute profile chart of the Micro E-mini S&P 500 Futures.

Definitions

Volume Areas: A structurally sound market will build on areas of high volume (HVNodes). Should the market trend for long periods of time, it will lack sound structure, identified as low volume areas (LVNodes). LVNodes denote directional conviction and ought to offer support on any test. 

If participants were to auction and find acceptance into areas of prior low volume (LVNodes), then future discovery ought to be volatile and quick as participants look to HVNodes for favorable entry or exit.

POCs: POCs are valuable as they denote areas where two-sided trade was most prevalent in a prior day session. Participants will respond to future tests of value as they offer favorable entry and exit.

About

After years of self-education, strategy development, mentorship, and trial-and-error, Renato Leonard Capelj began trading full-time and founded Physik Invest to detail his methods, research, and performance in the markets.

Capelj also develops insights around impactful options market dynamics at SpotGamma and is a Benzinga reporter.

Some of his works include conversations with ARK Invest’s Catherine Wood, investors Kevin O’Leary and John Chambers, FTX’s Sam Bankman-Fried, Kai Volatility’s Cem Karsan, The Ambrus Group’s Kris Sidial, among many others.

Disclaimer

In no way should the materials herein be construed as advice. Derivatives carry a substantial risk of loss. All content is for informational purposes only.

Categories
Commentary

Daily Brief For March 22, 2022

Editor’s Note: The Daily Brief is a free glimpse into the prevailing fundamental and technical drivers of U.S. equity market products. Join the 200+ that read this report daily, below!

What Happened

Overnight, equity index futures were sideways to higher, and this validates higher prices, more. 

This is as implied volatility metrics – such as the Cboe Volatility Index (INDEX: VIX) – continue to suggest less demand for protection and a potential easing of concern.

As discussed in detail, yesterday, participants are not committing themselves to increased call option (i.e., insurance for shorts or bets on the upside) exposures, a dynamic usually seen at the start of sustained reversals. 

Given this, as well as institutional selling in spite of underinvestment (watch a chat), and the Federal Reserve’s (Fed) commitment to reining in inflation via “aggressive” monetary policy (i.e., hike and taper asset purchases) action, there is concern over the sustainability of this rally.

Ahead is Fed-speak. The New York Fed’s John Williams speaks at 10:35 AM ET. San Francisco Fed’s Mary Daly talks at 2:00 PM ET. The Cleveland Fed’s Loretta Mester talks at 5:00 PM ET.

Graphic updated 6:30 AM ET. Sentiment Neutral if expected /ES open is inside of the prior day’s range. /ES levels are derived from the profile graphic at the bottom of the following section. Levels may have changed since initially quoted; click here for the latest levels. SqueezeMetrics Dark Pool Index (DIX) and Gamma (GEX) calculations are based on where the prior day’s reading falls with respect to the MAX and MIN of all occurrences available. A higher DIX is bullish. At the same time, the lower the GEX, the more (expected) volatility. Learn the implications of volatility, direction, and moneyness. SHIFT data used for S&P 500 (INDEX: SPX) options activity. Note that options flow is sorted by the call premium spent; if more positive, then more was spent on call options. Breadth reflects a reading of the prior day’s NYSE Advance/Decline indicator. VIX reflects a current reading of the CBOE Volatility Index (INDEX: VIX) from 0-100.

What To Expect

Fundamental: Based on remarks by the Fed’s Jerome Powell, quantitative tightening (QT) will move at a pace of $1 trillion a year. This is a faster pace than that of the prior QT.

Read yesterday’s commentary for more on QE and QT.

According to Joseph Wang’s detailed discussion on the implications of QT, the “[a]nticipation of QT is already widening the spread between Agency MBS and Treasuries but does not yet appear to affect Treasury prices.”

“The supply and demand dynamics suggest that the market may simply be slow to react. In that case, Treasury prices will also have to adjust downward, maybe by a lot.”

Pursuant to that remark, Damped Spring’s Andy Constan explains that quantitative easing (QE), “which decreased risk premiums and increased wealth was inflationary to assets but ineffective in generating inflation of goods and services.”

Essentially, QT is not a good tool to fight inflation.

“Raising rates is the strong tool to fight inflation for the Fed and decreasing the budget deficit growth is the tool for Fiscal policymakers; … the [Fed] will do both QT to reduce the balance sheet and hike rates to fight inflation.”

Moreover, higher bond yields (lower bond prices) are usually not good for stocks. The question is whether participants want to take on the added risk of investing at high valuations?

Graphic: Via S&P Global Inc (NYSE: SPGI). Markets tend not, necessarily, to perform poorly during rising interest rate environments. 

The QT narrative amplifies the impact of rate hikes

Lisa Shalett, CIO at Morgan Stanley (NYSE: MS) Wealth Management, discussed recently QT at $80 billion per month (and $500 billion in balance sheet reduction through year-end), as well as how the added risks are to be compensated through lower price-to-earnings multiples in the stock market.

“In tightening terms, that’s the equivalent of another 25-basis-point hike,” Shalett explained. “In contrast, balance sheet run-off totaled $700 billion from 2017 through 2019 before the Fed stopped because markets seized and stocks sold off.”

Graphic: Via Index Indicators. Breadth, here, is measured by the % of SPX stocks above the 50-day average.

Positioning: As discussed before, a feature of falling markets is the demand for protection. 

When this protection is monetized (or decay ensues), options counterparties add to the market liquidity (i.e., buying back short futures hedges).

Graphic: Via CME Group Inc (NYSE: CME). Book depth thickens since early March swing low.

A feature of markets entering a sustainable recovery is the demand for call options.

Based on metrics published by SpotGamma, call-buying was near its lows.

Graphic: Via SpotGamma. “Plots show the premium per trade aggregated each week, with calls in blue and puts in orange. This is only customer flow (i.e. retail, hedge funds). Starting with equities, call buying this past week was at LOWS going back to 2020 (top right).”

Looking at intraday measures, yesterday, we see that participants’ commitment to a change in direction remains low, still.

Graphic: SpotGamma’s Hedging Impact of Real-Time Options trade. The rising blue line denotes put selling (a positive delta impact). The falling orange line denotes call selling (a negative delta impact).

It’s possible that the bottoming process has yet to conclude. Instead, a build of positive options gamma (via the supply of protection – call selling – and more active hedging of call options near the money) may give the market some support.

To explain, in accordance with the HIRO graphic above, we surmise counterparties are long calls and therefore tend toward selling into strength (buying into weakness) amid increasing (decreasing) positive delta exposure.

As short-dated activity clusters in the area just north of the most recent price rise, and this protection decays, dealer exposure to positive delta (gamma) falls (rises).”

“Taken together, dealers add to the market liquidity. When there is rising liquidity, volatility (a measure of how ample liquidity is) falls,” SpotGamma adds. 

“Was the SPX to liquidate, again, demand for protection and increases in volatility likely have us targeting options-based support.”

Graphic: Via SpotGamma. Key levels of interest.

In other words, based on the information we have at the moment, the market is prone to sharp drops lower, and the rally is questionable. Caution.

Technical: As of 6:30 AM ET, Tuesday’s regular session (9:30 AM – 4:00 PM ET), in the S&P 500, will likely open in the upper part of a positively skewed overnight inventory, inside of prior-range and -value, suggesting a limited potential for immediate directional opportunity.

In the best case, the S&P 500 trades higher; activity above the $4,464.75 low volume area (LVNode) puts in play the $4,499.00 untested point of control (VPOC). Initiative trade beyond the VPOC could reach as high as the $4,526.25 high volume area (HVNode) and $4,565.00 VPOC, or higher.

In the worst case, the S&P 500 trades lower; activity below the $4,464.75 LVNode puts in play the $4,438.25 HVNode. Initiative trade beyond the HVNode could reach as low as the $4,409.00 and $4,355.00 VPOC, or lower.

Considerations: Push-and-pull, as well as responsiveness near key-technical areas (that are discernable visually on a chart), suggests technically-driven traders with short time horizons are very active. 

Such traders often lack the wherewithal to defend retests and, additionally, the type of trade may be indicative of the other time frame participants waiting for more information to initiate trades.

Click here to load today’s key levels into the web-based TradingView charting platform. Note that all levels are derived using the 65-minute timeframe. New links are produced, daily.
Graphic: 65-minute profile chart of the Micro E-mini S&P 500 Futures.

Definitions

Cave-Fill Process: Widened the area deemed favorable to transact at by an increased share of participants. This is a good development.

Volume Areas: A structurally sound market will build on areas of high volume (HVNodes). Should the market trend for long periods of time, it will lack sound structure, identified as low volume areas (LVNodes). LVNodes denote directional conviction and ought to offer support on any test. 

If participants were to auction and find acceptance into areas of prior low volume (LVNodes), then future discovery ought to be volatile and quick as participants look to HVNodes for favorable entry or exit.

Liquidation Breaks: The profile shape suggests participants were “too” long and had poor location.

POCs: POCs are valuable as they denote areas where two-sided trade was most prevalent in a prior day session. Participants will respond to future tests of value as they offer favorable entry and exit.

Excess: A proper end to price discovery; the market travels too far while advertising prices. Responsive, other-timeframe (OTF) participants aggressively enter the market, leaving tails or gaps which denote unfair prices.

About

After years of self-education, strategy development, mentorship, and trial-and-error, Renato Leonard Capelj began trading full-time and founded Physik Invest to detail his methods, research, and performance in the markets.

Capelj also develops insights around impactful options market dynamics at SpotGamma and is a Benzinga reporter.

Some of his works include conversations with ARK Invest’s Catherine Wood, investors Kevin O’Leary and John Chambers, FTX’s Sam Bankman-Fried, Kai Volatility’s Cem Karsan, The Ambrus Group’s Kris Sidial, among many others.

Disclaimer

In no way should the materials herein be construed as advice. Derivatives carry a substantial risk of loss. All content is for informational purposes only.

Categories
Commentary

Daily Brief For January 26, 2022

Editor’s Note: Our newsletter service provider is not working, today. Our apologies if you were not able to receive the note via email, as usual.

What Happened

Overnight, equity index futures auctioned sideways to higher as some metrics show investors bought the dip, aggressively, after Monday’s liquidation. 

At the same time measures of implied volatility compressed and the flows associated with that, too, are supporting the recovery.

Still “a rising interest rate environment [which] is leading to a revaluation,” is a key concern, and investors will be looking for clarity on monetary policy from the Federal Open Market Committee, today, after 2:00 PM ET

Other data to be released today include trade in goods (8:30 AM ET) and new home sales (10:00 AM ET).

Graphic updated 6:00 AM ET. Sentiment Neutral if expected /ES open is inside of the prior day’s range. /ES levels are derived from the profile graphic at the bottom of the following section. Levels may have changed since initially quoted; click here for the latest levels. SqueezeMetrics Dark Pool Index (DIX) and Gamma (GEX) calculations are based on where the prior day’s reading falls with respect to the MAX and MIN of all occurrences available. A higher DIX is bullish. At the same time, the lower the GEX, the more (expected) volatility. Learn the implications of volatility, direction, and moneyness. SHIFT data used for S&P 500 (INDEX: SPX) options activity. Note that options flow is sorted by the call premium spent; if more positive, then more was spent on call options. Breadth reflects a reading of the prior day’s NYSE Advance/Decline indicator. VIX reflects a current reading of the CBOE Volatility Index (INDEX: VIX) from 0-100.

What To Expect

Fundamental: As Bloomberg’s John Authers puts it well, drops in the market may make it more difficult to raise capital and this can tighten financial conditions.

“This leads to the hope that the stock market has already done some of the Fed’s job, so there will be less need for higher fed funds rates — and also that the Fed might have to act at some point if the stock market fall tightens conditions too much.”

Graphic: The “annual rate of change in the Fed Funds rate” via topdowncharts.com.

Though this most recent liquidation tightened financial conditions, it is not likely that the Federal Reserve (Fed) will change its tone amidst heightened inflation, among other things.

Graphic: Per Bloomberg, “there is quite a long way to go before the Fed would feel any great need to come to their rescue.”

In fact, according to Nordea Bank’s (OTC: NRDBY) research arm, though there are lower odds of a much “faster tapering,” the Fed is to continue “building towards a March hike.” 

Flexibility in policy, as well as a potential dismissal of a 50 basis point hike given geopolitical tensions, some poor responses to earnings results, and disappointments in real demand and growth, “could make for a brief market relief.”

Graphic: @MacroAlf plots credit impulse as a percent of GDP and SPX year-over-year earnings.

“Our forecast includes four hikes for the year, which is consistent with current market pricing,” Nordea adds on in a statement on the Fed not hiking by more than 25 basis points since the early 2000s. “In our view balances are tilted towards balance sheet tightening rather than adding a fifth or sixth hike this year.”

Graphic: Nordea says that “short-end pricing could take a break in the short-term.”

In the end, though, monetary frameworks and max liquidity promoted a divergence in price from fundamentals. Expected monetary policy evolution will make valuations much less justifiable. 

“The mechanical impact of QT should result in less liquidity and more net issuance thereby rising rates, but the empirical story, supported by growth prospects, [] is different,” Nordea says. 

Still, an “abundance of excess liquidity could provide a cushion as the Fed drains liquidity, a cushion that did not exist in 2018.”

Graphic: Per Bloomberg, “As Savita Subramanian of Bank of America Corporation (NYSE: BAC) shows in the following chart, expected earnings are far less helpful in explaining market outcomes since 2010 than they were before. Meanwhile, changes in the Fed’s balance sheet, the amount of money it’s making available to markets, have become hugely important.”

Perspectives: Matt Maley of Miller Tabak + Co. suggests “the amount of leverage that built up over the past several years will take longer to unwind,” and “we’ve moved into a period where investors should sell the rallies rather than buy the dips.”

This is somewhat in opposition to JPMorgan Chase & Co’s (NYSE: JPM) Mark Kolanovic statements that “worries around rates and corporate margins are overdone,” and “the earnings season [will] reassure, and in a worst-case scenario could see a return of the ‘Fed put.’”

When examining extraordinary actions by the Fed, “the average ‘exercise price’ is a -23.8% peak to trough (equating currently to SPX 3,670.00),” Evercore Inc (NYSE: EVR) adds.

“The Fed is likely to ‘exercise the Fed put’ should the average -23.8% strike price come into view.”

Positioning: A lower liquidity, short-gamma environment (wherein an options delta falls with stock price rises and rises when stock prices fall) has led to more erratic moves, as a result of counterparty hedging activities.

Graphic: Analysis of book depth for the E-mini S&P 500 futures contract, via CME Group Inc’s (NASDAQ: CME) Liquidity Tool. For more on the implications of participants’ options positioning and dealer hedging, read here.

The removal of put-heavy exposure, post-monthly options expiration (OPEX), and a reduction in embedded event premiums tied to the approaching FOMC, opens up a window of strength, wherein dealers have less positive delta exposure to sell against.

In other words, as measures of implied volatility compress, as is the case when there is less demand for downside put protection (a positive-delta trade for the dealers), the dealer’s exposure to positive delta declines.

Graphic: VIX term structure compresses.

All else equal, this solicits dealer buying of the underlying (a reduction of short-delta hedges).

Graphic: SqueezeMetrics details the implications of customer activity in the options market, on the underlying’s order book. For instance, in selling a put, customers add liquidity and stabilize the market. How? The market maker long the put will buy (sell) the underlying to neutralize directional risk as price falls (rises).

Taking into account options positioning, versus buying pressure (measured via short sales or liquidity provision on the market-making side), metrics are positively skewed, much more than yesterday. Tuesday the tone changed and the dip was bought.

Graphic: Data SqueezeMetrics. Graph via Physik Invest.

Technical: As of 6:00 AM ET, Wednesday’s regular session (9:30 AM – 4:00 PM ET), in the S&P 500, will likely open in the upper part of a positively skewed overnight inventory, just inside of prior-range and -value, suggesting a limited potential for immediate directional opportunity.

Gap Scenarios In Play (Potentially): Gaps ought to fill quickly. Should they not, that’s a signal of strength; do not fade. Leaving value behind on a gap-fill or failing to fill a gap (i.e., remaining outside of the prior session’s range) is a go-with indicator.

Auctioning and spending at least 1-hour of trade back in the prior range suggests a lack of conviction; in such a case, do not follow the direction of the most recent initiative activity.

In the best case, the S&P 500 trades higher; activity above the $4,411.75 regular trade high (RTH High) puts in play the $4,449.00 untested point of control (VPOC). Initiative trade beyond the VPOC could reach as high as the $4,486.76 RTH High and $4,526.25 high volume area (HVNode), or higher.

In the worst case, the S&P 500 trades lower; activity below the $4,411.75 RTH High puts in play the $4,346.75 HVNode. Initiative trade beyond the HVNode could reach as low as the $4,276.50 and $4,212.50 RTH Low, or lower.

Click here to load today’s key levels into the web-based TradingView charting platform. Note that all levels are derived using the 65-minute timeframe. New links are produced, daily.
Graphic: 65-minute profile chart of the Micro E-mini S&P 500 Futures.

What People Are Saying

Definitions

Volume Areas: A structurally sound market will build on areas of high volume (HVNodes). Should the market trend for long periods of time, it will lack sound structure, identified as low volume areas (LVNodes). LVNodes denote directional conviction and ought to offer support on any test. 

If participants were to auction and find acceptance into areas of prior low volume (LVNodes), then future discovery ought to be volatile and quick as participants look to HVNodes for favorable entry or exit.

Gamma: Gamma is the sensitivity of an option to changes in the underlying price. Dealers that take the other side of options trades hedge their exposure to risk by buying and selling the underlying. When dealers are short-gamma, they hedge by buying into strength and selling into weakness. When dealers are long-gamma, they hedge by selling into strength and buying into weakness. The former exacerbates volatility. The latter calms volatility.

Vanna: The rate at which the delta of an option changes with respect to volatility.

POCs: POCs are valuable as they denote areas where two-sided trade was most prevalent in a prior day session. Participants will respond to future tests of value as they offer favorable entry and exit.

Options Expiration (OPEX): Traditionally, option expiries mark an end to pinning (i.e, the theory that market makers and institutions short options move stocks to the point where the greatest dollar value of contracts will expire) and the reduction dealer gamma exposure.

About

After years of self-education, strategy development, mentorship, and trial-and-error, Renato Leonard Capelj began trading full-time and founded Physik Invest to detail his methods, research, and performance in the markets.

Capelj is also a Benzinga finance and technology reporter interviewing the likes of Shark Tank’s Kevin O’Leary, JC2 Ventures’ John Chambers, FTX’s Sam Bankman-Fried, and ARK Invest’s Catherine Wood, as well as a SpotGamma contributor developing insights around impactful options market dynamics.

Disclaimer

Physik Invest does not carry the right to provide advice.

In no way should the materials herein be construed as advice. Derivatives carry a substantial risk of loss. All content is for informational purposes only.