Categories
Commentary

Daily Brief For April 6, 2023

LOAD LEVELS ON TRADINGVIEW BY CLICKING HERE.

Administrative Bulletin

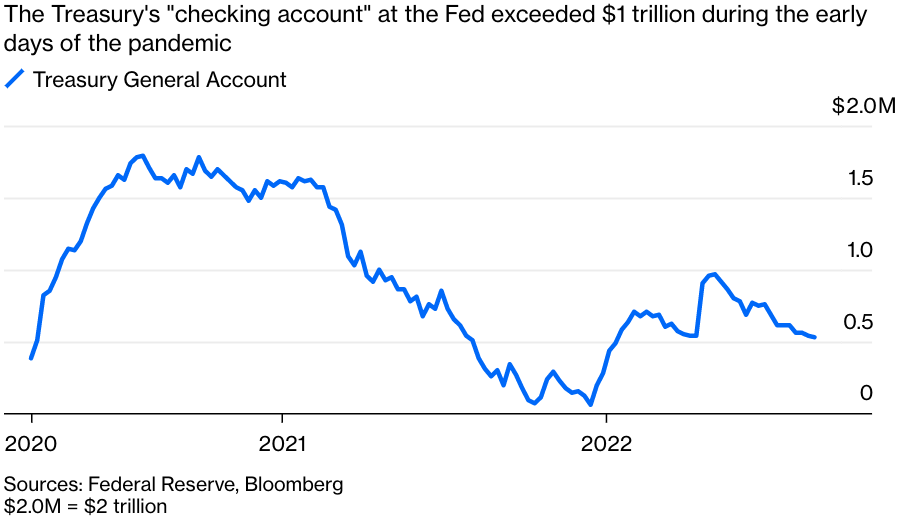
Welcome to the Daily Brief by Physik Invest, a soon-to-launch research, consulting, trading, and asset management solutions provider. Learn about our origin story here, and consider subscribing for daily updates on the critical contexts that could lend to future market movement.

Tomorrow’s Good Friday, and some markets, including the US’s equity market, will be closed. The Treasury market will remain open, albeit for less time, and may enable traders to price the impacts of coming releases, including non-farm payrolls (NFP). The consensus is that the US added 235,000 jobs in March, with the unemployment rate expected to remain steady at 3.50%. Higher for longer, then? We shall see.

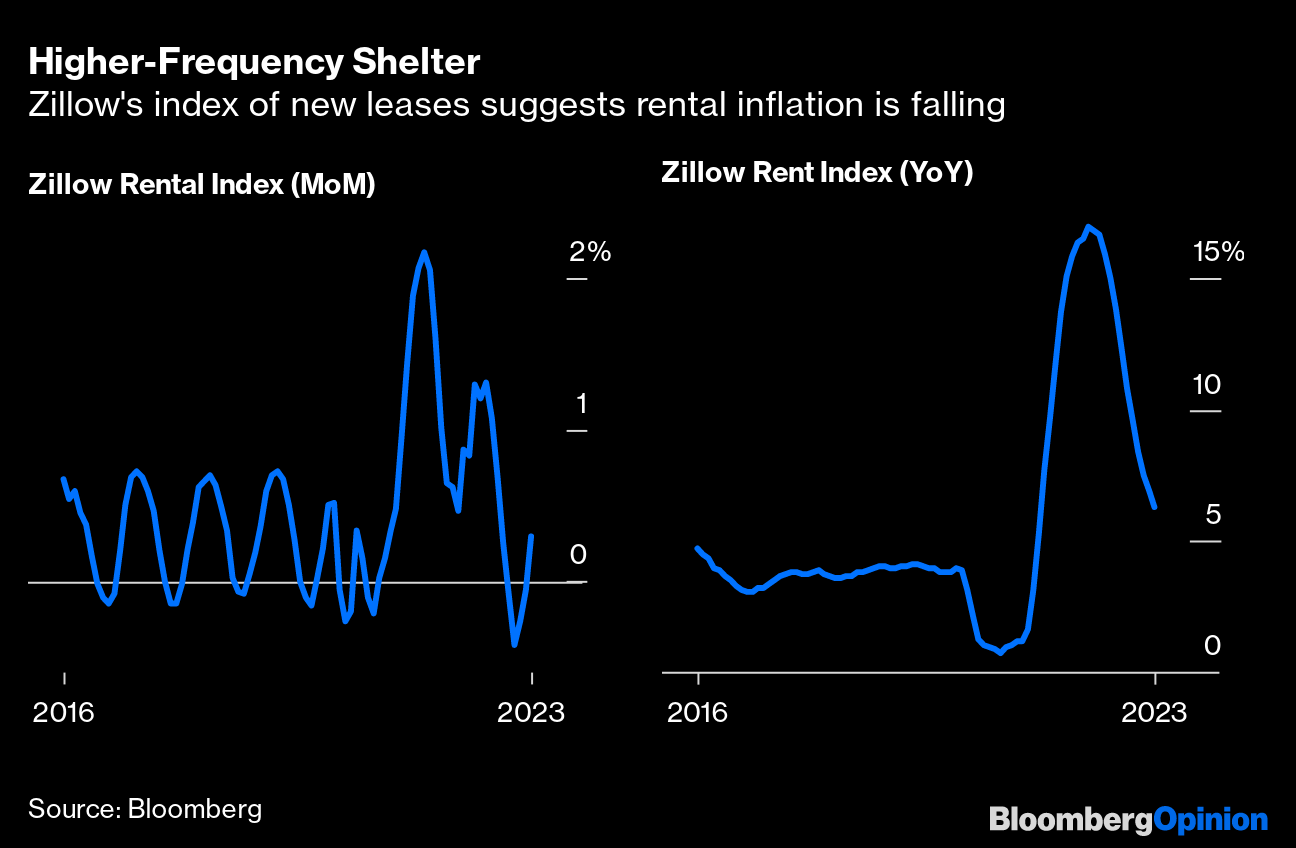
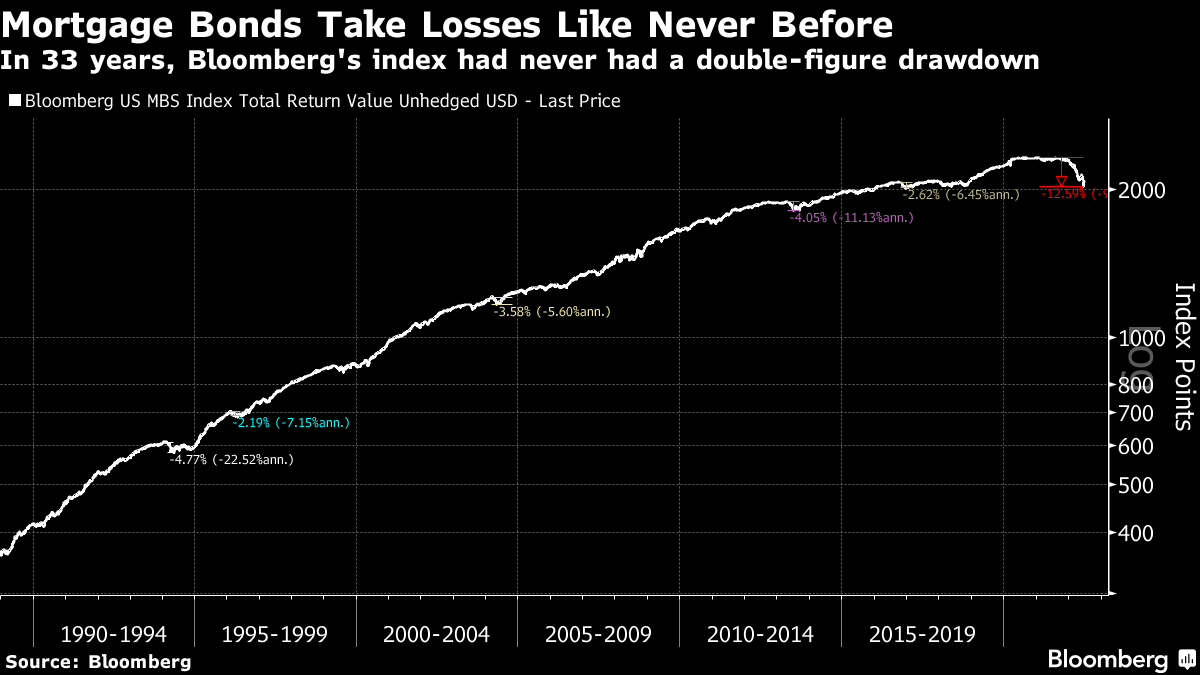
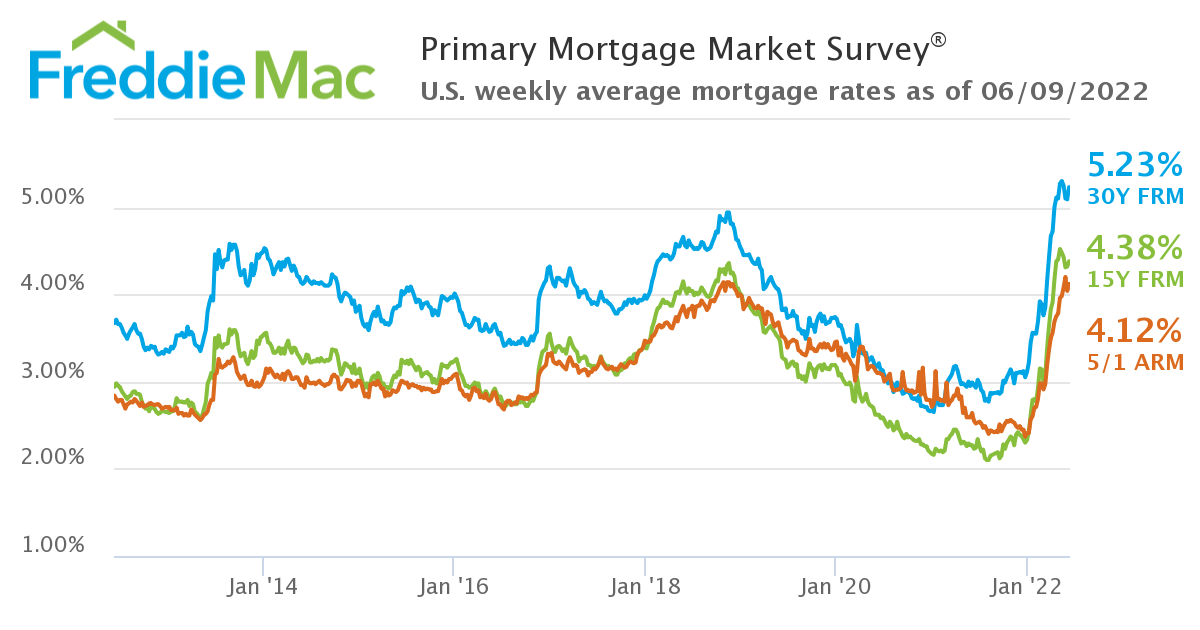
Moreover, the big news is that the trend in mortgage rates, followed closely in the US, continues to be down. US 30-year fixed mortgage rates fell for a fourth-straight week, though applications to buy and refinance a home declined for the first time in a month. However, borrowing costs remain generally high and housing inventory low, keeping a cap on homebuying activity. 

Notwithstanding, as explained by Akash Kanojia, for the housing market to “clear” on today’s affordability, home prices need to fall by about 20.00%. 

READ: HOW MUCH HOME PRICES MAY FALL

To explain, typically, banks use a debt-to-income ratio to determine how much they will lend to a borrower to buy a house. Adding, they could enforce a limit of 80% on the purchase price of the house, and the remaining 20.00% is paid in cash by the borrower as a down payment.

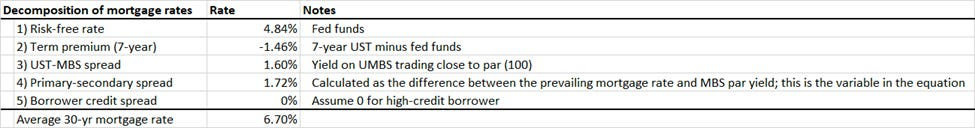
Mortgage rates comprise the short-term risk-free rate, term premium, the Treasury-MBS spread, the primary-secondary spread, and a credit spread based on the borrower’s creditworthiness. Any of these numbers changing can influence a borrower’s final payment to the lender. 

Graphic: Retrieved from Negative Convexity.

An analysis starting with a home price in 2021 of $575,000.00 and a borrower whose income was $92,000.00, and adjusting all for inflation and movements in rates, the decrease in home values to boost affordability is 21.00%.

Graphic: Retrieved from Negative Convexity. “To do this analysis, I started with a home price in April 2021[1]($575,000) and figured out how much annual income a borrower would have needed at that time to buy the house (~$92,000). I then adjusted the annual income up by 8% for 2023, extrapolating from this, resulting in a person that would have earned ~$92,000 earning $99,205 today. Then I calculated how much house a person earning $99,205 can afford today at a mortgage rate of 6.70% ($452,000). Divide the two, and you get a decrease of 21%.”

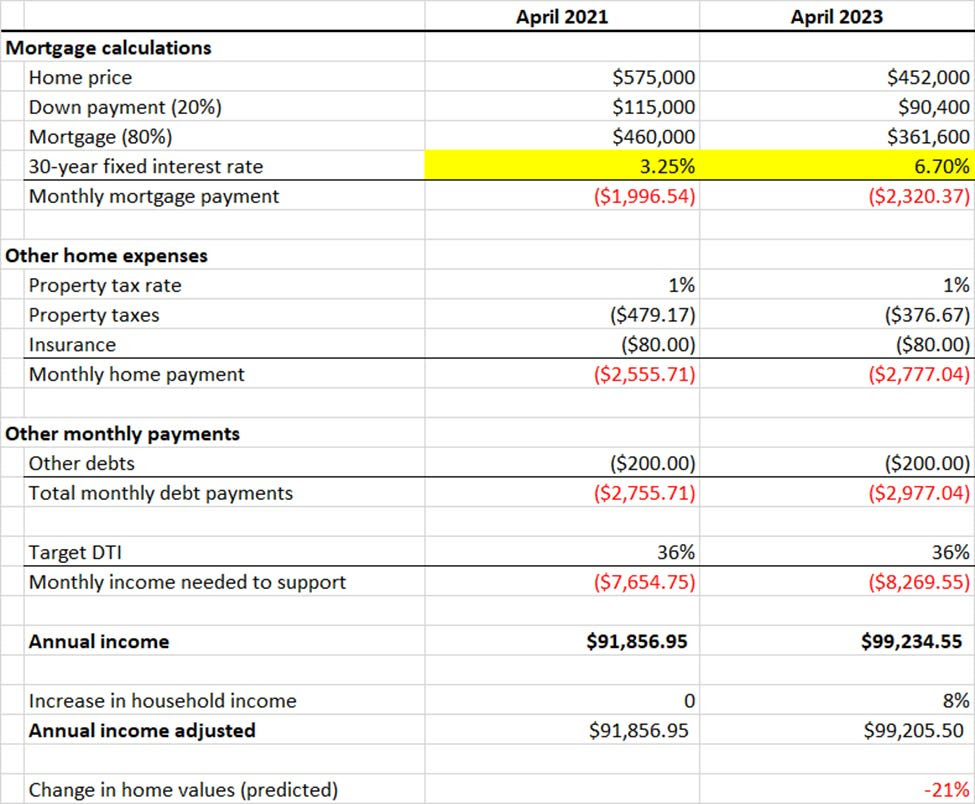
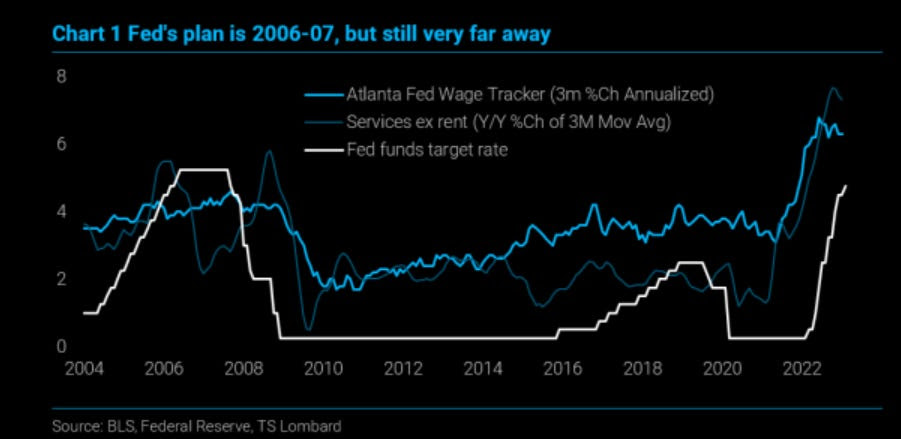
A worst-case scenario is that the fed funds rate rises further to quell inflation. If the fed funds rate were to rise to 6.00-6.25%, matching the latest annualized CPI print, and “the market realizes the Fed is not going to cut, and the curve (e.g., 3m-7y UST) steepens to historical norms (~150 basis points long-term average), barring changes in the MBS spread, primary-secondary spread, and credit charges, this produces a ~40.00% decline in home prices.

Graphic: Retrieved from Negative Convexity.

Consequently, as the economy slows and layoffs increase, as we’re starting to see, it will negatively affect housing demand and affordability due to income stability and growth. On the bright side, inflation destroys the nominal value of debt, Kanojia says. Assuming wages keep up, buyers in hot markets may be spared if they can withhold from selling at market-clearing prices, Kanojia ends.

On a note about the doom and gloom (i.e., economy slowing and layoffs increasing, as well as yield curve steepening), JPMorgan Chase & Co’s (NYSE: JPM) Jamie Dimon says the following: 

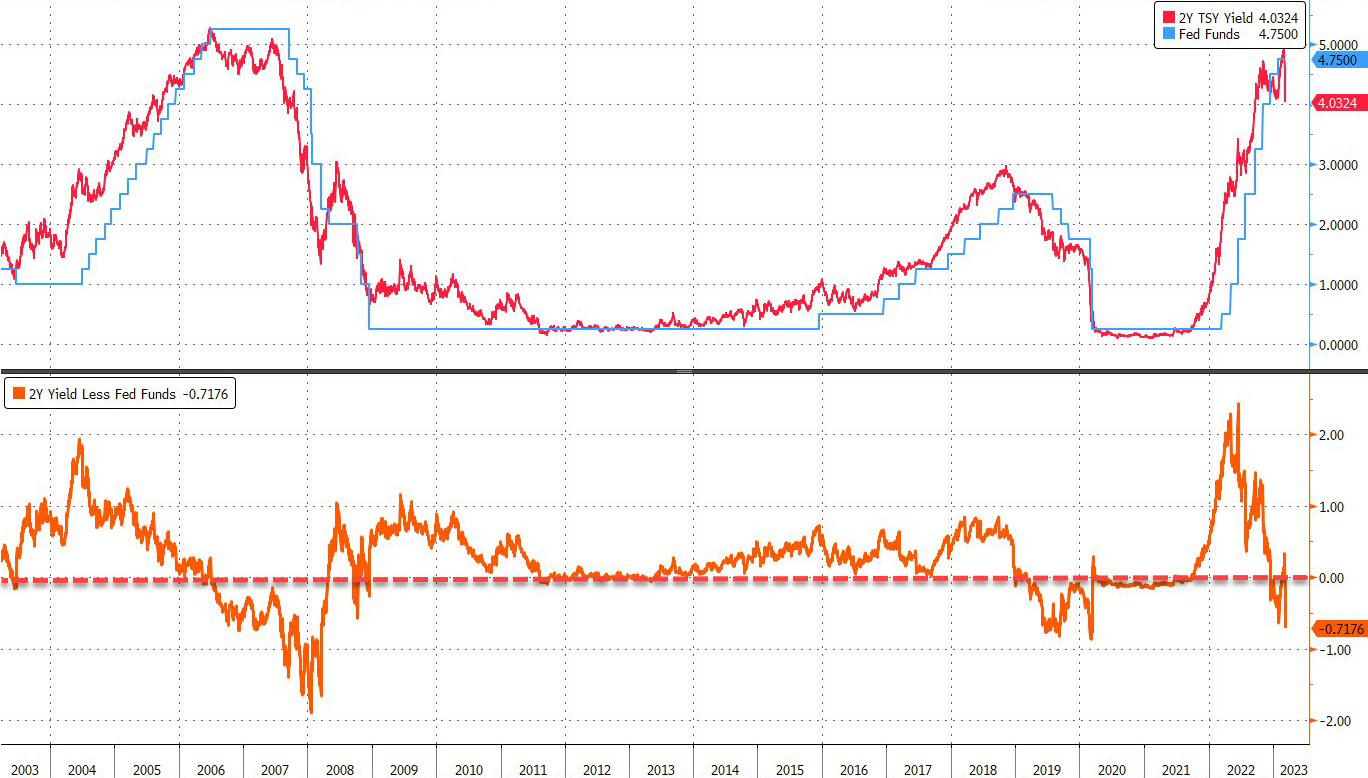
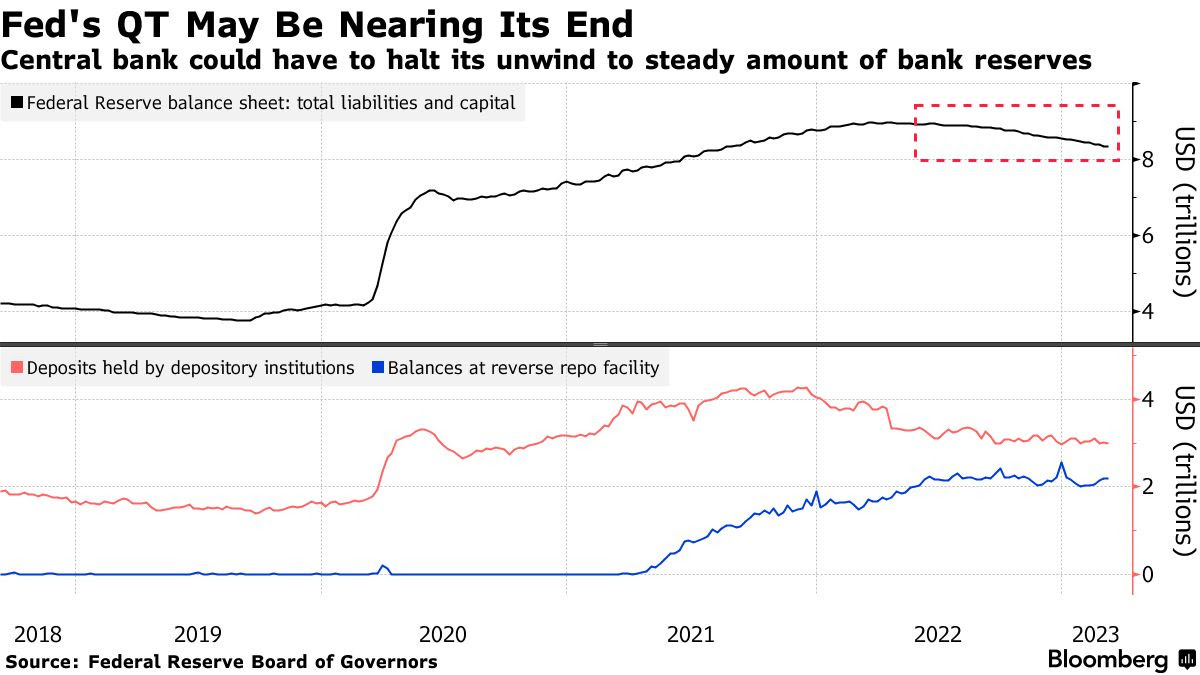
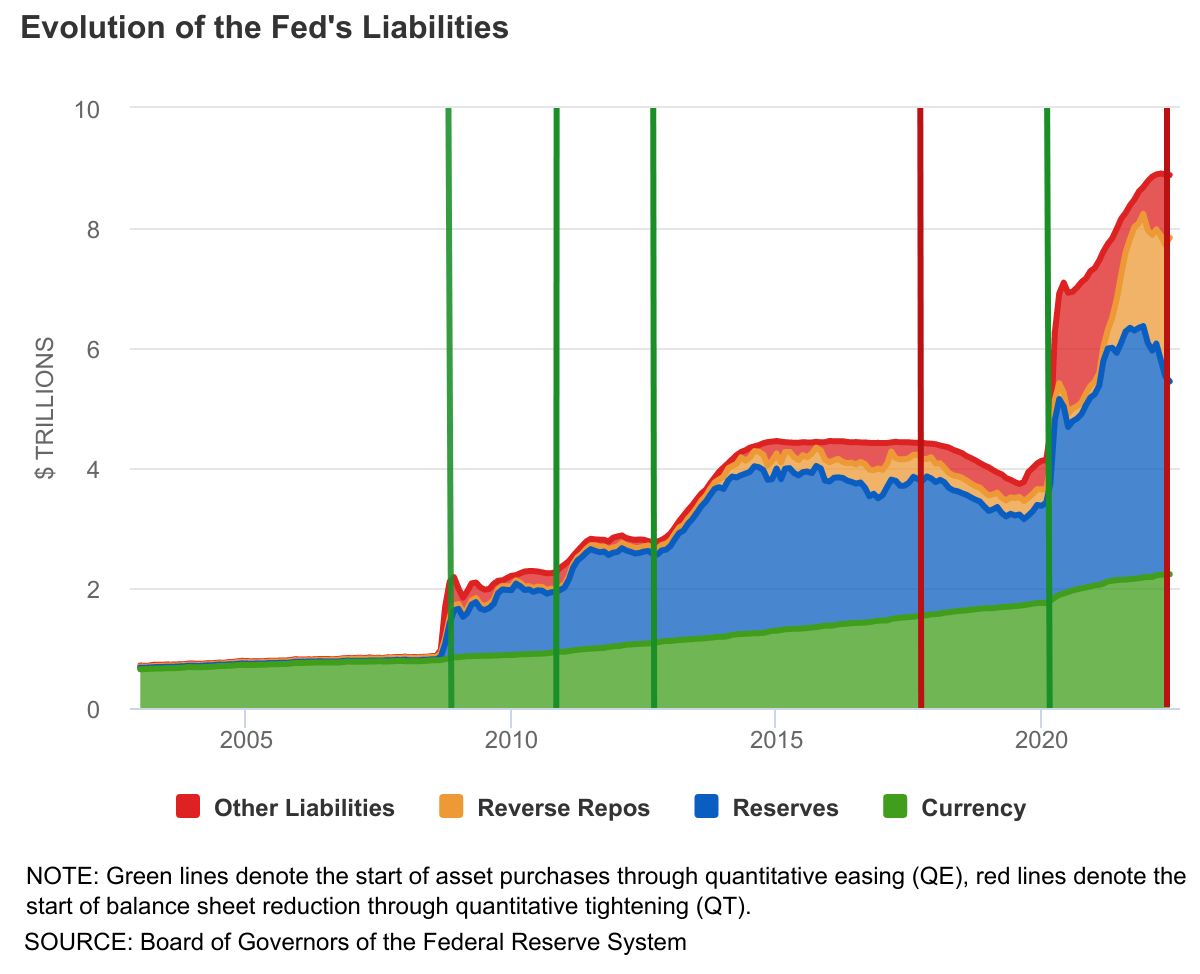
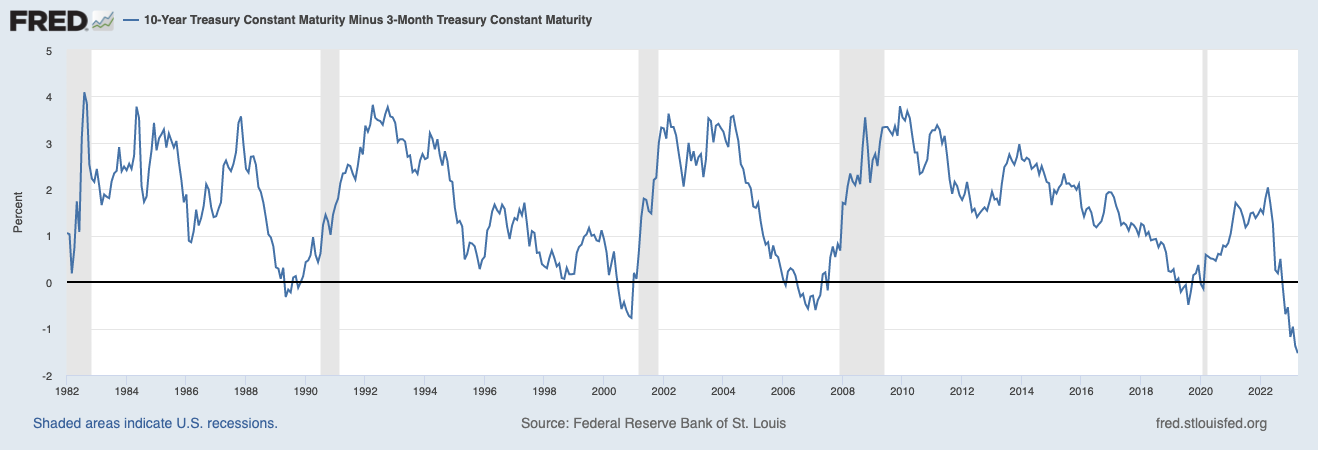
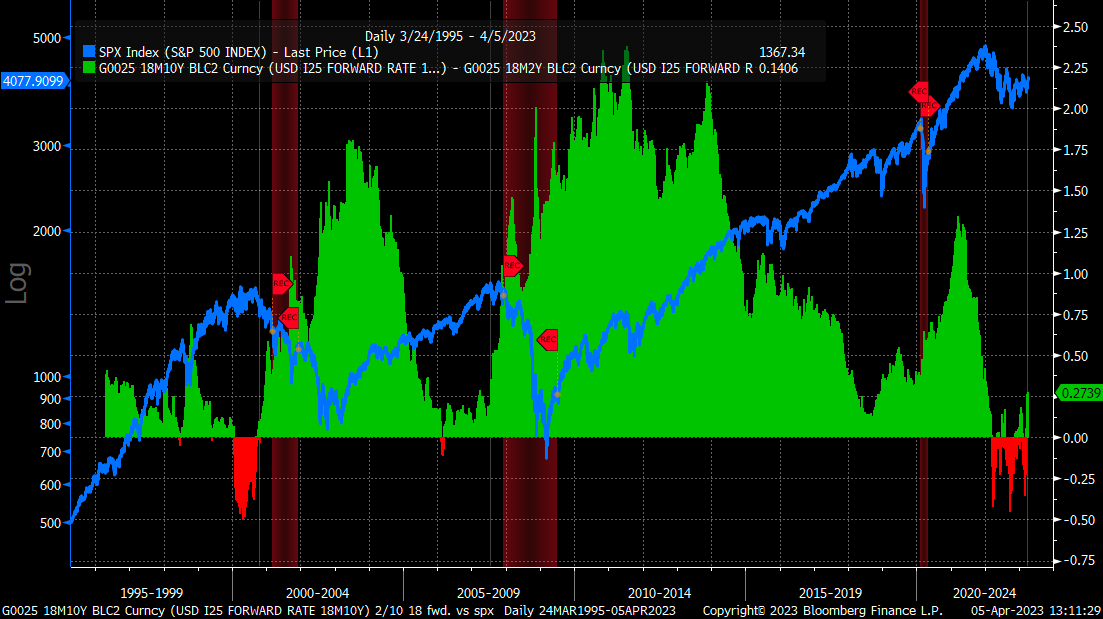
Today’s inverted yield curve implies that we are going into a recession. As someone once said, an inverted yield curve like this is ‘eight for eight’ in predicting a recession in the next 12 months. However, it may not be true this time because of the enormous effect of QT. As previously stated, longer-term rates are not necessarily controlled by central banks, and it is possible that the inversion we see today is still driven by prior QE and not the dramatic change in supply and demand that is going to take place in the future.

Dimon, the CEO of JPM, says that a graph showing the yields on bonds of different maturities is inverted, meaning that the yields on shorter-term bonds are higher than the yields on longer-term bonds. An inverted yield curve has often been a reliable indicator of an upcoming recession; it reflects investor demands for higher returns on short-term investments and expectations that short-term rates will fall in the future, which happens when the central bank cuts rates in response to a weak economy.

In other words, the conditions around the yield curve inversion are different this time.

Graphic: Retrieved from the Federal Reserve Bank of St. Louis. A normal yield curve is upward-sloping, meaning long-term interest rates are higher than short-term rates; investors demand a higher return for tying up their money for a longer period; the spread between the 10-year and 3-month treasury yield is positive. 

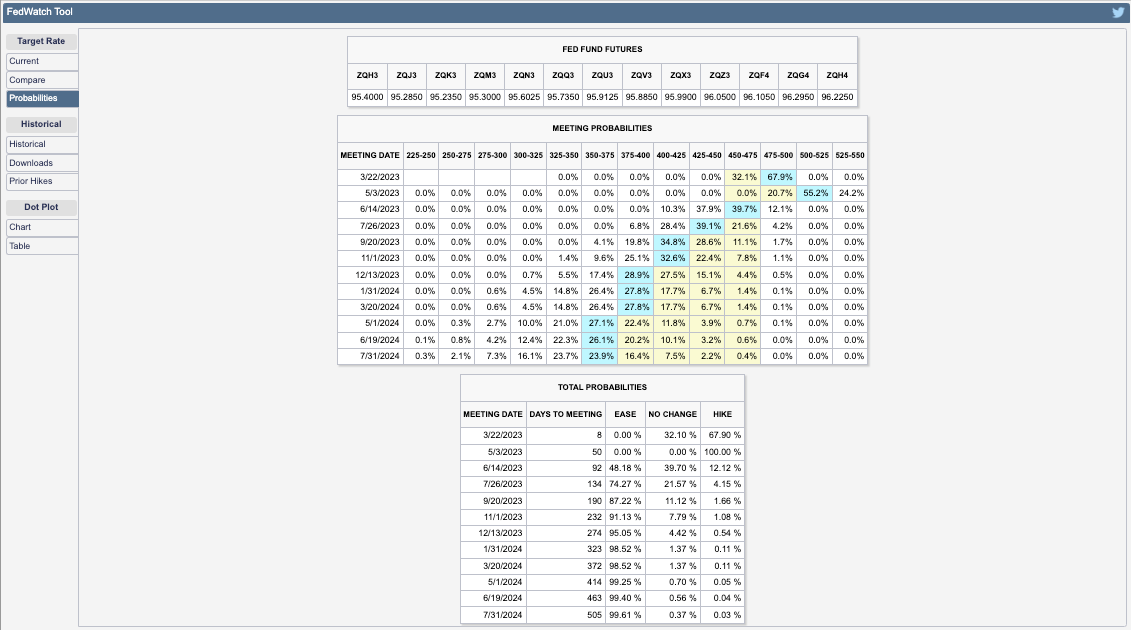
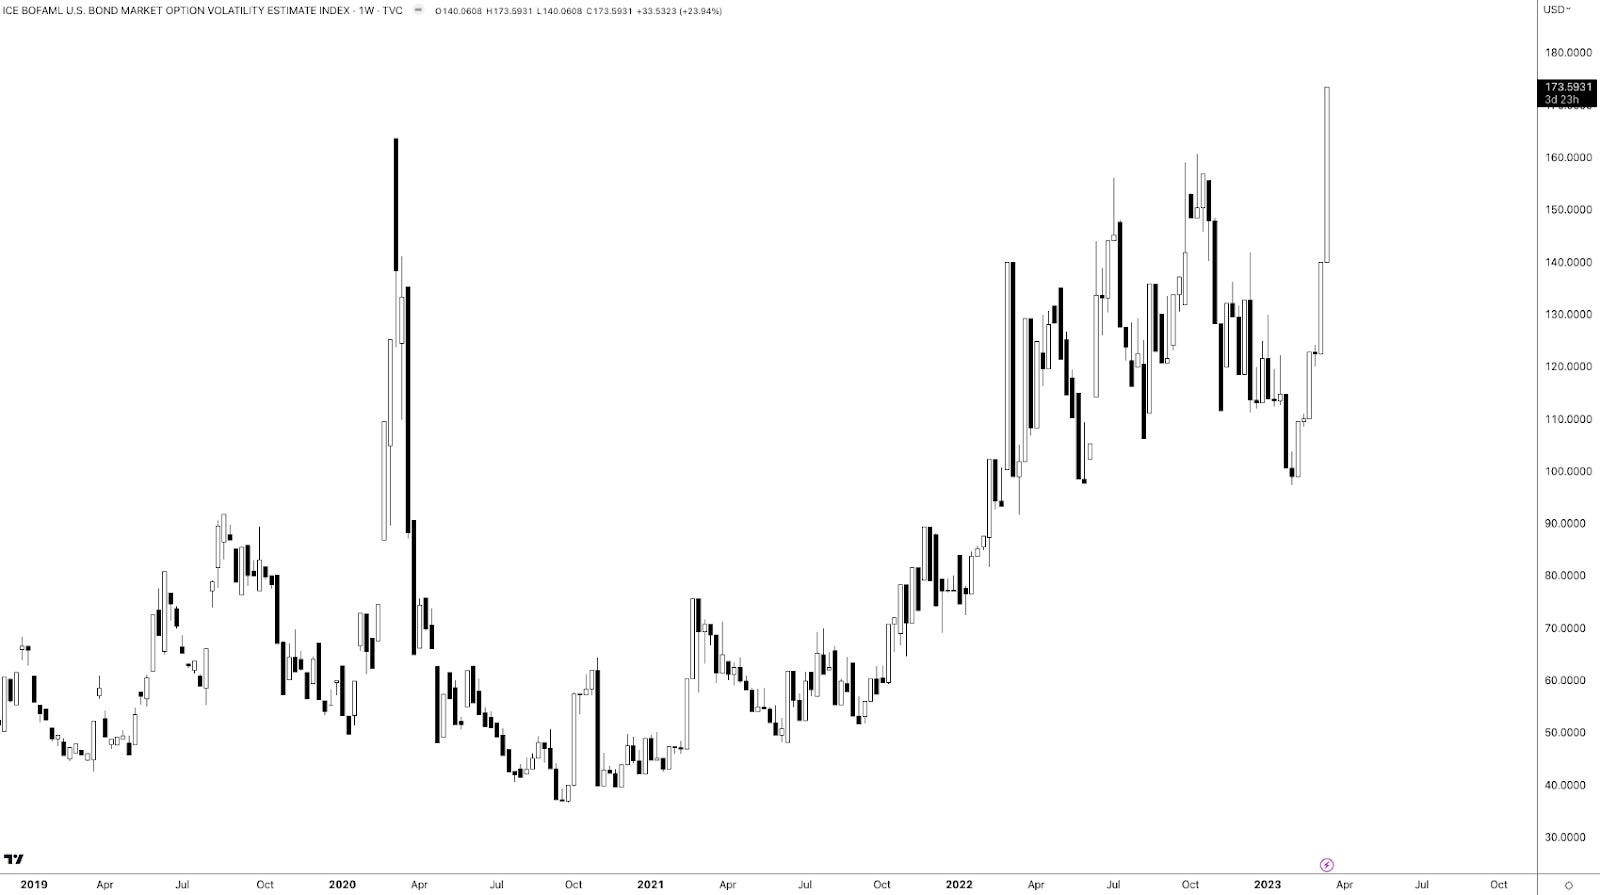
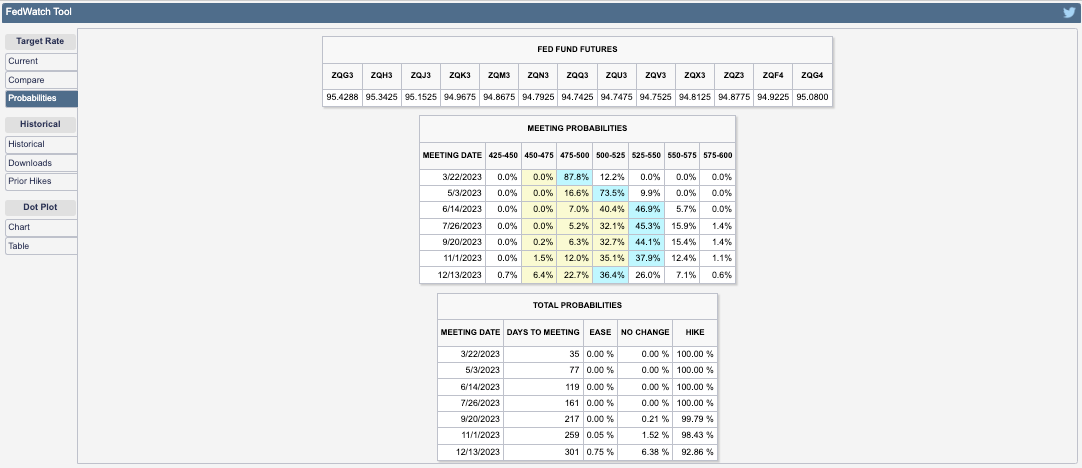
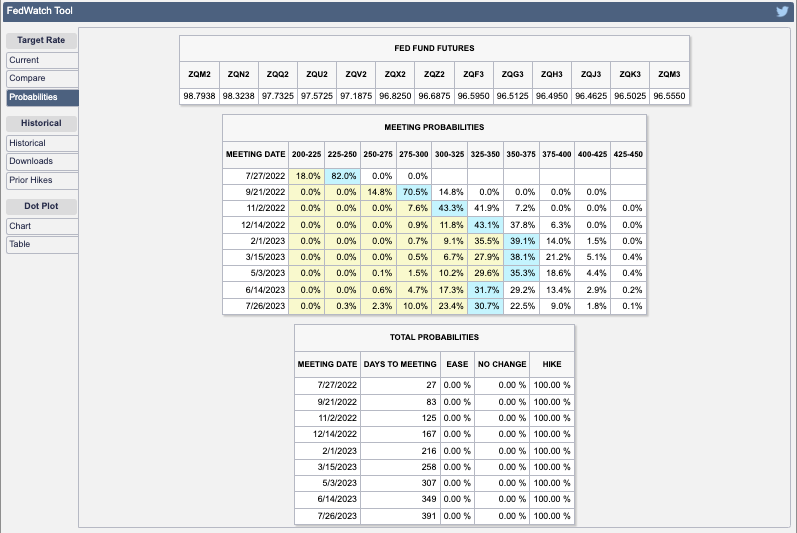
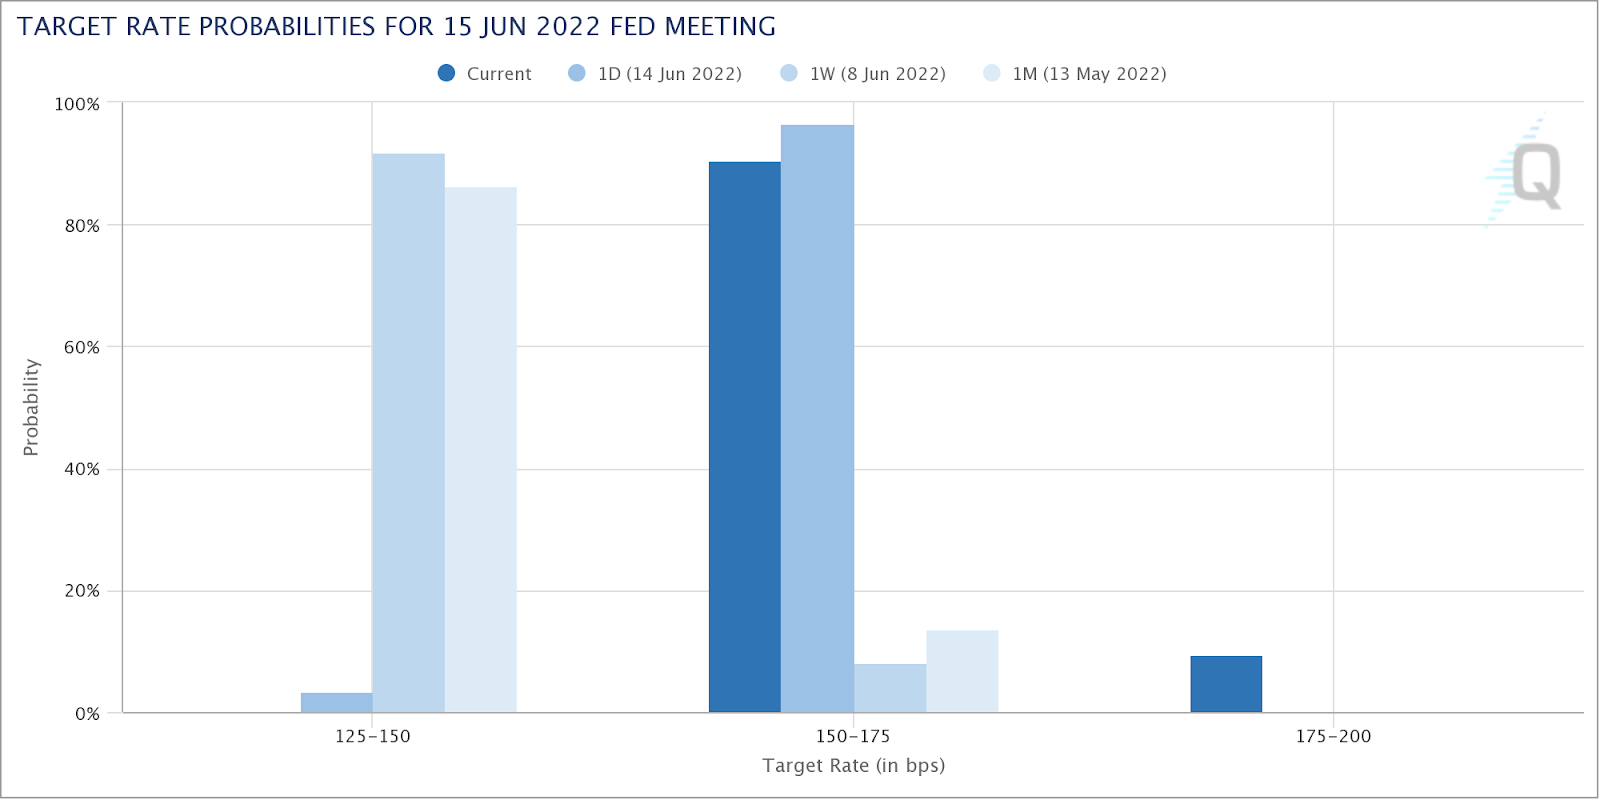
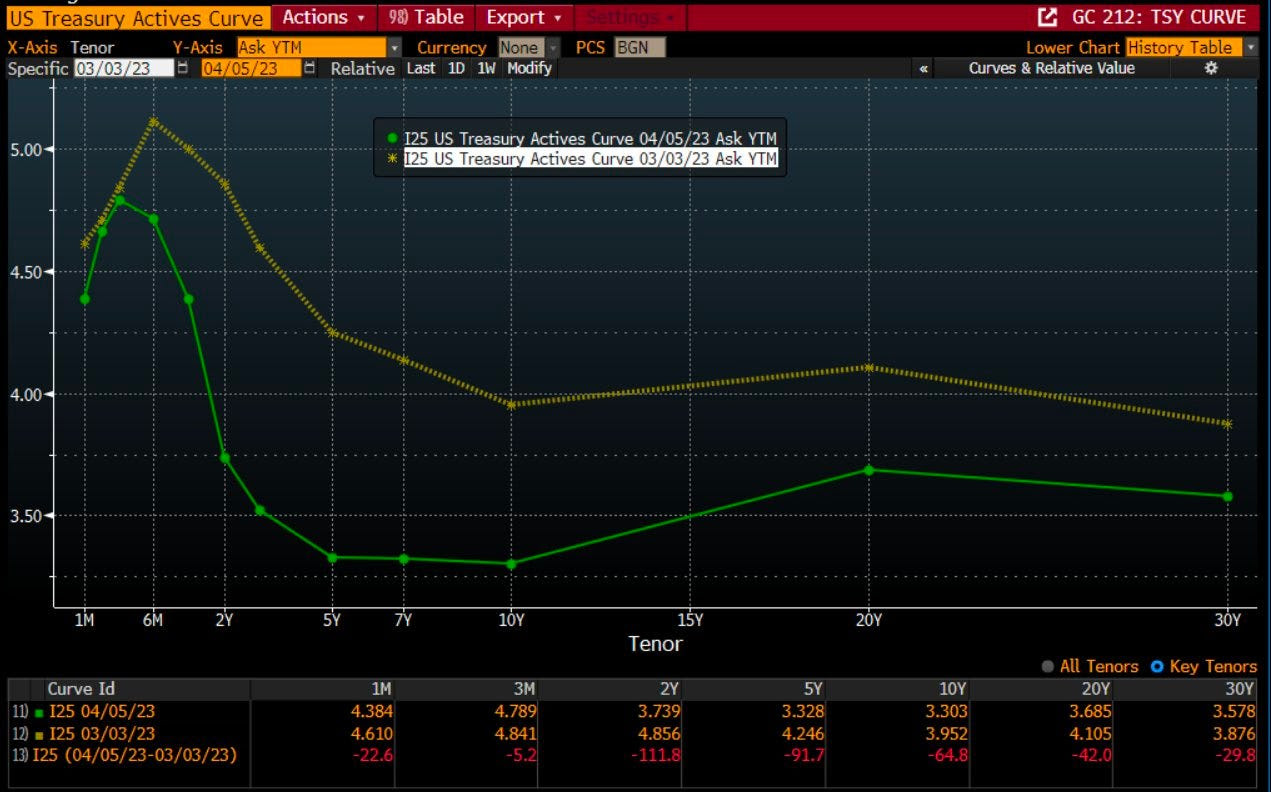
Further, a peek at the bond market shows cuts priced within six months.

Graphic: Retrieved from Bloomberg via @TheBondFreak.

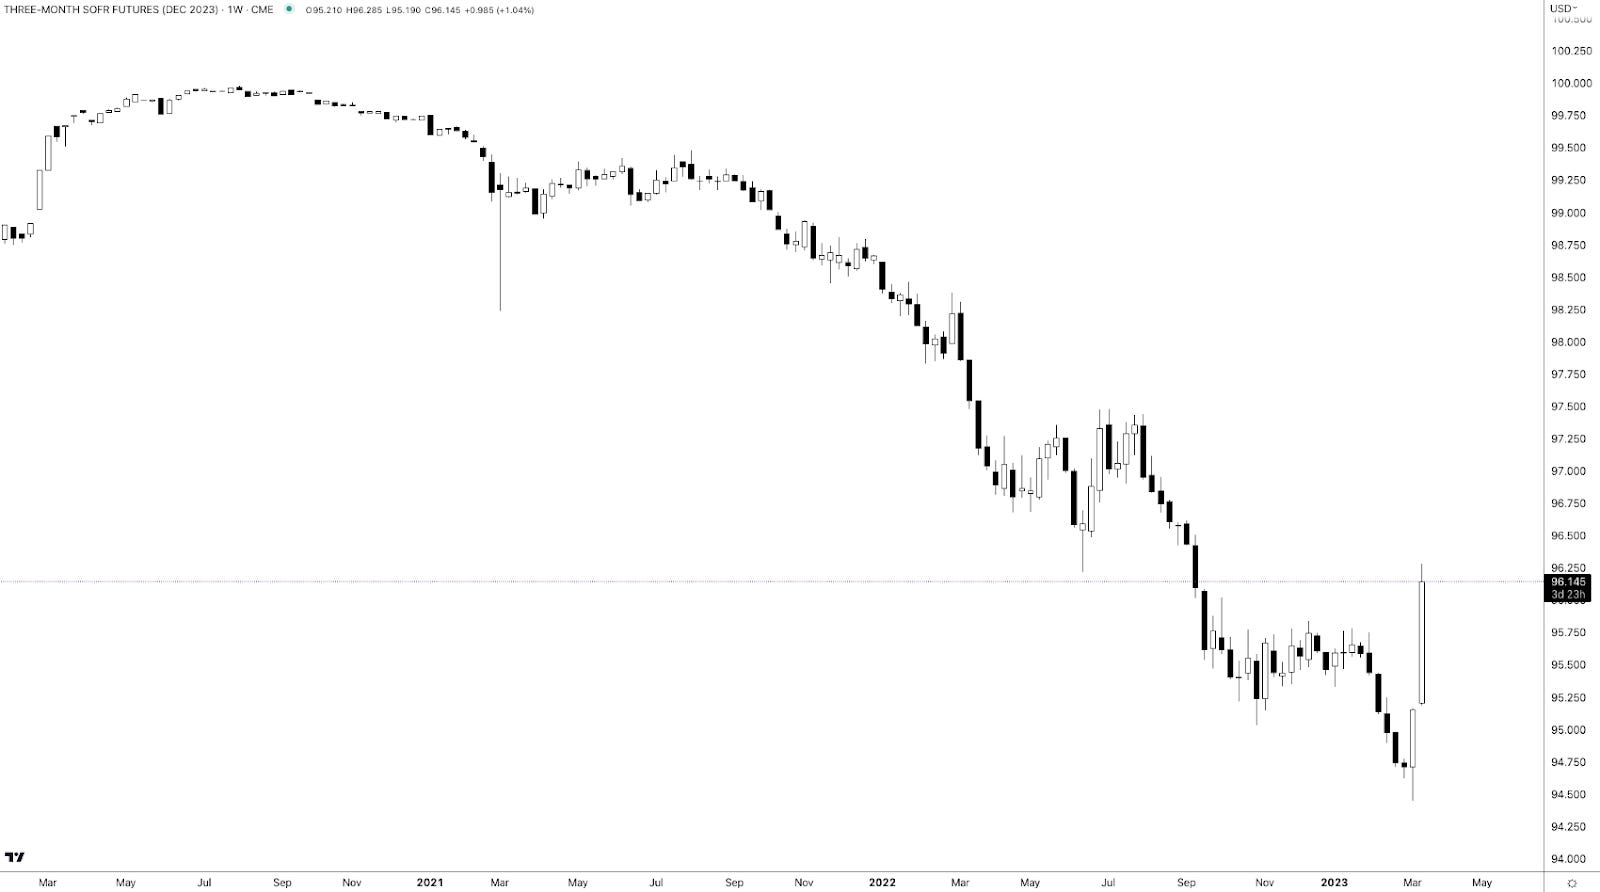
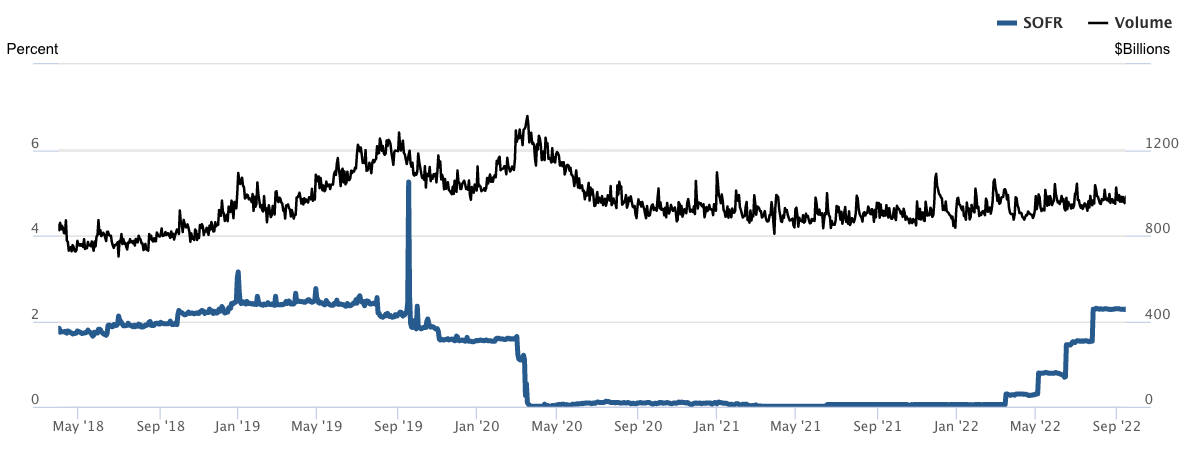
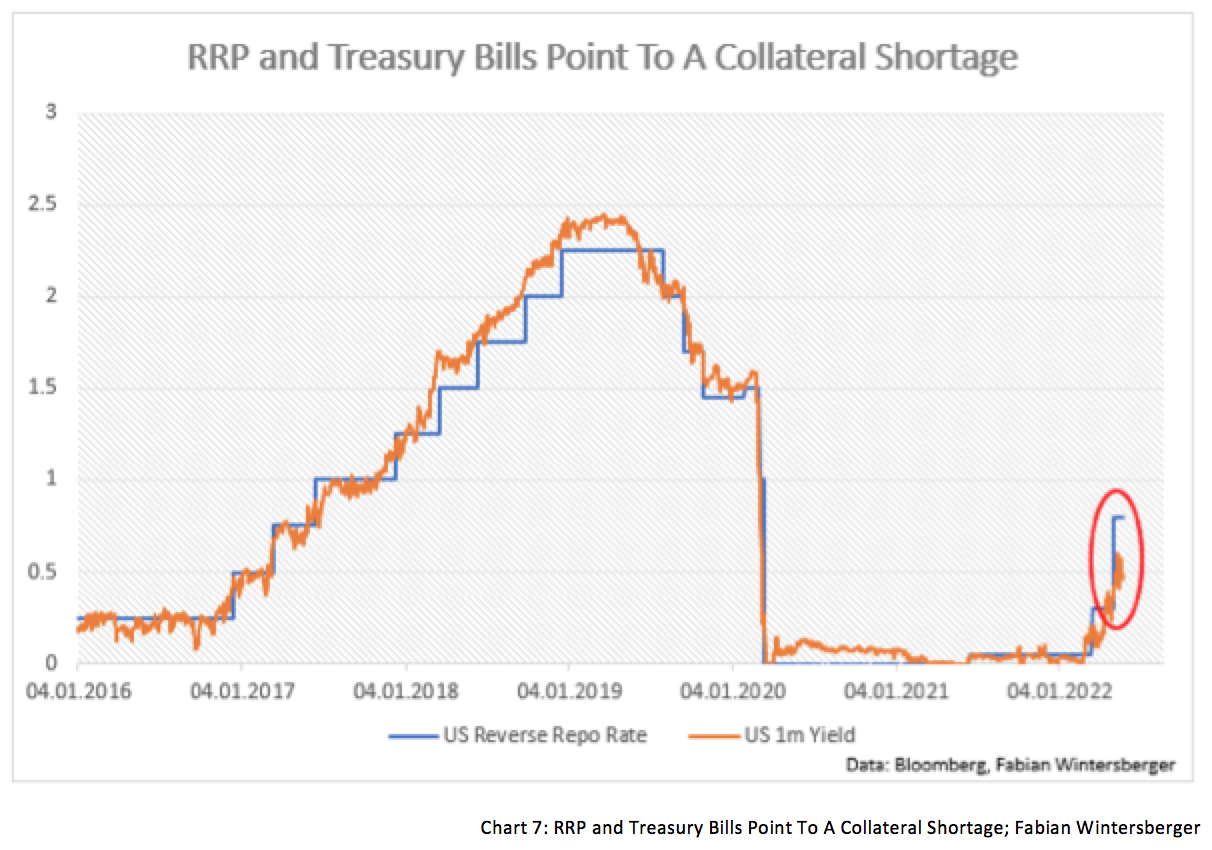
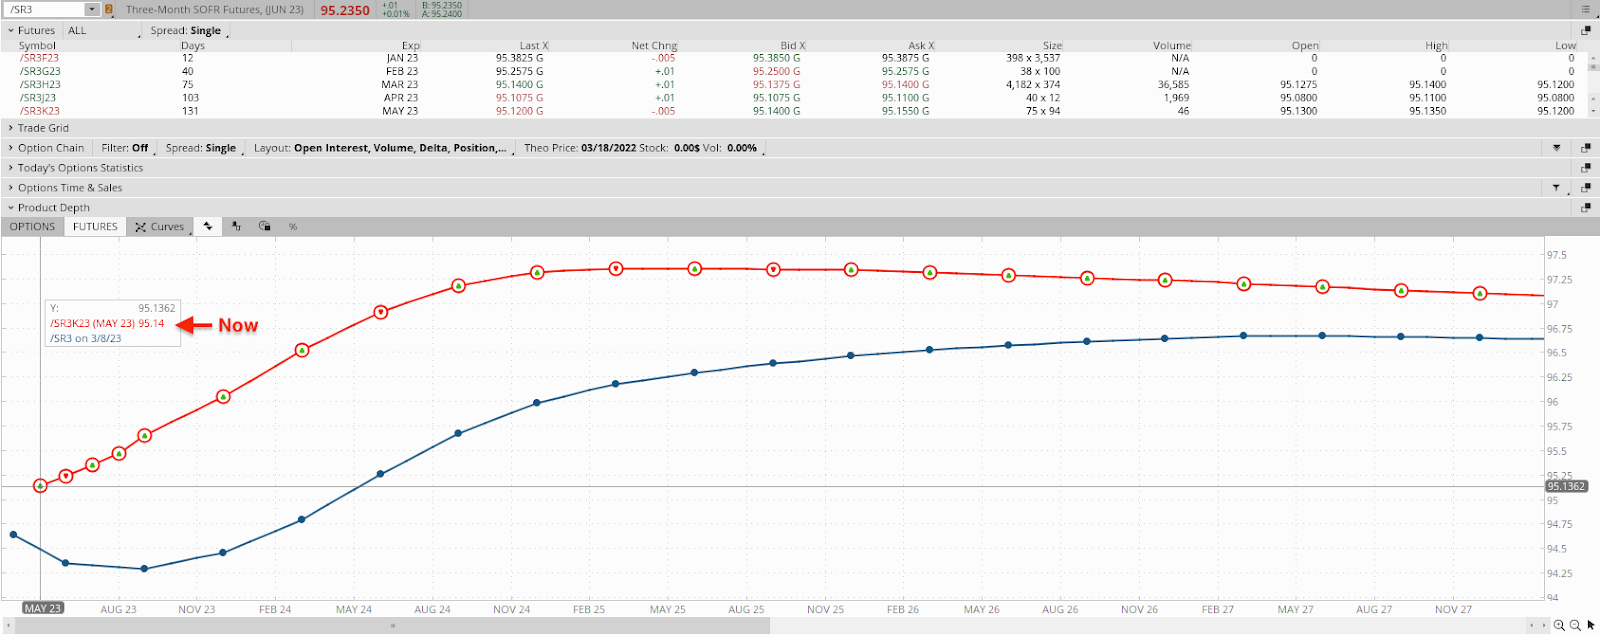
Same thing with the Secured Overnight Financing Rate (SOFR) market, developed by the Federal Reserve to replace LIBOR, which was phased out due to manipulation concerns, among other things, as a benchmark interest rate. 

READ: WHAT IS SOFR?

Unlike LIBOR, which is based on unsecured lending transactions between banks, SOFR is based on actual transactions in the overnight repurchase agreement (repo) market, which makes it a more reliable benchmark. Consequently, the shift from the Eurodollar (FUTURE: /GE), used to intervene in support of the dollar and other currencies and allow lenders to lock in rates, to SOFR has accelerated, too.

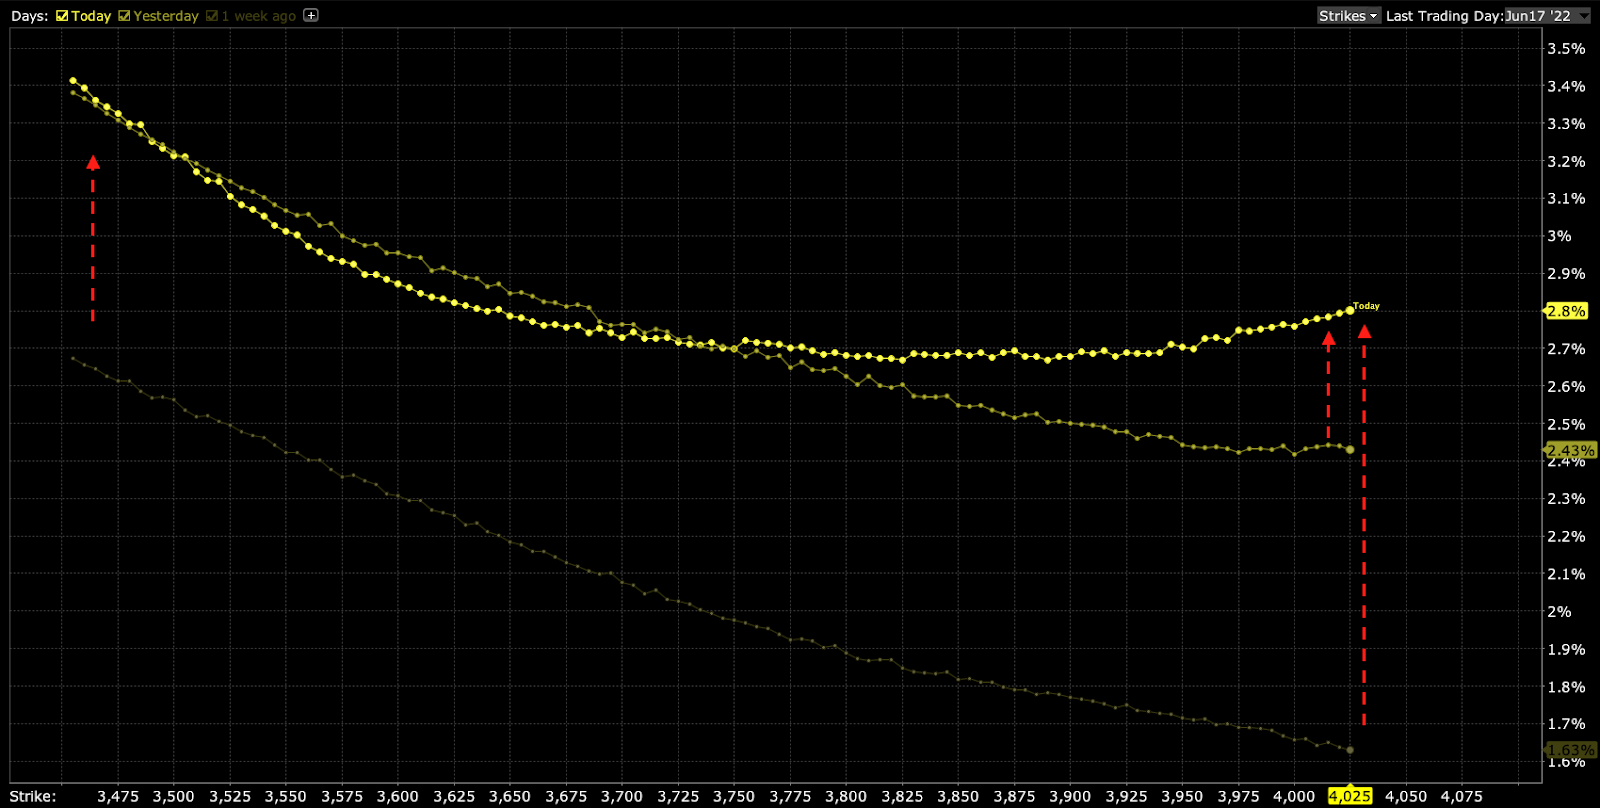
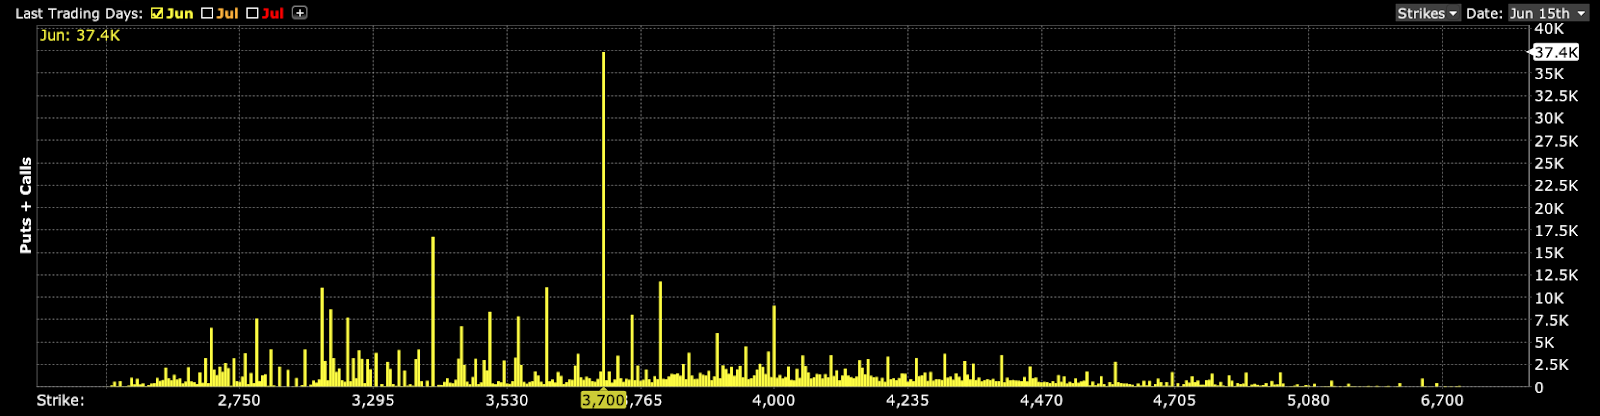
As stated yesterday, options activity in the SOFR market was centered around the 95.00 strikes. To calculate the implied interest rate using the value of the 3-month SOFR future, we can use the following formula:

Implied interest rate = 100 – future price; the implied interest rate calculated using the 3-month SOFR future is an annualized rate.

For example, if the current value of the 3-month SOFR future is 95.00, the implied interest rate would be 100.00 – 95.00 = 5.00%.

Graphic: Via Charles Schwab Corporation’s (NYSE: SCHW) thinkorswim platform. The three-month SOFR (FUTURE: /SR3) curve implies a 4.86% terminal rate today, followed by easing into year-end.

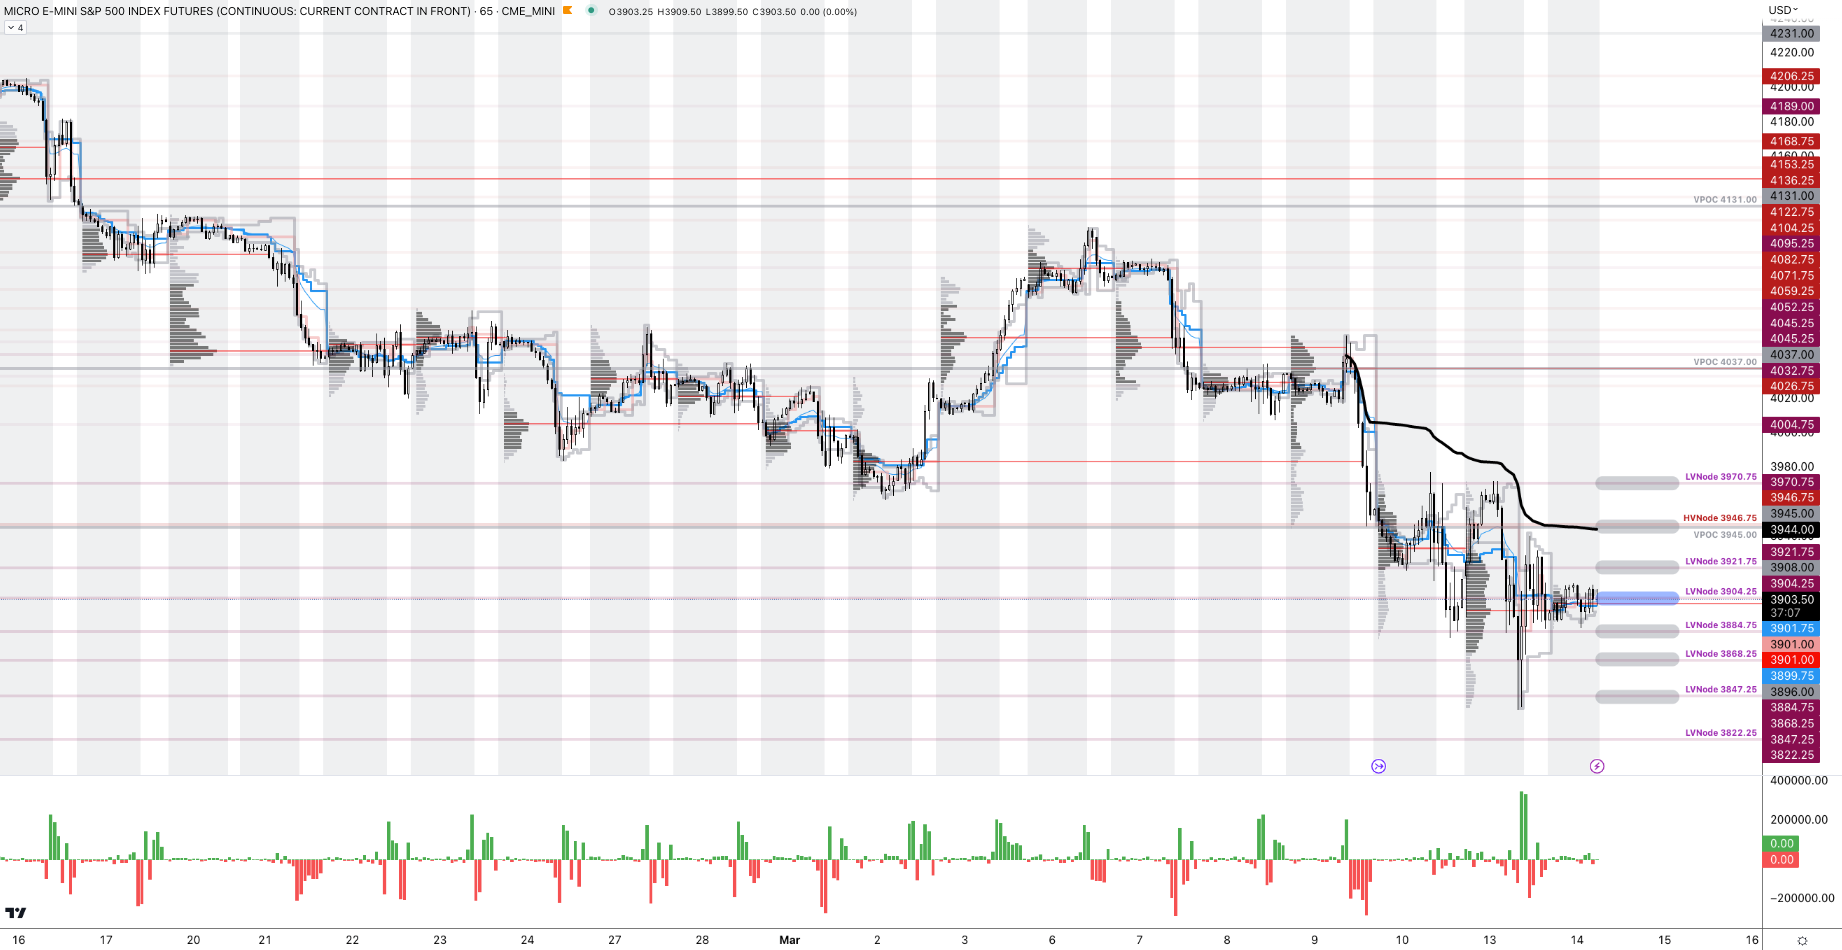
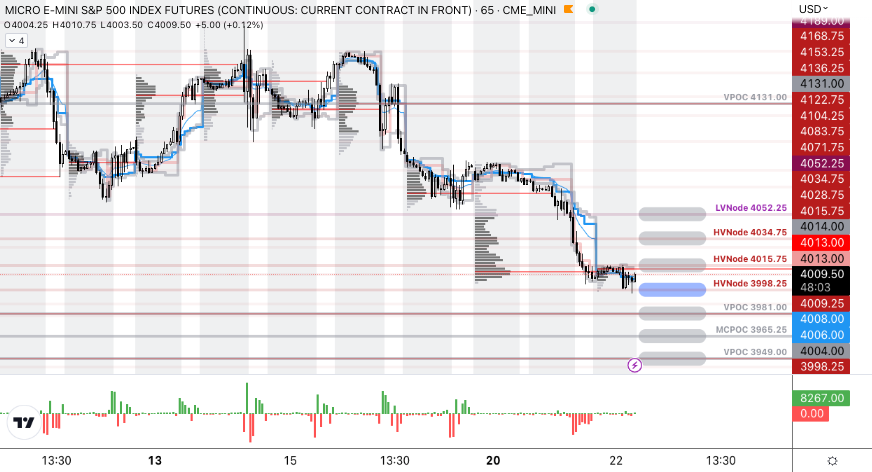
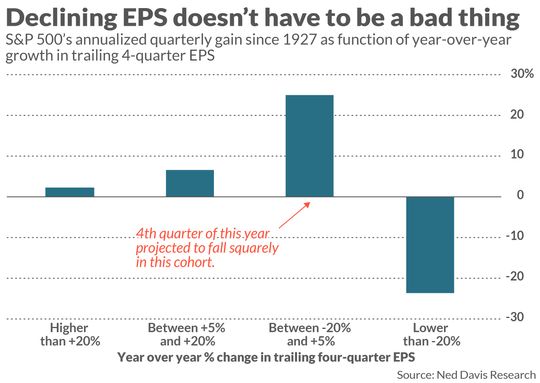
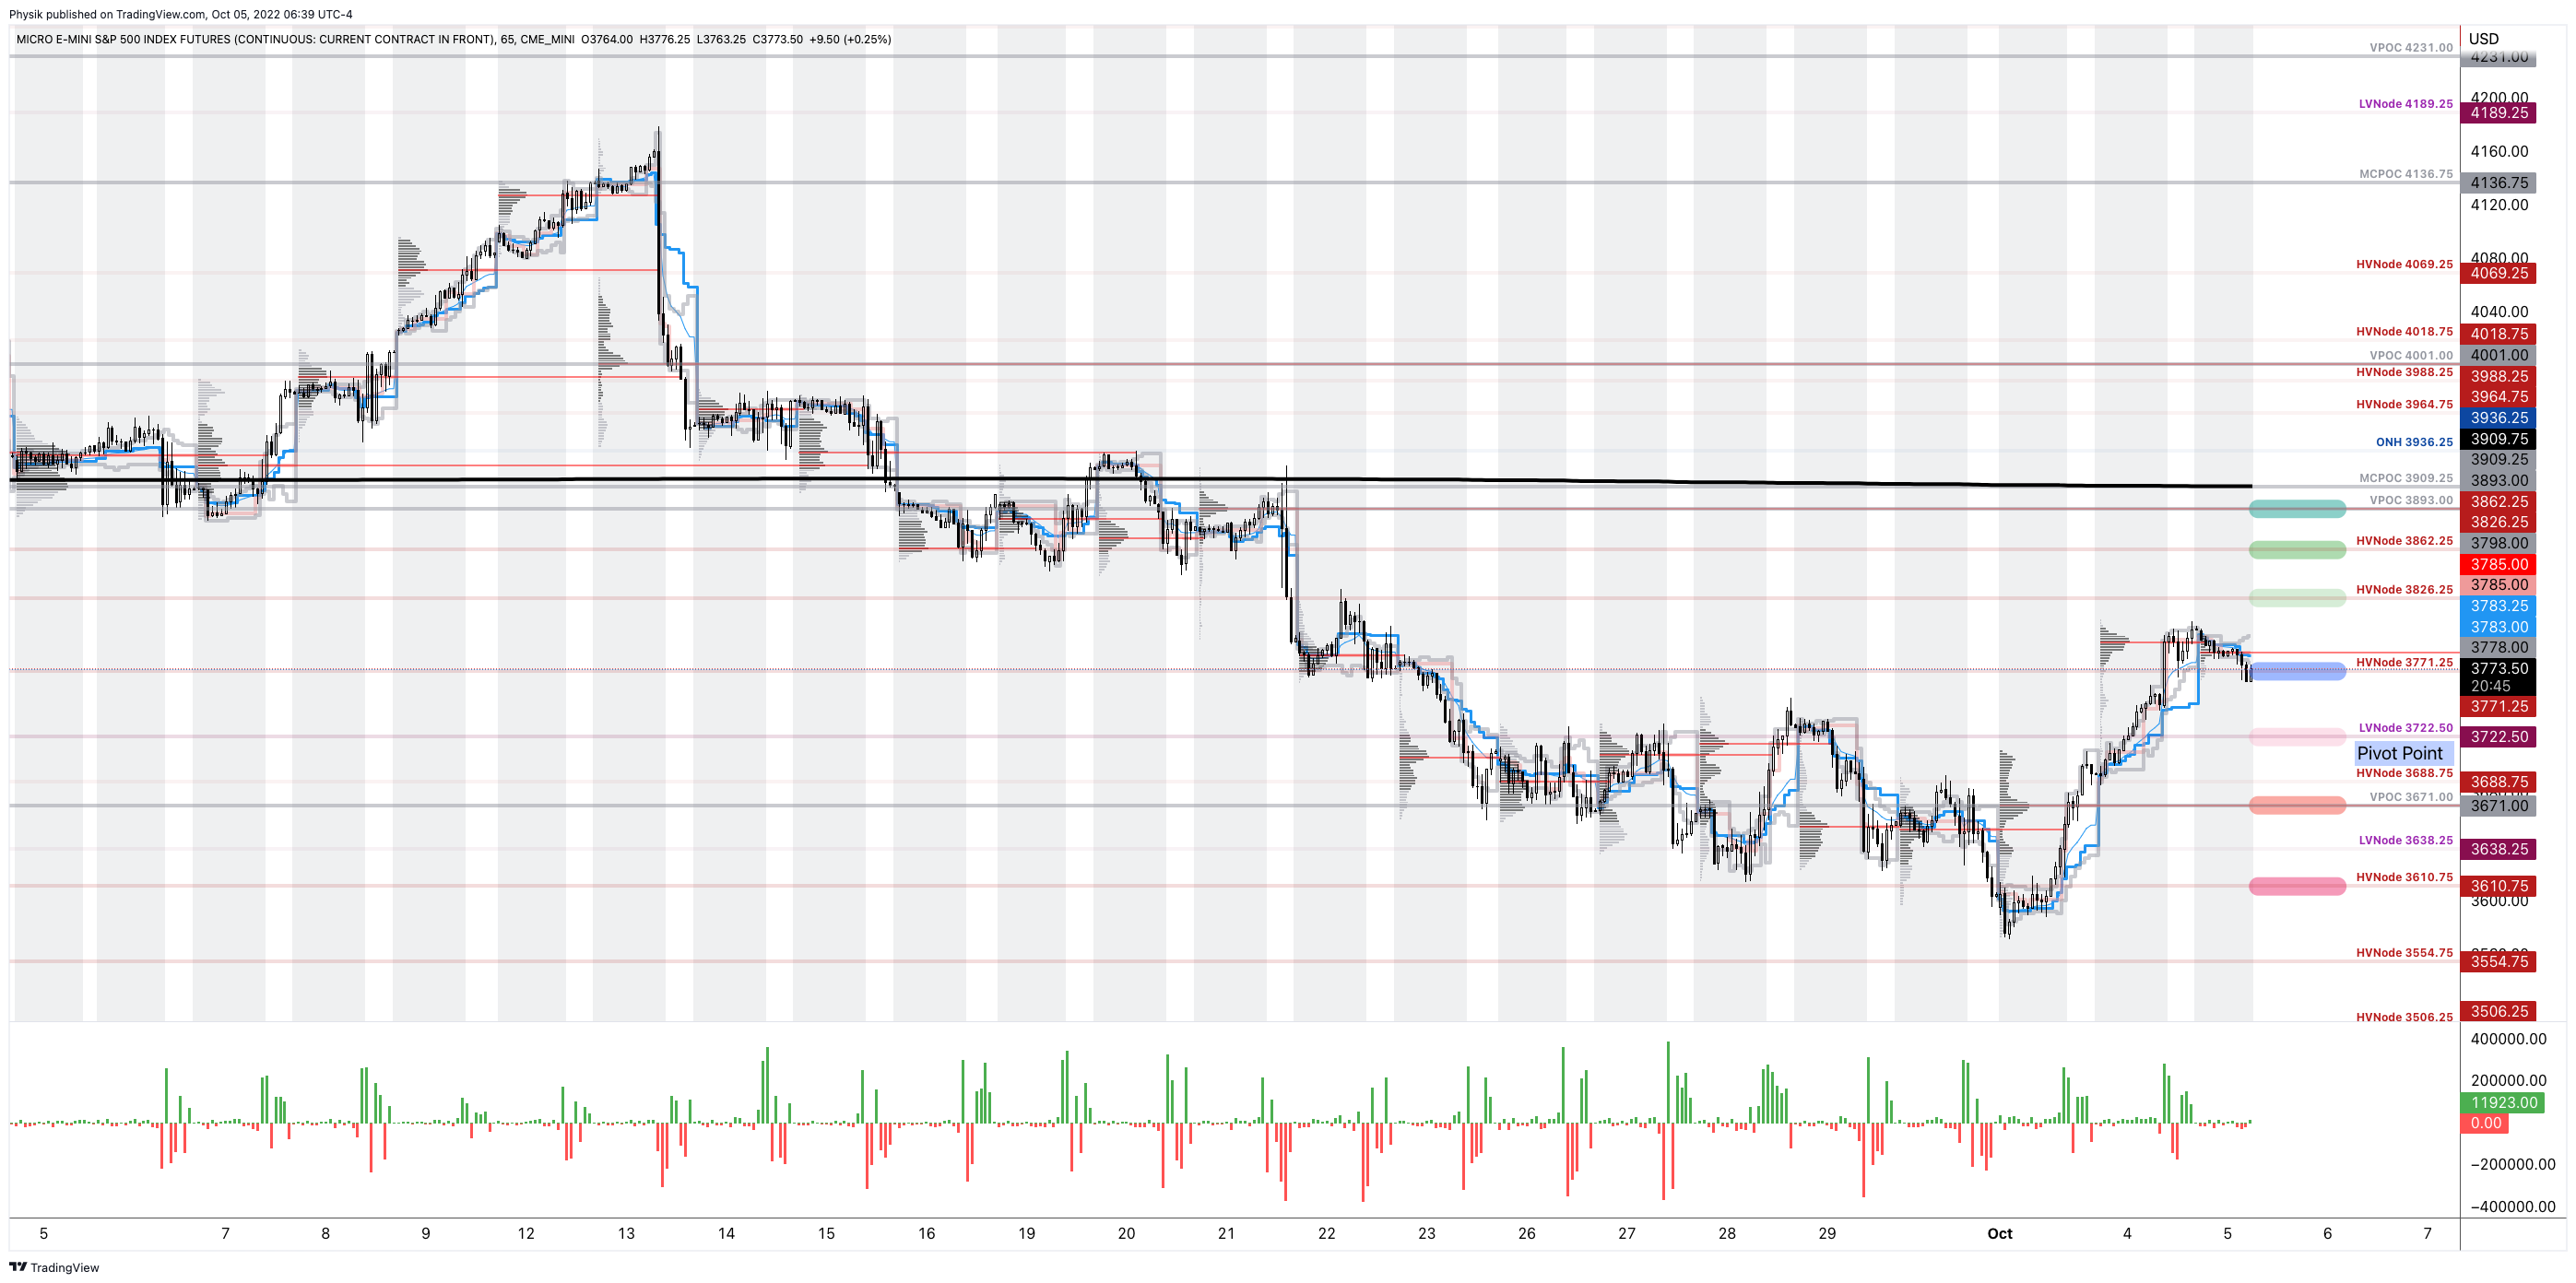
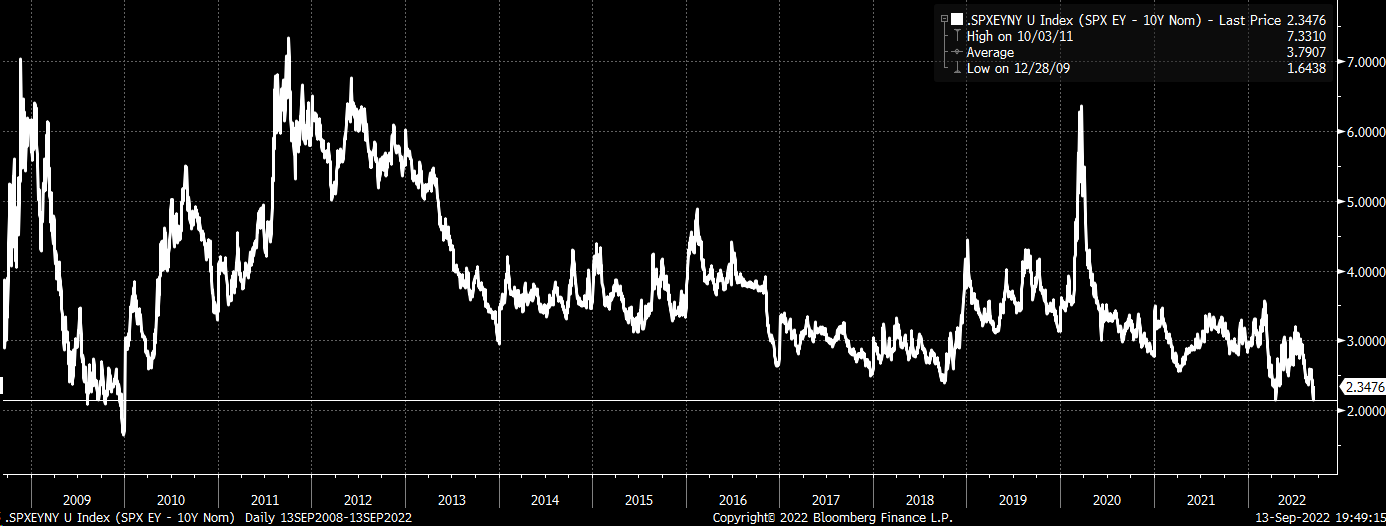
The S&P 500 (INDEX: SPX) has not bottomed based on these conditions. 3Fourteen Research concludes that the SPX has never bottomed during a Fed hike cycle, which one is still ongoing; typically, forward earnings stabilize and turn higher 3-6 months after a market bottom, which hasn’t happened; the 2-10 yield curve has never remained inverted six months after a major bear market bottom.

Graphic: Retrieved from Bloomberg via @MichaelMOTTCM.

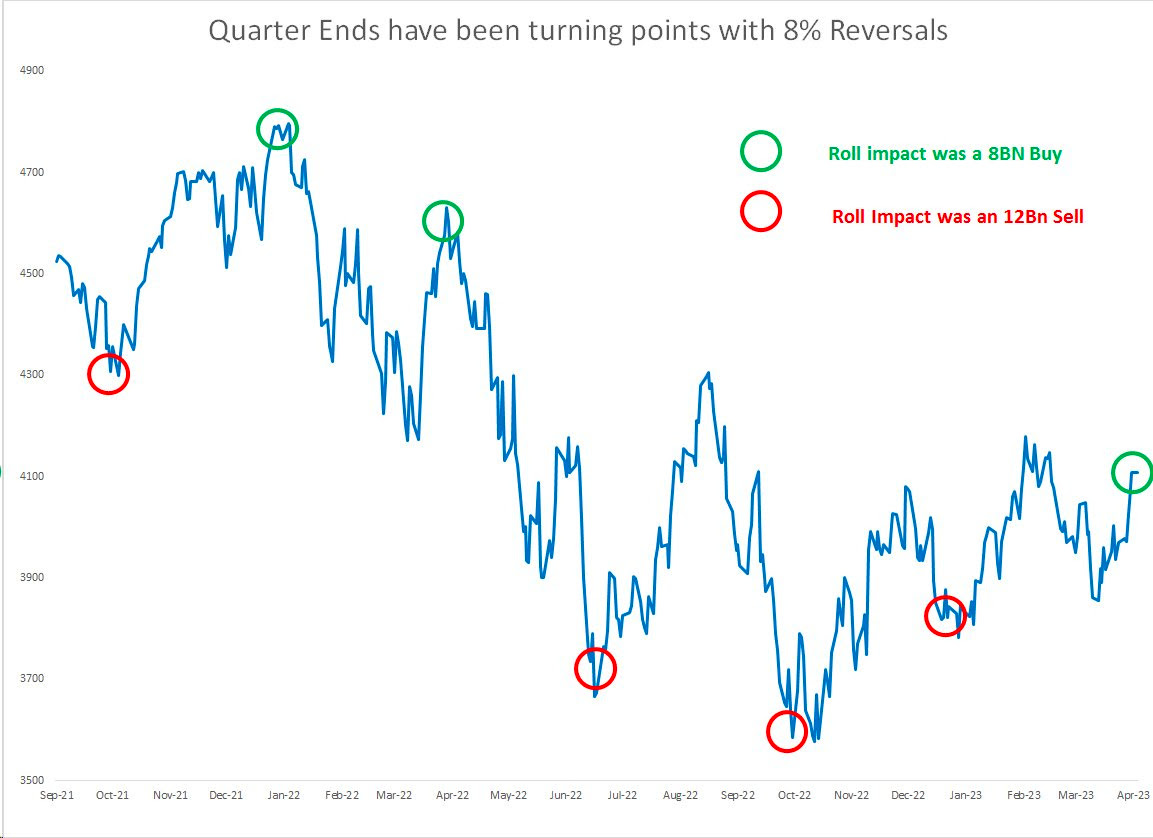
Notwithstanding all the doom and gloom, we explained in past letters that markets would likely remain strong through month-end March. 

Graphic: Retrieved from Damped Spring Advisors’ Andy Constan. “6 of the last 6 quarters, the quarter end flow has resulted in a spike or dip and a subsequent 8%+ reversal.”

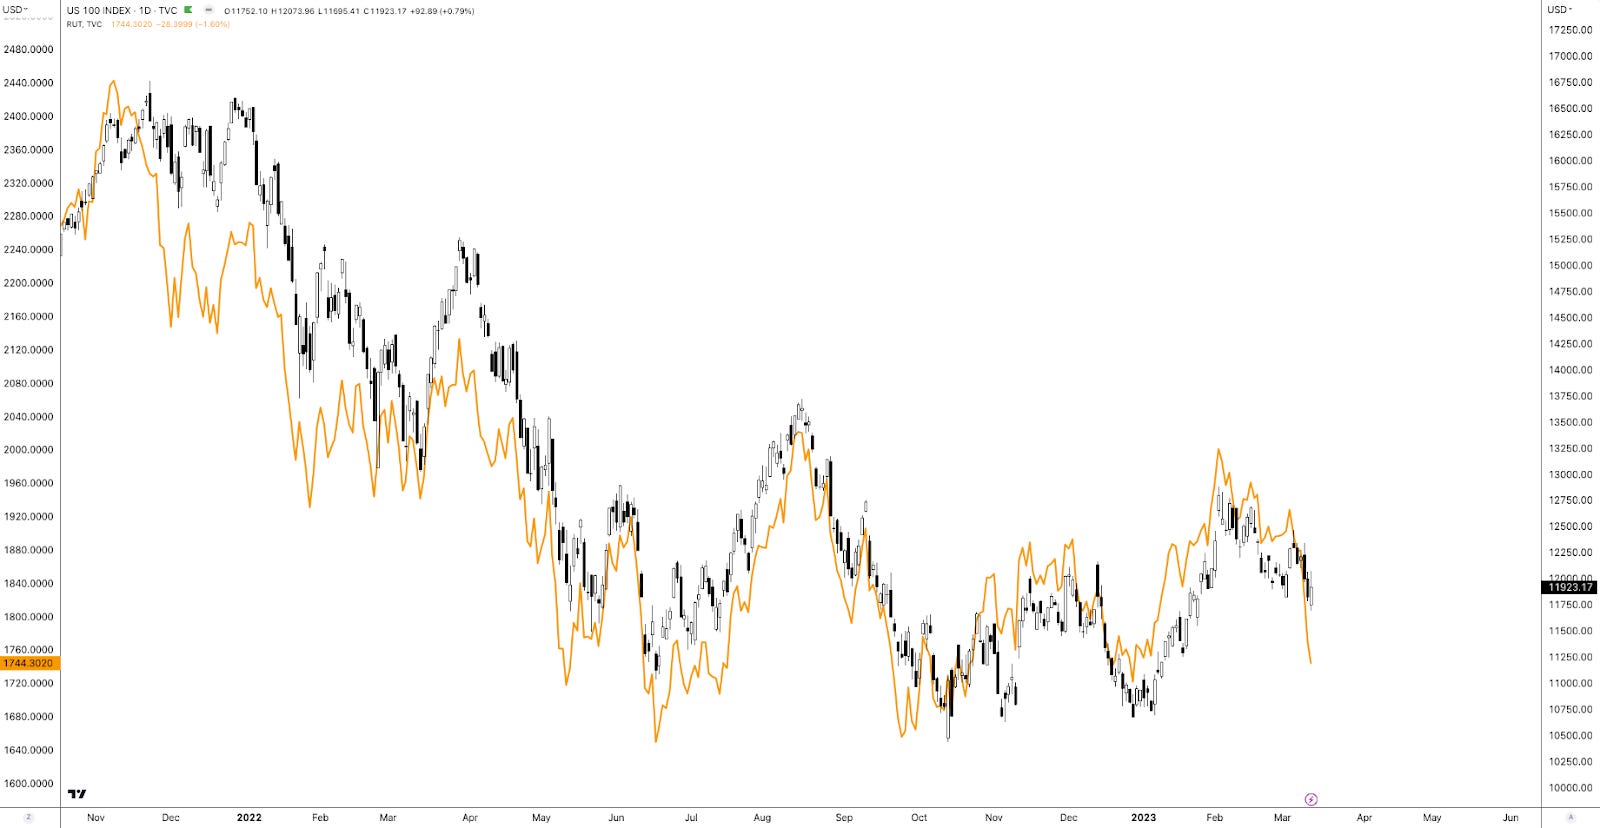
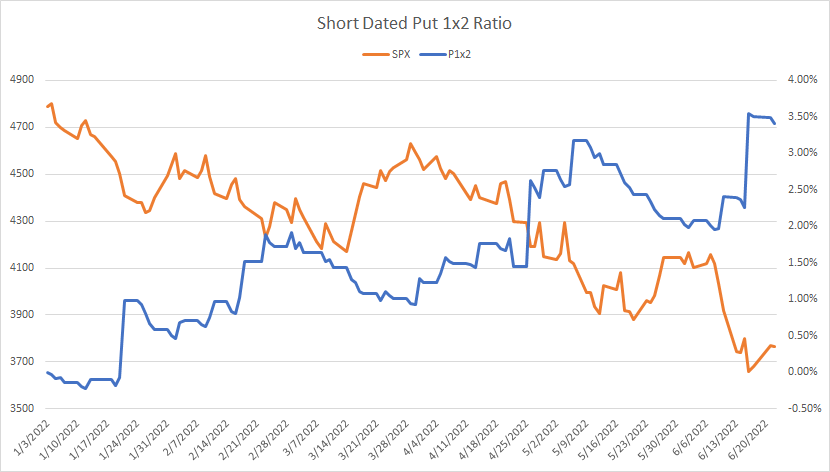
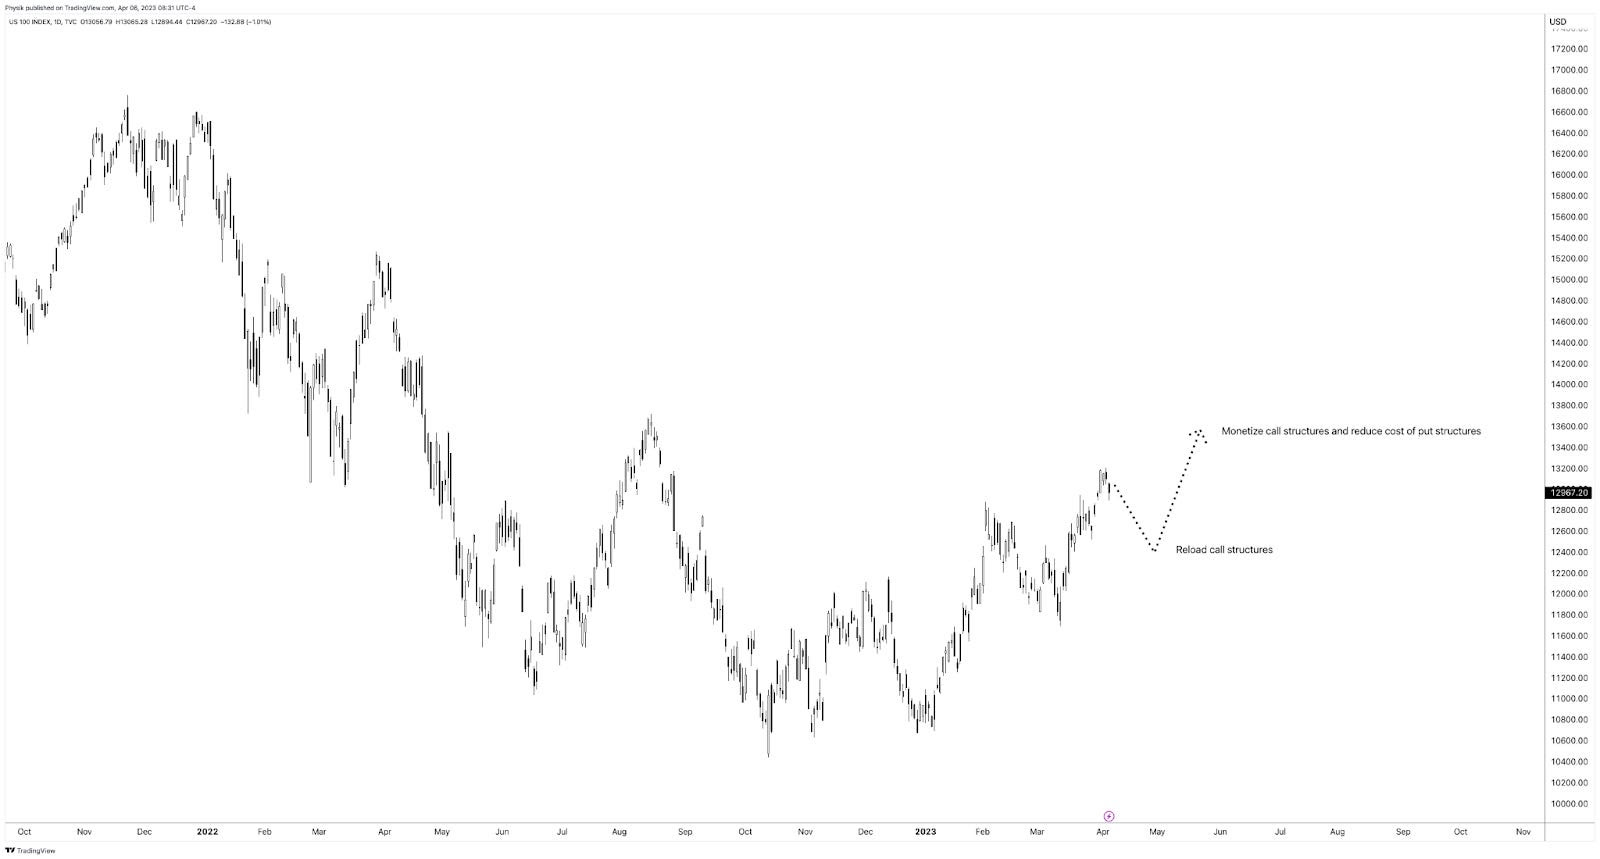
Accordingly, it made a lot of sense to own low- or no-cost call options structures in products like the Nasdaq 100 (INDEX: NDX), where many participants were caught offsides and bidding call volatility in response to the dramatic reversal; the reach for the right tail reduced the cost of ratio call spreads, making them the go-to structures.

It may make sense to re-load in similar call structures on pullbacks while using any proceeds or profits from those structures to reduce the cost of owning fixed-risk and less costly put structures (e.g., vertical) that may enable us to participate in equity market downside, as well as bet on lower rates in the future using call options structures on the /SR3 to express that opinion.

Graphic: Retrieved from TradingView via Physik Invest.

Disclaimer

Don’t use this free letter as advice; all content is for informational purposes, and derivatives carry a substantial risk of loss. At this time, Capelj and Physik Invest, non-professional advisors, will never solicit others for capital or collect fees and disbursements. Separately, you may view this letter’s content calendar at this link.

Categories
Commentary

Daily Brief For March 15, 2023

Physik Invest’s Daily Brief is read free by thousands of subscribers. Join this community to learn about the fundamental and technical drivers of markets.

Graphic updated 6:15 AM ET. Sentiment Risk-Off if expected /MES open is below the prior day’s range. /MES levels are derived from the profile graphic at the bottom of this letter. Click here for the latest levels. SqueezeMetrics Dark Pool Index (DIX) and Gamma (GEX) with the latter calculated based on where the prior day’s reading falls with respect to the MAX and MIN of all occurrences available. A higher DIX is bullish. The lower the GEX, the more (expected) volatility. Click to learn the implications of volatility, direction, and moneyness. Breadth reflects a reading of the prior day’s NYSE Advance/Decline indicator. The CBOE VIX Volatility Index (INDEX: VVIX) reflects the attractiveness of owning volatility. UMBS prices via MNDClick here for the economic calendar.

Administrative

As indicated yesterday, through the end-of-this week, newsletters may be shorter due to the letter writer’s commitments. Therefore, please read the Daily Brief for March 14, if you haven’t already, for a big discussion on bond and equity market volatility, as well as the odds of the market falling apart or rising, and positioning contexts that support that movement. If there are any incomplete statements below, we shall complete them in the coming letters. We’re laying it all out for awareness. Take care!

Fundamental

Headline inflation via CPI (Consumer Price Index) fell most on energy and core goods while shelter, food, and services inflation continues to be sticky. Core prices continue to be high, risking “inflationary psychology [] becoming ingrained,” Bloomberg’s John Authers explains.

Graphic: Retrieved from Bloomberg.

“There’s nothing in this report to suggest that inflation is defeated already,” explained Authers. “Not to raise the fed funds rate next week, with median inflation above 7%, would be a sign of panic,” and an acknowledgment of uncertainties with regard to the banking system, as talked about in the Daily Brief on March 14.

To note, however, contagion appears contained, despite Moody’s Corporation (NYSE: MCO) cutting its outlook for the banking system to negative from stable, and placing lenders including First Republic Bank (NYSE: FRC) on a downgrade review.

JPMorgan Chase & Co’s (NYSE: JPM) Marko Kolanovic did cut his equity allocation warning that not all carry trades, something this letter has talked about numerous times before (i.e., borrow at a low rate and invest in something that provides higher return), can be bailed out. Kolanovic appears worried about commercial real estate, which Simplify Asset Management’s Michael Green just told your letter writer is in a bubble that “we’re seeing crack,” finally.

Graphic: Retrieved from Bloomberg. The Federal Reserve’s new Bank Term Funding Program or BTFP is “QE in another name – assets will grow on the Fed balance sheet which will increase reserves.” Recall that QE is the flow of capital into capital markets while QT is the opposite. Q is for quantitative while E is for easing and T is for tightening.

Anyways, following yesterday’s CPI, traders price higher odds of a 25 basis point hike which puts the terminal or peak fed funds rate at 4.75-5.00%. Following this spring, factoring potential inflation plateau and financial system uncertainties, traders foresee the Fed easing. By year-end, traders expect rates to fall down to 3.75-4.00%. Recall that at the beginning of last week, there were no expectations of easing in 2023. Also, traders thought the Fed would raise as high as 5.50-5.75%.

Mortgage rates, determined by changes in the price of mortgage-backed securities or MBSs, fell too.

Graphic: Retrieved from ZeroHedge. Adding: “US layoffs [are] far higher than suggested by initial jobless claims, JOLTS.”

ARK Invest’s Cathie Wood, who your letter writer had the honor of interviewing in person for Benzinga articles, thinks we’re on the cusp of the “roaring twenties” as inflation “is likely to surprise on the low side of expectations” with the banking crisis also leading to “bad deflation.”

“Today, five major innovation platforms are evolving at the same time – multiomics sequencing, robotics, energy storage, artificial intelligence, and blockchain technology, all of which are converging,” she elaborates.

“Once the Fed stops looking backward at CPI inflation and starts addressing the deflationary banking crisis that a 19-fold increase in short rates and an inverted yield have caused, we would not be surprised to see a return to the Roaring Twenties.”

Graphic: Retrieved from Bloomberg.

On the backward-looking measures quote in the above paragraph, former Fed trader Joseph Wang notes that the Fed and central banks, in general, are aware segments of the market may break, but that won’t discourage them from tightening further.

“As the BOE saved the gilt market through purchases and kept tightening, so the Fed can save banks and keep tightening.”

Positioning

Tuesday’s letter said that following important events like CPI, the compression of wound implied volatility or IVOL, coupled with the nearing large options expirations (OpEx), sets the market up for potential short bursts of strength into the end of the month and next month.

That’s along the lines of what is happening. The S&P 500 rose mechanically after the release of CPI yesterday. Later, though the index succumbed, internally speaking the market remained strong through end-of-day, hence some short bursts boosted by some short-dated options activities, also.

As explained, yesterday, the recent re-grossing theme appears intact. Any further compression of wound IVOL and the passage of options expirations (OpEx) could support equities as month-end approaches. Though it may be too early to position for strength, one may consider it the way it was explained in the Daily Brief on March 14.

Technical

As of 6:15 AM ET, Wednesday’s regular session (9:30 AM – 4:00 PM ET), in the S&P 500, is likely to open in the middle part of a negatively skewed overnight inventory, inside of the prior day’s range, suggesting a limited potential for immediate directional opportunity.

The S&P 500 pivot for today is $3,904.25. 

Key levels to the upside include $3,921.75, $3,945.00, and $3,970.75.

Key levels to the downside include $3,884.75, $3,868.25, and $3,847.25.

Disclaimer: Click here to load the updated key levels via the web-based TradingView platform. New links are produced daily. Quoted levels likely hold barring an exogenous development.

Graphic: 65-minute profile chart of the Micro E-mini S&P 500 Futures.

Definitions

Volume Areas: Markets will build on areas of high-volume (HVNodes). Should the market trend for a period of time, this will be identified by a low-volume area (LVNodes). The LVNodes denote directional conviction and ought to offer support on any test.

If participants auction and find acceptance in an area of a prior LVNode, then future discovery ought to be volatile and quick as participants look to the nearest HVNodes for more favorable entry or exit.

POCs: Areas where two-sided trade was most prevalent in a prior day session. Participants will respond to future tests of value as they offer favorable entry and exit.

Volume-Weighted Average Prices (VWAPs): A metric highly regarded by chief investment officers, among other participants, for quality of trade. Additionally, liquidity algorithms are benchmarked and programmed to buy and sell around VWAPs.


About

The author, Renato Leonard Capelj, spends the bulk of his time at Physik Invest, an entity through which he invests and publishes free daily analyses to thousands of subscribers. The analyses offer him and his subscribers a way to stay on the right side of the market. 

Separately, Capelj is an accredited journalist with past works including interviews with investor Kevin O’Leary, ARK Invest’s Catherine Wood, FTX’s Sam Bankman-Fried, North Dakota Governor Doug Burgum, Lithuania’s Minister of Economy and Innovation Aušrinė Armonaitė, former Cisco chairman and CEO John Chambers, and persons at the Clinton Global Initiative.

Connect

Direct queries to renato@physikinvest.com. Find Physik Invest on TwitterLinkedInFacebook, and Instagram. Find Capelj on TwitterLinkedIn, and Instagram. Only follow the verified profiles.

Calendar

You may view this letter’s content calendar at this link.

Disclaimer

Do not construe this newsletter as advice. All content is for informational purposes. Capelj and Physik Invest manage their own capital and will not solicit others for it.

Categories
Commentary

Daily Brief For March 14, 2023

Physik Invest’s Daily Brief is read free by thousands of subscribers. Join this community to learn about the fundamental and technical drivers of markets.

Graphic updated 6:30 AM ET. Sentiment Neutral if expected /MES open is inside of the prior day’s range. /MES levels are derived from the profile graphic at the bottom of this letter. Click here for the latest levels. SqueezeMetrics Dark Pool Index (DIX) and Gamma (GEX) with the latter calculated based on where the prior day’s reading falls with respect to the MAX and MIN of all occurrences available. A higher DIX is bullish. The lower the GEX, the more (expected) volatility. Click to learn the implications of volatility, direction, and moneyness. Breadth reflects a reading of the prior day’s NYSE Advance/Decline indicator. The CBOE VIX Volatility Index (INDEX: VVIX) reflects the attractiveness of owning volatility. UMBS prices via MNDClick here for the economic calendar.

Administrative

A long(er) letter, today. Through the end-of-this week, newsletters may be shorter due to the letter writer’s commitments. Take care!

Fundamental

Yesterday’s letter focused on the SVB Financial Group (NASDAQ: SIVB) failure, albeit with an optimistic tone. In short, the bank could not make good on fast accelerating withdrawals. Read more here.

According to one TechCrunch article, the likes of Founders Fund “reportedly advised their portfolio companies … to withdraw their money, … [and], if everybody is telling each other that SVB is in trouble, that will be a challenge,” as it was.

Graphic: Retrieved from @Citrini7. In the worst-case scenario, it was likely that uninsured depositors at SIVB would have received $0.80 on each dollar barring a bailout.

Authorities later put forth emergency measures guaranteeing all deposits. The effort shored up confidence in the banking system and markets strengthened, though some regional names such as First Republic Bank (NYSE: FRC) continued trading weak. In FRC’s case, the Federal Reserve’s (Fed) new bailout facility does not help. As former Fed trader Joseph Wang explains, “you need Treasuries and Agency MBS to tap the facility, and [FRC] barely owns any.”

Graphic: Retrieved via Joseph Wang.

Anyways, as yesterday’s letter briefly mentioned, expectations on the path of Fed Funds shifted. Traders put the terminal/peak rate at 5.00-5.25%, down from 5.50-5.75%, while pricing cuts after spring. Previously, no cuts were expected in 2023.

Graphic: Retrieved from CME Group Inc’s (NASDAQ: CME) FedWatch Tool.

Some Treasury yields fell spectacularly, too, …

Graphic: Retrieved from Bloomberg.

… on par with those declines experienced amidst major crises, at least in the case of the 2-year.

Graphic: Retrieved from Bloomberg.

Measures of US Treasury yield volatility implied by options (i.e., bets or hedges on or against market movement) adjusted higher, accordingly. This is often a harbinger of equity market volatility.

Graphic: Merrill Lynch Option Volatility Estimate retrieved from TradingView

Call options on the three-month Secured Overnight Financing Rate (FUTURE: SOFR) future (i.e., bets on interest rates falling in the future) paid handsomely.

For instance, bull call spreads that expire in December 2023 (e.g., BUY +1 VERTICAL /SR3Z23:XCME 1/2500 DEC 23 /SR3Z23:XCME 96/97 CALL @.0375) increased in value by about 650.00% to $0.33 (i.e., $750.00 per contract).

Graphic: Retrieved via TradingView. Three-month SOFR Future (December 2023). When SOFR is at a lower (higher) number, the market is pricing an increase (decrease) in interest rates. Participants put the December 2023 SOFR rate at 100-96.145 = 3.855%.

In the equity space, some readers may have caught some commentary on spot-vol beta in the VIX complex strengthening like we have not seen in a while, a nod to the harbinger of equity market volatility remark a few paragraphs higher.

Recommended Readings:

  • Read: The Ambrus Group’s Kris Sidial on two major risks investors should watch out for in 2023. In short, volatility’s sensitivity to underlying prices (spot-vol beta) was low, and Sidial cast blame, in part, on commodity trading advisors and strong volatility supply.
  • Read: Simplify Asset Management’s Michael Green on using option and bond overlays to hedge big uncertainties facing markets. Following 2022, investors swapped poor-performing long-dated volatility exposures for ones with bounded risk and less time to expiry, hence the increase in 0 DTE trading.
Graphic: Retrieved from Piper Sandler’s (NYSE: PIPR) Danny Kirsch.

This spot-vol beta remark suggests that (at least some of) the volatility in rates, as well as certain small pockets of the equity and crypto market, manifested demand for crash protection in the S&P 500, “which feeds back into VIX,” one explanation put well.

Graphic: Retrieved from Piper Sandler’s (NYSE: PIPR) Danny Kirsch. “[Last] week finally got a bit of explosiveness in VIX as fixed strike volatility got bid. This is VIX generic front month future and move in SPX. Last time it really “paid” to have VIX upside was Jan of 2022 (point in upper left corner).”

Notwithstanding, for these options to keep their value and continue to perform well, realized volatility (RVOL) must pick up substantially, which is not likely.

Unlimited’s Bob Elliott comments: “the bond market is pricing a broad-based credit crunch, … [and though] it’s not crazy for the Fed to slow down here given the current uncertainty,” odds are financial problems are contained and the Fed moves forward with its mission to get (and keep) inflation down.

Graphic: Retrieved from Fabian Wintersberger. Just as the “monetary expansion supported the rise in equity and bond prices in January.”

Consequently, “the pricing of Dec23s and 5yr BEIs makes no sense,” Elliott adds. This means the example SOFR trade above is/was ripe for some monetization, and equity volatility must be dealt with carefully (i.e., price movements must be higher than they are now which would be difficult given that authorities/Fed do not want liquidations).

In support of siding with the less extreme take, we paraphrase Kai Volatility’s Cem Karsan who says that for years prior to the 2007-2008 turmoil, macro tourists were calling for a crash.

For markets to crumble, there would have to be an exogenous event far greater in implications than what just transpired with SIVB over the weekend. With odds that such turmoil doesn’t happen soon, coupled with participants easing up on their long-equity exposure (i.e., selling stock and not needing to hedge, hence the statement that owning equity volatility must be dealt with carefully), RVOL is likely to stay contained. That’s not to say that this volatility observed in the rates market can’t persist. It’s also not to say that markets can’t continue to trade lower (in fact, with interest rates rising and processes like quantitative tightening challenging bank liquidity, there is less incentive for investors to reside in lower-yielding equities). It just means that, barring some exogenous event, the market remains intact.

Graphic: Retrieved from Jack Farley. “Silicon Valley Bank owns >$80 Billion of Mortgage-Backed Securities (MBS), a market that is ‘more prone to bouts of volatility’ because ‘small investors & leveraged funds have become the main buyers’ as the Fed & banks step away from market, according to Dec 2022 BIS report.”

Positioning

Following important events like the release of the Consumer Price Index (CPI) today, the compression of implied volatility or IVOL, coupled with the nearing of big options expirations (OpEx), sets the market up for potential short bursts of strength heading into the end of the month and next month.

Graphic: Retrieved from Bloomberg. Inflation has been well within forecasts.

A quick comparison of the Russell 2000 (INDEX: RUT) and Nasdaq 100 (INDEX: NDX) suggests this options-induced strength may help keep the recent re-grossing theme intact. The compression of wound IVOL and passage of OpEx, coupled with the still-live re-grossing theme, may put a floor under equities.

Graphic: Retrieved from TradingView. Orange = RUT. Candles = NDX. Note the weakness in RUT. Note the strength of the Nasdaq relative to the Russell.

To play, one could place a portion of their cash in money market funds or T-bill ETFs or box spreads, for instance, while allocating another portion to leverage potential by way of some call options structures that use one or more short options to help bring down the cost of a long option that is closer to current market prices (e.g., a bull call spread or short ratio call spread). To note, based on options prices as of this writing, it may be too early to enter call structures (i.e., too expensive given the context).

 Technical

As of 6:30 AM ET, Tuesday’s regular session (9:30 AM – 4:00 PM ET), in the S&P 500, is likely to open in the middle part of a balanced overnight inventory, inside of the prior day’s range, suggesting a limited potential for immediate directional opportunity.

The S&P 500 pivot for today is $3,904.25. 

Key levels to the upside include $3,921.75, $3,945.00, and $3,970.75.

Key levels to the downside include $3,884.75, $3,868.25, and $3,847.25.

Disclaimer: Click here to load the updated key levels via the web-based TradingView platform. New links are produced daily. Quoted levels likely hold barring an exogenous development.

Graphic: 65-minute profile chart of the Micro E-mini S&P 500 Futures.

Definitions

Volume Areas: Markets will build on areas of high-volume (HVNodes). Should the market trend for a period of time, this will be identified by a low-volume area (LVNodes). The LVNodes denote directional conviction and ought to offer support on any test.

If participants auction and find acceptance in an area of a prior LVNode, then future discovery ought to be volatile and quick as participants look to the nearest HVNodes for more favorable entry or exit.

POCs: Areas where two-sided trade was most prevalent in a prior day session. Participants will respond to future tests of value as they offer favorable entry and exit.

Volume-Weighted Average Prices (VWAPs): A metric highly regarded by chief investment officers, among other participants, for quality of trade. Additionally, liquidity algorithms are benchmarked and programmed to buy and sell around VWAPs.


About

The author, Renato Leonard Capelj, spends the bulk of his time at Physik Invest, an entity through which he invests and publishes free daily analyses to thousands of subscribers. The analyses offer him and his subscribers a way to stay on the right side of the market. 

Separately, Capelj is an accredited journalist with past works including interviews with investor Kevin O’Leary, ARK Invest’s Catherine Wood, FTX’s Sam Bankman-Fried, North Dakota Governor Doug Burgum, Lithuania’s Minister of Economy and Innovation Aušrinė Armonaitė, former Cisco chairman and CEO John Chambers, and persons at the Clinton Global Initiative.

Connect

Direct queries to renato@physikinvest.com. Find Physik Invest on TwitterLinkedInFacebook, and Instagram. Find Capelj on TwitterLinkedIn, and Instagram. Only follow the verified profiles.

Calendar

You may view this letter’s content calendar at this link.

Disclaimer

Do not construe this newsletter as advice. All content is for informational purposes. Capelj and Physik Invest manage their own capital and will not solicit others for it.

Categories
Commentary

Daily Brief For February 22, 2023

Physik Invest’s Daily Brief is read free by thousands of subscribers. Join this community to learn about the fundamental and technical drivers of markets.

Graphic updated 7:15 AM ET. Sentiment Neutral if expected /MES open is inside of the prior day’s range. /MES levels are derived from the profile graphic at the bottom of this letter. Click here for the latest levels. SqueezeMetrics Dark Pool Index (DIX) and Gamma (GEX) with the latter calculated based on where the prior day’s reading falls with respect to the MAX and MIN of all occurrences available. A higher DIX is bullish. The lower the GEX, the more (expected) volatility. Click to learn the implications of volatility, direction, and moneyness. Breadth reflects a reading of the prior day’s NYSE Advance/Decline indicator. The CBOE VIX Volatility Index (INDEX: VVIX) reflects the attractiveness of owning volatility. UMBS prices via MNDClick here for the economic calendar.

Fundamental

We look beyond all the doom-and-gloom narrative to the bond-equity divergence which JPMorgan Chase & Co’s (NYSE: JPM) Marko Kolanovic wrote about recently.

Essentially, regressions suggest the move in interest rates since the Federal Reserve’s (Fed) meeting earlier this month should have resulted in a 5-10% sell-off in the rate-sensitive Nasdaq. It didn’t. Per Kolanovic, “this divergence cannot go much further.”

Recall interest rates matter to discounted future cash flows. The higher rates are the, worse that is for equities, says Damped Spring’s Andy Constan well in an interview. 

Interest rates matter elsewhere as well. When interest rates increase, “a mortgage goes down in price by a greater amount than the bond because the expected maturity of the mortgage becomes longer. The magnitude of this unbalanced price volatility characteristic is measured by a financial statistic called ‘convexity.’” Managing this convexity can be problematic and force feedback loops, just as we talk about with options per the below. See here for more.

Graphic: The “Biggest tail risk to SPX isn’t any macro data/virus/war but its own options market.”

Kolanvoic ends: The “risk-reward of holding bonds at this level of short-term yields looks better than equity (earnings yield) than any time since the great financial crisis (i.e., the spread between 2y and equity earnings yield is at the lowest point since 2007).”

Graphic: Retrieved from JPMorgan Chase & Co (NYSE: JPM).

Positioning

This letter said there would be movement after last week’s options expirations (OpEx). 

To quote the February 15 letter, ignoring the “excellent” liquidity and traders buying S&P 500 (INDEX: SPX) “hand over fist,” OpEx would result in a decline in counterparty exposure to positive gamma (i.e., positive exposure to movement). Support from an options positioning perspective would decline, and counterparties would “do less to disrupt and more to bolster movement.”

That’s along the lines of what’s happening, though the movement appears orderly.

Per SpotGamma, “The selling appears contained, as evidenced by an upward trending [implied volatility or IVOL] term structure and light bid in topline measures of [IVOL] like the [Cboe Volatility Index (INDEX: VIX)].” Notwithstanding this light bid at the front of the term structure, there is no rush to protect, as would be evidenced by longer-dated IVOL shifting “materially higher as traders reset to lower equity valuations.”

Graphic: Retrieved from SpotGamma. “SPX term structure today vs 2/13 (day prior to CPI). Traders had higher vol expectations for CPI vs today’s FOMC minutes, but [the] term structure is now more elevated. Makes sense as SPX [is] -3% lower. However, the loss of stabilizing OPEX positioning, elevated IV, & flat gamma may lead to higher relative vol today.”

With there being many options positions concentrated near the $4,000.00 SPX area, markets may be at risk of accelerated selling. Below $4,000.00 traders desire to own predominantly puts, and this leaves counterparties “short puts and [] positive delta, as well as negative gamma and vega, meaning they lose money in an increasing way as the market trades lower and volatility increases.” To hedge, counterparties could sell futures or stocks into the decline. This accelerates selling.

Graphic: Retrieved from SpotGamma.

So, with a break of that big $4,000.00 level increasing risk that selling accelerates, the desire to protect will bid IVOL and the marginal impact of its expansion can do more damage than good that any marginal compression can do.

Graphic: Retrieved from SpotGamma. “IV has now compressed to levels associated with recent market tops. If realized vol (RV) declined, then IV could go lower. But, realized isn’t declining.”

In light of this, your letter writer leans negative delta, as well as positive gamma and vega. If the market trades lower, such a setup would make money in short.

Technical

As of 7:15 AM ET, Wednesday’s regular session (9:30 AM – 4:00 PM ET), in the S&P 500, is likely to open in the middle part of a negatively skewed overnight inventory, inside of the prior day’s range, suggesting a limited potential for immediate directional opportunity.

The S&P 500 pivot for today is $3,998.25. 

Key levels to the upside include $4,015.75, $4,034.75, and $4,052.25.

Key levels to the downside include $3,981.00, $3,965.25, and $3,949.00.

Disclaimer: Click here to load the updated key levels via the web-based TradingView platform. New links are produced daily. Quoted levels likely hold barring an exogenous development.

Graphic: 65-minute profile chart of the Micro E-mini S&P 500 Futures.

Definitions

Volume Areas: Markets will build on areas of high-volume (HVNodes). Should the market trend for a period of time, this will be identified by a low-volume area (LVNodes). The LVNodes denote directional conviction and ought to offer support on any test.

If participants auction and find acceptance in an area of a prior LVNode, then future discovery ought to be volatile and quick as participants look to the nearest HVNodes for more favorable entry or exit.

Gamma: The sensitivity of an option’s Delta to changes in the underlying asset’s price.

CPOCs: Denote areas where two-sided trade was most prevalent over all sessions. Participants will respond to future tests of value as they offer favorable entry and exit.

POCs: Areas where two-sided trade was most prevalent in a prior day session. Participants will respond to future tests of value as they offer favorable entry and exit.

MCPOCs: Denote areas where two-sided trade was most prevalent over numerous sessions. Participants will respond to future tests of value as they offer favorable entry and exit.

Inversion Of VIX Futures Term Structure: Longer-dated VIX expiries are less expensive; is a warning of elevated near-term risks for equity market stability.


About

The author, Renato Leonard Capelj, works in finance and journalism.

Capelj spends the bulk of his time at Physik Invest, an entity through which he invests and publishes free daily analyses to thousands of subscribers. The analyses offer him and his subscribers a way to stay on the right side of the market. Separately, Capelj is an options analyst at SpotGamma and an accredited journalist.

Capelj’s past works include conversations with investor Kevin O’Leary, ARK Invest’s Catherine Wood, FTX’s Sam Bankman-Fried, North Dakota Governor Doug Burgum, Lithuania’s Minister of Economy and Innovation Aušrinė Armonaitė, former Cisco chairman and CEO John Chambers, and persons at the Clinton Global Initiative.

Connect

Direct queries to renato@physikinvest.com. Find Physik Invest on TwitterLinkedInFacebook, and Instagram. Find Capelj on TwitterLinkedIn, and Instagram. Only follow the verified profiles.

Calendar

You may view this letter’s content calendar at this link.

Disclaimer

Do not construe this newsletter as advice. All content is for informational purposes. Capelj and Physik Invest manage their own capital and will not solicit others for it.

Categories
Commentary

Daily Brief For February 15, 2023

Physik Invest’s Daily Brief is read by thousands of subscribers. You, too, can join this community to learn about the fundamental and technical drivers of markets.

Graphic updated 8:30 AM ET. Sentiment Neutral if expected /ES open is inside of the prior day’s range. /ES levels are derived from the profile graphic at the bottom of this letter. Click here for the latest levels. SqueezeMetrics Dark Pool Index (DIX) and Gamma (GEX) with the latter calculated based on where the prior day’s reading falls with respect to the MAX and MIN of all occurrences available. A higher DIX is bullish. At the same time, the lower the GEX, the more (expected) volatility. Click to learn the implications of volatility, direction, and moneyness. Breadth reflects a reading of the prior day’s NYSE Advance/Decline indicator. The CBOE VIX Volatility Index (INDEX: VVIX) reflects the attractiveness of owning volatility. UMBS price via MNDClick here for the calendar.

Fundamental

Consumer price updates (CPI) have traders pricing (even) higher rates for longer.

Yesterday’s data showed goods deflation is underway while services inflation persists. Per Unlimited’s Bob Elliott, “the picture of inflation for the Fed today is considerably less sanguine than at the last meeting.”

Graphic: Retrieved from @VincentDeluard. “The most important indices are the prices of wage-intensive services: haircuts, childcare, dentists, lawyers. With the exception of garages (crazy inflation), they all converge towards  6.5 – 7% YoY and 0.4%-0.5% MoM. That is the true long-term inflation.”

This new data confirms the hawkishness expressed by the Federal Reserve’s (Fed) Jerome Powell last week. US Treasury interest rates shifted higher, accordingly.

Graphic: Retrieved from ustreasuryyieldcurve.com.

CME Group Inc’s (NASDAQ: CME) FedWatch Tool places the terminal rate at 5.25-5.50%, up from 5.00-5.25% on Tuesday before the CPI release. Easing is set to happen this year still in the November-December timeframe.

Graphic: Retrieved from CME Group Inc’s (NASDAQ: CME) website.

Recall “a higher interest rate environment implies a more potent” monetary tightening and heavier flow of capital out of capital markets (i.e., quantitative tightening or QT), to quote former Fed trader Joseph Wang.

The pressure from the sale of assets (e.g., USTs, MBSs) will increase interest rates and move yield-seeking market participants out of risk, hence the expectation that pressure persists on equities in 2023

Graphic: Retrieved from TS Lombard. “Without a recession, the disinflation from the 2021 slowdown ends sometime soon, setting up for a re-acceleration later this year. Not to 8%, but high enough for the Fed to rue its choice of slowing rate hikes when it did.”

In other words, processes like QT manifest themselves as less demand for assets. Per Fabian Wintersberger, central bankers must “recycle bonds into the markets on an unprecedented scale, which could easily lead to lower bond prices/higher yields” causing a “reflux of capital to safe-haven assets, like treasuries.” 

Graphic: Retrieved from Fidelity Investments. “The recent rally in stocks deviated from liquidity conditions, which have held steady but have not improved. This is just one reason to question whether there is an adequate foundation to support a new bull market.”

You can produce the above chart yourself. Fed Balance Sheet data, here. Treasury General Account Data, here. Reverse Repo data, here. NL = BS – TGA – RRP.

Moreover, the above chart which this letter has produced for you in the past and some would say is naive, shows so-called net liquidity.

But, according to Morgan Stanley (NYSE: MS), the correlation between net liquidity and the S&P 500 (INDEX: SPX), over the past ten years is about ~0.70 and explains more than half of the movement in price-earings multiples over the past decade. 

Graphic: Retrieved from Bloomberg.

Positioning

After CPI, there was short-lived relief, as this letter expected. Following CPI, weakness surfaced and measures of traders’ activity in options markets showed a bearish tilt.

Big trades that fired off include the purchase of put options expiring in March on the S&P 500 and call options expiring in May on the Cboe Volatility Index (INDEX: VIX).

The net effect is pressure on the indexes that remain well-supported and compressed heading into big options expirations (OpEx) this week, after which the door may open to enable them to move freely and in sync with their constituents, some of which, like Alphabet Inc (NASDAQ: GOOGL) (NASDAQ: GOOG), are trading rather weak. 

Graphic: Retrieved from Tier1Alpha. “With implied correlation having fallen back to levels not seen since 2021, it’s notable that realized comovement shows no such improvement and instead sits near record highs. Whether this presages a violent snapback is unknowable, but certainly the conditions are in place.”

To explain, after OpEx, counterparty exposure to positive gamma (i.e., positive exposure to movement hedged in a way that reduces movement) will decline and “leave markets more at the whim of macro-type repositioning”; counterparties will do less to disrupt and more to bolster (i.e., add to movement). For how to trade (or how these events impact trades), see this case study by Physik Invest.

Should there be a large break lower, then “convexity could become an issue,” The Market Ear explained in a statement quoting Goldman Sachs Group Inc (NYSE: GS). “Inflecting CTA flow could translate to an approximately 20% sell-off in US equities over a month in a down-tape scenario.”

Graphic: Retrieved from Goldman Sachs Group Inc (NYSE: GS).

Technical

As of 7:30 AM ET, Wednesday’s regular session (9:30 AM – 4:00 PM ET), in the S&P 500, is likely to open in the lower part of a negatively skewed overnight inventory, inside of the prior day’s range, suggesting a limited potential for immediate directional opportunity.

The S&P 500 pivot for today is $4,136.25. 

Key levels to the upside include $4,147.00, $4,159.00, and $4,168.75.

Key levels to the downside include $4,122.75, $4,104.25, and $4,083.75.

Disclaimer: Click here to load the updated key levels via the web-based TradingView platform. New links are produced daily. Quoted levels likely hold barring an exogenous development.

Graphic: 65-minute profile chart of the Micro E-mini S&P 500 Futures.

Definitions

Volume Areas: Markets will build on areas of high-volume (HVNodes). Should the market trend for a period of time, this will be identified by a low-volume area (LVNodes). The LVNodes denote directional conviction and ought to offer support on any test.

If participants auction and find acceptance in an area of a prior LVNode, then future discovery ought to be volatile and quick as participants look to the nearest HVNodes for more favorable entry or exit.

POCs: Areas where two-sided trade was most prevalent in a prior day session. Participants will respond to future tests of value as they offer favorable entry and exit.


About

The author, Renato Leonard Capelj, works in finance and journalism.

Capelj spends the bulk of his time at Physik Invest, an entity through which he invests and publishes free daily analyses to thousands of subscribers. The analyses offer him and his subscribers a way to stay on the right side of the market. Separately, Capelj is an options analyst at SpotGamma and an accredited journalist.

Capelj’s past works include conversations with investor Kevin O’Leary, ARK Invest’s Catherine Wood, FTX’s Sam Bankman-Fried, Lithuania’s Minister of Economy and Innovation Aušrinė Armonaitė, former Cisco chairman and CEO John Chambers, and persons at the Clinton Global Initiative.

Connect

Direct queries to renato@physikinvest.com or find Physik Invest on TwitterLinkedInFacebook, and Instagram.

Calendar

You may view this letter’s content calendar at this link.

Disclaimer

Do not construe this newsletter as advice. All content is for informational purposes.

Categories
Commentary

Daily Brief For February 13, 2023

Physik Invest’s Daily Brief is read by thousands of subscribers. You, too, can join this community to learn about the fundamental and technical drivers of markets.

Graphic updated 7:50 AM ET. Sentiment Risk-On if expected /ES open is above the prior day’s range. /ES levels are derived from the profile graphic at the bottom of this letter. Click here for the latest levels. SqueezeMetrics Dark Pool Index (DIX) and Gamma (GEX) with the latter calculated based on where the prior day’s reading falls with respect to the MAX and MIN of all occurrences available. A higher DIX is bullish. The lower the GEX, the more (expected) volatility. Click for the implications of volatility, direction, and moneyness. Breadth reflects a reading of the prior day’s NYSE Advance/Decline indicator. The CBOE VIX Volatility Index (INDEX: VVIX) reflects the attractiveness of owning volatility. UMBS price via MNDClick here for the calendar.

Administrative

Improving the dashboard, above, per subscribers’ requests. The newest addition is the price of the 30-year Uniform Mortgage-Backed Security (UMBS); the trading of MBSs moves mortgage rates.

If any recommendations on what you would like to see in the above dashboard, please comment below. Have a great day!

Fundamental

This a brief letter while, in the background, your letter writer works on something substantial to provide you in the coming days.

In the meantime, let’s look past the doom and gloom. In short, this week is set to be pivotal, particularly a day or two after the release of consumer price updates. In the meantime, there will be breaks that are likely to fail. Caution on commitment.

Technical

As of 7:20 AM ET, Monday’s regular session (9:30 AM – 4:00 PM ET), in the S&P 500, is likely to open in the upper part of a negatively skewed overnight inventory, outside of the prior day’s, suggesting a potential for immediate directional opportunity.

The S&P 500 pivot for today is $4,100.25. 

Key levels to the upside include $4,123.25, $4,136.25, and $4,153.25.

Key levels to the downside include $4,083.75, $4,071.75, and $4,052.25.

Disclaimer: Click here to load the updated key levels via the web-based TradingView platform. New links are produced daily. Quoted levels likely hold barring an exogenous development.

Graphic: 65-minute profile chart of the Micro E-mini S&P 500 Futures.

Definitions

Volume Areas: Markets will build on areas of high-volume (HVNodes). Should the market trend for a period of time, this will be identified by a low-volume area (LVNodes). The LVNodes denote directional conviction and ought to offer support on any test.

If participants auction and find acceptance in an area of a prior LVNode, then future discovery ought to be volatile and quick as participants look to the nearest HVNodes for more favorable entry or exit.


About

The author, Renato Leonard Capelj, works in finance and journalism.

Capelj spends the bulk of his time at Physik Invest, an entity through which he invests and publishes free daily analyses to thousands of subscribers. The analyses offer him and his subscribers a way to stay on the right side of the market. Separately, Capelj is an options analyst at SpotGamma and an accredited journalist.

Capelj’s past works include conversations with investor Kevin O’Leary, ARK Invest’s Catherine Wood, FTX’s Sam Bankman-Fried, Lithuania’s Minister of Economy and Innovation Aušrinė Armonaitė, former Cisco chairman and CEO John Chambers, and persons at the Clinton Global Initiative.

Connect

Direct queries to renato@physikinvest.com or find Physik Invest on TwitterLinkedInFacebook, and Instagram.

Calendar

You may view this letter’s content calendar at this link.

Disclaimer

Do not construe this newsletter as advice. All content is for informational purposes.

Categories
Commentary

Daily Brief For October 5, 2022

The daily brief is a free glimpse into the prevailing fundamental and technical drivers of U.S. equity market products. Join the 1000+ that read this report daily, below!

Graphic updated 6:45 AM ET. Sentiment Neutral if expected /ES open is inside of the prior day’s range. /ES levels are derived from the profile graphic at the bottom of the following section. Levels may have changed since initially quoted; click here for the latest levels. SqueezeMetrics Dark Pool Index (DIX) and Gamma (GEX) calculations are based on where the prior day’s reading falls with respect to the MAX and MIN of all occurrences available. A higher DIX is bullish. At the same time, the lower the GEX, the more (expected) volatility. Learn the implications of volatility, direction, and moneyness. Breadth reflects a reading of the prior day’s NYSE Advance/Decline indicator. VIX reflects a current reading of the CBOE Volatility Index (INDEX: VIX) from 0-100.

Administrative

Expect no letter on Friday, October 7, 2022.

Fundamental

Markets printed lower, this morning, ahead of the US cash-open. This bonds, commodities, and equities down phenomenon we’ve unpacked in detail many times before. 

At its core, supply chokepoints and a hot labor market are keeping inflation high and sticky. To lessen this inflation, policymakers are seeking to tighten monetary policy. 

That means raising interest rates and quantitative tightening (QT). 

As we discussed on September 20, the transmission mechanisms of these drivers vary with QT having a very weak transmission “to economic activity but very strong to financial markets.” On the other end are rates that have a stronger transmission to economic activity.

And so, on “the incremental effects on liquidity” these drivers pose, markets are trading more in sync; on the way up, through fiscal stimuli, interest rate decreases, and QE (i.e., buying of US Treasuries and mortgage securities), investors sought more yield elsewhere. 

Risk assets like stocks, crypto, and beyond thus enjoyed a boost.

In a way, the opposite is happening now, and selling across risk -on and -off assets is persistent. 

Liquidity measures (which we began unpacking months ago, and were covered in Bloomberg by Kevin Muir of TheMacroTourist.com, recently, too) show a near-lockstep decline in the S&P 500 (INDEX: SPX). Please check out Kevin Muir’s Substack, too!

Net liquidity (NL) we calculate by taking the size of the Fed’s balance sheet (BS) and subtracting both the amounts in the reverse repo operation (RRP) and Treasury General Account (TGA).

Muir said that “the liquidity created from QE and fiscal stimulus was so great that commercial banks no longer wanted deposits from large institutional clients because there were not enough safe assets available to purchase.” 

This prompted the expansion of RRP (beyond primary dealers to include the mutual funds and non-traditional accounts), a liquidity-draining operation (cash in the system removed through an increase in the number of bonds), through which the Fed would deliver “high-quality collateral with the promise to buy it back in a certain number of days at a higher price,” Muir explained.

Graphic: Retrieved from Bloomberg.

Other NL drivers include the TGA which, prior to Covid, was fairly well-balanced by taxes (i.e., money coming in) and the issue of fixed-income securities (i.e., money coming out). 

Post-Covid, the TGA increased a lot and this has “the same effect as QT … [as] bonds are issued and cash [is] withdrawn from the financial system, but the money is not distributed into the economy,” Muir elaborated.

Graphic: Retrieved from Bloomberg.

Combining the moves of the RRP and TGA, with the BS, provides us a measure of NL (shown below) that well explains stock price movements, as we’ve put forth in letters before.

Graphic: Via Physik Invest. Data compiled by @jkonopas623. Fed Balance Sheet data, here. Treasury General Account Data, here. Reverse Repo data, here. NL = BS – TGA – RRP.

And, despite the far-spreading risk-on and -off context (i.e., stocks, crypto, and bonds down), it is believed that the large amounts in liquidity-draining operations (RRP and TGA), the impacts of QT, from hereon, may be lessened; per Muir, “[i]f the Fed had securities on its balance sheet that matched the maturity profile demanded by the institutions engaging in reverse repos, it could sell an amount equal to the total reverse repo balance to these institutions, reducing the need for reverse repos and elicit no change in the financial or real economy.”

“On top of that, the actual amount of monthly QT [$95 billion per month] is not that large,” Muir added. That’s because, over the span of five months, into the end of 2021 and the beginning of 2022, the TGA was up $816 billion. This equates to ~$163.2 or so billion per month of QT.

At the end of the day, though, the programs outlined above do less to provide market support. One can argue that the market has priced the programs and some economic slowing. It is not likely the market has priced the impacts of a sharply slowing economy and business.

That said, some data – less corporate profits falling out of bed – suggests “the stock market tends to do better when EPS growth rates are negative than when they are hugely positive.”

Graphic: Retrieved from Ned Davis Research via MarketWatch. “[A]n inverse relationship between earnings growth rates and the market’s average return.”

The key to explaining this is to remember markets are a forward-looking mechanism. 

“By the time earnings growth rates are extremely high–as they were late last year and early this–they have long since been reflected in stock prices.”

“During such periods, the market has instead shifted its focus to earnings several quarters hence—to factors such as the Fed having to put the brakes on an overheating economy.”

The reverse will happen when the year-over-year growth rate in trailing fourth-quarter EPS is negative; “investors will have shifted their focus to earnings’ likely imminent rebound.”

Positioning

Pending is a final resolution “tied to the incremental effects on liquidity,” (e.g., QT manifesting itself as “$4.5 billion less in demand for assets per day,” and buyback blackout).

Graphic: Retrieved from Barclays PLC (NYSE: BCS) via The Market Ear.

This is all the while options repositioning may actually make the case for increased fragility, as traders’ falling demand for put protection opens the door to less supportive hedging flows and more impact from macro-type flows (talked about above) if we will.

Graphic: Taken from @Alpha_Ex_LLC who retrieved from Bloomberg. S&P 500 (INDEX: SPX) October put option lower in price and volatility.

The last-mentioned SpotGamma explained well: 

“As traders realize that options protection is doing little to protect them, there may be a flip; the sale of volatility, which appears to be a good trade (now), could leave markets vulnerable to an event into which traders are no longer well-hedged. Should something bad happen and traders reach for protection, that could result in limit-down type of movement.”

If unsure of what direction to participate, consider pricing some Box Spreads that offer some competitive and guaranteed interest rates, similar to those earned with Treasury bills.

Technical

As of 6:40 AM ET, Wednesday’s regular session (9:30 AM – 4:00 PM ET), in the S&P 500, is likely to open in the lower part of a negatively skewed overnight inventory, inside of prior-range and -value, suggesting a limited potential for immediate directional opportunity.

In the best case, the S&P 500 trades higher.

Any activity above the $3,771.25 HVNode puts into play the $3,826.25 HVNode. Initiative trade beyond the last-mentioned could reach as high as the $3,862.25 HVNode and $3,893.00 VPOC, or higher.

In the worst case, the S&P 500 trades lower.

Any activity below the $3,771.25 HVNode puts into play the $3,722.50 LVNode. Initiative trade beyond the LVNode could reach as low as the $3,671.00 VPOC and $3,610.75 HVNode, or lower.

Click here to load today’s key levels into the web-based TradingView charting platform. Note that all levels are derived using the 65-minute timeframe. New links are produced, daily.
Graphic: 65-minute profile chart of the Micro E-mini S&P 500 Futures.

Definitions

Volume Areas: A structurally sound market will build on areas of high volume (HVNodes). Should the market trend for long periods of time, it will lack sound structure, identified as low volume areas (LVNodes). LVNodes denote directional conviction and ought to offer support on any test. 

If participants were to auction and find acceptance into areas of prior low volume (LVNodes), then future discovery ought to be volatile and quick as participants look to HVNodes for favorable entry or exit.

POCs: POCs are valuable as they denote areas where two-sided trade was most prevalent in a prior day session. Participants will respond to future tests of value as they offer favorable entry and exit.

About

After years of self-education, strategy development, mentorship, and trial-and-error, Renato Leonard Capelj began trading full-time and founded Physik Invest to detail his methods, research, and performance in the markets.

Capelj also develops insights around impactful options market dynamics at SpotGamma and is a Benzinga reporter.

Some of his works include conversations with ARK Invest’s Catherine Wood, investors Kevin O’Leary and John Chambers, FTX’s Sam Bankman-Fried, ex-Bridgewater Associate Andy Constan, Kai Volatility’s Cem Karsan, The Ambrus Group’s Kris Sidial, among many others.

Disclaimer

In no way should the materials herein be construed as advice. Derivatives carry a substantial risk of loss. All content is for informational purposes only.

Categories
Commentary

Daily Brief For September 16, 2022

The daily brief is a free glimpse into the prevailing fundamental and technical drivers of U.S. equity market products. Join the 900+ that read this report daily, below!

Graphic updated 6:50 AM ET. Sentiment Risk-Off if expected /ES open is below the prior day’s range. /ES levels are derived from the profile graphic at the bottom of the following section. Levels may have changed since initially quoted; click here for the latest levels. SqueezeMetrics Dark Pool Index (DIX) and Gamma (GEX) calculations are based on where the prior day’s reading falls with respect to the MAX and MIN of all occurrences available. A higher DIX is bullish. At the same time, the lower the GEX, the more (expected) volatility. Learn the implications of volatility, direction, and moneyness. Breadth reflects a reading of the prior day’s NYSE Advance/Decline indicator. VIX reflects a current reading of the CBOE Volatility Index (INDEX: VIX) from 0-100.

Administrative

A longer note so stick with me!

Updates are pending for the above dashboard. Exciting! Beyond this, the newsletter is getting a revamp in other parts. If you have any feedback on what should be changed, please comment!

Also, I am going to refer everyone to a conversation between Joseph Wang and Andy Constan, as well as some updates Cem Karsan of Kai Volatility made (HERE and HERE). That is, in part, a primer for what we will be talking more about, soon.

Fundamental

Talked about yesterday was the prospects of contractionary monetary policy reducing inflation and growth. BlackRock Inc (NYSE: BLK) strategists, even, put forth that a “deep recession” is needed to stem inflation. In short, “there is no way around this,” they claim.

Graphic: Retrieved from The Market Ear. FedEx Corporation (NYSE: FDX) sold 20% on warning about the global economy.

From thereon, we talked about how rates rising would “bring private sector credit growth down,” as well as “private sector spending and, hence, the economy.”

Based on where rates are at, the market may still be too expensive.

Graphic: Retrieved from Bloomberg via Michael J. Kramer. “What is amazing is how expensive this market is relative to rates. The spread between the S&P 500 Earnings yield and the 10-Yr nominal rate is at multi-year lows.”

On the other hand, some argue inflation peaks are in. ARK Invest’s Cathie Wood suggests “deflation [is] in the pipeline, heading for the PPI, CPI, PCE Deflator.” 

Tesla Inc’s (NASDAQ: TSLA) Elon Musk added that he thinks the Federal Reserve (Fed) may make a mistake noting “a major Fed rate hike risks deflation.” Musk suggested the Fed should drop 0.25%, basing his decision on non-lagging indicators, unlike the Fed.

That’s not in line with what CME Group Inc’s (NASDAQ: CME) FedWatch tool shows. Through this tool we see traders pricing an 80% chance of a 0.50-0.75% hike, all the while quantitative tightening (reducing Fed Treasuries and mortgage-backed securities holdings) accelerated on September 15. 

UST and MBS will roll off (which could turn into “outright sales”) at a pace of $95 billion per month, now, increasing competition for funding among commercial banks, and bolstering borrowing costs, as explained, below.

Graphic: Via Physik Invest. Data compiled by @jkonopas623. Fed Balance Sheet data, here. Treasury General Account Data, here. Reverse Repo data, here. NL = BS – TGA – RRP.

According to Bank of America Corporation (NYSE: BAC), since 2010, nearly 50% of the moves in market price-to-earnings multiples were explained by quantitative easing (QE), the inverse of QT, through which the Fed (or central banks, in general) creates credit used to buy securities in open markets, MarketWatch explains.

Graphic: Retrieved from the Federal Reserve Bank of Richmond. “The Fed Is Shrinking Its Balance Sheet. What Does That Mean?”

The “purchases of long-dated bonds are intended to drive down yields, which is seen enhancing appetite for risk assets as investors look elsewhere for higher returns. QE creates new reserves on bank balance sheets. The added cushion gives banks, which must hold reserves in line with regulations, more room to lend or to finance trading activity by hedge funds and other financial market participants, further enhancing market liquidity.”

Graphic: Retrieved from Bank of America Corporation (NYSE: BAC) via MarketWatch.

The liability side of the Fed’s balance sheet is what “matters to financial markets.” 

Thus far, “reductions in Fed liabilities have been concentrated in the Treasury General Account, or TGA, which effectively serves as the government’s checking account” to run the day-to-day business.

Given that we’re talking about balance sheets, here, Fed liabilities must match assets. Thus, a rise in the TGA must be accompanied by a decline in bank reserves (which are liabilities to the Fed). This, as a result, decreases the room banks have to “lend or to finance trading activity by hedge funds and other financial market participants, [which] further [cuts into] market liquidity.”

With the Treasury set to increase debt issuance, boosting TGA, it will effectively take “money out of the economy and put[] it into the government’s checking account.” The linked reduction in bank deposits and reserves bolsters “repurchase agreement rates and borrowing benchmarks linked to them, like the Secured Overnight Financing Rate,” per Bloomberg.

Graphic: Retrieved from the Federal Reserve Bank of New York. “The Secured Overnight Financing Rate (SOFR) is a broad measure of the cost of borrowing cash overnight collateralized by Treasury securities.”

Adding, this may play into “an additional tightening of overall financial conditions, in addition to the increase in the main fed funds rate target that the central bank intends to continue boosting.”

This will “put more pressure on the private sector to absorb those Treasurys, which means less money to put into other assets” that may be riskier, like equities, said Aidan Garrib, the head of global macro strategy and research at Montreal-based PGM Global.

Positioning

As of 6:50 AM ET, Friday’s expected volatility, via the Cboe Volatility Index (INDEX: VIX), sits at ~1.44%. Net gamma exposures decreasing may promote generally more expansive ranges.

Graphic: Via Physik Invest. Data retrieved from SqueezeMetrics.

Given where realized (RVOL) and implied (IVOL) volatility measures are, as well as skew, it is beneficial to be a buyer of options structures.

This is as there’s been a lot of speculation, particularly on the downside (put options), setting the stage for a more volatile and fragile market environment, says Kai Volatility’s Cem Karsan.

“On the index level, people are not well hedged,” a departure from what the case was heading into and through much of 2022. It’s the case that heading into 2022, traders were well hedged. Into and through the decline, traders’ monetization of existing hedges, as well as counterparty reactions, “compressed volatility” realized across US equities, as explained on July 15, 2022.

This made for some attractive trade opportunities seen here.

Graphic: Retrieved from The Market Ear. “VIX has decoupled from cross-asset volatilities.”

Now, given that the go-to trade is to sell stock and puts, short interest has grown, as have other risks, associated with this activity; essentially people are “los[ing] faith in convexity and risk premia’s ability to work,” as a result of “poor performance of vol,” and, the reaction to their “pain and financial loss,” is setting the stage for tail risks heading into the Q1 and Q2 2023.

The sale (purchase) of the front (back) expirations will bolster market pinning; as SpotGamma puts forth, “the positive impact of put closers and rolls, as well as decay,” is easing the market drop. However, this “positioning likely compounds drops and adds to volatility,” in the future.

To quote: “Though the removal of put-heavy exposures can boost markets higher, too add, the positive impacts are dulled via the demand for put exposures at much lower prices.”

Graphic: Retrieved from SpotGamma.

These particular options, which are at much lower prices, “are far more sensitive to changes in direction and IVOL,” as I explained in a SpotGamma note. These options can go “from having very little Delta (exposure to direction) to a lot more Delta on the move lower,” quickly.

Graphic: Via Mohamed Bouzoubaa et al’s Exotic Options and Hybrids.

“If we maintain that liquidity providers are short those puts, a positive Delta trade, then those liquidity providers [will sell] futures and stock, a negative Delta trade to stay hedged.”

Graphic: Via Banco Santander SA (NYSE: SAN) research.

Technical

As of 6:50 AM ET, Friday’s regular session (9:30 AM – 4:00 PM ET), in the S&P 500, is likely to open in the lower part of a negatively skewed overnight inventory, outside of prior-range and -value, suggesting a potential for immediate directional opportunity.

In the best case, the S&P 500 trades higher.

Any activity above the $3,909.25 MCPOC puts into play the $3,935.00 VPOC. Initiative trade beyond the latter could reach as high as the $3,964.75 HVNode and $4,001.00 VPOC, or higher.

In the worst case, the S&P 500 trades lower.

Any activity below the $3,909.25 MCPOC puts into play the $3,857.25 HVNode. Initiative trade beyond the latter could reach as low as the $3,826.25 and $3,770.75 HVNodes, or lower.

Click here to load today’s key levels into the web-based TradingView charting platform. Note that all levels are derived using the 65-minute timeframe. New links are produced, daily.
Graphic: 65-minute profile chart of the Micro E-mini S&P 500 Futures.

Considerations: A feature of this 2022 down market was responsiveness near key-technical areas (that are discernable visually on a chart). This suggested to us that technically-driven traders with shorter time horizons were very active. 

Such traders often lack the wherewithal to defend retests and, additionally, the type of trade may be indicative of the other time frame participants waiting for more information to initiate trades.

That’s changing. The key levels, quoted above, are snapping far easier and are not as well respected. That means other time frame participants with wherewithal are initiating trades. 

Those are the participants you should not fade.

Definitions

Volume Areas: A structurally sound market will build on areas of high volume (HVNodes). Should the market trend for long periods of time, it will lack sound structure, identified as low volume areas (LVNodes). LVNodes denote directional conviction and ought to offer support on any test. 

If participants were to auction and find acceptance into areas of prior low volume (LVNodes), then future discovery ought to be volatile and quick as participants look to HVNodes for favorable entry or exit.

POCs: POCs are valuable as they denote areas where two-sided trade was most prevalent in a prior day session. Participants will respond to future tests of value as they offer favorable entry and exit.

MCPOCs: POCs are valuable as they denote areas where two-sided trade was most prevalent over numerous day sessions. Participants will respond to future tests of value as they offer favorable entry and exit.

Gamma: Gamma is the sensitivity of an option to changes in the underlying price. Dealers that take the other side of options trades hedge their exposure to risk by buying and selling the underlying. When dealers are short-gamma, they hedge by buying into strength and selling into weakness. When dealers are long-gamma, they hedge by selling into strength and buying into weakness. The former exacerbates volatility. The latter calms volatility.

About

After years of self-education, strategy development, mentorship, and trial-and-error, Renato Leonard Capelj began trading full-time and founded Physik Invest to detail his methods, research, and performance in the markets.

Capelj also develops insights around impactful options market dynamics at SpotGamma and is a Benzinga reporter.

Some of his works include conversations with ARK Invest’s Catherine Wood, investors Kevin O’Leary and John Chambers, FTX’s Sam Bankman-Fried, ex-Bridgewater Associate Andy Constan, Kai Volatility’s Cem Karsan, The Ambrus Group’s Kris Sidial, among many others.

Disclaimer

In no way should the materials herein be construed as advice. Derivatives carry a substantial risk of loss. All content is for informational purposes only.

Categories
Commentary

Daily Brief For June 30, 2022

The daily brief is a free glimpse into the prevailing fundamental and technical drivers of U.S. equity market products. Join the 300+ that read this report daily, below!

What Happened

Overnight, equity index and commodity futures auctioned lower while bonds, the dollar, and implied volatility metrics were bid at the tail-end of the quarterly rebalancing period.

Participants have bet on a half-point rate cut in 2023 amid heightened recession odds, all the while the projected target rate sits in the range of 2.25-2.50% for the July 27, 2022 meeting.

Pursuant to this letter’s remarks in the days prior, trades biased long volatility are performing well, particularly those structured a standard deviation and beyond prior prices. We’ll unpack why that is, today.

Ahead is data on PCE inflation, disposable income, and consumer spending, as well as jobless claims (8:30 AM ET) and Chicago PMI (9:45 AM ET).

Graphic updated 6:30 AM ET. Sentiment Risk-Off if expected /ES open is below the prior day’s range. /ES levels are derived from the profile graphic at the bottom of the following section. Levels may have changed since initially quoted; click here for the latest levels. SqueezeMetrics Dark Pool Index (DIX) and Gamma (GEX) calculations are based on where the prior day’s reading falls with respect to the MAX and MIN of all occurrences available. A higher DIX is bullish. At the same time, the lower the GEX, the more (expected) volatility. Learn the implications of volatility, direction, and moneyness. SHIFT data used for S&P 500 (INDEX: SPX) options activity. Note that options flow is sorted by the call premium spent; if more positive, then more was spent on call options. Breadth reflects a reading of the prior day’s NYSE Advance/Decline indicator. VIX reflects a current reading of the CBOE Volatility Index (INDEX: VIX) from 0-100.

What To Expect

Fundamental: Discussed in recent letters were the prospects of whether a recession would be necessary for stemming inflation.

Read: The Fed needs to remove the heat from the demand without prompting an accident among mortgage financiers.

Graphic: Via Bloomberg. “[W]hat’s happened to mortgage-backed bonds this year is a radical departure. Bloomberg’s index dates back to 1988 when the asset class was still in its infancy. This is the first time it has ever withstood a decline that stretches into double figures.”

“That’s the message the market took,” Bloomberg’s John Authers explained. “[T]he most painful surprise over the second half of this year would be for inflation to stay sticky.”

“That would quash the belief in a swift easing campaign in 2023.”

Graphic: CME Group Inc’s (NASDAQ: CME) FedWatch Tool.

Some, like the Federal Reserve’s (Fed) Loretta Mester, suggest that gone are the days to err on the side of being too accommodative.

“It also calls into question the conventional view that monetary policy should always look through supply shocks,” Mester said. “In some circumstances, such shocks could threaten the stability of inflation expectations and would require policy action.”

Graphic: Via Bloomberg. “The Richmond Fed’s survey of manufacturing isn’t generally one of the most closely monitored releases, but as this one was the worst since the Great Recession (barring only one month during the Covid shutdown), it garnered more attention than usual.”

Moreover, the Fed’s preferred inflation measure – the personal consumption expenditure deflator (PCE) – is set to update. The expectation is that core PCE drops, “thanks to base effects from last year,” bolstering the “narrative that inflation will soon be licked.”

Graphic: Via Bloomberg.

Positioning: Discussed, earlier this week, was whether it made sense to lean toward owning volatility, rather than selling it outright.

A “higher starting point” in implied volatility (IVOL), and a still-present right-tail (from the positioning for a bear market rally), made it so we could position, for less cost, in short-dated structures with asymmetric payouts, on both sides of the market.

Read: Trading Volatility, Correlation, Term Structure and Skew by Colin Bennett et al. Originally sourced via Academia.edu.

For instance, S&P 500 (INDEX: SPX) spreads +1 (near-the-money) x -2 (out-of-the-money), in excess of 200 points or so in width and up to 15 days to expiration, are performing well, today, pricing in excess of a 600% gain, only after pricing for little to no cost to enter in the days prior.

Disclaimer: Have delta in the direction you want the market to move, as well as positive gamma. In our case, we wanted negative delta (short bias) and positive gamma (profits amplified).

Graphic: Via Glyn Holton. “Positive gamma corresponds to curvature that opens upward. Negative gamma corresponds to curvature that opens downward.”

Recent market weaknesses will allow us to monetize and rotate those proceeds into speculative directional bets on the call-side, potentially. After all, the money is made in not losing it. Stay nimble. These are not trade recommendations. Be open-minded.

Graphic: Via Pat Hennessy. “[T]he performance of short-dated 1×2 put ratios in SPX this year. Despite being short the tail, the grind lower has been well captured by this trade structure.”

Technical: As of 6:30 AM ET, Thursday’s regular session (9:30 AM – 4:00 PM ET), in the S&P 500, will likely open in the lower part of a negatively skewed overnight inventory, outside of prior-range and -value, suggesting a potential for immediate directional opportunity.

In the best case, the S&P 500 trades higher; activity above the $3,770.75 HVNode puts in play the $3,793.25 Ledge. Initiative trade beyond the Ledge could reach as high as the $3,821.50 LVNode and $3,840.75 ONH, or higher.

In the worst case, the S&P 500 trades lower; activity below the $3,770.75 HVNode puts in play the $3,735.75 HVNode. Initiative trade beyond the HVNode could reach as low as the $3,722.50 LVNode and $3,696.00 LVNode, or lower.

Click here to load today’s key levels into the web-based TradingView charting platform. Note that all levels are derived using the 65-minute timeframe. New links are produced, daily.
Graphic: 65-minute profile chart of the Micro E-mini S&P 500 Futures.

Considerations: Responsiveness near key-technical areas (that are discernable visually on a chart), suggests technically-driven traders with short time horizons are very active. 

Such traders often lack the wherewithal to defend retests and, additionally, the type of trade may be indicative of the other time frame participants waiting for more information to initiate trades.

Definitions

Overnight Rally Highs (Lows): Typically, there is a low historical probability associated with overnight rally-highs (lows) ending the upside (downside) discovery process.

Volume Areas: A structurally sound market will build on areas of high volume (HVNodes). Should the market trend for long periods of time, it will lack sound structure, identified as low volume areas (LVNodes). LVNodes denote directional conviction and ought to offer support on any test. 

If participants were to auction and find acceptance into areas of prior low volume (LVNodes), then future discovery ought to be volatile and quick as participants look to HVNodes for favorable entry or exit.

About

After years of self-education, strategy development, mentorship, and trial-and-error, Renato Leonard Capelj began trading full-time and founded Physik Invest to detail his methods, research, and performance in the markets.

Capelj also develops insights around impactful options market dynamics at SpotGamma and is a Benzinga reporter.

Some of his works include conversations with ARK Invest’s Catherine Wood, investors Kevin O’Leary and John Chambers, FTX’s Sam Bankman-Fried, Kai Volatility’s Cem Karsan, The Ambrus Group’s Kris Sidial, among many others.

Disclaimer

In no way should the materials herein be construed as advice. Derivatives carry a substantial risk of loss. All content is for informational purposes only.

Categories
Commentary

Daily Brief For June 15, 2022

The daily brief is a free glimpse into the prevailing fundamental and technical drivers of U.S. equity market products. Join the 300+ that read this report daily, below!

What Happened

The calm before the storm.

Overnight, equity index futures auctioned sideways, inside of a developing balance area. The S&P 500 was glued to the area above $3,700.00.

The Treasury rout cooled. T-Note (FUTURE: /ZN) and T-Bond (FUTURE: /ZB) futures were off their lows. Per Bloomberg, the sell-off in fixed income wiped nearly $10 trillion of value in global bonds, erasing post-Pandemic gains on stimulative central bank intervention.

This letter has talked about the bonds and equities down phenomenon before. It is the shifting in priorities at the policy level – from monetary to fiscal – driving (more) positive correlations.

Abroad, the slump solicited the attention of policymakers. The European Central Bank (ECB) said it would have an emergency meeting to discuss current market conditions. Policymakers are to sign off on the reinvestment of bond purchases conducted during the pandemic.

In other news, the American Petroleum Institute issued policies to unleash American energy and fuel recovery. The U.S. rebuffed China by calling the Taiwan Strait an international waterway as CEOs urge the U.S. Congress to pass a China competition bill. More news of layoffs hit the wire also. Coinbase Global Inc (NASDAQ: COIN) will lay off 18% of its workforce, alongside many other crypto companies. 

Elsewhere, Redfin Corporation (NASDAQ: RDFN) and Compass Inc (NYSE: COMP) are laying off workers, as are automotive manufacturers.

Ahead is a packed calendar. To be released is data on retail sales, import prices, and manufacturing (8:30 AM ET). Later is data on home building and inventories (10:00 AM ET).

Key is the Federal Open Market Committee (FOMC) statement, projections, and news conference (2:00 PM ET).

Graphic updated 6:30 AM ET. Sentiment Neutral if expected /ES open is inside of the prior day’s range. /ES levels are derived from the profile graphic at the bottom of the following section. Levels may have changed since initially quoted; click here for the latest levels. SqueezeMetrics Dark Pool Index (DIX) and Gamma (GEX) calculations are based on where the prior day’s reading falls with respect to the MAX and MIN of all occurrences available. A higher DIX is bullish. At the same time, the lower the GEX, the more (expected) volatility. Learn the implications of volatility, direction, and moneyness. SHIFT data used for S&P 500 (INDEX: SPX) options activity. Note that options flow is sorted by the call premium spent; if more positive, then more was spent on call options. Breadth reflects a reading of the prior day’s NYSE Advance/Decline indicator. VIX reflects a current reading of the CBOE Volatility Index (INDEX: VIX) from 0-100.

What To Expect

Fundamental: Let’s keep it short and to the point.

As talked about, yesterday, the FOMC is expected to raise rates by 75 basis points in light of new data. Per Bloomberg, “Powell will argue that a supersized move is needed to preempt inflation expectations from unanchoring.”

Graphic: Via CME Group Inc’s (NASDAQ: CME) FedWatch Tool.

The peak in rates is somewhere in the 3.75-4.00% range out in early-to-mid 2023. Into that date range, there is a 100% the Fed will hike.

Graphic: Via Federal Home Loan Mortgage Corporation (OTC: FMCC). “The housing market is incredibly rate-sensitive, so as mortgage rates increase suddenly, demand again is pulling back.”

On the quantitative tightening (QT) side of things, which is the direct (out) flow of capital from capital markets, the Fed will stop reinvesting the proceeds of maturing Treasuries for the first time since the start of quantitative easing (QE).

Per the Financial Times, in May, FOMC members agreed to cap their monthly balance-sheet run-off at $30 billion in U.S. Treasuries (UST) and $17.5 billion for agency mortgage-backed securities (MBS). 

This will have an effect on prices “as liquidity – the ease with which investors can buy and sell assets – deteriorates as markets grapple with a larger amount of bond supply to absorb.”

Moreover, in the recent sale of bonds, liquidity was “worse than it was leading up to Lehman,” and, accordingly, this has played into repo dislocations.

“As customers sell their position to dealers, there’s limited liquidity in the off-the-run markets so the dealers short-sell currents,” Scott Skyrm of Curvature Securities says on increased buys and sells leading to more settlement activity, which plays into more fails.

“Market participants reduce their investments and leverage and go into ‘cash,’ leaving more actual cash in the repo market.”

Therefore, Treasury securities, across all tenors, have traded below the rate on overnight general collateral repurchase agreements. 

This could “be a sign of another shortage of collateral and that another systemic risk event might come up in the future,” as Fabian Wintersberger well explained in his newsletter.

Graphic: Via Fabian Wintersberger. Data from Bloomberg. 

Wintersberger adds: “All those things suggest that the storm we are currently facing in markets is just the beginning. The war in Ukraine, a rising interest rate environment, energy costs that subdue the outlook for the real economy, and finally, signals of stress in financial markets imply that there might be tough times ahead.”

Positioning: The divergence in volatility implied (IVOL) by participants’ options activity, versus that which the market realizes (RVOL) was resolved.

Graphic: Taken by Physik Invest from Interactive Brokers Group Inc (NASDAQ: IBKR).

As I wrote in my commentary for options data and analysis platform SpotGamma, yesterday, pursuant to remarks made in Physik Invest’s recent letters, volatility repriced and that was a boon for participants who bought into the implied skew convexity idea.

Graphic: Taken by Physik Invest from Interactive Brokers Group Inc (NASDAQ: IBKR).

Moreover, $3,700.00 SPX is a key level, per SpotGamma. This is because there is sizeable interest at that level expiring June 17, after FOMC. These options have little time to expiry and, thus, their gamma (options sensitivity to direction) grows rather large, at near-the-money strikes.

Graphic: Text taken from Exotic Options and Hybrids: A Guide to Structuring, Pricing and Trading. 

In theory, we see participants as owning protection against their stock exposures. Therefore, the counterparties are short puts (positive delta) and short stock or futures (negative delta).

As the time to expiry narrows, above the strike in question delta decays, and counterparts buy back their static delta hedges. 

As the time to expiry narrows, below the strike in question delta expands and counterparts sell more static delta to hedge.

Graphic: Text taken from Exotic Options and Hybrids: A Guide to Structuring, Pricing and Trading.

That means, depending on what happens with FOMC, if below $3,700.00, associated hedging, less any new reach for protection would pressure markets lower. If above $3,700.00, hedging, less any new sale of protection, would bolster markets higher.

Graphic: Taken by Physik Invest from Interactive Brokers Group Inc (NASDAQ: IBKR).

If lower, all else equal, the June 17 options expiration will coincide with the removal of the in-the-money options exposures in question. This opens a window during which markets may have less pressure to rally against.

Technical: As of 6:30 AM ET, Wednesday’s regular session (9:30 AM – 4:00 PM ET), in the S&P 500, will likely open in the lower part of a positively skewed overnight inventory, inside of prior-range and -value, suggesting a limited potential for immediate directional opportunity.

In the best case, the S&P 500 trades higher; activity above the $3,768.25 HVNode puts in play the $3,808.50 HVNode. Initiative trade beyond the $3,808.50 HVNode could reach as high as the $3,836.25 LVNode and $3,863.25 LVNode, or higher.

In the worst case, the S&P 500 trades lower; activity below the $3,768.25 HVnode puts in play the $3,727.75 HVNode. Initiative trade beyond the $3,727.75 HVNode could reach as low as the $3,688.75 and $3,664.25 HVNode, or lower.

Click here to load today’s key levels into the web-based TradingView charting platform. Note that all levels are derived using the 65-minute timeframe. New links are produced, daily.
Graphic: 65-minute profile chart of the Micro E-mini S&P 500 Futures. Updated: 6/14/2022.

Definitions

Should the market trend for long periods of time, it will lack sound structure, identified as low volume areas (LVNodes). LVNodes denote directional conviction and ought to offer support on any test. 

If participants were to auction and find acceptance into areas of prior low volume (LVNodes), then future discovery ought to be volatile and quick as participants look to HVNodes for favorable entry or exit.

Point Of Control: POCs are valuable as they denote areas where two-sided trade was most prevalent in a prior day session. Participants will respond to future tests of value as they offer favorable entry and exit.

Micro Composite Point Of Control: POCs are valuable as they denote areas where two-sided trade was most prevalent over numerous day sessions. Participants will respond to future tests of value as they offer favorable entry and exit.

Volume-Weighted Average Prices (VWAPs): A metric highly regarded by chief investment officers, among other participants, for quality of trade. Additionally, liquidity algorithms are benchmarked and programmed to buy and sell around VWAPs.

About

After years of self-education, strategy development, mentorship, and trial-and-error, Renato Leonard Capelj began trading full-time and founded Physik Invest to detail his methods, research, and performance in the markets.

Capelj also develops insights around impactful options market dynamics at SpotGamma and is a Benzinga reporter.

Some of his works include conversations with ARK Invest’s Catherine Wood, investors Kevin O’Leary and John Chambers, FTX’s Sam Bankman-Fried, Kai Volatility’s Cem Karsan, The Ambrus Group’s Kris Sidial, among many others.

Disclaimer

In no way should the materials herein be construed as advice. Derivatives carry a substantial risk of loss. All content is for informational purposes only.