Categories
Commentary

Daily Brief For October 5, 2022

The daily brief is a free glimpse into the prevailing fundamental and technical drivers of U.S. equity market products. Join the 1000+ that read this report daily, below!

Graphic updated 6:45 AM ET. Sentiment Neutral if expected /ES open is inside of the prior day’s range. /ES levels are derived from the profile graphic at the bottom of the following section. Levels may have changed since initially quoted; click here for the latest levels. SqueezeMetrics Dark Pool Index (DIX) and Gamma (GEX) calculations are based on where the prior day’s reading falls with respect to the MAX and MIN of all occurrences available. A higher DIX is bullish. At the same time, the lower the GEX, the more (expected) volatility. Learn the implications of volatility, direction, and moneyness. Breadth reflects a reading of the prior day’s NYSE Advance/Decline indicator. VIX reflects a current reading of the CBOE Volatility Index (INDEX: VIX) from 0-100.

Administrative

Expect no letter on Friday, October 7, 2022.

Fundamental

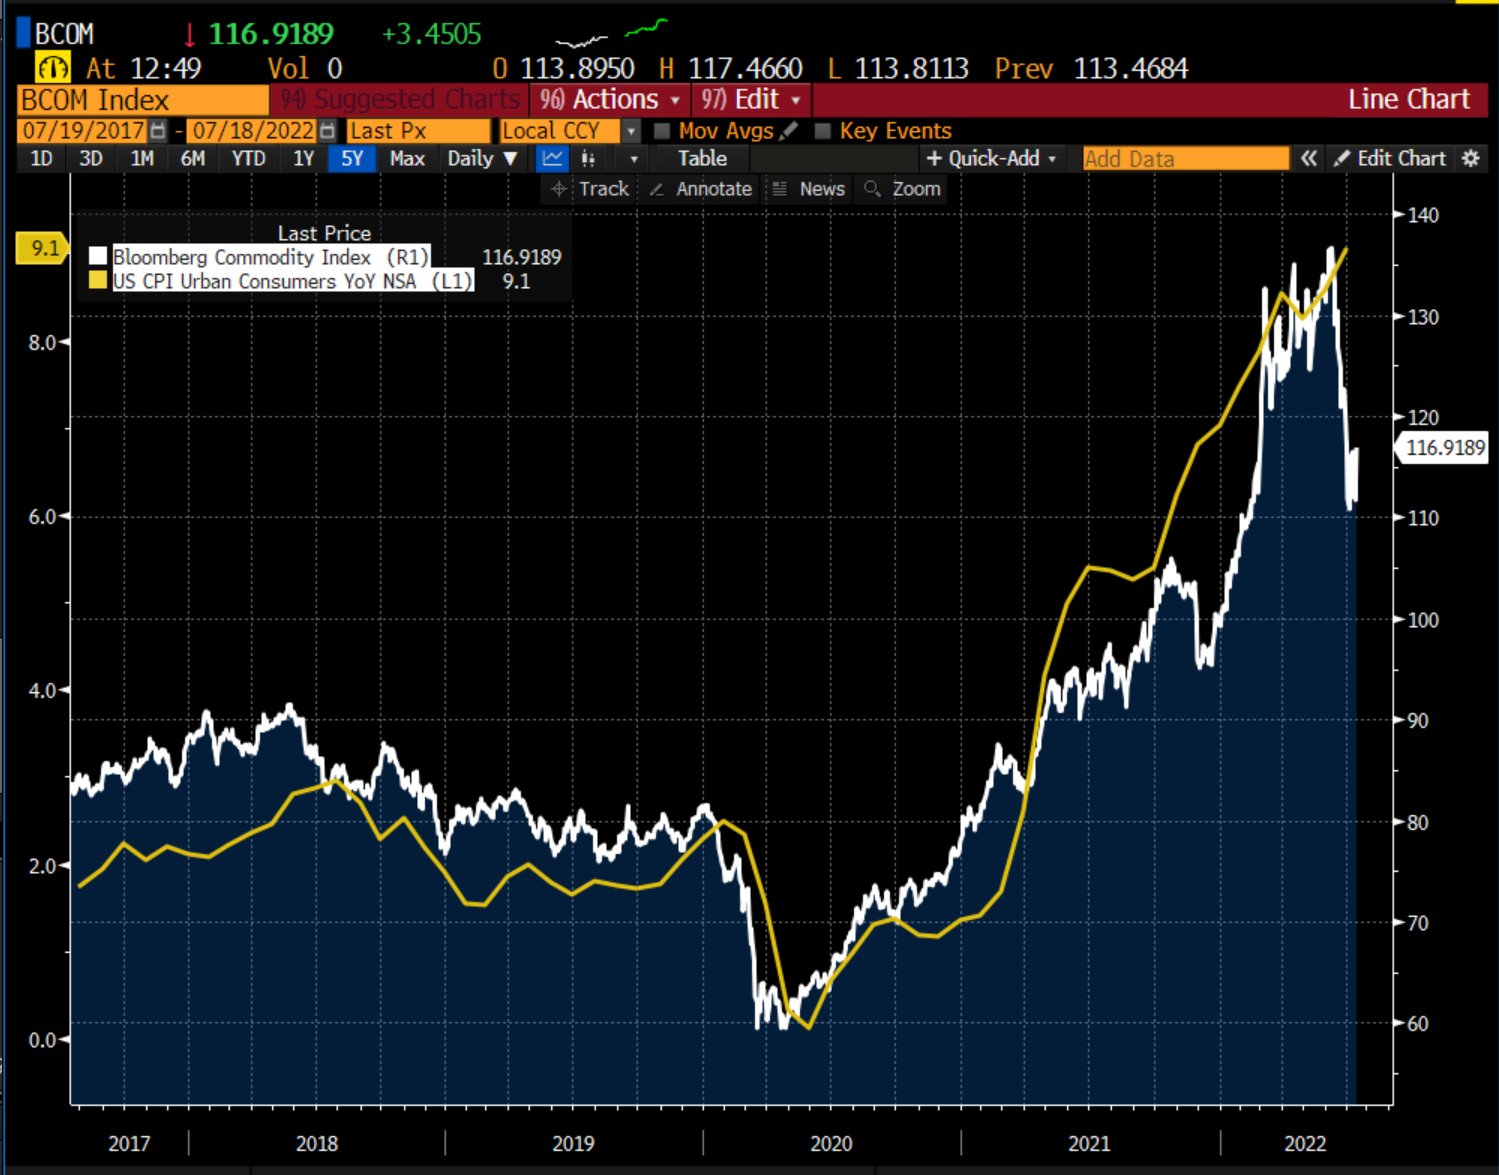
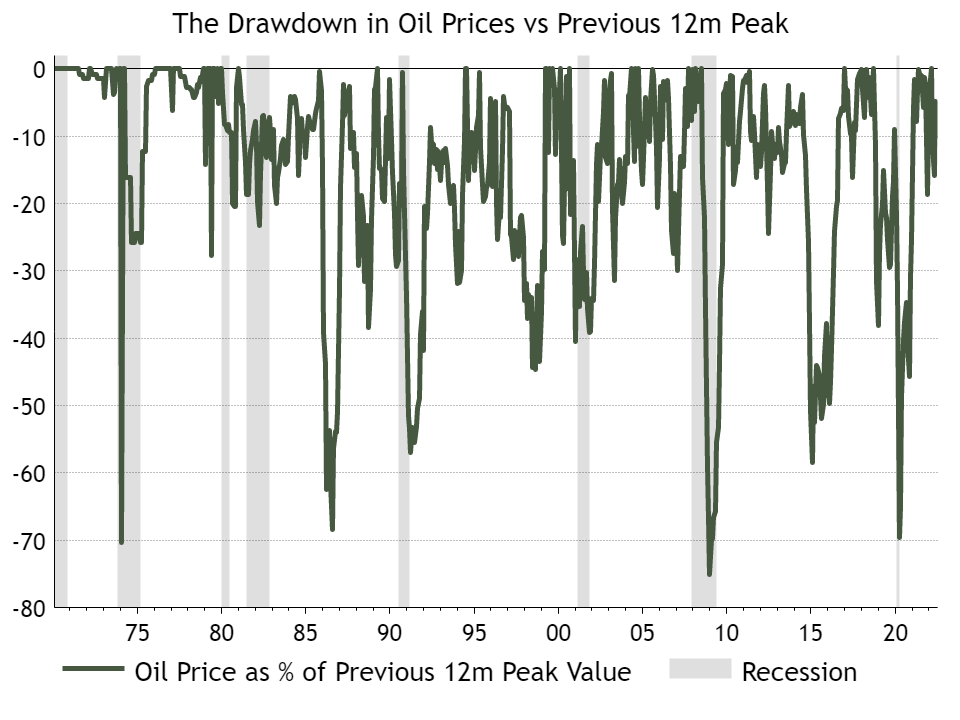
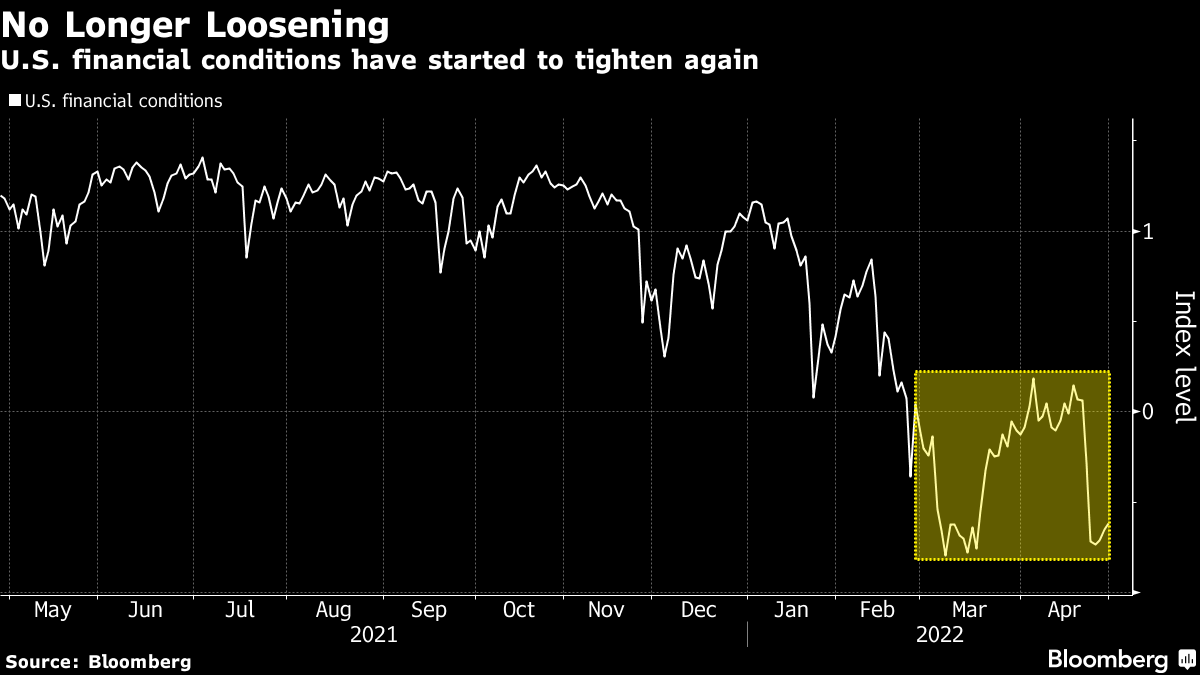
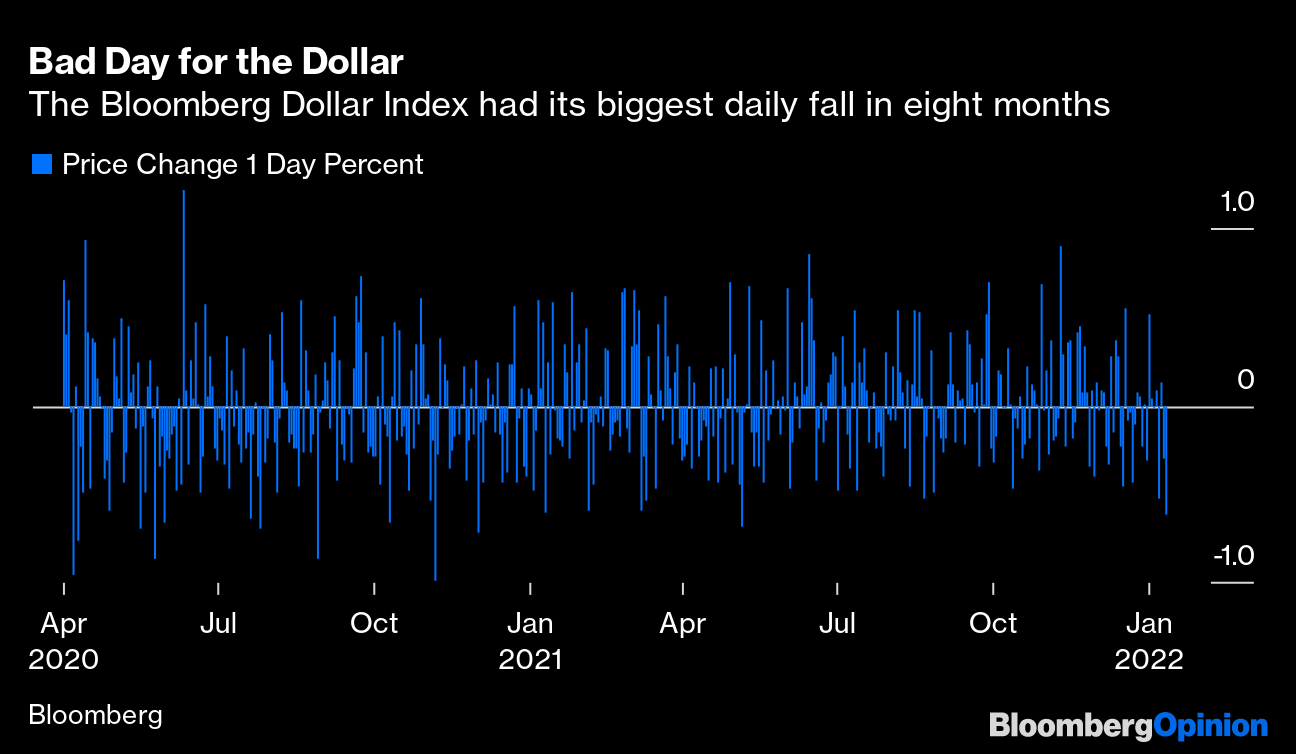
Markets printed lower, this morning, ahead of the US cash-open. This bonds, commodities, and equities down phenomenon we’ve unpacked in detail many times before. 

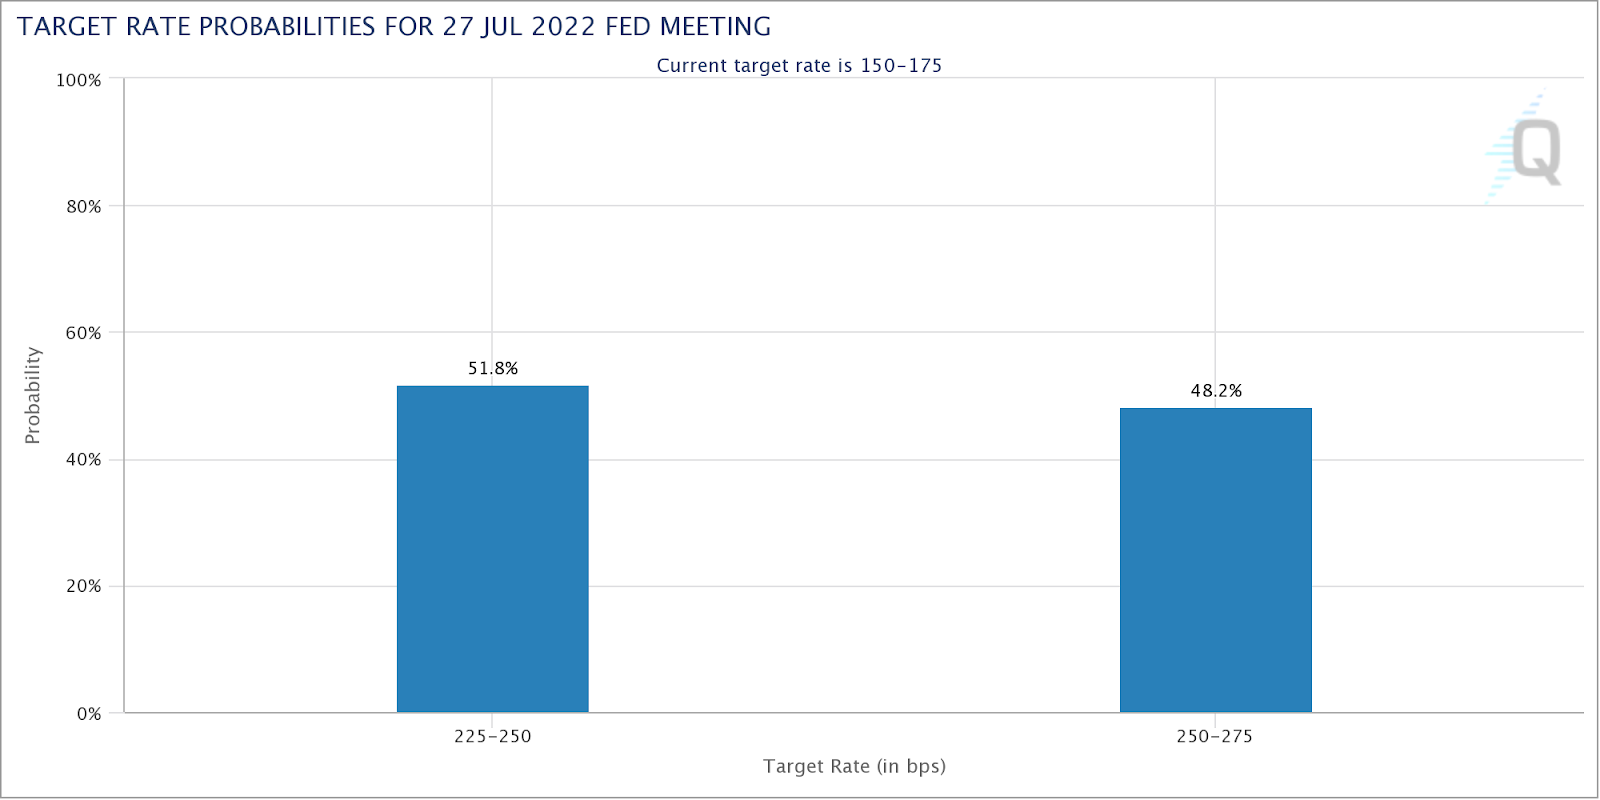
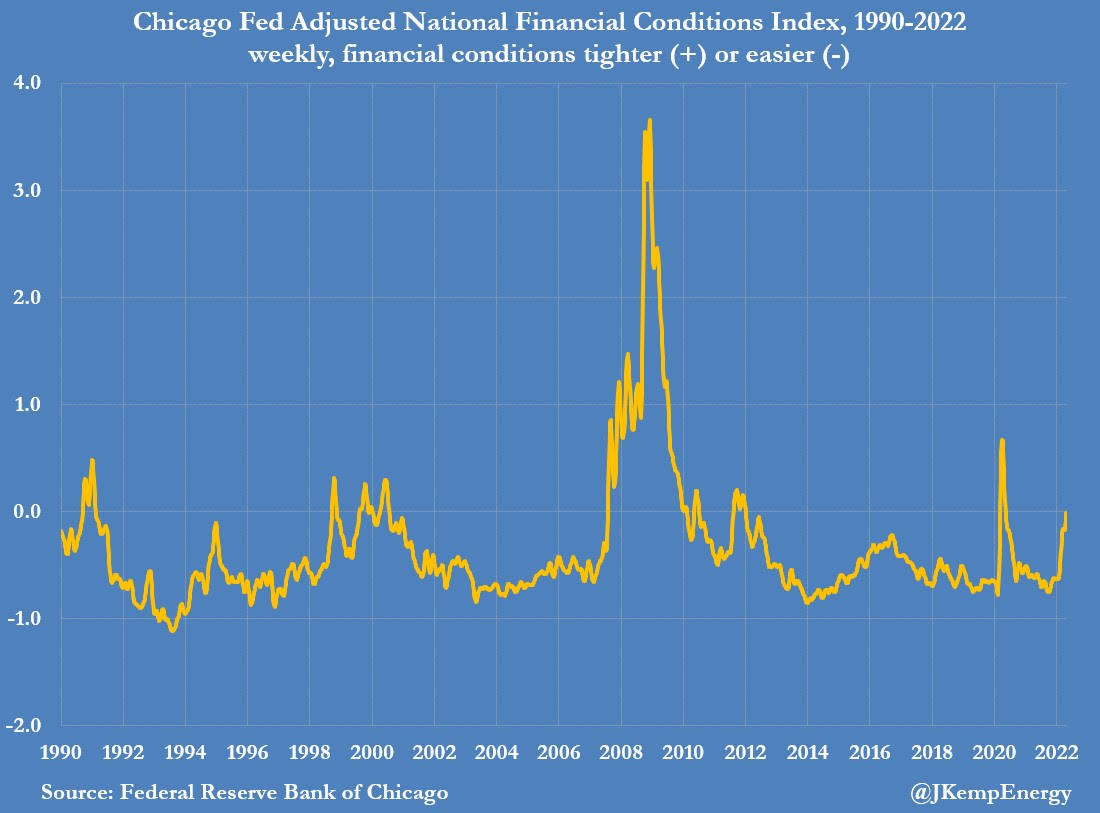
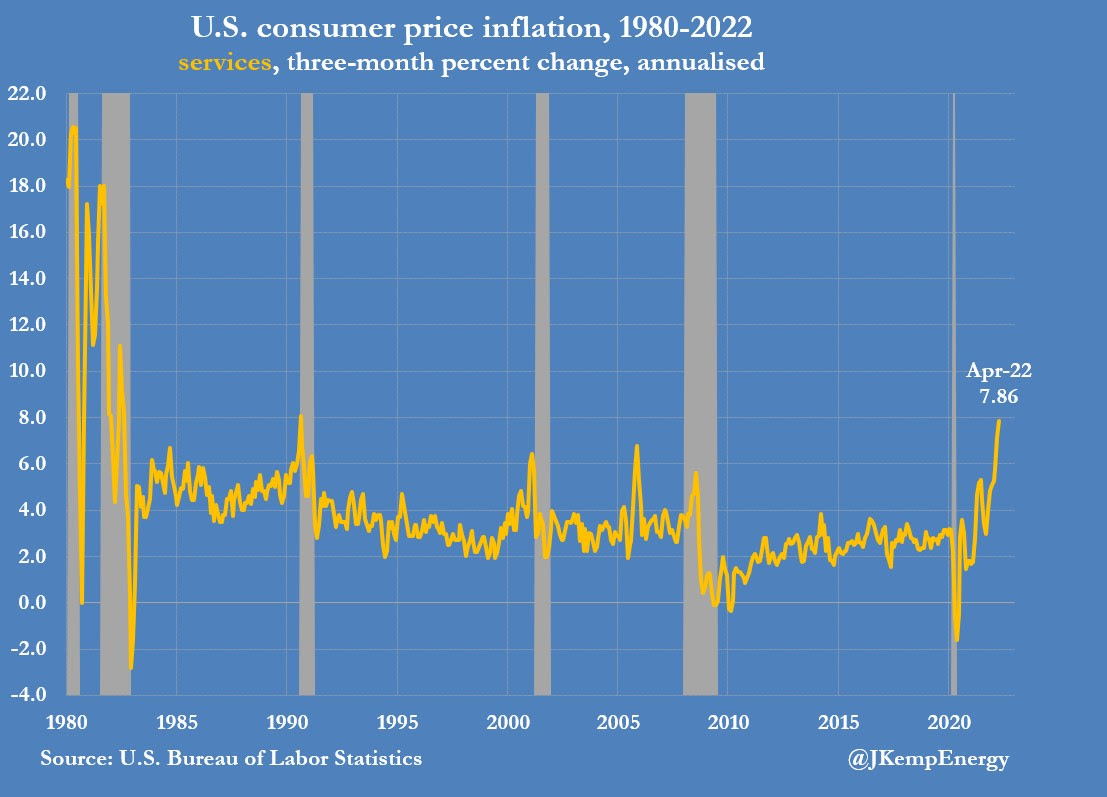
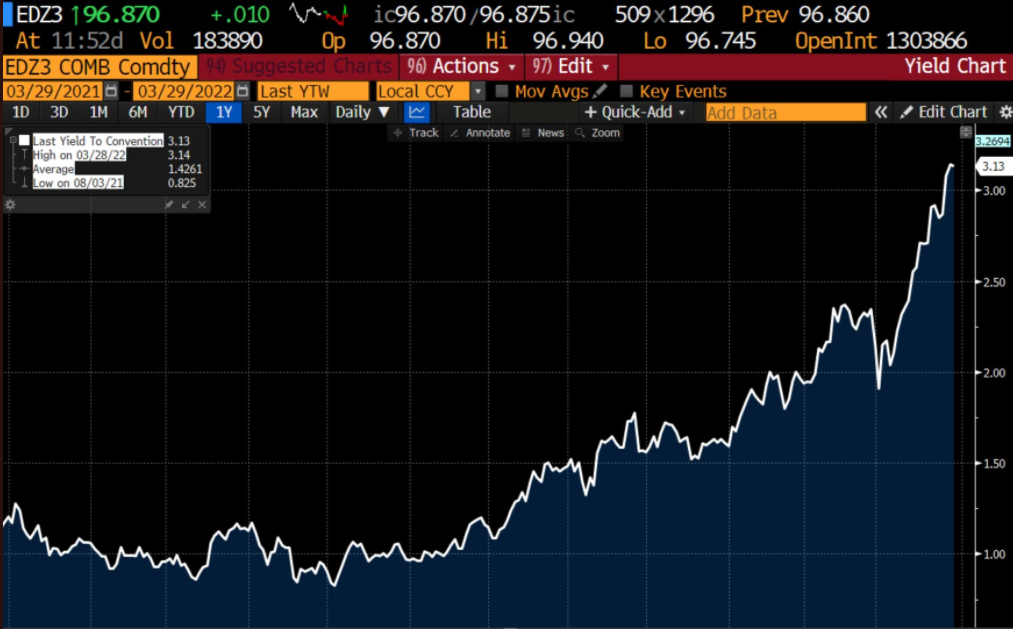
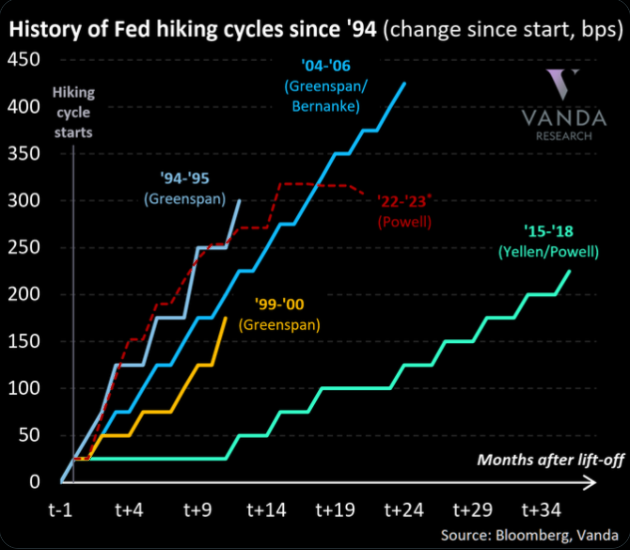
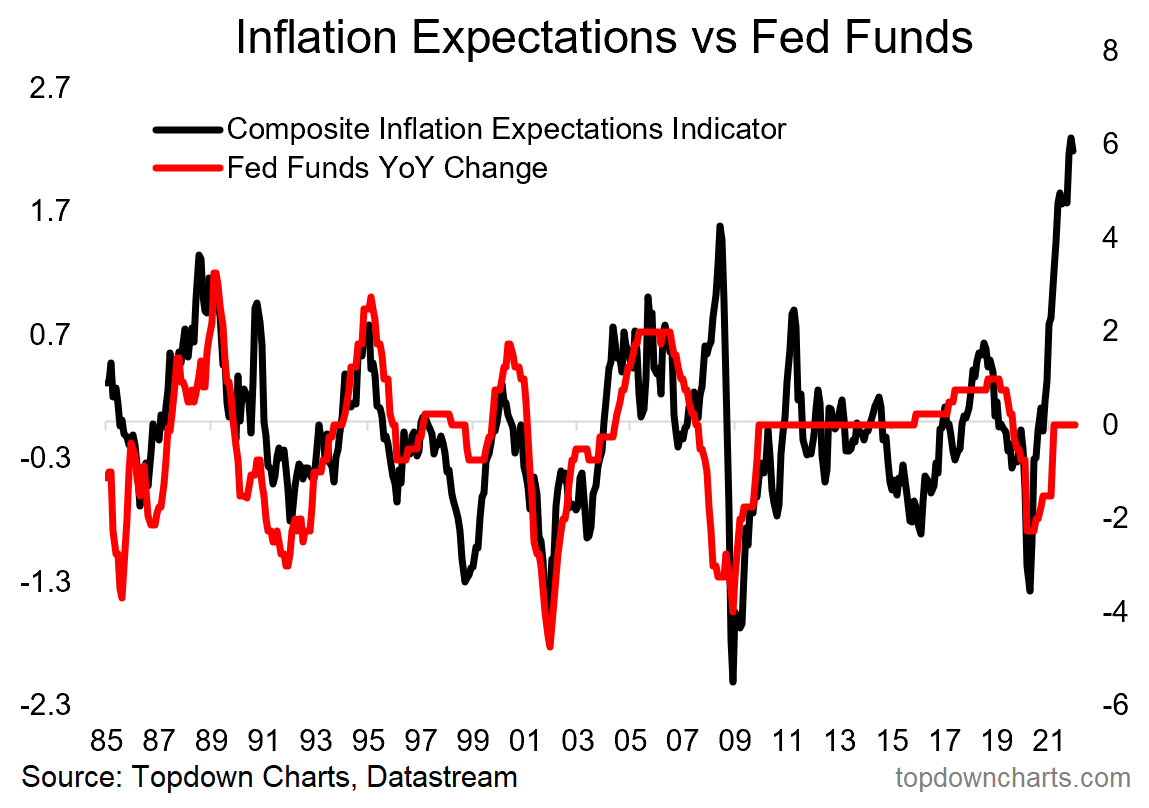
At its core, supply chokepoints and a hot labor market are keeping inflation high and sticky. To lessen this inflation, policymakers are seeking to tighten monetary policy. 

That means raising interest rates and quantitative tightening (QT). 

As we discussed on September 20, the transmission mechanisms of these drivers vary with QT having a very weak transmission “to economic activity but very strong to financial markets.” On the other end are rates that have a stronger transmission to economic activity.

And so, on “the incremental effects on liquidity” these drivers pose, markets are trading more in sync; on the way up, through fiscal stimuli, interest rate decreases, and QE (i.e., buying of US Treasuries and mortgage securities), investors sought more yield elsewhere. 

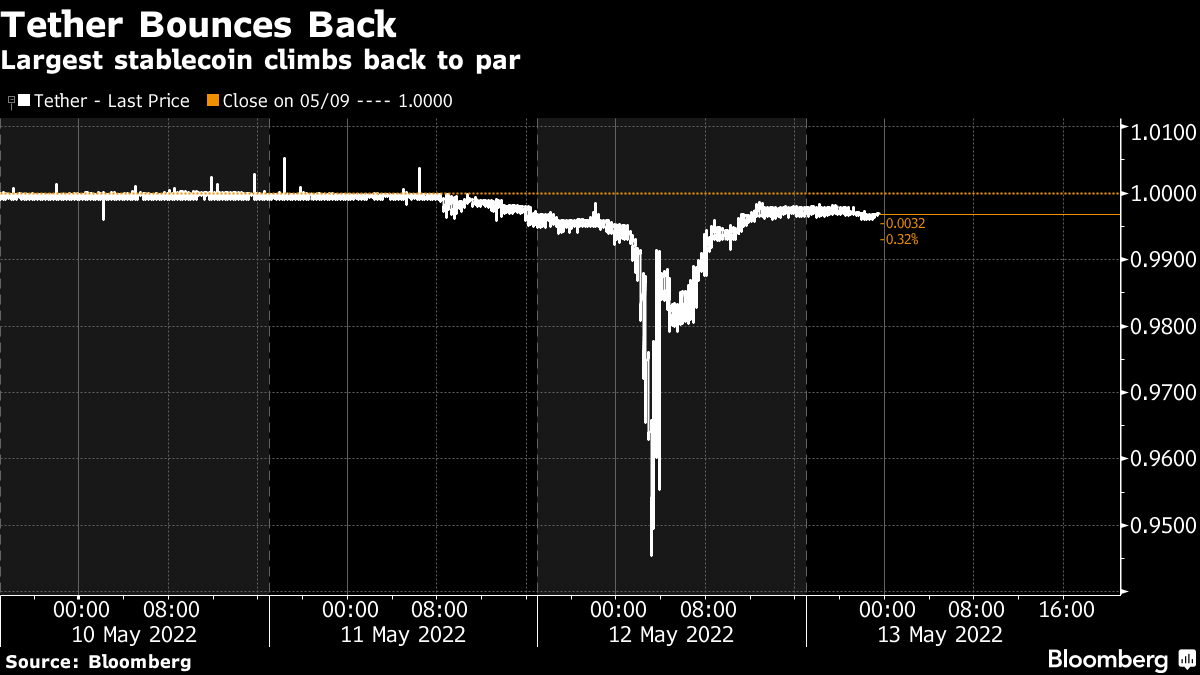
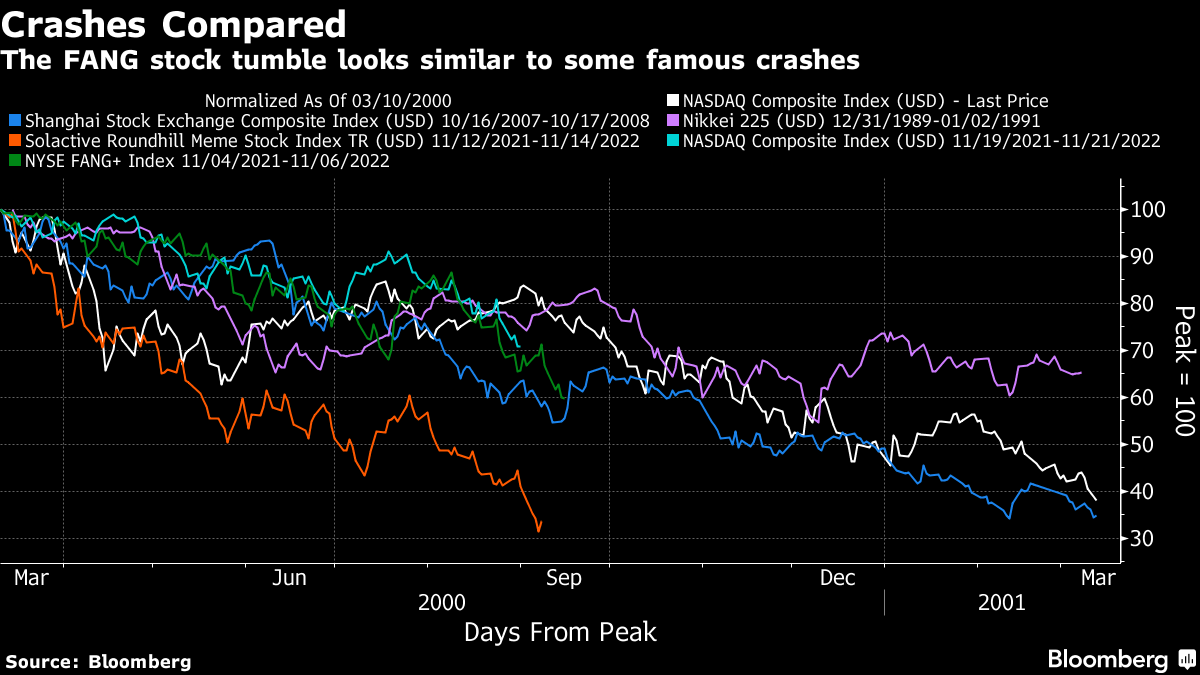
Risk assets like stocks, crypto, and beyond thus enjoyed a boost.

In a way, the opposite is happening now, and selling across risk -on and -off assets is persistent. 

Liquidity measures (which we began unpacking months ago, and were covered in Bloomberg by Kevin Muir of TheMacroTourist.com, recently, too) show a near-lockstep decline in the S&P 500 (INDEX: SPX). Please check out Kevin Muir’s Substack, too!

Net liquidity (NL) we calculate by taking the size of the Fed’s balance sheet (BS) and subtracting both the amounts in the reverse repo operation (RRP) and Treasury General Account (TGA).

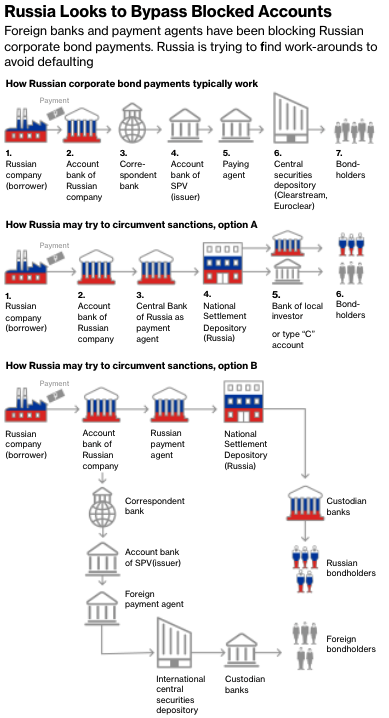
Muir said that “the liquidity created from QE and fiscal stimulus was so great that commercial banks no longer wanted deposits from large institutional clients because there were not enough safe assets available to purchase.” 

This prompted the expansion of RRP (beyond primary dealers to include the mutual funds and non-traditional accounts), a liquidity-draining operation (cash in the system removed through an increase in the number of bonds), through which the Fed would deliver “high-quality collateral with the promise to buy it back in a certain number of days at a higher price,” Muir explained.

Graphic: Retrieved from Bloomberg.

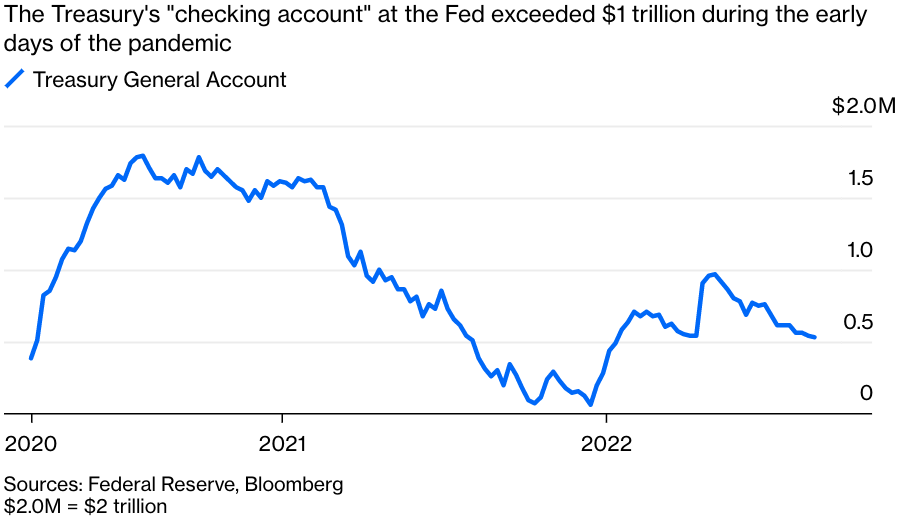
Other NL drivers include the TGA which, prior to Covid, was fairly well-balanced by taxes (i.e., money coming in) and the issue of fixed-income securities (i.e., money coming out). 

Post-Covid, the TGA increased a lot and this has “the same effect as QT … [as] bonds are issued and cash [is] withdrawn from the financial system, but the money is not distributed into the economy,” Muir elaborated.

Graphic: Retrieved from Bloomberg.

Combining the moves of the RRP and TGA, with the BS, provides us a measure of NL (shown below) that well explains stock price movements, as we’ve put forth in letters before.

Graphic: Via Physik Invest. Data compiled by @jkonopas623. Fed Balance Sheet data, here. Treasury General Account Data, here. Reverse Repo data, here. NL = BS – TGA – RRP.

And, despite the far-spreading risk-on and -off context (i.e., stocks, crypto, and bonds down), it is believed that the large amounts in liquidity-draining operations (RRP and TGA), the impacts of QT, from hereon, may be lessened; per Muir, “[i]f the Fed had securities on its balance sheet that matched the maturity profile demanded by the institutions engaging in reverse repos, it could sell an amount equal to the total reverse repo balance to these institutions, reducing the need for reverse repos and elicit no change in the financial or real economy.”

“On top of that, the actual amount of monthly QT [$95 billion per month] is not that large,” Muir added. That’s because, over the span of five months, into the end of 2021 and the beginning of 2022, the TGA was up $816 billion. This equates to ~$163.2 or so billion per month of QT.

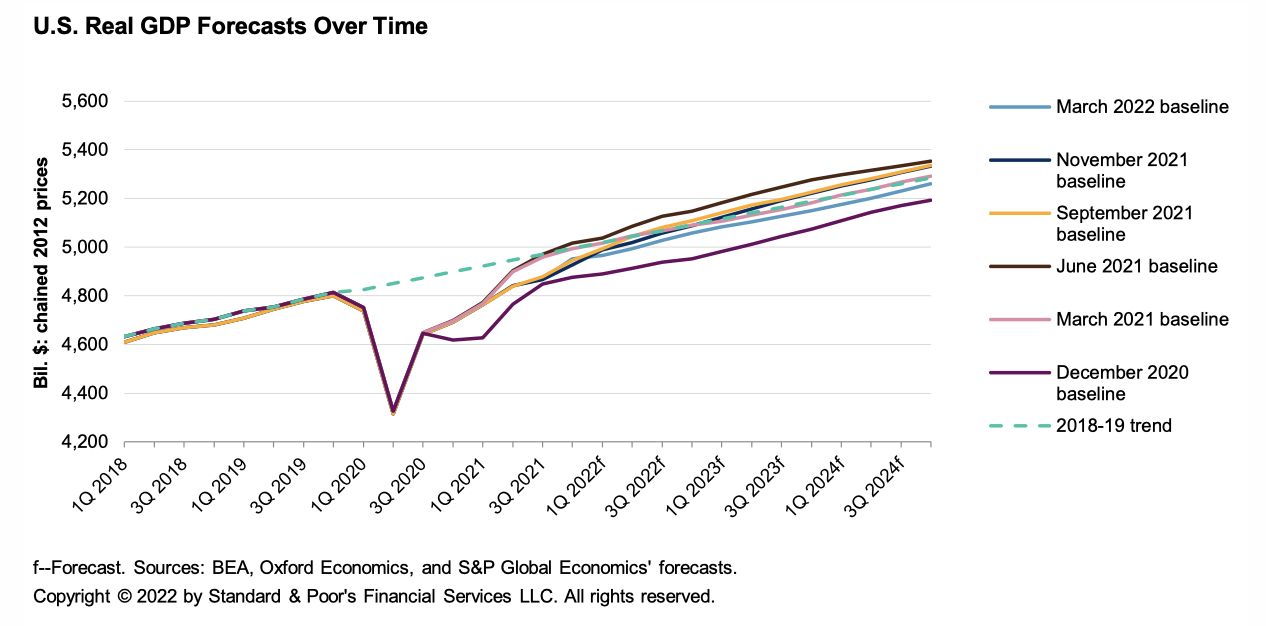
At the end of the day, though, the programs outlined above do less to provide market support. One can argue that the market has priced the programs and some economic slowing. It is not likely the market has priced the impacts of a sharply slowing economy and business.

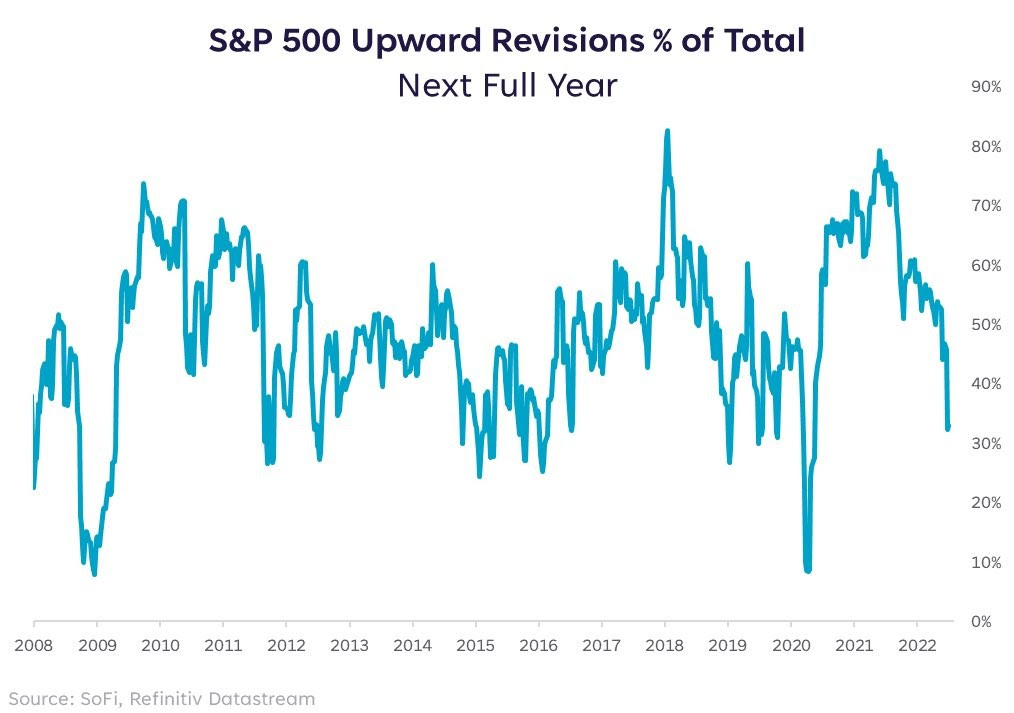
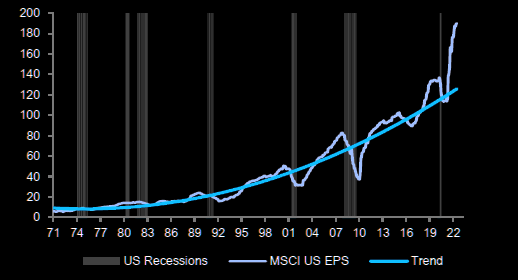
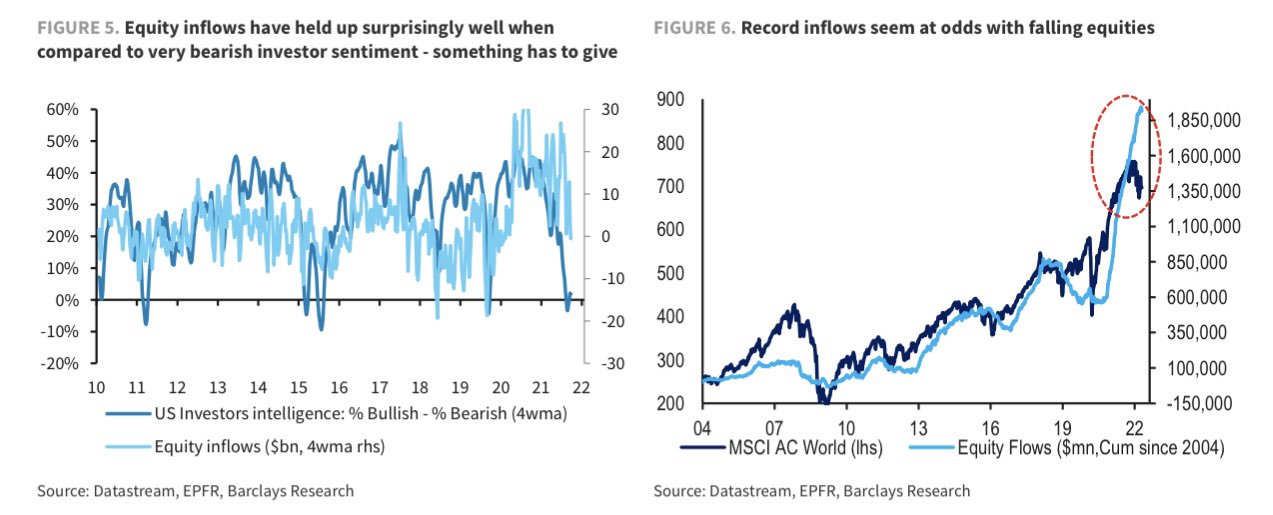
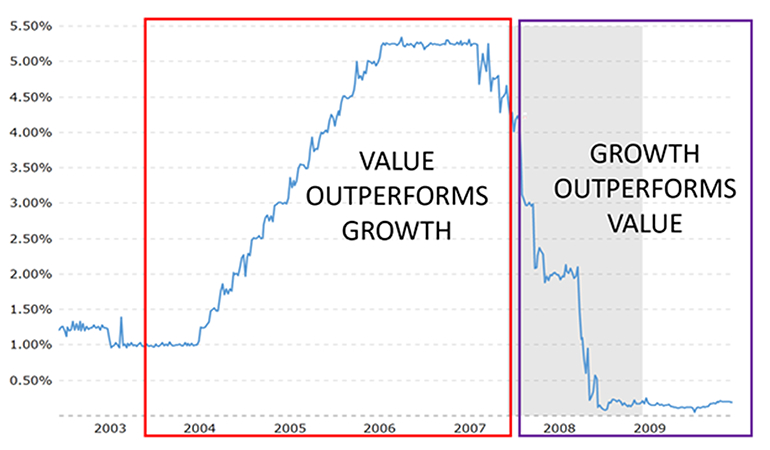
That said, some data – less corporate profits falling out of bed – suggests “the stock market tends to do better when EPS growth rates are negative than when they are hugely positive.”

Graphic: Retrieved from Ned Davis Research via MarketWatch. “[A]n inverse relationship between earnings growth rates and the market’s average return.”

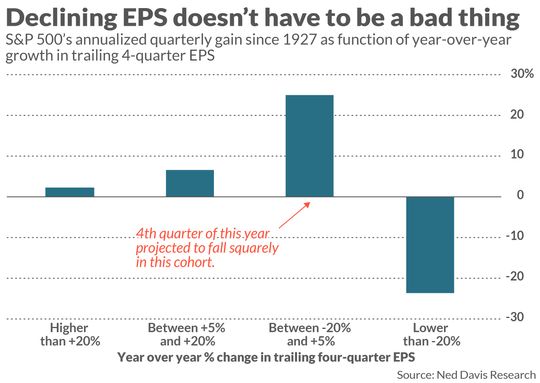
The key to explaining this is to remember markets are a forward-looking mechanism. 

“By the time earnings growth rates are extremely high–as they were late last year and early this–they have long since been reflected in stock prices.”

“During such periods, the market has instead shifted its focus to earnings several quarters hence—to factors such as the Fed having to put the brakes on an overheating economy.”

The reverse will happen when the year-over-year growth rate in trailing fourth-quarter EPS is negative; “investors will have shifted their focus to earnings’ likely imminent rebound.”

Positioning

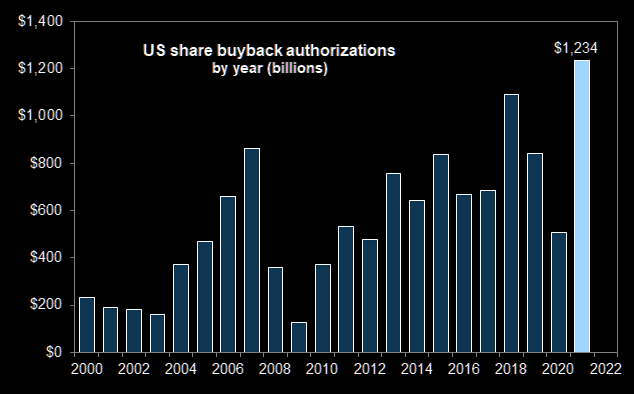
Pending is a final resolution “tied to the incremental effects on liquidity,” (e.g., QT manifesting itself as “$4.5 billion less in demand for assets per day,” and buyback blackout).

Graphic: Retrieved from Barclays PLC (NYSE: BCS) via The Market Ear.

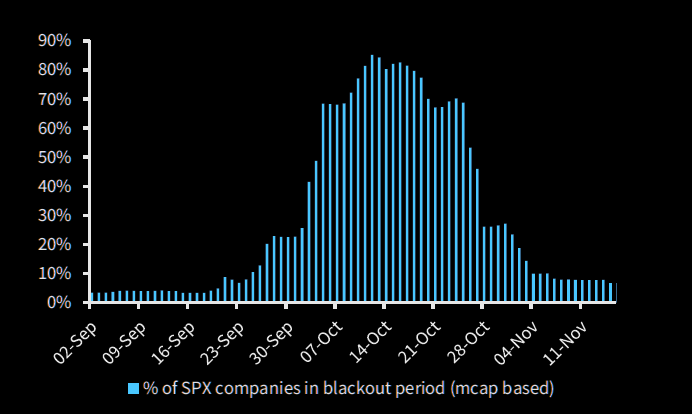
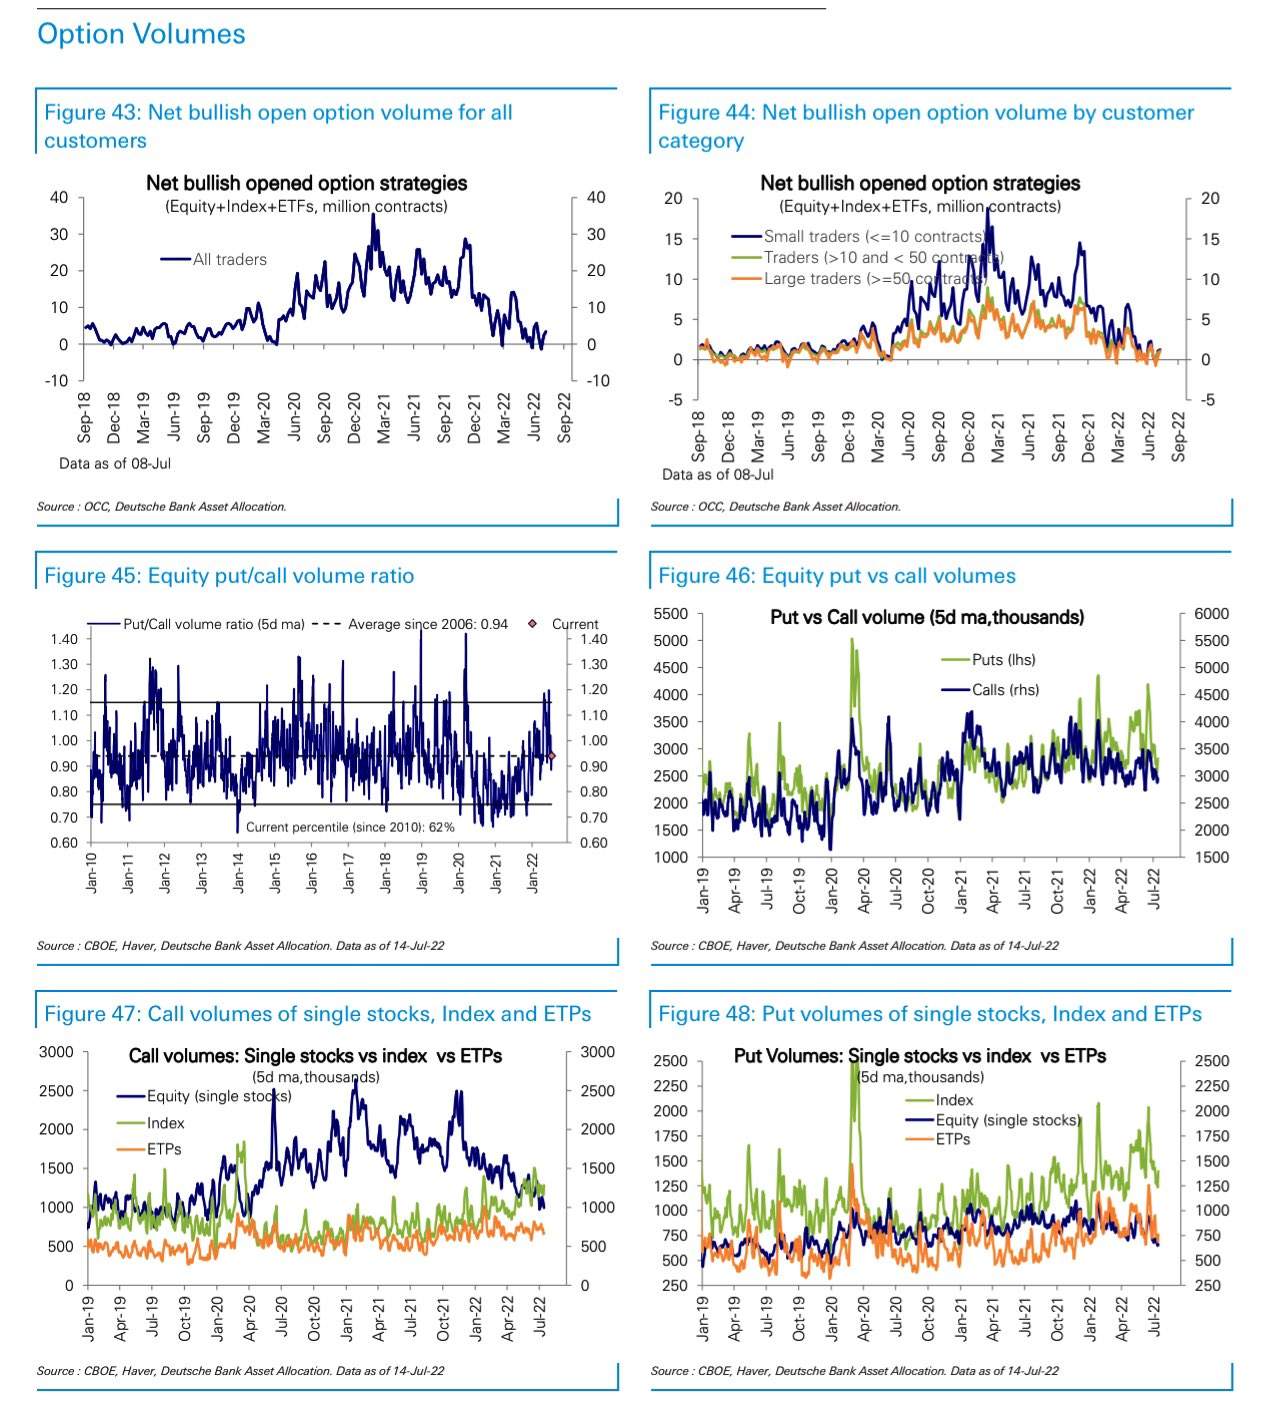
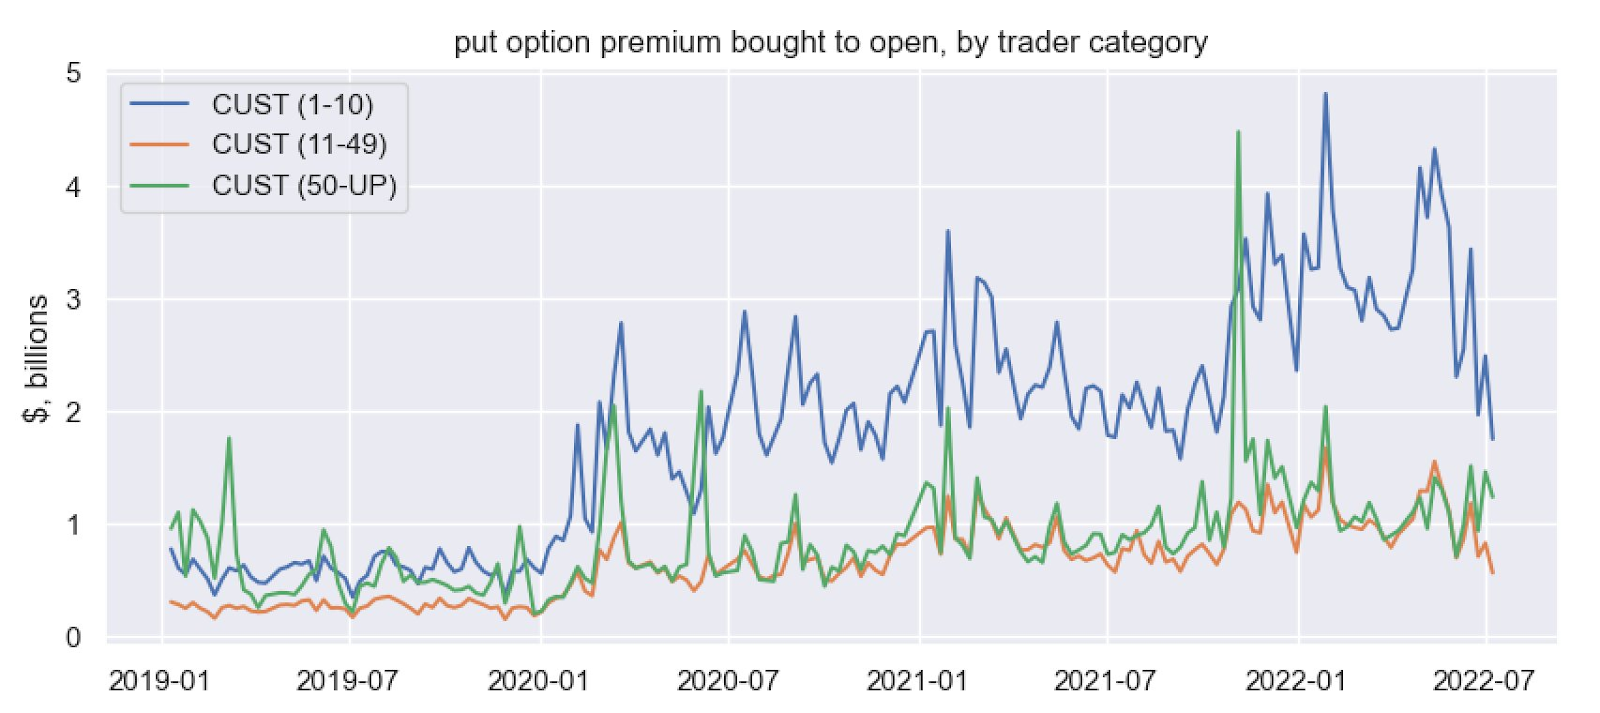
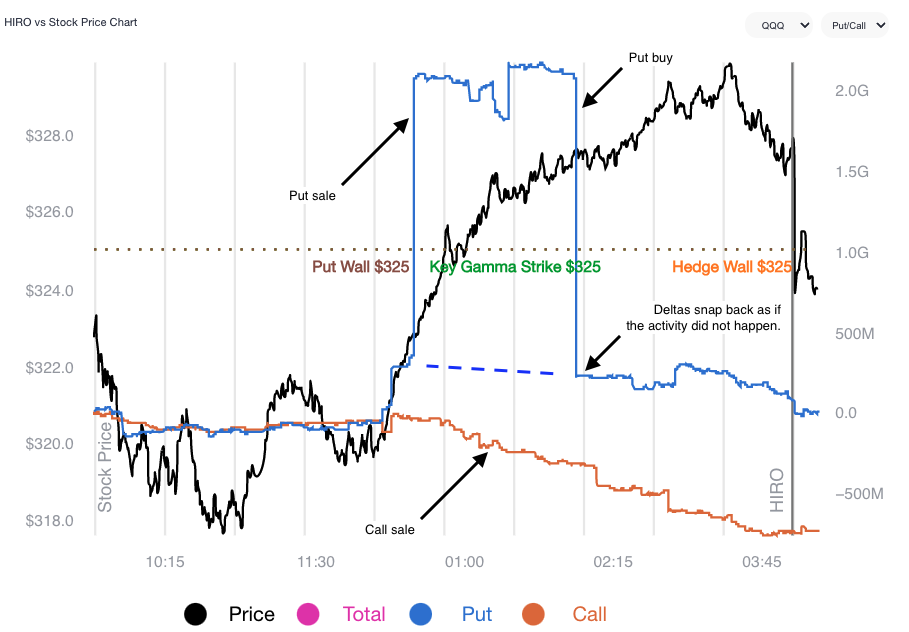
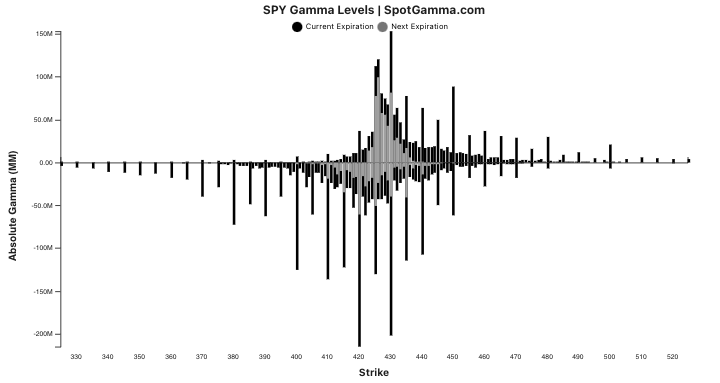
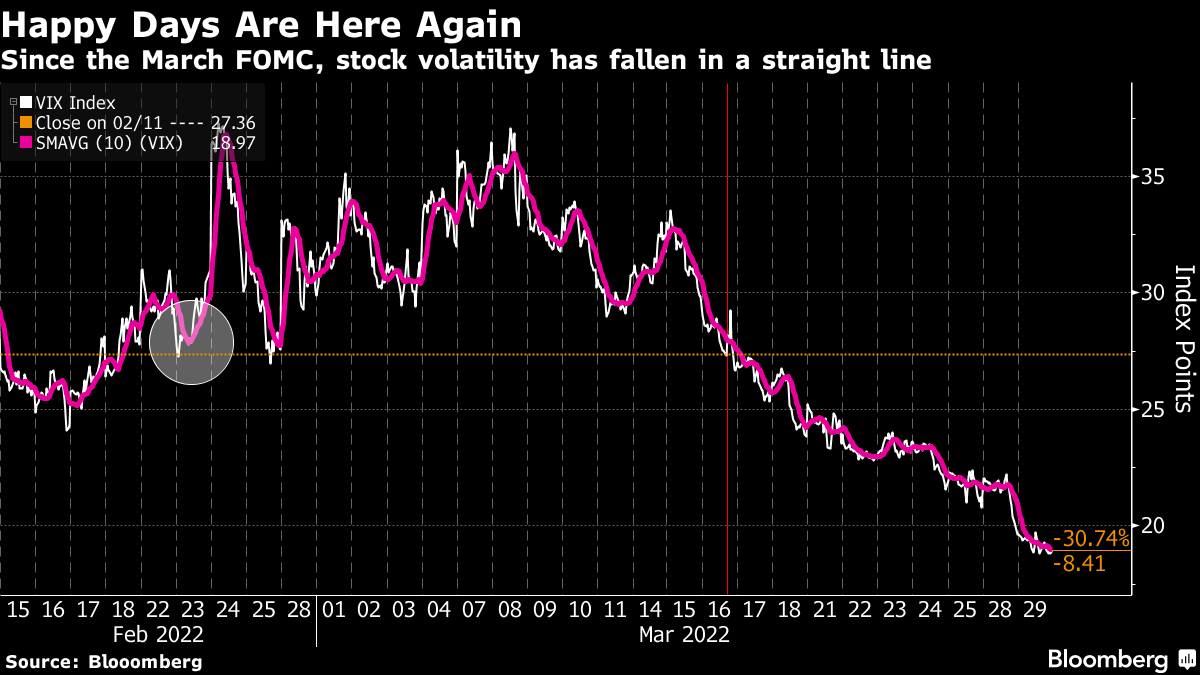
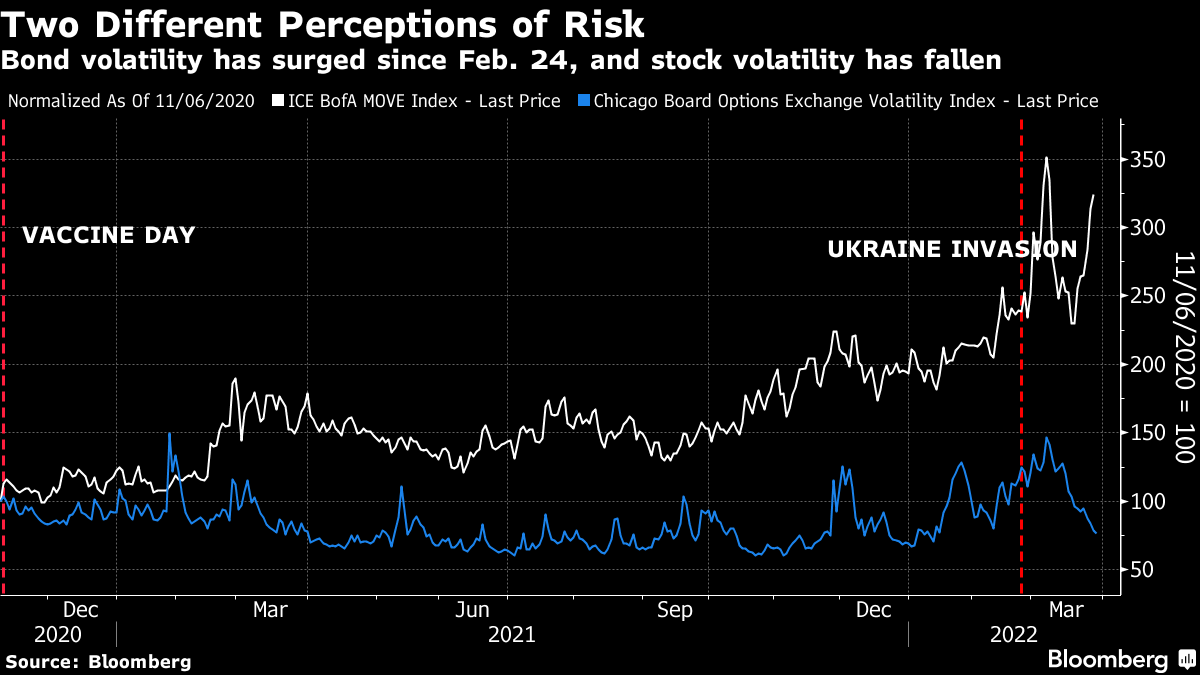
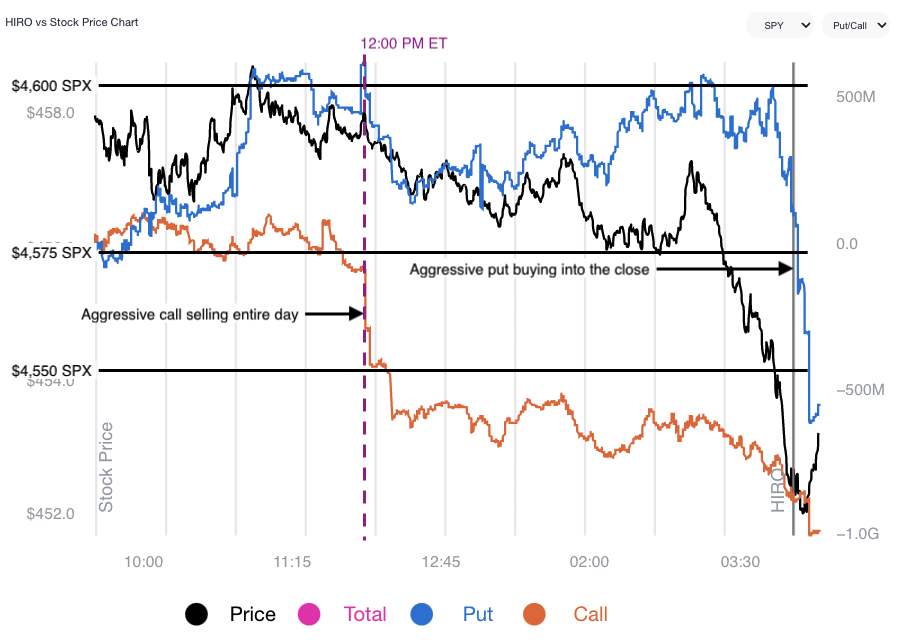
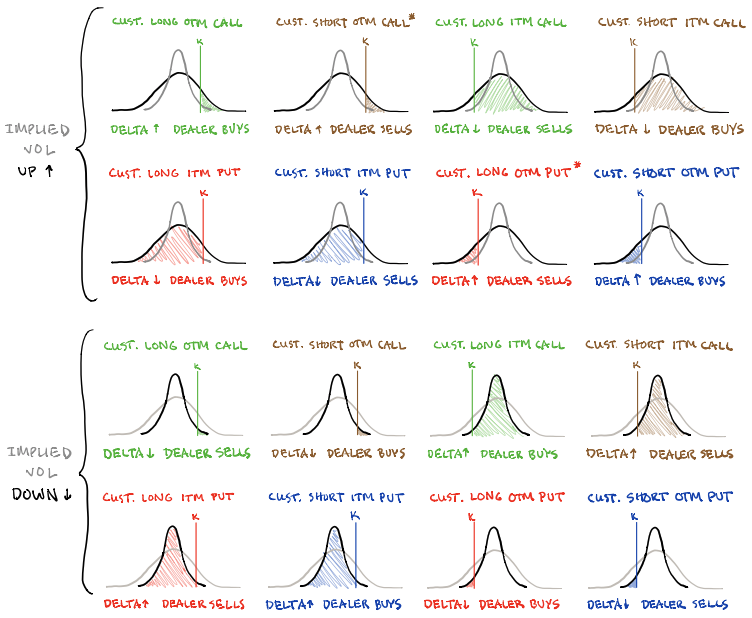
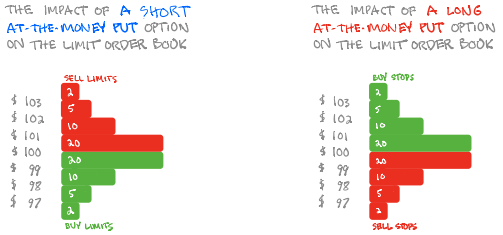
This is all the while options repositioning may actually make the case for increased fragility, as traders’ falling demand for put protection opens the door to less supportive hedging flows and more impact from macro-type flows (talked about above) if we will.

Graphic: Taken from @Alpha_Ex_LLC who retrieved from Bloomberg. S&P 500 (INDEX: SPX) October put option lower in price and volatility.

The last-mentioned SpotGamma explained well: 

“As traders realize that options protection is doing little to protect them, there may be a flip; the sale of volatility, which appears to be a good trade (now), could leave markets vulnerable to an event into which traders are no longer well-hedged. Should something bad happen and traders reach for protection, that could result in limit-down type of movement.”

If unsure of what direction to participate, consider pricing some Box Spreads that offer some competitive and guaranteed interest rates, similar to those earned with Treasury bills.

Technical

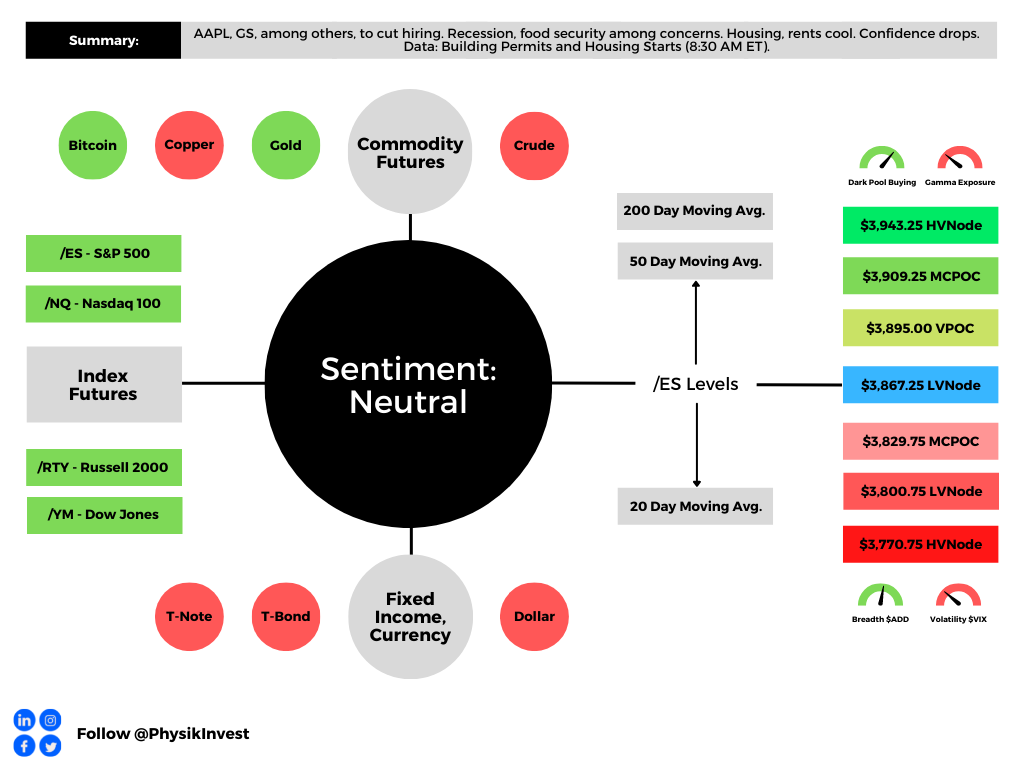
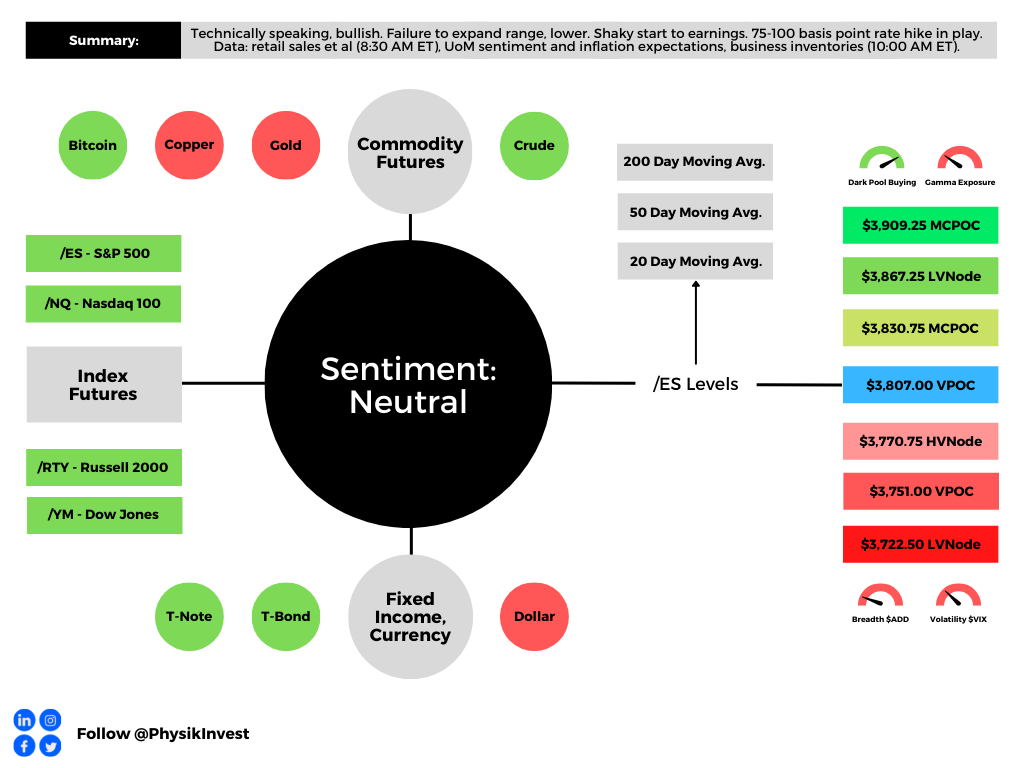
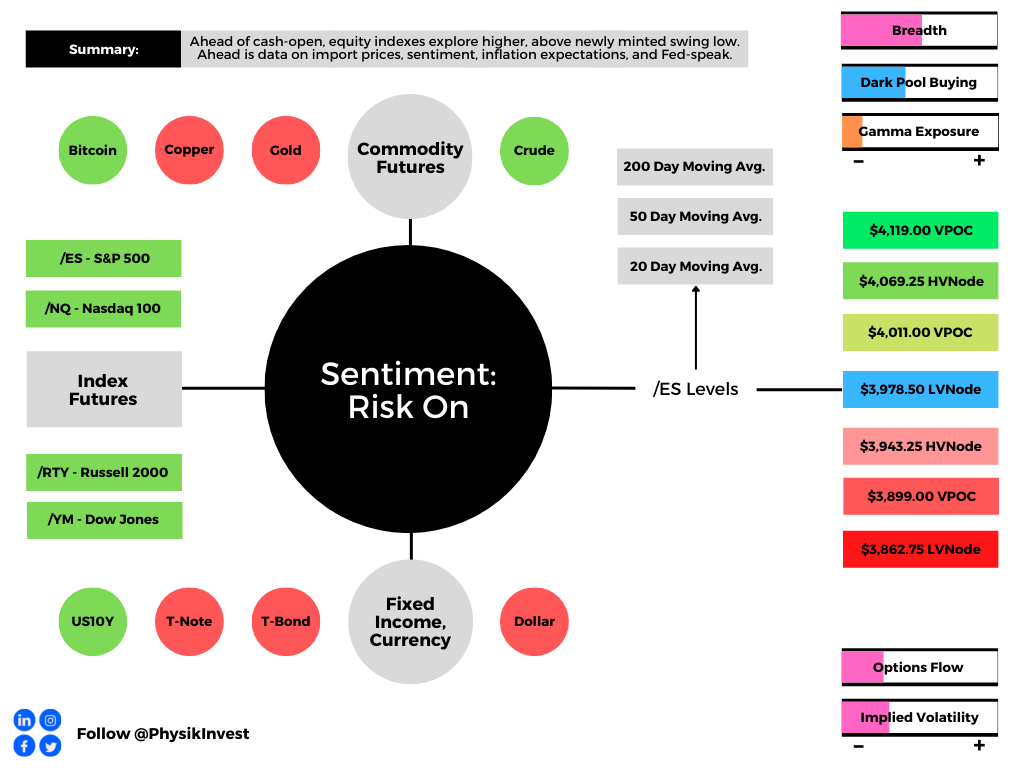
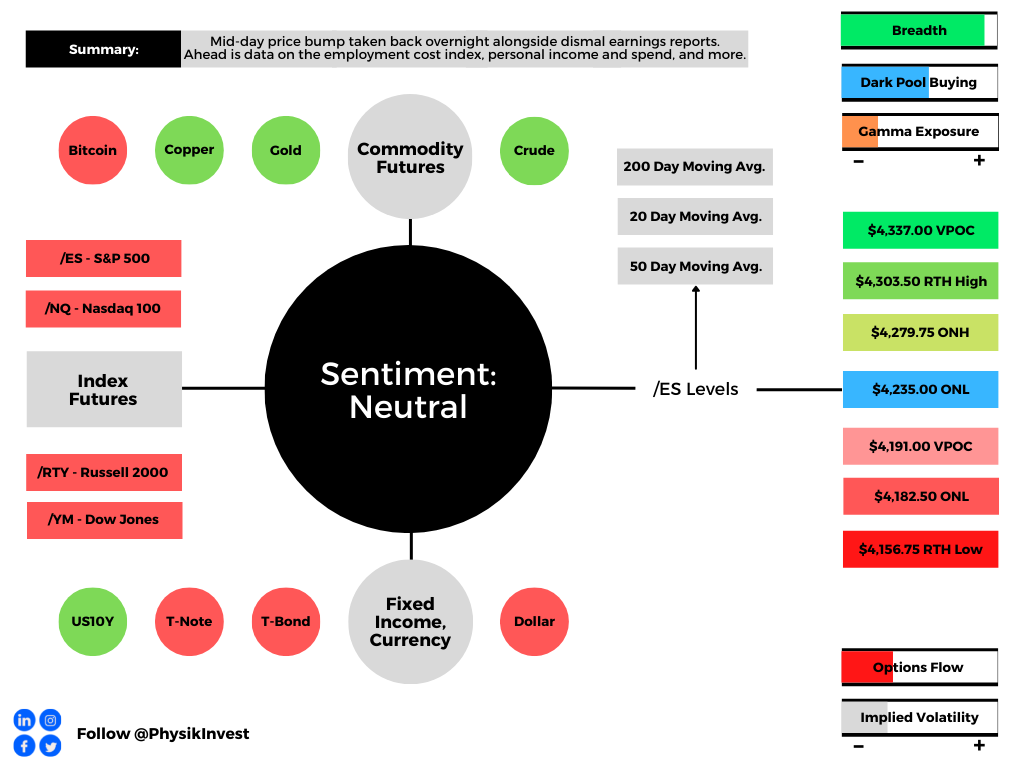
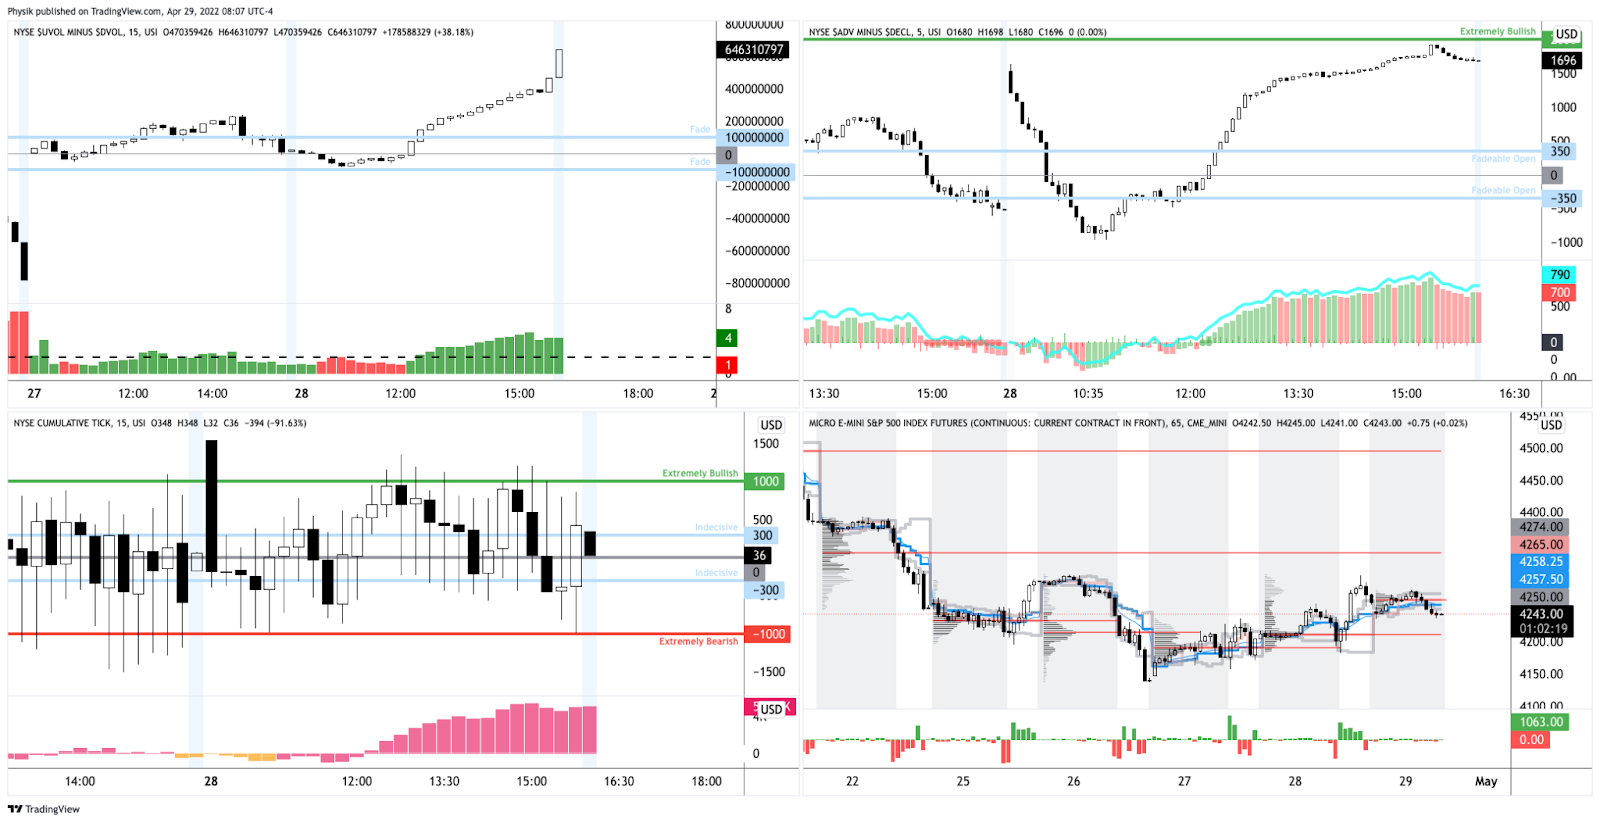
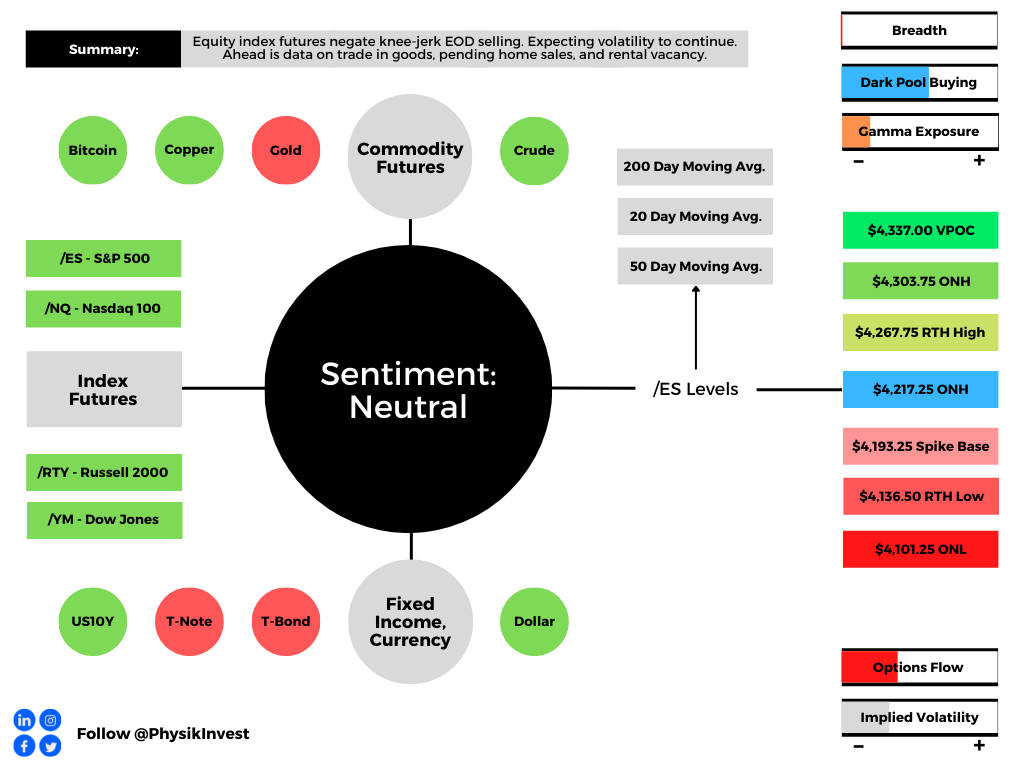
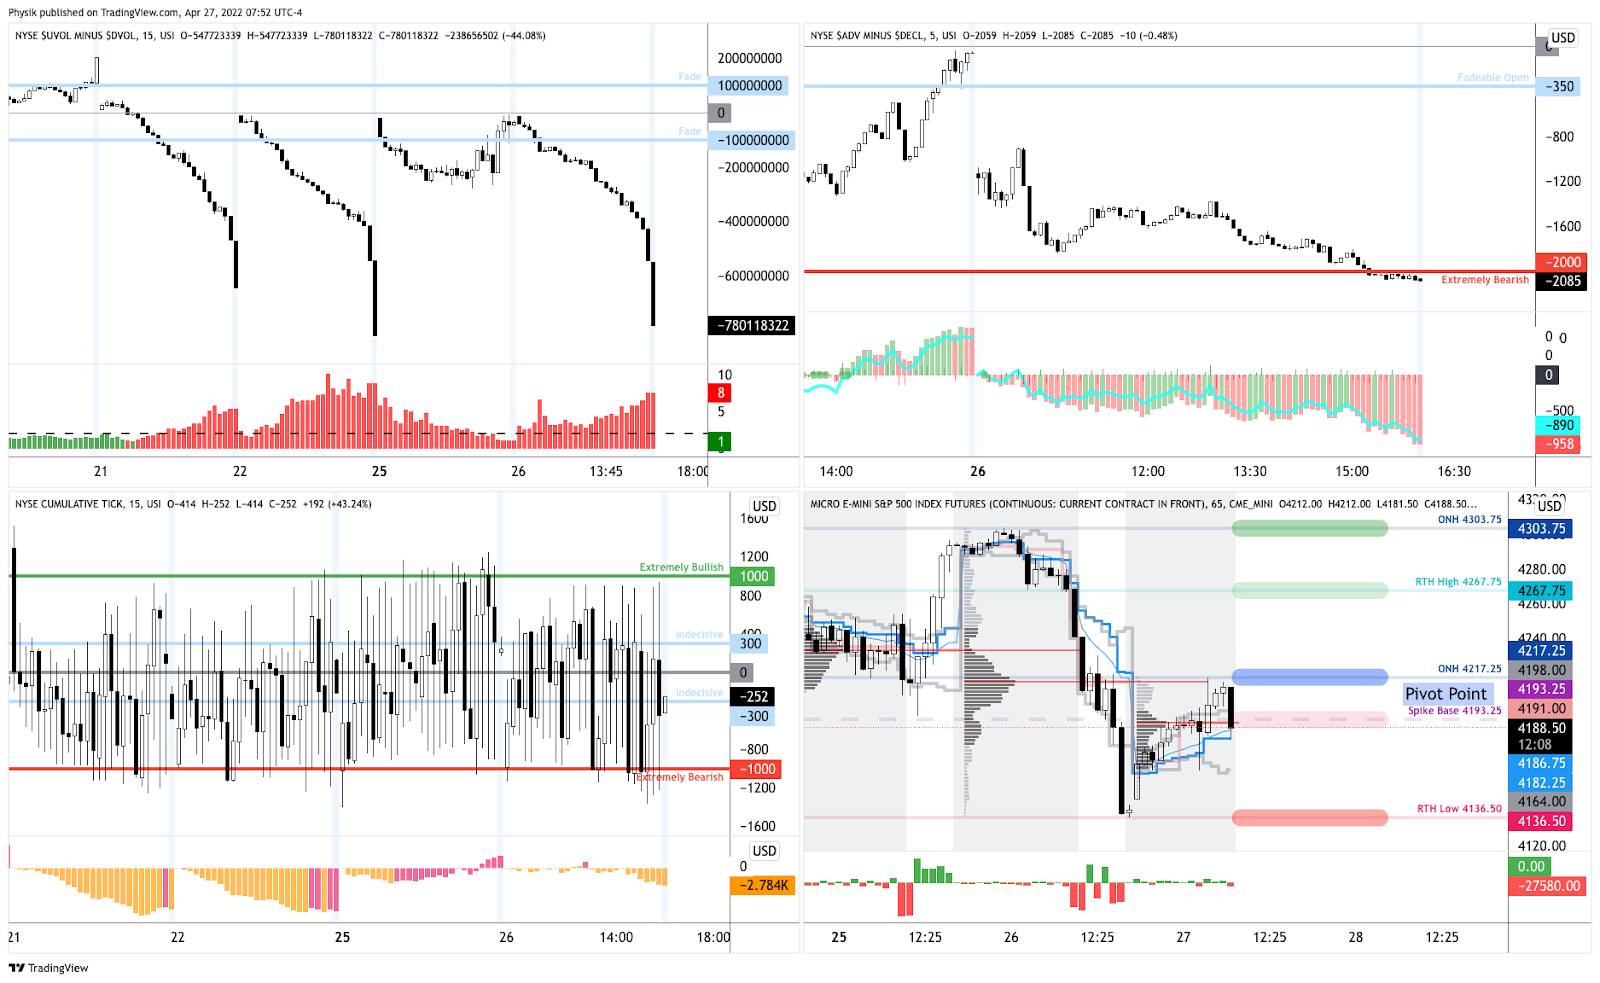
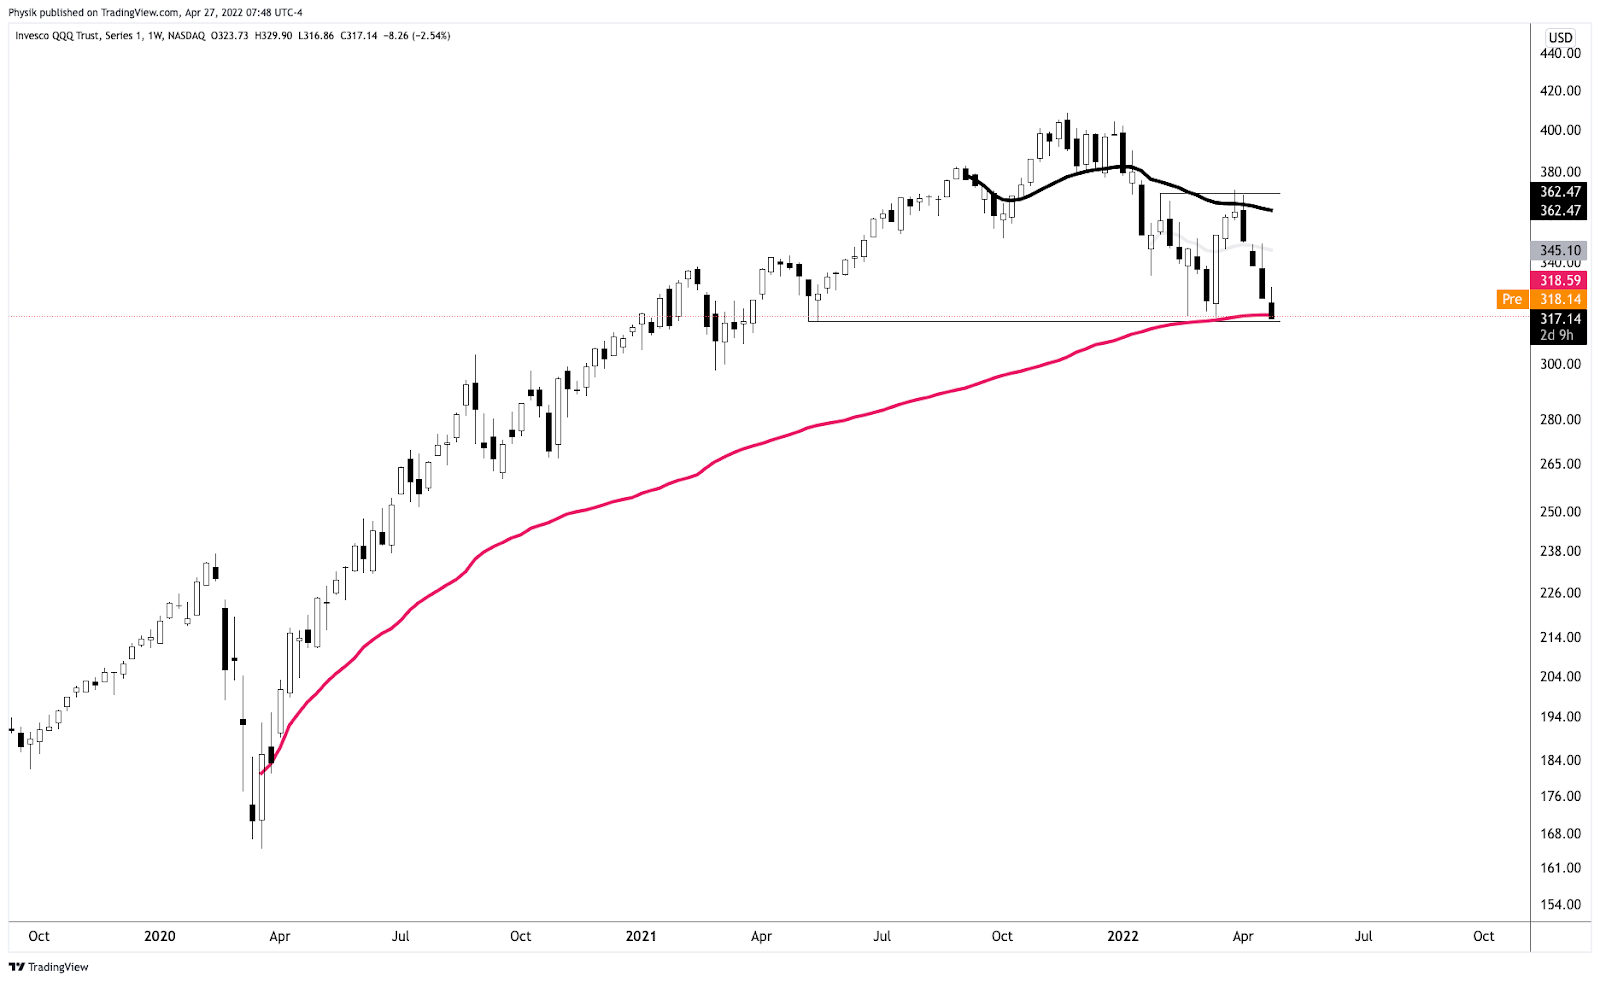
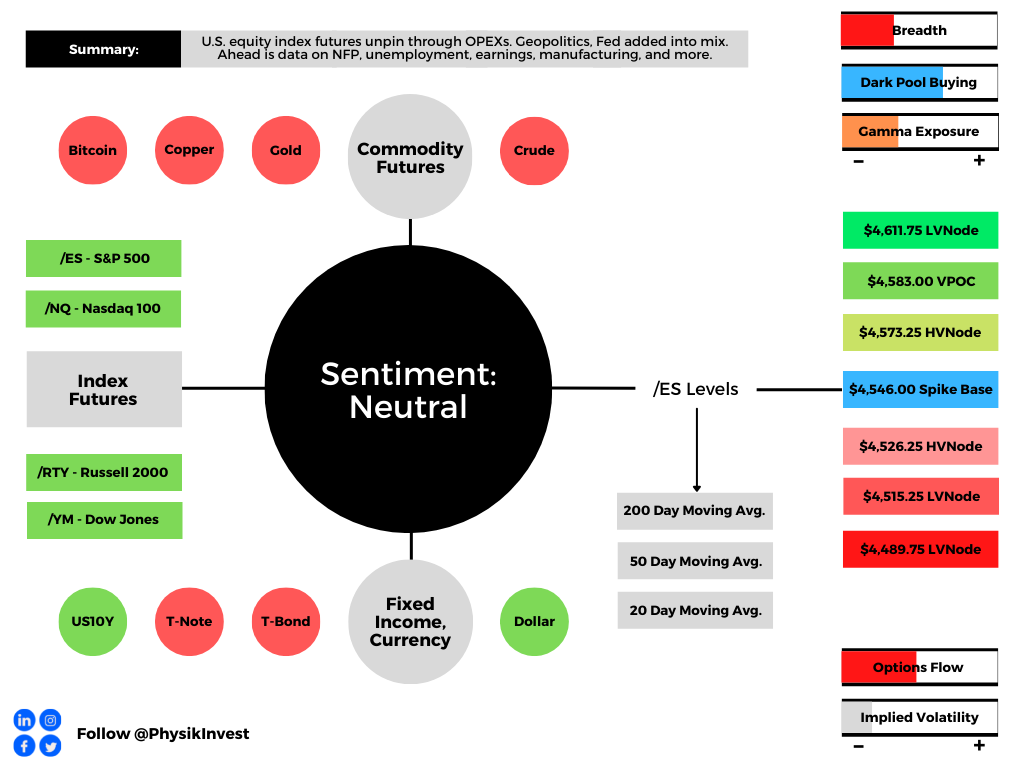
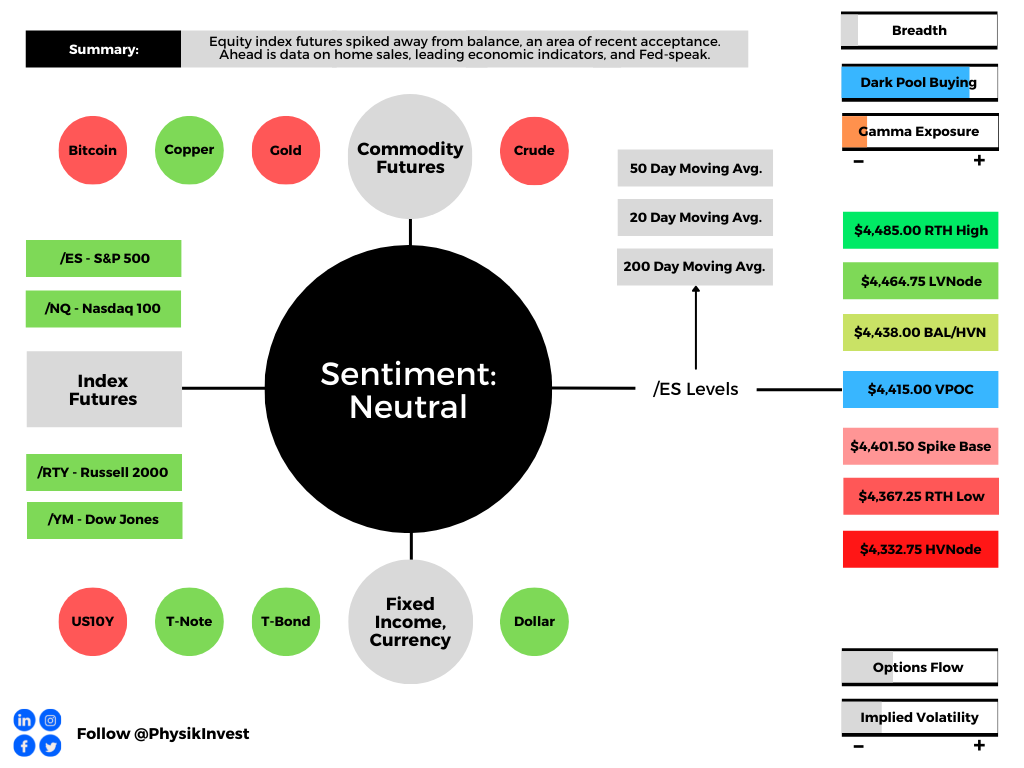
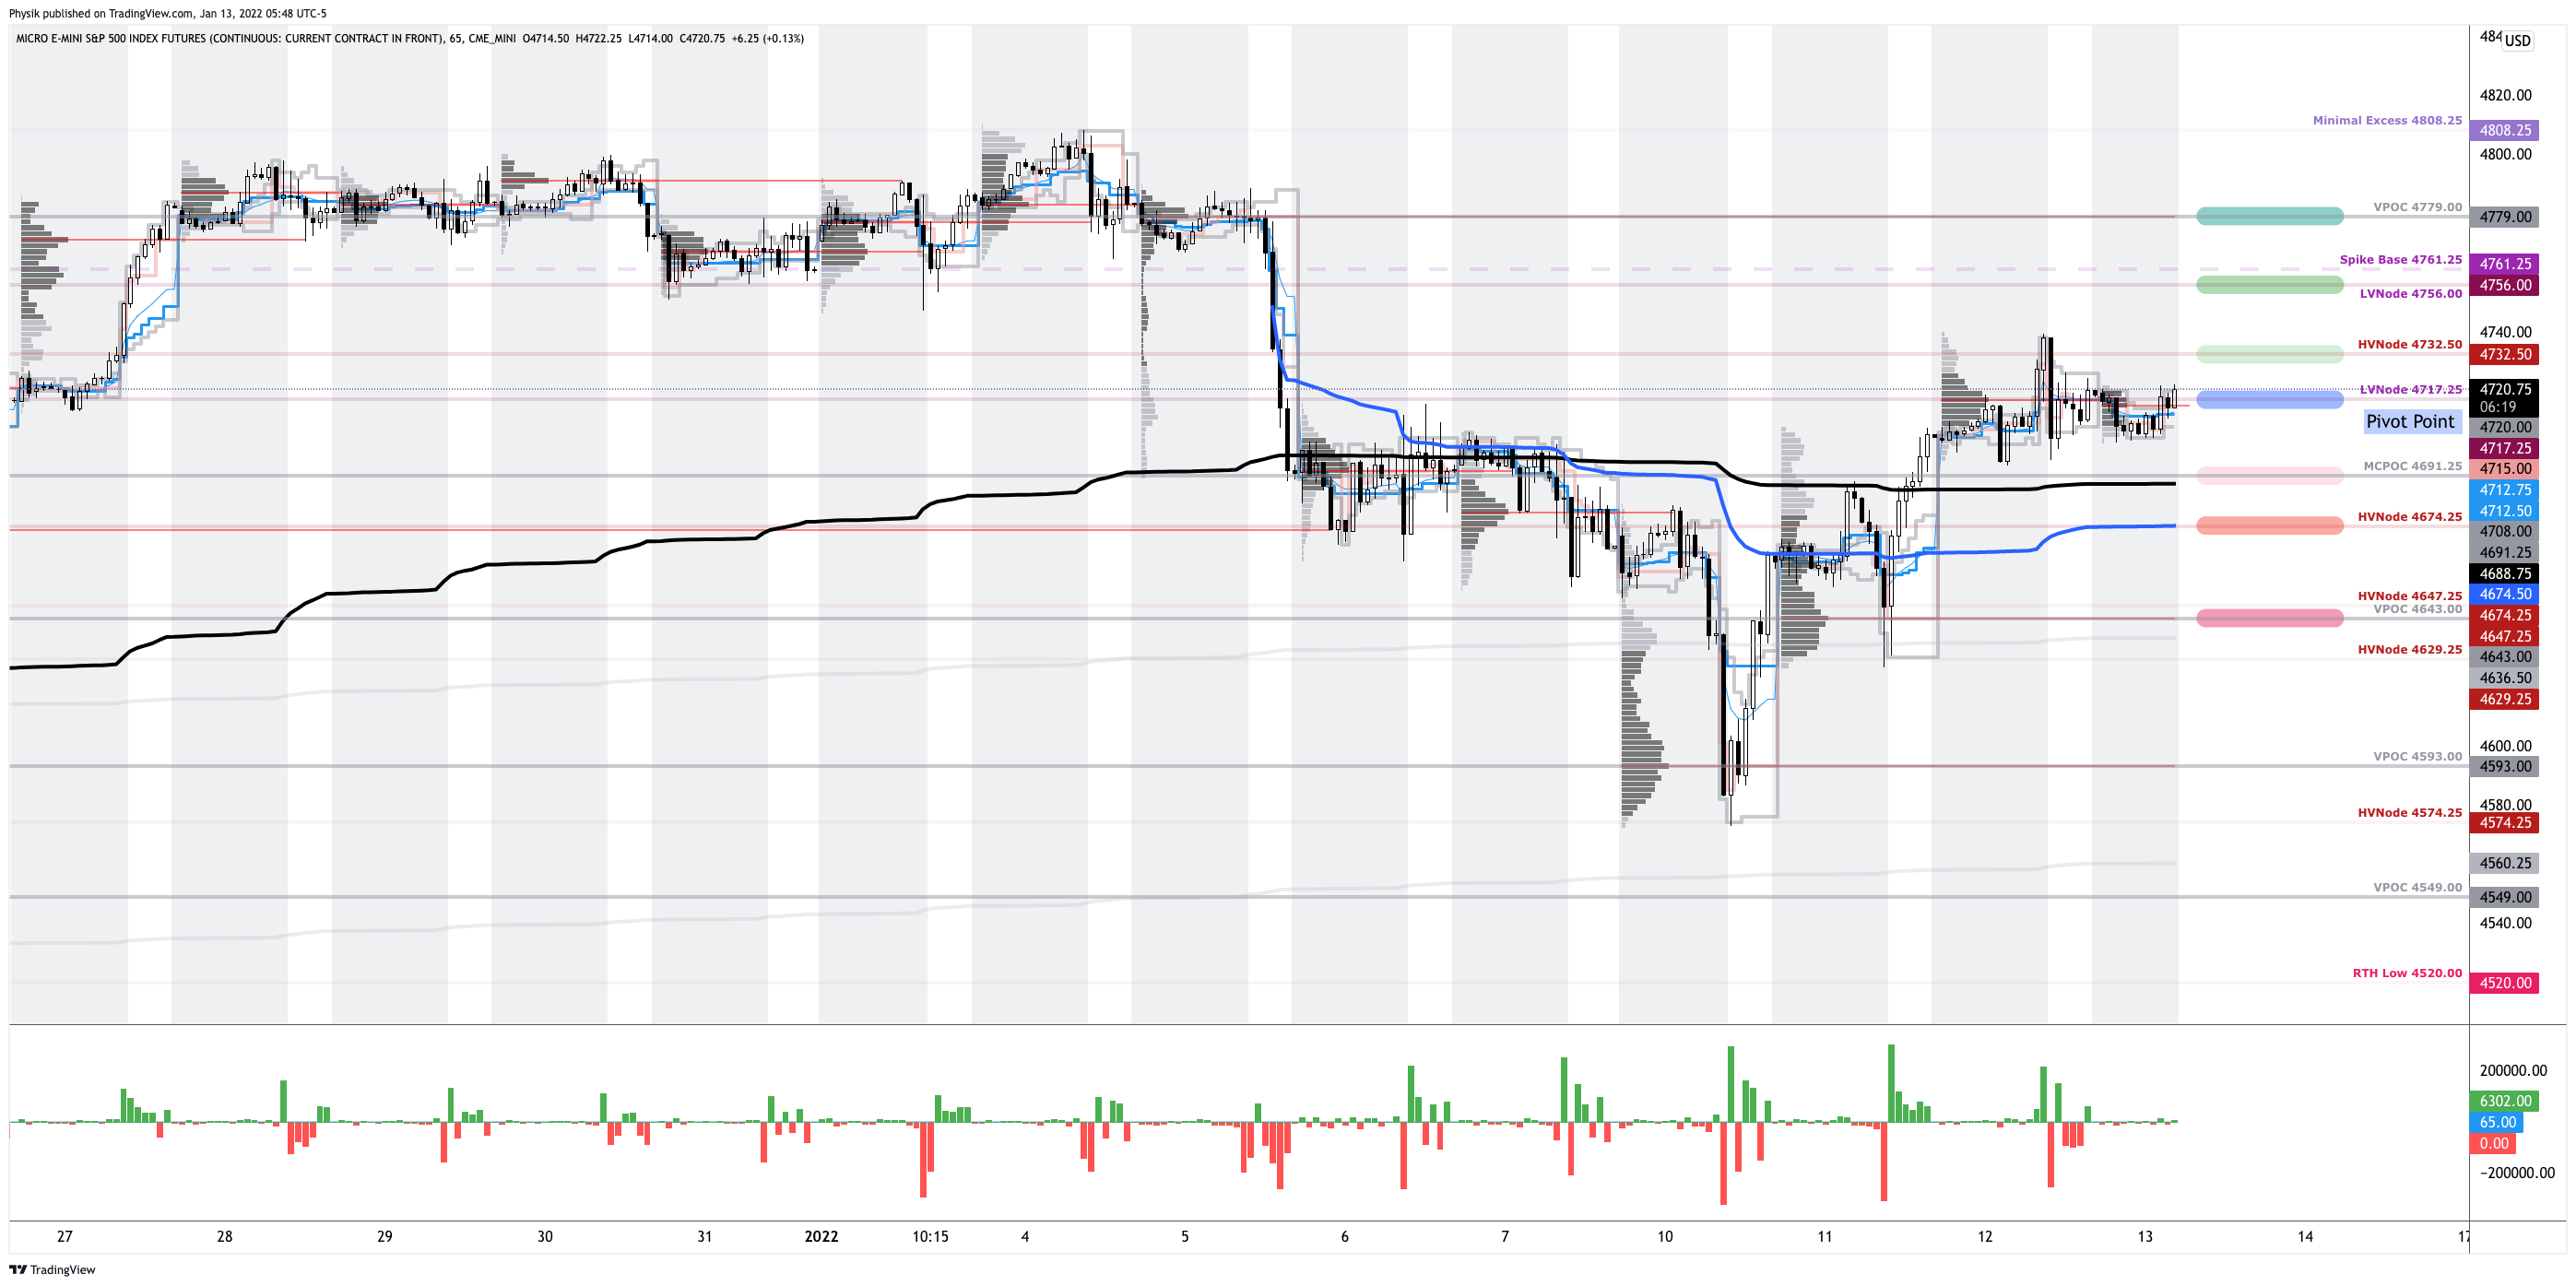
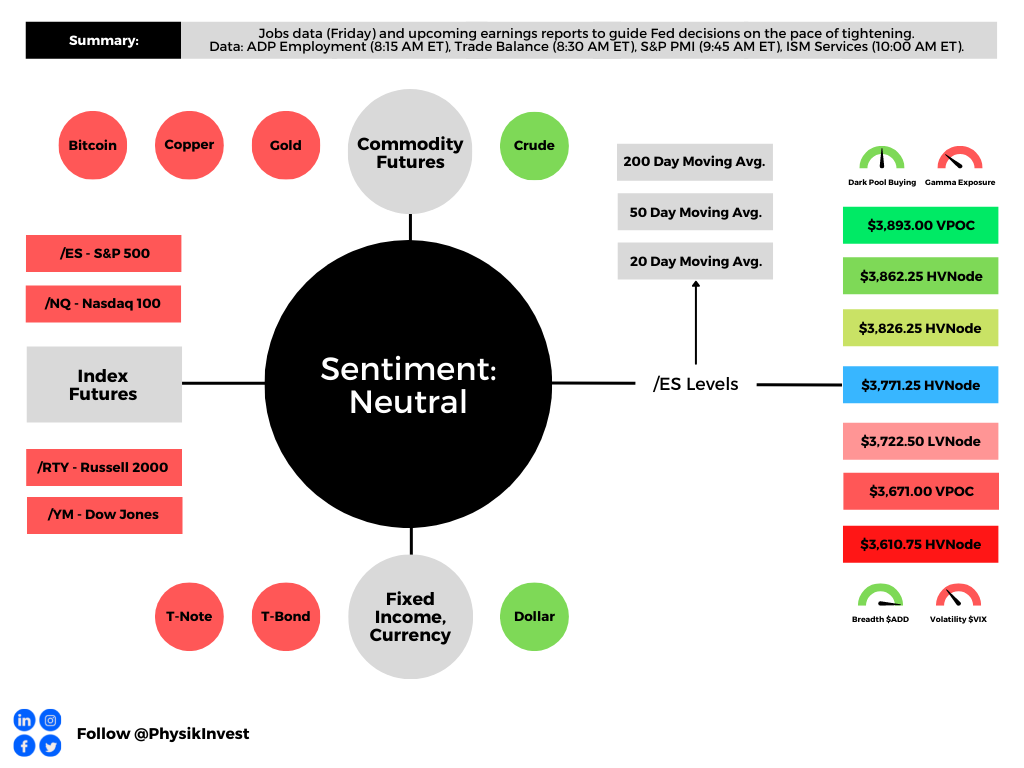
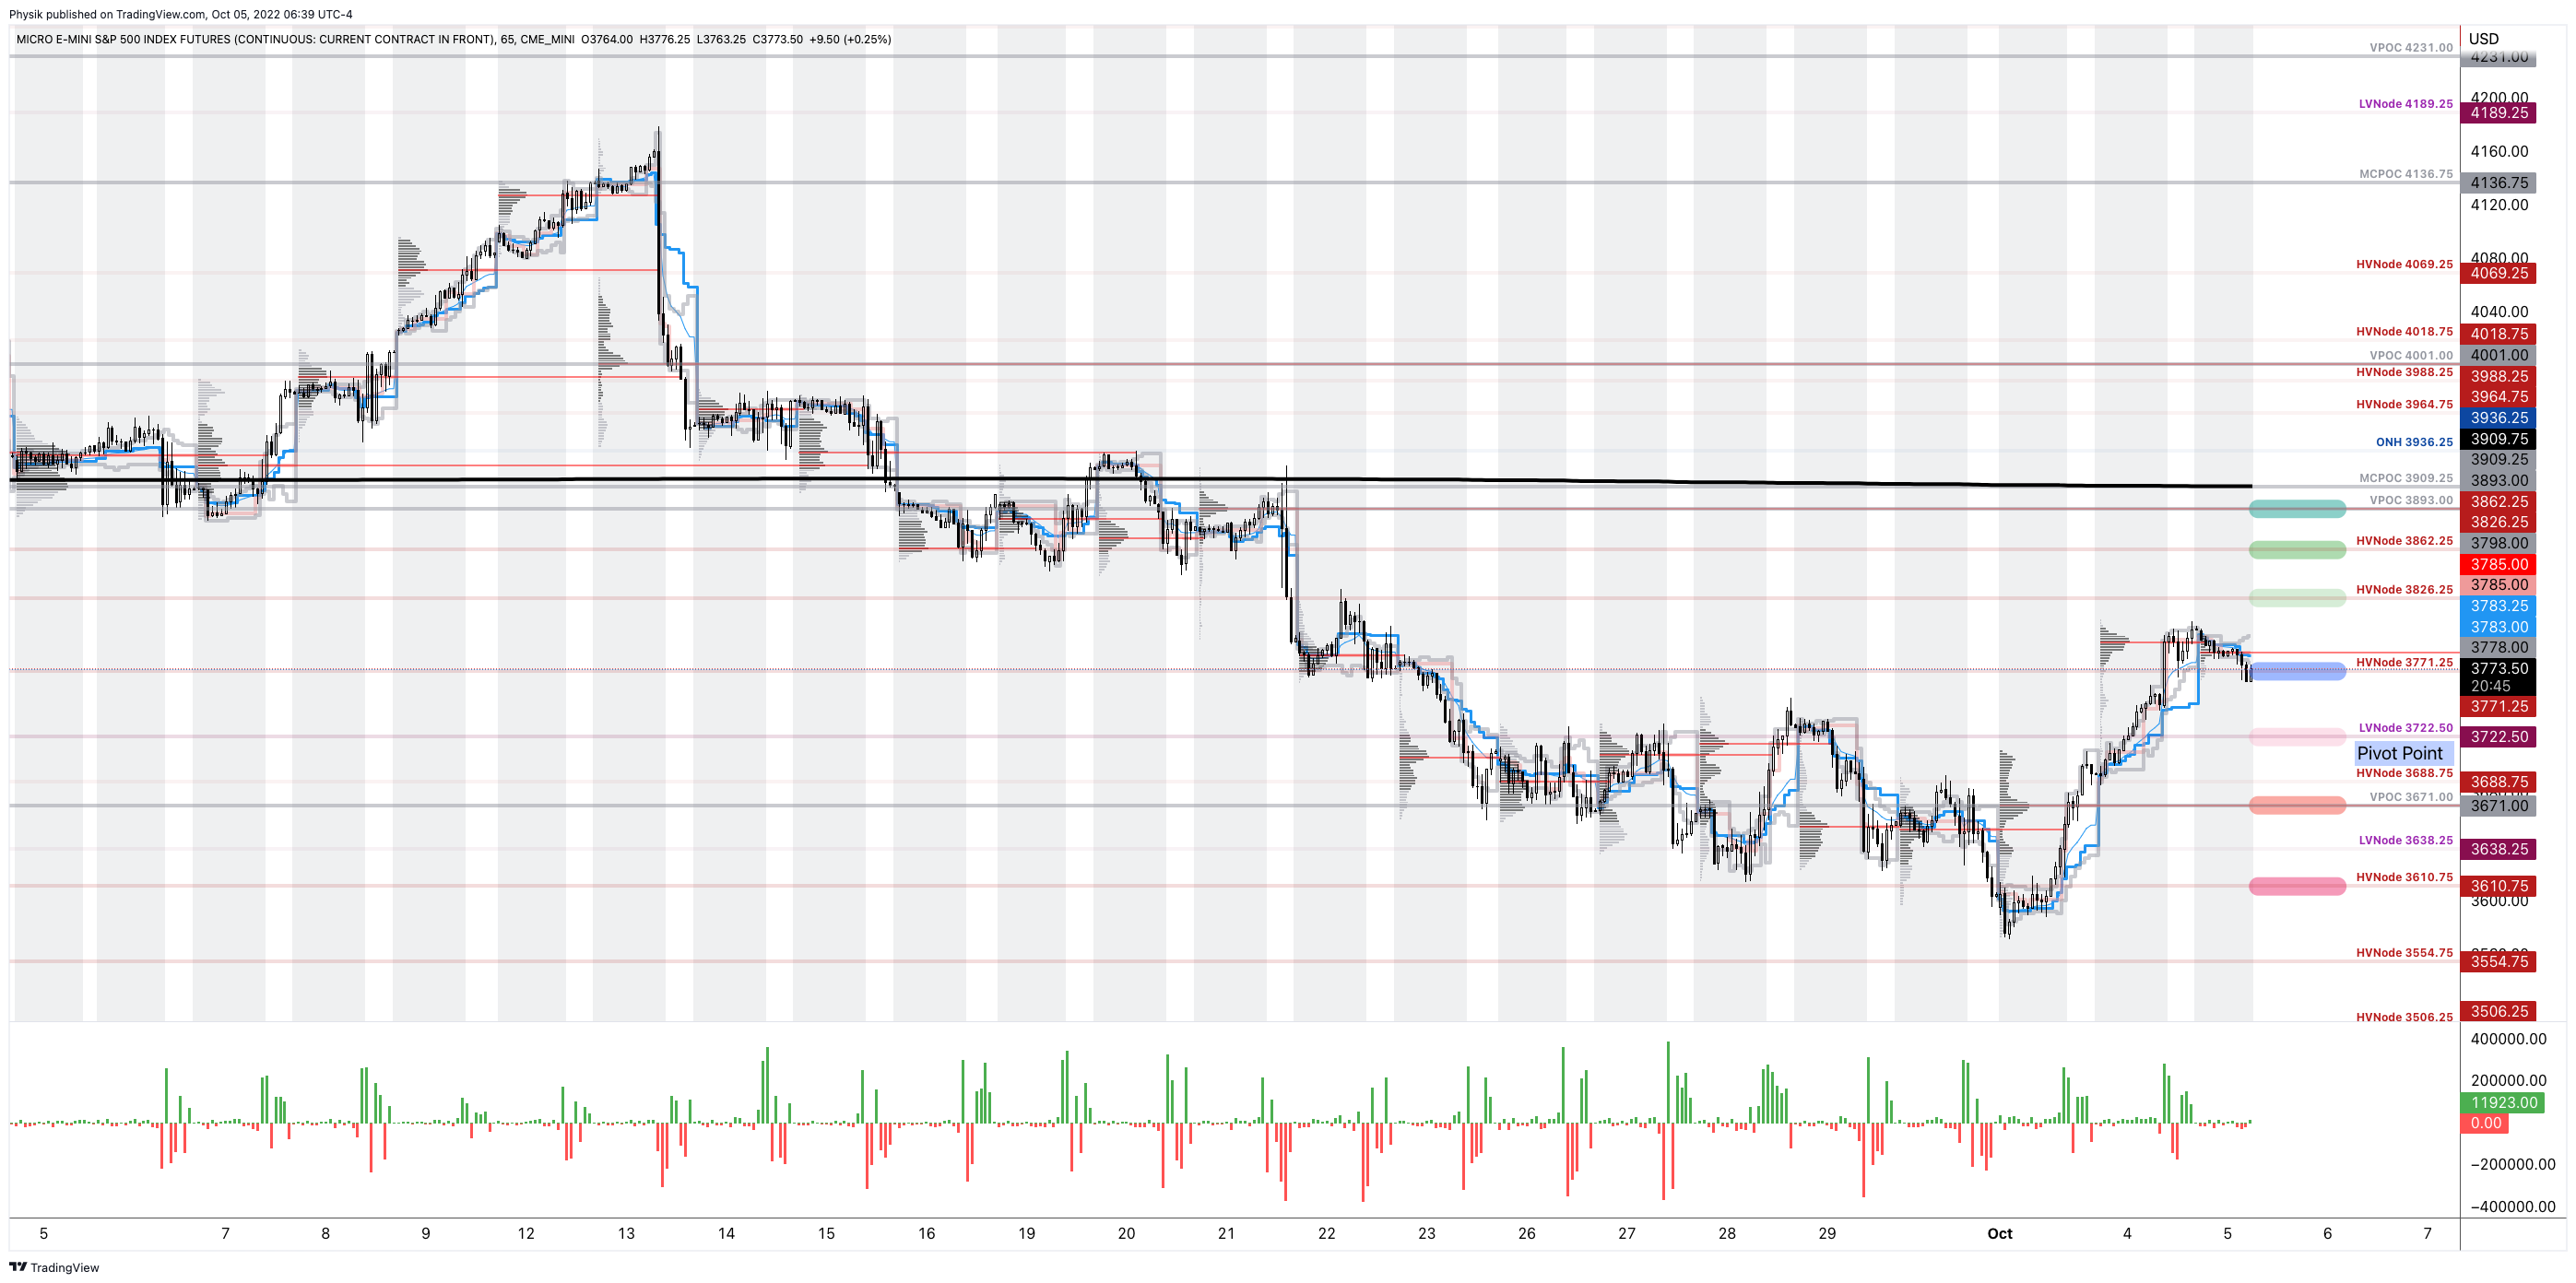
As of 6:40 AM ET, Wednesday’s regular session (9:30 AM – 4:00 PM ET), in the S&P 500, is likely to open in the lower part of a negatively skewed overnight inventory, inside of prior-range and -value, suggesting a limited potential for immediate directional opportunity.

In the best case, the S&P 500 trades higher.

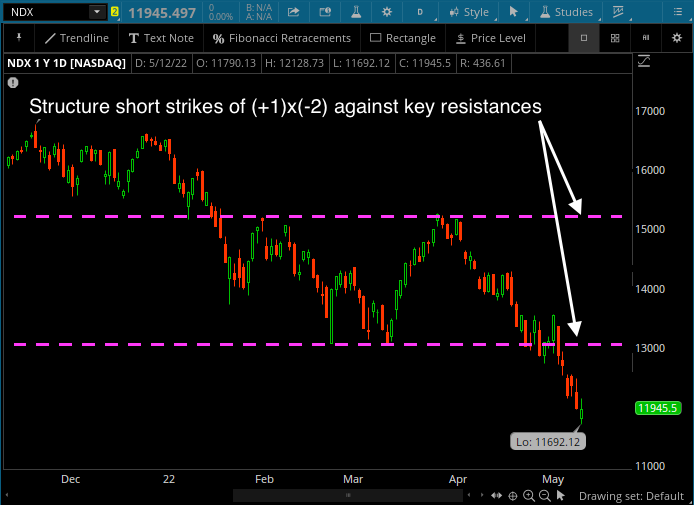
Any activity above the $3,771.25 HVNode puts into play the $3,826.25 HVNode. Initiative trade beyond the last-mentioned could reach as high as the $3,862.25 HVNode and $3,893.00 VPOC, or higher.

In the worst case, the S&P 500 trades lower.

Any activity below the $3,771.25 HVNode puts into play the $3,722.50 LVNode. Initiative trade beyond the LVNode could reach as low as the $3,671.00 VPOC and $3,610.75 HVNode, or lower.

Click here to load today’s key levels into the web-based TradingView charting platform. Note that all levels are derived using the 65-minute timeframe. New links are produced, daily.
Graphic: 65-minute profile chart of the Micro E-mini S&P 500 Futures.

Definitions

Volume Areas: A structurally sound market will build on areas of high volume (HVNodes). Should the market trend for long periods of time, it will lack sound structure, identified as low volume areas (LVNodes). LVNodes denote directional conviction and ought to offer support on any test. 

If participants were to auction and find acceptance into areas of prior low volume (LVNodes), then future discovery ought to be volatile and quick as participants look to HVNodes for favorable entry or exit.

POCs: POCs are valuable as they denote areas where two-sided trade was most prevalent in a prior day session. Participants will respond to future tests of value as they offer favorable entry and exit.

About

After years of self-education, strategy development, mentorship, and trial-and-error, Renato Leonard Capelj began trading full-time and founded Physik Invest to detail his methods, research, and performance in the markets.

Capelj also develops insights around impactful options market dynamics at SpotGamma and is a Benzinga reporter.

Some of his works include conversations with ARK Invest’s Catherine Wood, investors Kevin O’Leary and John Chambers, FTX’s Sam Bankman-Fried, ex-Bridgewater Associate Andy Constan, Kai Volatility’s Cem Karsan, The Ambrus Group’s Kris Sidial, among many others.

Disclaimer

In no way should the materials herein be construed as advice. Derivatives carry a substantial risk of loss. All content is for informational purposes only.

Categories
Commentary

Daily Brief For July 19, 2022

The daily brief is a free glimpse into the prevailing fundamental and technical drivers of U.S. equity market products. Join the 300+ that read this report daily, below!

Graphic updated 6:50 AM ET. Sentiment Neutral if expected /ES open is inside of the prior day’s range. /ES levels are derived from the profile graphic at the bottom of the following section. Levels may have changed since initially quoted; click here for the latest levels. SqueezeMetrics Dark Pool Index (DIX) and Gamma (GEX) calculations are based on where the prior day’s reading falls with respect to the MAX and MIN of all occurrences available. A higher DIX is bullish. At the same time, the lower the GEX, the more (expected) volatility. Learn the implications of volatility, direction, and moneyness. Breadth reflects a reading of the prior day’s NYSE Advance/Decline indicator. VIX reflects a current reading of the CBOE Volatility Index (INDEX: VIX) from 0-100.

Fundamental

After the release of data on consumer prices, earlier this month, the belief was that a de-rate, on inflation, was, potentially, nearing an end, although it was likely to remain at a “higher level than we’ve seen historically,” per the likes of Chevron Corporation’s (NYSE: CVX) CEO Mike Wirth.

Read: National Association of Homebuilders (NAHB) Housing Market Index (HMI) sees record decline. Rental markets cooling. Foreign buying jumps. Food to be the ultimate weapon in the 21st century.

Graphic: Retrieved from Randy Woodward. “Bloomberg commodities index vs. headline CPI.”

Now comes an even deeper compression on earnings?

Graphic: Retrieved from Callum Thomas. “Clear downward momentum in earnings revisions, only 33% of analyst earnings estimates have been revised upward (i.e. the rest downward) — matches the worsening macro.”

Well, maybe. Based on executives’ perspectives, we’re probably “talking ourselves into a recession,” precisely what the likes of Robert Shiller have expressed worry on.

Accordingly, participants are now pricing in shaky earnings, selling the stock of Goldman Sachs Group Inc (NYSE: GS), Apple Inc (NASDAQ: AAPL), and beyond, on those firms’ preparations for an increased potential for an economic downturn.

Up until this week, the Nasdaq 100 (INDEX: NDX) was doing better, consolidating for a potential break above a key response area, like the S&P 500 (INDEX: SPX), highlighted in a section further below.

It failed after the release of earnings from some index heavyweights.

Graphic: Retrieved from Bloomberg. “The Nasdaq 100, down 27% for the year so far, had briefly managed to get above its 50-day moving average on Monday, suggesting that the relentless downward trend was over — but the index failed to stay there, thanks in large part to Apple.”

Pessimism is incredibly strong among investors, however, a sort-of contrarian signal.

In spite of some Bank of America Corporation (NYSE: BAC) indicators pointing to poor fundamentals, sentiment is suggestive of a looming “stocks/credit rally in coming weeks.”

Graphic: Retrieved from Bloomberg. “Investors slashed their exposure to risk assets to levels not seen even during the global financial crisis in a sign of full capitulation amid a “dire” economic outlook, according to Bank of America Corp.’s monthly fund manager survey.”

Positioning

Though we’re far more than halfway through a dot-com type collapse that’s happened “underneath the surface of the indices,” per Simplify Asset Management’s Mike Green, still-strong passive flows continue to support the largest stocks within the indexes.

Graphic: Retrieved from The Market Ear. Via Barclays PLC (NYSE: BCS).

At the same time, options volumes show traders concentrating less on bullish strategies in the single stocks, while the index flows remain steady.

Graphic: Via Deutsche Bank AG (NYSE: DB).

Looking at skew on something like the tech- and growth-heavy Nasdaq 100 (INDEX: NDX), our comments in prior letters (regarding volatility supply from the re-hedging of defensive structures on the put side and volatility demand on the call side from the positioning for a reversal) appear still valid.

Read: Daily Brief for July 15, 2022.

Therefore, spread opportunities still exist and remain attractive.

Graphic: Via Charles Schwab Corporation-owned (NYSE: SCHW) TD Ameritrade’s Thinkorswim. Skew resembles more of a smile, rather than a smirk.

Read: Trading Volatility, Correlation, Term Structure and Skew by Colin Bennett.

Technical

As of 6:45 AM ET, Tuesday’s regular session (9:30 AM – 4:00 PM ET), in the S&P 500, is likely to open in the upper part of a positively skewed overnight inventory, inside of prior-range and -value, suggesting a limited potential for immediate directional opportunity.

In the best case, the S&P 500 trades higher.

Any activity above the $3,867.25 LVNode puts into play the $3,895.00 VPOC. Initiative trade beyond the VPOC could reach as high as the $3,909.25 MCPOC and $3,943.25 HVNode, or higher.

In the worst case, the S&P 500 trades lower.

Any activity below the $3,867.25 LVNode puts into play the $3,829.75 MCPOC. Initiative trade beyond the MCPOC could reach as low as the $3,800.75 LVNode and $3,770.75 HVNode, or lower.

Click here to load today’s key levels into the web-based TradingView charting platform. Note that all levels are derived using the 65-minute timeframe. New links are produced, daily.
Graphic: 65-minute profile chart of the Micro E-mini S&P 500 Futures.

Considerations: Responsiveness near key-technical areas (that are discernable visually on a chart), suggests technically-driven traders with short time horizons are very active. 

Such traders often lack the wherewithal to defend retests and, additionally, the type of trade may be indicative of the other time frame participants waiting for more information to initiate trades.

Definitions

Volume Areas: A structurally sound market will build on areas of high volume (HVNodes). Should the market trend for long periods of time, it will lack sound structure, identified as low volume areas (LVNodes). LVNodes denote directional conviction and ought to offer support on any test. 

If participants were to auction and find acceptance into areas of prior low volume (LVNodes), then future discovery ought to be volatile and quick as participants look to HVNodes for favorable entry or exit.

POCs: POCs are valuable as they denote areas where two-sided trade was most prevalent in a prior day session. Participants will respond to future tests of value as they offer favorable entry and exit.

MCPOCs: POCs are valuable as they denote areas where two-sided trade was most prevalent over numerous day sessions. Participants will respond to future tests of value as they offer favorable entry and exit.

Volume-Weighted Average Prices (VWAPs): A metric highly regarded by chief investment officers, among other participants, for quality of trade. Additionally, liquidity algorithms are benchmarked and programmed to buy and sell around VWAPs.

About

After years of self-education, strategy development, mentorship, and trial-and-error, Renato Leonard Capelj began trading full-time and founded Physik Invest to detail his methods, research, and performance in the markets.

Capelj also develops insights around impactful options market dynamics at SpotGamma and is a Benzinga reporter.

Some of his works include conversations with ARK Invest’s Catherine Wood, investors Kevin O’Leary and John Chambers, FTX’s Sam Bankman-Fried, former Bridgewater Associate Andy Constan, Kai Volatility’s Cem Karsan, The Ambrus Group’s Kris Sidial, among many others.

Disclaimer

In no way should the materials herein be construed as advice. Derivatives carry a substantial risk of loss. All content is for informational purposes only.

Categories
Commentary

Daily Brief For July 15, 2022

The daily brief is a free glimpse into the prevailing fundamental and technical drivers of U.S. equity market products. Join the 300+ that read this report daily, below!

Graphic updated 6:35 AM ET. Sentiment Neutral if expected /ES open is inside of the prior day’s range. /ES levels are derived from the profile graphic at the bottom of the following section. Levels may have changed since initially quoted; click here for the latest levels. SqueezeMetrics Dark Pool Index (DIX) and Gamma (GEX) calculations are based on where the prior day’s reading falls with respect to the MAX and MIN of all occurrences available. A higher DIX is bullish. At the same time, the lower the GEX, the more (expected) volatility. Learn the implications of volatility, direction, and moneyness. Breadth reflects a reading of the prior day’s NYSE Advance/Decline indicator. VIX reflects a current reading of the CBOE Volatility Index (INDEX: VIX) from 0-100.

Fundamental

Note: A really interesting discussion in the below positioning section which tidies up some of the past analyses we’ve made. Read on for more!

Ahead are updates on retail sales, import prices, Empire State Manufacturing (8:30 AM ET), industrial production and capacity utilization (9:15 AM ET), as well as University of Michigan consumer sentiment and inflation expectations, and business inventories (10:00 AM ET).

This week, markets repriced after data on inflation came in hot. Participants have bet on tough action from the Federal Reserve (Fed). Now, there is a near-50% chance of a 100 basis point hike later in July.

Graphic: Via CME Group Inc’s (NASDAQ: CME) FedWatch Tool.

Per The Macro Compass, published by Alfonso Peccatiello, companies have downgraded their outlooks and job creation “is much less impressive” amid labor force shrinkage.

“[T]he number of total employed people in the US divided by its total population in the 25-54y age bracket dropped below 80%,” he explains. “Over the last 30 years, at the peak of each economic cycle, this ratio was over 80%.”

Accordingly, earnings “are nowhere near pricing the economic slowdown, … [and there still remains] way too much optimism.”

Graphic: Retrieved from The Market Ear. Via Barclays Plc (NYCE: BCS).

Additionally, commodities (even more so those that are industrial and “are the cleanest expression of global demand”) have endured selling pressure with a near 30% copper drawdown likely to precede positive total returns for long bonds, Peccatiello explains.

Graphic: Retrieved from Callum Thomas. With “[r]ecessions see[ing] oil prices fall by 20% to 70%, … being bullish on oil at this point is either betting against history or [] recession.”

Positioning

The drawdown in commodities is significant as that was, arguably, the last place that offered participants a hedge against their poorly performing bond and equity exposures. 

“A lot of people allocated to commodity trend following and that did a good job in the first two quarters,” The Ambrus Group’s Kris Sidial explained

“CTAs were performing and you had a lot of people who did not need to buy [equity] volatility because their portfolios were covered from the inflation hedges.”

Graphic: Shared by Benn Eifert of QVR Advisors.

That, coupled with the sale of ultra-short-dated volatility, particularly in some of the single names to capture “rich” volatility, as well as hedging of structured products issuances, continues to play into suppressed index volatility.

For context: Rising rates and a drive for yield have been a boon for exotic derivatives. 

Participants often seek exposure to products that are essentially short volatility a year or so out. The counterparty, here, is long volatility on these notes. To hedge risk – since “you can’t just be long volatility, … [otherwise] you’ll bleed money for long periods of time” – the bank will hedge risk in the listed market. 

However, on a one-year auto-callable, for which it would be appropriate to sell one-year volatility in the listed market, “some of these banks … create this synthetic calendar profile where they’re … sell[ing] a little bit of one-month vol because they can take in that theta a whole lot faster, or two- and three-month vol,” spreading exposure in buckets.

See, here, for a sample presentation on what is an Auto-Callable Yield Note.

This suppresses “vol in the front of the term structure, and … opens up the door to … that other move where if everybody is selling vol in the front of the term structure,” it may blow out on a large increase in demand.

“If you look back during COVID, there are articles about banks that lost a lot of money because of the[ir] hedges. This has happened previously and you’re seeing little blips of it start to” return.
Graphic: Retrieved from The Ambrus Group’s Kris Sidial. “[S]ome dealers will opportunistically look to sell vol in some buckets in the front of the term structure.”

Basically, “the macro landscape … opened up another area to hedge” which resulted in the increased movement of realized equity (RVOL) volatility, relative to that which is implied (IVOL).

Graphic: Via S&P Global Inc (NYSE: SPGI). As explained by SpotGamma, “30-day realized SPX volatility is now trading above the VIX, something that generally shows after major selloffs wherein IV “premium” needs to reset to calmer/higher equity markets.”

Now, with commodities not offering protection, one has to be concerned if “the flock move[s].”

“If commodities are not performing, they’re not going to work as a hedge for your portfolio. That opens the door … [to] markets sliding lower and [people] need[ing] to get hedges on,” which is likely to bid equity volatility where some single names “are only trading three to four vol points above where they were trading in January of 2020,” the complete dismissal of a crash.

Therefore, “if you wanted to go out and hedge, the opportunity is still there in the equity space.”

Technical

As of 6:30 AM ET, Friday’s regular session (9:30 AM – 4:00 PM ET), in the S&P 500, is likely to open in the middle part of a balanced overnight inventory, inside of prior-range and -value, suggesting a limited potential for immediate directional opportunity.

In the best case, the S&P 500 trades higher.

Any activity above the $3,807.00 VPOC puts into play the $3,830.75 MCPOC. Initiative trade beyond the MCPOC could reach as high as the $3,867.25 LVNode and $3,909.25 MCPOC, or higher.

In the worst case, the S&P 500 trades lower.

Any activity below the $3,807.00 VPOC puts into play the $3,770.75 HVNode. Initiative trade beyond the HVNode could reach as low as the $3,751.00 VPOC and $3,722.50 LVNode, or lower.

Click here to load today’s key levels into the web-based TradingView charting platform. Note that all levels are derived using the 65-minute timeframe. New links are produced, daily.
Graphic: 65-minute profile chart of the Micro E-mini S&P 500 Futures.

Considerations: Responsiveness near key-technical areas (that are discernable visually on a chart), suggests technically-driven traders with short time horizons are very active. 

Such traders often lack the wherewithal to defend retests and, additionally, the type of trade may be indicative of the other time frame participants waiting for more information to initiate trades.

Definitions

Volume Areas: A structurally sound market will build on areas of high volume (HVNodes). Should the market trend for long periods of time, it will lack sound structure, identified as low volume areas (LVNodes). LVNodes denote directional conviction and ought to offer support on any test. 

If participants were to auction and find acceptance into areas of prior low volume (LVNodes), then future discovery ought to be volatile and quick as participants look to HVNodes for favorable entry or exit.

POCs: POCs are valuable as they denote areas where two-sided trade was most prevalent in a prior day session. Participants will respond to future tests of value as they offer favorable entry and exit.

MCPOCs: POCs are valuable as they denote areas where two-sided trade was most prevalent over numerous day sessions. Participants will respond to future tests of value as they offer favorable entry and exit.

Volume-Weighted Average Prices (VWAPs): A metric highly regarded by chief investment officers, among other participants, for quality of trade. Additionally, liquidity algorithms are benchmarked and programmed to buy and sell around VWAPs.

About

After years of self-education, strategy development, mentorship, and trial-and-error, Renato Leonard Capelj began trading full-time and founded Physik Invest to detail his methods, research, and performance in the markets.

Capelj also develops insights around impactful options market dynamics at SpotGamma and is a Benzinga reporter.

Some of his works include conversations with ARK Invest’s Catherine Wood, investors Kevin O’Leary and John Chambers, FTX’s Sam Bankman-Fried, former Bridgewater Associate Andy Constan, Kai Volatility’s Cem Karsan, The Ambrus Group’s Kris Sidial, among many others.

Disclaimer

In no way should the materials herein be construed as advice. Derivatives carry a substantial risk of loss. All content is for informational purposes only.

Categories
Commentary

Daily Brief For May 13, 2022

The daily brief is a free glimpse into the prevailing fundamental and technical drivers of U.S. equity market products. Join the 300+ that read this report daily, below!

What Happened

Overnight, equity indices probed higher, above Thursday’s trade, which established a new swing low. The Cboe Volatility Index (INDEX: VIX) fell while yields were bid and commodities mixed.

Today, we’ll get into some key narratives including crypto turmoil and financial conditions, as well as a validation of some of our trade theses.

Ahead is data on import prices (8:30 AM ET), University of Michigan consumer sentiment and inflation expectations (10:00 AM ET), as well as Fed-speak by Neel Kashkari (11:00 AM ET).

Take care and watch your risk.

Graphic updated 6:40 AM ET. Sentiment Risk-On if expected /ES open is above the prior day’s range./ES levels are derived from the profile graphic at the bottom of the following section. Levels may have changed since initially quoted; click here for the latest levels. SqueezeMetrics Dark Pool Index (DIX) and Gamma (GEX) calculations are based on where the prior day’s reading falls with respect to the MAX and MIN of all occurrences available. A higher DIX is bullish. At the same time, the lower the GEX, the more (expected) volatility. Learn the implications of volatility, direction, and moneyness. SHIFT data used for S&P 500 (INDEX: SPX) options activity. Note that options flow is sorted by the call premium spent; if more positive, then more was spent on call options. Breadth reflects a reading of the prior day’s NYSE Advance/Decline indicator. VIX reflects a current reading of the CBOE Volatility Index (INDEX: VIX) from 0-100.

What To Expect

Fundamental: In the news, panic in the cryptocurrency markets eased and Tether (CRYPTO: USDT-USD), the world’s largest stablecoin, backed by commercial paper and U.S. Treasuries, climbed back to par.

JPMorgan Chase & Co’s (NYSE: JPM) Teresa Ho said there would be little impact on traditional funding markets while, according to Barclays PLC’s (NYSE: BCS) Joseph Abate, redemptions in Tether, which has a market value just shy of $90-100 billion, would only “cause meaningful strains in money markets should they exceed half of the stablecoin’s total holdings.”

Graphic: Via Bloomberg.

Also in the news are rising interest rates (e.g., mortgage rates up to ~5.30%) and a weak equity market (e.g., S&P 500 lower ~20%), among other things, feeding into a tightening of financial conditions (which is how monetary policy impacts the economy).

Graphic: Via Bloomberg.

“Financial conditions for households and businesses wanting to borrow or raise capital tightened again last week and are the most restrictive since the first wave of the pandemic in 2020 and before that 2012,” Reuters’ John Kemp said.

Graphic: Via John Kemp.

This is as inflation has become “deeply embedded,” spreading from the energy and raw materials-intensive merchandise sector to services.

Graphic: Via John Kemp.

“Rapid service sector price increases usually signal the imminent arrival of a recession,” Kemp said, pointing to decisions by some public companies like Uber Inc (NYSE: UBER), Twitter Inc (NYSE: TWTR), and Amazon Inc (NASDAQ: AMZN) to slow growth and cut labor forces as a validation of slowing momentum.

Graphic: Via Bloomberg. “I think we’re primed for a big distressed supply surge,” said Phil Brendel, a distressed debt analyst for Bloomberg Intelligence. “Everyone gets comfortable and complacent on credit and then when it turns, you tend to see these massive spikes.”

The accelerated selling of equities (~$6.2 billion), bonds (~11.4 billion), cash (~$19.7 billion), and some commodities (~$1.8 billion in gold), over the last week, per Bank of America Corporation’s (NYSE: BAC) Michael Hartnett is capitulation. 

“The definition of true capitulation is investors selling what they love,” Hartnett said, gauging the prospects that stocks have hit a near-term bottom. “Fear and loathing suggest stocks are prone to an imminent bear market rally, but we do not think ultimate lows have been reached.”

Positioning: In past commentaries, we talked about ways to play a returns distribution that is skewed to the upside (albeit, with large negative outliers).

Graphic: Via Physik Invest. Data retrieved from SqueezeMetrics. A higher DIX/GEX ratio has historically been associated with S&P 500 outperformance in the subsequent month. A very low DIX/GEX ratio has historically been associated with positive S&P 500 performance in the subsequent month, though there are many more negative outliers.

The following Goldman Sachs Group Inc (NYSE: GS) remark is a validation of what we’ve discussed:

“Even though the VIX’s reaction to recent spot downside has been mild, its high starting point leaves vol high overall, and we like strategies with a short volatility bias, including put selling and 1×2 call spread overlays.”

Graphic: Via Goldman Sachs Group Inc. Taken from The Market Ear.

Mainly, zero- and low-cost bets ($0.00-$1.00 debit to open) that deliver asymmetric payouts (sometimes in excess of $10.00 credit to close) in case of violent and short-lived reversals. 

Personally, this letter’s author is structured positive delta and gamma in the Nasdaq 100 (INDEX: NDX) via ratios spread (1×2) and butterfly (1x2x1) structures.

Graphic: Via Banco Santander SA (NYSE: SAN) research, the return profile, at expiry, of a classic 1×2 (long 1, short 2 further away) ratio spread.

As stated before, width and timing are everything. 

Too much time or too narrow may result in asymmetric losses when the demand for upside bets further out in price and time bids the skew that you’re short, relative to the at-the-money volatility you own.

Ten to fifteen days to expiration and 500-1000 points wide, in the Nasdaq 100 (INDEX: NDX), one of the hardest hit of the indexes, work well. 

An easy check is whether the spread prices for a debit or credit to close if the underlying moves to the long strike of the spread, all else equal.

Debits (which may run as low as $0.00, depending on trade location) can be offset with credits from put sales.

Graphic: Chart of the Nasdaq 100 (INDEX: NDX).

Technical: As of 6:45 AM ET, Friday’s regular session (9:30 AM – 4:00 PM ET), in the S&P 500, will likely open in the upper part of a positively skewed overnight inventory, outside of prior-range and -value, suggesting a higher potential for immediate directional opportunity.

In the best case, the S&P 500 trades higher; activity above the $3,978.50 low volume node (LVNode) puts into play the $4,011.00 untested point of control (VPOC). Initiative trade beyond the VPOC could reach as high as the $4,069.25 high volume area (HVNode) and $4,119.00 VPOC, or higher.

In the worst case, the S&P 500 trades lower; activity below the $3,978.50 LVNode puts into play the $3,943.25 HVNode. Initiative trade beyond the HVNode could reach as low as the $3,899.00 VPOC and $3,862.75 LVNode, or lower.

Click here to load today’s key levels into the web-based TradingView charting platform. Note that all levels are derived using the 65-minute timeframe. New links are produced, daily.
Graphic: 65-minute profile chart of the Micro E-mini S&P 500 Futures.

Considerations: Gap scenarios are in play.

Gaps ought to fill quickly. Should they not, that’s a signal of strength; do not fade. Leaving value behind on a gap-fill or failing to fill a gap (i.e., remaining outside of the prior session’s range) is a go-with indicator.

Auctioning and spending at least 1-hour of trade back in the prior range suggests a lack of conviction; in such a case, do not follow the direction of the most recent initiative activity.

Definitions

Volume Areas: A structurally sound market will build on areas of high volume (HVNodes). Should the market trend for long periods of time, it will lack sound structure, identified as low volume areas (LVNodes). LVNodes denote directional conviction and ought to offer support on any test. 

If participants were to auction and find acceptance into areas of prior low volume (LVNodes), then future discovery ought to be volatile and quick as participants look to HVNodes for favorable entry or exit.

POCs: POCs are valuable as they denote areas where two-sided trade was most prevalent in a prior day session. Participants will respond to future tests of value as they offer favorable entry and exit.

MCPOCs: POCs are valuable as they denote areas where two-sided trade was most prevalent over numerous day sessions. Participants will respond to future tests of value as they offer favorable entry and exit.

About

After years of self-education, strategy development, mentorship, and trial-and-error, Renato Leonard Capelj began trading full-time and founded Physik Invest to detail his methods, research, and performance in the markets.

Capelj also develops insights around impactful options market dynamics at SpotGamma and is a Benzinga reporter.

Some of his works include conversations with ARK Invest’s Catherine Wood, investors Kevin O’Leary and John Chambers, FTX’s Sam Bankman-Fried, Kai Volatility’s Cem Karsan, The Ambrus Group’s Kris Sidial, among many others.

Disclaimer

In no way should the materials herein be construed as advice. Derivatives carry a substantial risk of loss. All content is for informational purposes only.

Categories
Commentary

Daily Brief For April 29, 2022

The Daily Brief is a free glimpse into the prevailing fundamental and technical drivers of U.S. equity market products. Join the 200+ that read this report daily, below!

What Happened

Overnight, equity index futures auctioned sideways-to-lower after a mid-day price bump Thursday, on the heels of dismal earnings, among other things including a contraction in economic growth, last quarter.

Amazon Inc (NASDAQ: AMZN) shares fell after the company projected sluggish sales as well as higher costs.

Apple Inc (NASDAQ: AAPL) saw strong sales and profit help top estimates. The company announced a $90 billion share buyback and fears over supply constraints.

Tesla Inc’s (NASDAQ: TSLA) Elon Musk offloaded $4 billion worth of shares just after his deal to buy Twitter Inc (NYSE: TWTR) was reached days before.

Also in the news: Russia’s urgency to avoid a default. Food Inflation hits an all-time high. China’s currency plunge raises the risk of 2015-style panic. No-money-down crypto mortgages and why housing may be topping. Barclays PLC (NYSE: BCS) halts ETN sales.

Ahead is data on the employment cost index, PCE, personal income and consumer spending (8:30 AM ET), as well as Chicago PMI (9:45 AM ET), and University of Michigan consumer sentiment and inflation expectations (10:00 AM ET).

Graphic updated 6:30 AM ET. Sentiment Neutral if expected /ES open is inside of the prior day’s range. /ES levels are derived from the profile graphic at the bottom of the following section. Levels may have changed since initially quoted; click here for the latest levels. SqueezeMetrics Dark Pool Index (DIX) and Gamma (GEX) calculations are based on where the prior day’s reading falls with respect to the MAX and MIN of all occurrences available. A higher DIX is bullish. At the same time, the lower the GEX, the more (expected) volatility. Learn the implications of volatility, direction, and moneyness. SHIFT data used for S&P 500 (INDEX: SPX) options activity. Note that options flow is sorted by the call premium spent; if more positive, then more was spent on call options. Breadth reflects a reading of the prior day’s NYSE Advance/Decline indicator. VIX reflects a current reading of the CBOE Volatility Index (INDEX: VIX) from 0-100.

What To Expect

Fundamental: In hindsight, a very volatile week characterized by large, two-sided action and little constructive movement (i.e., a week that ended sideways rather than up or down).

Graphic: Via Bloomberg. Indexes sideways, mainly, as large constituents report their earnings.

This is ahead of what many think is likely to be front-loaded 50 basis point tightening next week and in June with rates, ultimately, trading in the range of 2.25-2.50% end-of-year.

Graphic: Via CME Group Inc’s (NASDAQ: CME) FedWatch Tool.

In light of tightening expectations, Columbia Threadneedle’s Gene Tannuzzo says “Tighter financial conditions are the mechanism that reduces demand and ultimately slows inflation.”

Graphic: Via Bloomberg. Financial conditions have started to tighten.

“If financial conditions don’t tighten [i.e., stocks regain their swagger] and inflation remains high, in their eyes, they need to hike more.”

Graphic: Via S&P Global Inc (NYSE: SPGI). Food Inflation Hits All-Time High, Fuels Security Risks.

In regards to balance sheet reduction, “QT will consist of run-off caps of USD 60bn for US Treasuries (UST) and USD 35bn for mortgage-backed securities (MBS), which will make up for a cap of USD 95bn per month going forward,” Nordea Bank (OTC: NRDBY) research says.

“The balance sheet reduction will revolve around coupon securities, with the Fed’s c. USD 326bn Treasury bills only allowed roll-off in months when maturing caps do not reach the cap. We expect the Fed to use a 3-month roll-on period in its reduction, which will make up for a relatively smooth and predictable treasury run-off.”

Positioning: Our April 27 discussion on positioning went into great detail on the likelihood of continued volatility and lower prices. 

On April 28 we noted the implications of heightened implied volatility and no follow-through to the downside. 

The returns distribution, based on implied volatility metrics alone, was skewed positive, albeit with a potential for large negative outliers.

Graphic: Via @HalfersPower. “In backwardation via $VIX: $VIX3M next month [realized volatility] is highest amongst the deciles (d10 >1) ~43% subsequent realized volatility.”

During Thursday’s trade, markets endured a near-vertical price rise alongside repositioning and what SpotGamma says is a “put-heavy expiration [Friday] (20% of gamma roll-off expected).”

Graphic: SpotGamma’s Hedging Impact of Real-Time Options indicator for the QQQ.

The idea is as follows: customers are well-hedged (customers own puts and/or are short calls) and this offers them positive, yet asymmetric (gamma), exposure to direction (delta). In other words, negative delta and positive gamma

The counterparty has exposure to positive delta and negative gamma. If the underlyings trade lower and volatility rises, all else equal, the position will lose. To hedge against these losses, the counterparties will sell underlying into weakness.

If this exposure is to roll off or underlying prices reverse and move higher, these counterparties will re-hedge and buy underlying. That’s what SpotGamma is hinting at.

Graphic: Via SpotGamma, the estimated gamma for calls by strike as a positive number and puts as a negative number on the S&P 500 ETF, the SPY. Notice the weight on the put side.

SpotGamma also notes: “VIX call open interest (blue) is near March ’20 highs. With VIX near 1-yr highs put interest (red) is near lows. Equity rally/vol decline seems like it would catch most everyone offsides.”

Graphic: Via SpotGamma.

Technical: As of 6:15 AM ET, Friday’s regular session (9:30 AM – 4:00 PM ET), in the S&P 500, will likely open in the middle part of a balanced overnight inventory, inside of prior-range and -value, suggesting a limited potential for immediate directional opportunity.

In the best case, the S&P 500 trades higher; activity above the $4,235.00 overnight low (ONL) puts in play the $4,279.75 overnight high (ONH). Initiative trade beyond the ONH could reach as high as the $4,303.50 regular trade high (RTH High) and $4,337.00 untested point of control (VPOC), or higher.

In the worst case, the S&P 500 trades lower; activity below the $4,235.00 ONL puts in play the $4,191.00 VPOC. Initiative trade beyond the VPOC could reach as low as the $4,182.50 ONL and $4,156.75 regular trade low (RTH Low), or lower.

Click here to load today’s key levels into the web-based TradingView charting platform. Note that all levels are derived using the 65-minute timeframe. New links are produced, daily.
Graphic: 65-minute profile chart of the Micro E-mini S&P 500 Futures.

Considerations: Into this week, markets were extremely weak alongside hawkish remarks from the Fed and dismal responses to earnings results, among other things.

Graphic: Via Bloomberg.

Then, as a major index – the Invesco QQQ Trust Series 1 (NASDAQ: QQQ) – tested a major VWAP anchored from the lows of March 2020. After, a rounded bottom began to form while implied volatility metrics continued to trend higher.

Graphic: Invesco QQQ Trust Series 1 (NASDAQ: QQQ) with anchored VWAPs.

Thursday’s price rise and volatility compression, particularly at the short-end of the term structure coincided with some of the strongest breadth in days. 

Notwithstanding, the entire advance was taken back overnight and now the S&P 500 is trading back inside a multi-day consolidation. 

If a short-term trader, playing responsively (i.e., fading edges) is likely the best course of action until the indexes, at least, are able to break above this week’s ranges and remain there (i.e., not trade back down).

Graphic: Market Internals as pioneered by (a mentor of mine) Peter Reznicek. Notice the indicator in the top right, weighted S&P sectors (histogram) versus unweighted (blue line). During late last week, participants sold the entire market, heavily (as supported by the difference between the volume flowing into stocks that are up versus those that are down).

Definitions

Overnight Rally Highs (Lows): Typically, there is a low historical probability associated with overnight rally-highs (lows) ending the upside (downside) discovery process.

Volume Areas: A structurally sound market will build on areas of high volume (HVNodes). Should the market trend for long periods of time, it will lack sound structure, identified as low volume areas (LVNodes). LVNodes denote directional conviction and ought to offer support on any test. 

If participants were to auction and find acceptance into areas of prior low volume (LVNodes), then future discovery ought to be volatile and quick as participants look to HVNodes for favorable entry or exit.

POCs: POCs are valuable as they denote areas where two-sided trade was most prevalent in a prior day session. Participants will respond to future tests of value as they offer favorable entry and exit.

Volume-Weighted Average Prices (VWAPs): A metric highly regarded by chief investment officers, among other participants, for quality of trade. Additionally, liquidity algorithms are benchmarked and programmed to buy and sell around VWAPs.

About

After years of self-education, strategy development, mentorship, and trial-and-error, Renato Leonard Capelj began trading full-time and founded Physik Invest to detail his methods, research, and performance in the markets.

Capelj also develops insights around impactful options market dynamics at SpotGamma and is a Benzinga reporter.

Some of his works include conversations with ARK Invest’s Catherine Wood, investors Kevin O’Leary and John Chambers, FTX’s Sam Bankman-Fried, Kai Volatility’s Cem Karsan, The Ambrus Group’s Kris Sidial, among many others.

Disclaimer

In no way should the materials herein be construed as advice. Derivatives carry a substantial risk of loss. All content is for informational purposes only.

Categories
Commentary

Daily Brief For April 27, 2022

The Daily Brief is a free glimpse into the prevailing fundamental and technical drivers of U.S. equity market products. Join the 200+ that read this report daily, below!

What Happened

Overnight, equity index futures probed higher, essentially negating Tuesday’s end-of-day, knee-jerk liquidation.

Tuesday’s selling came alongside Russia cutting gas to Poland and Bulgaria, Vice President Kamala Harris testing positive for COVID-19, and heavy selling in growth and tech stocks, amid doubts corporate profits can withstand the Federal Reserve’s bid to tame inflation.

As Jerome Schneider of Pacific Investment Management Co says, QT will “have a profound effect on the cost of liquidity and more importantly the cost of transacting business and reallocating assets from one avenue to another avenue.” 

“There might not necessarily be a rapid deceleration or decline in the stock market or other risk assets, but there’s going to be a changing cost of capital that this balance sheet is going to be part of.”

After the close, weakness continued. Alphabet Inc (NASDAQ: GOOGL) (NASDAQ: GOOG) missed on slowing sales growth and digital-ad spending. One of the biggest losers was Tesla Inc (NASDAQ: TSLA) which shed 12% or so on news that Elon Musk would use his fortune, much of which is tied up in Tesla, to buy Twitter Inc (NYSE: TWTR).

Germany’s passage of a bigger borrowing budget, coupled with China’s pledge to boost infrastructure bolstered an overnight advance that fed into price action at home. The S&P 500, in particular, for a brief moment, took back a key level, negating much of yesterday’s liquidation.

Ahead is data on international trade in goods (8:30 AM ET), as well as pending home sales and the rental vacancy rate (10:00 AM ET).

Graphic updated 7:00 AM ET. Sentiment Neutral if expected /ES open is inside of the prior day’s range. /ES levels are derived from the profile graphic at the bottom of the following section. Levels may have changed since initially quoted; click here for the latest levels. SqueezeMetrics Dark Pool Index (DIX) and Gamma (GEX) calculations are based on where the prior day’s reading falls with respect to the MAX and MIN of all occurrences available. A higher DIX is bullish. At the same time, the lower the GEX, the more (expected) volatility. Learn the implications of volatility, direction, and moneyness. SHIFT data used for S&P 500 (INDEX: SPX) options activity. Note that options flow is sorted by the call premium spent; if more positive, then more was spent on call options. Breadth reflects a reading of the prior day’s NYSE Advance/Decline indicator. VIX reflects a current reading of the CBOE Volatility Index (INDEX: VIX) from 0-100.

What To Expect

Positioning: Markets are positioned for continued volatility. 

Based on a reading of market gamma exposure (GEX) and buying support (DIX), the returns distribution is skewed positive. There’s buying in the context of an environment in which the hedging of options positioning implies selling into weakness and buying of strength.

Graphic: Via Barclays PLC (NYSE: BCS) research.

In the most simple way that I can explain: when positioning is stretched one way, that often tends to mark a turning point – the returns distribution is either skewed positive or negative.

Graphic: Via Physik Invest. Data via SqueezeMetrics. Updated March of 2022. A high DIX/GEX ratio often portends positive 1-month returns.

An updated read, after Tuesday’s weak close, tells us that we can (1) definitely expect larger ranges to continue and (2) potential for short-term bounces

Based on overnight activity, one of those is happening, now.

Graphic: Via Physik Invest. Data via SqueezeMetrics.

This is as participants are both well-hedged and using weakness as an opportunity to buy into a less highly valued market.

Well-hedged means that customers (i.e., you and I) own protection against long equity exposure. So, that could mean customers own puts and/or are short calls. One of the most dominant flows is the long put, short call.

Such trade offers customers positive, yet asymmetric (gamma), exposure to direction (delta). In other words, negative delta and positive gamma. 

The counterparty has exposure to positive delta and negative gamma. If the underlyings trade lower and volatility rises, all else equal, the position will lose. To hedge against these losses, the counterparties will sell underlying into weakness.

If prices reverse and move higher, these counterparties will re-hedge and buy underlying.

Normally, as seen over the bull run of 2020 and 2021, markets are in an uptrend and there’s a strong supply of volatility. Often, customers sell more calls than puts and, in an uptrend, those calls solicit more active hedging than the put options.

Recall that the customer is short the call. That means the counterparty is long the call (a positive delta and gamma trade) and will make money if prices rise, all else equal. 

The hedging of this particular exposure (i.e., sell strength, buy weakness), in an uptrend, occurs slower (i.e., counterparts will allow their profits to run), and that’s what can help the market sustain lower volatility trends for longer periods.

When prices reverse and underlyings trade lower, put options solicit increased hedging activity. Given the nature of counterparty exposure to those puts, that hedging happens quickly and can take from market liquidity as to volatility (i.e., buy strength, sell weakness).

See, below, E-mini S&P 500 book depth, a proxy for market liquidity, and how much it has declined since the end of last year when markets became more volatile and noise around the Federal Reserve’s intent to taper bond-buying and raise rates grew louder.

Graphic: Via CME Group Inc (NASDAQ: CME) Liquidity Tool. Note how in late March, book depth rose as markets rose and customer call activity solicited increased hedging of counterparty long-gamma exposure (i.e., buy weakness, sell strength), adding to market liquidity.

In the above environment, counterparty hedging matters; the market is more sensitive to the flow, so to speak. That sensitivity is expected to continue.

SpotGamma, an options data and analysis service, sees the early May period as pivotal. Then is the Federal Open Market Committee (FOMC) meeting and the potential Russian default, per Moody’s Corporation (NYSE: MCO).

As quoted: “Russia ‘may be considered in default’ if it does not pay two bonds in US dollars by end of a grace period on May 4.”

Graphic: Via Bloomberg.

Until those events are resolved, participants will likely continue to (remain) hedge(d). Upon resolve, customers likely monetize their protection to offset losses on underlying equity exposure. 

That means selling volatility which reduces counterparty exposure to short puts (negative gamma and positive delta). To re-hedge, underlying is bought back and that may support a price rise.

Graphic: VIX term structure via VIX Central. Expansion (higher) solicits counterparty selling which pressures the market lower. Compression (lower) solicits counterparty buying which bolsters attempts higher.

Whether that price rise has legs depends on what the fundamental situation is, then. See the below section titled Considerations for a full technical picture and the most likely turning points.

Technical: As of 7:00 AM ET, Wednesday’s regular session (9:30 AM – 4:00 PM ET), in the S&P 500, will likely open in the middle part of a balanced overnight inventory, inside of prior-range and -value, suggesting a limited potential for immediate directional opportunity.

In the best case, the S&P 500 trades higher; activity above the $4,217.25 overnight high (ONH) puts in play the $4,267.75 regular trade high (RTH High). Initiative trade beyond the RTH High could reach as high as the $4,303.75 ONH and $4,337.00 VPOC, or higher.

In the worst case, the S&P 500 trades lower; activity below the $4,217.25 ONH puts in play the $4,193.25 spike base. Initiative trade beyond the spike base could reach as low as the $4,136.50 regular trade low (RTH Low) and $4,101.25 overnight low (ONL), or lower.

Considerations: Spikes mark the beginning of a break from value. Spikes higher (lower) are validated by trade at or above (below) the spike base (i.e., the origin of the spike).

Additionally, the indexes continue to trade below their 20-, 50-, and 200-day simple moving averages, confirming the trend change and bearish tone (further validated by poor breadth).

Graphic: Market Internals as pioneered by (a mentor of mine) Peter Reznicek. Notice the indicator in the top right, weighted S&P sectors (histogram) versus unweighted (blue line). During late last week, participants sold the entire market, heavily (as supported by the difference between the volume flowing into stocks that are up versus those that are down).

All indexes remain, as stated, yesterday, below their volume-weighted average prices (VWAPs) anchored from the start of this year (or their respective peaks). 

VWAPs are a metric highly regarded by chief investment officers (CIOs), among other participants, for quality of trade. Liquidity algorithms, too, are benchmarked and programmed to buy and sell around VWAPs.

The Invesco QQQ Trust Series 1 (NASDAQ: QQQ) just tested a major VWAP, yesterday, anchored from the lows of March 2020. That’s a fair price to pay for Nasdaq 100 exposure.

Graphic: Invesco QQQ Trust Series 1 (NASDAQ: QQQ) with anchored VWAPs.

Notwithstanding, notice the flat-to-declining AVWAP that’s black in color. So long as prices remain below this level, the index is likely a sell. 

Should that level flatten (and begin to rise), and if the QQQ was able to trade above it for a sustained period, there is potential for sustained upside.

Click here to load today’s key levels into the web-based TradingView charting platform. Note that all levels are derived using the 65-minute timeframe. New links are produced, daily.
Graphic: 65-minute profile chart of the Micro E-mini S&P 500 Futures.

Definitions

Overnight Rally Highs (Lows): Typically, there is a low historical probability associated with overnight rally-highs (lows) ending the upside (downside) discovery process.

Volume Areas: A structurally sound market will build on areas of high volume (HVNodes). Should the market trend for long periods of time, it will lack sound structure, identified as low volume areas (LVNodes). LVNodes denote directional conviction and ought to offer support on any test. 

If participants were to auction and find acceptance into areas of prior low volume (LVNodes), then future discovery ought to be volatile and quick as participants look to HVNodes for favorable entry or exit.

POCs: POCs are valuable as they denote areas where two-sided trade was most prevalent in a prior day session. Participants will respond to future tests of value as they offer favorable entry and exit.

About

After years of self-education, strategy development, mentorship, and trial-and-error, Renato Leonard Capelj began trading full-time and founded Physik Invest to detail his methods, research, and performance in the markets.

Capelj also develops insights around impactful options market dynamics at SpotGamma and is a Benzinga reporter.

Some of his works include conversations with ARK Invest’s Catherine Wood, investors Kevin O’Leary and John Chambers, FTX’s Sam Bankman-Fried, Kai Volatility’s Cem Karsan, The Ambrus Group’s Kris Sidial, among many others.

Disclaimer

In no way should the materials herein be construed as advice. Derivatives carry a substantial risk of loss. All content is for informational purposes only.

Categories
Commentary

Daily Brief For April 1, 2022

The Daily Brief is a free glimpse into the prevailing fundamental and technical drivers of U.S. equity market products. Join the 200+ that read this report daily, below!

What Happened

Overnight, equity index futures auctioned sideways to higher after their late-day liquidation and break from a multi-day consolidation area on technical factors (e.g., options expirations) among other things, potentially, like the increase in personal consumption expenditures.

Broadly speaking, the narrative that investors are showing some concern over the economic outlook, with respect to geopolitical tension and monetary policy, continues to emanate. 

U.S. high-grade bonds shed over 5%, booking the worst quarterly performance since the ‘80s. This is as recession risks have risen more than two-fold. 

Notwithstanding, the Federal Reserve’s (Fed) favorite yield curve metric remains steep; per a Bloomberg commentary, “the gap between the three-month bill rates and 10-year yields is the ‘most useful term spread for forecasting recessions,’ … [and] it currently stands at 186 basis points, versus negative 2 basis points on 2s10s.”

In terms of news, the U.K. will join the U.S. in releasing oil from its reserves to lower prices and reduce its reliance on external partners. This helped ease futures calendar spreads on oil, Reuters’ John Kemp said in a newsletter to followers; the “six-month spread [narrowing] to a backwardation of $9 per barrel, the lowest since before Russia’s invasion of Ukraine.”

Ahead is data on nonfarm payrolls, the unemployment rate and average hourly earnings, as well as labor-force participation (8:30 AM ET). Thereafter, the Chicago Fed’s Charles Evans is scheduled to speak (9:05 AM ET). 

Later is Markit manufacturing PMI (9:45 AM ET), as well as ISM manufacturing index and consumer spending data (10:00 AM ET).

Graphic updated 6:30 AM ET. Sentiment Neutral if expected /ES open is inside of the prior day’s range. /ES levels are derived from the profile graphic at the bottom of the following section. Levels may have changed since initially quoted; click here for the latest levels. SqueezeMetrics Dark Pool Index (DIX) and Gamma (GEX) calculations are based on where the prior day’s reading falls with respect to the MAX and MIN of all occurrences available. A higher DIX is bullish. At the same time, the lower the GEX, the more (expected) volatility. Learn the implications of volatility, direction, and moneyness. SHIFT data used for S&P 500 (INDEX: SPX) options activity. Note that options flow is sorted by the call premium spent; if more positive, then more was spent on call options. Breadth reflects a reading of the prior day’s NYSE Advance/Decline indicator. VIX reflects a current reading of the CBOE Volatility Index (INDEX: VIX) from 0-100.

What To Expect

Fundamental: The S&P 500 bagged its first quarterly loss in two years as recession probabilities, implied by some yield curves, have risen.

Graphic: Via Barclays. Taken from The Market Ear. “[T]he 1y ahead recession probability implied by the 3m10y curve rises to about 40% a year from now (so for an early 2024 recession), slightly higher than implied by other curves.”

This is as the stock performance, relative to bonds against the lagged spread of 10- and 2-year bond yields, is expected to be weak, according to insights by Pictet Asset Management.

Graphic; Via Pictet Asset Management Ltd. Taken from Bloomberg. “On this basis, stocks’ great outperformance this quarter may end up looking like a head-fake.”

Pictet’s narrative further validates some of the theses shared by institutions like Brevan Howard Asset Management, which is having one of its best years, Morgan Stanley (NYSE: MS), Goldman Sachs Group Inc (NYSE: GS), and Bank of America Corporation (NYSE: BAC).

Adding to the prospects for weaker earnings amid higher costs, among other things, some of these institutions see the potential for the Fed’s terminal rate to reach between 3% and 3.25%.

Graphic: Via Andreas Steno Larsen. “The Fed is now priced to hike to levels above 3% by Dec-2023, … which is the main reason why we have seen a sell-off in all assets with an intensive duration profile over the past 12-15 months … [and has] duration intensive assets … starting to look attractive again from a risk/reward perspective.”

This would hit valuations as higher yields both reduce the present value of future earnings and “hurt those carrying the highest leverage,” potentially playing into a slowdown or recession. 

Graphic: Via S&P Global Inc (NYSE: SPGI) “expects the economic damage [of geopolitics and pricing pressures] to lower U.S. GDP growth to 3.2% this year, matching its preliminary forecast in early March but a full 70 bps lower than its November forecast of 3.9%.”

“Now rates volatility can drive growth volatility and that actually becomes a vicious cycle between the two,” said Christian Mueller-Glissmann of Goldman Sachs. 

“That’s a big difference to the last cycle where growth volatility drove rates volatility.”

Graphic: Via Vanda. Taken from The Market Ear. “The bond market is pricing the 2022 cycle to be remarkably fast. Macro Alf: ‘Remember: sharp changes in borrowing conditions often cause non-linear reactions in a highly leveraged system.’”

However, this is as the dominance of rate-sensitive tech stocks is set to shrink next year amid sector reclassifications, as well as still-stimulative policy and beats of economic expectations that may feed into earnings surprises, later.

JPMorgan’s Marko Kolanoivc explains that (1) “both equity and credit markets have historically fared well at the start of monetary tightening cycles,” (2) “the real policy rate is extremely negative and thus stimulative,” and (3) “not all central banks are tightening.”

Morgan Stanley’s Michael Wilson vehemently disagrees suggesting the recent equity market turnaround “was nothing more than a vicious bear market rally,” and offers participants a clear opportunity to sell at better prices.

Taking all of the above comments and perspectives together, one thing is for certain: this period in history is like no other. It makes sense to pick a timeframe and stick with it. 

Positioning: In the past weeks, according to JPMorgan Chase & Co’s Nikolaos Panigirtzoglou, the supportive “rebalancing flows away from bonds into equities” are no more and, therefore, equities are subject to increased vulnerabilities “if bond yields continue to rise.”

This is after measures of equity implied volatility were crushed heading through the mid-March FOMC and monthly options expiry (OPEX) events, and the options hedging impact of this, at least, was very supportive, as we’ve talked about many times in this newsletter.

Graphic: Via Bloomberg. “The CBOE-VIX index, measuring stock volatility from the options market, unsurprisingly spiked immediately after Russia’s attack. It reached another high three weeks ago. Then the VIX started to fall, and in the two weeks since the Fed unveiled its first rate hike in years, the decline has been almost linear. The ‘fear gauge,’ as it is often known, is now significantly lower than it was a week before the invasion, when markets were priced on the assumption that there would be no war.”

On the contrary, measures of volatility for other assets, like the Merrill Lynch Options Volatility Estimate (INDEX: MOVE), a useful measure of bond market sentiment, are doing the opposite. 

We discussed early last month, what we saw was an increased supply of equity market volatility, as a potential reason for some of these divergences. 

As Bloomberg’s John Authers explained well, it, too, could have been “an aggressive central bank” that prompted a move out of bonds and into equities, and subdued target-date fund rebalancing flows which usually sell stocks and buy bonds.

Graphic: Via Bloomberg.

“[I]t looks as though the contradictions that had built up in the market over the last two years, and in the decade before that, are being put under extreme stress by the double whammy of a newly aggressive Federal Reserve, and the worst geopolitical shock in decades,” Authers adds.

Still, realized volatility continues to trend down which ought to force those (e.g., computer-driven traders) who position (and size equity exposure) based on underlying volatility to load up, again.

Nomura Holdings Inc’s (NYSE: NMR) Charlie McElligott explains that “volatility-targeting funds and trend-following commodity trading advisers, purchased” billions of equity futures which bolstered the price rise of the last weeks.

From a positioning versus buying support perspective, the forward returns distribution is skewed positive but not by a lot; a lot of the supportive options exposure is rolling-off and this could free up (i.e., unpin) indexes for the next leg up or down.

Graphic: SpotGamma’s Hedging Impact of Real-Time Options Indicator shows negative delta trade in the S&P 500 SPY ETF, and this pressured the underlying index.

Technical: As of 6:30 AM ET, Friday’s regular session (9:30 AM – 4:00 PM ET), in the S&P 500, will likely open in the upper part of a positively skewed overnight inventory, inside of prior-range and -value, suggesting a limited potential for immediate directional opportunity.

In the best case, the S&P 500 trades higher; activity above the $4,546.00 spike base puts in play the $4,573.25 high volume area (HVNode). Initiative trade beyond the HVNode could reach as high as the $4,583.00 untested point of control (VPOC) and $4,611.75 low volume area (LVNode), or higher.

In the worst case, the S&P 500 trades lower; activity below the $4,546.00 spike base puts in play the $4,526.25 HVNode. Initiative trade beyond the HVNode could reach as low as the $4,515.25 and $4,489.75 LVNodes, or lower.

Considerations: A change in the market (i.e., the transition from two-time frame trade, or balance, to one-time frame trade, or trend) occurred.

Continue to monitor for acceptance outside of the balance area. Rejection (i.e., return inside of balance) portends a move to the opposite end of the balance. See the below graphic for more.

Click here to load today’s key levels into the web-based TradingView charting platform. Note that all levels are derived using the 65-minute timeframe. New links are produced, daily.
Graphic: 65-minute profile chart of the Micro E-mini S&P 500 Futures.

What People Are Saying

Definitions

Volume Areas: A structurally sound market will build on areas of high volume (HVNodes). Should the market trend for long periods of time, it will lack sound structure, identified as low volume areas (LVNodes). LVNodes denote directional conviction and ought to offer support on any test. 

If participants were to auction and find acceptance into areas of prior low volume (LVNodes), then future discovery ought to be volatile and quick as participants look to HVNodes for favorable entry or exit.

Gamma: Gamma is the sensitivity of an option to changes in the underlying price. Dealers that take the other side of options trades hedge their exposure to risk by buying and selling the underlying. When dealers are short-gamma, they hedge by buying into strength and selling into weakness. When dealers are long-gamma, they hedge by selling into strength and buying into weakness. The former exacerbates volatility. The latter calms volatility.

POCs: POCs are valuable as they denote areas where two-sided trade was most prevalent in a prior day session. Participants will respond to future tests of value as they offer favorable entry and exit.

Options Expiration (OPEX): Marks change in dealer gamma exposure. 

Volume-Weighted Average Prices (VWAPs): A metric highly regarded by chief investment officers, among other participants, for quality of trade. Additionally, liquidity algorithms are benchmarked and programmed to buy and sell around VWAPs.

About

After years of self-education, strategy development, mentorship, and trial-and-error, Renato Leonard Capelj began trading full-time and founded Physik Invest to detail his methods, research, and performance in the markets.

Capelj also develops insights around impactful options market dynamics at SpotGamma and is a Benzinga reporter.

Some of his works include conversations with ARK Invest’s Catherine Wood, investors Kevin O’Leary and John Chambers, FTX’s Sam Bankman-Fried, Kai Volatility’s Cem Karsan, The Ambrus Group’s Kris Sidial, among many others.

Disclaimer

In no way should the materials herein be construed as advice. Derivatives carry a substantial risk of loss. All content is for informational purposes only.

Categories
Commentary

Daily Brief For February 18, 2022

Editor’s Note: The Daily Brief is a free glimpse into the prevailing fundamental and technical drivers of U.S. equity market products. Join the 200+ that read this report daily, below!

What Happened

Overnight, equity index futures auctioned back up into range after a spike lower from multi-day balance. The overnight response, higher, happened after Russian Foreign Minister Sergei Lavrov agreed to meet U.S. Secretary of State Antony Blinken for talks in Europe next week.

Ahead is data on existing home sales and leading economic indicators (10:00 AM ET), as well as Fed-speak by Christopher Waller (10:15 AM ET), John Williams (11:00 AM ET), and Lael Brainard (1:30 PM ET).

In observance of Washington’s Birthday, markets are closed Monday, February 21, 2022.

Graphic updated 6:45 AM ET. Sentiment Neutral if expected /ES open is inside of the prior day’s range. /ES levels are derived from the profile graphic at the bottom of the following section. Levels may have changed since initially quoted; click here for the latest levels. SqueezeMetrics Dark Pool Index (DIX) and Gamma (GEX) calculations are based on where the prior day’s reading falls with respect to the MAX and MIN of all occurrences available. A higher DIX is bullish. At the same time, the lower the GEX, the more (expected) volatility. Learn the implications of volatility, direction, and moneyness. SHIFT data used for S&P 500 (INDEX: SPX) options activity. Note that options flow is sorted by the call premium spent; if more positive, then more was spent on call options. Breadth reflects a reading of the prior day’s NYSE Advance/Decline indicator. VIX reflects a current reading of the CBOE Volatility Index (INDEX: VIX) from 0-100.

What To Expect

Fundamental: Given the persistence of mechanical responses to key levels, visually-driven, weaker-handed participants (which seldom bear the wherewithal to defend retests) carry a heavier hand in recent price discovery.

The takeaway is that the larger, other time frame (OTF) participants are waiting for more information before committing to substantial expansion of range via large sales or buys.

Information the OTFs are seeking to process and position themselves in accordance with are (but not limited to) geopolitical tensions and contractionary monetary policy.

Thursday’s commentary went in-depth on the implications of more severe Fed-action. Mainly, to slow inflation and rid the market of excesses, “a Volcker moment” is needed a strategist said.

Graphic: Via MacroTrends & Cboe Options Institute. “Value stocks started to outperform when the Federal Reserve (under Greenspan) communicated their intent to tighten policy. Value fell out of favor in the middle of 2007 following a UST yield curve inversion and looser monetary policy (under Bernanke).”

The Ambrus Group’s Kris Sidial, and others, expressed their differing sentiments on the issue, given that equities are so intertwined with consumer savings.

“There is no way the fed looks to use additional volatility as a policeman,” he explained. “It’s one of those things that sounds ok in theory but will not work in real-world applications.”

As Moody’s Corporation (NYSE: MCO) puts well, “This cycle is unlike any recent one and, while there are a ton of reasons to be optimistic about the U.S. economy’s near-term prospects, there are also reasons to worry that a recession isn’t far off on the horizon.”

Graphic: Via St. Louis Fed. Taken from Cboe Global Markets Inc (BATS: CBOE). “In fact, a dynamic where short-dated bond yields are higher than longer-dated bonds can reinforce an economic slowdown. The cost of capital is perhaps the most important component for evaluating so many other market relationships. Any investment that involves borrowed money becomes more expensive when the cost of capital increases. More is spent on interest payments. Higher rates incentivize saving (as opposed to consumption) which impacts businesses and the economy as a whole.”

“If the Fed is forced to raise the fed funds rate above its neutral rate to tame inflation, the stage will be set for recession. Also, some Fed officials believe they are falling further behind the curve, which could lead to a more aggressive tightening cycle, a recipe for an economic downturn in 2023 or 2024.”

Based on this sentiment, investors have already bet – via the eurodollar futures contract – on the Fed reversing its tightening course in late 2023. The current baseline calls for four 25-basis point rate hikes this year.

Graphic: Via Bloomberg. “In the eurodollar futures markets, the spread between the December 2023 and December 2025 contracts has dropped further into negative territory on Monday — implying a near-25 basis point cut in the federal funds benchmark over this 24-month timeframe.”

“We, therefore, think that the more likely path is a longer series of 25-basis point increases in the target range for the fed funds rate and we may need to add an additional rate hike to our baseline forecast in March,” Moody’s says in response to more hawkish pricings as a result of market focus on comments by hawkish regional Fed presidents.

Graphic: Via TS Lombard. Taken from The Market Ear. “Flattening is normal when the Fed is tightening. Looking at the past eight hiking cycles, almost every segment of the curve has flattened on average without immediately triggering a recession.”

On that note, Mark Haefele, chief investment officer at UBS Group AG’s (NYSE: UBS) Global Wealth Management arm says that “Despite the recent volatility, it’s important to remember that we are still in an environment of robust economic and earnings growth.”

Graphic: Via Bloomberg. “If market dysfunction is reflected in tighter conditions, then this chart shows we’re nowhere near stressed levels — after all, central bank policy globally is historically loose.”

“Our base case we expect upside for equity markets over the balance of the year.”

Positioning: Passive buying flows persist alongside a drop in bearish sentiment readings.

Graphic: Via EPFR, Barclays PLC (NYSE: BCS), and Bloomberg. Taken from The Market Ear

This action is in the face of a collapse in margin debt.

Graphic: Via Tier1Alpha. Taken from The Market Ear. “Margin debt is a big part of the puzzle, but even more important is the “delta” of the margin debt. The YoY % change of FINRA margin debt looks slightly scary.”

In the credit markets, investment-grade spreads are at some of their widest levels since 2020. Per Bloomberg, put option (bets on the downside) open interest in corporate bond ETFs is at an all-time high.

“Rotate into credit now,” Chris Sheldon, the co-head of credit and markets at KKR, explained, taking a contrarian view. “As the rate volatility plays through the market segment, we think high yield could become more attractive very quickly.”

On the single-stock and index-level, options positioning suggests participants should continue to brace for volatility. Participants’ demand for protection (negative delta exposure) has left counterparties (dealers taking the other side and warehousing risk) adding negative delta exposure linearly (via stock and futures sales) to hedge.

To note, owning an option offers someone positive exposure to gamma or convexity (to have profits multiplied if the direction is correct, all else equal). On the other side, though, participants who are short gamma or convexity may have their losses multiplied if incorrect.

Making some naive assumptions on the build-in interest in options strikes at lower prices, we may surmise that dealers are exposed to increased negative gamma exposure. 

To hedge this, if volatility were to remain unchanged, dealers must sell (buy) into weakness (strength) to hedge increasing (decreasing) negative gamma exposure. If volatility rises (drops), then more stock and futures must be sold (bought/covered).

Pictured: SqueezeMetrics highlights implications of volatility, direction, and moneyness.

The monthly options expiration (OPEX) will coincide with the removal of lots of put-heavy exposures. This will decrease the dealers’ positive exposure to delta and make gamma exposures less negative. 

Therefore, absent some exogenous event that increases demand for protection, again, there is the potential for strength, post-OPEX. That’s when that real-money buying, alluded to above, may resolve in higher prices.

Technical: As of 6:30 AM ET, Friday’s regular session (9:30 AM – 4:00 PM ET), in the S&P 500, will likely open in the middle part of a positively skewed overnight inventory, inside of prior-range and -value, suggesting a limited potential for immediate directional opportunity.

Spikes: Spikes mark the beginning of a break from value. Spikes higher (lower) are validated by trade at or above (below) the spike base (i.e., the origin of the spike).

In the best case, the S&P 500 trades higher; activity above the $4,415.00 untested point of control (VPOC) puts in play the $4,438.00 key response area (balance boundary and high volume area). Initiative trade beyond the key response area could reach as high as the $4,464.75 low volume area (LVNode) and $4,485.00 regular trade high (RTH High), or higher.

In the worst case, the S&P 500 trades lower; activity below the $4,415.00 VPOC puts in play the $4,401.50 spike base. Initiative trade beyond the spike base could reach as low as the $4,367.25 regular trade low (RTH Low) and $4,332.75 high volume area (HVNode), or lower.

Click here to load today’s key levels into the web-based TradingView charting platform. Note that all levels are derived using the 65-minute timeframe. New links are produced, daily.
Graphic: 65-minute profile chart of the Micro E-mini S&P 500 Futures.

Definitions

Overnight Rally Highs (Lows): Typically, there is a low historical probability associated with overnight rally-highs (lows) ending the upside (downside) discovery process.

Volume Areas: A structurally sound market will build on areas of high volume (HVNodes). Should the market trend for long periods of time, it will lack sound structure, identified as low volume areas (LVNodes). LVNodes denote directional conviction and ought to offer support on any test. 

If participants were to auction and find acceptance into areas of prior low volume (LVNodes), then future discovery ought to be volatile and quick as participants look to HVNodes for favorable entry or exit.

POCs: POCs are valuable as they denote areas where two-sided trade was most prevalent in a prior day session. Participants will respond to future tests of value as they offer favorable entry and exit.

Options Expiration (OPEX): Traditionally, option expiries mark an end to pinning (i.e, the theory that market makers and institutions short options move stocks to the point where the greatest dollar value of contracts will expire) and the reduction dealer gamma exposure. In recent history, this reset in dealer positioning has been front-run; prior, there was an increase in volatility after the removal of large options positions and associated hedging.

Balance (Two-Timeframe Or Bracket): Rotational trade that denotes current prices offer favorable entry and exit. Balance-areas make it easy to spot a change in the market (i.e., the transition from two-time frame trade, or balance, to one-time frame trade, or trend). 

Modus operandi is responsive trade (i.e., fade the edges), rather than initiative trade (i.e., play the break).

Volume-Weighted Average Prices (VWAPs): A metric highly regarded by chief investment officers, among other participants, for quality of trade. Additionally, liquidity algorithms are benchmarked and programmed to buy and sell around VWAPs.

About

After years of self-education, strategy development, mentorship, and trial-and-error, Renato Leonard Capelj began trading full-time and founded Physik Invest to detail his methods, research, and performance in the markets.

Capelj is also a Benzinga finance and technology reporter interviewing the likes of Shark Tank’s Kevin O’Leary, JC2 Ventures’ John Chambers, FTX’s Sam Bankman-Fried, and ARK Invest’s Catherine Wood, as well as a SpotGamma contributor developing insights around impactful options market dynamics.

Disclaimer

Physik Invest does not carry the right to provide advice.

In no way should the materials herein be construed as advice. Derivatives carry a substantial risk of loss. All content is for informational purposes only.

Categories
Commentary

Daily Brief For February 17, 2022

Editor’s Note: The Daily Brief is a free glimpse into the prevailing fundamental and technical drivers of U.S. equity market products. Join the 200+ that read this report daily, below!

What Happened

Overnight, equity index futures were range-bound inside of a larger developing balance area. 

Volatility remains heightened in the face of conflicting narratives surrounding Russka-Ukraine and action by the Federal Reserve.

Ahead is data on jobless claims, building permits, housing starts, and the Philadelphia Fed Manufacturing Index (8:30 AM ET). 

Fed-speak follows. James Bullard will speak at 11:00 AM ET and Loretta Mester at 5:00 PM ET.

Below we discuss the implications of unprecedented Fed action and a “new Volcker moment,” positioning, and more.

Graphic updated 6:50 AM ET. Sentiment Neutral if expected /ES open is inside of the prior day’s range. /ES levels are derived from the profile graphic at the bottom of the following section. Levels may have changed since initially quoted; click here for the latest levels. SqueezeMetrics Dark Pool Index (DIX) and Gamma (GEX) calculations are based on where the prior day’s reading falls with respect to the MAX and MIN of all occurrences available. A higher DIX is bullish. At the same time, the lower the GEX, the more (expected) volatility. Learn the implications of volatility, direction, and moneyness. SHIFT data used for S&P 500 (INDEX: SPX) options activity. Note that options flow is sorted by the call premium spent; if more positive, then more was spent on call options. Breadth reflects a reading of the prior day’s NYSE Advance/Decline indicator. VIX reflects a current reading of the CBOE Volatility Index (INDEX: VIX) from 0-100.

What To Expect

Fundamental: Minutes of the January 25-26 Federal Open Market Committee meeting were released, yesterday. 

Per Bloomberg, “persistent real wage growth in excess of productivity growth that could trigger inflationary wage-price dynamics,” among other risks, participants responded positively to what seems to be overall “less-hawkish” narratives.

The yield curve steepened (i.e., the spread between long- and short-rates widened), shortly after, given sentiment that the Fed may be less inclined to raise rates than once priced in.

Graphic: Via Bloomberg.

The minutes said, however, that “if inflation does not move down as they expect, it would be appropriate for the Committee to remove policy accommodation at a faster pace than they currently anticipate. Some participants commented on the risk that financial conditions might tighten unduly in response to a rapid removal of policy accommodation.”

Moreover, Fed action today is in opposition to what has been done before

In the past, “the Fed used rate hikes to engineer recessions that generated the slack needed to keep inflation in check (‘opportunistic disinflation’),” Credit Suisse Group AG’s (NYSE: CS) Zoltan Pozsar says.

“With the Fed’s ‘updated dual mandate’ of inclusive low unemployment and the political imperative of redistribution through firmer wage growth at the bottom of the income distribution, the Fed aiming to slow inflation via a recession is unimaginable. Hikes today then are meant to slow inflation without a recession … which is not something that the Fed has ever managed.”

With that, the Fed has “no control over goods prices unless they curb demand through a recession,” the note adds. However, “they have a lot of control over services inflation – which, unlike goods inflation, is mainly a function of domestic nominal factors.”

Components of services inflation include OER and “all other services,” with the former a function of house prices, the latter a function of labor supply.

Both respond to financial conditions which are driven by long-term interest rates or term premia and less so by short rates. Thus far, the market is pricing little impact on long-term interest and mortgage rates, as well as richly-valued equities.

“More is needed,” Pozsar explains. “To slow OER inflation, mortgage rates need to be higher and house prices flat or outright lower. To slow all other services – driven by a shortage of labor – we need more supply of labor, not less demand for it through a recession.”

“We need to slow services inflation by slowing, not killing, wage growth.”

With this policy talk of increasing labor supply with lower asset prices (cutting into the riches of those involved in the equity and alternative asset markets over the recent years), a Fed first, Pozsar thinks we need “a Volcker moment.”

In other terms, as stated yesterday and before, prevailing monetary frameworks and max liquidity promoted a large divergence in price from fundamentals

Graphic: Taken from Lyn Alden. “US economic growth is softening, and that’s when everyone suddenly gets more critical on valuations.”

The growth in passive investing – the effect of increased moneyness among nonmonetary assets – and derivatives trading imply a lot of left-tail risks.

The (pending) removal of this liquidity cuts into “the processes that enforce these bubbles” found in the volatility market and beyond, therefore upping the judgment of valuations.

“A new Volcker moment should also mean a radical change in the Fed’s strategy and involve going from targeting rates to targeting quantities once again – not the quantity of reserves in the banking system, but the quantity of duration in the market-based shadow banking system to jolt all sorts or risk premia higher.”

Positioning: Pursuant to comments in prior newsletters regarding “accumulation” and the rotation out of money market funds, according to Barclays PLC (NYSE: BCS), retail poured $48 billion into U.S. Equity ETFs last week.

Graphic: Via EPFR, Barclays, and Bloomberg. Taken from The Market Ear.

That is as, per The Market Ear, “vol[atility] targeting players, the crowd adjusting their positions as volatility is moving, have decreased their longs as [volatility has] moved higher.”

Graphic: Via Barclays and Bloomberg. Taken from The Market Ear.

In the face of this accumulation and prospects of buying in cases where volatility compresses, per JPMorgan Chase & Co’s (NYSE: JPM) Nikolaos Panigirtzoglou, however, “There is a good chance that 2022, in terms of equity fund flows, will look like 2018.”

Graphic: Per Panigirtzoglou, flows “started very strong in continuation of the previous year, but at some point that flow picture will be wilting.”

“As the Fed raises rates and other central banks are following the Fed, the risk is that at some point equity fund flows dissipate, or even turn negative,” he added. “I would not be surprised if we could have some sort of a repeat of 2018.”

On a micro level, in response to the FOMC minutes, participants sold puts and bought calls. Into the end-of-day, call buyers likely monetized their bets, while put selling continued. 

Graphic: SpotGamma’s Hedging Impact of Real-Time Options (HIRO) indicator.

The compression of volatility, coupled with that aforementioned trade, bolsters attempts higher.

Moreover, in the slightly bigger (week- and month-long picture), according to SpotGamma, “post-OPEX, the removal of linear short (-delta) hedges [to put-heavy exposures] may further bolster attempts higher.” 

On the other hand, “The removal of downside (put) protection may also open the door for weakness in a case where some outside (fundamental) event solicits real-money selling and a new demand for protection.”

Graphic: The “Biggest tail risk to SPX isn’t any macro data/virus/war but its own options market.”

Technical: As of 6:30 AM ET, Thursday’s regular session (9:30 AM – 4:00 PM ET), in the S&P 500, will likely open in the middle part of a negatively skewed overnight inventory, inside of prior-range and -value, suggesting a limited potential for immediate directional opportunity.

Balance (Two-Timeframe Or Bracket): Rotational trade that denotes current prices offer favorable entry and exit. Balance-areas make it easy to spot a change in the market (i.e., the transition from two-time frame trade, or balance, to one-time frame trade, or trend). 

Modus operandi is responsive trade (i.e., fade the edges), rather than initiative trade (i.e., play the break).

In the best case, the S&P 500 trades higher; activity above the $4,438.00 key response area (BAL/ONL/HVNode) puts in play the $4,485.00 regular trade high (RTH High). Initiative trade beyond the RTH High could reach as high as the $4,499.00 untested point of control (VPOC) and $4,526.25 high volume area (HVNode), or higher.

In the worst case, the S&P 500 trades lower; activity below the $4,438.00 key response area (BAL/ONL/HVNode) puts in play the $4,421.75 low volume area (LVNode). Initiative trade beyond the LVNode could reach as low as the $4,393.75 HVNode and $4,365.00 POC, or lower.

Click here to load today’s key levels into the web-based TradingView charting platform. Note that all levels are derived using the 65-minute timeframe. New links are produced, daily.
Graphic: 65-minute profile chart of the Micro E-mini S&P 500 Futures.

Definitions

Overnight Rally Highs (Lows): Typically, there is a low historical probability associated with overnight rally-highs (lows) ending the upside (downside) discovery process.

Volume Areas: A structurally sound market will build on areas of high volume (HVNodes). Should the market trend for long periods of time, it will lack sound structure, identified as low volume areas (LVNodes). LVNodes denote directional conviction and ought to offer support on any test. 

If participants were to auction and find acceptance into areas of prior low volume (LVNodes), then future discovery ought to be volatile and quick as participants look to HVNodes for favorable entry or exit.

POCs: POCs are valuable as they denote areas where two-sided trade was most prevalent in a prior day session. Participants will respond to future tests of value as they offer favorable entry and exit.

About

After years of self-education, strategy development, mentorship, and trial-and-error, Renato Leonard Capelj began trading full-time and founded Physik Invest to detail his methods, research, and performance in the markets.

Capelj is also a Benzinga finance and technology reporter interviewing the likes of Shark Tank’s Kevin O’Leary, JC2 Ventures’ John Chambers, FTX’s Sam Bankman-Fried, and ARK Invest’s Catherine Wood, as well as a SpotGamma contributor developing insights around impactful options market dynamics.

Disclaimer

Physik Invest does not carry the right to provide advice.

In no way should the materials herein be construed as advice. Derivatives carry a substantial risk of loss. All content is for informational purposes only.

Categories
Commentary

Daily Brief For January 13, 2022

The Daily Brief is a free glimpse into the prevailing fundamental and technical drivers of U.S. equity market products. Join the 200+ that read this report daily, below!

What Happened

Overnight, equity index futures diverged from commodity and bond products. Measures of implied volatility showed signs of bottoming. The dollar continued a plunge. 

Overall, the stance is neutral as the “hottest U.S. inflation in 39 years sets up March rate liftoff.”

Ahead is data on jobless claims and producer prices (8:30 AM ET). The Federal Reserve’s Lael Brainard will have a confirmation hearing (10:00 AM ET), Tom Barkin will speak later (12:00 PM ET), with Charles Evans speaking last (1:00 PM ET).

Graphic updated 5:55 AM ET. Sentiment Neutral if expected /ES open is inside of the prior day’s range. /ES levels are derived from the profile graphic at the bottom of the following section. Levels may have changed since initially quoted; click here for the latest levels. SqueezeMetrics Dark Pool Index (DIX) and Gamma (GEX) calculations are based on where the prior day’s reading falls with respect to the MAX and MIN of all occurrences available. A higher DIX is bullish. At the same time, the lower the GEX, the more (expected) volatility. Learn the implications of volatility, direction, and moneyness. SHIFT data used for S&P 500 (INDEX: SPX) options activity. Note that options flow is sorted by the call premium spent; if more positive, then more was spent on call options. Breadth reflects a reading of the prior day’s NYSE Advance/Decline indicator. VIX reflects a current reading of the CBOE Volatility Index (INDEX: VIX) from 0-100.

What To Expect

Fundamental: The consumer price index printed 7%, rising 0.5% from November. 

Much of the increases were attributed to shelter, used vehicles, and food.

With unemployment falling and inflation proving stubborn, monetary policymakers have been emboldened to tighten, raising rates in March and (later) shrinking the balance sheet. 

“In terms of where the Fed is on their dual mandate — inflation and the labor market — they’re basically there,” Michael Gapen, chief U.S. economist at Barclays Plc (NYSE: BCS), said on Bloomberg Television. “I don’t really think anything stops them going in March except one of these kind of outlier events. I think they’re ready.”

Market reaction was muted, mostly, with commodities bearing the brunt of the bullishness.

The calm reaction in equities, ahead of the earnings season, and bonds “showed that there was nothing particularly surprising in the [CPI] report, and that traders were confident that prices already covered the risks,” Bloomberg’s John Authers explained

“Fed funds futures barely budged, leaving a first rate hike in March almost fully priced. As they did before these numbers came out, dealers feel certain that the Fed will hike at least three times this year, while a fourth in December is seen as a 50-50 call.”

Graphic: Via Callum Thomas of Topdown Charts, “With the composite measure of inflation expectations at 40-year highs it’s fair to suggest that the Fed may have some catching up to do as it kicks off the transition away from easing.”

As an aside, there was a big drop in the dollar. In raising rates, currencies ought to attract money. Right? 

“[T]he combination of another really bad inflation number and an insouciant bond market response has been enough to knock the dollar off course. Many factors drive currencies, but this is consistent with a view that the rate hikes already priced in, and supporting the dollar until now, won’t be enough to head off inflation.”

Graphic: Via Bloomberg, “a weaker dollar makes imports more expensive and increases inflation.”

Positioning: On January 7, this commentary suggested metrics of options positioning, versus buying pressure (measured via short sales or liquidity provision on the market-making side) were positively skewed, even more so than before.

What followed was upside resolve, exacerbated in part by the compression in volatility and unwind of hedges to destabilizing customer options activity (i.e., put buying and call selling).

What now?

Scott Rubner of Goldman Sachs Group Inc (NYSE: GS) had the following to say.

“I am in the process of writing flow-of-funds note for February. My gut tells me to be bearish in February for when the ‘January Inflows’ run out. However, I just re-ran the CURRENT SET-UP for January and the conditions are not in place for a larger correction (>5%). Said another way, I want to be bearish, but this is the consensus. Investors are short, hedges are too big, everyone has on the puts, sentiment is negative (lowest in 86 weeks), I think everyone is already looking for the correction, and this may shift into buying dip alpha.”

So, what does all that mean? 

Demand for downside protection, as already touched on, coincided with customers indirectly taking liquidity and destabilizing the market as the participant short the put sold underlying to neutralize risk.

Graphic: SqueezeMetrics details the implications of customer activity in the options market, on the underlying’s order book. For instance, in selling a put, customers add liquidity and stabilize the market. How? The market maker long the put will buy (sell) the underlying to neutralize directional risk as price falls (rises).

Expansion in implied volatility increases the directional exposure of that protection. 

This is good for put buyers and bad for put sellers, simply put. As a result, in weakness, hedging of these contracts pressures markets further, making for violent up and down trade.

Graphic: The “Biggest tail risk to SPX isn’t any macro data/virus/war but its own options market.”

As volatility contracts, however, and underlying prices rise, the directional exposure of protection declines. This is bad for put buyers and good for put sellers. In offsetting this decline in directional risk, counterparties will unwind earlier hedges to bearish customer options activity. 

The unwind of these hedges, as SpotGamma explains, “likely invokes supportive dealer hedging flows with respect to time (‘charm’) and volatility (‘vanna’).”

Couple this flow with strong passive buying support, as evidenced by metrics quoted elsewhere in this newsletter (e.g., DIX), the odds that markets continue to rally (or trade sideways, at least, short-term), in the face of “above-trend growth” and a record year of buybacks, as well as other things, seem good.

Graphic: Taken from The Market Ear. Goldman Sachs’ Scott Rubner: “The GS corporate buyback desk expects a record year for executions of $975B or >$4B per day.”

Technical: As of 5:55 AM ET, Thursday’s regular session (9:30 AM – 4:00 PM ET), in the S&P 500, will likely open in the middle part of a negatively skewed overnight inventory, inside of prior-range and -value, suggesting a limited potential for immediate directional opportunity.

In the best case, the S&P 500 trades higher; activity above the $4,717.25 low volume area (LVNode) puts in play the $4,732.50 high volume area (HVNode). Initiative trade beyond the HVNode could reach as high as the $4,756.00 LVNode and $4,779.00 untested point of control (VPOC), or higher.

In the worst case, the S&P 500 trades lower; activity below the $4,717.25 LVNode puts in play the $4,691.25 micro composite point of control (MCPOC). Initiative trade beyond the MCPOC could reach as low as the $4,674.25 HVNode and $4,643.00 VPOC, or lower.

Considerations: As evidenced by the volume-weighted average price anchored from the release of FOMC minutes (blue color, below), the average buyer, since that, is winning.

Click here to load today’s key levels into the web-based TradingView charting platform. Note that all levels are derived using the 65-minute timeframe. New links are produced, daily.
Graphic: 65-minute profile chart of the Micro E-mini S&P 500 Futures.

What People Are Saying

Definitions

Volume Areas: A structurally sound market will build on areas of high volume (HVNodes). Should the market trend for long periods of time, it will lack sound structure, identified as low volume areas (LVNodes). LVNodes denote directional conviction and ought to offer support on any test. 

If participants were to auction and find acceptance into areas of prior low volume (LVNodes), then future discovery ought to be volatile and quick as participants look to HVNodes for favorable entry or exit.

DIX: For every buyer is a seller (usually a market maker). Using DIX — which is derived from short sales (i.e., liquidity provision on the market-making side) — we can measure buying pressure.

Gamma: Gamma is the sensitivity of an option to changes in the underlying price. Dealers that take the other side of options trades hedge their exposure to risk by buying and selling the underlying. When dealers are short-gamma, they hedge by buying into strength and selling into weakness. When dealers are long-gamma, they hedge by selling into strength and buying into weakness. The former exacerbates volatility. The latter calms volatility.

Vanna: The rate at which the delta of an option changes with respect to volatility.

Charm: The rate at which the delta of an option changes with respect to time.

Options: If an option buyer was short (long) stock, he or she would buy a call (put) to hedge upside (downside) exposure. Option buyers can also use options as an efficient way to gain directional exposure.

POCs: POCs are valuable as they denote areas where two-sided trade was most prevalent in a prior day session. Participants will respond to future tests of value as they offer favorable entry and exit.

MCPOCs: POCs are valuable as they denote areas where two-sided trade was most prevalent over numerous day sessions. Participants will respond to future tests of value as they offer favorable entry and exit.

Options Expiration (OPEX): Traditionally, option expiries mark an end to pinning (i.e, the theory that market makers and institutions short options move stocks to the point where the greatest dollar value of contracts will expire) and the reduction dealer gamma exposure.

Volume-Weighted Average Prices (VWAPs): A metric highly regarded by chief investment officers, among other participants, for quality of trade. Additionally, liquidity algorithms are benchmarked and programmed to buy and sell around VWAPs.

Rates: Low rates have to potential to increase the present value of future earnings making stocks, especially those that are high growth, more attractive. To note, inflation and rates move inversely to each other. Low rates stimulate demand for loans (i.e., borrowing money is more attractive).

About

After years of self-education, strategy development, mentorship, and trial-and-error, Renato Leonard Capelj began trading full-time and founded Physik Invest to detail his methods, research, and performance in the markets.

Capelj is also a Benzinga finance and technology reporter interviewing the likes of Shark Tank’s Kevin O’Leary, JC2 Ventures’ John Chambers, FTX’s Sam Bankman-Fried, and ARK Invest’s Catherine Wood, as well as a SpotGamma contributor developing insights around impactful options market dynamics.

Disclaimer

Physik Invest does not carry the right to provide advice.

In no way should the materials herein be construed as advice. Derivatives carry a substantial risk of loss. All content is for informational purposes only.